Article

Research on Energy Consumption Performance of a New Passive Phase Change Thermal Storage Window

1
State Grid Baishan Electric Power Supply Company, Jilin 134300, China
2
School of Civil Engineering and Architecture, Northeast Electric Power University, Jilin 132012, China
*
Author to whom correspondence should be addressed.
Buildings 2025, 15(7), 1145; https://doi.org/10.3390/buildings15071145
Submission received: 25 February 2025 / Revised: 29 March 2025 / Accepted: 29 March 2025 / Published: 31 March 2025
(This article belongs to the Special Issue Advanced Technologies in Building Energy Saving and Carbon Reduction)

Abstract

The new passive phase change thermal storage window integrates advanced energy-saving materials and technologies to provide efficient insulation and mechanical properties. It is suitable for green buildings. Through on-site experiments and simulations in summer, autumn, and winter in Jilin City, the cyclic use function of summer insulation and winter heating has been verified. This article establishes a numerical model and compares it with measured data to verify the accuracy of the model. In order to further verify the practicality of the new window, it was applied and tested at the Yichun substation in the cold winter region. The results showed that the new window can significantly reduce energy consumption while increasing indoor temperature. This article used a refined model established by Green Building Saville and Airpak3.0 software to deeply analyze the energy consumption and temperature field distribution of the window, and verified the reliability of numerical analysis in performance prediction. This study not only proves the effectiveness of the new phase change thermal storage window but also provides a new solution for the energy-saving design of green buildings.

1. Introduction

With the increasingly severe global climate change and environmental problems, energy saving and emission reduction have become a common challenge worldwide [1,2,3]. In the field of construction, energy consumption and carbon emission occupy a significant proportion, especially in the external windows of buildings, whose contribution to energy consumption cannot be ignored. Therefore, it is of great significance to develop energy-efficient exterior window systems to reduce building energy consumption and promote the development of green buildings. In recent years, photovoltaic phase change heat storage structures have mostly combined with the building itself, but there are problems such as cumbersome installation and construction and complicated follow-up maintenance. In order to solve these problems and promote the application of photovoltaic phase change thermal storage structure in practical engineering, this paper is devoted to the study of solar phase change thermal storage form to simplify the installation process and promote the subsequent research and development of thermal storage structure.
Energy-efficient windows are designed to reduce indoor–outdoor heat exchange in buildings, effectively maintain the indoor–outdoor temperature difference, and have excellent thermal insulation properties. Lu et al. [4] used a potential window with an uneven strip weave, which employs thick sticks and thin wood strips as an external shading screen. Gao et al. [5] assembled light-diffusing and heat-insulating aerogel glazing units by incorporating silica gel aerogel particles into the cavities of double-glazed units. Zhou et al. [6] designed a VO hybrid thermochromic photovoltaic composite smart energy-efficient window, which scatters visible light through VO nanoparticles in the middle layer and directs it to the border to generate electricity. A VO2 hybrid thermochromic photovoltaic glass composite smart energy-saving window, which scatters visible light through the VO2 nanoparticles in the middle layer and directs it to the solar cells in the frame to generate electricity. Guo et al. [7] investigated an energy-saving and power-generating one-piece window by combining the VO2 with organic solar cells. Lyu [8] developed a water-sandwiching window for energy saving in winter.
As phase change materials rely on latent heat, the temperature can be maintained in a stable range during the heat storage and release process [9,10], which has great research space and value in the field of building energy saving, comfort improvement, and solar high-temperature heat storage [11,12,13]. This makes it possible to combine phase change materials with the envelope, using phase change materials to improve the stability of the wall temperature of the room through the role of energy storage, and at the same time reduce the fluctuation of the air temperature in the room [14]. Some scholars have also added PCM to different parts of the envelope. Li Gen et al. [15] demonstrated the energy-saving effect of double-pane PCM windows, while Silva et al. [16] verified the improvement of room temperature and fluctuation by combining PCM with phase change louvers. Wang et al. [17] explored the energy-saving performance of PCM wall panels for high-rise lightweight buildings in Shanghai and pointed out the significant energy-saving efficiency in the winter season. Li et al. proposed the use of infill PCM panels to improve room temperature stability through energy storage and to reduce air temperature fluctuation inside the room. Li et al. [18] propose the use of PCM-filled glass roofs as an alternative to conventional roofs.
Most of the existing energy-saving windows only solve the problem of energy consumption caused by summer cooling, while the energy-saving windows studied in this paper solve the problem of energy consumption caused by winter heating in high-cold areas. However, there are still some problems that need to be solved and further explored: (1) At present, there are fewer studies and applications of combining heat storage technology with passive building technology at home and abroad. (2) Zero-carbon buildings, including substations, are mostly researched in the southern region to solve the energy consumption problem generated by summer cooling, while there are fewer studies on winter heating in alpine regions. (3) Many scholars at home and abroad have conducted experiments on photovoltaic phase change heat storage mostly for the envelope structure, while the outer windows in the envelope structure are more important and need to be combined with phase change materials for comprehensive consideration.
Therefore, this paper will develop a new type of passive phase change heat storage window by combining the passive concept and phase change materials and realize the energy-saving effect through the heat storage performance of phase change materials. Numerical simulation based on the energy simulation software is carried out on the new type of window developed and analyzes its energy consumption in the substation in the alpine region. Verify the feasibility and energy-saving effect of its application in the substation project through the experimental and simulation data.

2. Passive Phase Change Thermal Storage Window Fabrication

The results show that the temperature of PCM can be kept in a stable range during heat storage and release depending on latent heat [19]. In addition, under the same heat storage conditions, the volume of the required heat storage material is much smaller than that of sensible heat storage material. In addition, phase change materials usually have high thermal resistance, non-toxic and harmless, stable composition, are easy to prepare, and so on [20]. To sum up, phase change materials still have great research space and value in the field of building energy saving, improving comfort, and solar heat storage at high temperatures [21]. Therefore, the use of suitable composite phase change materials to make heat storage structure and form solar phase change heat storage form with photovoltaic panels can give full play to the advantages of composite phase change materials and improve the conversion efficiency. Through the use of phase change materials, winter heating in the cold area can be achieved, so as to achieve the purpose of energy saving and carbon reduction. At the same time, the cost of some composite phase change materials is lower [22], which can reduce the cost to a certain extent. In addition, in the process of installation, the solar phase change heat storage form can be disassembled and installed at any time, eliminating the construction link, reducing project costs, and in line with the development concept of building industrialization [23].
Window ① and ② are made by cutting 340 mm × 980 mm × 4 mm glass panels. These panels are then sealed and encapsulated on three sides using window-and-door adhesive, with a spacing of 10 mm between. They are filled with liquid phase change paraffin, and the top surface is close by.
On the other hand, window ③ is made of 788 mm × 1098 mm × 4 mm high-borosilicate glass. Its interior is lined with heating resistor wires in a zigzag pattern and temperature sensors. It is filled with 4 kg of phase change paraffin wax.
Among them, the total paraffin mass of the experimental phase change thermal storage window is 5 kg, which theoretically has the ability to absorb 1100 kJ of heat. The passive phase change thermal storage window (Note: The “passive” here refers to, which was introduced for the first time) theoretically has the ability to absorb 880 kJ of heat, respectively.
The prepared energy-saving exterior window is accurately installed in the window frame, and the photovoltaic module is arranged in a position with superior outdoor lighting conditions. Photovoltaic modules and photovoltaic energy storage (built-in inverter) are closely connected to form an integrated solar energy conversion and storage system. Solar panels efficiently convert solar energy into electricity and store it in a photovoltaic accumulator, ready to be called upon at any time. In addition, the energy-saving phase change window integrates resistance wires with power failure protection. The resistance wire [20] can use the energy stored in the photovoltaic energy storage to heat the phase change material. Once the phase change material reaches a preset temperature threshold, the heating process will automatically stop, thus achieving the heat energy storage and release cycle of phase change paraffin. It not only improves the efficiency of heat energy utilization of phase change paraffin but also enhances the safety and stability of the whole system through the power failure protection mechanism. The specific schematic diagrams of the phase change thermal storage window are shown in Figure 1 and Figure 2.
The photovoltaic modules were installed in the experimental room. In winter, field tests were carried out. First, measurements were taken during the field test of the phase change thermal storage window. Subsequently, the field test of the passive phase change thermal storage window was conducted. Thermal parameters were measured during these tests and then analyzed. The schematic diagram of the principle is shown in Figure 3.

3. New Passive Phase Change Thermal Storage Window Field Test

3.1. Test Materials

The test material, paraffin wax, is a type of organic solid–liquid phase change material with excellent performance. It has advantages such as non-toxicity, low subcooling, non-corrosiveness, and low cost. Moreover, paraffin waxes with different carbon chain lengths exhibit different phase change temperatures, enabling their use in various environments. For this field test, industrial paraffin wax with a phase change temperature of 18 °C was employed. The specific parameters are presented in Table 1, and the DSC curve is shown in Figure 4.

3.2. Test Equipment and Conditions

(1) Test site and equipment
The experimental location is the boarding warehouse of the playground on the East Campus of Northeast Power University in Jilin City. This warehouse contains a total of four storage areas. To reduce the impact of other factors such as light intensity, the second and third areas were, respectively, selected as the experimental room and the control room. Energy-saving windows were installed in the experimental room (labeled with a red box), as shown in Figure 5. In contrast, normal windows were used in the comparison room (labeled with a yellow box).
Both the experimental and control rooms were arranged with four temperature-measurement points and one light-measurement point. The size of each room is 6.15 m × 3.65 m × 2.85 m, resulting in a volume of 58.4 m3. The measurement method is presented in Table 2 below.
Under different environmental temperatures, measurements of the on-site temperature and light intensity in the experimental room and the control room were, respectively, carried out in the morning, noon, and afternoon within a certain period of time. Relevant data were recorded, organized, and analyzed. Based on the data measured on-site, modeling and parameter adjustments were then carried out.
(2) Measurement points
Figure 5 and Figure 6 demonstrate the locations of the temperature measurement points and the light measurement points. In the experiment, the temperature measurement points were used to comprehensively record the dynamic changes in the energy-saving window and the overall temperature of the experimental room during the phase change in paraffin. The conditions in the experimental room and the control room were kept the same, except for the use of the phase change window, in order to exclude other interfering factors.
Furthermore, the light intensity data were synchronously collected using the light detector to explore the effect of light intensity on the temperature between the experimental and control rooms. If there was no significant difference in light intensity data, it was not specifically discussed.
(3) Test equipment
The apparatus employed in the experiment consisted of a temperature sensor, a light sensor, and a digital display. The temperature and light intensity were measured between the experimental and control rooms. The schematic diagram of the apparatus is shown in Figure 7 below.
The solar phase change thermal storage window system utilized several instruments. These included a 200 W solar cell, a mobile power supply with a 220 V inverter, and a heating wire equipped with a 30-degree Celsius temperature control switch. The schematic diagram of these instruments is presented in Figure 8.
(4) Loading program
Accurate field measurements of temperature and light intensity were taken at different ambient temperatures, for both experimental and control rooms, at specific times of the day (morning, midday, and evening). The solar panels were positioned in a sunny open area and charged via a DC-DC converter connected to a portable power source. The temperature was monitored in real-time by a temperature control switch to ensure that the phase change material functioned within the appropriate temperature range, thereby preventing energy wastage.

3.3. Test Results of Passive Phase Change Thermal Storage Windows

In this study, the performance of the phase change thermal storage window was analyzed from 1 July to 31 October, during which the outdoor ambient temperature ranged from 5 °C to 30 °C. Specifically, the test data were categorized into states of phase change occurrence and non-occurrence. Figure 9 and Figure 10 show the collated data regarding these two states.
Based on the principle of specific heat capacity, the energy required to warm 1 m3 of air by 1 °C is 1.296 kJ, while the air in the experimental room consumes 82.94 kJ to warm 1 °C. A 5 kg amount of phase change paraffin wax can theoretically raise the temperature of the closed experimental room by 13 °C when its latent heat is fully utilized. However, since the phase change energy-saving external window is connected to the indoor and outdoor environments, its heat absorption and excretion process will affect the indoor and outdoor air temperatures. Therefore, it is expected that the phase change thermal storage window can raise the temperature of the experimental room by about 6.5 °C.
In this study, the phase change temperature of the paraffin wax used was 18 °C. The performance of phase change thermal storage windows without phase change was examined under summer conditions, i.e., at ambient temperatures of 18 °C, 30 °C, and 21 °C. Since all these temperatures were higher than the 18 °C phase change temperature of the paraffin wax, the paraffin did not undergo the phase change transformation. Although the paraffin failed to completely absorb heat, its low thermal conductivity effectively blocked the transfer of external heat. As shown in Figure 9 the temperature difference between the experimental and control rooms at different ambient temperatures was maintained at about 2 °C.
During the month of October, the temperature in the Jilin area fluctuated between 8 °C and 20 °C. For some periods, this was lower than the 18 °C phase change temperature of the paraffin wax. Figure 10 details the complete process of the phase change material from fully absorbing heat to fully exothermic. Paraffin wax is exothermic when the ambient temperature is lower than 18 °C and absorbs heat when it is higher than 18 °C to regulate the room ambient temperature. The experimental data showed that when the ambient temperature was lower than 18 °C in the morning, the paraffin wax inside the energy-saving window remained in a white solid state and did not undergo the phase change, but effectively insulated the external heat so that the temperature difference between the experimental room and the control room was kept at about 2 °C.
As the ambient temperature gradually rises above 18 °C, the phase change process begins to take place. Paraffin absorbs heat from the surrounding environment and gradually transforms from a white solid to a transparent liquid. As paraffin absorbs heat during this phase change from solid to liquid, it effectively stores this thermal energy. This causes a significant increase in the temperature difference between the experimental and control rooms, which widens to 6 °C to 11 °C. The experimental data showed that the time for a complete transformation of the phase change was 40 min. After the phase transition occurs, if the ambient temperature does not change significantly, the stored heat is gradually released, leading to a decrease in the temperature difference between the experimental and control rooms over time. After five hours, the temperature difference gradually decreases.
Subsequently, when the ambient temperature is gradually reduced to below 18 °C, the phase-transition process occurs again, and the liquid paraffin wax begins to solidify and gradually transforms back to the white solid state. During this process, the temperature difference between the experimental and control rooms is maintained at approximately 3 °C.
This ability of 1 kg of paraffin wax in the phase change thermal storage window to raise 58.4 m3 volume of air by 1 °C on average contributes to the observed temperature differences during the phase change process. It showcases the significant heat storage and heat-transfer capabilities of the paraffin-based phase change thermal storage window.

3.4. Solar Passive Phase Change Thermal Storage Window Test Results

The experimental period for the passive phase change thermal storage energy-saving window covers 1 November to 31 January. During this time, the ambient temperature was consistently below 18 °C, resulting in the energy-saving exterior window not being able to naturally trigger the phase change transformation.
Therefore, the experiment adopted a scheme combined with solar energy. Solar panels were used to convert solar energy into electricity. The electricity is used to power a heating element in contact with the phase change material, which causes the paraffin to melt and then solidify again as the heat is cycled through the system. This process heats and recycles the phase change material to achieve the energy-saving goal.
When the paraffin energy is fully released, it can raise the temperature of the air in the experimental room by 10 °C. Considering that heat is absorbed both indoors and outdoors, the effect is expected to be about 5 °C.
In order to deeply explore the performance of this energy-saving window body, the researchers divided the test results into two groups for comparison: one before heating and the other after heating. Through the comparative analysis, the researchers obtained the comparative results, which are shown in Figure 11 and Figure 12. The results demonstrate the performance differences of the passive phase change thermal storage window body in different states. These findings provide important data support for the subsequent model validation, as they can be used to verify and refine the parameters related to the window’s performance in the model, ensuring that the model accurately represents the real-world behavior of the passive phase change thermal storage window.
In Figure 11, the phase change process could not occur spontaneously due to the ambient temperature being significantly lower than 18 °C in winter. During the test, the white and solid phase change material had a blocking effect on the transmission of sunlight. This led to a decrease in the temperature at the window of the experimental room compared to the control room. Due to the relatively low thermal conductivity of the phase change material, the heat loss from the room was blocked. Therefore, despite the lower indoor window temperature in the experimental room, the overall temperature in the experimental room was still higher than that in the control room due to its good thermal insulation performance, and the temperature difference between the two was about 2 °C. The utilization rate of the heat-blocking capacity of the phase change material was about 50%. This value might be attributed to. Compared to previous studies, our results show the heat-blocking performance of the phase change material under similar low-temperature conditions.
In the passive heat storage energy-saving window body, the effective heating of phase change materials was realized by effectively combining phase change materials with solar panels. Figure 12 records in detail the temperature changes between experiments and controls in the process of heat absorption and exothermic process of paraffin wax after heating in the passive heat storage and energy-saving window body. Compared to the thermally absorbed phase change in the natural environment, the phase change transformation time of paraffin wax was extended to one hour after heating with a heating wire. During the heating process, the heat energy generated by the heating wire was partly absorbed by the paraffin wax, and the other part raised the temperature of the air near the energy-saving window. When the heating is completed, due to the relatively low ambient temperature, the paraffin wax phase changes again and releases heat to the experimental room, so that the temperature difference between the experimental room and the control room is basically maintained at 3–4 °C, at this time the utilization rate of about 80%, while the temperature difference between the high test point can be up to 12 °C, so the utilization rate of the passive phase change thermal storage window on the phase change in the paraffin wax can reach 80% or more, and the performance of the phase change thermal storage window in the environment is higher when the performance is the same, basically. The phase change paraffin in the passive phase change thermal storage window can still realize an average of 1 °C per kg of air of 58.4 m3 volume in winter under the effect of solar energy, which proves the stability of the passive phase change thermal storage window.

4. Numerical Simulation of a New Passive Phase Change Thermal Storage Form

In order to deeply explore the energy consumption characteristics and indoor temperature variation rules of the existing buildings in the high cold area, this paper adopts the energy consumption simulation software of Greenesville2020 [24,25] and Airpak3.0 [26] to conduct fine modeling and analysis of the existing buildings. In the simulation process, the cooling load in the model built by BECH was calculated by using the measured temperature data, and the calculated cooling load was brought into the model built by Airpak to calculate the temperature field of the model and compare it with the field measured temperature to verify the consistency of the simulation results with the field measured results, thus ensuring the accuracy of the simulation. In addition, by constructing the digital model of the existing building, the energy consumption difference before and after the renovation of the envelope structure is compared and analyzed, aiming to provide a basis for the energy-saving transformation of the substation in the high cold area and verify the practicability and feasibility of the solar phase change heat storage form in the substation in the high cold area.

4.1. Green Building Swire Modeling

Parameter settings prior to building energy simulation were completed in the Green Building Swell 2020 heating load software BECH.
(1) Model Creation: In the BECH simulation of heating load, the components are mainly composed of rock wool board exterior wall, exterior window and exterior door. The exterior wall parts are created by creating wall stretches, and the doors and windows are created by inserting doors and windows or two-point doors and windows. The floor frame is set according to the solid structure of the laboratory, and the sloping roof of the laboratory is set on the second floor according to the height of the building. The schematic diagram of the model is shown in Figure 13.
(2) Material properties: Material properties of exterior walls, doors, and windows. Select the thermal parameters of common doors and windows available in the material library. Comparison of numerical and experimental data should be more comprehensive, and it is best to combine statistical analysis to quantify bias. The corresponding material thickness and type can be corrected in the material library. Finally, the set material properties are assigned to the corresponding section, and the property setting is completed. The general situation of the experimental building is that the length of the building is 6.15 m, the width of the building is 3.65 m, the total height of the building is 2.85 m, and the number of building floors is 1 story. Detailed parameters for building design are shown in Table 3 below.
(3) Room type: This simulation selects the type of office, and sets the equipment, personnel, lighting, and working time in the room. According to the “Cold and Cold Areas Residential Building Energy Efficiency Design Standards” (JGJ26-2018) and field research, the parameters are set as follows: (1) The indoor temperature of the heating room is adjusted by the ideal air conditioner, and the ideal air conditioner is turned off when the indoor temperature is discussed. According to the heating time of Jilin City, the heating time is set from 15 October to 15 April of the following year, the heating system runs from 0:00 to 24:00, and the heating temperature is designed to be 18 °C. (2) Since there is no window ventilation in winter, the ventilation opening times of the outside doors and windows are set to 0.
(4) Engineering setup: The geographic location is set as Jilin, the building type is a public building, and the direction is determined according to the north pointer. Considering that the ground is cemented and has less impact on the overall environment, it is determined to be adiabatic at the lower edge, and the solar radiation absorption coefficient in this simulation is set to be 0.65 for the outer wall and 0.70 for the roof.
(5) Meteorological parameters: Set the local meteorological data of Jilin according to “Design Code for Heating, Ventilation and Air Conditioning of Civil Buildings (GB 50736-2012)”.
(6) Grid division: In this paper, the grid required by the model between experiments was considered, and due to the small size of the model built, the grid was set to the normal 500.
(7) Calculation model: The temperature in the laboratory is set according to the field measurement model, and the energy consumption required by the calculation model to achieve the measured temperature in the laboratory is compared with the actual heat release of paraffin, the utilization rate is calculated, and the data are provided for the Airpak temperature field simulation.

4.2. Airpak Numerical Modeling

The parameterization of the building temperature field analysis is completed in Airpak, which includes the building model size, adding modules, setting the basic parameters of the simulation and the boundary conditions of the modules, meshing, numerical solving, and post-simulation processing.
(1) Modeling: Create a room through model-room-edit, adjust the size according to the actual size of the house, and choose the coordinate position.
(2) Determine the parameters: According to the orientation of the site between experiments, determine the orientation of the house in the simulation and set the acceleration of gravity.
(3) Establishment of modules: Create a “block” module according to the 50% utilization rate of the absorbed cold load, define the properties of the heat source, and set the module in the position of the outer window. Set the wall model by “wall” command, set the temperature of the ceiling and wall according to the measured temperature on site, and set the other settings as an adiabatic boundary.
(4) Analyze the model: After all parameters are set, select check model. Create a model as shown in Figure 14.
(5) Grid division: Due to the small size of the house, the grid will be divided into 500. After dividing the grid, select start solution to run the calculation, and click cut to analyze the resulting temperature field.

4.3. Simulation Results and Analysis

4.3.1. Green Building Swire BECH Energy Consumption Results and Analysis

The test results showed that the temperature of the experimental room remained stable within half an hour after the release of energy from the phase change paraffin in the experimental room and the control room. In contrast, the temperature in the experimental room remained constant after one hour when the passive phase change thermal storage window was in phase change. In order to quantify the utilization rate of paraffin in the energy-saving window, it is assumed that the absorption and release of heat are completed within one hour based on the energy conversion formula. The energy was converted to power by this setting, thus facilitating analysis. On this basis, the field test data were introduced into the heating load analysis by means of the Green Building Swell model. The model calculates the amount of heating and cooling loads required between experiments, from which the proportion of the total load that is generated by the phase change paraffin, i.e., the utilization of the paraffin, is calculated.
Table 4 lists the results of this calculation process, where the paraffin wax within the phase change thermal storage window maintains its liquid state and does not undergo a phase change in the summer when the ambient temperature is higher than the paraffin wax phase change temperature.
Comparison with the on-site test data reveals that the required cold load between experiments is only 50% of the actual heat absorbed by the phase change material (1100 kJ), a result that is basically consistent with the on-site measurements. After an in-depth investigation, it was found that the main reasons are as follows: firstly, under the high-temperature conditions in summer, the phase change temperature of paraffin wax is lower than the ambient temperature, so it cannot absorb all the theoretical heat. Secondly, the energy-saving external windows have heat escaping phenomenon in actual use, which leads to the reduction of heat absorbed by paraffin. In addition, paraffin may also absorb external heat, which is not directly used to regulate the indoor temperature, thus reducing the utilization rate.
In the test of phase change thermal storage window body, phase change paraffin wax undergoes phase change when the ambient temperature is lower than 18 °C, which effectively adjusts and balances the internal temperature of the room by releasing heat. Table 5 shows the specific values of the simulated calculation of the cold load and the utilization rate of phase change paraffin in the process of temperature adjustment.
When paraffin wax undergoes phase change, simulation analysis shows that the average utilization rate of paraffin wax can reach 80%, which is basically consistent with the field measurement. This result shows that the phase change thermal storage window does have the function of regulating the indoor temperature during the phase change process.
In winter, phase change paraffin wax is not heated by solar panels. When the ambient temperature is always lower than the phase change temperature of the paraffin wax, the phase change cannot take place. In this case, the phase change paraffin inside the passive phase change thermal storage window still shows some ability to regulate the temperature and keep warm. The heating load results are shown in Table 6 below.
The phase change paraffin in the passive phase change thermal storage window body, in the white solid state when the phase change condition is not reached, although it does not actively release heat to participate in temperature regulation, but its inherent low thermal conductivity to a certain extent prevents the heat from escaping. This characteristic makes the phase change paraffin still able to play the role of heat preservation when the phase change has not occurred, which helps to maintain the stability of the indoor temperature. Evaluated from the perspective of the thermal insulation effect, the utilization rate of phase change paraffin wax at this time can reach 50%, which is basically consistent with the field measurement, showing that it still has energy-saving potential in the non-phase change state.
Solar energy was utilized to heat the phase change paraffin during the winter months to induce a phase change. After the phase change occurred, temperature data were collected from the site. These temperature data were brought into the model for calculation and analysis to produce the corresponding heating load results. The heating load results from this test were organized into Table 7.
According to the results presented in the data in the table, the actual utilization rate of passive phase change thermal storage windows in winter after heating phase change paraffin using solar panels is basically 90%, which is higher than the 80% measured in the field, and is considered to be related to the low external environment in winter during the field measurements.

4.3.2. Airpak Temperature Field Results and Analysis

In order to more accurately assess the effect of the cooling/heating loads calculated by Green Building Swell in practical applications, the results of the calculations were imported into the model built by Airpak. After entering the temperature data of the control room in the model, the temperature field distribution of the experimental room was simulated. By comparing and analyzing the temperature data and the corresponding temperature field distributions of the test points in the experimental room and the control room, we can visualize the performance of the cooling/heating loads calculated by Green Building Swell in practical applications.
In order to study the performance of the phase change thermal storage window in the absence of phase change, this section deliberately selected some relevant temperature data for the construction of the simulated temperature field. The temperatures of the selected measurement points are shown in Table 8, and the temperature distribution is visualized by the temperature field schematic to compare with the table temperatures, see Figure 15.
It can be clearly observed from Figure 15 that the temperatures at the window side (i.e., test points 1 and 2) show the lowest values due to the shading effect of the phase change material. It is worth noting that the test time for the above data was 10:00, when the sunlight mainly shone on the east side of the experimental and control rooms, and thus the temperature at test point 4 (the corresponding point 8 in the control room), which was located on that side, was relatively high.
In addition, with the natural convection and rise of hot air, both the experimental and control rooms showed a tendency for the temperature of the upper side measurement points to be higher than that of the lower side. In particular, the temperature of measurement point 3 (7), which was at the highest position in the room, reached the highest value. At the time of testing, the ambient temperatures in both the experimental and control rooms were higher than 18 °C, which resulted in a relatively small temperature difference between the two houses.
When the ambient temperature is lower than the phase change temperature, the paraffin wax in the phase change thermal storage energy-saving window body will undergo a phase change. Table 9 and Table 10 record in detail the temperature data between the experiment and the control when the paraffin phase change occurs. The corresponding temperature field distributions are shown in Figure 16 and Figure 17.
Table 9 shows that, under the condition that the test time is 20:30 and the ambient temperature is 13 °C, the energy-saving exterior window acts as a heat source to diffuse heat to the surrounding area. Therefore, measurement points 1 and 2, which are closest to the energy-saving windows, receive the most heat and have the highest temperature performance. As the distance from the energy-saving windows gradually increases, the heat received by measurement points 3 and 4 decreases, and their temperatures gradually decrease accordingly. In contrast, measurement points 5 and 6 in the control room have lower temperatures because they are directly affected by the outdoor environment and the windows and doors. Measurement points 7 and 8, on the other hand, are farther away from the windows and doors and are subject to relatively little external influence, thus retaining the higher temperatures that continue in the morning.
In Table 10 and Figure 17, the ambient temperature was maintained at 20 °C at the time point of 13:30. At this time, the sunlight came into the room from the west side, resulting in higher temperatures at test points 1 and 2 (test points 5 and 6 in the control room) than at the other test points in the room. In the area not exposed to direct sunlight, the temperatures between the experimental and control rooms were closer to the ambient temperature, and the temperature difference between them was smaller, around 2 °C. When the ambient temperature reaches 20 °C, the phase change process begins to take place and the paraffin absorbs heat from the surrounding environment. As can be seen from the tabular data, although both test points 1 and 2 and test points 5 and 6 were subjected to direct sunlight, the temperatures at test points 1 and 2 were much lower than those at test points 5 and 6, and the temperature difference between the two was about 10 °C. This difference indicates that the energy-efficient exterior windows in the experimental room played a significant thermal regulation role in the phase change process, effectively reducing the temperature in the area under direct sunlight.
In the study of passive phase change thermal storage windows, the inter-experimental temperature data when no phase change occurred were selected and are shown in Table 11. The corresponding temperature field results are shown in Figure 18.
Table 11 the ambient temperature reached −17 °C when the data collection time was 10:30. Under these conditions, due to the relatively low thermal conductivity of phase change paraffin, it effectively slowed down the transfer of heat from the room to the outside. As a result, the overall temperature of the experimental room was about 2 °C higher than that of the control room. In the morning, the sunlight came into the room from the east side, which made the temperature of test point 8 on the east side of the control room higher than that of test point 5 and test point 6 on the west side. Although test point 7 was located in the interior of the room, its temperature was the lowest among all the test points, and the temperature difference with that of test point 3 at the same location was around 4 °C. The temperature of test point 8 was higher than that of test point 5 and test point 6 on the west side of the control room.
In the study of passive phase change thermal storage windows, the inter-experimental temperature data 3–10 and 3–11 were specifically selected when the phase change occurred. The temperature field distribution is shown in Figure 19 and Figure 20.
The data in Table 12 were collected at 11:30 a.m. when the ambient temperature was −6 °C. During the experiment, the phase change paraffin inside the energy-saving exterior window was heated. While the heating wire heated the phase change material, part of the heat was transferred to the experimental room, so the overall temperature of the experimental room increased compared with the control room, which was about 2 °C, especially at test point 3 and test point 7, where the temperature difference reached 6 °C. The temperature difference between test point 3 and test point 7 reached 6 °C. At the same time, under sunlight and without other external heat sources, the temperatures at test points 5, 6, and 8 near the window of the control room were significantly higher than those at test point 7 inside the room.
Table 13 the time of data collection is 13:00, when the ambient temperature is −5 °C. The phase change material has completed its transformation from a white solid to a transparent liquid. The phase change material had completed its transformation from a white solid to a transparent liquid and continued to undergo a phase change to release heat at an ambient temperature below its phase change temperature. The temperature between experiments was significantly higher than that between controls. Due to the high light intensity at this time, the temperature difference between test points 1 and 2 (near the energy-saving exterior windows) and test points 5 and 6 (corresponding positions in the control room) remained at about 3 °C. Meanwhile, the overall temperature difference between the other test points in the room and the experimental room reached about 7 °C because they were not exposed to direct sunlight.

5. Conclusions

In this paper, we study in-depth the energy-saving and heat storage effects of phase change thermal storage windows and passive phase change thermal storage windows through on-site tests. Then, we compare these effects with the results of Greensville heating load simulation and Airpak temperature field simulation and analyze them. Based on these comprehensive investigations, the following conclusions are drawn:
(1) The phase change material paraffin wax can effectively absorb or release heat when the ambient temperature is higher or lower than its phase change temperature of 18 °C, thereby realizing the regulation of indoor temperature.
(2) Paraffin connects the indoor and outdoor environments through energy-efficient exterior windows during the phase change process. However, the heat-exchange rate deviates from the theoretically predicted value due to factors such as heat losses to the surrounding environment and imperfect thermal contact between the paraffin and the window structure. As a result, its effect of raising or lowering the indoor temperature is about half of the theoretical expected value. In a high-temperature environment, paraffin wax can maintain its liquid state and absorb heat to lower the indoor temperature, with a heat-utilization rate of about 50%. Moreover, when the ambient temperature is close to the phase change temperature, the phase change phenomenon is significant and can be completed within half an hour, raising the indoor temperature by about 5 °C. At this time, the energy utilization rate is as high as 80%.
(3) While the behavior of paraffin under normal and high-temperature conditions is well understood, its performance in low-temperature winter environments is of particular interest. Under low-temperature winter conditions, the paraffin wax remained in a solid state, which limited the effectiveness of the energy-saving window body. However, when heated by the solar panel, the passive phase change thermal storage window body can significantly increase the temperature difference between the experimental room and the control room. Especially when the power of the solar panel is low, it can still maintain the temperature difference at 3–4 °C, demonstrating the heat preservation effect of the phase change material at low temperatures. At this time, the energy utilization of the phase change paraffin was maintained above 80%, indicating the stability and high efficiency of the window.
(4) In alpine regions, an efficient and safe passive phase change heat storage window has been developed by integrating photovoltaic modules, photovoltaic energy storages, and phase change heat storage windows. This new type of window, unlike previous designs, can effectively utilize solar energy resources even under low solar panel power conditions. It incorporates innovative design elements that optimize the interaction between the photovoltaic components and the phase change material, enabling it to regulate indoor temperature through the heat storage property of paraffin, maintaining the utilization rate of phase change paraffin at 80%.
(5) In terms of phase change temperature, in this field experiment in Jilin City, the phase change temperature of phase change paraffin in the selected solar phase change heat storage form is 18 °C, which is relatively high in winter applications in high-cold areas. In view of this, in order to improve the practicality of phase change materials and their applicability in winter heating, it is still necessary to carry out in-depth exploration and optimization work in the material modification of phase change temperature of phase change paraffin.

Author Contributions

Conceptualization, Y.C.; methodology, C.Z.; software, H.Z. (Hongbin Zhang); validation, H.Z. (Hongbin Zhang) and H.Z. (Hongyu Zhang); formal analysis, Y.C.; investigation, C.Z.; resources, C.Z.; data curation, Y.L.; writing—original draft preparation, C.Z.; writing—review and editing, H.Z. (Hongbin Zhang); visualization, Y.L.; supervision, Y.C.; project administration, C.Z.; funding acquisition, Y.C. All authors have read and agreed to the published version of the manuscript.
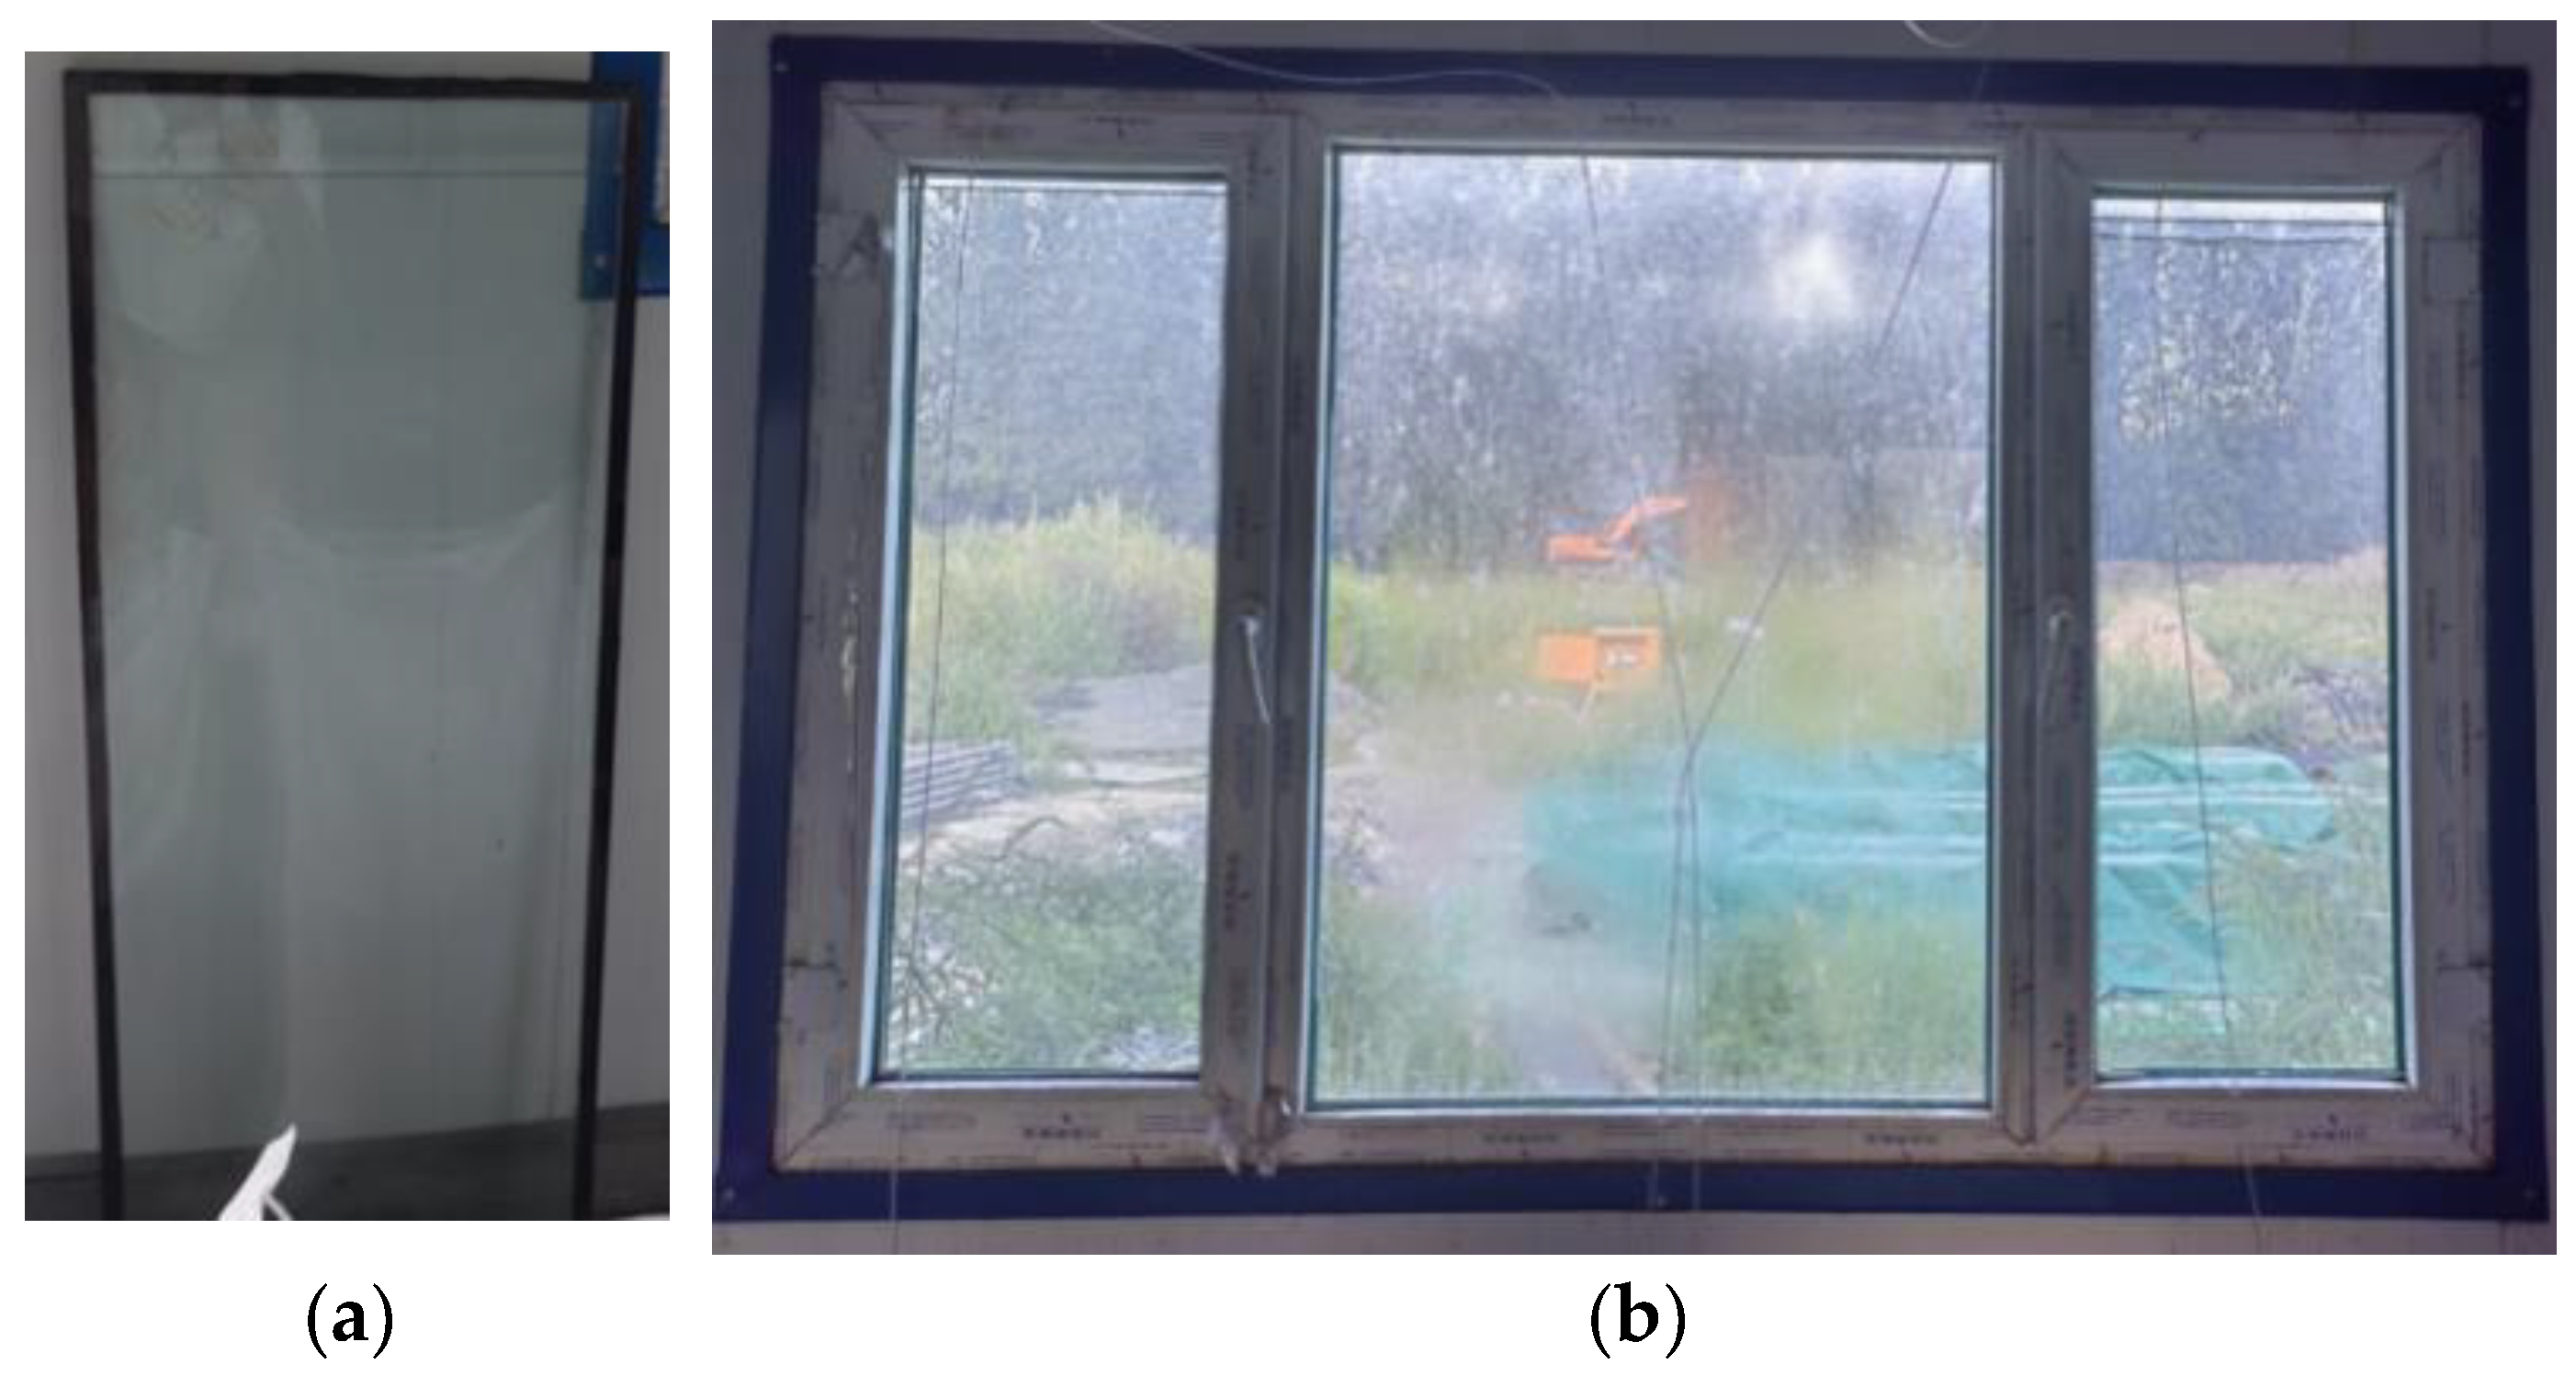
Funding

This research was funded by State Grid Baishan Electric Power Supply Company Jilin Province (Grant No. SGJLBS00KJJS2400697S).

Data Availability Statement

Due to privacy protection requirements, the original data cannot be publicly shared.

Conflicts of Interest

Authors Yong Cui, Hongbin Zhang, Hongyu Zhang and Yunli Li were employed by State Grid Baishan Electric Power Supply Company. The remaining authors declare that the research was conducted in the absence of any commercial or financial relationships that could be construed as a potential conflict of interest.

References

  1. IEA. Global CO2 Emissions Rebound to Record High in 2021. Energy Conserv. Environ. Prot. 2022, 3, 8. [Google Scholar]
  2. Research Report on Energy Consumption and Carbon Emission of Buildings in China (2022). Architecture 2023, 2, 57–69.
  3. Research Report on Energy Consumption and Carbon Emission of Buildings in China (2023). Architecture 2024, 2, 46–59.
  4. Lu, Y.; Lin, H.K.; Liu, S.W.; Xiao, Y. Nonuniform woven solar shading screens: Shading, mechanical, and daylighting performance. Sustainability 2019, 11, 5652. [Google Scholar] [CrossRef]
  5. Gao, T.; Jelle, B.P.; Ihara, T.; Gustavsen, A. Insulating glazing units with silica aerogel granules: The impact of particle size. Appl. Energy 2014, 128, 27–34. [Google Scholar] [CrossRef]
  6. Zhou, J.D.; Gao, Y.F.; Zhang, Z.T.; Luo, H.; Cao, C.; Chen, Z.; Dai, L.; Liu, X. VO2 thermochromic smart window for energy savings and generation. Sci. Rep. 2013, 3, 3029. [Google Scholar] [CrossRef]
  7. Guo, F.; Chen, S.; Chen, Z.; Luo, H.; Gao, Y.; Przybilla, T.; Spiecker, E.; Osvet, A.; Forberich, K.; Brabec, C.J. Printed smart photovoltaic window integrated with an energy-saving thermochromic layer. Adv. Opt. Mater. 2015, 3, 1524–1529. [Google Scholar] [CrossRef]
  8. Lyu, Y.L.; Liu, W.J.; Su, H.; Wu, X. Numerical analysis on the advantages of evacuated gap insulation of vacuum-water flow window in building energy saving under various climates. Energy 2019, 175, 353–364. [Google Scholar] [CrossRef]
  9. Joybari, M.M.; Haghighat, F.; Seddegh, S. Natural convection characterization during melting of phase change materials: Development of a simplified front tracking method. Sol. Energy 2017, 158, 711–720. [Google Scholar] [CrossRef]
  10. Shi, H.; Liu, H.; Qian, J.; Sun, Y.S. Research progress of phase change materials in building energy efficiency. Appl. Chem. Eng. 2021, 50, 4. [Google Scholar]
  11. Feldman, D.; Shapiro, M.M.; Banu, D.; Fuks, C.J. Fatty acids and their mixtures as phase-change materials for thermal energy storage. Sol. Energy Mater. Sol. Energy Mater. 1989, 18, 201–216. [Google Scholar]
  12. Kabeel, A.E.; Khalil, A.; Shalaby, S.M.; Zayed, M.E. Experimental investigation of thermal performance of flat and v-corrugated plate solar air heaters with and without PCM as thermal energy storage. Energy Convers. Manag. 2016, 113, 264–272. [Google Scholar]
  13. Kenisarin, M.; Mahkamov, K. Solar energy storage using phase change materials. Renew. Sustain. Energy Rev. 2007, 11, 1913–1965. [Google Scholar] [CrossRef]
  14. Chen, C.; Liu, Y.; Guo, H. Preliminary study of composite phase change wall applied to passive solar house. J. Build. Mater. 2008, 11, 684–689. [Google Scholar]
  15. Li, G.; Liu, Y.; Wang, X. Numerical simulation of the effect of phase-change energy storage glass windows on energy consumption in air-conditioned rooms. Cryog. Eng. 2019, 6, 6. [Google Scholar]
  16. Silva, T.; Vicente, R.; Amaral, C.; Figueiredo, A. Thermal performance of a window shutter containing PCM: Numerical validation and experimental analysis. Appl. Energy 2016, 179, 64–84. [Google Scholar] [CrossRef]
  17. Wang, H.K.; Wu, Z.G. Parametric analysis of applying PCM wallboards for energy saving in high-rise lightweight buildings in Shanghai. Renew. Energy 2020, 145, 52–64. [Google Scholar]
  18. Li, D.; Wu, Y.Y.; Zhang, G.J. Influence of glazed roof containing phase change material on indoor thermal environment and energy consumption. Appl. Energy 2018, 222, 343–350. [Google Scholar]
  19. Cheng, X.; Zhang, C.; Ran, X. Research progress in the field of phase change materials in building heat preservation. J. Synth. Mater. Ageing Appl. 2025, 2, 73–76. [Google Scholar]
  20. Yan, T.; Li, Z.; Yu, Z. Effect of physical Properties of phase change materials on heat storage process. South. Agric. Mach. 2019, 56, 144–146+154. [Google Scholar]
  21. Pang, J.; Wang, X.; Hou, H. Study on the influence of solar collection and storage Device on Thermal environment of fabricated solar greenhouse. Acta Sol. Energy Sin. 2019, 46, 470–478. [Google Scholar]
  22. Kang, L.; Wang, W.; Li, Y. Application of phase change materials in prefabricated composite wall solar greenhouse. J. Hebei Univ. Sci. Technol. 2024, 45, 318–327. [Google Scholar]
  23. Cai, Y.; Shu, Z.; He, J. Research progress of the coupling technology of solar passive ventilation and building phase change thermal storage. Build. Energy Conserv. 2024, 52, 3–15. [Google Scholar]
  24. Lin, C.-K.; Wang, H.-Z.; Zhang, C. Energy Saving Renovation Scheme of Power Center of Taiyuan University of Technology Based on Greengensville Software—A Case Study of Green Building Design Competition. In 2022–2023 Proceedings of Architectural Society of China, Hunan University, Taiyuan University of Technology; Architectural Society of China: Beijing, China, 2023; pp. 484–492. [Google Scholar]
  25. Fan, Z.; Li, H. Renovation design of terrace garden building based on application of green building software. Green Sci. Technol. 2023, 25, 258–262. [Google Scholar]
  26. Wang, C.; Li, D. Numerical simulation of indoor environment based on Airpak software. Mod. Inf. Technol. 2019, 8, 111–115. [Google Scholar]
Figure 1. Schematic diagram of energy-saving glass and window. Phase change thermal storage windows: (a) Phase change glass; (b) Phase change heat storage windows.
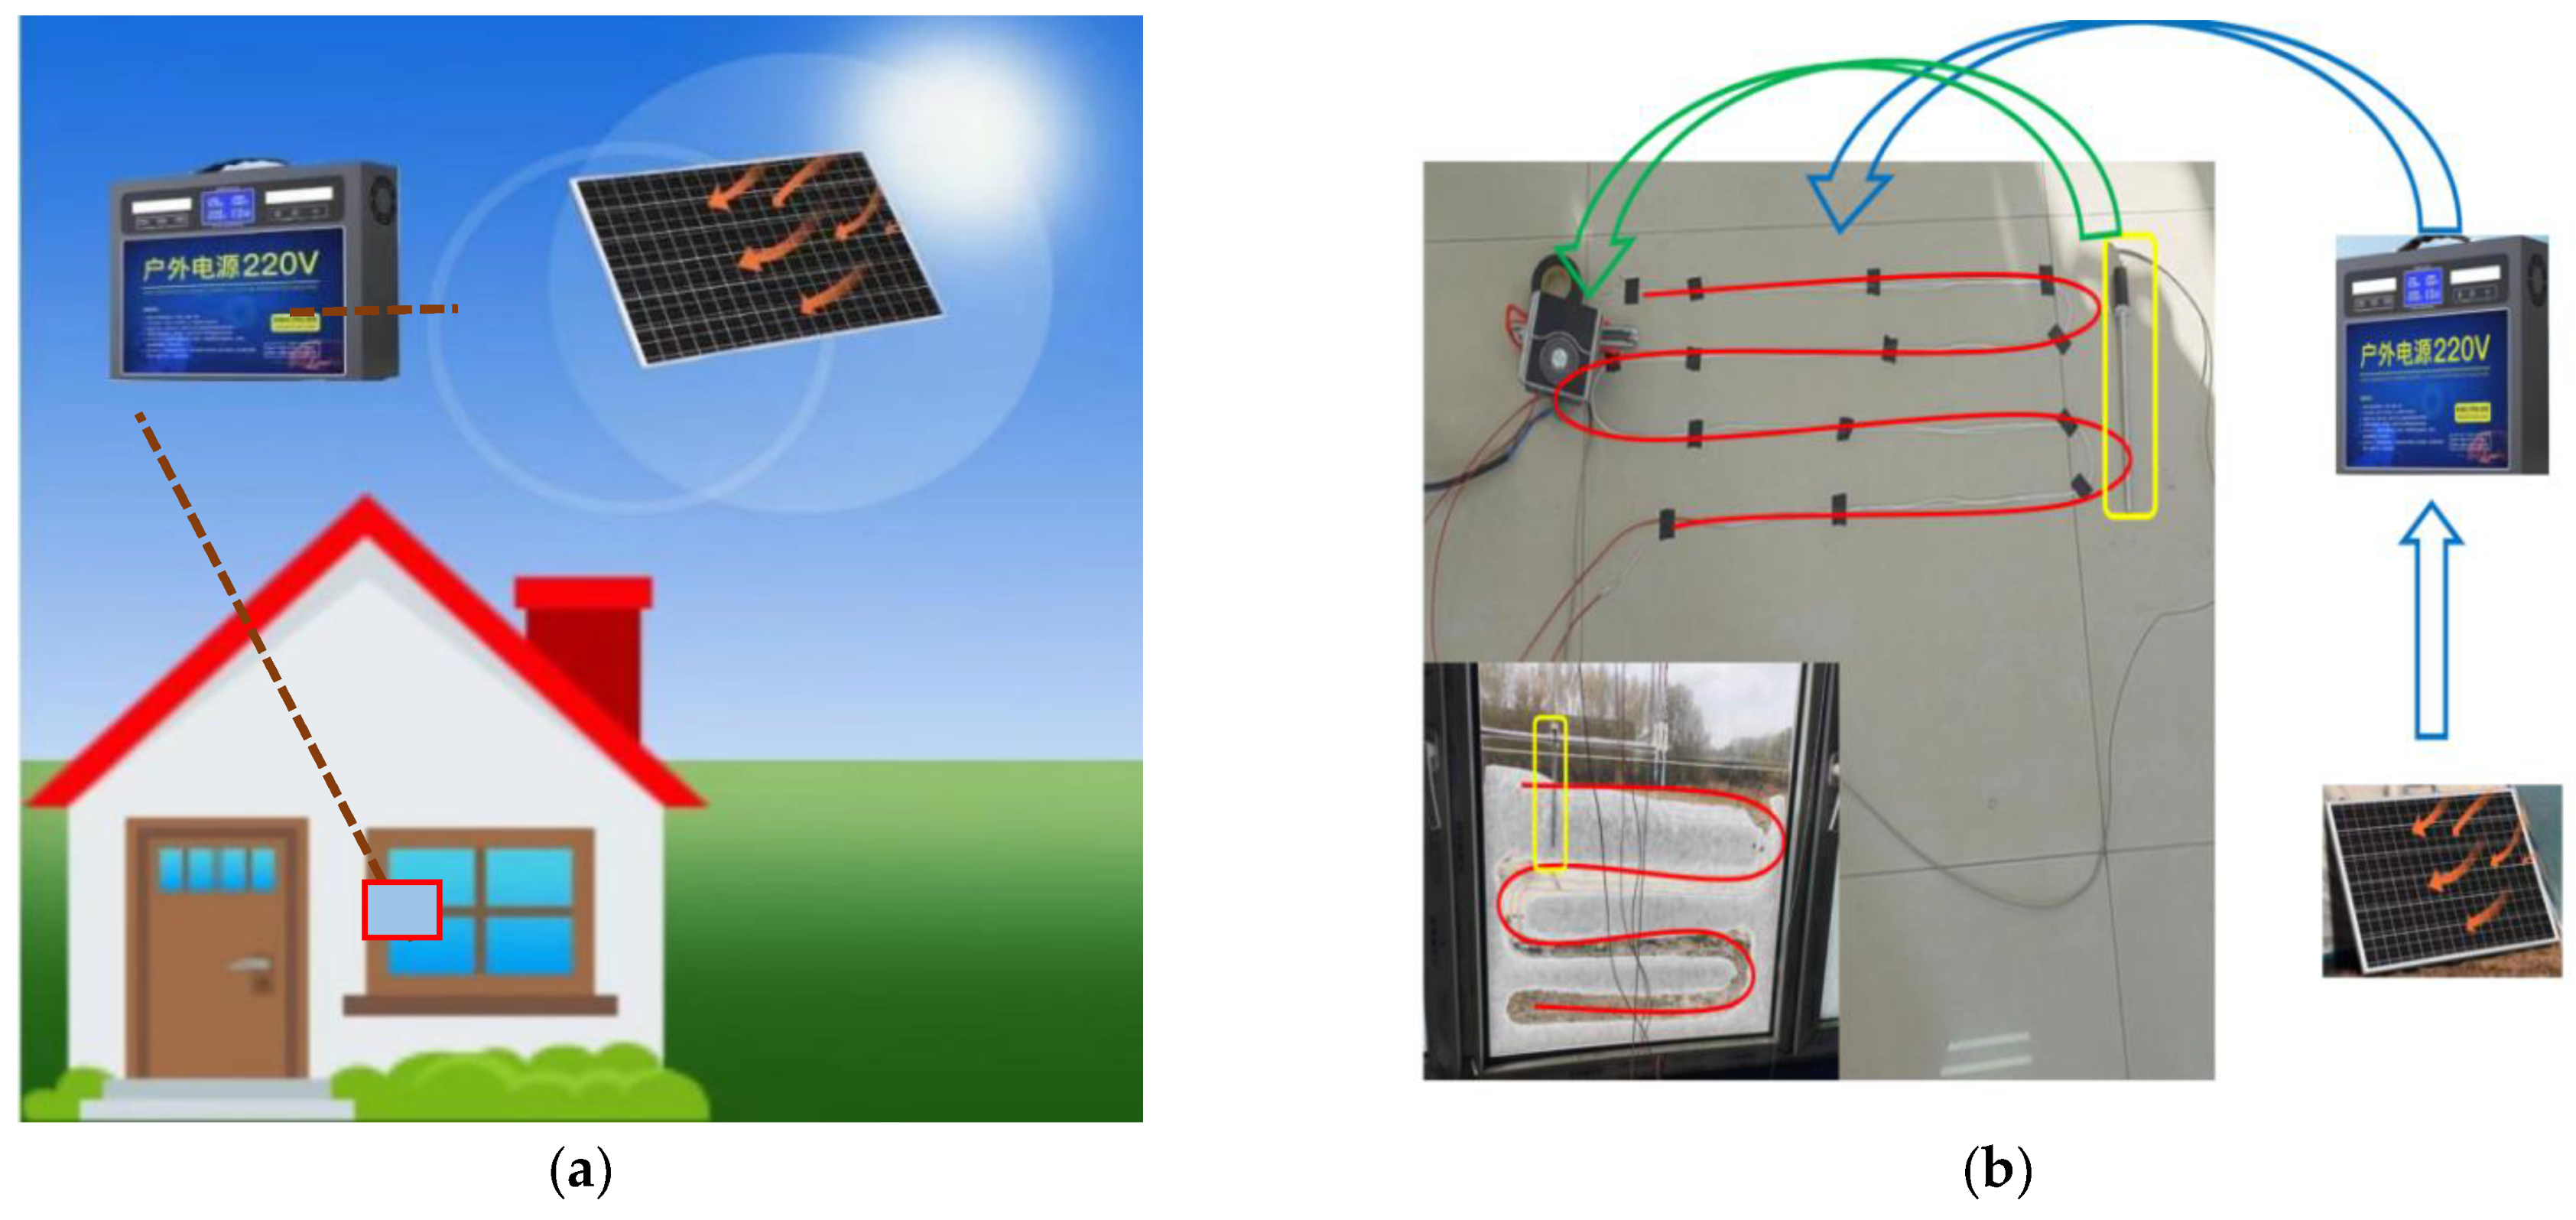
Buildings 15 01145 g001
Figure 2. Schematic diagram of passive phase change thermal storage window. (a) Schematic diagram of solar panels. (b) Schematic diagram of heating wire alignment. (c) Form schematic.
Buildings 15 01145 g002
Figure 3. Schematic diagram of the principle of solar phase change thermal storage window: (a) Schematic diagram of the macroscopic principle of solar phase change thermal storage windows; (b) Schematic diagram of the principle of heatable external window.
Buildings 15 01145 g003
Figure 4. Paraffin DSC parameter curve. The upper half of the vertical axis represents heat release, while the lower half represents heat absorption. The comparable areas of the two peaks indicate that the heat absorption/release performance meets the requirements.
Buildings 15 01145 g004
Figure 5. Schematic diagram of experimental and control rooms. The left side shows the experimental group, while the right side displays the control group.
Buildings 15 01145 g005
Figure 6. Schematic diagram of the layout of the experimental room. The test points are arranged inside the room.
Buildings 15 01145 g006
Figure 7. Schematic diagram of the instrument: (a) Temperature sensors; (b) Digital display; (c) Light sensors.
Buildings 15 01145 g007
Figure 8. Schematic diagram of the instrument: (a) Photovoltaic panels; (b) Mobile power; (c) Heating wire.
Buildings 15 01145 g008
Figure 9. Temperature statistics of each test point without phase transition. Note: Each of the four data sets represents the results of four measurement points in the experimental and control rooms during a certain period of time. (a) Test point temperatures in the mornings of 21–25 August. (b) Temperature at the test site in the afternoon from 21 to 25 August. The three sets of data represent the inter-experimental temperature, inter-control temperature, and ambient temperature, respectively.
Buildings 15 01145 g009
Figure 10. Temperature statistics of phase transition experiment. Note: Each of the three data sets shows the process of phase transition change over a period of time, from the onset to the end of the phase transition. (a) Test point temperatures on the morning of 8 October. (b) Temperature at the test point on the afternoon of 8 October. (c) Test point temperatures on the morning of 12 October. (d) Temperature at the test site on the afternoon of October 12. (e) Temperature at the test site on the morning of 13th October. (f) Temperature at the test point on the afternoon of 13th October. The three sets of data represent the inter-experimental temperature, inter-control temperature, and ambient temperature, respectively.
Buildings 15 01145 g010aBuildings 15 01145 g010b
Figure 11. Temperature data without phase transition experiment. The three sets of data represent the inter-experimental temperature, inter-control temperature, and ambient temperature, respectively.
Buildings 15 01145 g011
Figure 12. Temperature data of phase transition experiment. The three sets of data represent the inter-experimental temperature, inter-control temperature, and ambient temperature, respectively.
Buildings 15 01145 g012
Figure 13. Schematic diagram of adding modules: (a) Model layer; (b) Model second floor (roof).
Buildings 15 01145 g013
Figure 14. Schematic diagram of Airpak modeling.
Buildings 15 01145 g014
Figure 15. Schematic diagram of temperature field: (a) Floor plan; (b) Elevations.
Buildings 15 01145 g015
Figure 16. Schematic diagram of temperature field: (a) Floor plan; (b) Elevation drawings.
Buildings 15 01145 g016
Figure 17. Schematic diagram of temperature field: (a) Floor plan; (b) Elevation drawings.
Buildings 15 01145 g017
Figure 18. Schematic diagram of temperature field: (a) Floor plan; (b) Elevation drawings.
Buildings 15 01145 g018
Figure 19. Schematic diagram of temperature field: (a) Floor plan; (b) Elevation drawings.
Buildings 15 01145 g019
Figure 20. Schematic diagram of temperature field: (a) Floor plan; (b) Elevation drawings.
Buildings 15 01145 g020
Table 1. Specific performance parameters of industrial paraffin.
HallmarkUnit (of Measure)NormTest Standard
Phase transition temperature°C18ASTME1269
Thermal conductivityW-m−1-K−10.21ISO 22007-2:2008
Latent heat of phase transitionJ-g−1220 ± 10ASTME1269
Flash point°C135-
Boiling°C287-
Specific heat capacitykJ/kg-K2-
Material (that sth is made of)-organic material-
Density (solid/liquid)g-cm−30.88/0.77ASTM D792
Operating temperature°C−40–120GB/T 3512-2001
ASTME1269 Test Standard for Determining Specific Heat Capacity by Differential Scanning Calorimetry, 2018; ISO 22007-2:2008 Test Standard for Determination of thermal conductivity and thermal diffusivity, 2008; ASTM D792 Test Standard Methods for Density and Specific Gravity (Relative Density) of Plastics by Displacement; GB/T 3512-2001 Test Standard for Rubber, vulcanized or thermoplastic Accelerated ageing and heat resistance tests.
Table 2. Measurement contents and methods between experimental and control groups.
Serial NumberMeasurement ContentConcrete Way
1–4Inter-laboratory temperatureTemperature sensor acquisition
5–8Temperature between controlsTemperature sensor acquisition
9Light intensity between experimentsLight sensor acquisition
10Light intensity between controlsLight sensor acquisition
Note: The position of cloth points 1–4 and 5–8 should be as identical as possible to avoid affecting the final results of the test.
Table 3. Parameters of building envelope structure.
Parameter CategoryConfiguration DescriptionPerformance Parameters
External wall50 mm rock wool boardK = 0.730 W/(m2-K)
Roofing50 mm rock wool boardK = 0.730 W/(m2-K)
External window12 A steel and aluminum single Frame Double glazed windowK = 3.900 W/(m2-K)
Outer doorThermal doorK = 1.972 W/(m2-K)
External sunshadeNot have-
Equipment/personnel/lighting gained hotNot have-
ventilationNatural ventilationtime/h
Table 4. Heating load calculation results.
Cooling Load of Experimental Room (kW)Control Room Cooling Load (kW)Energy Difference in One Hour (kJ)Utilization Factor
0.7420.56464048.5%
0.7680.5482062.1%
0.440.30747836.2%
0.2870.0778159.2%
Table 5. Heating load calculation results.
Cooling Load of Experimental Room (kW)Control Room Cooling Load (kW)Energy Difference in One Hour (kJ)Utilization Factor
0.6100.3788567%
0.6740.34120291%
0.8290.407151996.2%
Table 6. Heating load calculation results.
Heat Load of the Laboratory Room (kW)Control Room Heat Load (kW)Energy Difference in One Hour (kJ)Utilization Factor
0.5920.44646052%
0.7940.6455463%
0.420.30740646%
Table 7. Heating load calculation results.
Heat Load of the Laboratory Room (kW)Control Room Heat Load (kW)Energy Difference in One Hour (kJ)Utilization Factor
0.7420.5183594%
0.440.2182894.1%
0.8020.59474885%
Table 8. Temperature measurement points.
Test Point NumberTemperature of Measurement Point Between Experiments (°C)Temperature of Measurement Point Between Controls (°C)
1/530.731.7
2/630.731.9
3/731.532.5
4/831.332.7
Table 9. Temperature of measurement points.
Test Point NumberTemperature of Measurement Point Between Experiments (°C)Temperature of Measurement Point Between Controls (°C)
1/514.310.7
2/614.511
3/713.612.9
4/813.212.5
Table 10. Temperature measurement points.
Test Point NumberTemperature of Measurement Point Between Experiments (°C)Temperature of Measurement Point Between Controls (°C)
1/526.737.2
2/626.937.3
3/724.826.3
4/824.326.2
Table 11. Temperature measurement points.
Test Point NumberTemperature of Measurement Point Between Experiments (°C)Temperature of Measurement Point Between Controls (°C)
1/5−8.1−10.4
2/6−7.5−9.8
3/7−7.6−11.8
4/8−7.6−9.7
Table 12. Temperature measurement points.
Test Point NumberTemperature of Measurement Point Between Experiments (°C)Temperature of Measurement Point Between Controls (°C)
1/5−1.3−1.4
2/6−0.9−1.8
3/7−2.5−8.7
4/8−0.5−2.1
Table 13. Temperature of measurement points.
Test Point NumberTemperature of Measurement Point Between Experiments (°C)Temperature of Measurement Point Between Controls (°C)
1/55.42.6
2/64.33
3/71.4−4
4/81.70.3
Disclaimer/Publisher’s Note: The statements, opinions and data contained in all publications are solely those of the individual author(s) and contributor(s) and not of MDPI and/or the editor(s). MDPI and/or the editor(s) disclaim responsibility for any injury to people or property resulting from any ideas, methods, instructions or products referred to in the content.

