1. Introduction
The excessive release of greenhouse gases, particularly carbon dioxide (CO
2), has significantly contributed to global warming, posing unprecedented climate challenges worldwide. In response, governments globally have implemented various policies aimed at reducing emissions [
1,
2]. At the 2020 UN General Assembly, China formally declared its climate goals, committing to peak CO
2 emissions by 2030 and achieve carbon neutrality by 2060. This underscores China’s strategic dedication to addressing global environmental governance [
3]. Within this framework, cities, as hubs of economic activity, play a central role in energy consumption and carbon emissions, making them critical focal points for mitigation efforts [
4]. As the urban area continues to expand, the population increases, and carbon emissions gradually rise, controlling urban carbon emissions is the key to achieving the goal of sustainable development [
5,
6]. Urban areas are an important part of a city. Due to their high-density population and intensive economic activities, they have become major sources of energy consumption and carbon emissions. The issue of carbon emissions in urban areas is becoming increasingly prominent, and it is expected that their emissions will show a significant growth trend in the future [
6,
7]. Therefore, the development of efficient clean energy technologies and the improvement of energy utilization efficiency are crucial for promoting the transition of urban areas to a low-carbon development model [
8]. This not only helps alleviate the impact of climate change but also serves as a key measure to achieve the national carbon peak and carbon neutrality goals [
9].
In recent years, China has implemented a range of measures to combat pollution and enhance environmental quality, such as upgrading industrial structures, controlling pollution at its source, expanding afforestation efforts, and promoting public transportation. These initiatives aim to foster green economic growth [
10,
11]. The introduction of the dual-carbon targets represents a strategic response to climate change and a critical step in advancing ecological civilization [
12]. To achieve these goals, it is essential to accelerate the transition to cleaner energy systems, drive innovation in green and low-carbon technologies, and facilitate industrial transformation. These efforts not only support sustainable development but also provide new momentum for high-quality economic and social progress [
13,
14]. Consequently, the integration of high-quality development, pollution prevention, and dual-carbon objectives forms the foundational framework of China’s ecological civilization strategy [
15,
16,
17].
Carbon emission accounting is the basis for formulating effective carbon-reduction strategies, and carbon emission peak prediction is an important tool for evaluating and planning emission reduction paths [
18]. Currently, to predict peak carbon emissions, researchers have used various methods, including scenario analyses, statistical models, and complex models, such as machine learning. For example, Zhai et al. [
19] used the Markov model and the LEAP model to predict regional CO
2 emissions and assess emission-reduction potential based on different policy and technology scenarios, and it proves the importance of integrating carbon emission reduction and prediction. Niu et al. [
20] used the FLUS model and the ARIMA model to predict carbon emissions in the Yellow River Basin, and the mean absolute percentage error (MAPE) of the model was 5.2%, verifying the superiority of the prediction model in forecasting carbon emissions under different scenarios. Chang et al. [
21] revealed that the growth of electricity consumption was the main driver of China’s CO
2 emissions through projective tracking regression (PPR) and other machine learning models. To further verify the potential of coordinated carbon emission reductions through prediction, Zhang et al. [
22] took into account the carbon emission reduction linkages existing among cities. The prediction results demonstrated strong connections in carbon emissions among cities. Xu et al. [
23] proposed the use of a hybrid model to reduce the limitations of a single model and proved the superiority of the hybrid model through experiments. However, these methods all have limitations, such as the reliance on preset scenarios or high-quality historical data and the limited ability to capture long-term dynamic changes [
19,
20,
21]. To overcome these challenges, the KAYA model, as a classical decomposition analysis framework, decomposes total carbon emissions into four factors: population, GDP, energy intensity, technological progress, which can analyze the key driving factors affecting carbon emissions and is applicable to predicting peak carbon emissions in urban areas [
24]. Xu et al. [
23] predicted, by using the KAYA model combined with the multi-scenario analysis model, that the carbon emission peak in the Chengdu urban area is expected to be reached in 2025, which verifies the effectiveness of the model. Huo et al. [
25] combined the KAYA model with the Monte Carlo model and found that carbon emissions from urban residential buildings in hot summer and cold winter areas in China will peak in 2040. The research demonstrates that the KAYA model can be combined with other models. Although existing studies have made some progress in predicting the peak carbon emissions at an urban level by using the KAYA model, most of these studies focus on the carbon emissions of urban residential buildings and adopt a single-dimensional analysis method, failing to fully consider the characteristics of several key urban areas, such as transportation, the water system, and solid waste treatment [
23,
25]. Therefore, these studies have obvious shortcomings in building a comprehensive carbon-emission-analysis framework. To make up for this shortcoming, it is urgent to carry out multidimensional research while predicting the peak carbon emission, to provide a more complete and systematic urban carbon emission management solution [
26].
To cope with global climate change, strengthen environmental protection, and save resources and energy, the Chinese government is constantly exploring new ideas, new methods, and new technologies for sustainable development. As the regional government faces the double pressure of economic construction and carbon emission reduction, it needs to find a way to achieve carbon emission reductions in economic development. To sum up, urban areas are the key components of cities and carbon emission reductions in urban areas will effectively promote the reduction of urban carbon emissions. Currently, there are relatively few studies on urban carbon emissions. Most researchers mainly focus on building carbon emissions with a single-dimensional analysis. Meanwhile, prediction methods have limitations, making it difficult to construct a comprehensive analysis framework. The novelty of this study lies in constructing a multi-system carbon emission calculation model and combining the KAYA model with multiple scenarios for long-term and short-term predictions. The unique contribution of this research is to propose a carbon emission reduction path covering multiple fields, providing a relatively comprehensive solution for the low-carbon transformation of cities.
2. Research Method
2.1. Carbon Emission Calculation Model
The energy consumption of buildings, transportation, and industries is decomposed, and then, different types of energy consumption carbon emissions are calculated, which can be divided into building carbon emissions, transportation carbon emissions, water system carbon emissions, solid waste carbon emissions, offset carbon emissions of renewable energy, and the carbon sink.
2.1.1. Building Carbon Emission Model
Analyzing the building carbon emissions calculation model reveals that the building area, building type, and the carbon emission factors of various energy sources are the main influencing factors [
27]. Therefore, the formula is as follows:
In the equation, represents the building’s carbon emissions, represents the floor area of the type of building, represents the annual electricity consumption of the type of building, represents the carbon emission factor for electricity, represents the annual gas consumption of the first type of building, and represents the carbon emission factor for natural gas.
2.1.2. Transportation Carbon Emission Model
The principal determinants of transportation-related carbon emissions encompass the travel sharing rate, the overall travel demand, the travel modality, and the energy consumption per 100 km for each travel option. Travel modalities include buses, taxis, private automobiles, non-motorized vehicles, rail transit systems, and walking, among others. The travel mode sharing rate represents the percentage that each transportation mode accounts for within the overall transportation mix. The formula for calculating carbon emissions in the transportation sector is [
28] as follows:
In the equation, represents transportation carbon emission, represents the energy carbon emission factor, represents the sharing rate of the first travel mode, represents the total travel demand, represents the number of passengers carried by the travel mode, and represents the energy consumption per 100 km of the travel mode.
2.1.3. Carbon Emission Model of Water System
The carbon emissions of the water system are associated with multiple factors, including the total volume of urban water usage, the utilization ratio of renewable water resources, the energy consumption in water treatment processes, and the energy intensity of the water supply. The total urban water consumption quantity is in turn linked to elements like the urban population size, the per capita annual water consumption, and the leakage rate of the pipe network. Therefore, the formula for calculating carbon emissions of the water system is as follows [
29]:
In the equation, represents the carbon emissions of the water system, represents the energy consumption of tap water, represents the energy consumption of recycled water, and represents the green electricity influence coefficient during the planning period.
2.1.4. Solid Waste Carbon Emission Model
The carbon emissions generated during solid waste treatment are contingent upon factors, such as the population size, the per capita annual household waste production, the household waste recycling rate, and the carbon emission coefficient per unit of solid waste treatment. By regulating the per capita household waste generation amount and enhancing the household waste recycling rate, it is feasible to decrease the carbon emissions from solid waste treatment. The calculation formula for carbon emissions is shown in Formula (4) [
30].
In the equation, represents the carbon emission of solid waste, represents the planned population size, represents the planned per capita annual household waste generation, represents the recycling rate of household waste, and represents the carbon emission coefficient of unit solid waste treatment.
2.1.5. Renewable Energy Carbon Emission Model
The carbon emissions of renewable energy are predominantly associated with the annual heating output of solar hot water systems, the reliability rate of the solar hot water supply, and the annual cumulative electricity generation of solar photovoltaic installations. So, the carbon offset of renewable energy can be improved by improving the utilization rate of renewable energy. Therefore, the formula for the calculating the carbon offset of renewable energy is [
31] as follows:
In the equation, represents the carbon offset amount of renewable energy, represents the annual heating amount of solar hot water, represents the guarantee rate of solar hot water, and represents the annual cumulative power generation of solar photovoltaic.
2.1.6. Carbon Sink Model
Based on Formula (6), it can be discerned that the quantity of carbon sequestration is correlated with the green space area, the carbon sequestration capacity of vegetation, and the vegetation growth correction factors. By expanding the green space area and modifying the type of plant allocation, the carbon sink can be augmented [
32].
In the equation, represents carbon sink, represents the area of the kind of green space, represents the proportion of trees in the kind of green space, represents the carbon sequestration amount of trees, represents the proportion of shrubs in the kind of green space, represents the carbon sequestration amount of shrubs, represents the proportion of grassland in the kind of green space, represents the carbon sequestration amount of grassland, and represents the correction factor for vegetation growth.
2.2. Prediction Model of Peak Carbon Emissions
The KAYA model, a widely utilized analytical instrument for CO
2 emissions, is characterized by its straightforward formula. This simplicity enables it to distinctly elucidate the factors influencing carbon emission variations. Moreover, it is well-adapted for predicting carbon emissions in urban regions. Based on the KAYA model, CO
2 emissions are correlated with the product of factors, such as the population size, economic level, and energy consumption, and the specific formula is as follows [
33]:
In the equation, represents the total carbon emissions, represents the population, represents the per capita GDP, represents the energy consumption intensity per unit GDP, and represents the carbon density.
2.3. Short-Term Prediction Model of Carbon Emissions
XGBoost (Extreme Gradient Boosting) mitigates the error of the prediction model through a sequential tree-addition approach. It employs the CART-based learner, where new trees are incrementally incorporated to approximate the residual of the previous prediction. The underlying mechanism involves an iterative prediction process using an additive model. In each iteration, a new tree is introduced, and its construction aims to better fit the cumulative prediction residuals of all previously added trees [
34]. Therefore, the generation of a tree will consider the prediction residual of all trees before, and XGBoost will add the prediction results of all trees to obtain the final prediction result, as shown in Formula (8).
In the equation, represents the predicted value, represents the j-th regression tree, represents the number of CART-based learners, represents the sum result of k − 1 regression trees, represents the sample eigenvalue, and represents the k-th regression tree that needs to be optimized.
The XGBoost algorithm can process a large amount of data, reduce prediction error, and prevent the overfitting phenomenon, which can be an effective tool for an urban carbon emission prediction model [
35].
In this study, the grid search method was used to optimize the hyperparameters of XGBoost. Parameter ranges, such as the learning rate, the maximum depth of the tree, and the number of estimators, were set, and the best combination was determined through cross-validation. Finally, the learning rate was selected as 0.1, the maximum depth of the tree was 5, and the number of estimators was 150.
2.4. Evaluation Index
This study selects the mean absolute error (MAE), root mean square error (RMSE), and coefficient of determination (R
2) to evaluate the predictive performance of the model [
36]. The formulas for the evaluation metrics are as follows:
In the equation, represents average of actual value, represents the actual value, represents average of predicted value, represents the number of samples, and represents the predicted value.
By breaking down the carbon emission calculation models of six major systems—urban buildings, transportation, water systems, solid waste, renewable energy utilization, and carbon sinks—it is clear that during the planning phase, adjustments can be made to various indicators, such as the planned building area, the proportion of different types of buildings, modes of transportation, transportation type proportions, per capita water consumption, renewable water resource utilization, pipeline leakage rate, per capita solid waste generation, carbon sinks, and renewable energy utilization rate to reduce urban carbon emissions.
3. Case Study
To address planetary environmental governance imperatives, China is pioneering institutional innovations in green growth frameworks. The China-Singapore Tianjin Eco-City project in Tianjin is a model for eco-friendly urban construction with limited resources. The China-Singapore Tianjin Eco-City covers an area of 150 square kilometers. By 2020, the construction area of the eco-city will be 9.943 million square meters, of which the residential building area will be 7.278 million square meters, the public building area will be 1.567 million square meters, and the industrial building area will be 1.098 million square meters.
The data used in this study, such as building energy consumption, and industrial and transportation energy consumption, are publicly available online. During the data-collection process, to ensure the accuracy and reliability of the data, this study pre-processed the data and verified it through methods, such as cross-validation.
3.1. Carbon Emission Analysis
The quantitative analysis of carbon emissions focuses on the country or city level and covers the total amount of greenhouse gases produced by all economic and social activities. The urban area is an important part of a city, and carbon emission accounting is achieved by accurately measuring greenhouse gases released directly or indirectly by government agencies and business entities. In the specific implementation process, the greenhouse gas emissions generated by various activities can be comprehensively audited. According to the greenhouse gas emission inventory prepared, the emissions of different sectors or industries can be further subdivided and calculated to form an overall carbon emission profile. This study will deeply study the total amount, intensity, and main sources of greenhouse gas emissions of China-Singapore Tianjin Eco-City, and the results will become an important basis for predicting carbon emissions, exploring emission-reduction strategies, and formulating policy frameworks for low-carbon development.
3.1.1. Energy Consumption Analysis
Building Energy Consumption
This paper divides public buildings according to their different functions, including commercial buildings, entertainment venues, offices, and research venues, educational institutions at all levels (including universities, middle schools, primary schools, and kindergartens), municipal yards and stations, and medical institutions. Direct carbon emissions include carbon emissions generated by natural gas consumed in the processes of catering, domestic hot water, and production demands (except for natural gas consumed in building heating). Indirect carbon emissions refer to the carbon emissions generated by electricity and heat consumption in building operations. See
Table 1 for specific data.
Industrial Energy Consumption
The land used in the eco-city is divided into two types: industrial land of the first class and industrial land of the second class. The energy consumption of these two types of industrial land is mainly electricity and heat. The details are shown in
Table 2.
Transportation Energy Consumption
Table 3 shows the data table of transportation energy consumption in the region, including taxis, rail transit, and buses.
3.1.2. Total Carbon Emissions
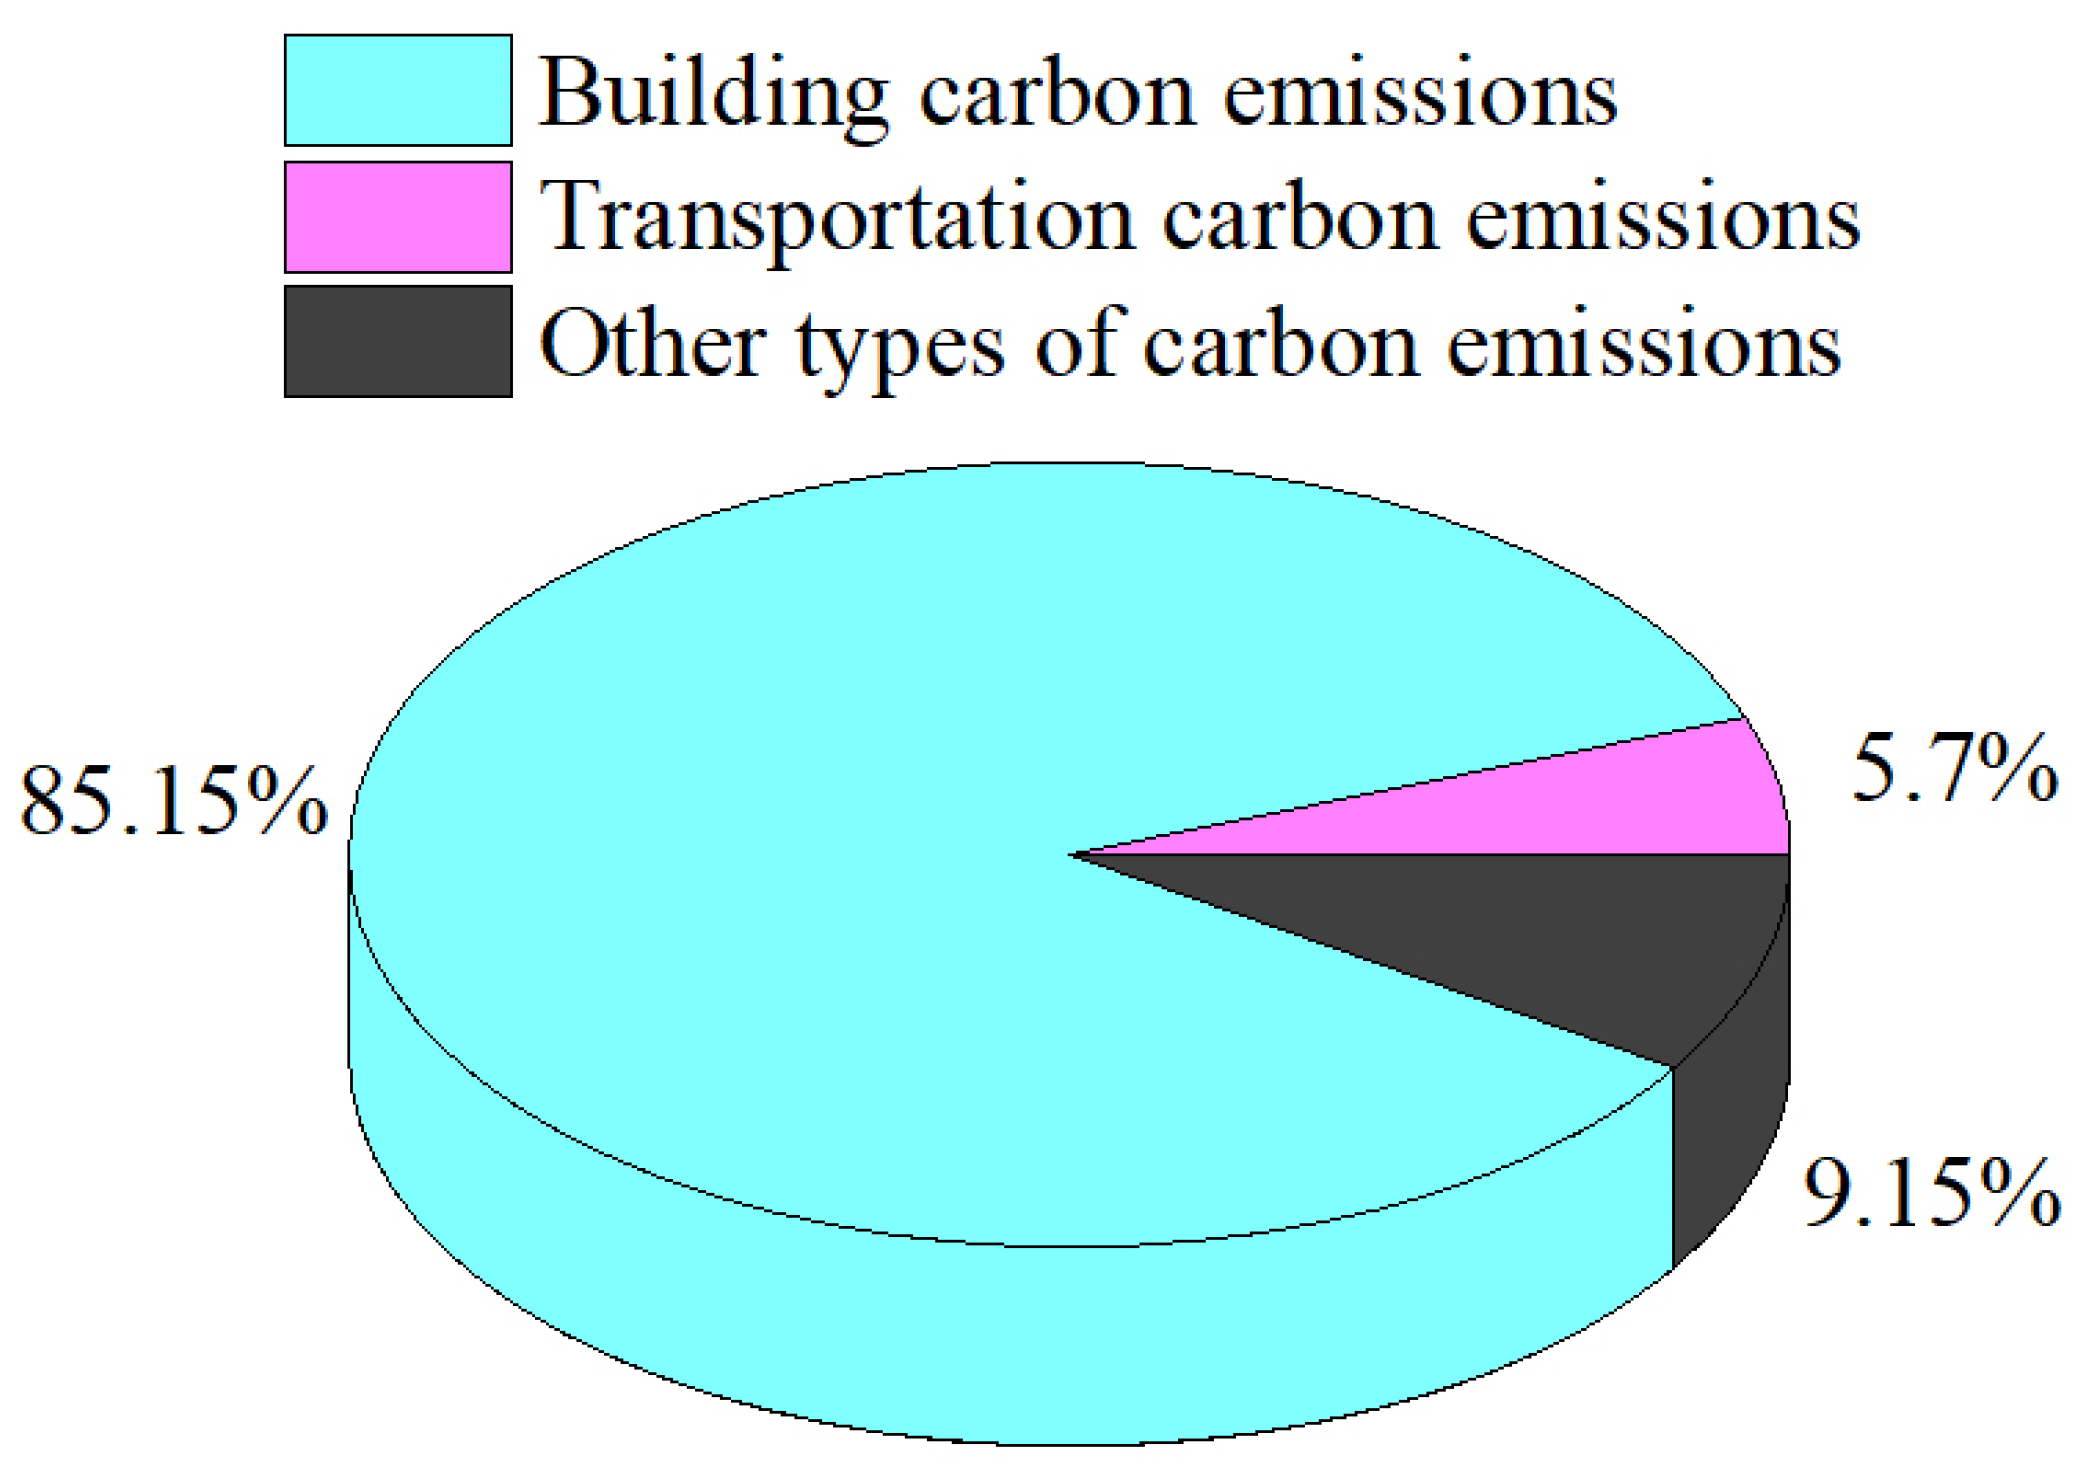
Summarize the carbon emission inventory of the eco-city, and combine the data published by government agencies with the carbon emission model. In 2020, the eco-city will have 517,100 tons of carbon emissions from buildings, 34,600 tons from transportation, and 55,600 tons from other types of carbon emissions (
Figure 1). The total carbon emissions of the eco-city in 2020 will be 607,300 tons.
3.2. Prediction of Peak Carbon Emission Based on Scenario Analysis
This study employs scenario planning to forecast urban carbon peaking, identifying emission-energy drivers in eco-cities. Predictive algorithms model emission trajectories under policy-responsive scenarios aligned with urban development blueprints, ultimately projecting peak carbon emission [
37].
3.2.1. Scenario Setting
The first year of the study is 2020. The energy consumption intensity is calculated according to
Section 2.1. Three scenarios are set according to different propulsion intensities, which are respectively the baseline scenario, low carbon scenario, and enhanced low carbon scenario.
Base Scenario
Given the eco-city’s persistent economic growth, population increase, resource utilization, and energy requirements, it is expected to sustain its current developmental trajectory. The construction sector will likely continue its rapid expansion, accompanied by a rise in the adoption of high-energy-consuming equipment. Lifestyle patterns are anticipated to align more closely with those observed in developed nations across Europe and North America.
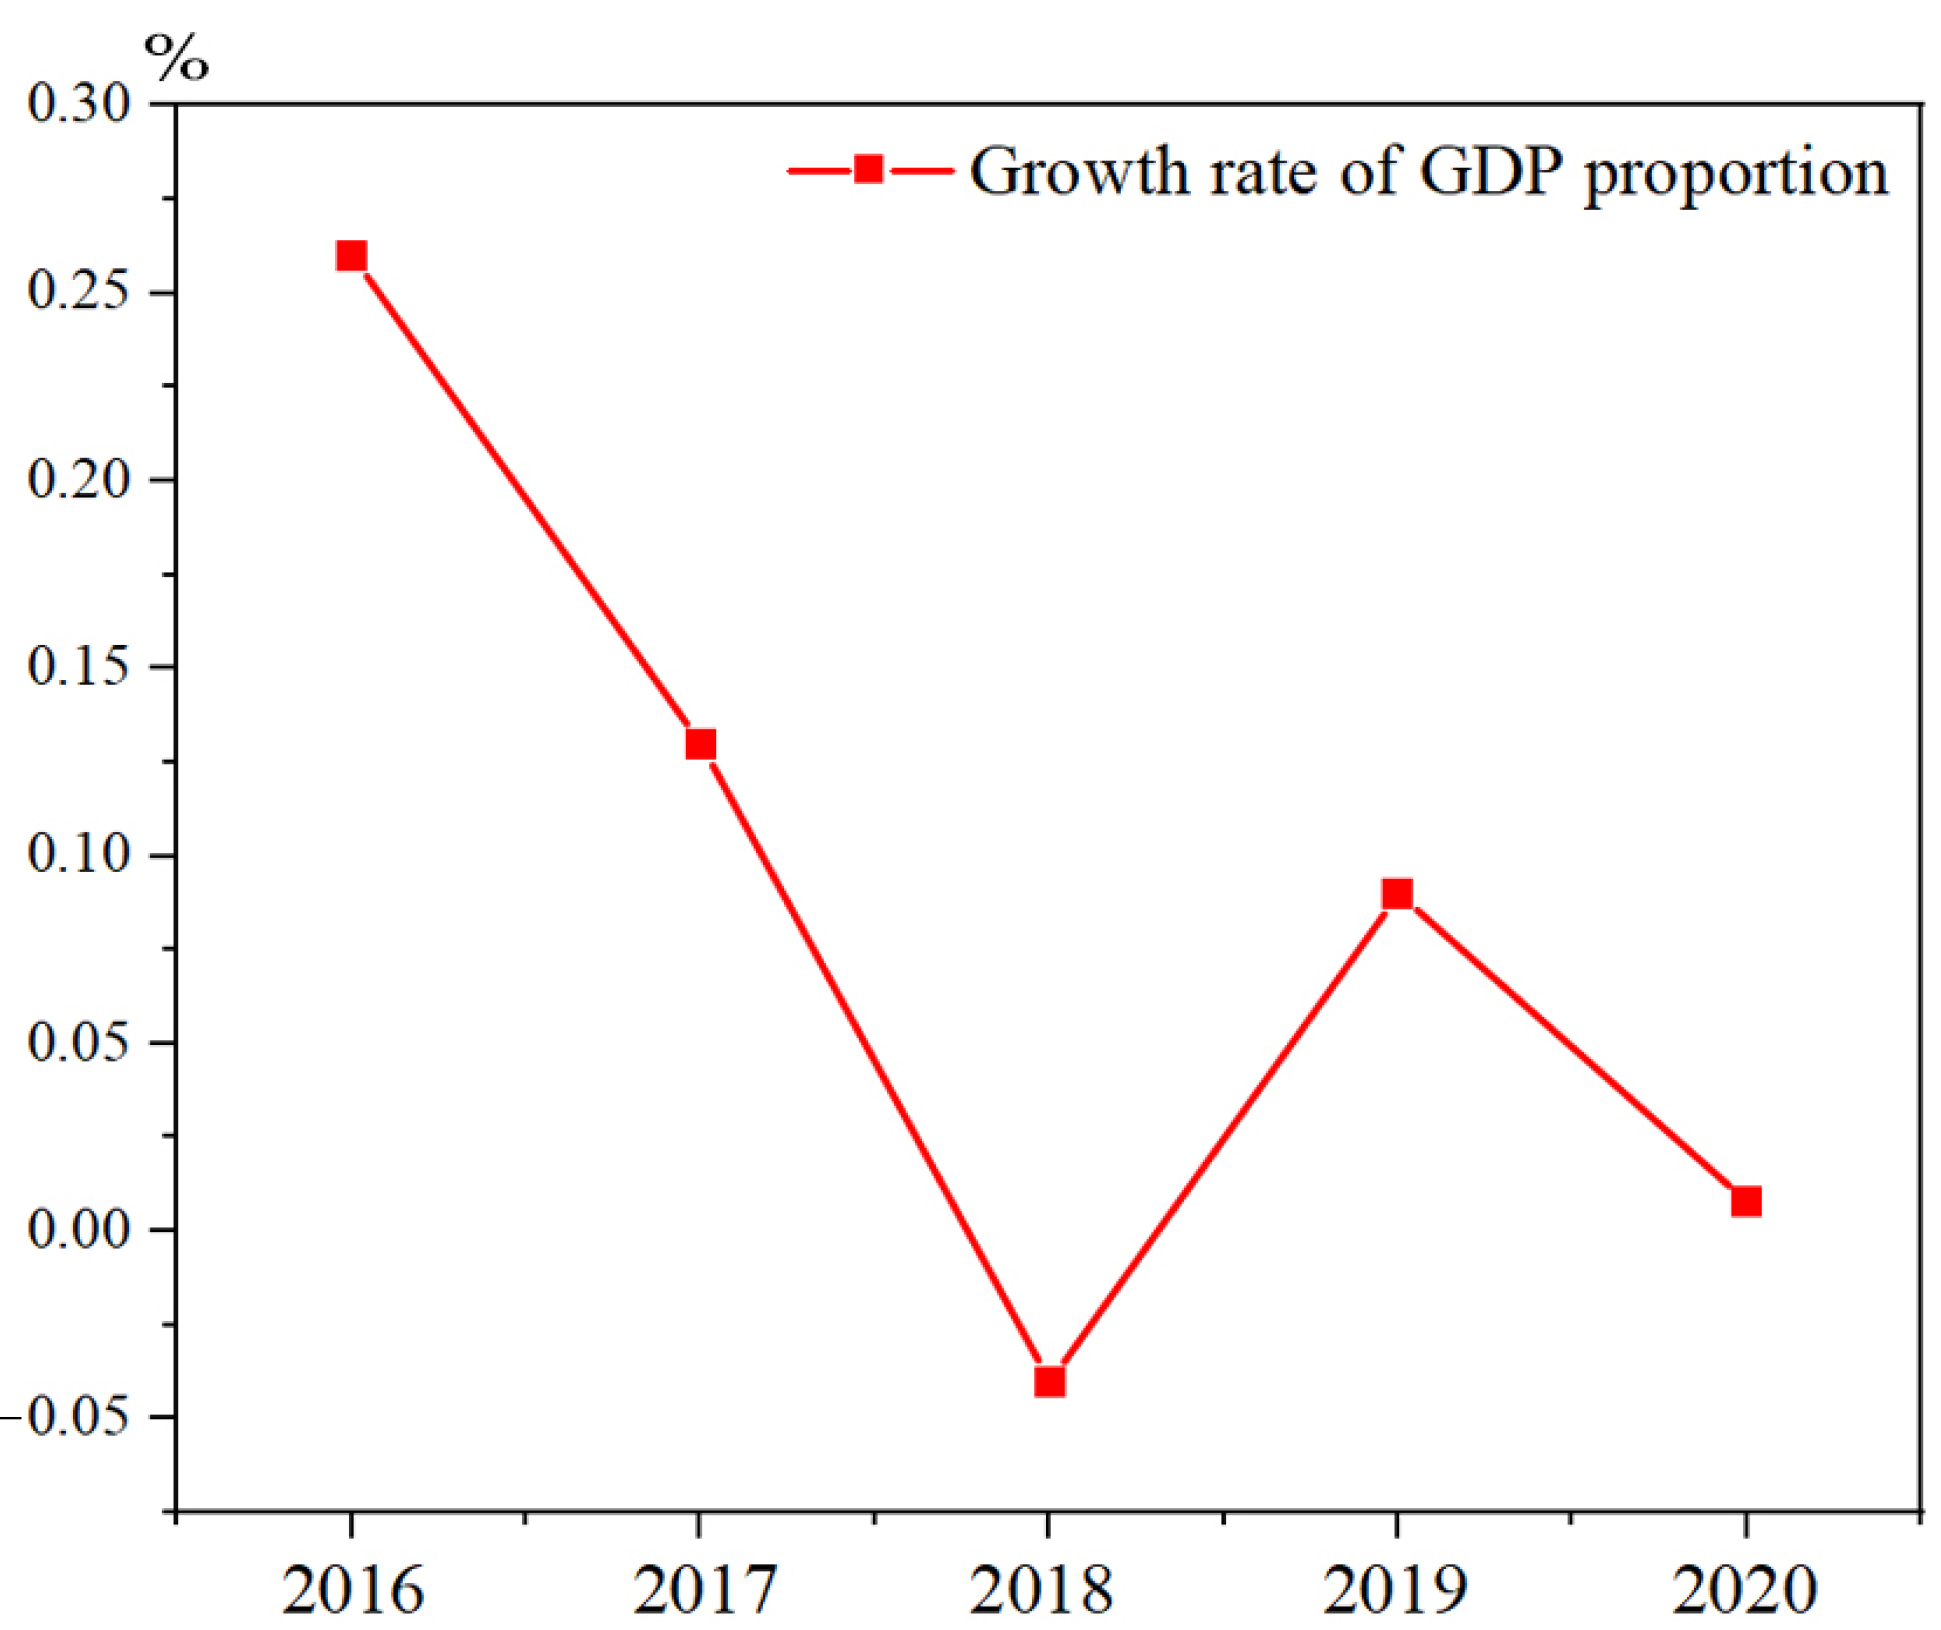
During the 13th Five-Year Plan period, the regional GDP of eco-cities increased from 17.65 billion yuan in 2016 to nearly 50 billion yuan in 2020, and the growth rate of the GDP is shown in
Figure 2. There is no primary industry within the scope of eco-city management, and the proportion of secondary industry increased slightly from 16.4% in 2016 to 18% in 2020, while the proportion of tertiary industry decreased slightly from 83.6% in 2016 to 82% in 2020. The tertiary industry has been maintaining a trend of more than 80%. Compared with the secondary industry, the energy consumption of the tertiary industry is significantly lower, and its carbon emission of 10,000 yuan GDP, that is, the carbon intensity, is also significantly lower than that of the secondary industry. Therefore, the trend of maintaining sustained rapid development and a high proportion of the tertiary industry in the eco-city is conducive to controlling the excessive growth rate of carbon dioxide emissions accompanied by economic growth.
In 2019, the eco-city had a resident population of 85,000, which grew to 100,000 by the end of 2020. Projections suggest that the permanent population will reach approximately 600,000 by 2035. This rapid growth has attracted a significant influx of residents, leading to a surge in household energy consumption and amplifying the impact of population growth on lifestyle-related carbon emissions. As the population continues to expand, its influence on emissions from sectors, such as buildings, transportation, and industries, is expected to become increasingly pronounced.
Low-Carbon Scenario
Within resource-carrying-capacity thresholds, the construction sector will implement development intensity controls while advancing a tiered energy conservation framework: accelerating the large-scale application of ultra-low energy buildings, piloting near-zero energy technology pathways, and zero energy consumption buildings. Concurrent measures include enhancing equipment efficiency parameters and deploying intelligent operation and maintenance systems, establishing smart energy monitoring systems throughout building lifecycles to guide user-side low-carbon behavioral transitions.
Enhancing Low-Carbon Scenarios
In the context of low-carbon scenarios, scale up the implementation of renewable energy projects at the municipal level.
3.2.2. Prediction Results of Peak Carbon Emissions
From a demographic perspective, the ongoing expansion of the eco-city has resulted in a steady population rise, intensifying residential and industrial activities. This escalation in activity levels drives a higher energy demand, subsequently influencing carbon emissions. Such observations align with the model’s assumption of a positive correlation between population growth and emission levels. Economically, the eco-city’s development correlates with increased energy consumption, given the current energy framework, thereby elevating carbon emissions. This trend supports the model’s premise linking economic growth to higher emission outputs. In terms of energy usage, advancements in technology and the adoption of energy-saving initiatives are expected to gradually reduce consumption. This aligns with the model’s foundational assumption and reflects the eco-city’s commitment to fostering green development and enhancing energy efficiency. Furthermore, as the eco-city transitions toward a more sustainable energy mix, the growing adoption of low-carbon and carbon-neutral energy sources is anticipated to alter the carbon density. This shift is consistent with the model’s projections and underscores the region’s proactive approach to energy structure optimization [
25].
Based on the evaluation of three distinct scenarios, relevant parameters were incorporated into the KAYA model to project peak carbon emissions and their trajectories. Under the baseline scenario, the eco-city is projected to achieve its emission peak in 2050, with emissions reaching 2.914 million tons of CO
2. In the low-carbon scenario, by enhancing the adoption rate of high-performance buildings, the peak is anticipated to occur earlier, in 2043, with emissions peaking at 2.408 million tons of CO
2. By 2050, emissions under this scenario are expected to decline to 2.351 million tons of CO
2. The carbon reduction in the low-carbon scenario will be 613,000 tons of CO
2, and the application of renewable energy will continue to be increased in the low-carbon scenario. Under the set renewable energy application scenario, the peak carbon emissions in 2043 will be 2.253 million tons of CO
2, and the carbon emissions in 2050 will be 2.182 million tons of CO
2. In order to achieve the peak of the eco-city in 2050, corresponding measures need to be taken to further improve the application level of renewable energy and the carbon sink capacity. Compared with previous studies [
24,
30], this research applies the KAYA model to the urban area. Most of the previous studies focused on carbon emissions in urban agglomerations. Moreover, this research conducts carbon emission predictions for multiple systems, such as buildings, transportation, and water systems, while previous studies only focused on a single system like buildings or transportation. By comparing the differences in predicting carbon peaks and trends between multi-system coupling and single-system research, it shows that multi-system research can more comprehensively reflect the carbon emission situation in urban areas and provide a basis for formulating comprehensive emission reduction strategies.
3.3. Research on Carbon Emission Reduction Path
The Chinese government’s requirement for the China-Singapore Tianjin Eco-City is to develop it into a national demonstration zone for green development and clearly stipulates that CO2 emissions per unit of GDP should be reduced to less than 0.2 tons of CO2 per 10,000 yuan by 2035.
In order to meet this carbon emission target and promote economic development at the same time, it is necessary to explore a development path that can both promote economic growth and effectively reduce carbon emissions [
32]. Based on the above requirements, this study uses a variety of models to predict short-term carbon emissions in different areas of the eco-city and selects the most appropriate prediction method for this study. At the same time, this study combined with the forecast results put forward a feasible carbon emission reduction path.
3.3.1. Predictive Model Screening
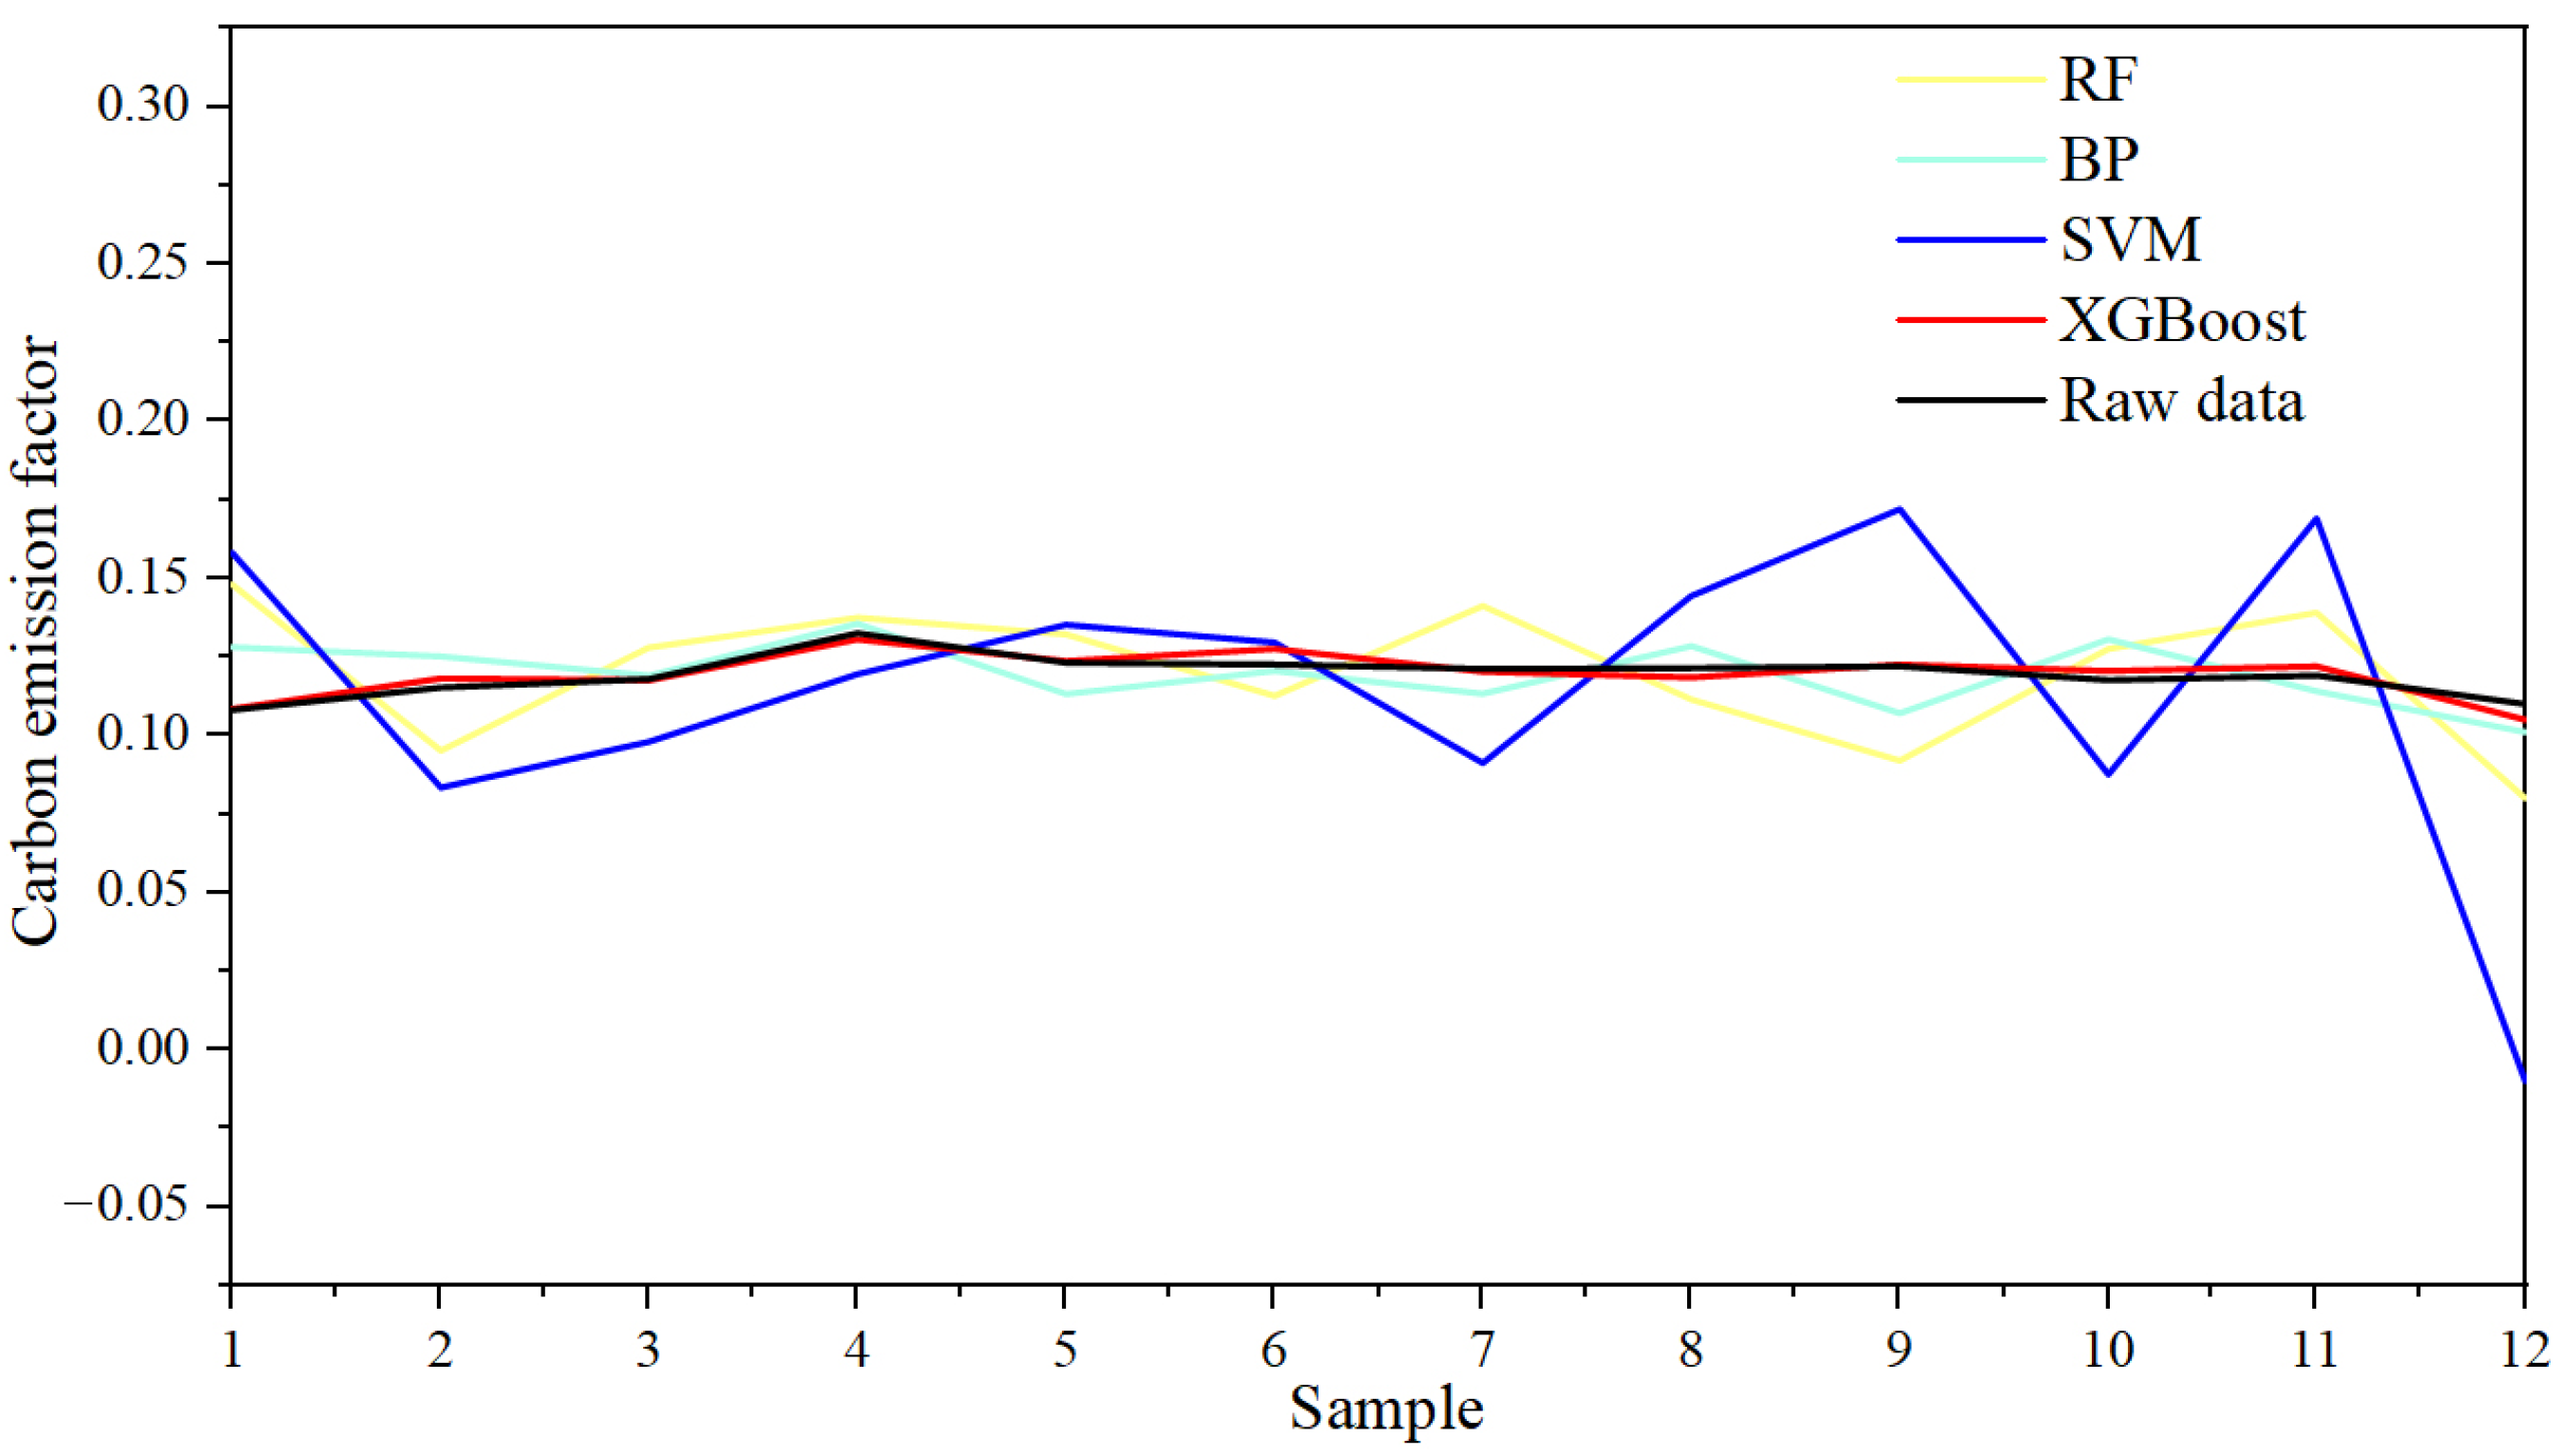
To identify an optimal model for carbon emission forecasting, this research evaluated the predictive accuracy of four machine learning algorithms: random forest (RF), backpropagation neural network (BP), support vector machine (SVM), and XGBoost. Thermal carbon emission factors were utilized as input variables for the analysis. A comparative assessment of model performance is presented in
Table 4, while
Figure 3 visually depicts the predictive outcomes generated using each algorithm.
Through a comparative analysis, it is found that XGBoost performs better than other prediction models in the process of prediction and effectively reduces the lag of other prediction models. Combined with the predictors in
Table 4, XGBoost’s R
2 is closest to 1. Compared with other prediction models, XGBoost has the smallest MAE and RMSE, which fully indicates that XGBoost has excellent prediction performance in urban carbon emission prediction.
3.3.2. Prediction Results of Carbon Emission Model
The XGBoost model is based on the gradient boosting framework. It assumes that by continuously fitting the residuals of the previous round of predictions, the prediction accuracy of the model can be gradually improved. With the increase in the number of iterations, that is, training a new regression tree in each round to fit the residuals of the previous round of predictions, this finally adds up the prediction results of all regression trees to obtain the final predicted value.
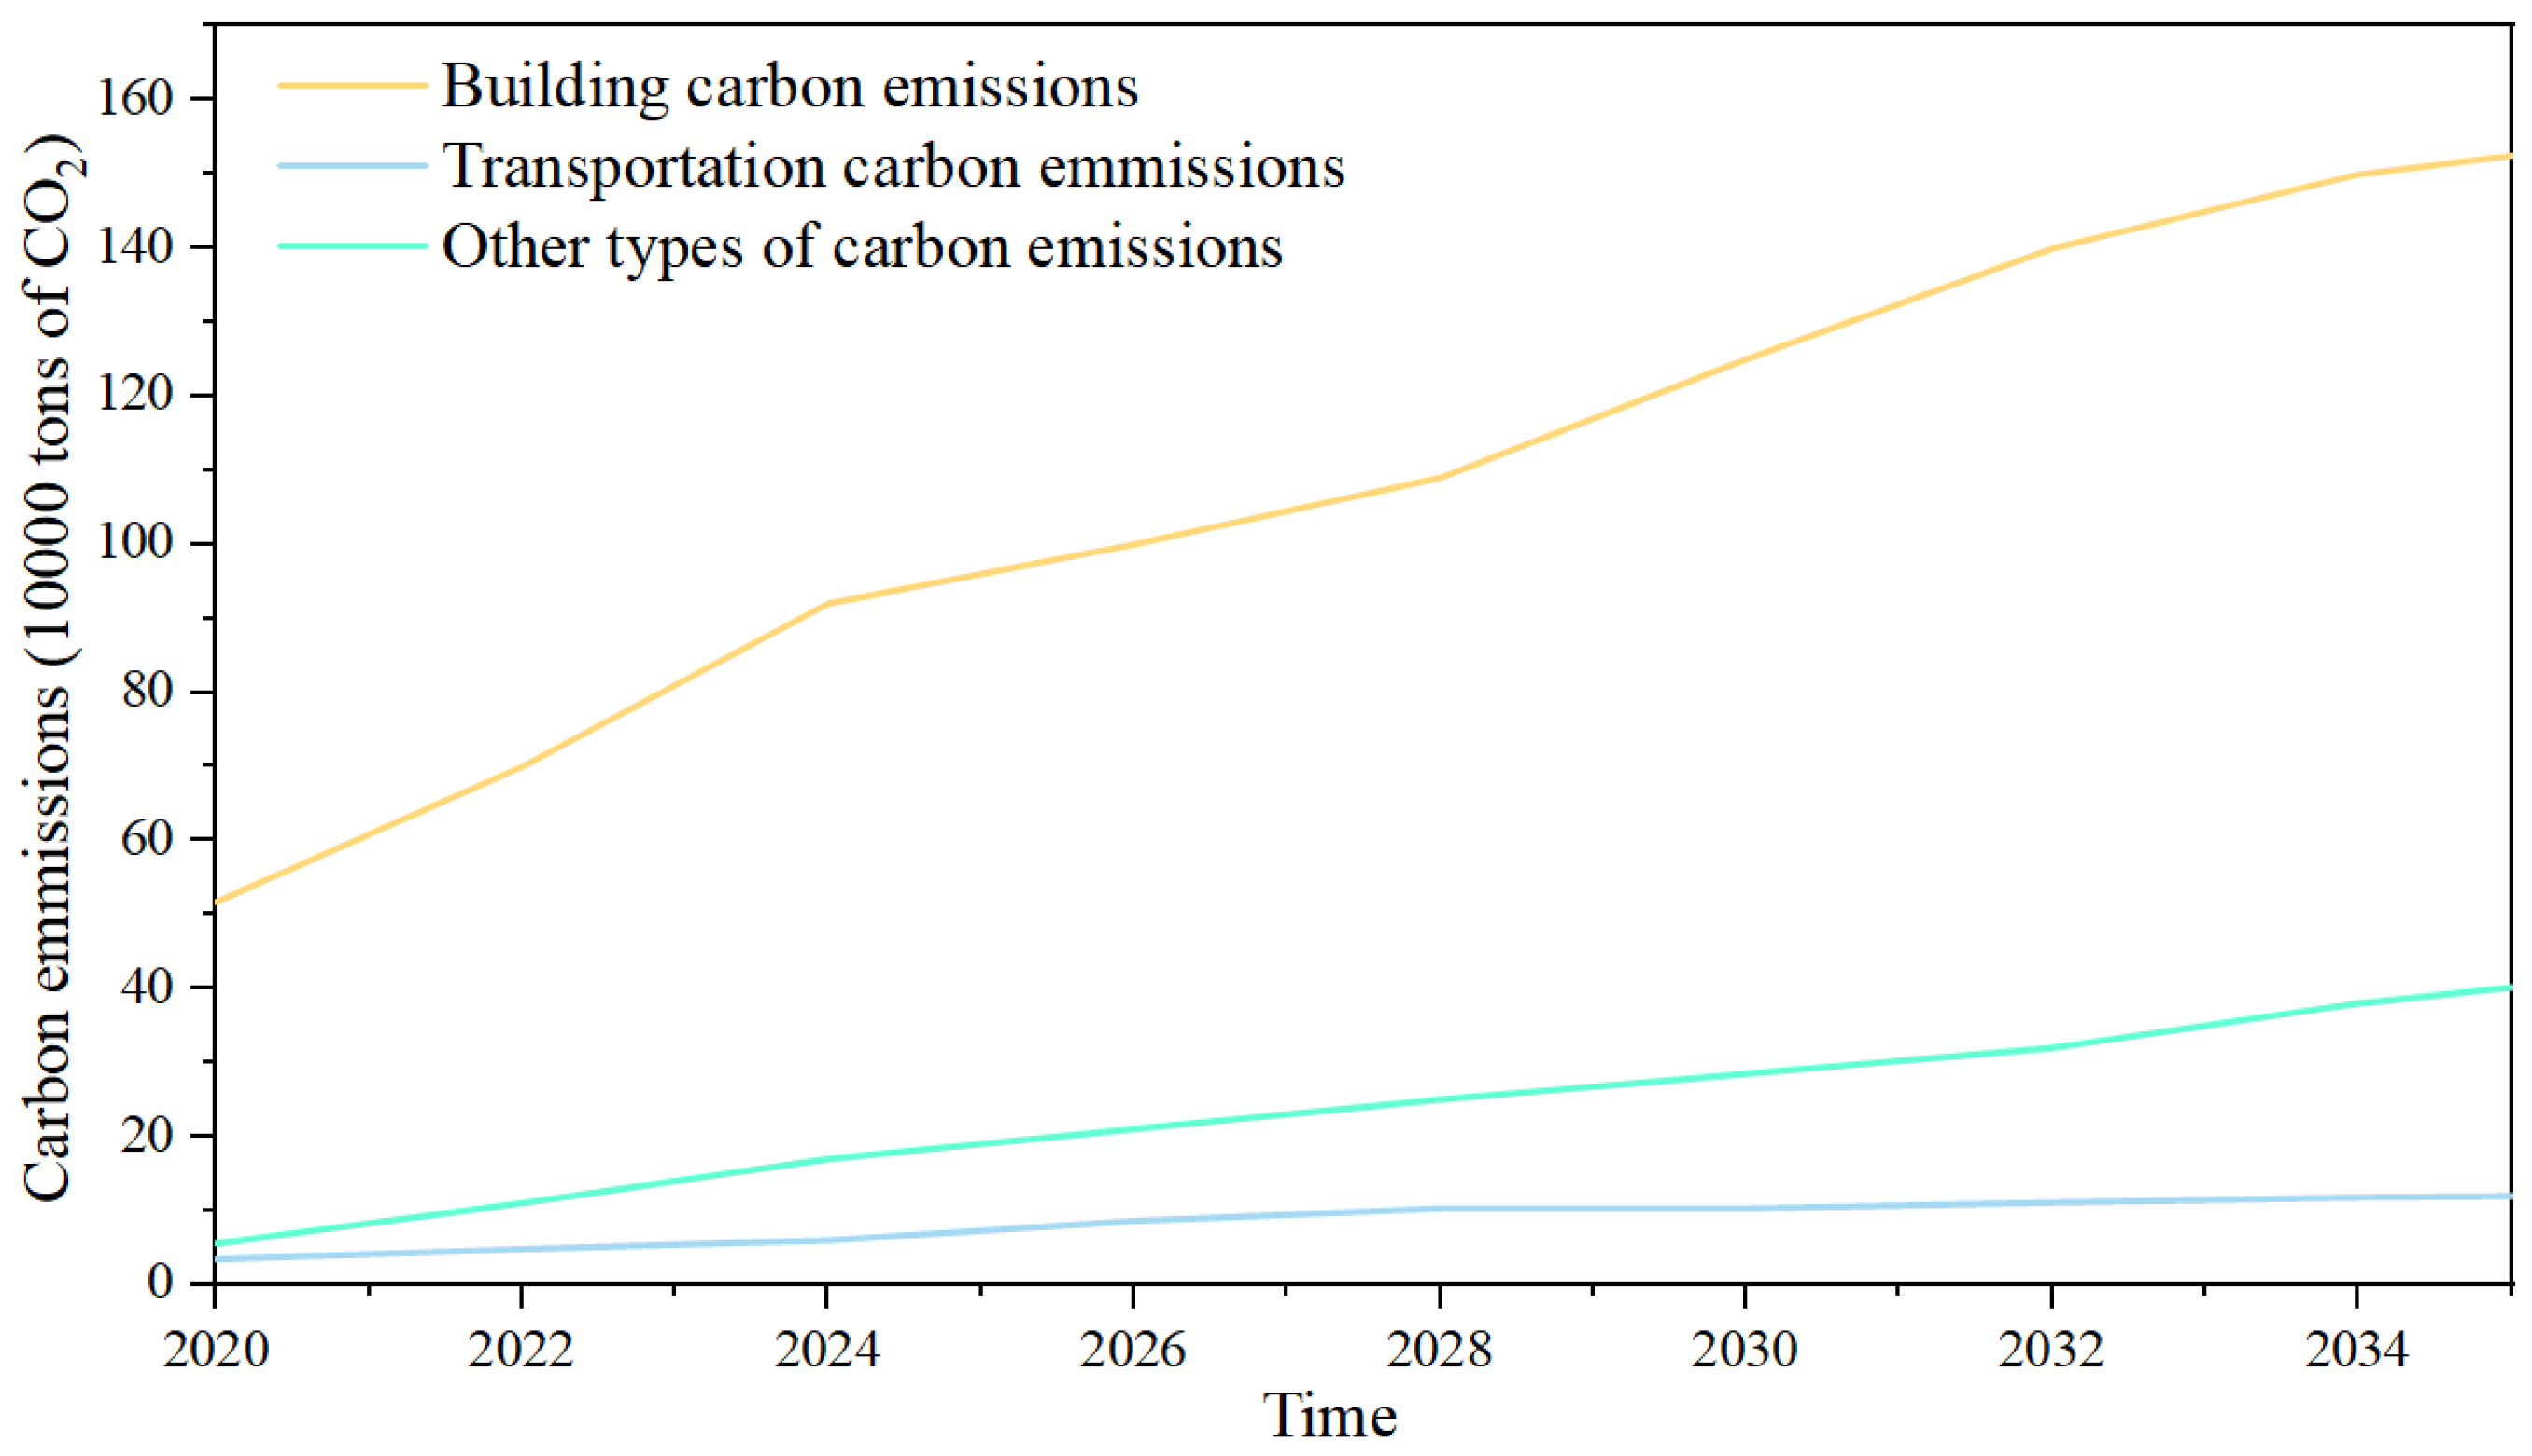
This research employed the XGBoost algorithm to analyze energy consumption and carbon emission factors, utilizing the emission factor methodology for carbon quantification. The dataset was partitioned into training and testing subsets at a ratio of 7:3, with the predictive outcomes illustrated in
Figure 4. Carbon emissions from the building sector of the eco-city are on the rise, with projections showing that emissions from the building sector will increase from 517,100 t CO
2 in 2020 to 1,554,300 t CO
2 in 2035. Carbon emissions from the transport sector of the eco-city show a slow upward trend, increasing from 34,600 t CO
2 in 2020 to 121,000 t CO
2 in 2035. Carbon emissions from other areas of the eco-city increased from 55,600 t CO
2 in 2020 to 423,000 t CO
2 in 2035.
Compared with the research of [
20,
21,
22] and others, this study conducts carbon emission prediction in fields, such as construction and transportation. It demonstrates that the XGBoost model can stably make predictions in different fields, and the prediction results are in line with the actual situation. By comparing the large fluctuations or unreasonable prediction results of the model in different fields in previous studies, it fully shows that the XGBoost model has stronger adaptability and stability in different fields, providing a more reliable basis for cities to formulate carbon-emission-management strategies under different development plans.
3.3.3. Carbon Reduction Path
In this section, multiple carbon reduction paths will be proposed. First, it is necessary to conduct feasibility and cost-benefit analyses.
In terms of feasibility, high-efficiency insulation materials and energy-saving door and window technologies can be applied in building renovations. Regarding the utilization of renewable energy, local solar and wind resources can support the construction of photovoltaic and wind power systems. In terms of the transportation structure, intelligent transportation and new energy vehicle charging technologies can be applied. Changing residents’ travel habits can be gradually achieved through publicity and policy guidance.
In terms of cost–benefit, although the cost per square meter increases in building energy-saving renovations, a large amount of energy costs can be saved in the long run. Renewable energy projects have high initial investments but low later-stage operating costs and significant environmental benefits. Although the optimization of the transportation structure has the problem of high upfront investment, it can improve transportation efficiency and air quality.
Through a comprehensive evaluation, each path has a considerable cost–benefit ratio under reasonable planning and implementation, which can provide a powerful reference for regional emission reduction decisions. The specific paths are as follows:
Building Carbon Reduction
In terms of reducing building energy consumption, if the mandatory target of 100% green buildings is achieved and the proportion of zero energy or zero carbon buildings is increased, carbon emissions will be effectively reduced. According to 2020 statistics, the China-Singapore Tianjin Eco-City has completed 10.21 million square meters of low-carbon buildings and will complete 31.11 million square meters of low-carbon buildings in 2035. The carbon emission of buildings is predicted under three scenarios. The predicted results show that by improving the energy-saving rate of buildings, the proportion of green buildings, and the development of ultra-low-energy-consumption buildings, etc., in 2035, building carbon emissions in the base scenario are 1.5620 million tons of CO2, the low carbon scenario is 1.518 million tons of CO2, and the enhanced low carbon scenario is 1.4682 million tons of CO2. Therefore, promoting the building energy conservation of the eco-city according to the enhanced low-carbon scenario can reduce carbon emissions by 93,800 tons per year.
Transportation Carbon Reduction
In terms of transportation carbon reductions, community centers need to be rationally planned and equipped with corresponding functional buildings, such as administrative management, culture and sports, medical and health care, life services, and commerce. Residents can walk to the community center and solve problems, such as schooling, shopping, and medical treatment within 500 m. Free bus routes should be implemented within the eco-city area to reduce the use of private cars. The proportion of green travel in the eco-city can reach 64.8% of the current assessment value, and the proportion of green travel will reach 90% in 2035. It can also improve the electrification of transportation, optimize clean energy public transportation lines, and accelerate the construction of rail transit. The above measures can reduce traffic congestion, and then reduce traffic carbon emissions, the calculation results show that the annual carbon reduction can reach 58,900 tons.
Carbon Reduction in the Water System
Since the utilization ratio of unconventional water in the eco-city is only 60%, it is necessary to coordinate various water resources and establish a differentiated and diversified supply guarantee system. After the sewage treatment reaches the standard, it is used for replenishing the municipal ecological landscape. At the same time, raising residents’ awareness of water conservation will achieve carbon emission reduction at the source. Assuming that the per capita water consumption of eco-city residents is 81 L/person/day and the water system structure is modified according to the above method, it is estimated that the utilization ratio of unconventional water resources will reach more than 70% in 2035, and the annual carbon reduction can be achieved to 3720 tons.
Carbon Reduction from Solid Waste
The daily per capita waste production of the eco-city is planned to be no more than 0.8 kg/person/day. We can carry out source control, reduce waste generation, and guide residents in public places, such as offices, scenic spots, shopping malls, and communities, to establish a green life, co-construction, and sharing awareness in terms of clothing, food, housing, transportation, and use, to achieve the source reduction of solid waste. The next step is to set up a smart waste sorting device, create an integral and ecological value system, and build a waste-free ecosystem, which will reduce the daily per capita waste production by 0.68 kg/person/day and reduce annual carbon emissions to 14,400 tons.
Renewable Energy Carbon Reduction
The renewable energy utilization rate of the eco-city in 2020 is about 12%. If we establish a safe and efficient comprehensive renewable energy utilization system based on renewable energy, such as solar energy, geothermal energy, and wind energy, and make full use of the photovoltaic, solar thermal, and wind power generation and heating facilities that can be used in the space of the eco-city, the proportion of renewable energy utilization will be increased by 2035, so that it will reach more than 30%. According to the predicted results, if the utilization rate of renewable energy is increased from 12% to more than 30%, carbon emissions will be reduced by 288,200 tons.
Carbon Sink and Carbon Reduction
The overall planning area of the eco-city is 1.5 million square kilometers, of which the water area is 49.29 square kilometers and the land area is 100.71 square kilometers. According to statistics, in 2020, the green area of the eco-city will be 11.41 square kilometers, the green land rate will be 11.3%, and the green space carbon sink will be 113,000 tons/year. If the green area is increased to 25.07 square kilometers, it can achieve 248,000 tons of carbon sequestration per year in 2035 and then achieve 135,000 tons of carbon reduction per year.
3.4. Results and Discussion
This study is highly correlated with the current green procurement policies. From the perspective of urban areas, it can offer references for the implementation and optimization of these policies. For example, China’s green procurement policies encourage the construction industry to use energy-saving materials. This study discovers that energy-saving renovations of buildings can effectively reduce carbon emissions, which contributes to further improving the green procurement standards in the construction field. The EU’s GPP framework focuses on green procurement in the transportation sector. The transportation optimization proposed in this study can promote carbon reduction in urban areas and provide reasonable references for relevant departments in policy-making.
To better demonstrate the universality of the research results, a comparative analysis has been carried out with other low-carbon urban practice studies. This analysis provides an effective approach to low-carbon development, offers a replicable method for other regions, and plays a significant guiding role. However, this study still needs further refinement. In terms of carbon emissions, compared with other cases, the area selected in this study has imperfections in low-carbon technologies, policy measures, and in technology, policies, and systems. It is necessary to subsequently adjust the energy structure, improve application technologies and policies, and perfect the evaluation mechanism [
20,
21,
26].


