
Multi-Hazard Vibration Control of Transmission Infrastructure: A Pounding Tuned Mass Damper Approach with Lifelong Reliability Analysis


Abstract
:1. Introduction
- Wind-induced hazards: Wind loads represent one of the most prevalent types of disaster leading to the collapse of power transmission towers [3,4]. When exposed to extreme wind loads, such as those from hurricanes, typhoons [5], galloping [6,7] or downbursts, the primary structural members of the transmission tower experience a substantial surge in stress levels, which may result in yielding, buckling, and ultimately, complete structural collapse. Furthermore, wind-driven particles, such as wind-blown raindrops [8] or sand [9], can exacerbate the dynamic responses of power transmission towers, and prolonged exposure to wind-induced excitations can induce fatigue damage in operational transmission towers, progressively diminishing the structural capacity of their components. In severe cases, this cumulative damage can escalate to collapse and result in catastrophic failure;
- Earthquake activity: As potent natural disasters, earthquakes generate intense ground motions that can cause immediate physical damage, such as the collapse of transmission towers and the fracture of conductors [10,11]. Additionally, these seismic events have the potential to trigger secondary geological hazards, such as landslides or structural failures, which can further compound the damage to transmission lines. Moreover, the electrical equipment situated along these lines can be adversely affected by earthquakes, thereby jeopardizing the stability of the entire power system. The ensuing disruptions not only lead to widespread power outages that inflict substantial economic losses on society but also have the potential to initiate a chain of consequences that disrupts the normal functioning of other vital infrastructure.
2. Numerical Model of Power Transmission Tower
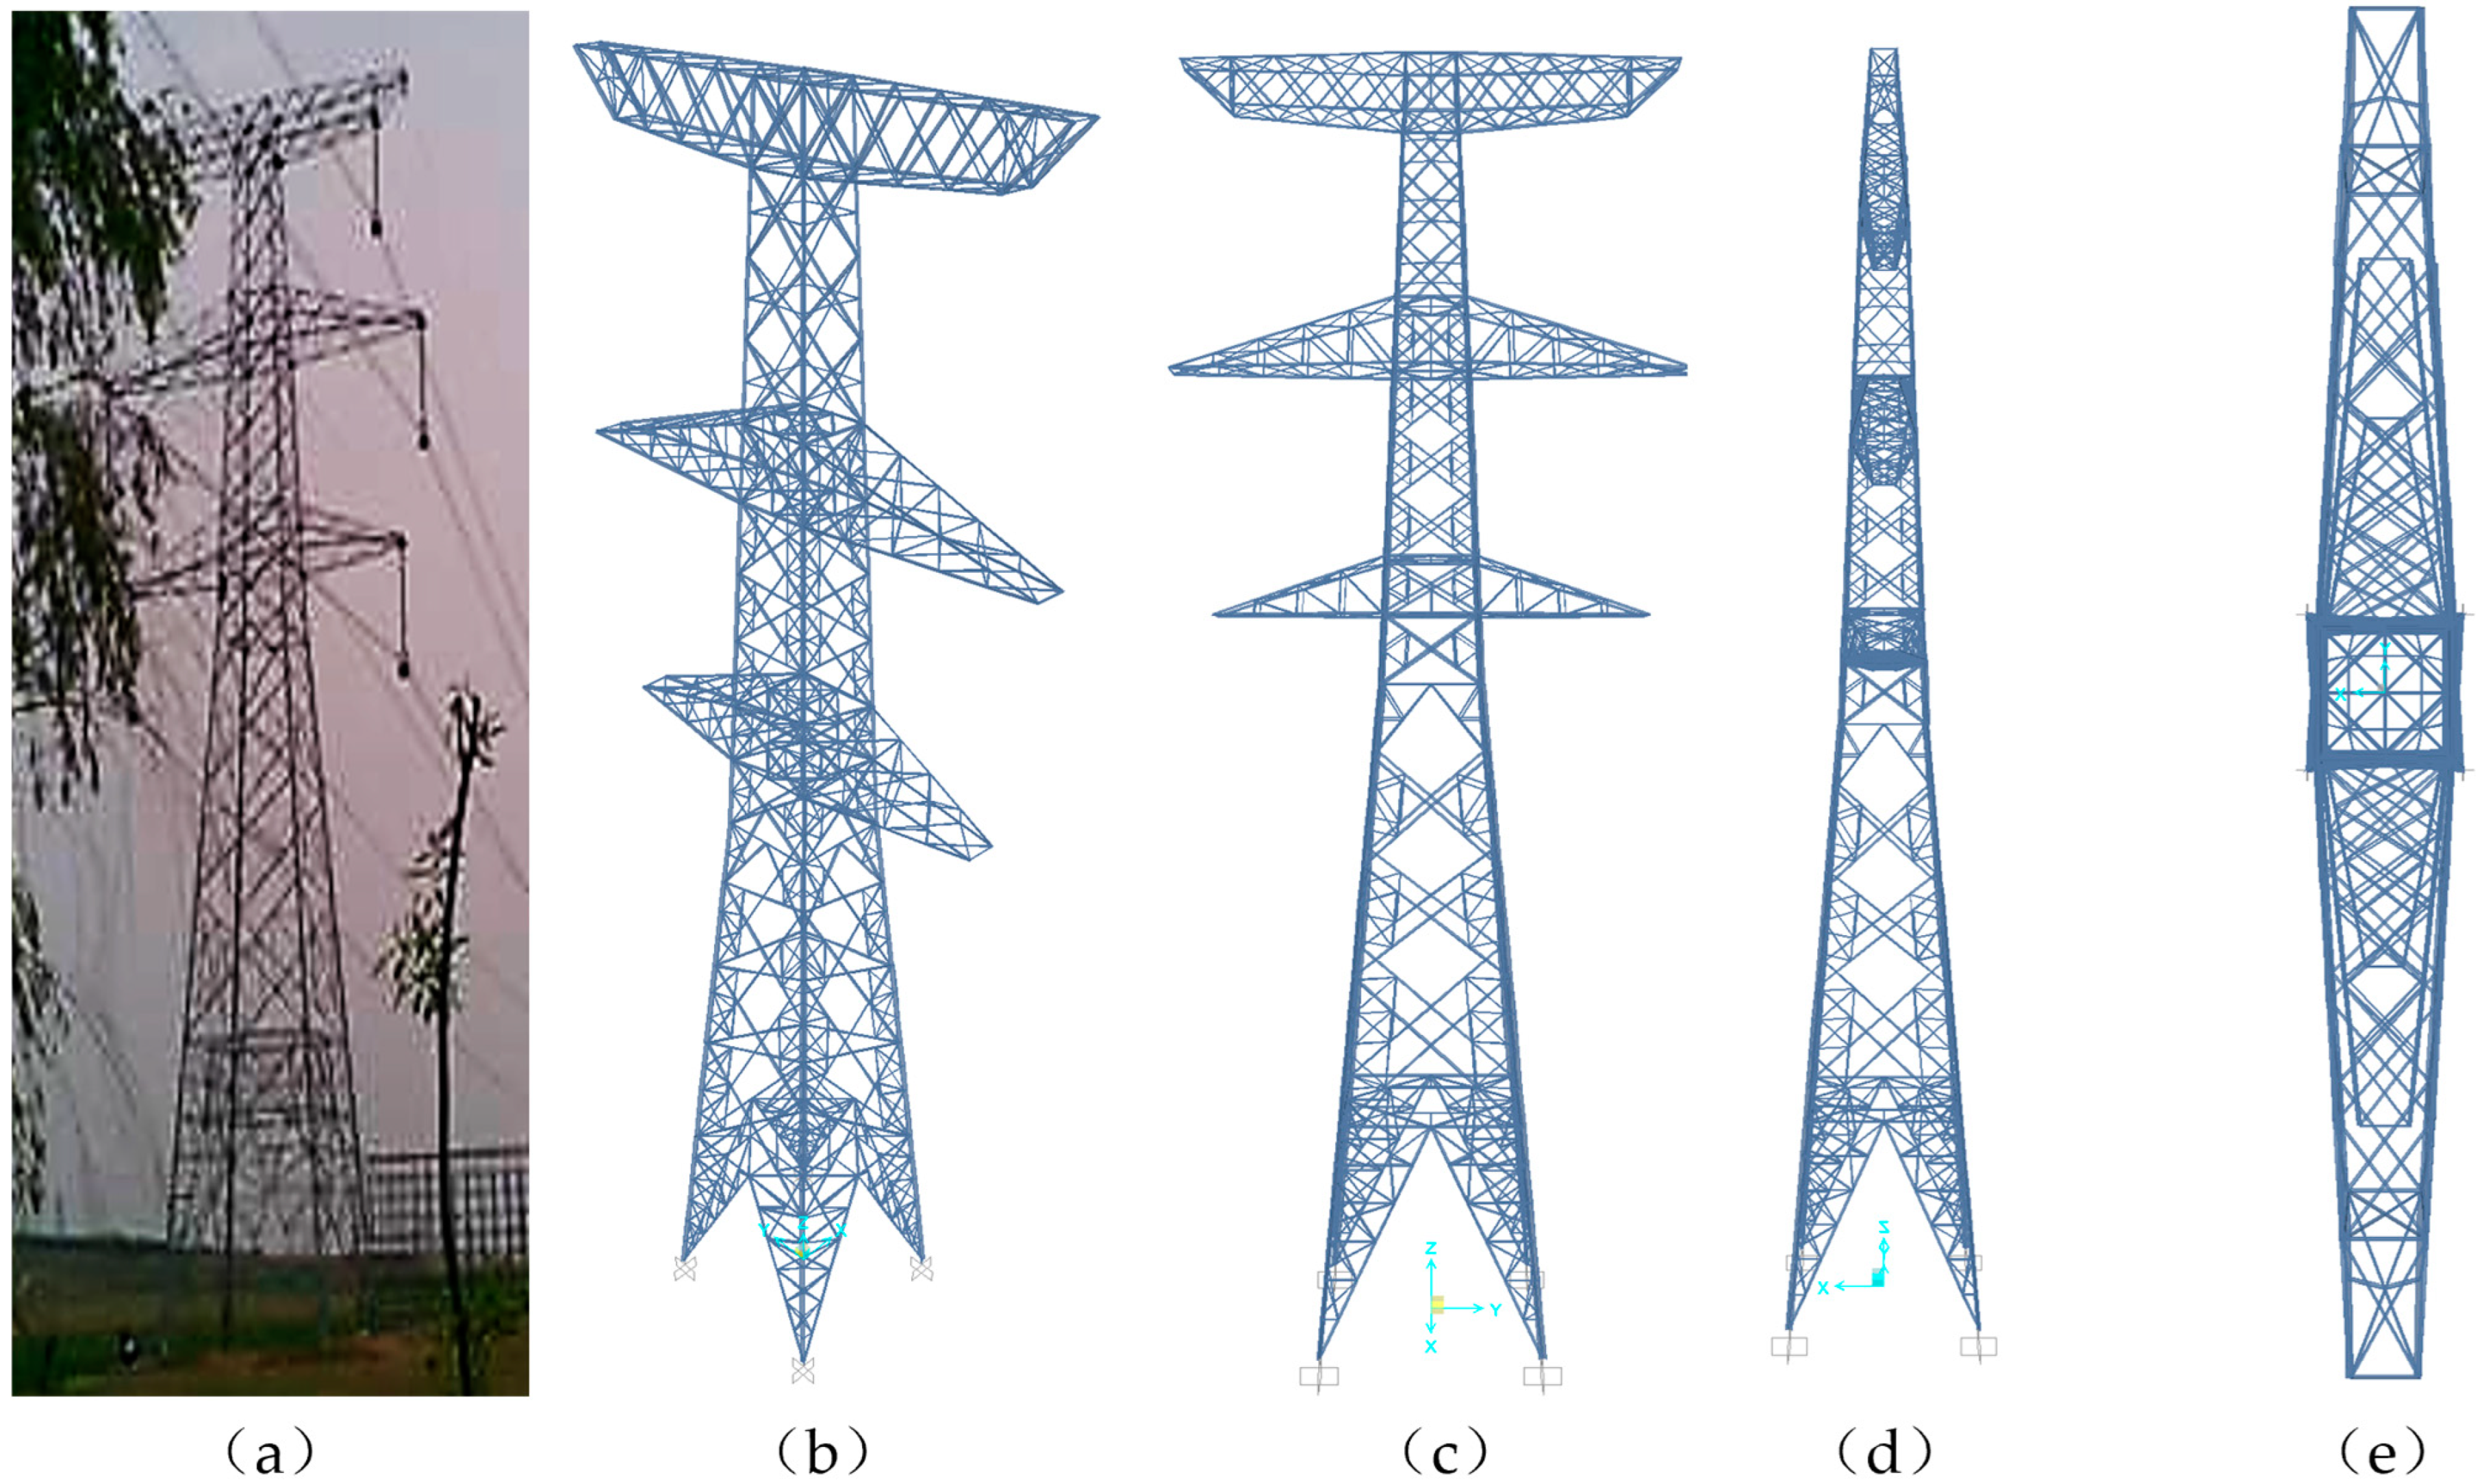
2.1. FE Model
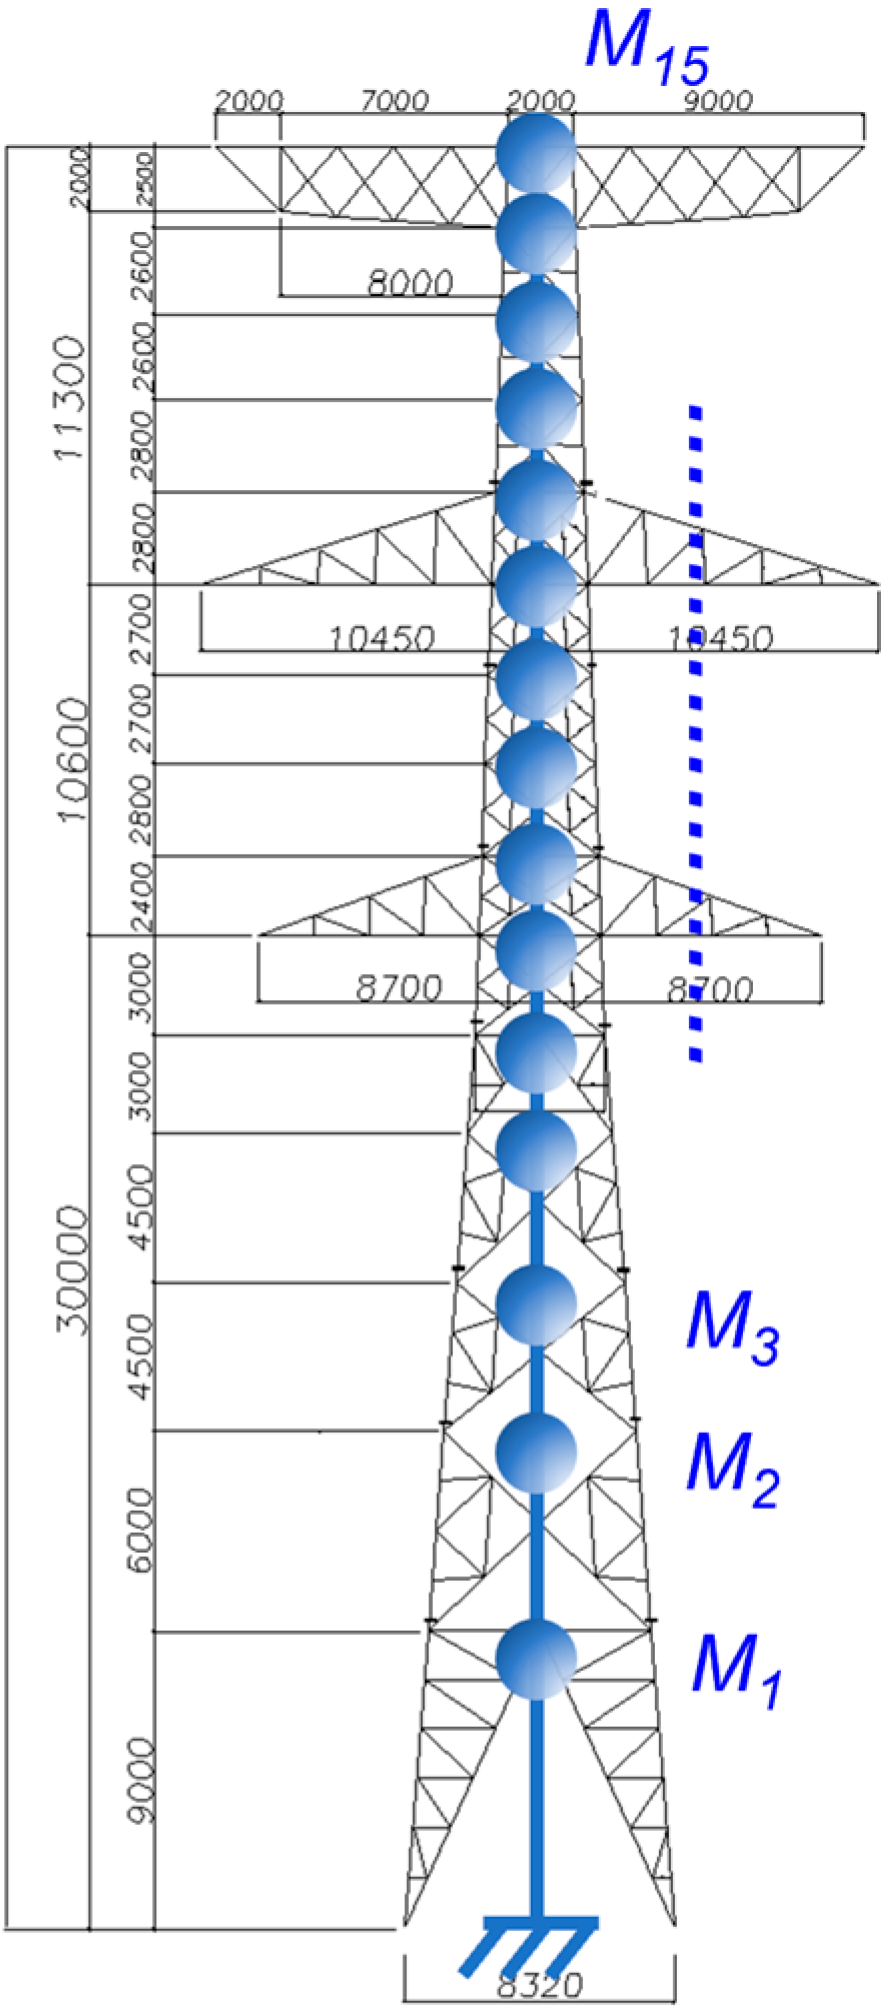
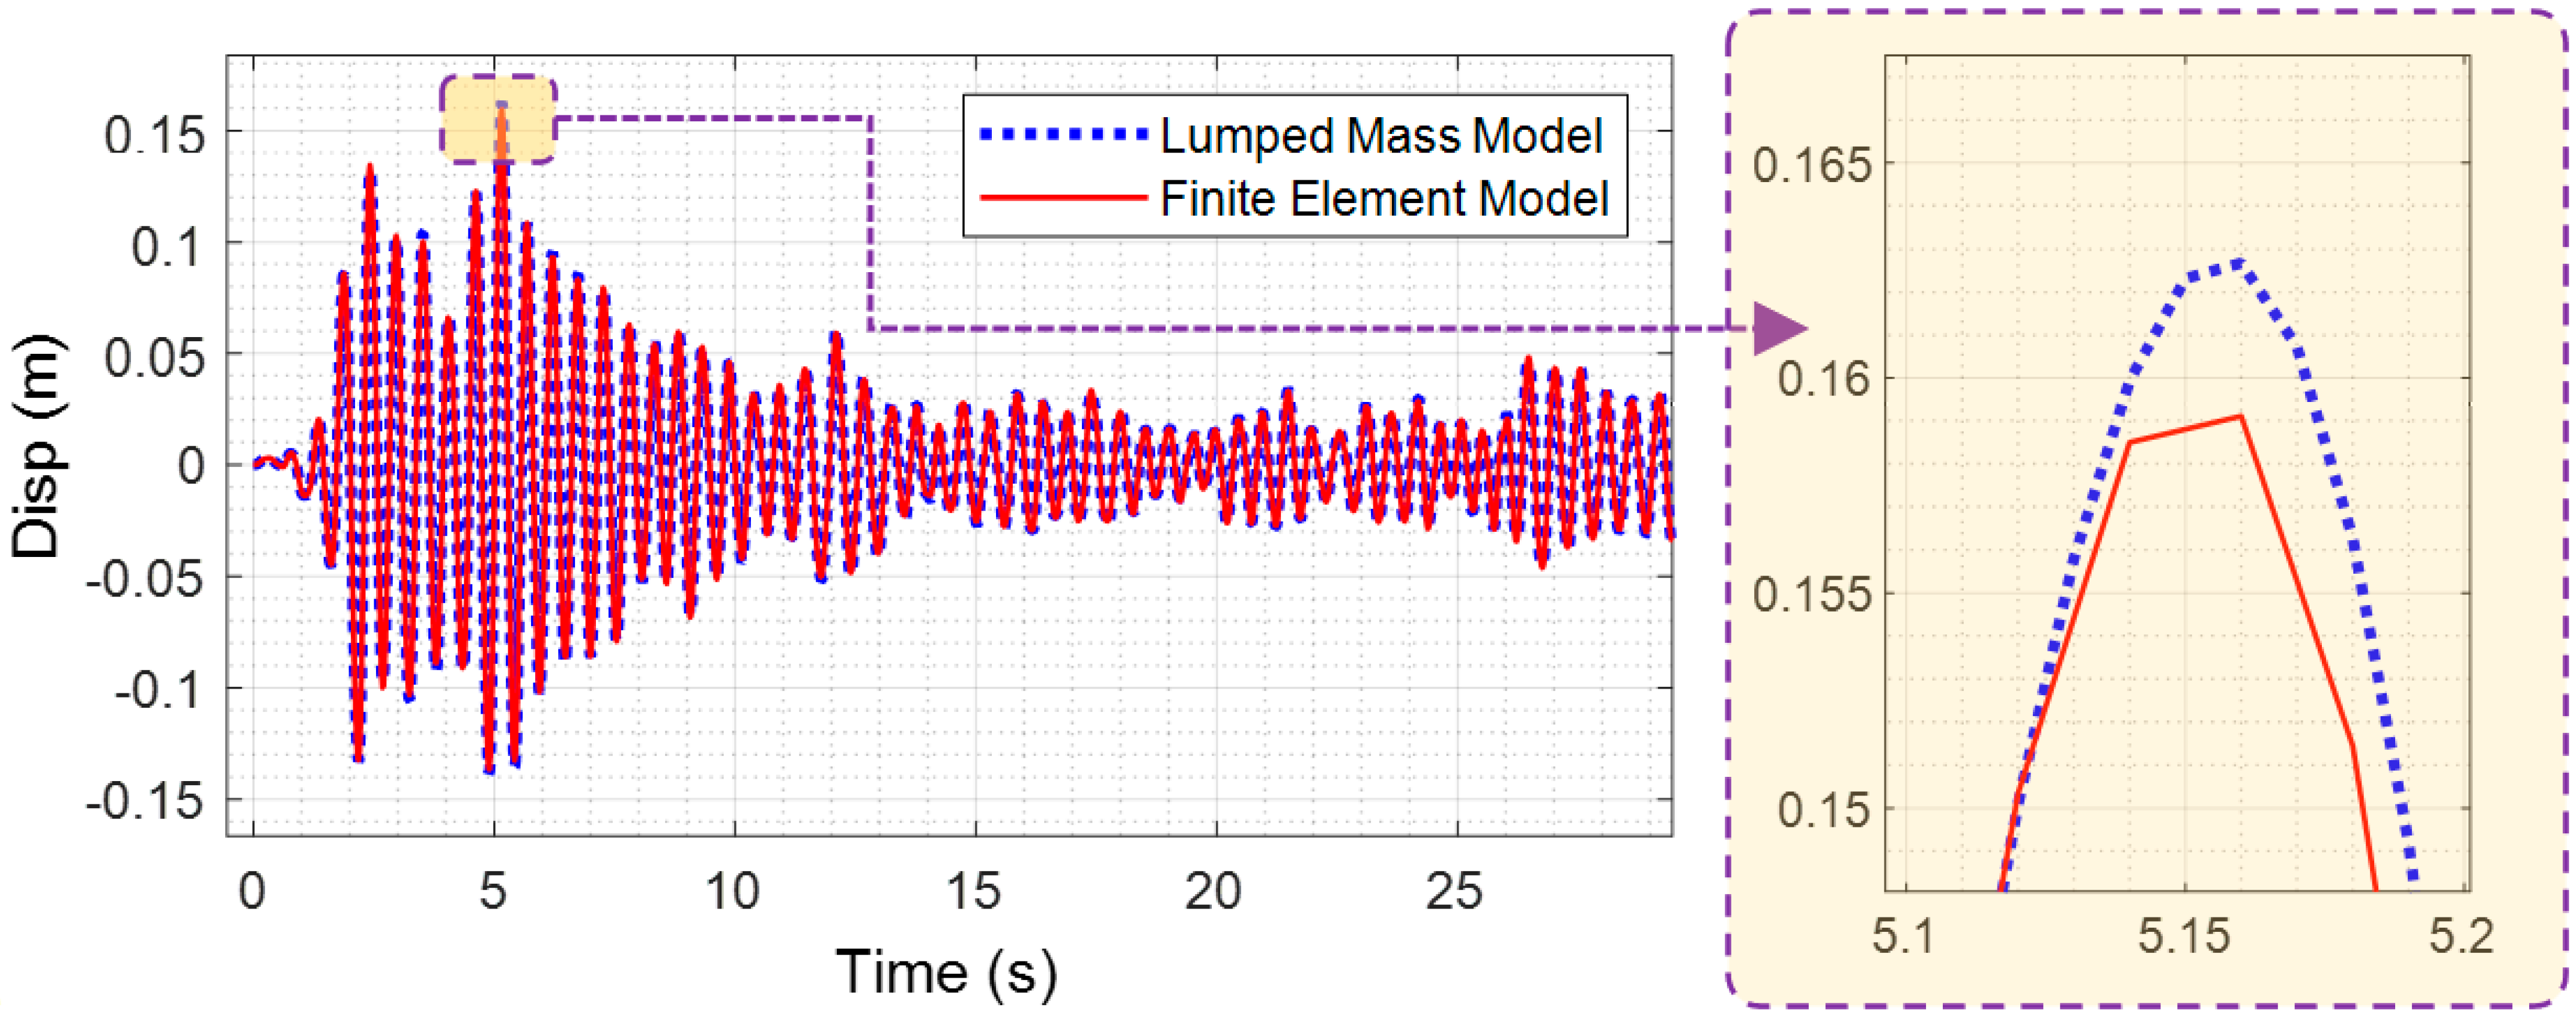
2.2. Lumped Mass Model
- Step 1
- The power transmission tower was divided into nodes based on its structural characteristics. The positions of the crossarms and crossbraces were considered as a single node layer. In Figure 3, the power transmission tower considered in this study is represented by a lumped mass model of 15 mass components.
- Step 2
- The mass of the steel members between two adjacent nodes and was calculated. Here, represents the ith node, and represents the i + 1th node. Then, half of the calculated mass was assigned to node and the other half to node . Thus, the mass matrix was obtained.
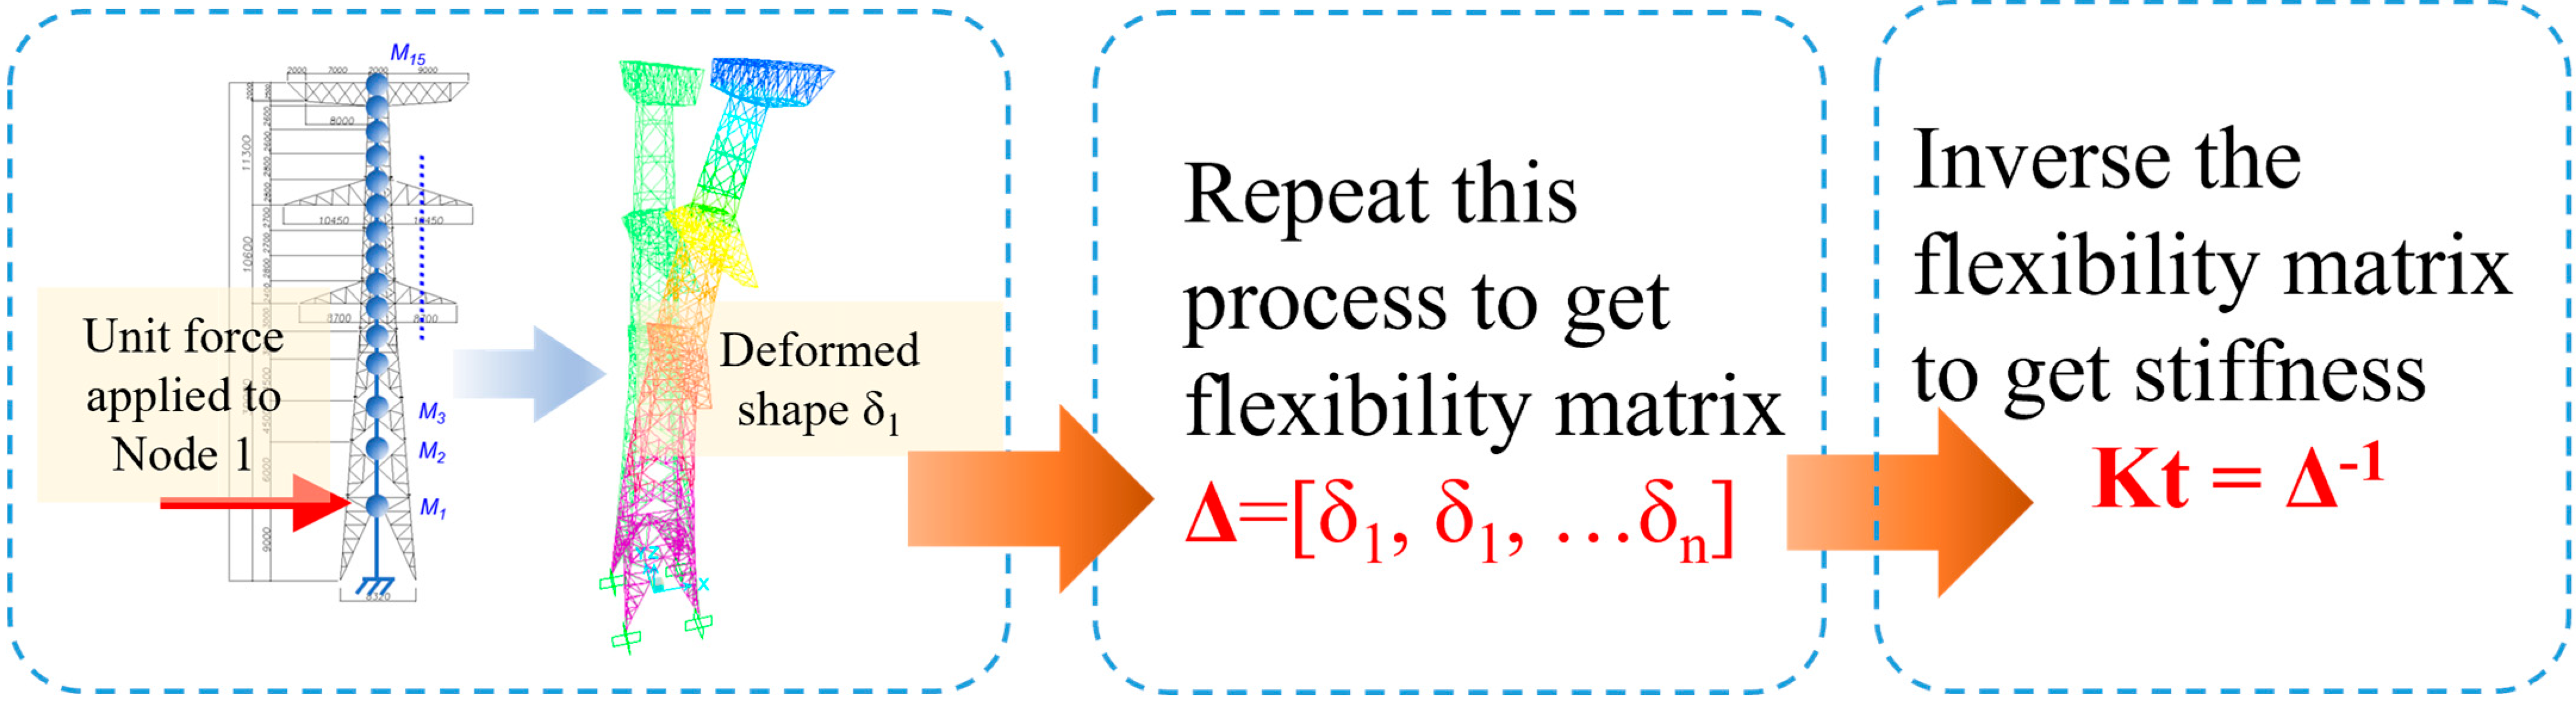
- Step 3
- A unit force was aaplied at the jth node. The deformed shape under this load case was considered the jth flexibility vector, . The total flexibility matrix was then obtained as followed:
- Step 4
- Assuming Rayleigh damping, the damping matrix was then calculated as a superposition of the mass matrix and stiffness matrix, as follows:
2.3. Lumped Mass Model Considering Tower-Line Coupling Effect
3. Power Transmission Tower Controlled with Pounding Tuned Mass Damper
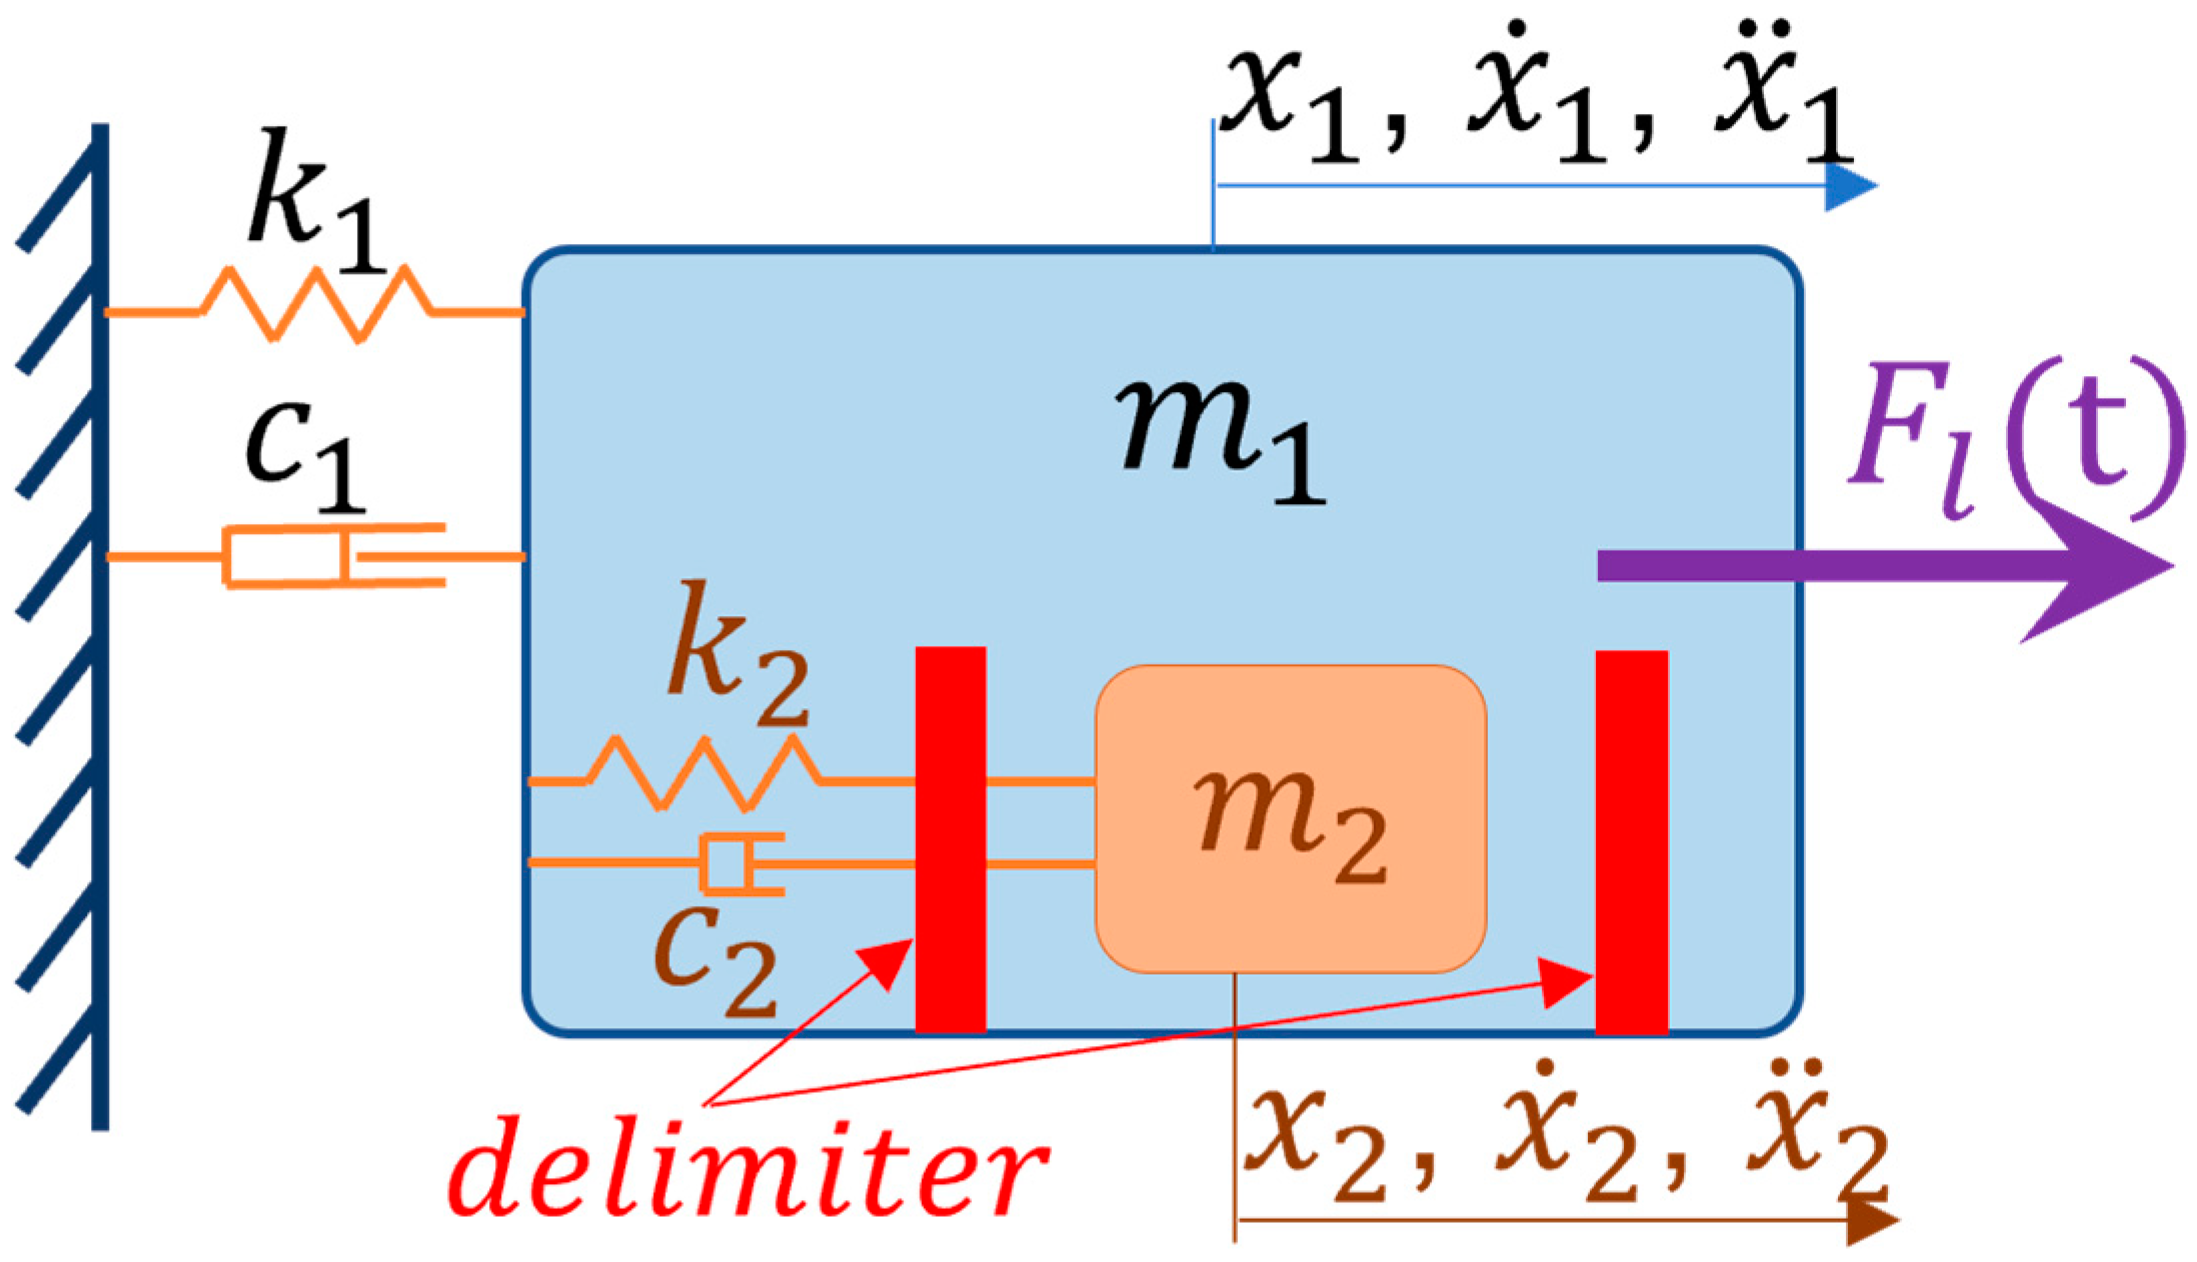
3.1. Dampin Mechanism of Pounding Tuned Mass Damper
3.2. Motion Equation of Structure–PTMD System
4. Consideration of Uncertainties
5. Simulation of Dynamic Hazards
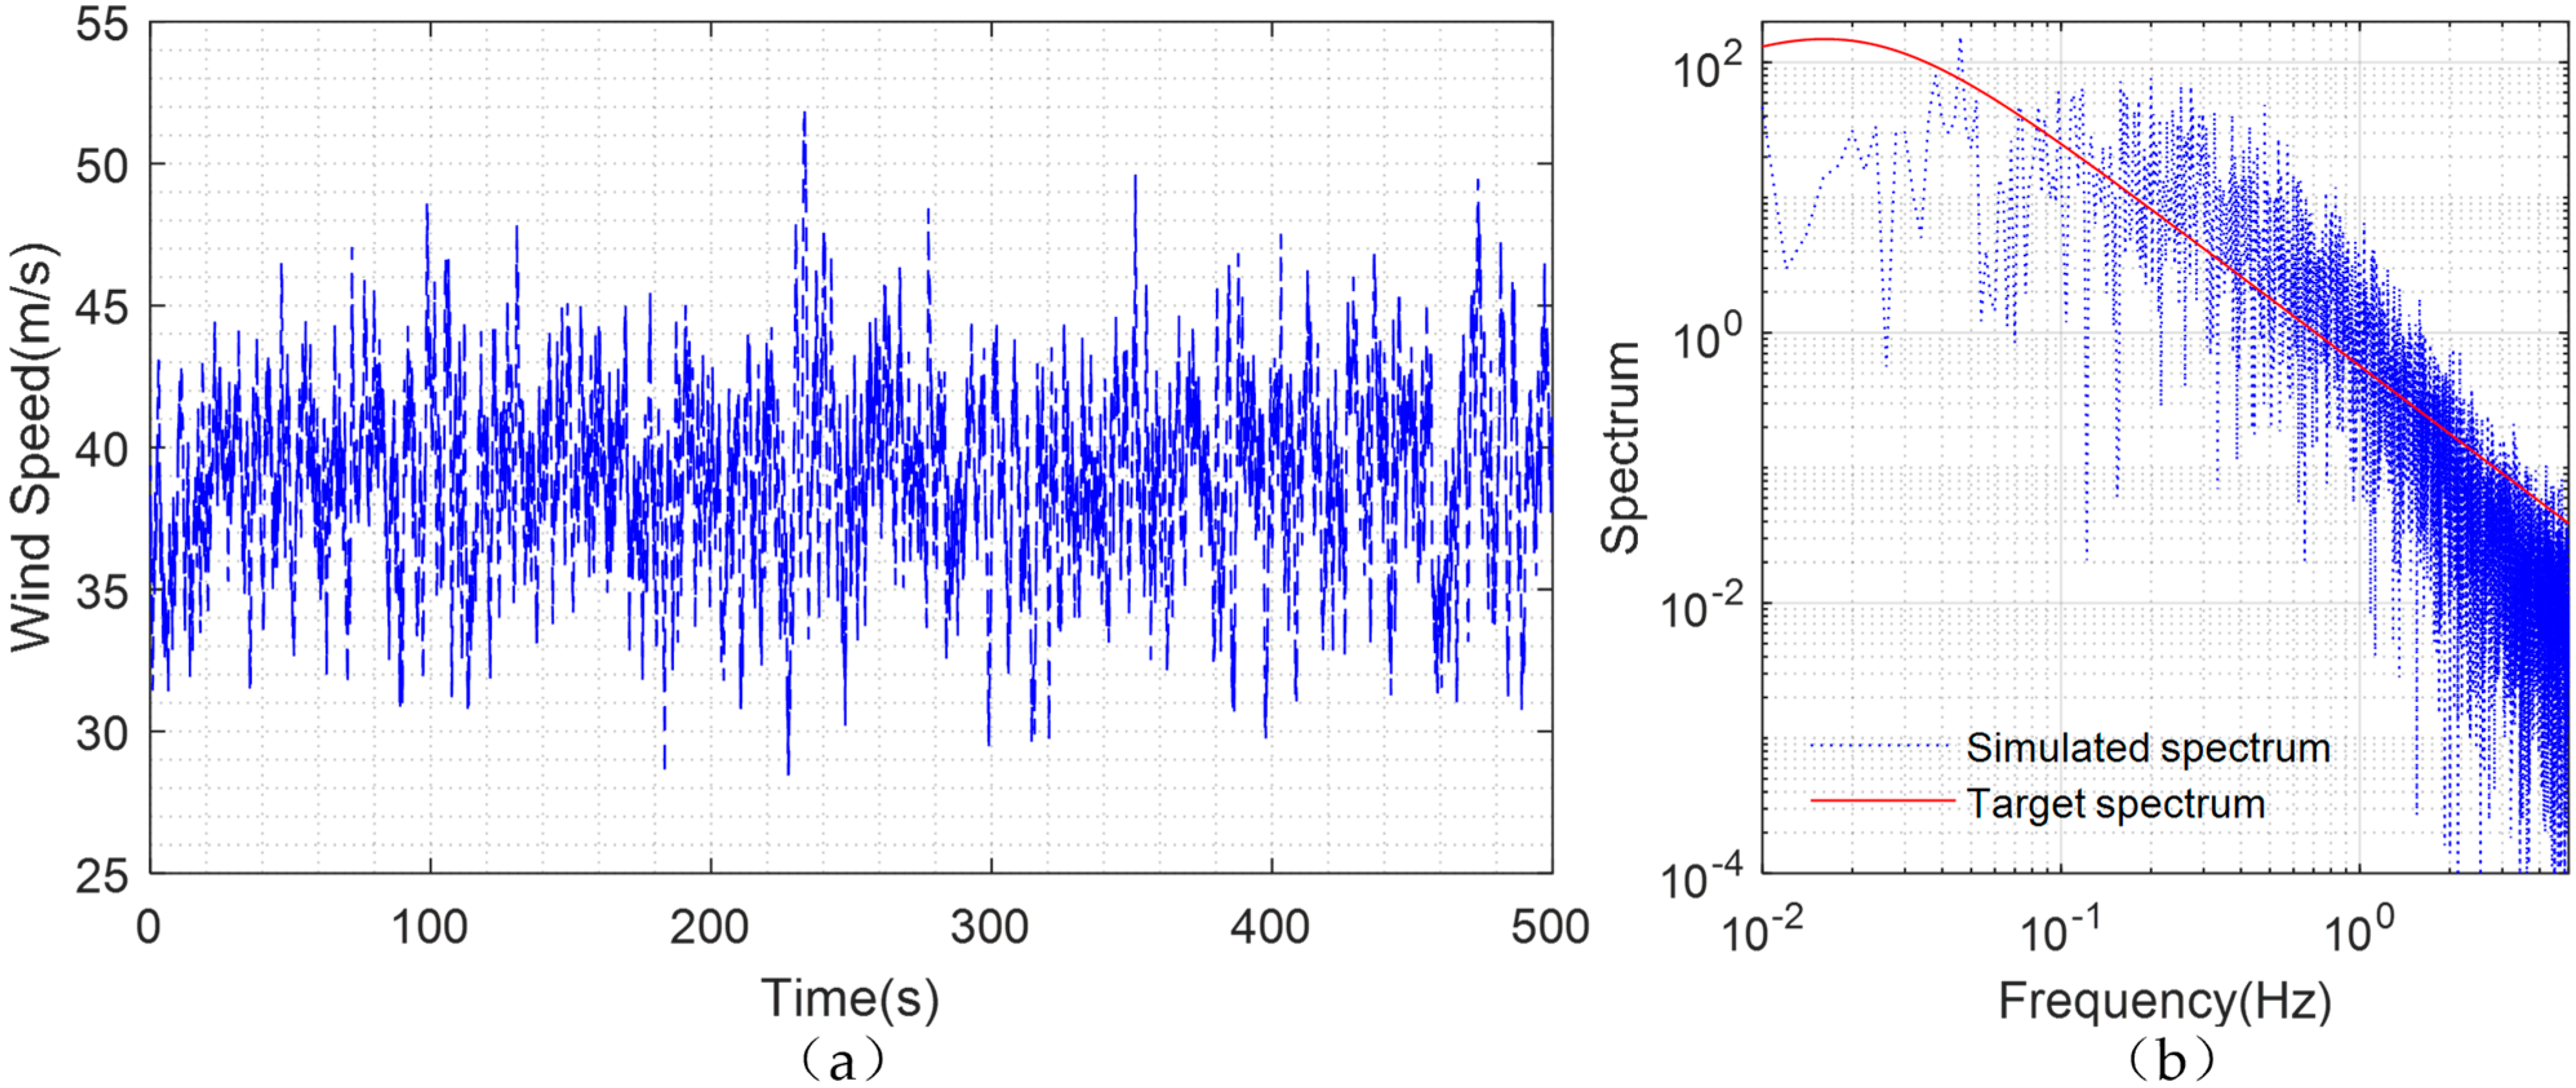
5.1. Simulation of Wind Loads
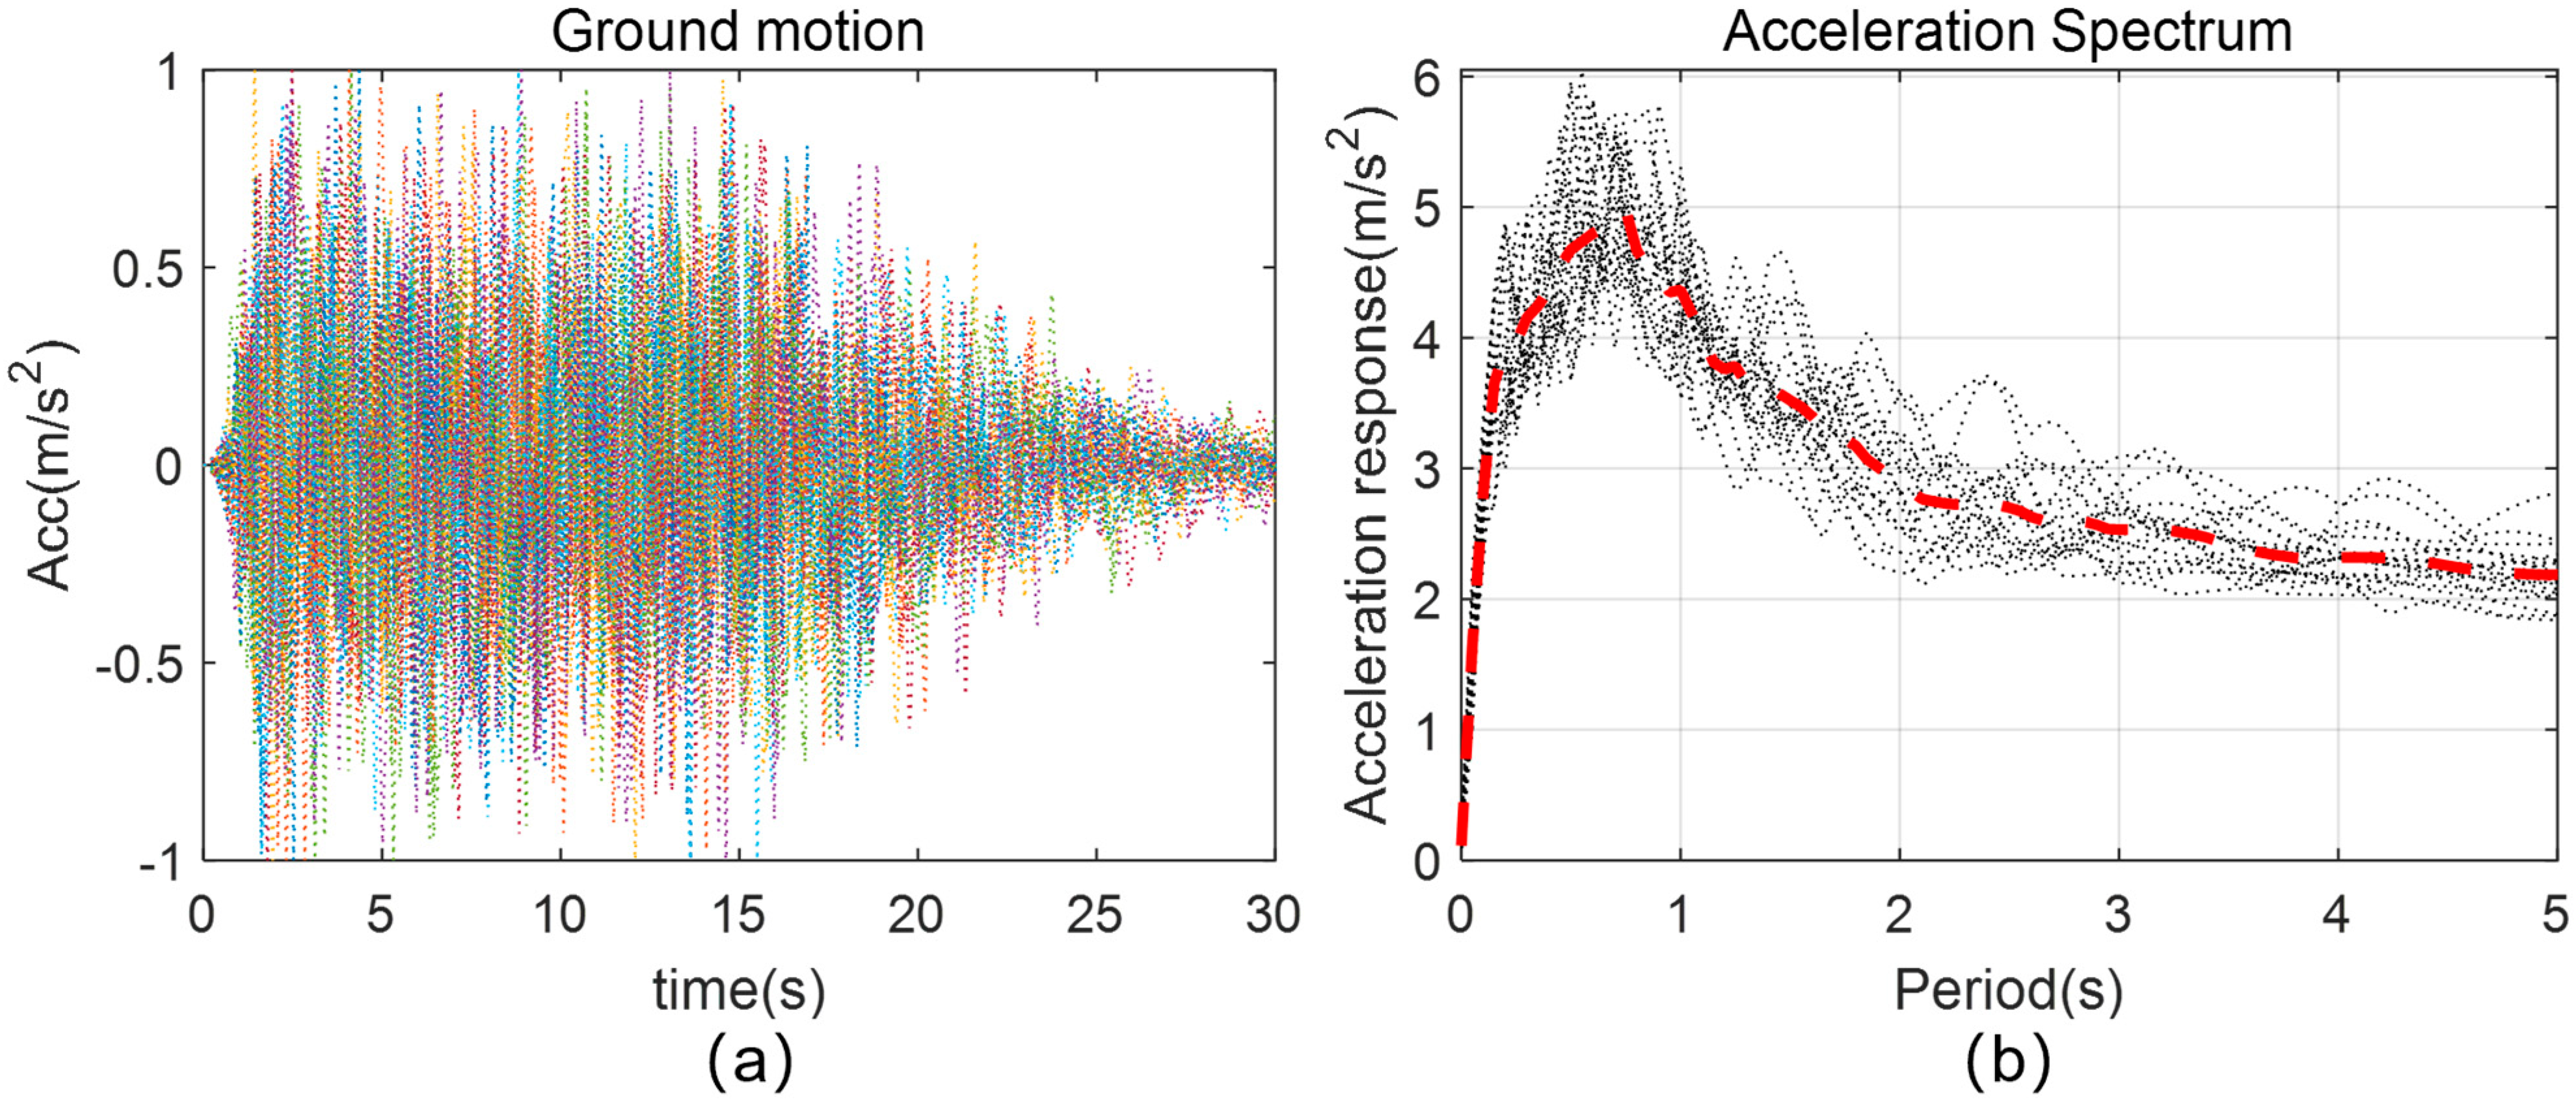
5.2. Simulation of Earthquake Actions
6. Reliability Analysis
6.1. Fragility Analysis
6.2. Consideration of Hazards
6.3. Reliability Analysis Based on Fragility and Harzard Analysis
7. Results and Discussion
7.1. Performace Evaluation Based on Time-Domain Response
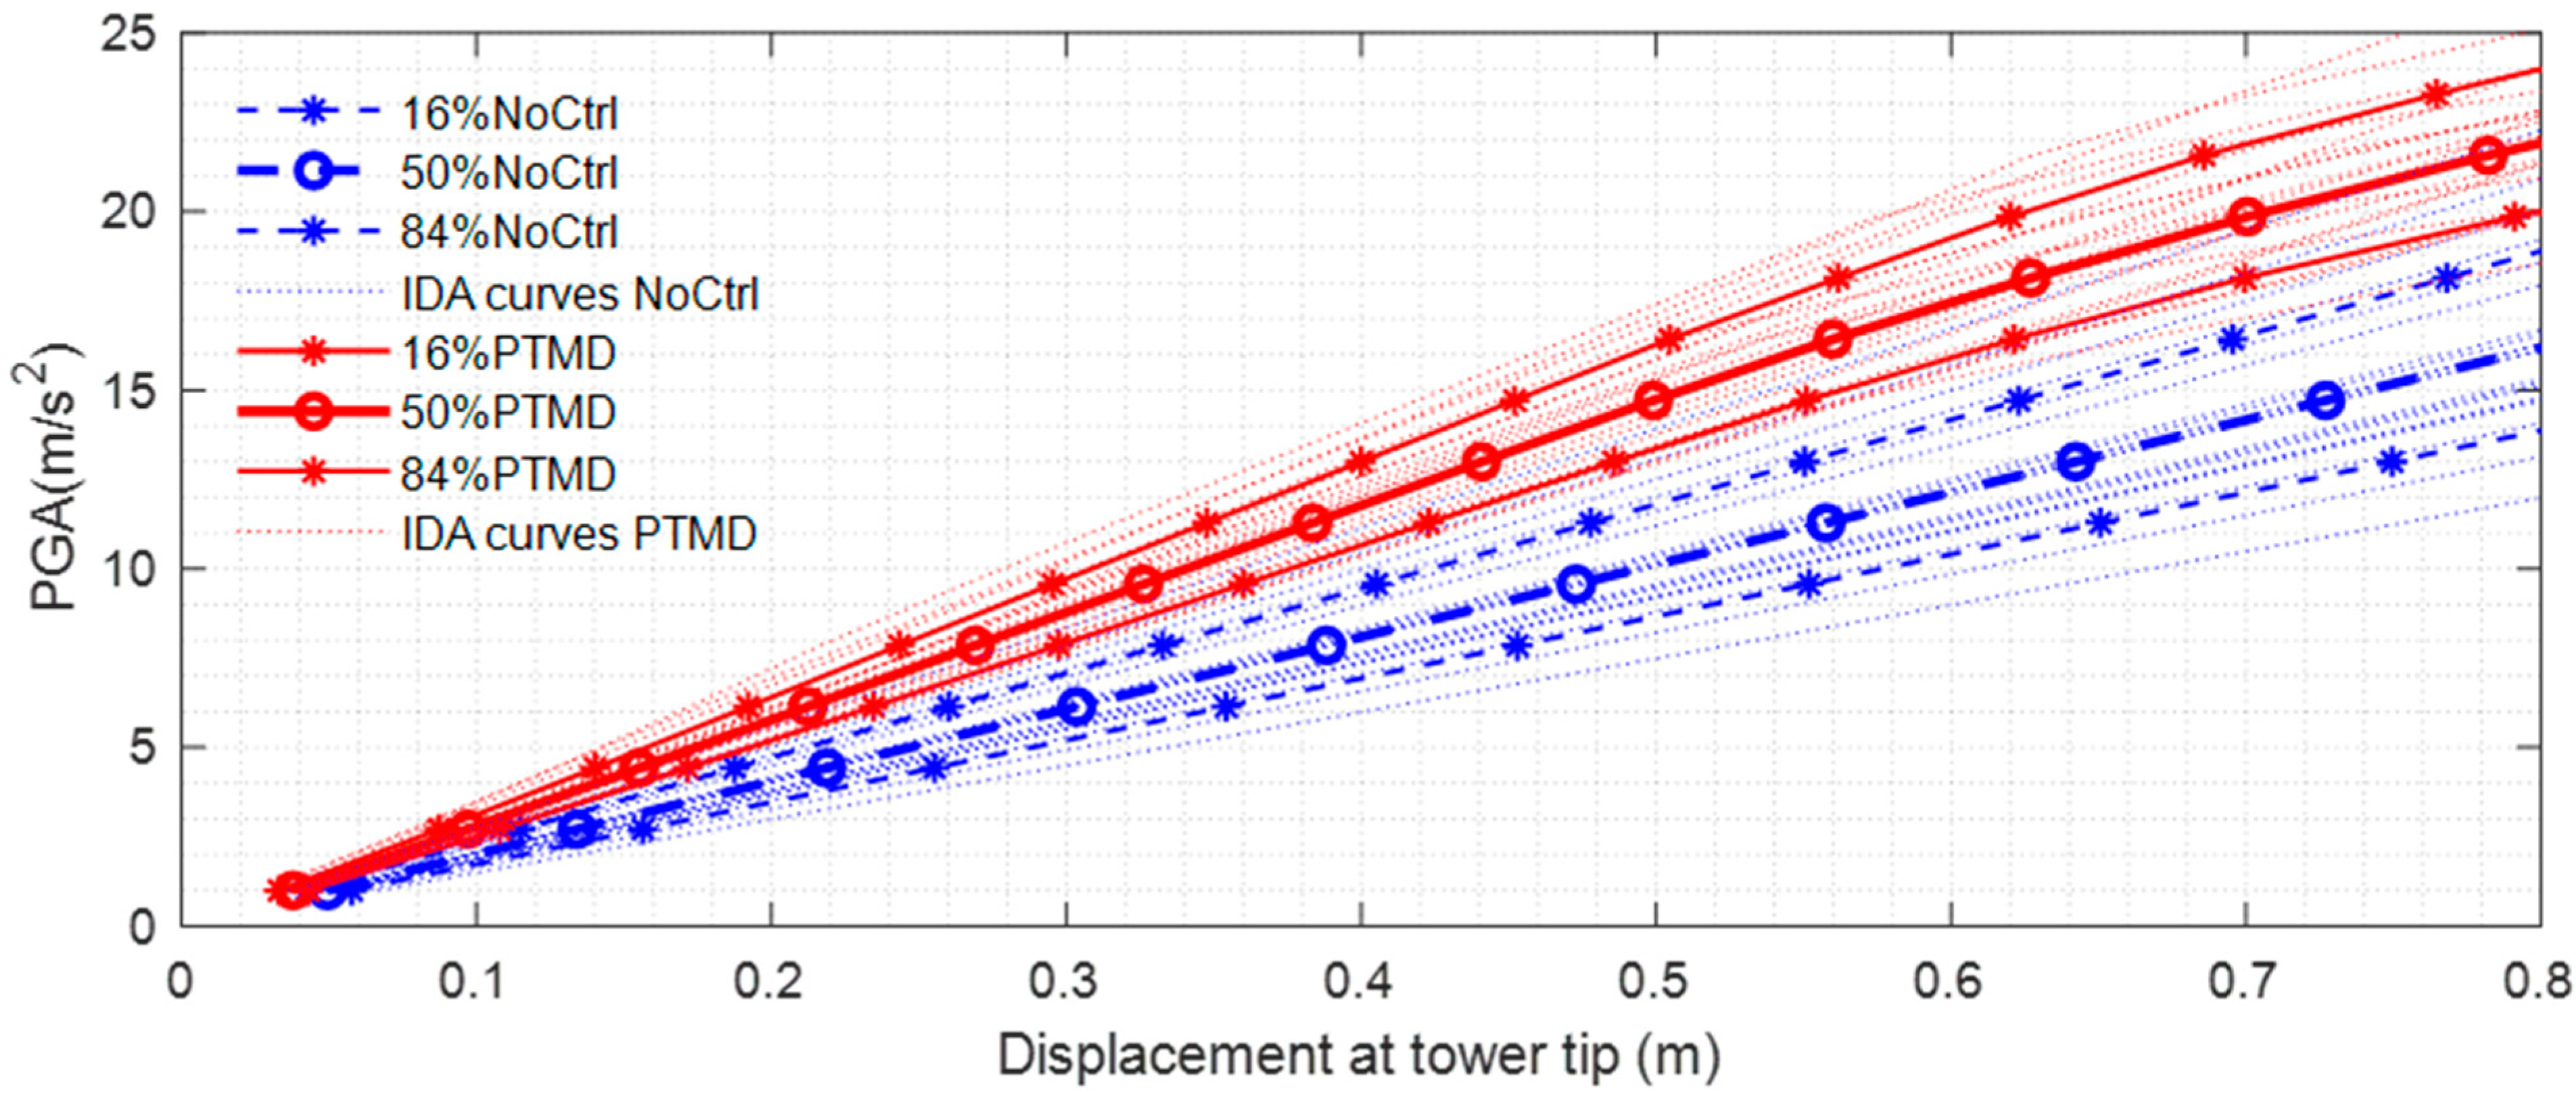
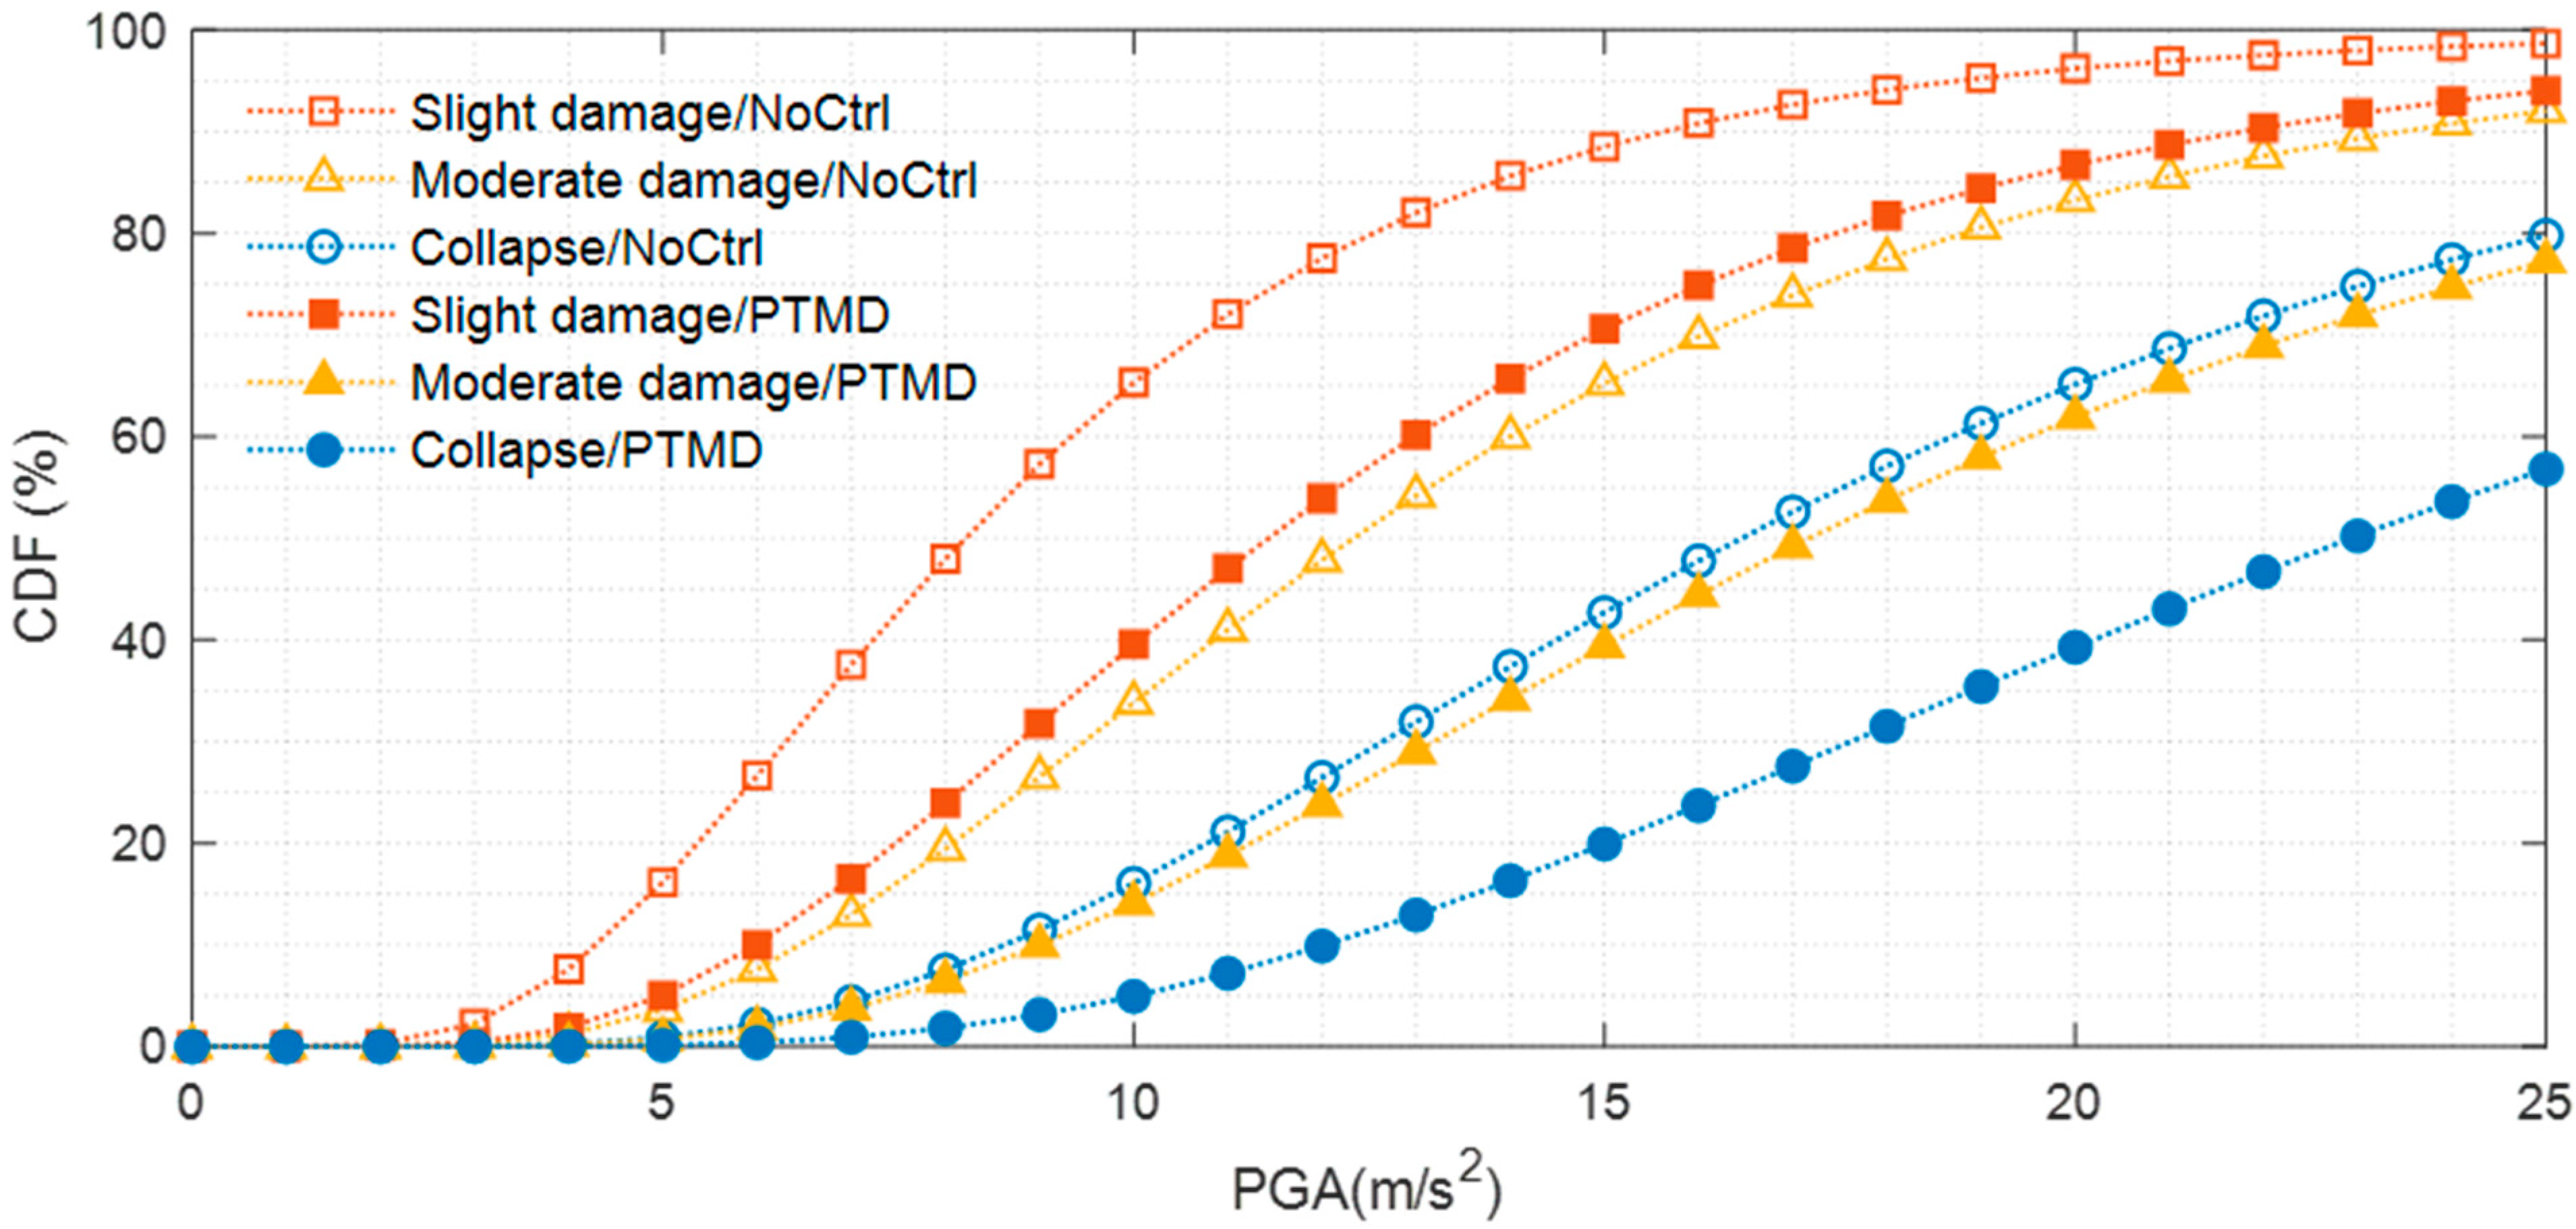
7.2. Fragility Curves with and Without Control
7.3. Structural Reliability with and Without Control
- As the service life extends from 30 to 100 years, a decrease in reliability is observed. Specifically, in the absence of control measures, is 3.4399 for a 1-year service life. However, when the tower is expected to operate for 100 years, drops significantly to 1.9005;
- Comparing wind load to earthquakes, wind load emerged as the dominant factor. For instance, with a 50-year service life, the reliability is 2.1851 when only wind load is considered. Conversely, the tower’s reliability under earthquake conditions reaches 4.3830, indicating that the tower is more susceptible to damage from wind load than from earthquakes. Considering both wind and earthquake load, the reliability factor is slightly lower at 2.1849 compared with the wind-only case (= 2.1851);
- In all scenarios, the PTMD exhibited a satisfactory damping effect. For example, it enhanced the reliability from 2.1849 to 2.4295 under combined wind and earthquake load, demonstrating its effectiveness in providing dual control against vibrations and seismic activity.
8. Conclusions
- (1)
- While deterministic structural analysis demonstrated the damping ability of the PTMD using the vibration reduction ratio, this study further verified the effectiveness of the PTMD when considering structural uncertainties and excitation uncertainties;
- (2)
- This paper proposes utilizing reliability as a metric to assess the effectiveness of dampers in enhancing structural safety. With the implementation of the PTMD, the lifelong reliability of the power transmission tower increased from 2.1849 to 2.4295;
- (3)
- The proposed method takes into account the influence of multiple dynamic disasters. The results indicate that the PTMD is effective for dual control of seismic and wind-induced vibrations;
- (4)
- The PTMD utilized in this study was not optimized. However, reliability can serve as a valuable target for optimizing PTMDs and other damping devices, with the potential to further improve performance in dual seismic and vibration control.
Author Contributions
Funding
Data Availability Statement
Conflicts of Interest
References
- He, X.; Ma, H.; Zhang, S.; Wang, W.; Zhang, L. Study on the Multi-Hazard Responses of Transmission Tower-Line Systems Under Fire and Wind Loads Using ABAQUS. Appl. Sci. 2025, 15, 255. [Google Scholar] [CrossRef]
- Wang, W.; Wang, G.; Sheng, H.; Gao, Y.; Lv, X. Research on multi-hazard response of transmission tower-line systems under rare earthquake-wind combined actions. World Earthq. Eng. 2023, 39, 165–173. [Google Scholar]
- Azzi, Z.; Elawady, A.; Irwin, P.; Chowdhury, A.G.; Abi Shdid, C. Aeroelastic modeling to study the wind-induced response of a self-supported lattice tower. Eng. Struct. 2022, 245, 112885. [Google Scholar]
- Vu, Q.-V.; Lee, H.-J.; Kim, J.-M. Nonlinear Pushover Analysis of Retrofitted Transmission Towers Under Static Wind Loads. Buildings 2025, 15, 654. [Google Scholar] [CrossRef]
- Zhou, X.; Li, J. Risk Assessment of High-Voltage Power Grid Under Typhoon Disaster Based on Model-Driven and Data-Driven Methods. Energies 2025, 18, 809. [Google Scholar] [CrossRef]
- Zhao, M.; Li, M.; Li, S.; Wan, Y.; Hai, Y.; Li, C. Galloping Performance of Transmission Line System Aeroelastic Model with Rime Through Wind-Tunnel Tests. Energies 2025, 18, 1203. [Google Scholar] [CrossRef]
- Wu, Y.; Chen, X. Prediction and characterization of three-dimensional multi-mode coupled galloping of multi-span ice-accreted transmission conductors. J. Wind Eng. Ind. Aerodyn. 2023, 241, 105516. [Google Scholar]
- Soares Fernandes, Y.M.; Rodrigues Machado, M.; Dutkiewicz, M. The Spectral Approach of Love and Mindlin-Herrmann Theory in the Dynamical Simulations of the Tower-Cable Interactions under the Wind and Rain Loads. Energies 2022, 15, 7725. [Google Scholar] [CrossRef]
- Ma, X.; Lu, J.; Li, B.; Tian, W.; Zhang, Y.; Zhang, P. Fragility Analysis of Power Transmission Tower Subjected to Wind–Sand Loads. Energies 2024, 17, 6339. [Google Scholar] [CrossRef]
- Chang, M.; Chen, B.; Xiao, X.; Chen, Y. Nonstationary Stochastic Responses of Transmission Tower-Line System with Viscoelastic Material Dampers Under Seismic Excitations. Materials 2025, 18, 1138. [Google Scholar] [CrossRef]
- Nie, P.; Liu, H.; Wang, Y.; Han, S. Seismic Response and Collapse Analysis of a Transmission Tower Structure: Assessing the Impact of the Damage Accumulation Effect. Buildings 2024, 14, 2243. [Google Scholar] [CrossRef]
- Roy, S.; Kundu, C.K. State of the art review of wind induced vibration and its control on transmission towers. Structures 2021, 29, 254–264. [Google Scholar] [CrossRef]
- Li, Z.; Hu, Y.; Tu, X. Wind-Induced Response and Its Controlling of Long-Span Cross-Rope Suspension Transmission Line. Appl. Sci. 2022, 12, 1488. [Google Scholar] [CrossRef]
- Bian, Y.; Liu, X.; Sun, Y.; Zhong, Y. Optimized Design of a Tuned Mass Damper Inerter (TMDI) Applied to Circular Section Members of Transmission Towers. Buildings 2022, 12, 1154. [Google Scholar] [CrossRef]
- Zhou, M.; Meng, X.; Tian, L.; Jin, Q.; Liu, J. Shape Memory Alloy-Spring Pendulum for Vibration Suppression of Wind-Induced Transmission Tower-Line Systems. Int. J. Struct. Stab. Dyn. 2023, 23, 2350168. [Google Scholar] [CrossRef]
- Song, X.; Chen, Y.; Bo, C.; Wu, J. Response control of a transmission tower-line system under wind excitations by electromagnetic inertial mass dampers. Adv. Struct. Eng. 2022, 25, 3334–3348. [Google Scholar] [CrossRef]
- Lei, X.; Shen, L.; Niu, H.; Chen, J.; Xie, W.; Zhang, X. Development and Application of Eddy Current Damping-Based Tuned Mass Damper for Wind-Induced Vibration Control of Transmission Tower. Int. J. Struct. Stab. Dyn. 2024, 24, 2450053. [Google Scholar] [CrossRef]
- Lou, W.; Wen, Z.; Chen, Y.; Huang, M. Wind Tunnel Study on Bidirectional Vibration Control of Lattice Towers with Omnidirectional Cantilever-Type Eddy Current TMD. Appl. Sci. 2019, 9, 2978. [Google Scholar] [CrossRef]
- Grotto, L.G.; Miguel, L.F.F.; Kaminski Junior, J. Optimization of stiffness and damping coefficients of connection dampers to reduce the dynamic response of transmission line steel towers subjected to wind action. Adv. Steel Constr. Int. J. Hong Kong 2023, 19, 254–261. [Google Scholar]
- Wu, J.; Chen, B.; Zhi, L.; Song, X. Seismic Response Mitigation of a Television Transmission Tower by Shape Memory Alloy Dampers. Materials 2021, 14, 6987. [Google Scholar] [CrossRef]
- Zhang, P.; Song, G.; Li, H.; Lin, Y. Seismic control of power transmission tower using pounding TMD. J. Eng. Mech. 2013, 139, 1395–1406. [Google Scholar] [CrossRef]
- Tian, L.; Rong, K.; Bi, K.; Zhang, P. A Bidirectional Pounding Tuned Mass Damper and Its Application to Transmission Tower-Line Systems under Seismic Excitations. Int. J. Struct. Stab. Dyn. 2019, 19, 1950056. [Google Scholar] [CrossRef]
- Lin, Y.; Liu, T. Seismic Vibration Control and Multi-Objective Optimization of Transmission Tower with Tuned Mass Damper Under Near-Fault Pulse-like Ground Motions. Buildings 2024, 14, 3572. [Google Scholar] [CrossRef]
- Miguel, L.F.F.; Miguel, L.F.F.; Lopez, R.H. Simultaneous optimization of force and placement of friction dampers under seismic loading. Eng. Optim. 2016, 48, 582–602. [Google Scholar] [CrossRef]
- Li, H.; Xu, J. Simplified aseismic calculation model for transmission tower-line system considering pile-soil dynamic interaction. Chin. J. Geotech. Eng. 2009, 31, 1763–1767. [Google Scholar]
- Shinozuka, M.; Deodatis, G. Simulation of Stochastic Processes by Spectral Representation. Appl. Mech. Rev. 1991, 44, 191. [Google Scholar]
- Eisenhut, C.; Krug, F.; Schram, C.; Klockl, B. Wind-Turbine Model for System Simulations Near Cut-In Wind Speed. IEEE Trans. Energy Convers. 2007, 22, 414–420. [Google Scholar] [CrossRef]
- Li, J.-X.; Zhang, C.; Cheng, J.-P. Seismic Fragility Analysis of the Transmission Tower-Line System Considering Bolt Slippage. Appl. Sci. 2024, 14, 10909. [Google Scholar] [CrossRef]
- Cornell, C.A.; Jalayer, F.; Hamburger, R.O.; Foutch, D.A. Probabilistic Basis for 2000 SAC Federal Emergency Management Agency Steel Moment Frame Guidelines. J. Struct. Eng. 2002, 128, 526–533. [Google Scholar] [CrossRef]


| Node No. | Height (m) | Mass (kg) |
|---|---|---|
| 1 | 9.00 | 3163.85 |
| 2 | 15.0 | 1033.85 |
| 3 | 19.5 | 1708.71 |
| 4 | 24.0 | 1123.44 |
| 5 | 26.8 | 767.98 |
| 6 | 30.0 | 1393.82 |
| 7 | 32.4 | 1413.27 |
| 8 | 35.2 | 478.67 |
| 9 | 37.9 | 448.92 |
| 10 | 40.6 | 1441.11 |
| 11 | 43.4 | 1202.66 |
| 12 | 46.2 | 289.97 |
| 13 | 48.8 | 203.59 |
| 14 | 51.4 | 1506.49 |
| 15 | 53.9 | 891.70 |
| Random Variable | Average Value | Standard Deviation | Distribution Type |
|---|---|---|---|
| Elastic modulus | 206 GPa | 6.18 GPa | Lognormal |
| Poisson’s ratio | 0.3 | 0.009 | Lognormal |
| Mass density | 7800 kg/mm3 | Deterministic | |
| Yield strength for Q235 | 263.7 MPa | 18.46 MPa | Lognormal |
| Yield strength for Q345 | 387.1 MPa | 27.10 MPa | Lognormal |
| Web thickness | 0.985 | 0.031 | Normal |
| Width | 1.001 | 0.008 | Normal |
| Service Life (Year) | Wind | Seismic | Wind + Seismic | |||
|---|---|---|---|---|---|---|
| No Ctrl | PTMD | No Ctrl | PTMD | No Ctrl | PTMD | |
| 1 | 3.4400 | 3.6124 | 5.1700 | 5.3467 | 3.4399 | 3.6123 |
| 30 | 2.3786 | 2.6089 | 4.4930 | 4.6934 | 2.3784 | 2.6088 |
| 50 | 2.1851 | 2.4296 | 4.3830 | 4.5879 | 2.1849 | 2.4295 |
| 100 | 1.9006 | 2.1686 | 4.2296 | 4.4410 | 1.9005 | 2.1685 |
Disclaimer/Publisher’s Note: The statements, opinions and data contained in all publications are solely those of the individual author(s) and contributor(s) and not of MDPI and/or the editor(s). MDPI and/or the editor(s) disclaim responsibility for any injury to people or property resulting from any ideas, methods, instructions or products referred to in the content. |
© 2025 by the authors. Licensee MDPI, Basel, Switzerland. This article is an open access article distributed under the terms and conditions of the Creative Commons Attribution (CC BY) license (https://creativecommons.org/licenses/by/4.0/).
Share and Cite
Zhang, Z.; Qi, L.; Rong, J.; Zhang, Y.; Li, P.; Jia, Z. Multi-Hazard Vibration Control of Transmission Infrastructure: A Pounding Tuned Mass Damper Approach with Lifelong Reliability Analysis. Buildings 2025, 15, 1113. https://doi.org/10.3390/buildings15071113
Zhang Z, Qi L, Rong J, Zhang Y, Li P, Jia Z. Multi-Hazard Vibration Control of Transmission Infrastructure: A Pounding Tuned Mass Damper Approach with Lifelong Reliability Analysis. Buildings. 2025; 15(7):1113. https://doi.org/10.3390/buildings15071113
Chicago/Turabian StyleZhang, Zhuoqun, Lizhong Qi, Jingguo Rong, Yaping Zhang, Peijie Li, and Ziguang Jia. 2025. "Multi-Hazard Vibration Control of Transmission Infrastructure: A Pounding Tuned Mass Damper Approach with Lifelong Reliability Analysis" Buildings 15, no. 7: 1113. https://doi.org/10.3390/buildings15071113
APA StyleZhang, Z., Qi, L., Rong, J., Zhang, Y., Li, P., & Jia, Z. (2025). Multi-Hazard Vibration Control of Transmission Infrastructure: A Pounding Tuned Mass Damper Approach with Lifelong Reliability Analysis. Buildings, 15(7), 1113. https://doi.org/10.3390/buildings15071113