
Bearing Strength of Concrete Pedestals Partially Loaded at Early Ages: An Experimental Work Mitigating Failure Risk


 , and
, and 
Abstract
1. Introduction
2. Experimental Work
2.1. Materials
2.1.1. Concrete
2.1.2. Bearing Plate
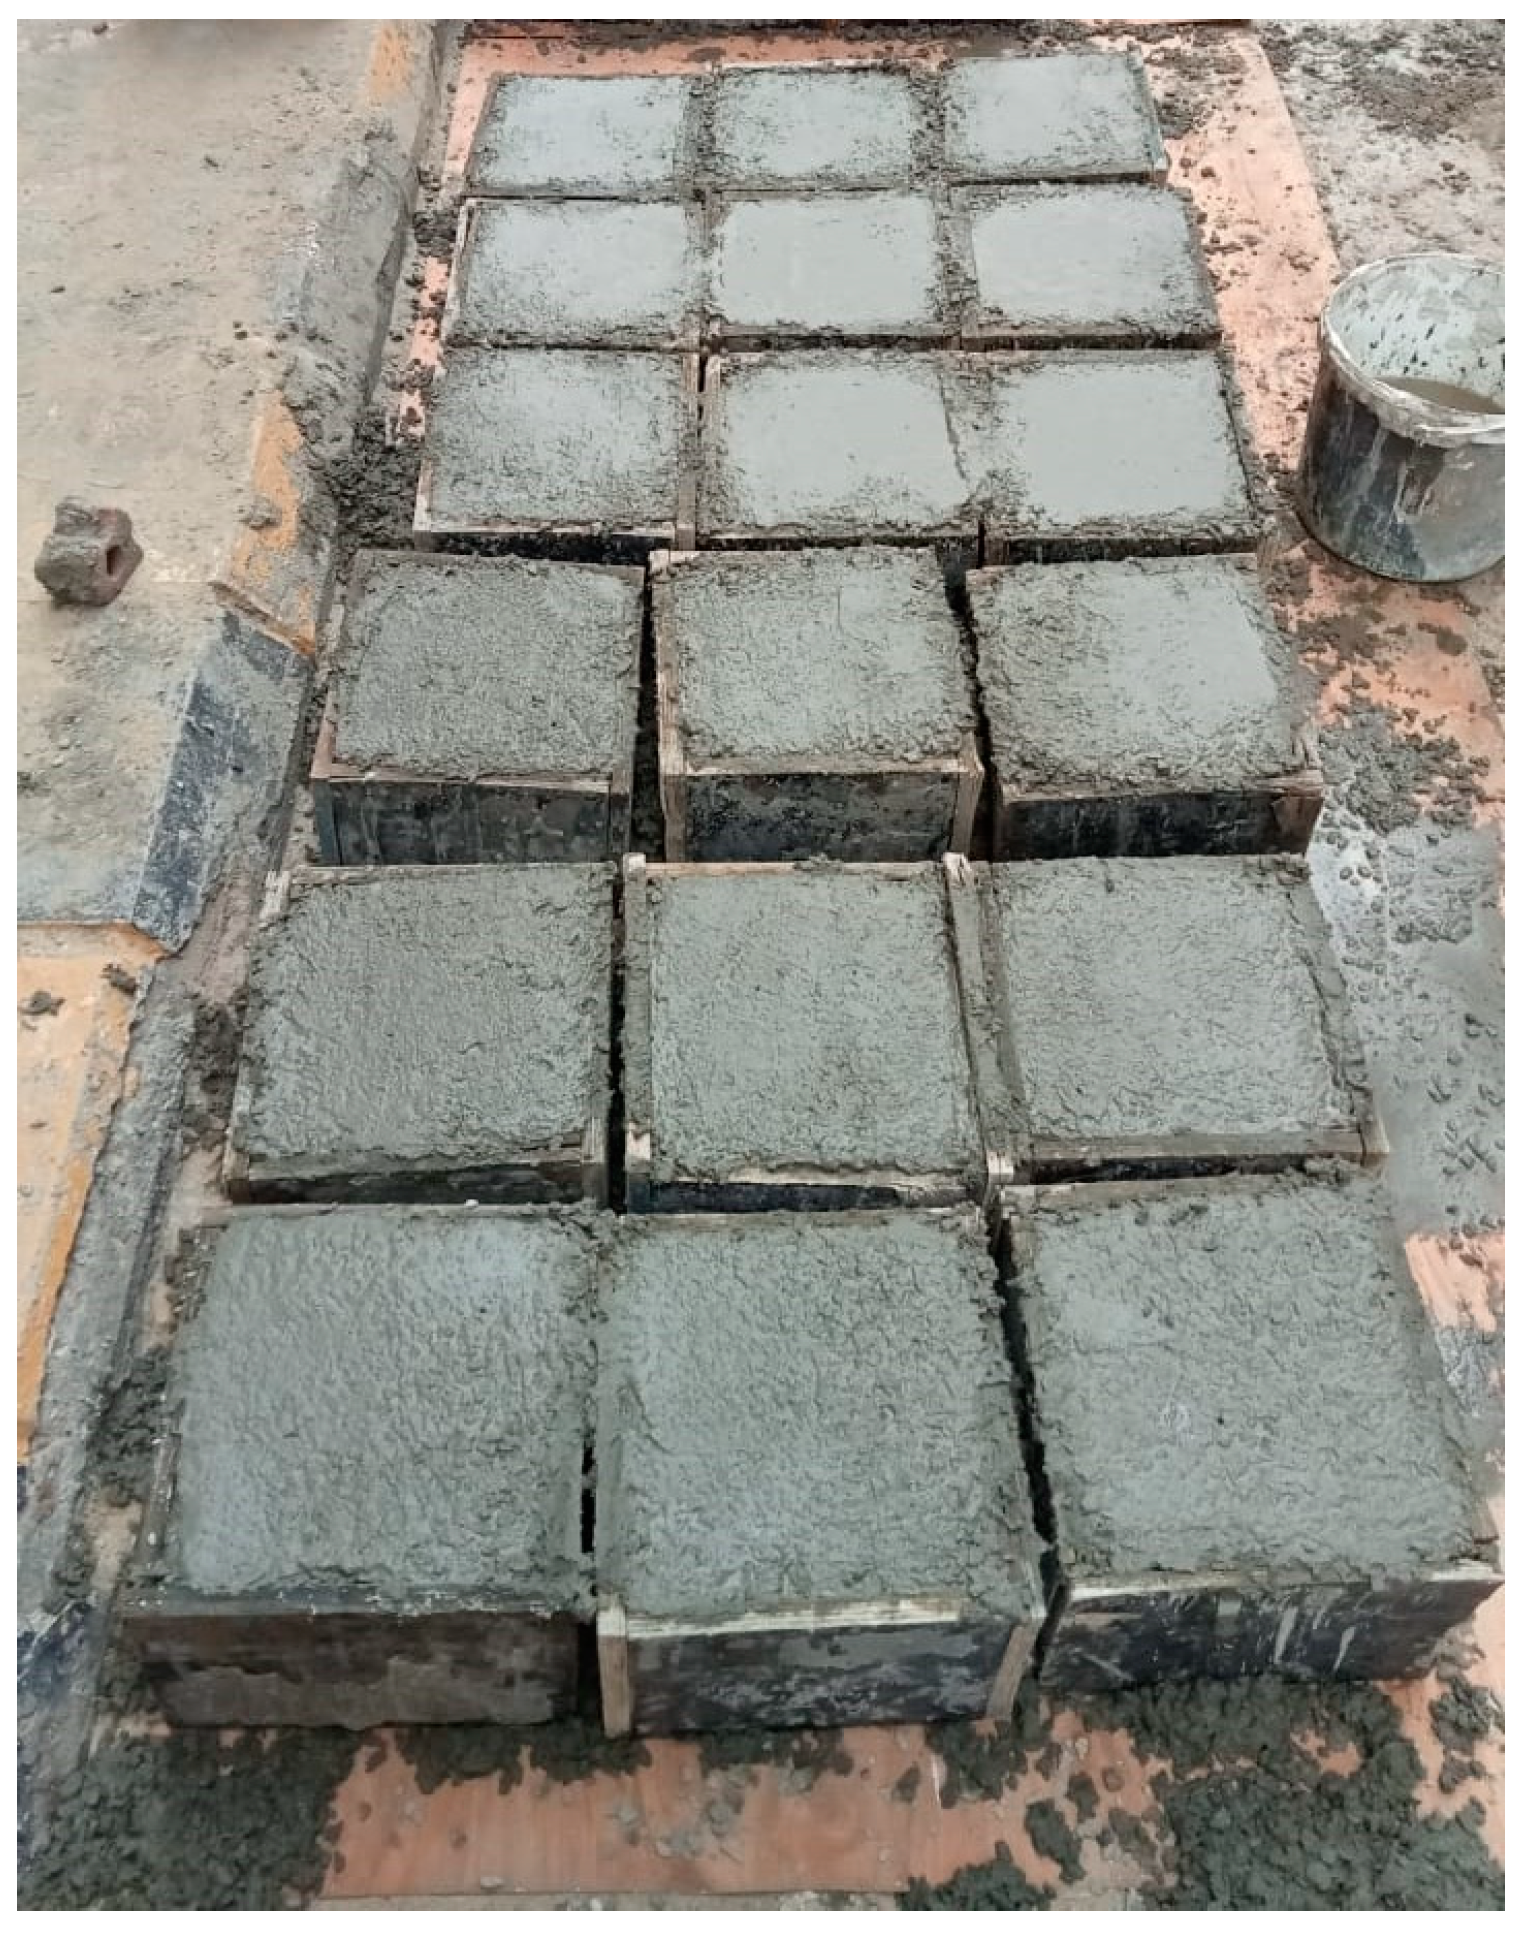
2.2. Pedestal Sample’s Specification
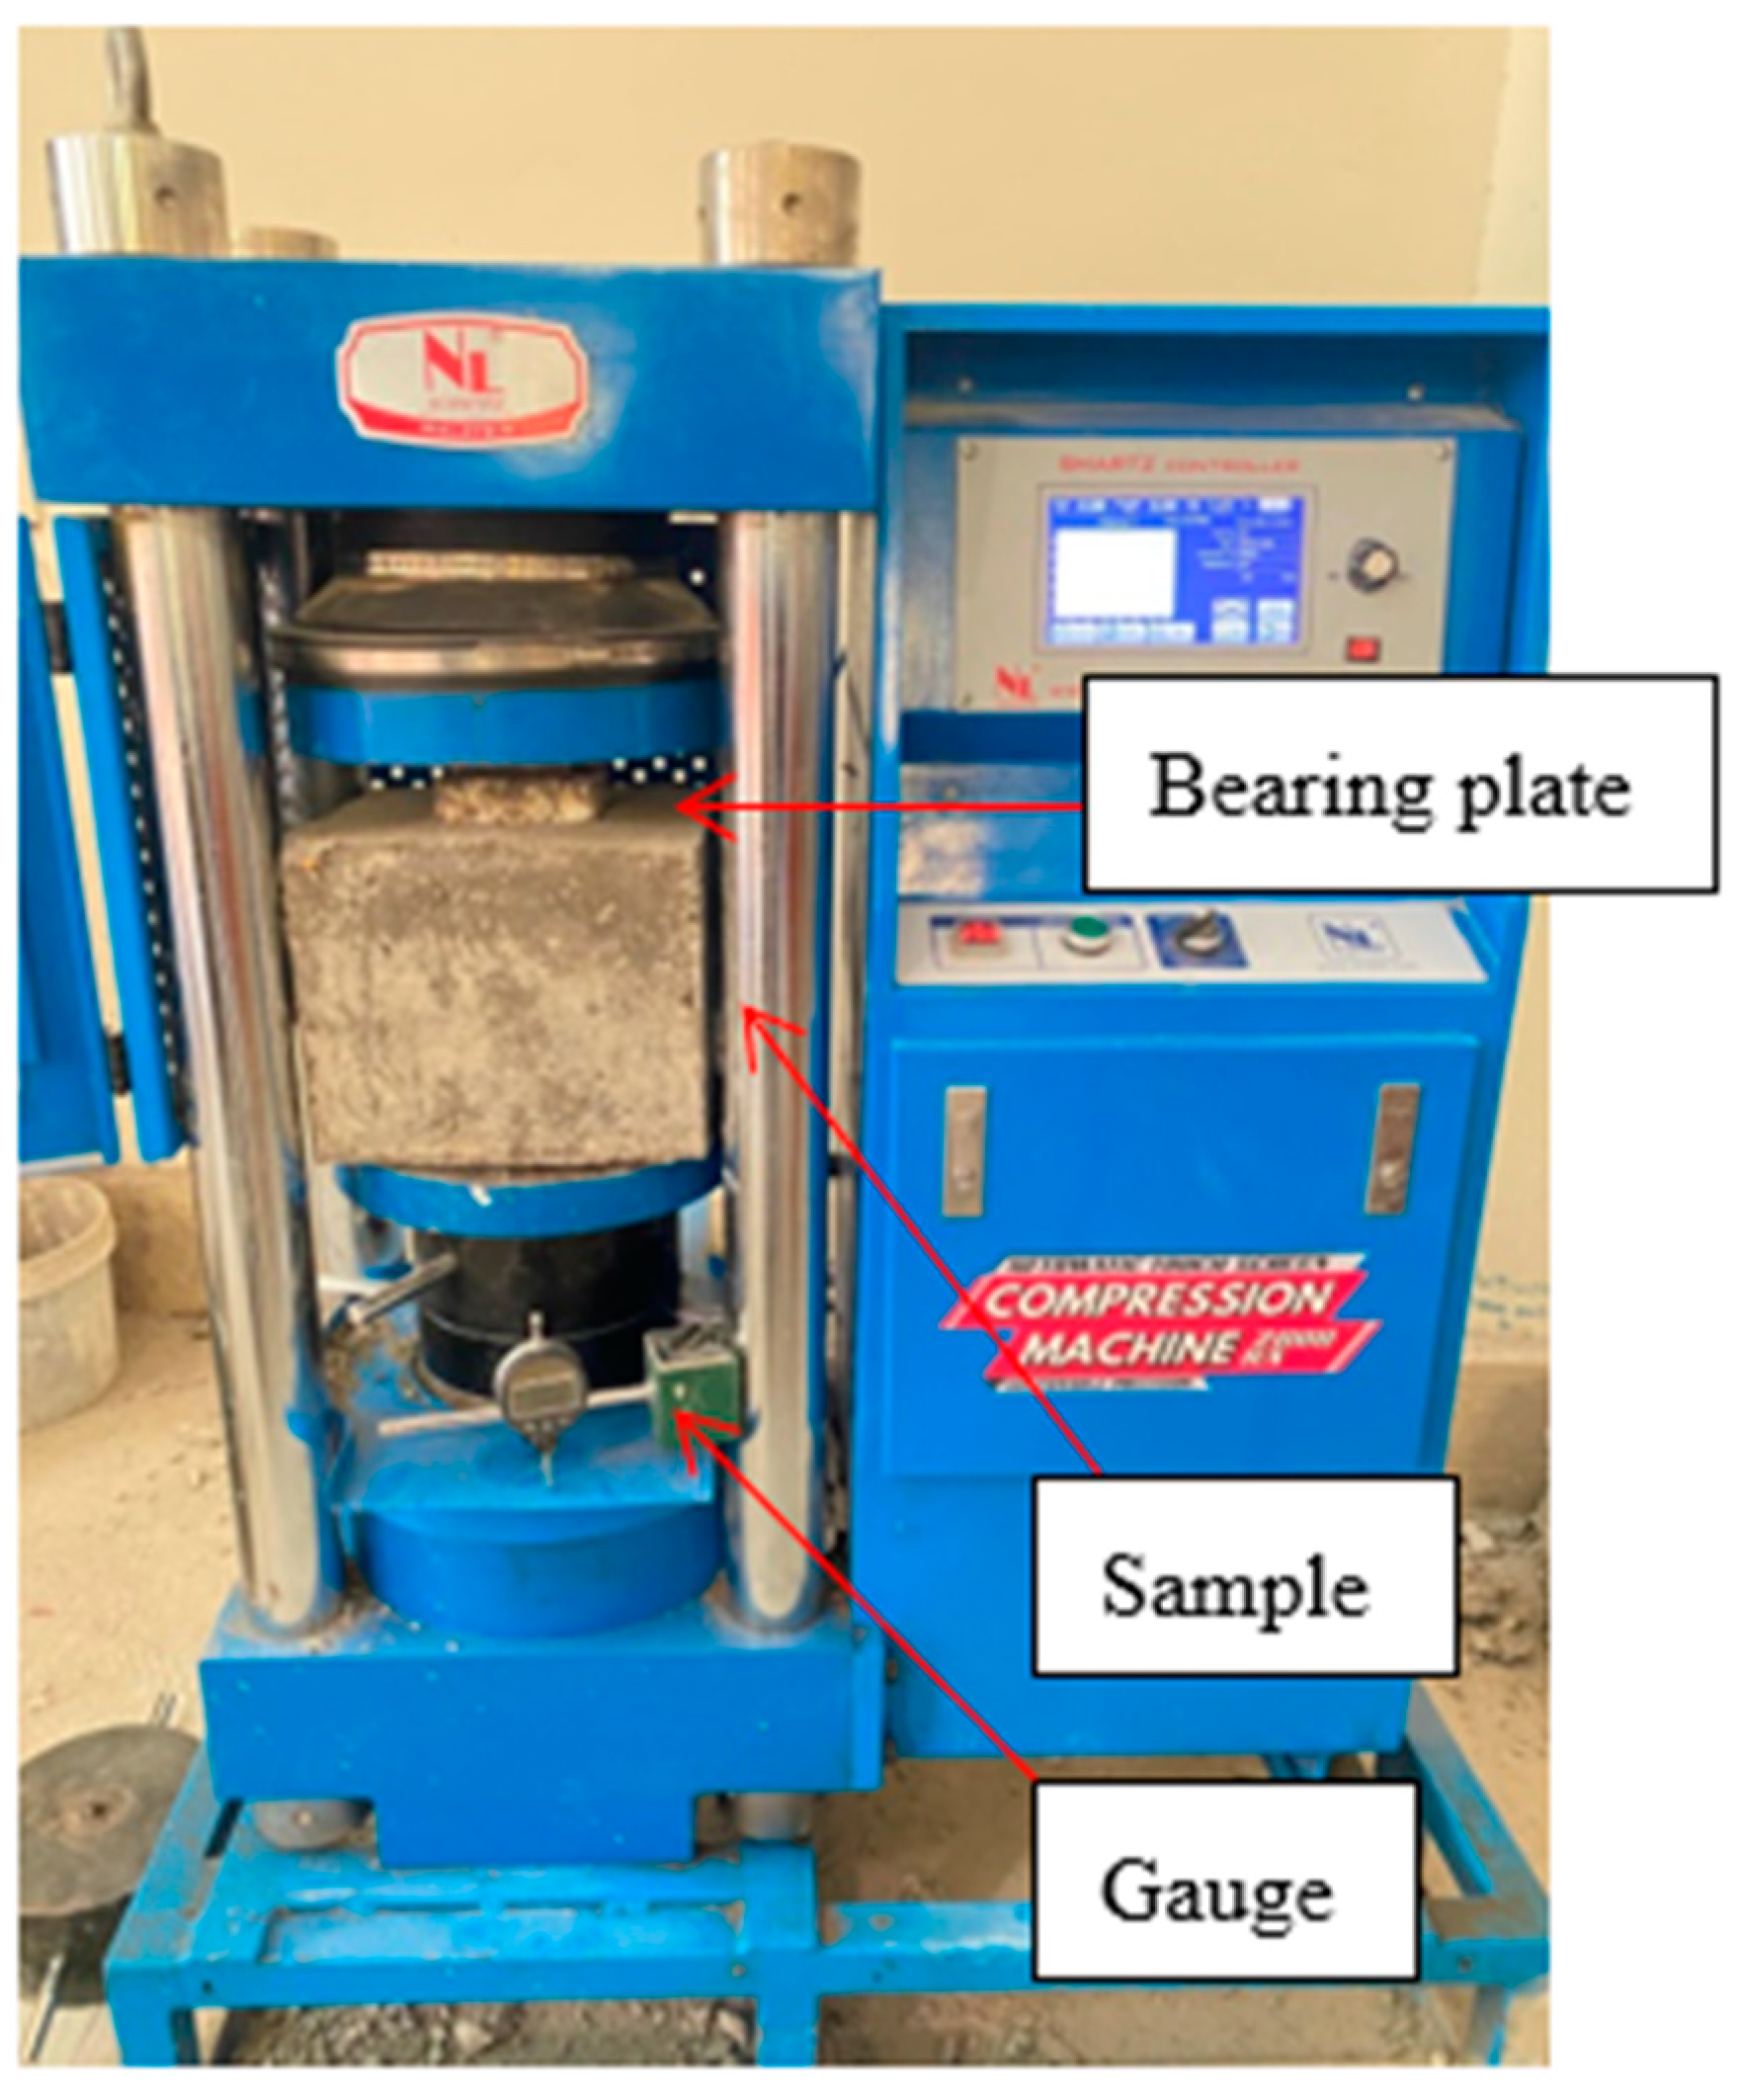
2.3. Test Setup and Measurements
3. Test Results and Analysis
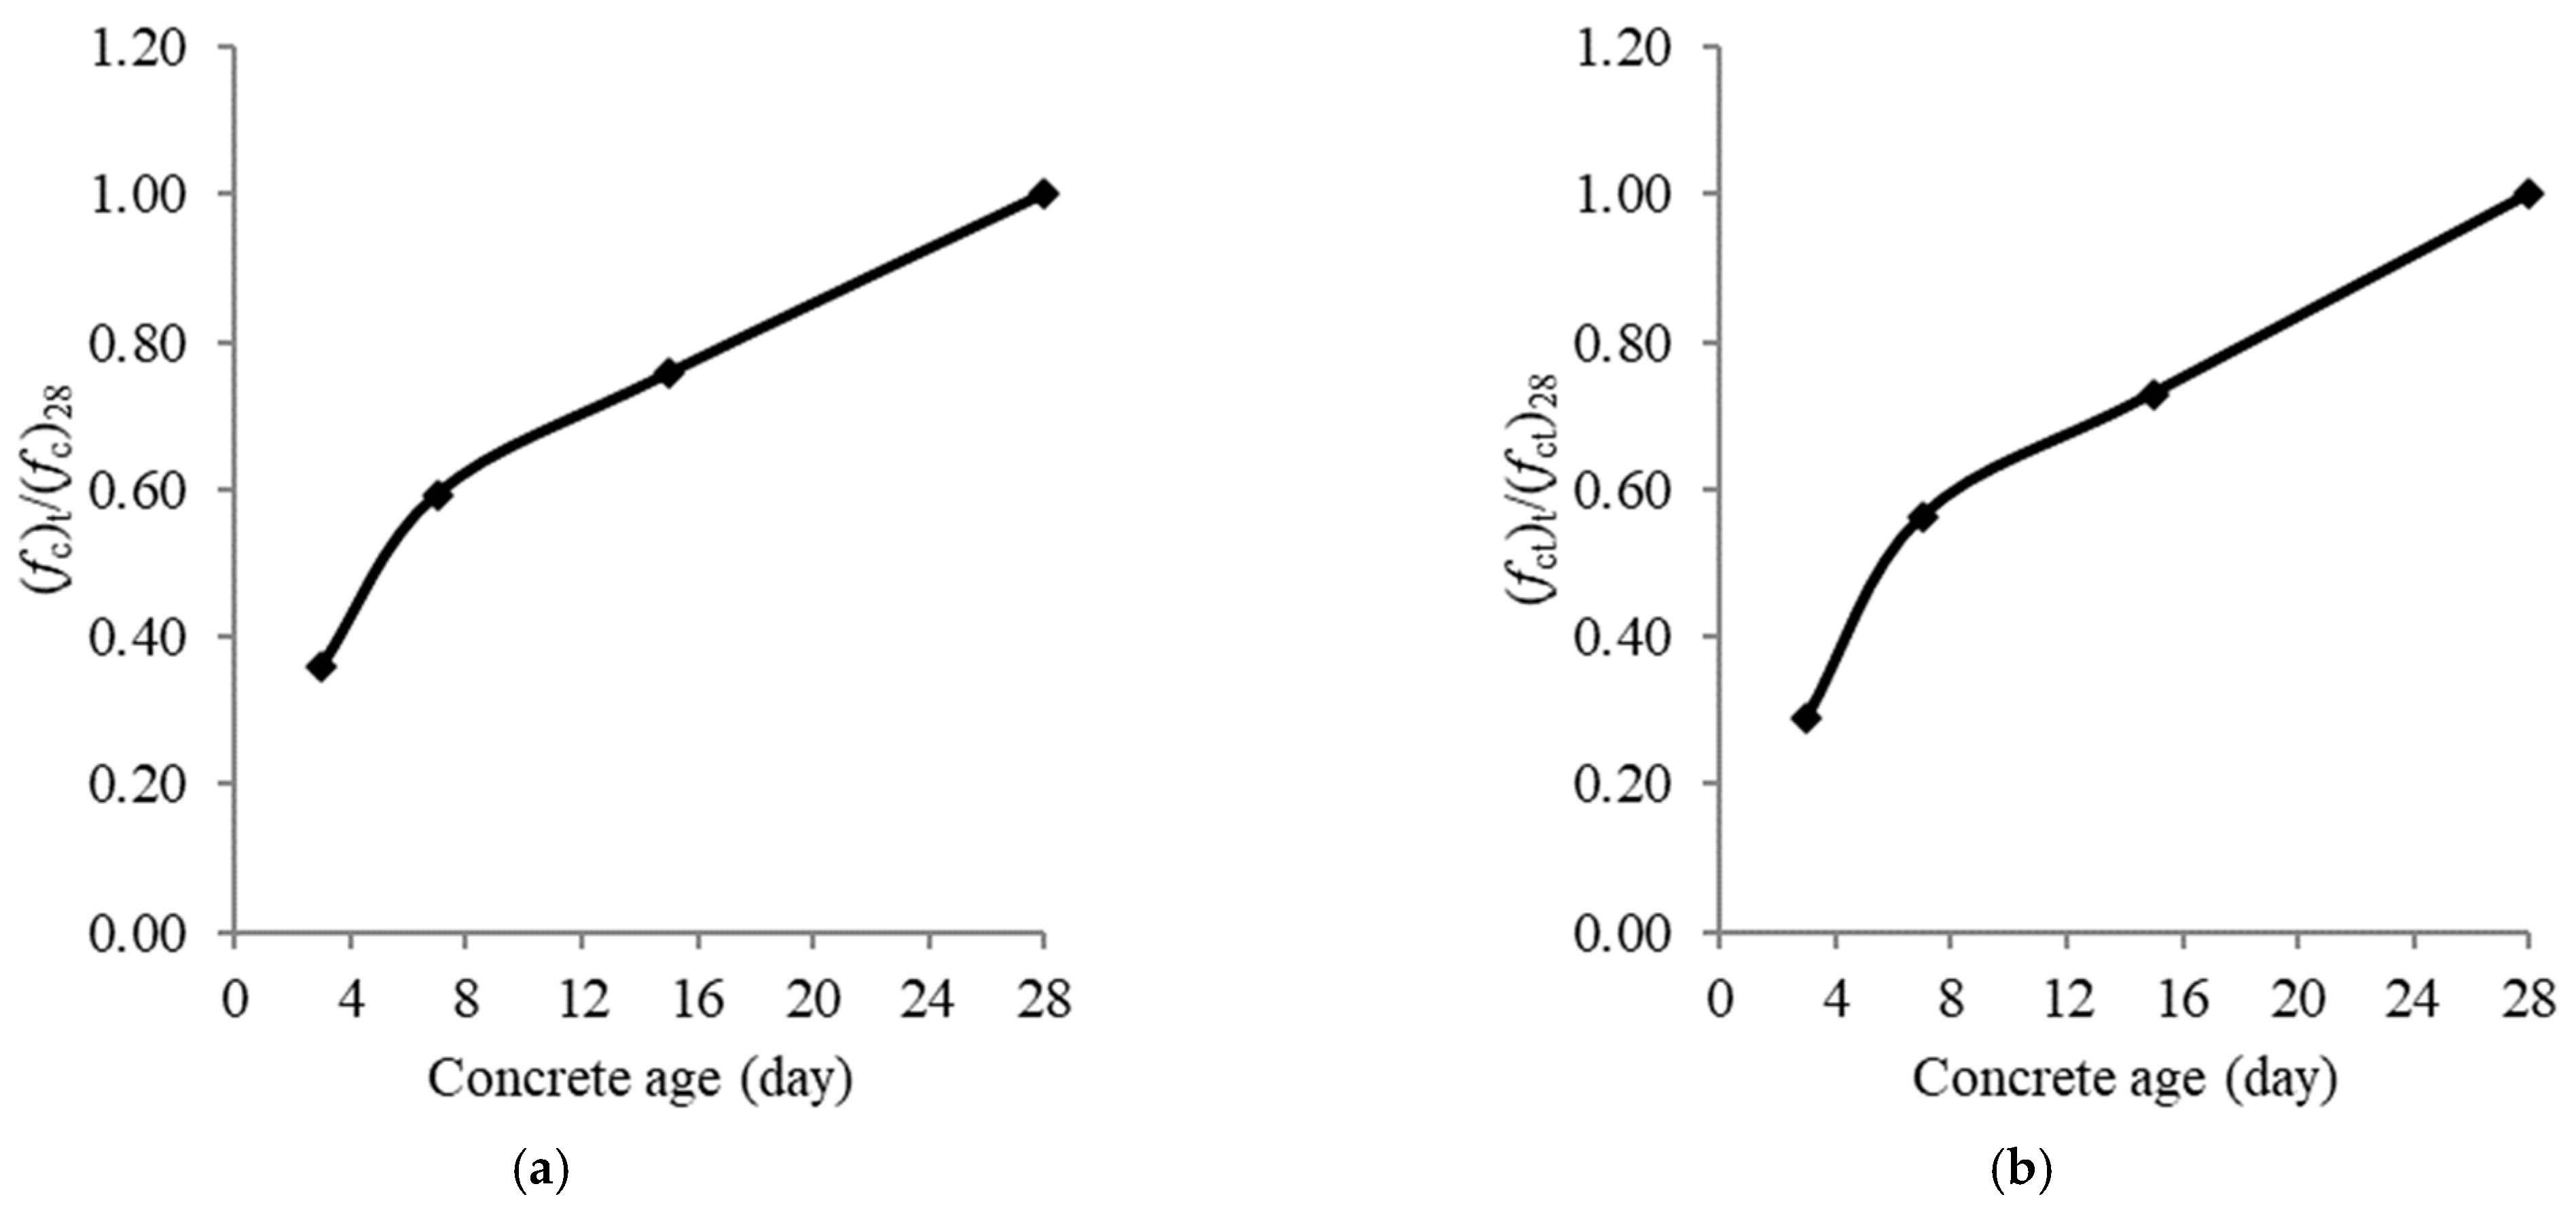
3.1. Compression and Tension Tests
3.2. Bearing Tests
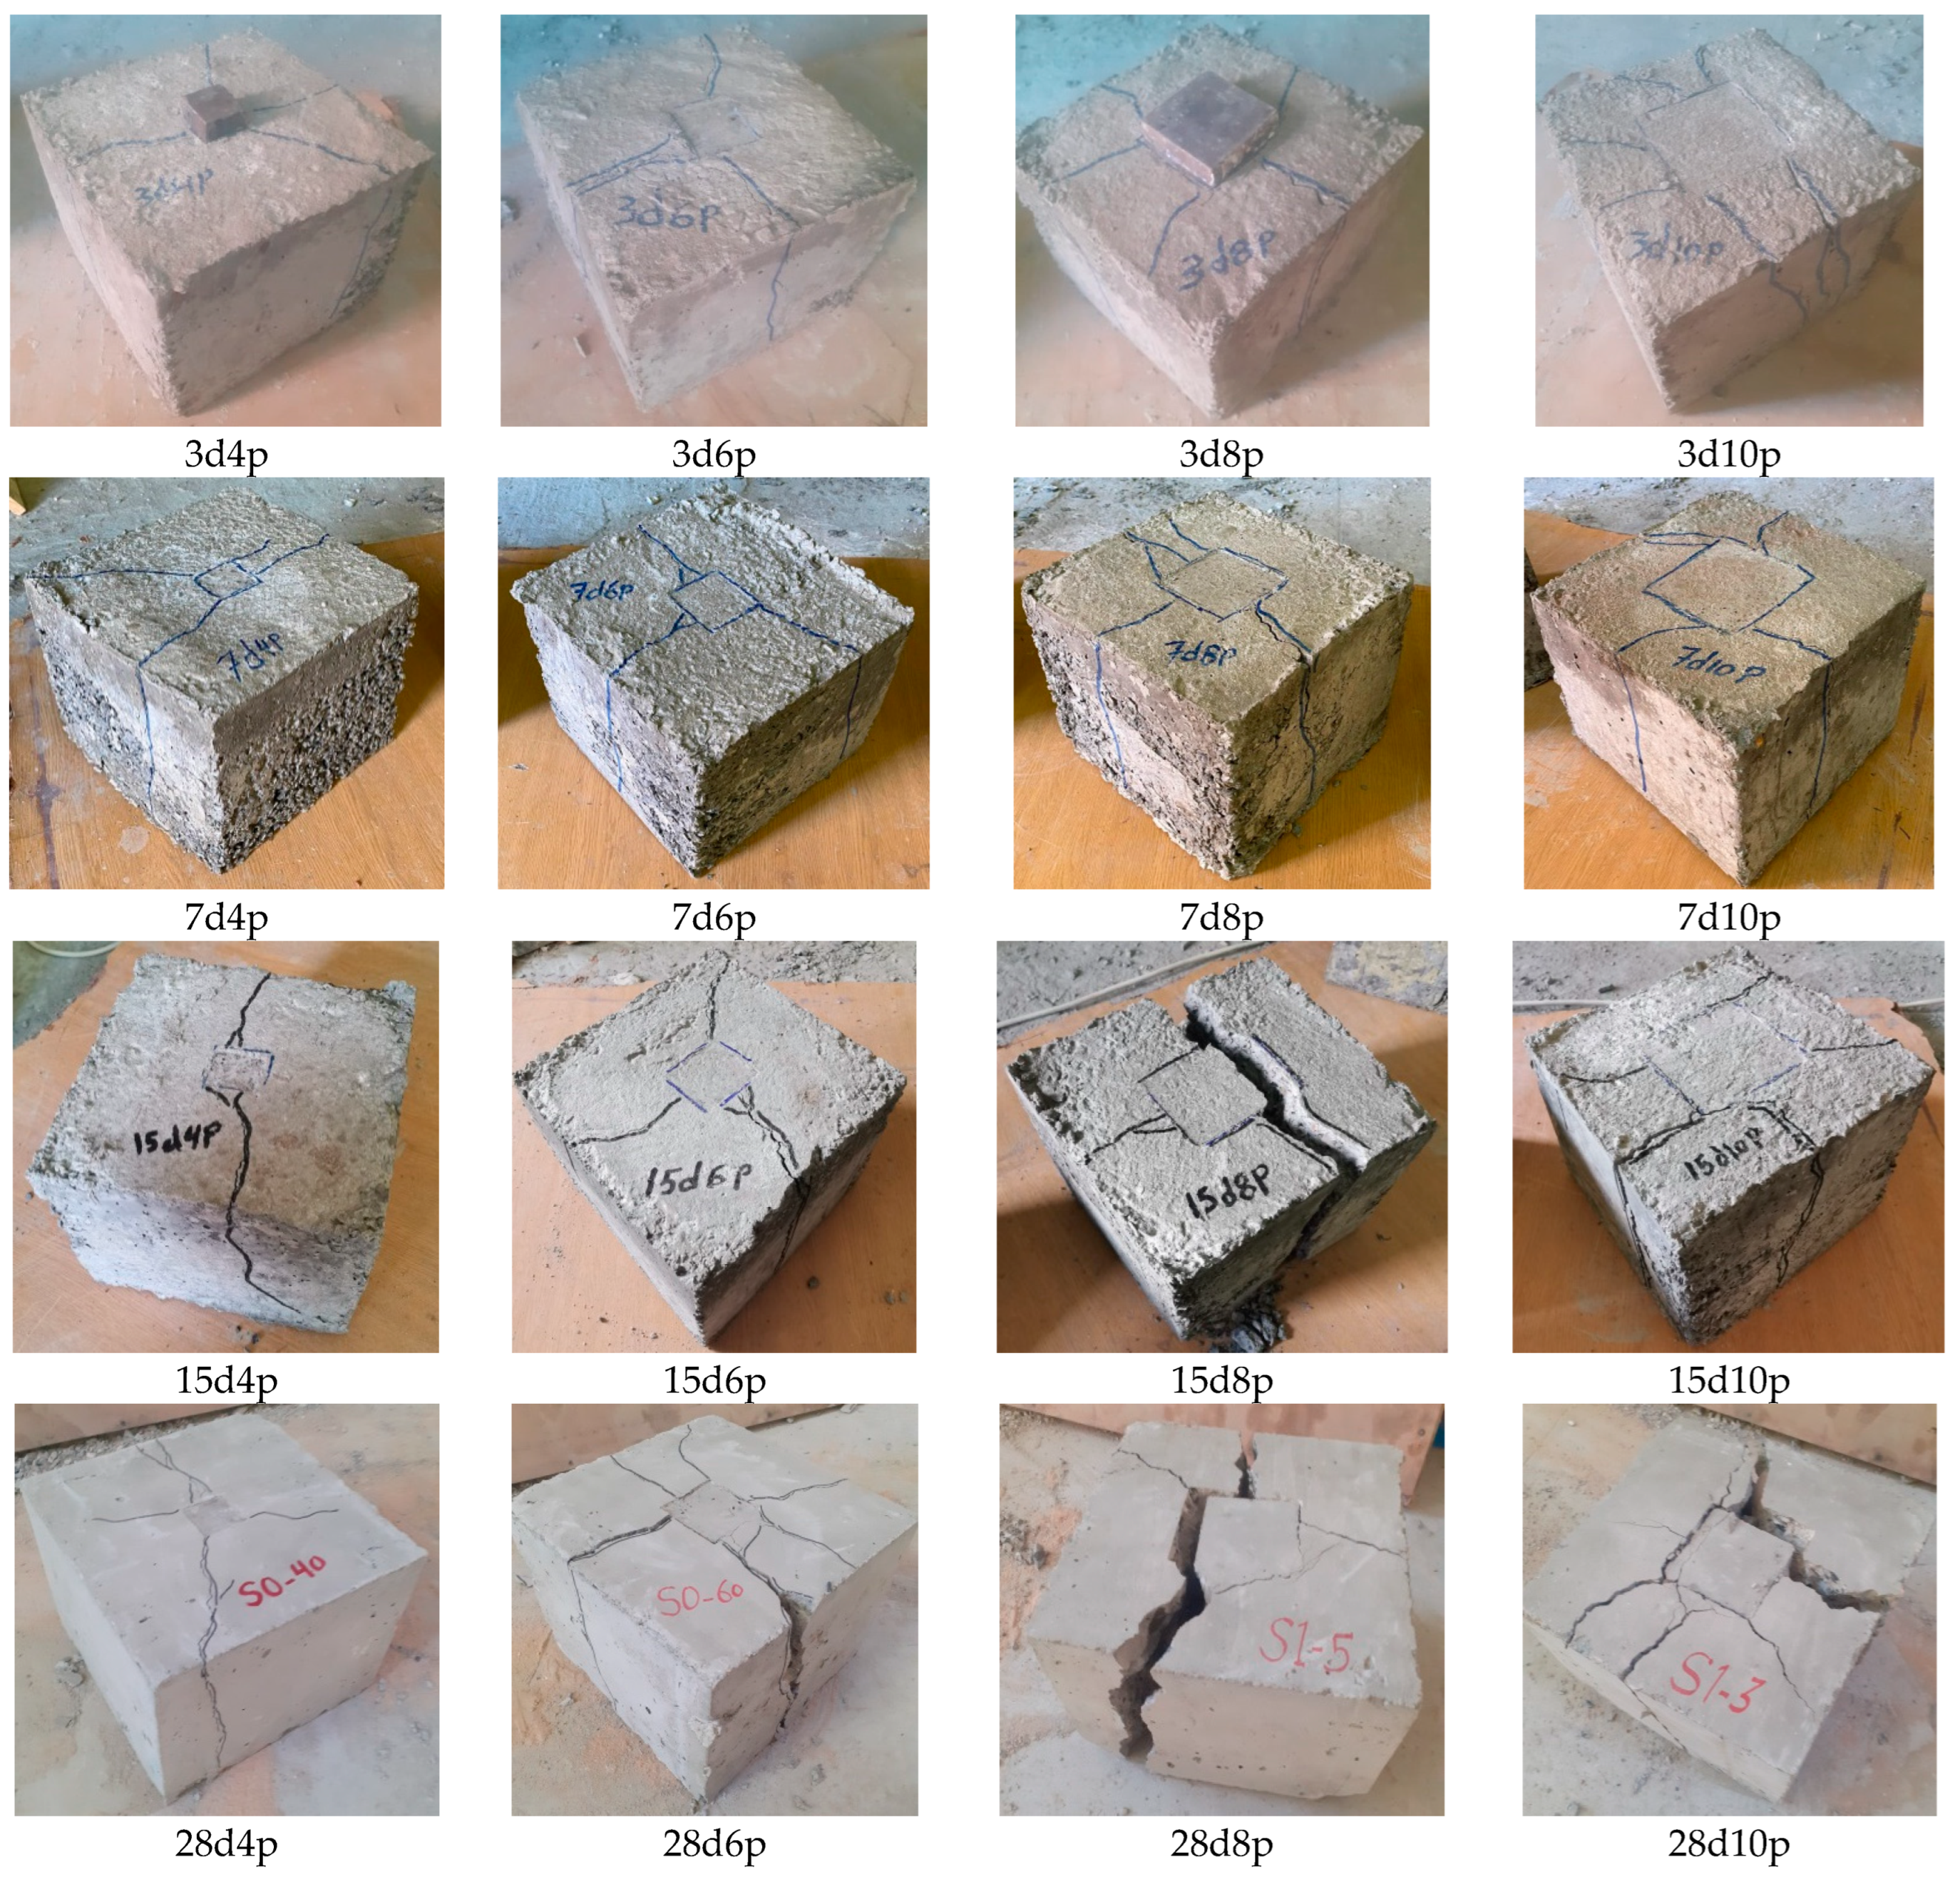
3.2.1. Collapses of the Concrete Pedestals
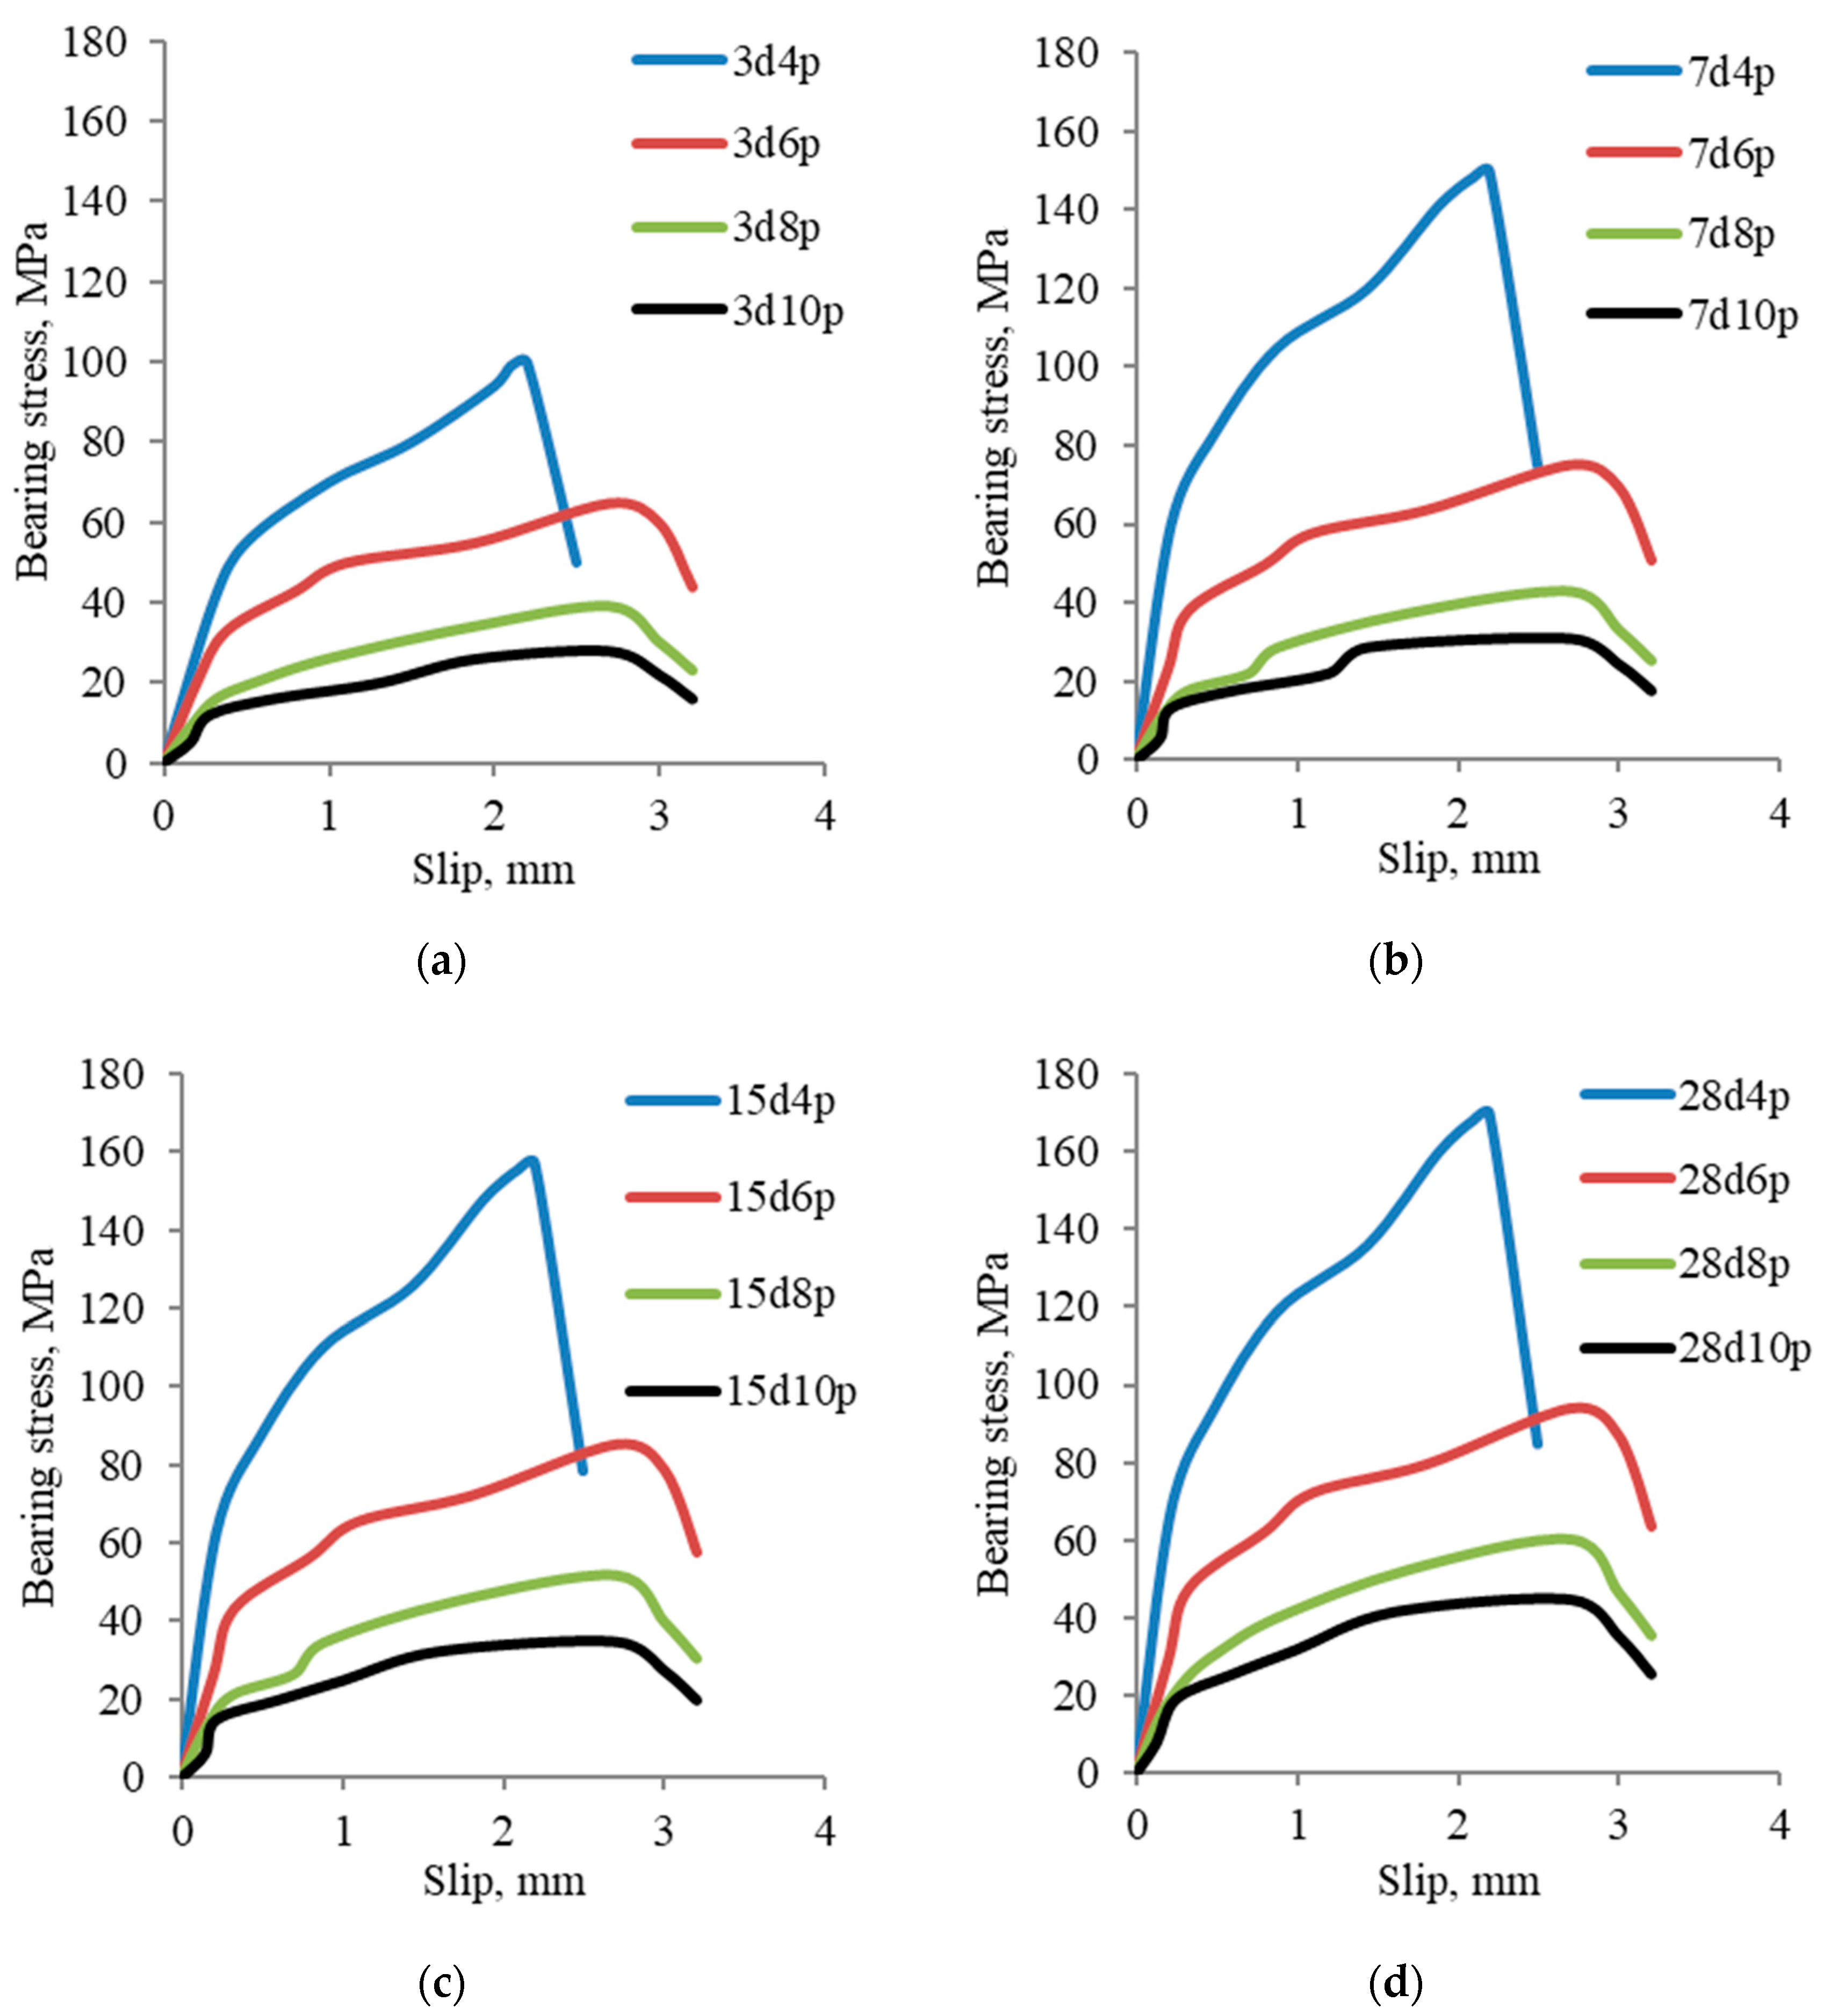
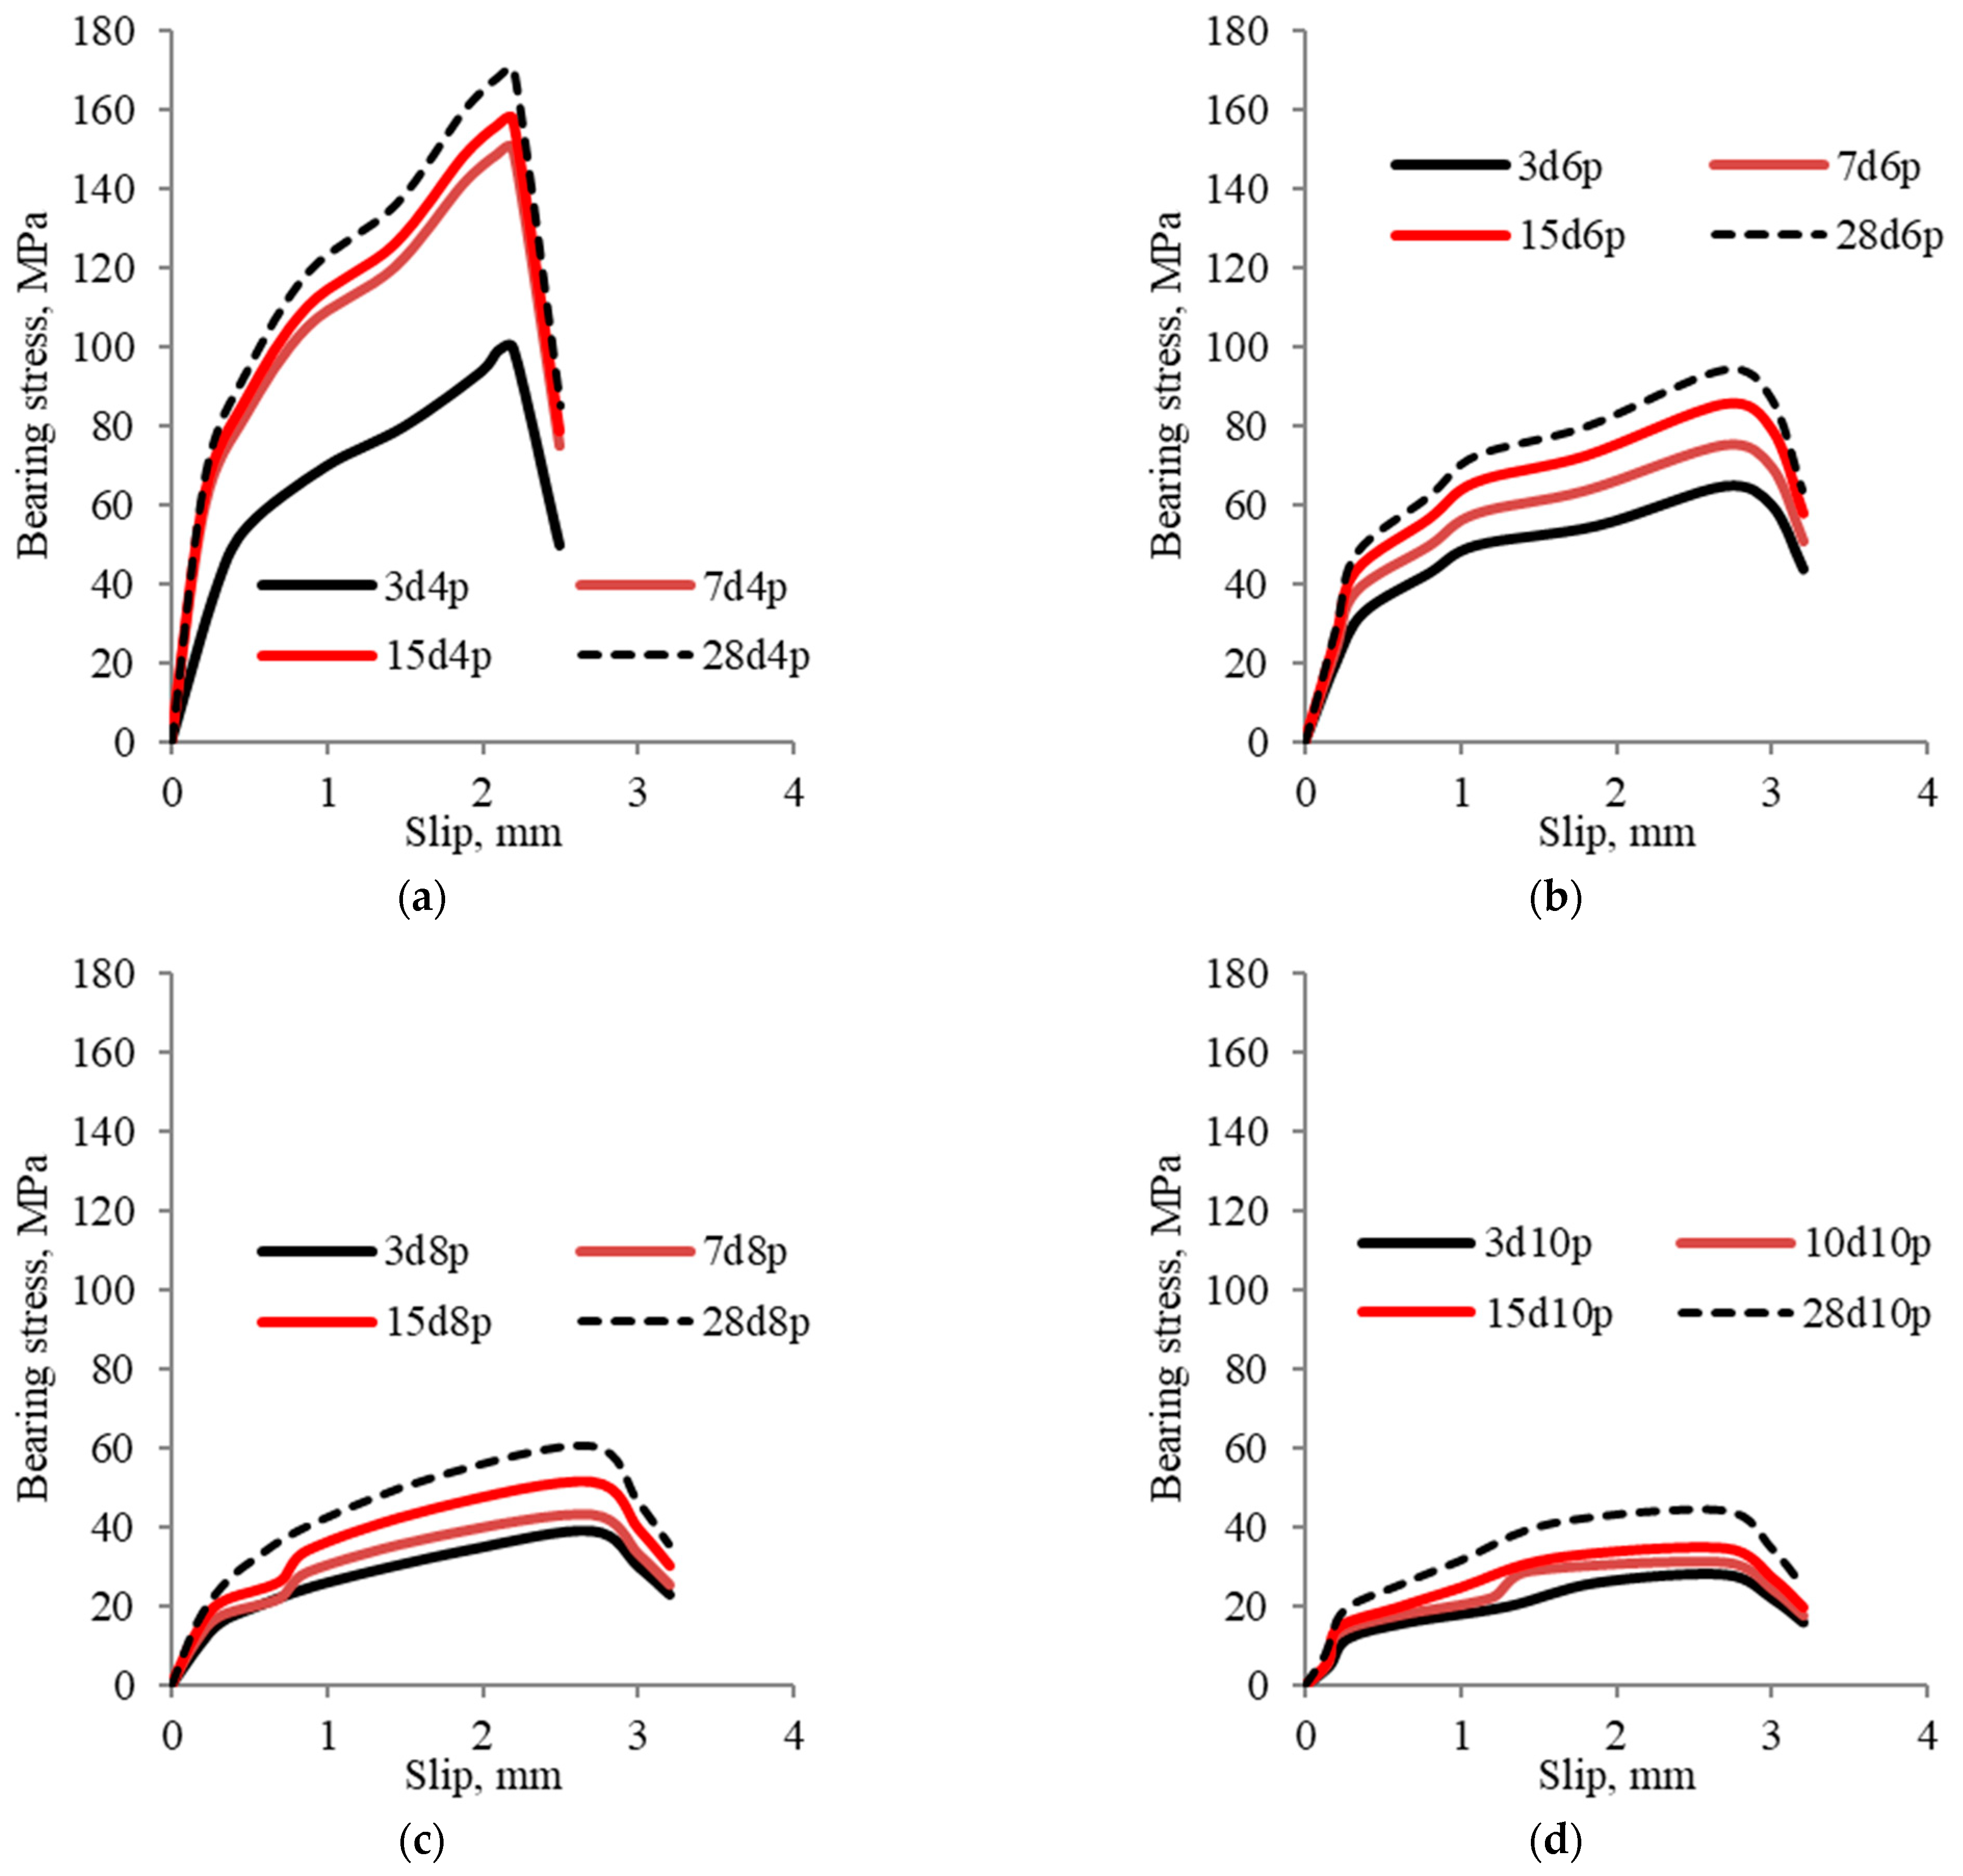
3.2.2. Bearing Stress Versus the Loaded Plate Slip
3.2.3. Bearing Strength
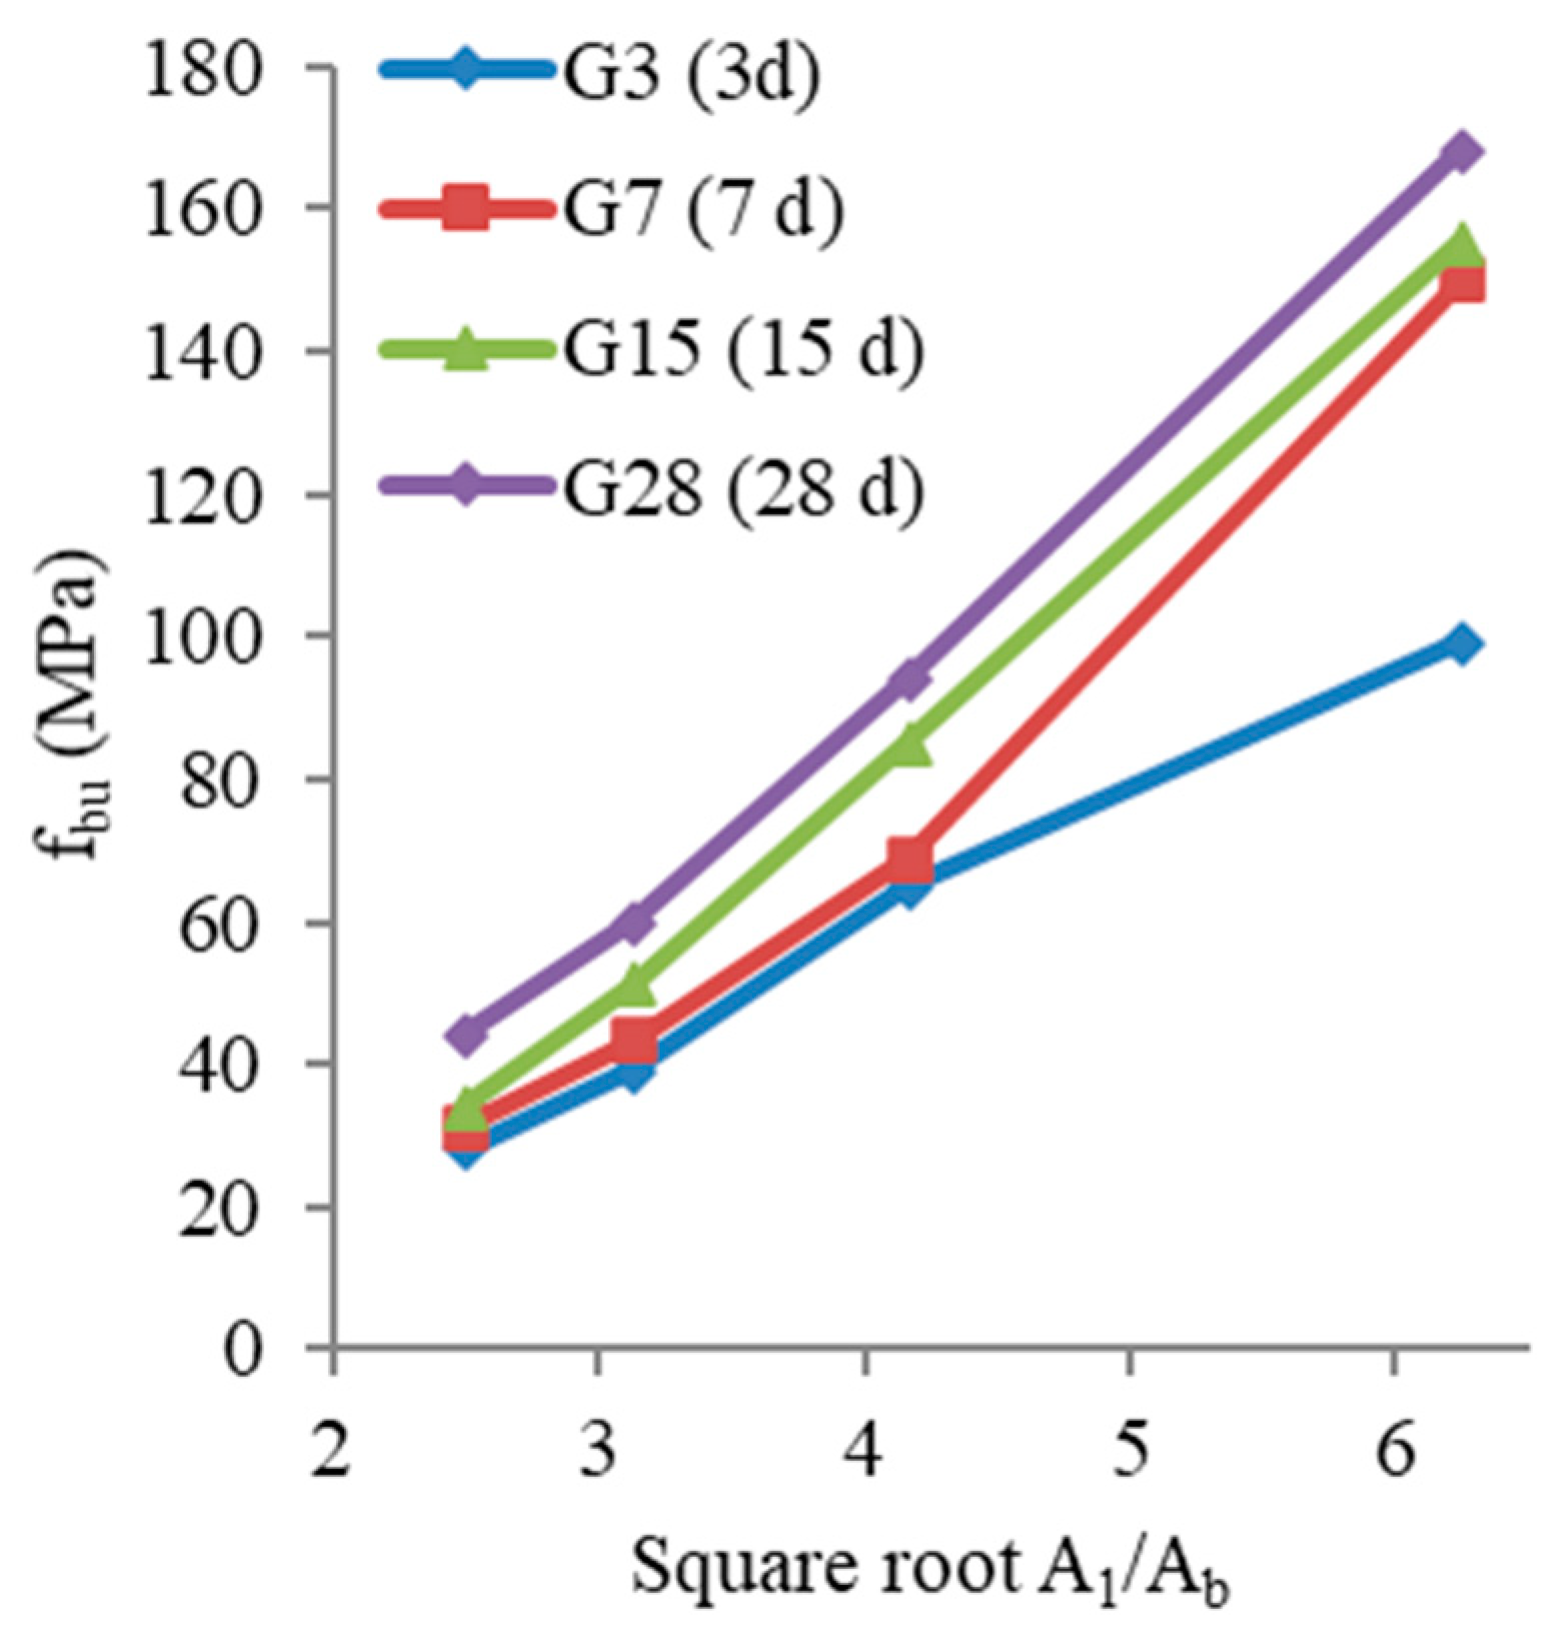
Effect of Local Area Aspect Ratio (A1/Ab)
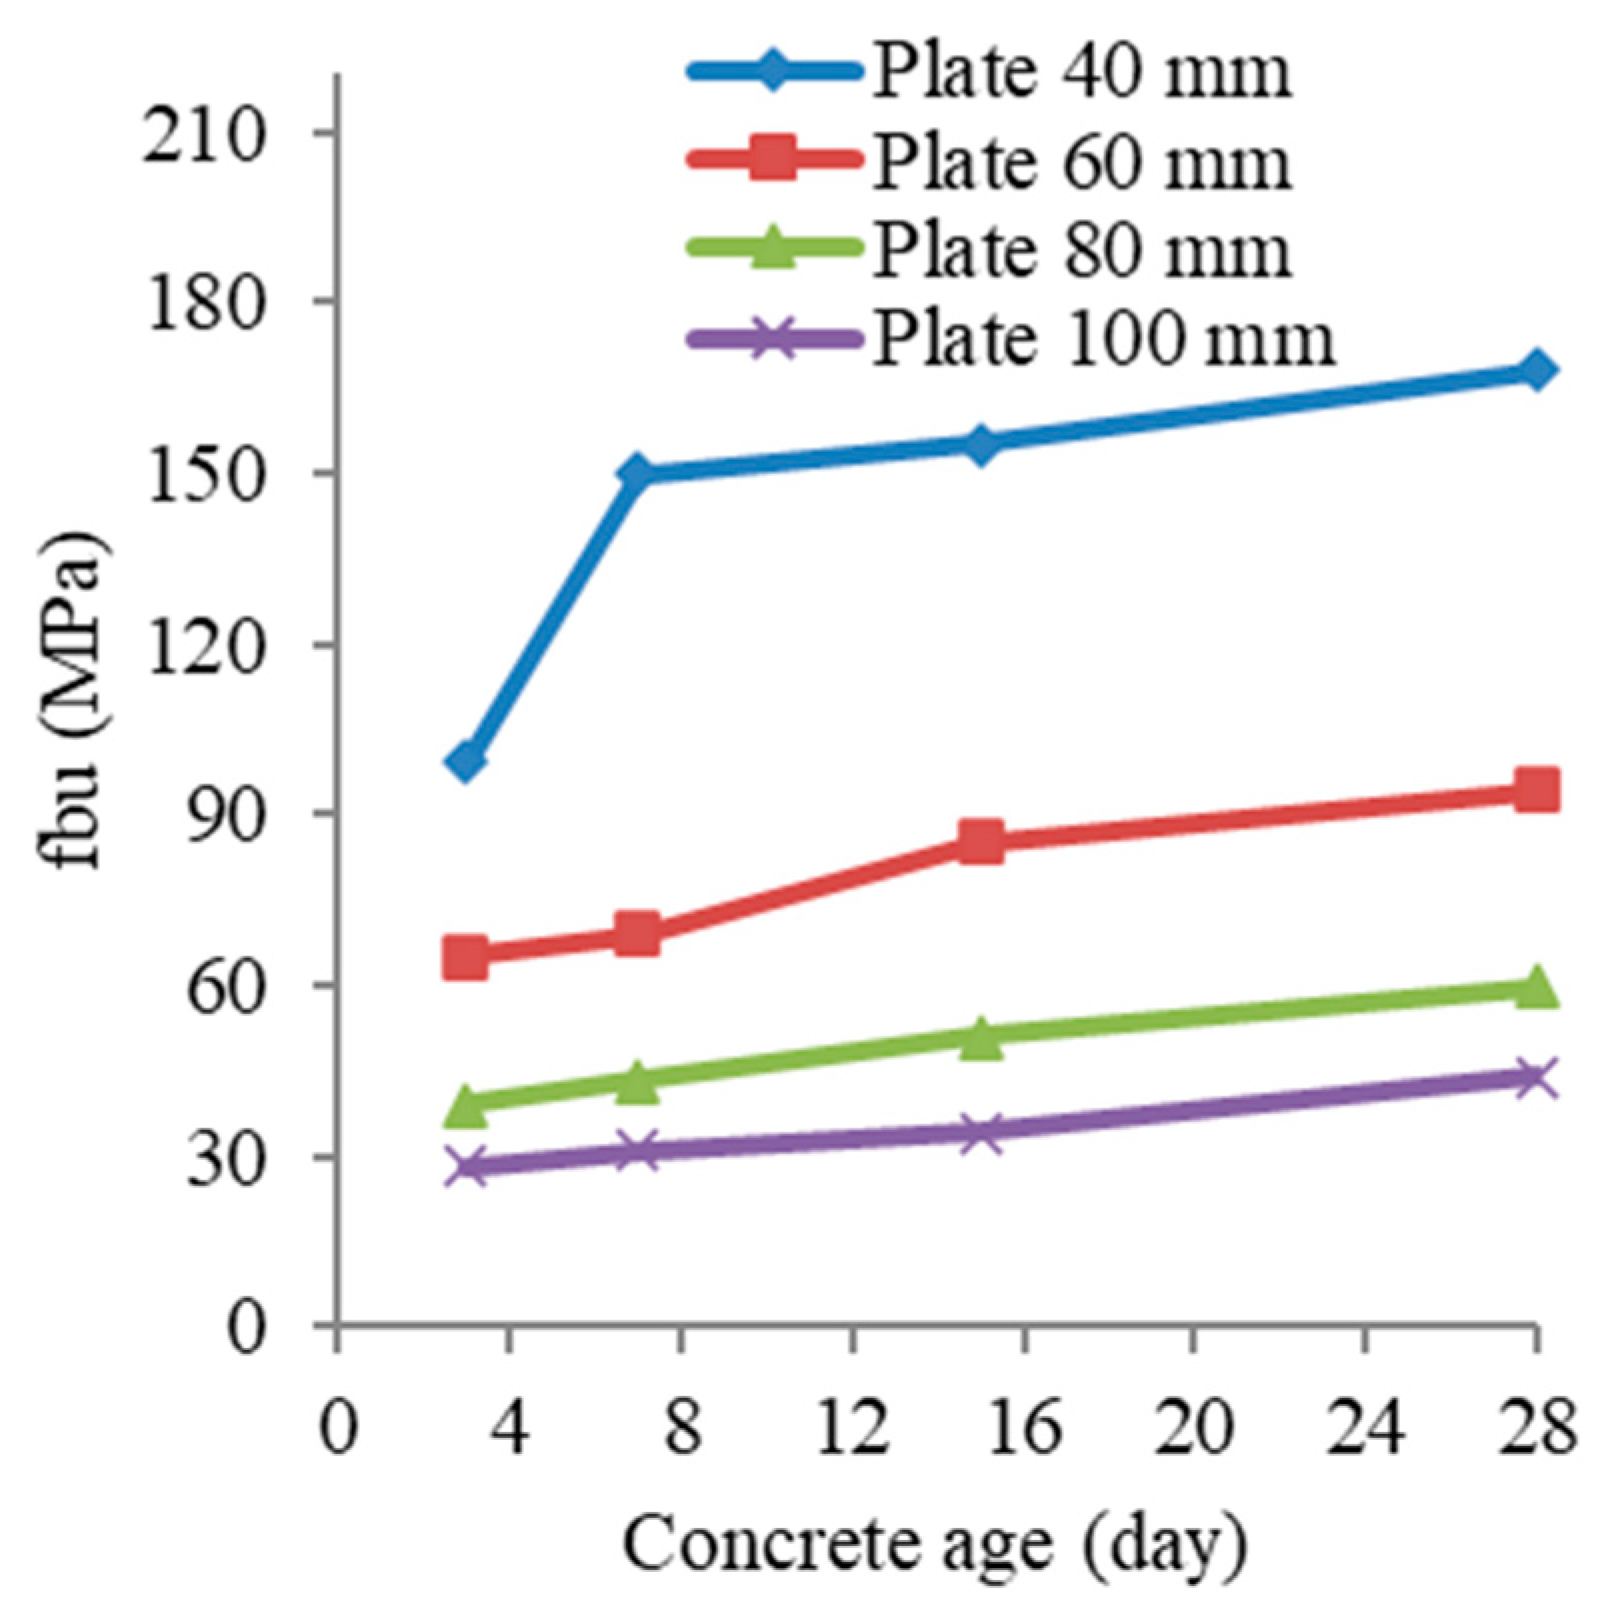
Effect of Concrete Age
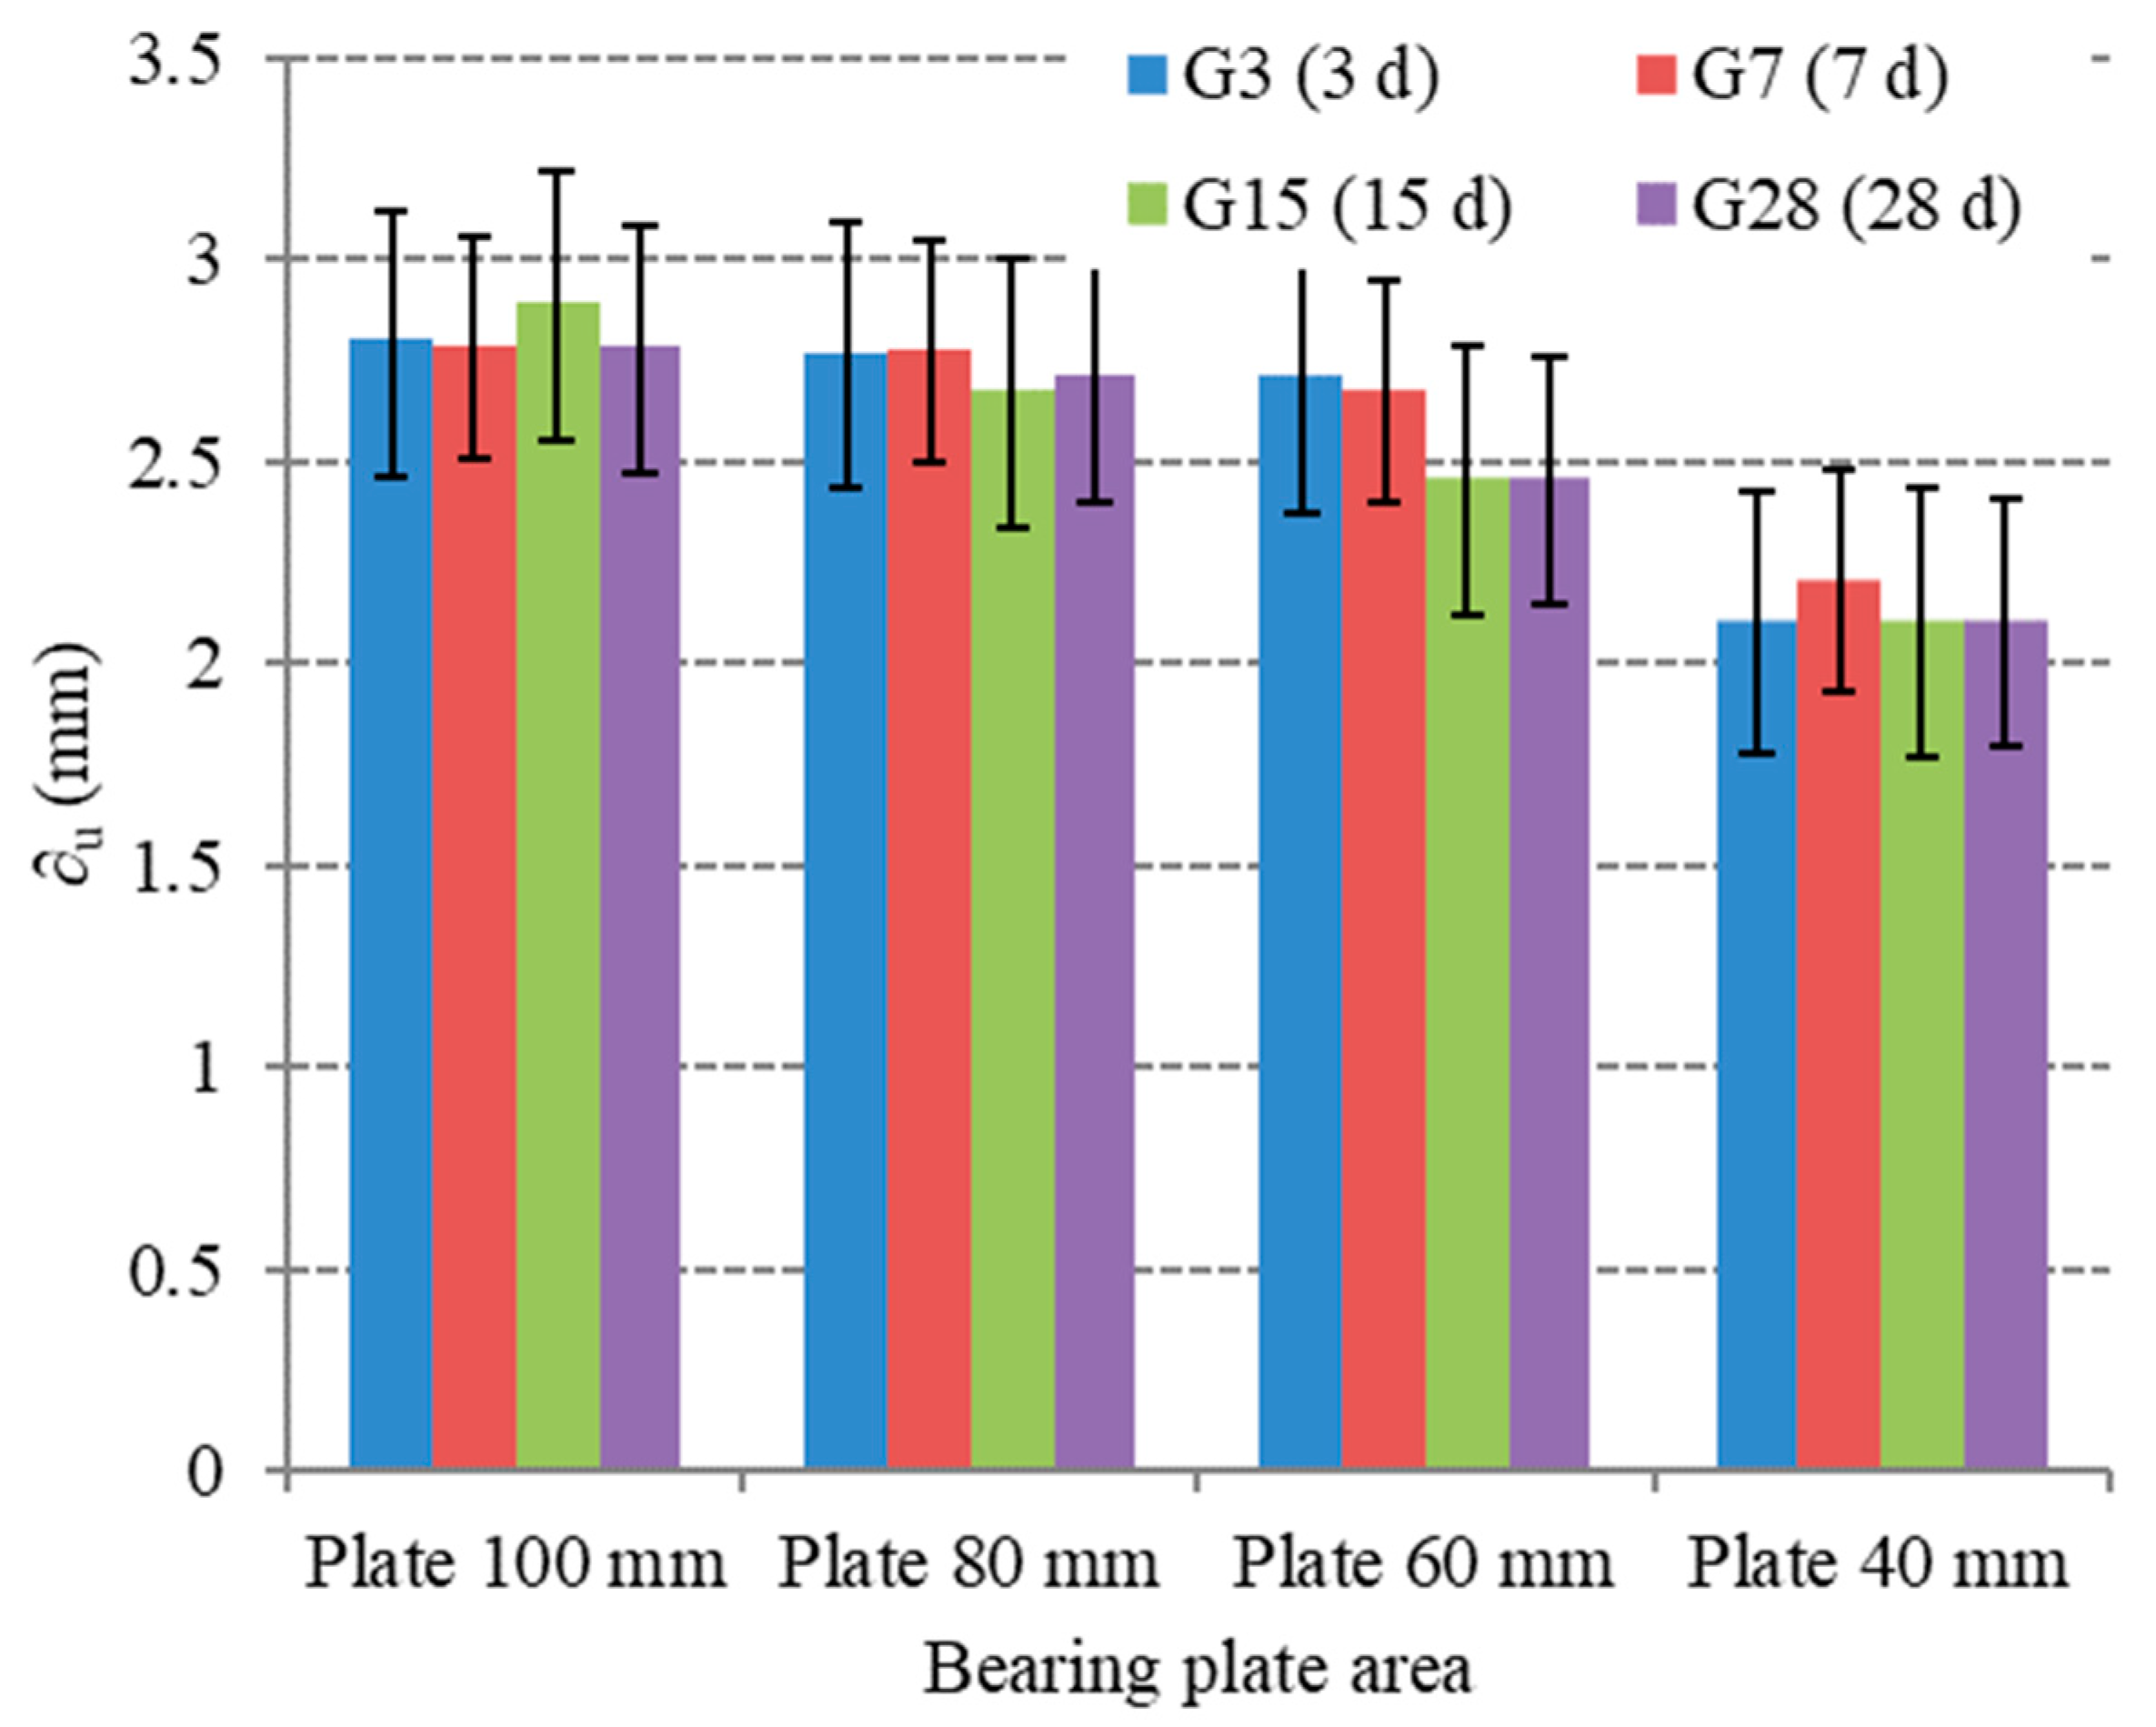
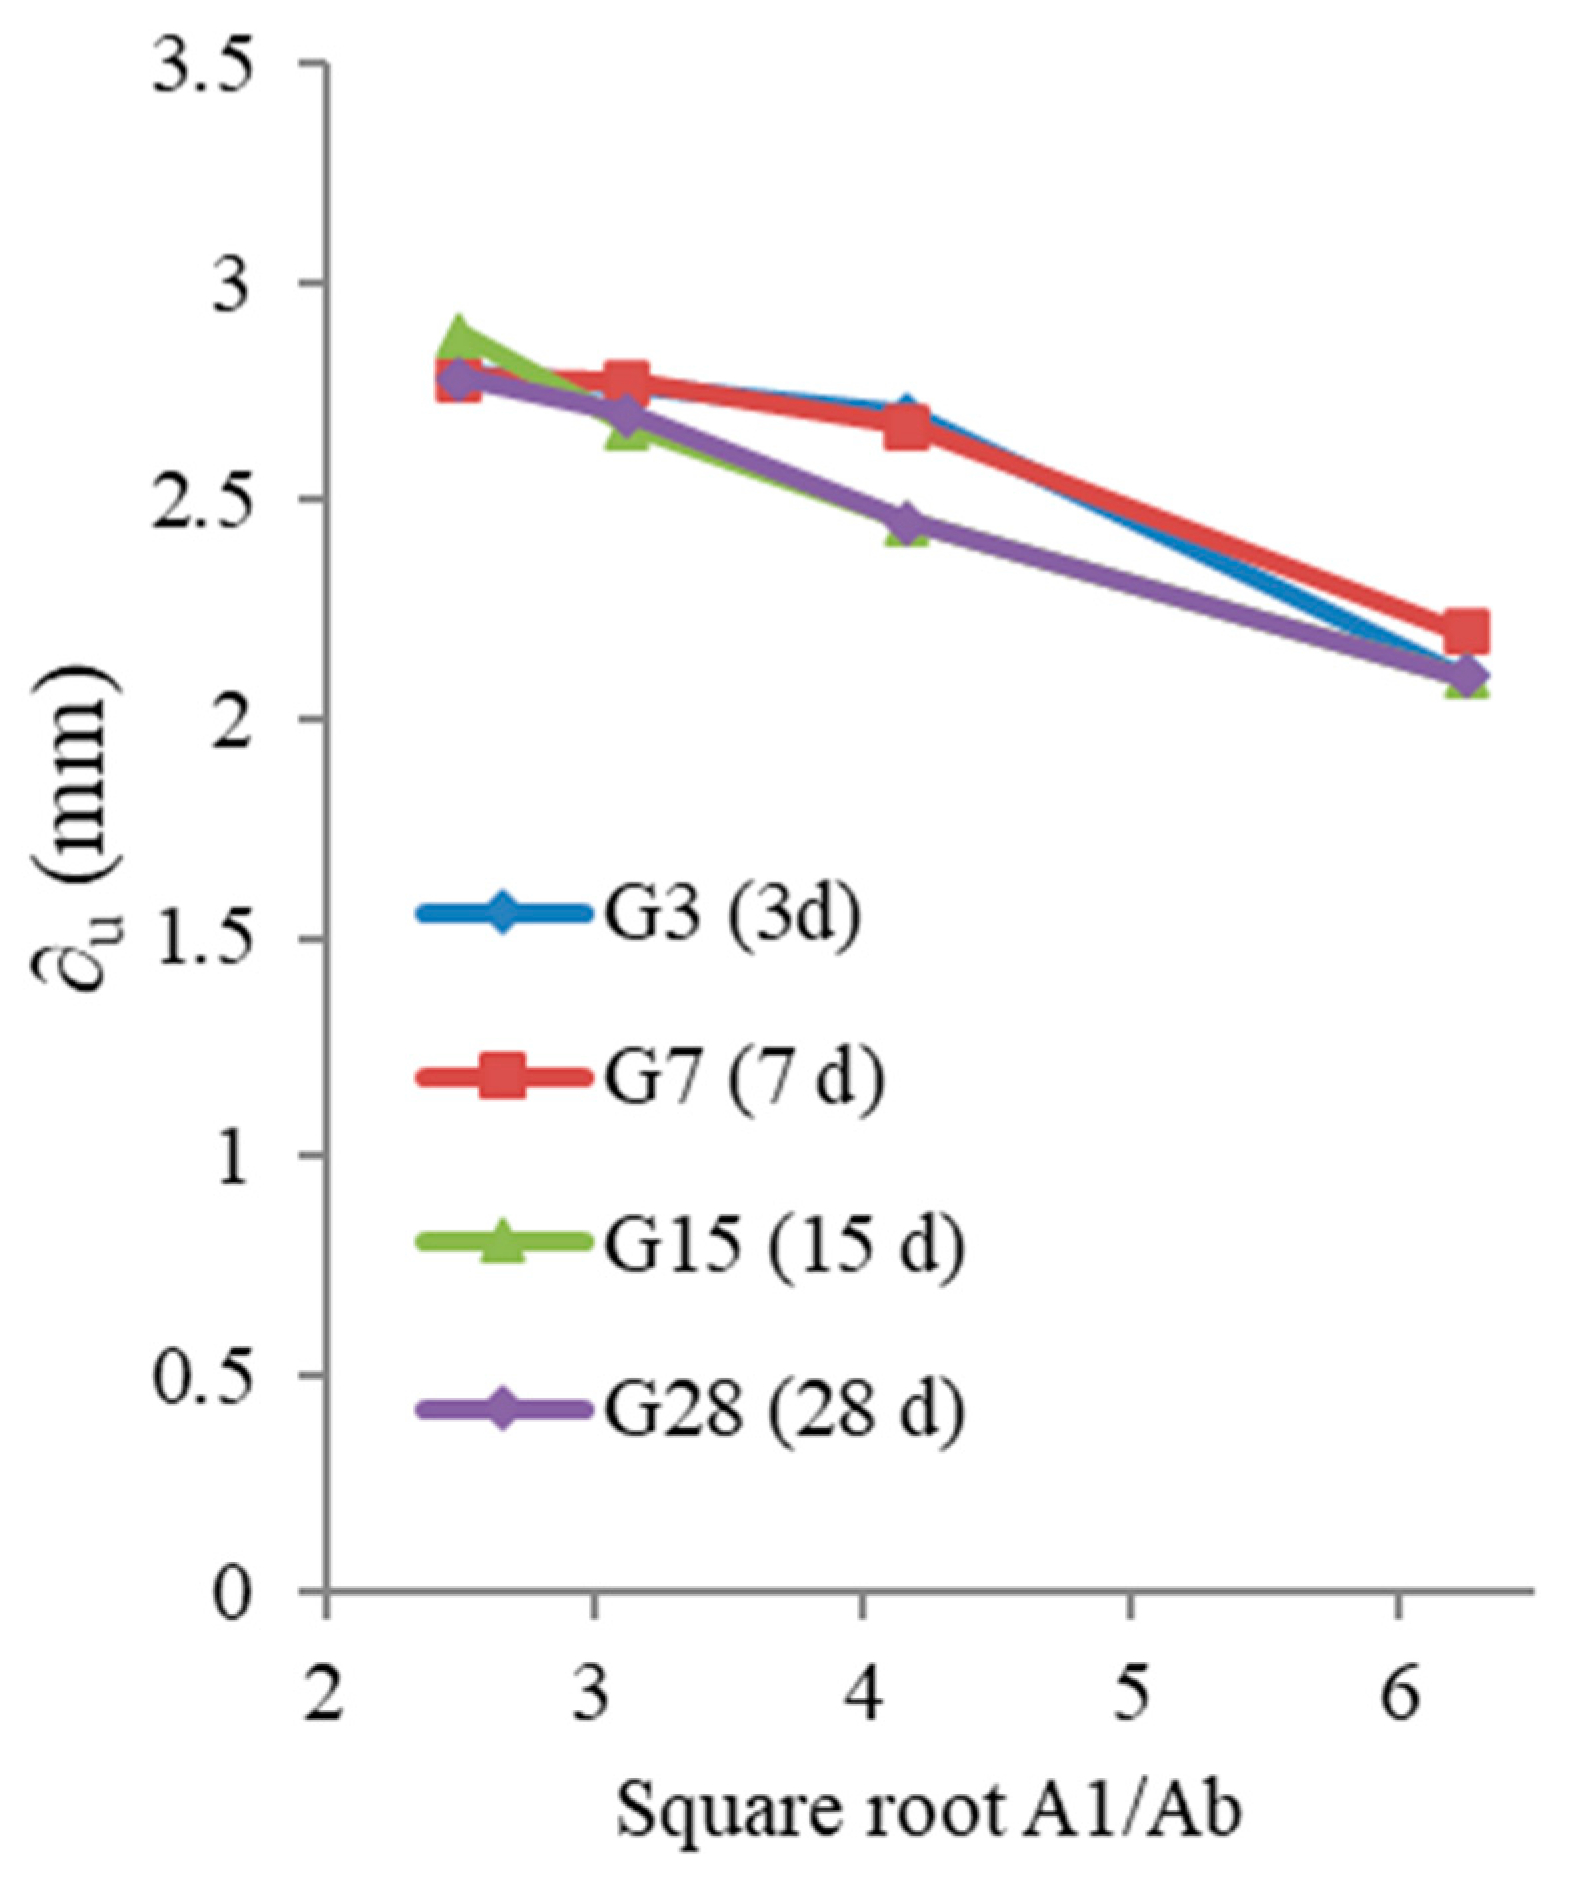
3.2.4. Ultimate Deformation
Effect of Local Area Aspect Ratio (A1/Ab)
Effect of Concrete Age
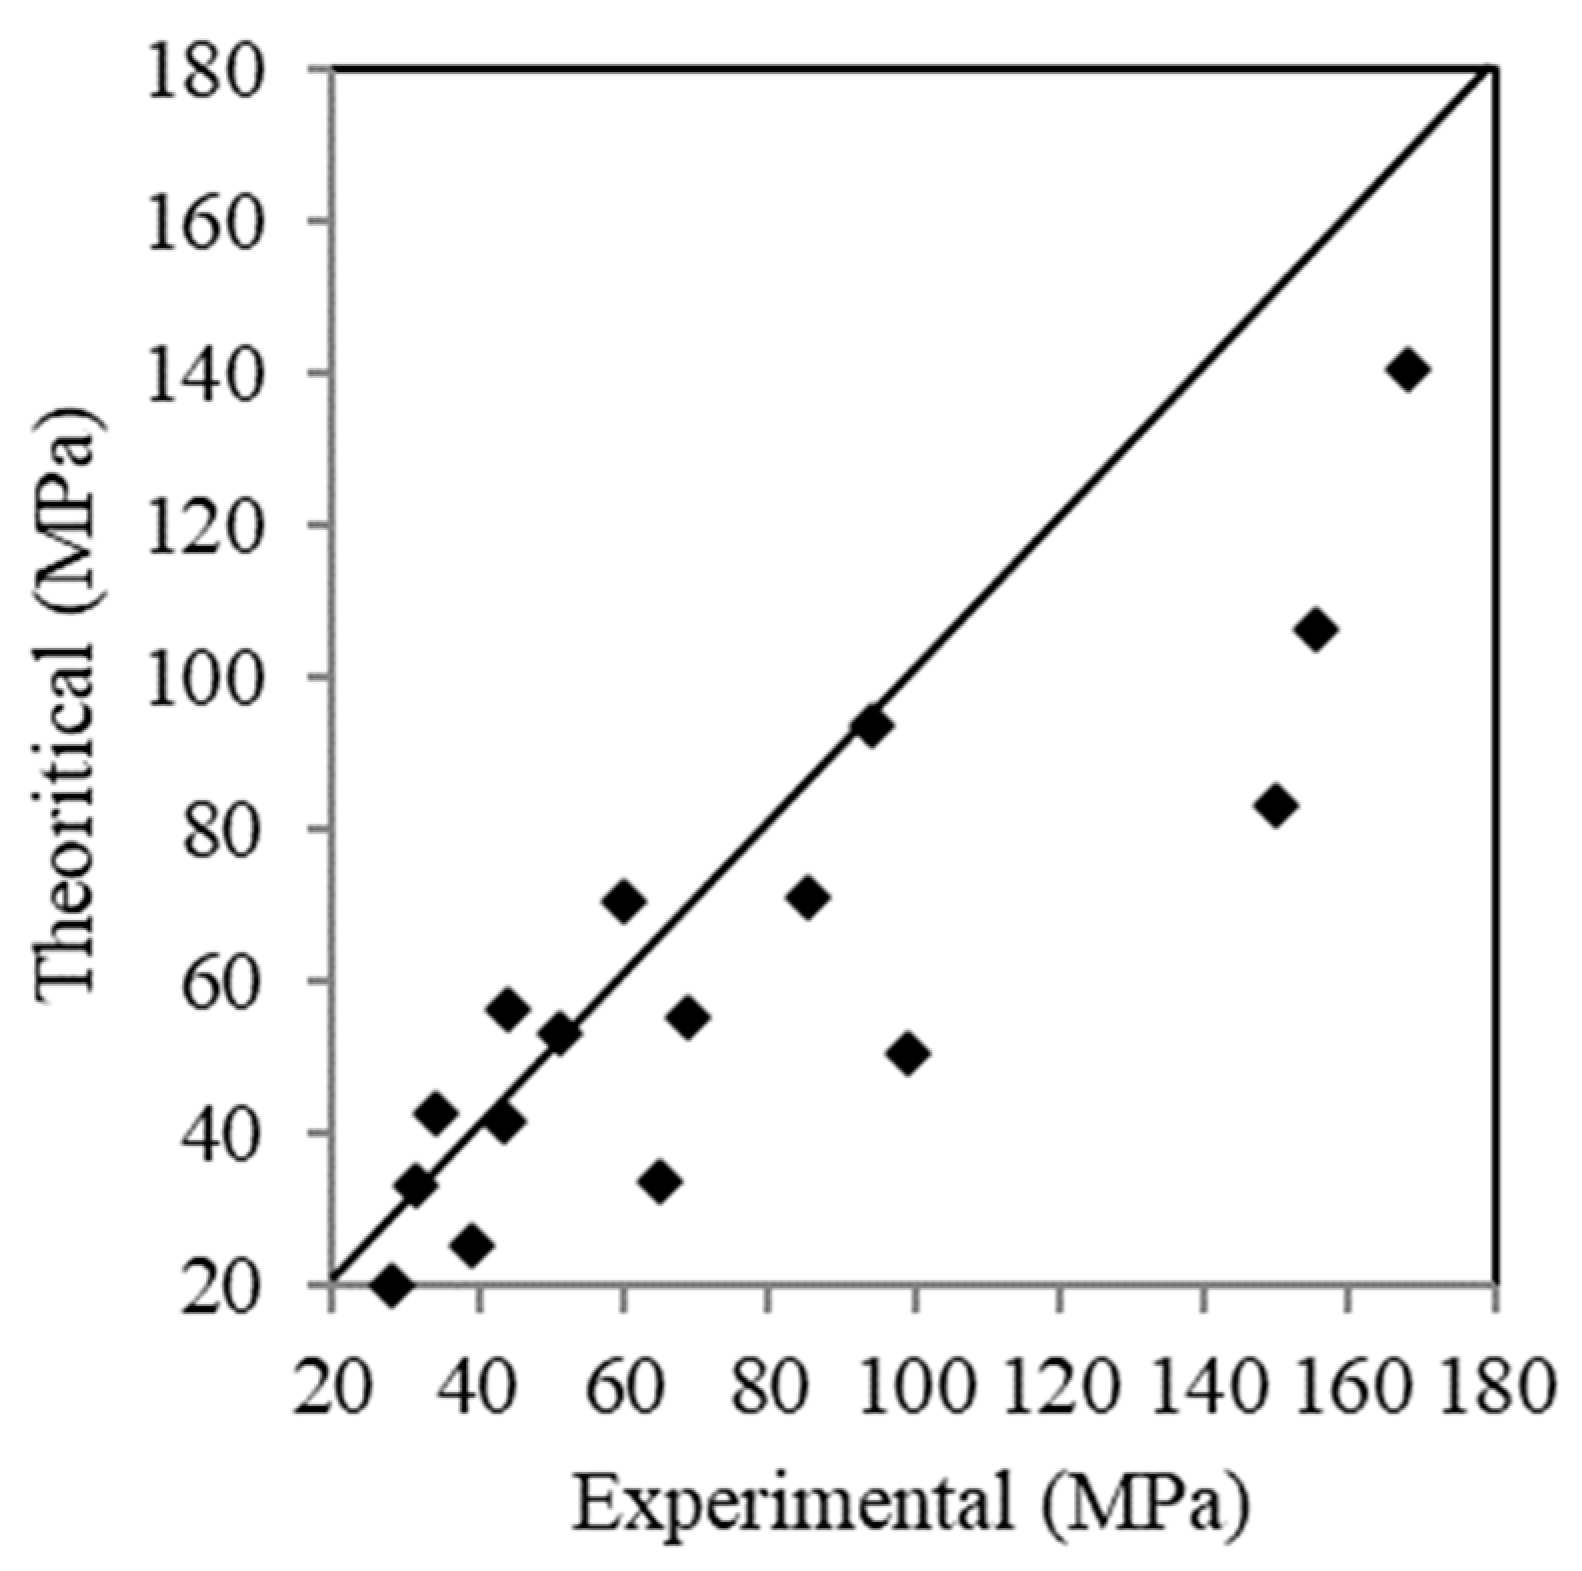
4. Proposed Formulas
5. Conclusions
- Compared to 3 days-concrete, the compressive strength increased by 65, 110 and 178% while the tension strength increased by 94, 151 and 244% when the concrete age climbed to 7, 15 and 28 days, respectively.
- The concrete samples failed due to concrete splitting near the contact bearing area’s outer border.
- The bearing stress–plate slip curve of the samples with a small plate area, such as 40 mm, showed the highest bearing capacity values and the least deformations. As A1/Ab increased, the sample resisted higher bearing stresses.
- At the same level of the bearing plate area, the bearing stress of the samples having high age was higher than that of the samples having little age.
- At concrete age equals 3 days, when the increased from 2.5 to 3.13, 4.17, and 6.25, the ultimate bearing strength of the samples increased by 38.79, 131.5, and 253.13%, respectively. At all concrete ages, as the increased, the ultimate bearing strength of the samples improved more.
- When the concrete age of the samples climbed from 3 to 7, 15 and 28 days, the ultimate bearing strength improved by 51 %, 56.5 %, and 69.5 % at equals 6.25. Additionally, it was found that as the concrete age of the samples increased, the ultimate bearing strength whatever is varied.
- A new equation was proposed to be able to predict the bearing strength of the concrete, taking into account the effect of the age of the concrete and the ratio .
Author Contributions
Funding
Data Availability Statement
Acknowledgments
Conflicts of Interest
References
- Lew, H.S.; Reichard, T.W. Mechanical properties of concrete at early ages. ACI J. Proc. 1978, 75, 533–542. [Google Scholar]
- Kim, J.K.; Han, S.H.; Song, Y.C. Effect of temperature and aging on the mechanical properties of concrete: Part I: Experimental results. Cem. Concr. Res. 2002, 32, 1087–1094. [Google Scholar] [CrossRef]
- Kanstad, T.; Hammer, T.A.; Bjøntegaard, Ø.; Sellevold, E.J. Mechanical properties of young concrete: Part II: Determination of model parameters and test program proposals. Mater. Struct. 2003, 36, 226–230. [Google Scholar] [CrossRef]
- Roziere, E.; Cortas, R.; Loukili, A. Tensile behaviour of early age concrete: New methods of investigation. Cem. Concr. Compos. 2015, 55, 153–161. [Google Scholar] [CrossRef]
- Mamand, H.; Chen, J.; Barnett, S.J. Experimental and modelling investigation of mechanical behaviour of ageing concrete. Constr. Build. Mater. 2017, 155, 1138–1146. [Google Scholar] [CrossRef]
- Swaddiwudhipong, S.; Lu, H.-R.; Wee, T.-H. Direct tension test and tensile strain capacity of concrete at early age. Cem. Concr. Res. 2003, 33, 2077–2084. [Google Scholar]
- Niyogi, S.K. Bearing strength of concrete—Geometric variations. J. Struct. Div. 1973, 99, 1471–1490. [Google Scholar]
- Niyogi, S.K. Bearing strength of concrete-support, mix, size effect. J. Struct. Div. 1974, 100, 1685–1702. [Google Scholar]
- Breen, J.E.; Burdet, O.; Roberts, C.; Sanders, D.; Wollmann, G. Anchorage Zone Reinforcement for Post-Tensioned Concrete Girders; Transportation Research Board, National Research Council: Washington, DC, USA, 1994; Volume 356. [Google Scholar]
- Haroon, S.; Yazdani, N.; Tawfiq, K. Posttensioned anchorage zone enhancement with fiber-reinforced concrete. J. Bridge Eng. 2006, 11, 566–572. [Google Scholar] [CrossRef]
- Bonetti, R. Ultimate Strength of the Local Zone in Load Transfer Tests. PhD Thesis, Virginia Polytechnic Institute and State University, Blacksburg, VA, USA, 2005. [Google Scholar]
- Liu, Y.Y.; Guan, J.G.; Wang, C.Z. Bearing strength of concrete and its failure mechanism. J. China Civil. Eng. 1985, 18, 53–65. [Google Scholar] [CrossRef]
- Cao, S.Y.; Yang, X.K. Working mechanism and strength theory of concrete under local pressure. J. Harbin Coll. Arch. Eng. 1982, 3, 44–53. [Google Scholar]
- GB 50010-2010; Code for Design of Concrete Structures. The Standards Press of China: Beijing, China, 2015.
- ACI 318-14; Building Code Requirements for Structural Concrete. American Concrete Institute: Farmington Hills, MI, USA, 2014.
- Li, S.; Zheng, W.Z.; Zhou, W.; Fan, M.M.; Gai, L.Q. Analysis of actual confinement provided by high-strength steel spirals in reactive powder concrete of anchorage zones. Struct. Concr. 2021, 22, 3526–3543. [Google Scholar] [CrossRef]
- Li, S.; Zheng, W.Z.; Zhou, W.; Jiang, Z.S.; Wang, Y. Experiment and validation of local bearing capacity for reactive powder concrete confined with high-strength spirals. Arch. Civ. Mech. Eng. 2022, 22, 40. [Google Scholar] [CrossRef]
- Marchao, C.; Lúcio, V.; Ganz, H.R. Efficiency of the confinement reinforcement in anchorage zones of posttensioning tendons. Struct. Concr. 2019, 20, 1182–1198. [Google Scholar] [CrossRef]
- Miao, T.M.; Zheng, W.Z. Local bearing capacity of concrete under the combined action of pressure force and bond stress. Constr. Build. Mater. 2019, 226, 152–161. [Google Scholar]
- Yu, K.Y.; Jia, M.J.; Yang, Y.Z.; Liu, Y.S. A clean strategy of concrete curing in cold climate: Solar thermal energy storage based on phase change material. Appl. Energy 2023, 331, 120375. [Google Scholar] [CrossRef]
- Yu, K.Y.; Liu, Y.S.; Jia, M.J.; Wang, C.; Yang, Y.Z. Thermal energy storage cement mortar containing encapsulated hydrated salt/fly ash cenosphere phase change material: Thermo-mechanical properties and energy saving analysis. J. Energy Storage 2022, 51, 104388. [Google Scholar] [CrossRef]
- Fayed, S.; Mansour, W.; Tawfik, T.A. Bearing behavior of steel fiber reinforced recycled aggregate concrete blocks. Structures 2023, 57, 105249. [Google Scholar]
- Fayed, S.; Madenci, E.; Özkiliç, Y.O.; Tawfik, T.A. Effect of Block Size on Bearing Strength of Steel Fiber-Reinforced Recycled Aggregate Concrete. Arab. J. Sci. Eng. 2024, 49, 5287–5303. [Google Scholar]
- Yehia, S.A.; Fayed, S.; Shahin, R.I.; Ramadan, B.A. Effect of existing holes under the loading plate on local compressive strength of plain concrete blocks: An experimental and numerical study. Case Stud. Constr. Mater. 2024, 21, e03937. [Google Scholar]
- ECP 203-2018; Egyptian Code for the Design and Construction of Concrete Structures. Egyptian Code Committee: Giza, Egypt, 2018; Tests Guide, Part II.
- Wang, S.; Lin, C.; Li, S.; Lu, Y. Compressive performance and analytical modeling of early strength seawater sea sand engineered cementitious composites. J. Build. Eng. 2024, 90, 109282. [Google Scholar]
- Al-Sahawneh, E.I.; Amjad, A.Y.; Hassan, R.H.; Khair Al-Deen, B. A proposed model at failure stage to assess the bearing stress of normal weight concrete. Int. J. Eng. Res. Appl. 2013, 3, 793–802. [Google Scholar]
- Rao, C.K.; Swamy, R.N. Bearing strength of steel fibre reinforced concrete. Build. Sci. 1974, 9, 263–268. [Google Scholar]
- Zhou, W.; Hu, H.; Zheng, W. Bearing capacity of reactive powder concrete reinforced by steel fibers. Constr. Build. Mater. 2013, 48, 1179–1186. [Google Scholar] [CrossRef]
- Zain, M.R.M.; Yahya, N.A. Experimental study on bearing strength of concrete blocks under concentric compression load. Pertanika J. Sci. Technol. 2017, 25, 67–76. [Google Scholar]
- Shafighfard, T.; Kazemi, F.; Asgarkhani, N.; Yoo, D.-Y. Machine-learning methods for estimating compressive strength of high-performance alkali-activated concrete. Eng. Appl. Artif. Intell. 2024, 136, 109053. [Google Scholar] [CrossRef]


| Basalt Dolomite | Cement | Sand | Water |
|---|---|---|---|
| 1280 | 300 | 650 | 150 |
| Studied Parameter | Group | Specimen | Concrete Age (Day) | Pedestal Area A1 (mm) | Plate Area Ab = b × b (mm) | Concrete Cover c (mm) | c/b | ||
|---|---|---|---|---|---|---|---|---|---|
| Bearing concentration level (A1/Ab) at age = 3 day | G3 | 3d4p | 3 | 250 × 250 | 40 × 40 | 39.06 | 6.25 | 105 | 2.63 |
| 3d6p | 3 | 250 × 250 | 60 × 60 | 17.36 | 4.17 | 95 | 1.58 | ||
| 3d8p | 3 | 250 × 250 | 80 × 80 | 9.77 | 3.13 | 85 | 1.06 | ||
| 3d10p | 3 | 250 × 250 | 100 × 100 | 6.25 | 2.50 | 75 | 0.75 | ||
| Bearing concentration level (A1/Ab) at age = 7 day | G7 | 7d4p | 7 | 250 × 250 | 40 × 40 | 39.06 | 6.25 | 105 | 2.63 |
| 7d6p | 7 | 250 × 250 | 60 × 60 | 17.36 | 4.17 | 95 | 1.58 | ||
| 7d8p | 7 | 250 × 250 | 80 × 80 | 9.77 | 3.13 | 85 | 1.06 | ||
| 7d10p | 7 | 250 × 250 | 100 × 100 | 6.25 | 2.50 | 75 | 0.75 | ||
| Bearing concentration level (A1/Ab) at age = 15 day | G15 | 15d4p | 15 | 250 × 250 | 40 × 40 | 39.06 | 6.25 | 105 | 2.63 |
| 15d6p | 15 | 250 × 250 | 60 × 60 | 17.36 | 4.17 | 95 | 1.58 | ||
| 15d8p | 15 | 250 × 250 | 80 × 80 | 9.77 | 3.13 | 85 | 1.06 | ||
| 15d10p | 15 | 250 × 250 | 100 × 100 | 6.25 | 2.50 | 75 | 0.75 | ||
| Bearing concentration level (A1/Ab) at age = 28 day | G28 | 28d4p | 28 | 250 × 250 | 40 × 40 | 39.06 | 6.25 | 105 | 2.63 |
| 28d6p | 28 | 250 × 250 | 60 × 60 | 17.36 | 4.17 | 95 | 1.58 | ||
| 28d8p | 28 | 250 × 250 | 80 × 80 | 9.77 | 3.13 | 85 | 1.06 | ||
| 28d10p | 28 | 250 × 250 | 100 × 100 | 6.25 | 2.50 | 75 | 0.75 |
| Sample ID | Compressive Strength fc (MPa) | Increase in the fc (%) | Tensile Strength fct (MPa) | Increase in the fct (%) |
|---|---|---|---|---|
| 3d | 11.2 | 0.00 | 0.84 | 0.00 |
| 7d | 18.5 | 65.18 | 1.63 | 94.05 |
| 15d | 23.6 | 110.71 | 2.11 | 151.19 |
| 28d | 31.2 | 178.57 | 2.89 | 244.05 |
| Group | Specimen | Concrete Age (Day) | c/b | fbu (Mpa) | Gain in fbu (%) | |
|---|---|---|---|---|---|---|
| G3 | 3d10p | 3 | 2.5 | 0.75 | 28.1 | 0.00 |
| 3d8p | 3 | 3.13 | 1.06 | 39 | 38.79 | |
| 3d6p | 3 | 4.17 | 1.58 | 65.05 | 131.49 | |
| 3d4p | 3 | 6.25 | 2.63 | 99.23 | 253.13 | |
| G7 | 7d10p | 7 | 2.5 | 0.75 | 31.2 | 0.00 |
| 7d8p | 7 | 3.13 | 1.06 | 43.3 | 38.78 | |
| 7d6p | 7 | 4.17 | 1.58 | 69 | 121.15 | |
| 7d4p | 7 | 6.25 | 2.63 | 150 | 380.77 | |
| G15 | 15d10p | 15 | 2.5 | 0.75 | 34.1 | 0.00 |
| 15d8p | 15 | 3.13 | 1.06 | 51.2 | 50.15 | |
| 15d6p | 15 | 4.17 | 1.58 | 85.2 | 149.85 | |
| 15d4p | 15 | 6.25 | 2.63 | 155.3 | 355.43 | |
| G28 | 28d10p | 28 | 2.5 | 0.75 | 44.2 | 0.00 |
| 28d8p | 28 | 3.13 | 1.06 | 60 | 35.75 | |
| 28d6p | 28 | 4.17 | 1.58 | 94.2 | 113.12 | |
| 28d4p | 28 | 6.25 | 2.63 | 168.2 | 280.54 |
| Group | Specimen | Concrete Age (Day) | c/b | fbu (Mpa) | Gain in fbu (%) | |
|---|---|---|---|---|---|---|
| GI; plate 40 mm | 3d4p | 3 | 6.25 | 2.63 | 99.23 | 0.00 |
| 7d4p | 7 | 6.25 | 2.63 | 150 | 51.16 | |
| 15d4p | 15 | 6.25 | 2.63 | 155.3 | 56.51 | |
| 28d4p | 28 | 6.25 | 2.63 | 168.2 | 69.51 | |
| GII; plate 60 mm | 3d6p | 3 | 4.17 | 1.58 | 65.05 | 0.00 |
| 7d6p | 7 | 4.17 | 1.58 | 69 | 6.07 | |
| 15d6p | 15 | 4.17 | 1.58 | 85.2 | 30.98 | |
| 28d6p | 28 | 4.17 | 1.58 | 94.2 | 44.81 | |
| GIII; plate 80 mm | 3d8p | 3 | 3.13 | 1.06 | 39 | 0.00 |
| 7d8p | 7 | 3.13 | 1.06 | 43.3 | 11.03 | |
| 15d8p | 15 | 3.13 | 1.06 | 51.2 | 31.28 | |
| 28d8p | 28 | 3.13 | 1.06 | 60 | 53.85 | |
| GV; plate 100 mm | 3d10p | 3 | 2.5 | 0.75 | 28.1 | 0.00 |
| 7d10p | 7 | 2.5 | 0.75 | 31.2 | 11.03 | |
| 15d10p | 15 | 2.5 | 0.75 | 34.1 | 21.35 | |
| 28d10p | 28 | 2.5 | 0.75 | 44.2 | 57.30 |
| Specimen | fc (MPa) | fbu,E (MPa) | Concrete age T (day) | fbu,ACI (MPa) | fbu,E/fbu,ACI | |
|---|---|---|---|---|---|---|
| 3d10p | 11.2 | 28.1 | 3 | 2.5 | 20.23 | 1.39 |
| 3d8p | 11.2 | 39 | 3 | 3.13 | 25.33 | 1.54 |
| 3d6p | 11.2 | 65.05 | 3 | 4.17 | 33.74 | 1.93 |
| 3d4p | 11.2 | 99.23 | 3 | 6.25 | 50.58 | 1.96 |
| 7d10p | 18.5 | 31.2 | 7 | 2.5 | 33.42 | 0.93 |
| 7d8p | 18.5 | 43.3 | 7 | 3.13 | 41.84 | 1.03 |
| 7d6p | 18.5 | 69 | 7 | 4.17 | 55.74 | 1.24 |
| 7d4p | 18.5 | 150 | 7 | 6.25 | 83.54 | 1.80 |
| 15d10p | 23.6 | 34.1 | 15 | 2.5 | 42.63 | 0.80 |
| 15d8p | 23.6 | 51.2 | 15 | 3.13 | 53.37 | 0.96 |
| 15d6p | 23.6 | 85.2 | 15 | 4.17 | 71.10 | 1.20 |
| 15d4p | 23.6 | 155.3 | 15 | 6.25 | 106.57 | 1.46 |
| 28d10p | 31.2 | 44.2 | 28 | 2.5 | 56.36 | 0.78 |
| 28d8p | 31.2 | 60 | 28 | 3.13 | 70.56 | 0.85 |
| 28d6p | 31.2 | 94.2 | 28 | 4.17 | 94.00 | 1.00 |
| 28d4p | 31.2 | 168.2 | 28 | 6.25 | 140.89 | 1.19 |
| Specimen | fc (MPa) | fbu,E (MPa) | Concrete age T (day) | fbu,th (MPa) | fbu,E/fbu,th | |
|---|---|---|---|---|---|---|
| 3d10p | 11.2 | 28.1 | 3 | 2.5 | 28.19 | 1.00 |
| 3d8p | 11.2 | 39 | 3 | 3.13 | 38.77 | 0.99 |
| 3d6p | 11.2 | 65.05 | 3 | 4.17 | 56.25 | 0.86 |
| 3d4p | 11.2 | 99.23 | 3 | 6.25 | 91.19 | 0.92 |
| 7d10p | 18.5 | 31.2 | 7 | 2.5 | 40.82 | 1.31 |
| 7d8p | 18.5 | 43.3 | 7 | 3.13 | 58.30 | 1.35 |
| 7d6p | 18.5 | 69 | 7 | 4.17 | 87.16 | 1.26 |
| 7d4p | 18.5 | 150 | 7 | 6.25 | 144.88 | 0.97 |
| 15d10p | 23.6 | 34.1 | 15 | 2.5 | 37.40 | 1.10 |
| 15d8p | 23.6 | 51.2 | 15 | 3.13 | 59.71 | 1.17 |
| 15d6p | 23.6 | 85.2 | 15 | 4.17 | 96.52 | 1.13 |
| 15d4p | 23.6 | 155.3 | 15 | 6.25 | 170.15 | 1.10 |
| 28d10p | 31.2 | 44.2 | 28 | 2.5 | 17.95 | 0.71 |
| 28d8p | 31.2 | 60 | 28 | 3.13 | 47.43 | 0.79 |
| 28d6p | 31.2 | 94.2 | 28 | 4.17 | 96.10 | 1.02 |
| 28d4p | 31.2 | 168.2 | 28 | 6.25 | 193.45 | 1.15 |
Disclaimer/Publisher’s Note: The statements, opinions and data contained in all publications are solely those of the individual author(s) and contributor(s) and not of MDPI and/or the editor(s). MDPI and/or the editor(s) disclaim responsibility for any injury to people or property resulting from any ideas, methods, instructions or products referred to in the content. |
© 2025 by the authors. Licensee MDPI, Basel, Switzerland. This article is an open access article distributed under the terms and conditions of the Creative Commons Attribution (CC BY) license (https://creativecommons.org/licenses/by/4.0/).
Share and Cite
Fayed, S.; El-Zohairy, A.; Salim, H.; Mlybari, E.A.; Bazuhair, R.W.; Ghalla, M. Bearing Strength of Concrete Pedestals Partially Loaded at Early Ages: An Experimental Work Mitigating Failure Risk. Buildings 2025, 15, 1107. https://doi.org/10.3390/buildings15071107
Fayed S, El-Zohairy A, Salim H, Mlybari EA, Bazuhair RW, Ghalla M. Bearing Strength of Concrete Pedestals Partially Loaded at Early Ages: An Experimental Work Mitigating Failure Risk. Buildings. 2025; 15(7):1107. https://doi.org/10.3390/buildings15071107
Chicago/Turabian StyleFayed, Sabry, Ayman El-Zohairy, Hani Salim, Ehab A. Mlybari, Rabeea W. Bazuhair, and Mohamed Ghalla. 2025. "Bearing Strength of Concrete Pedestals Partially Loaded at Early Ages: An Experimental Work Mitigating Failure Risk" Buildings 15, no. 7: 1107. https://doi.org/10.3390/buildings15071107
APA StyleFayed, S., El-Zohairy, A., Salim, H., Mlybari, E. A., Bazuhair, R. W., & Ghalla, M. (2025). Bearing Strength of Concrete Pedestals Partially Loaded at Early Ages: An Experimental Work Mitigating Failure Risk. Buildings, 15(7), 1107. https://doi.org/10.3390/buildings15071107