
The Spatiotemporal Evolution of Buildings’ Carbon Emissions in Siping, a Chinese Industrial City

Abstract
1. Introduction
2. Materials and Methods
2.1. Study Area
2.2. Data Sources
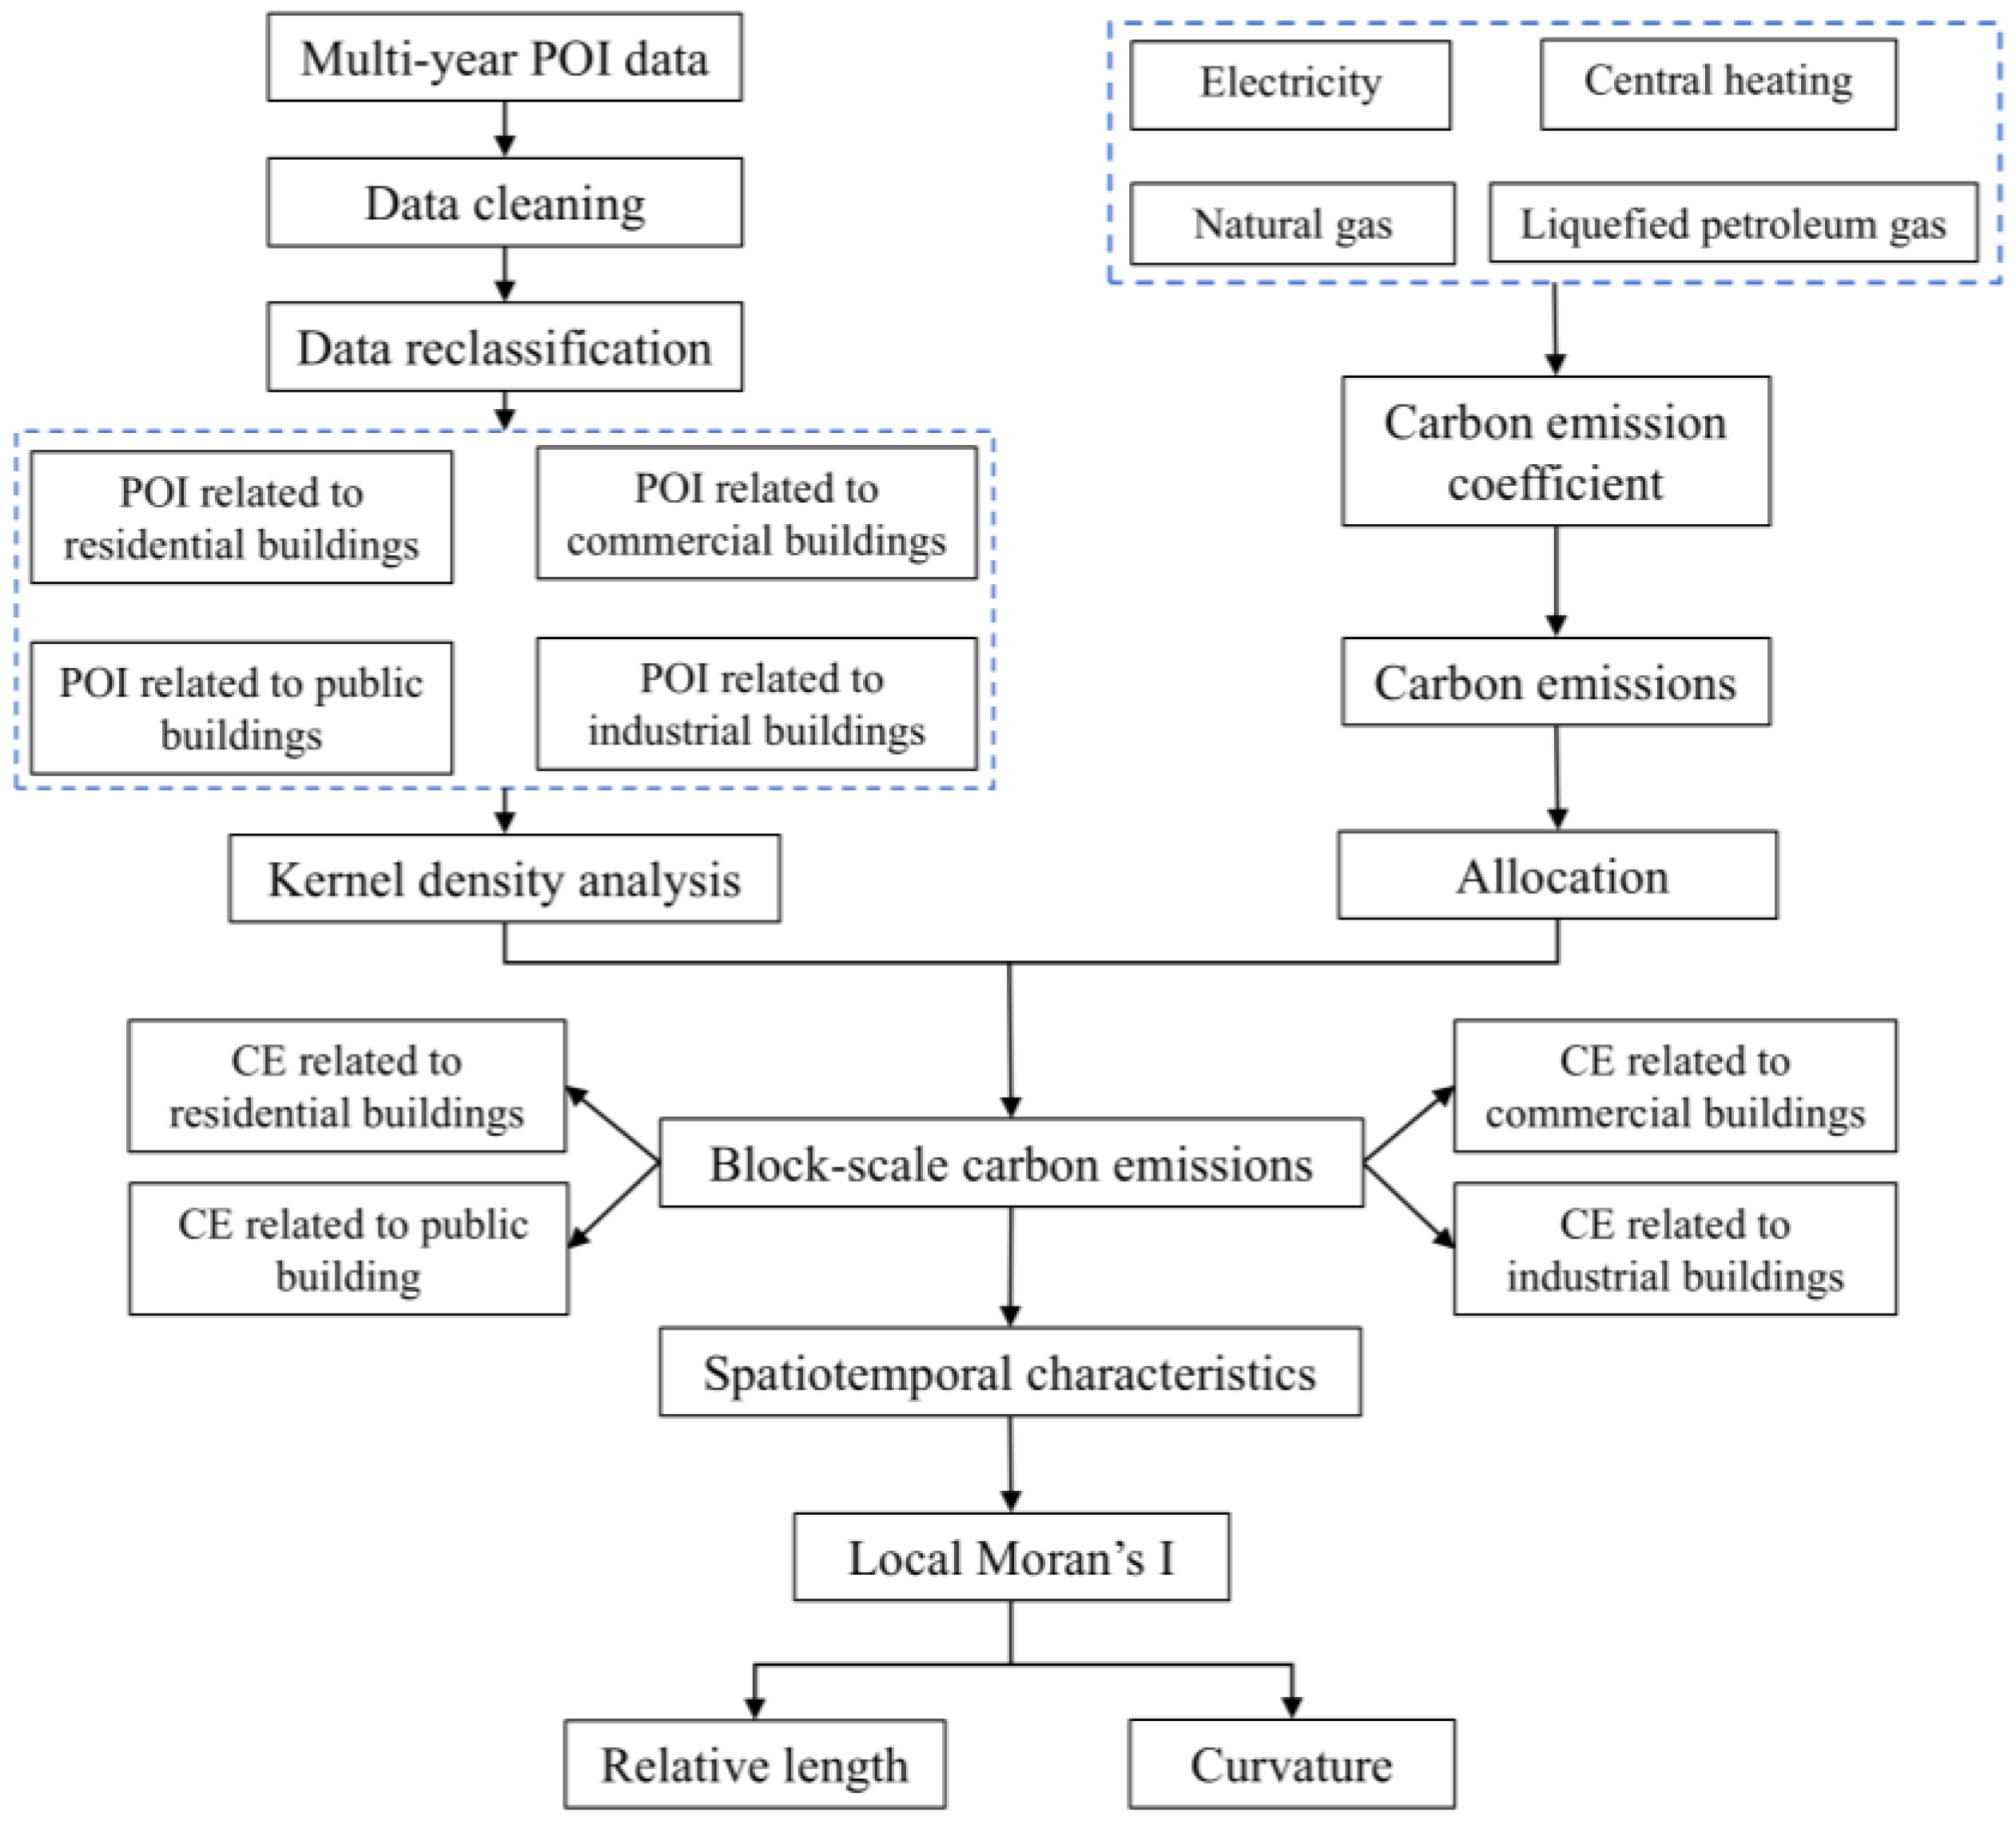
2.3. Methods
2.3.1. POI Data Processing
2.3.2. Carbon Emissions Estimation
- Total carbon emissions
- 2.
- Spatial estimation of carbon emissions
2.3.3. Spatiotemporal Characteristic Analysis
3. Results
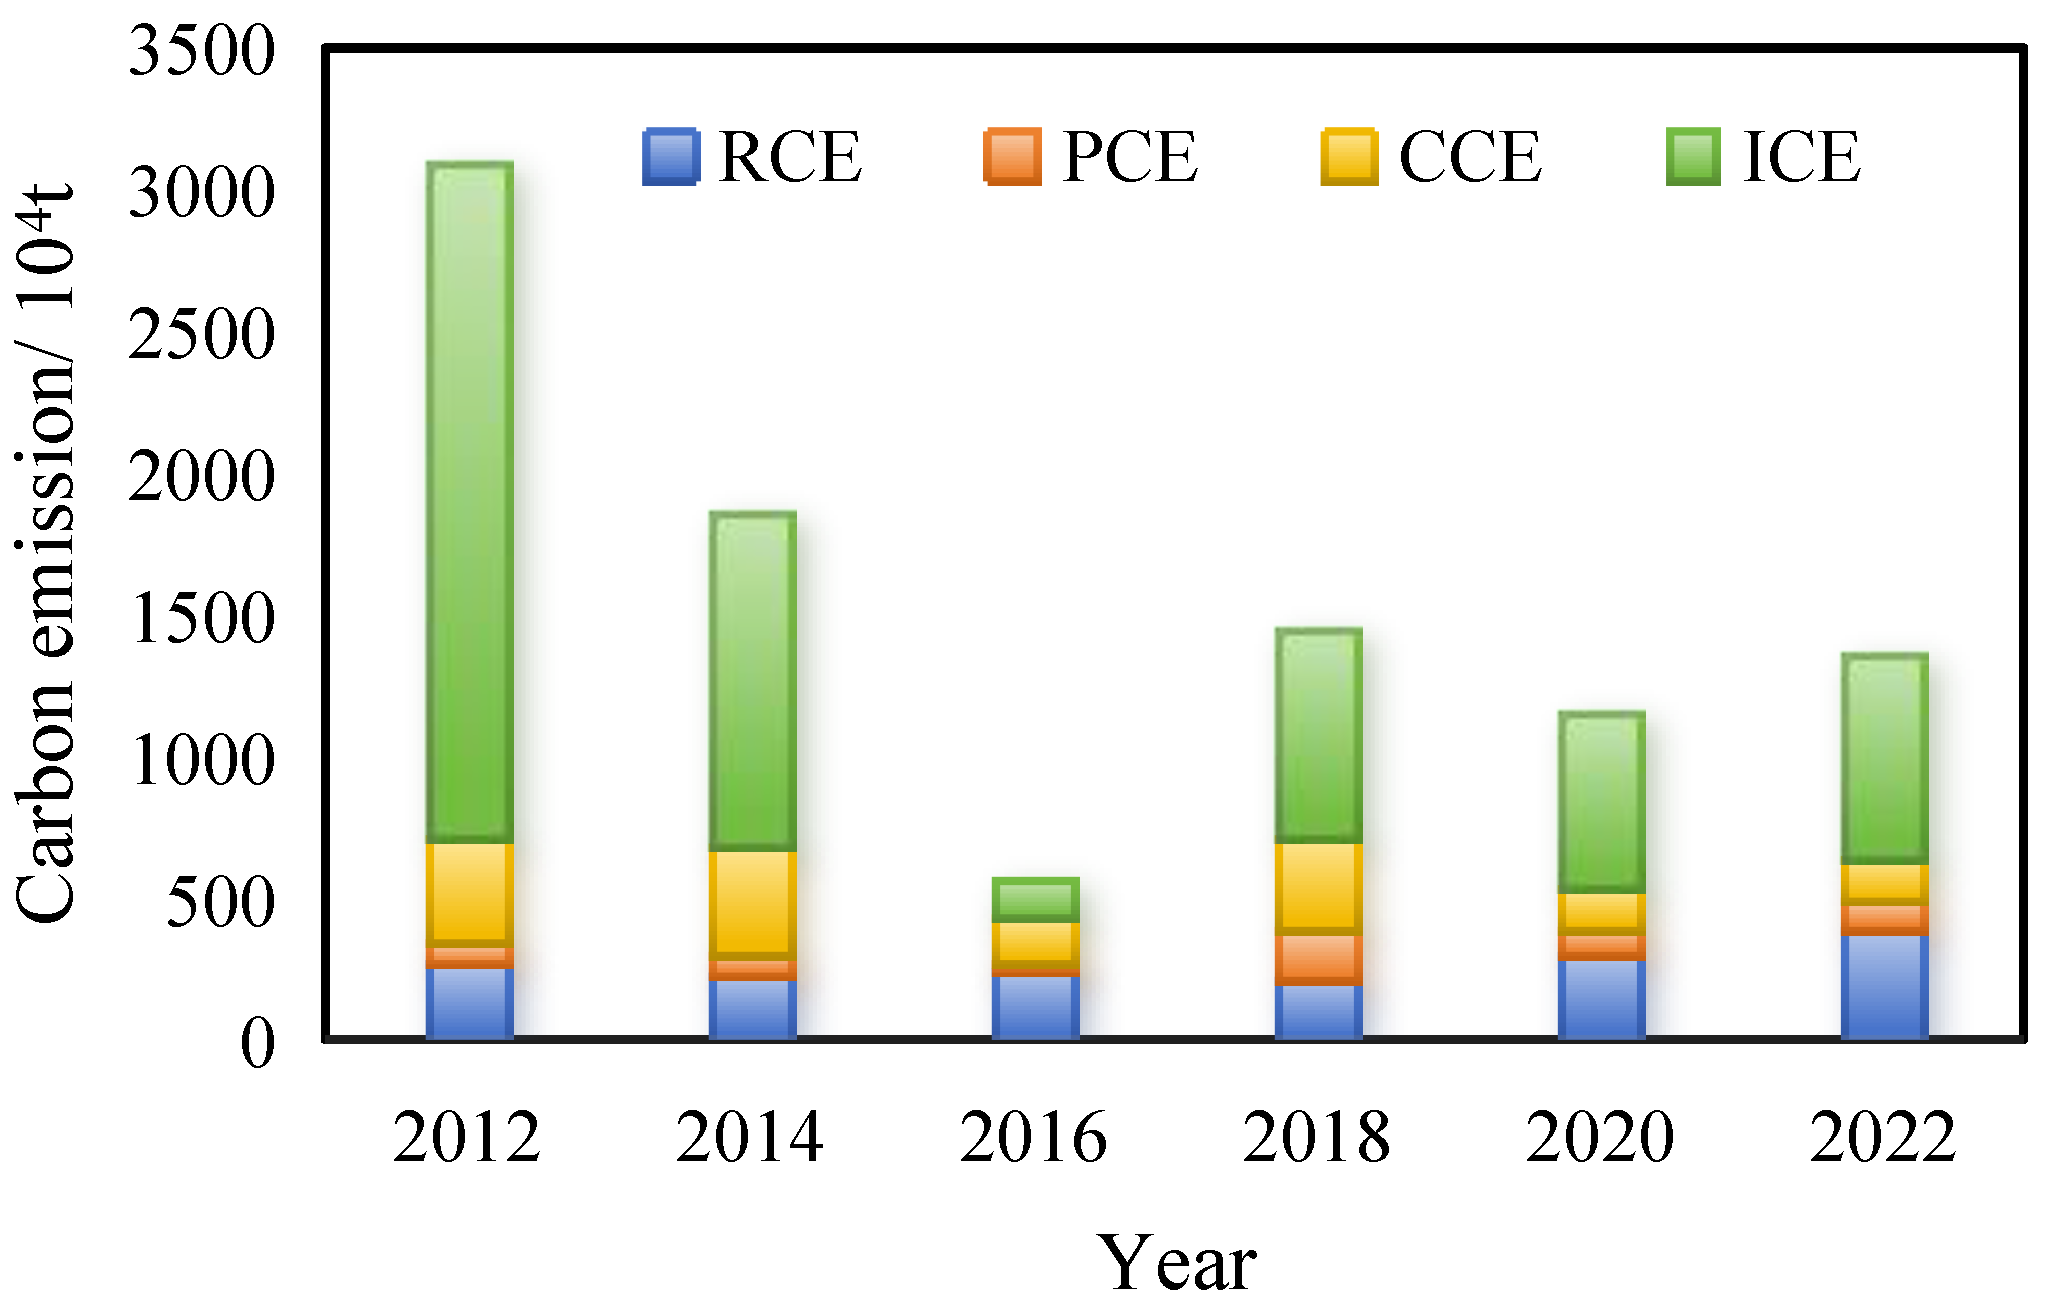
3.1. General Trend of Carbon Emissions in Siping
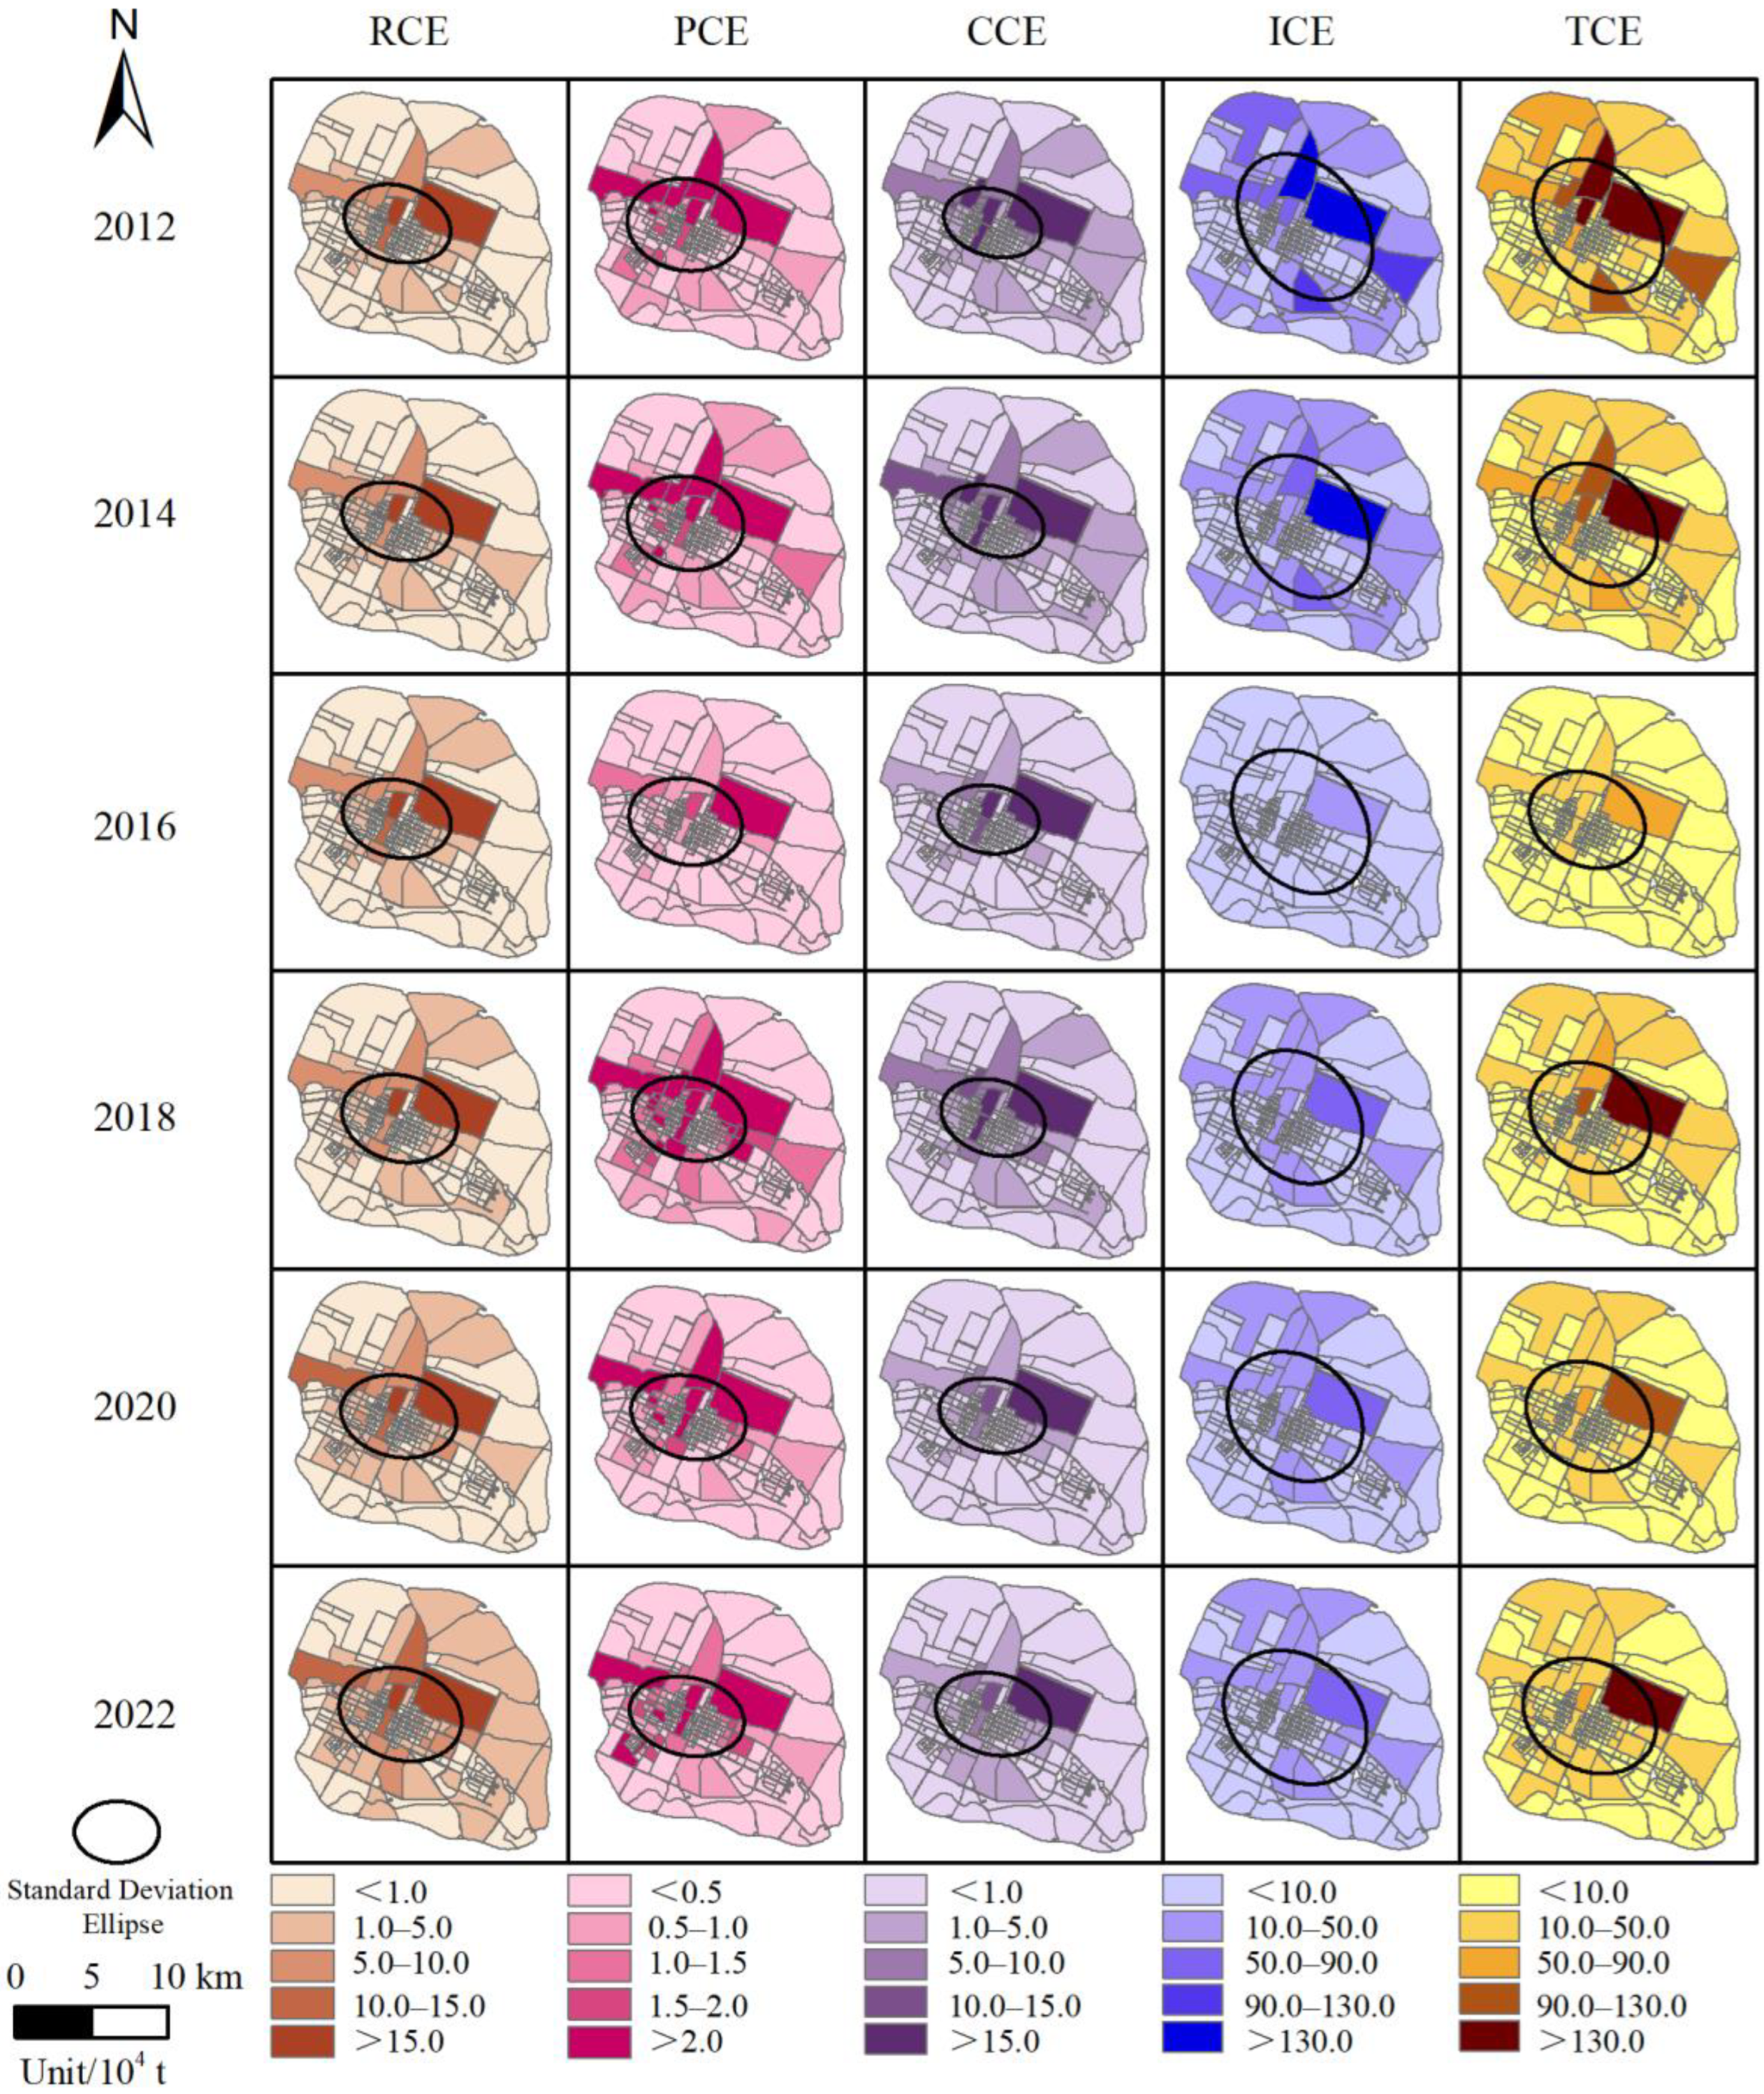
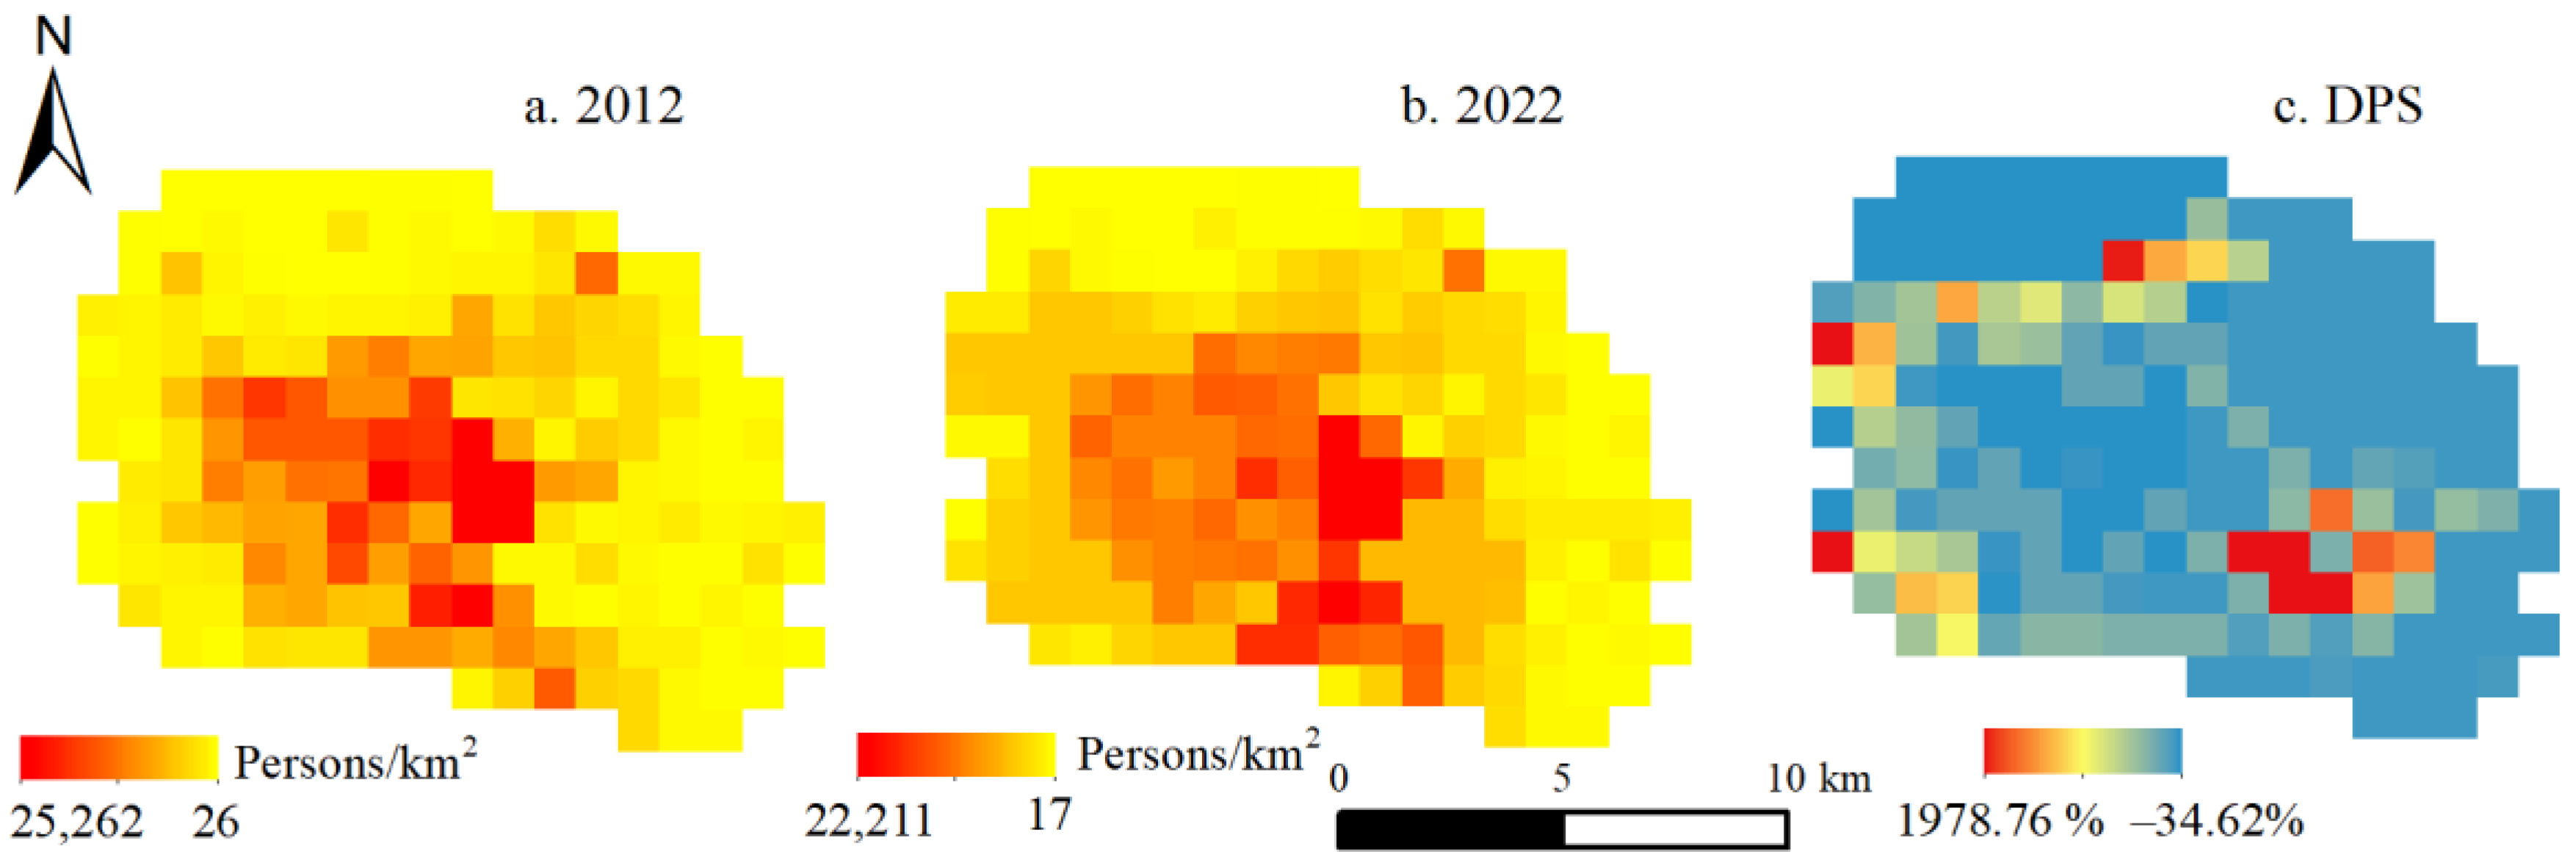
3.2. Spatial and Temporal Characteristics of Carbon Emissions in City Blocks
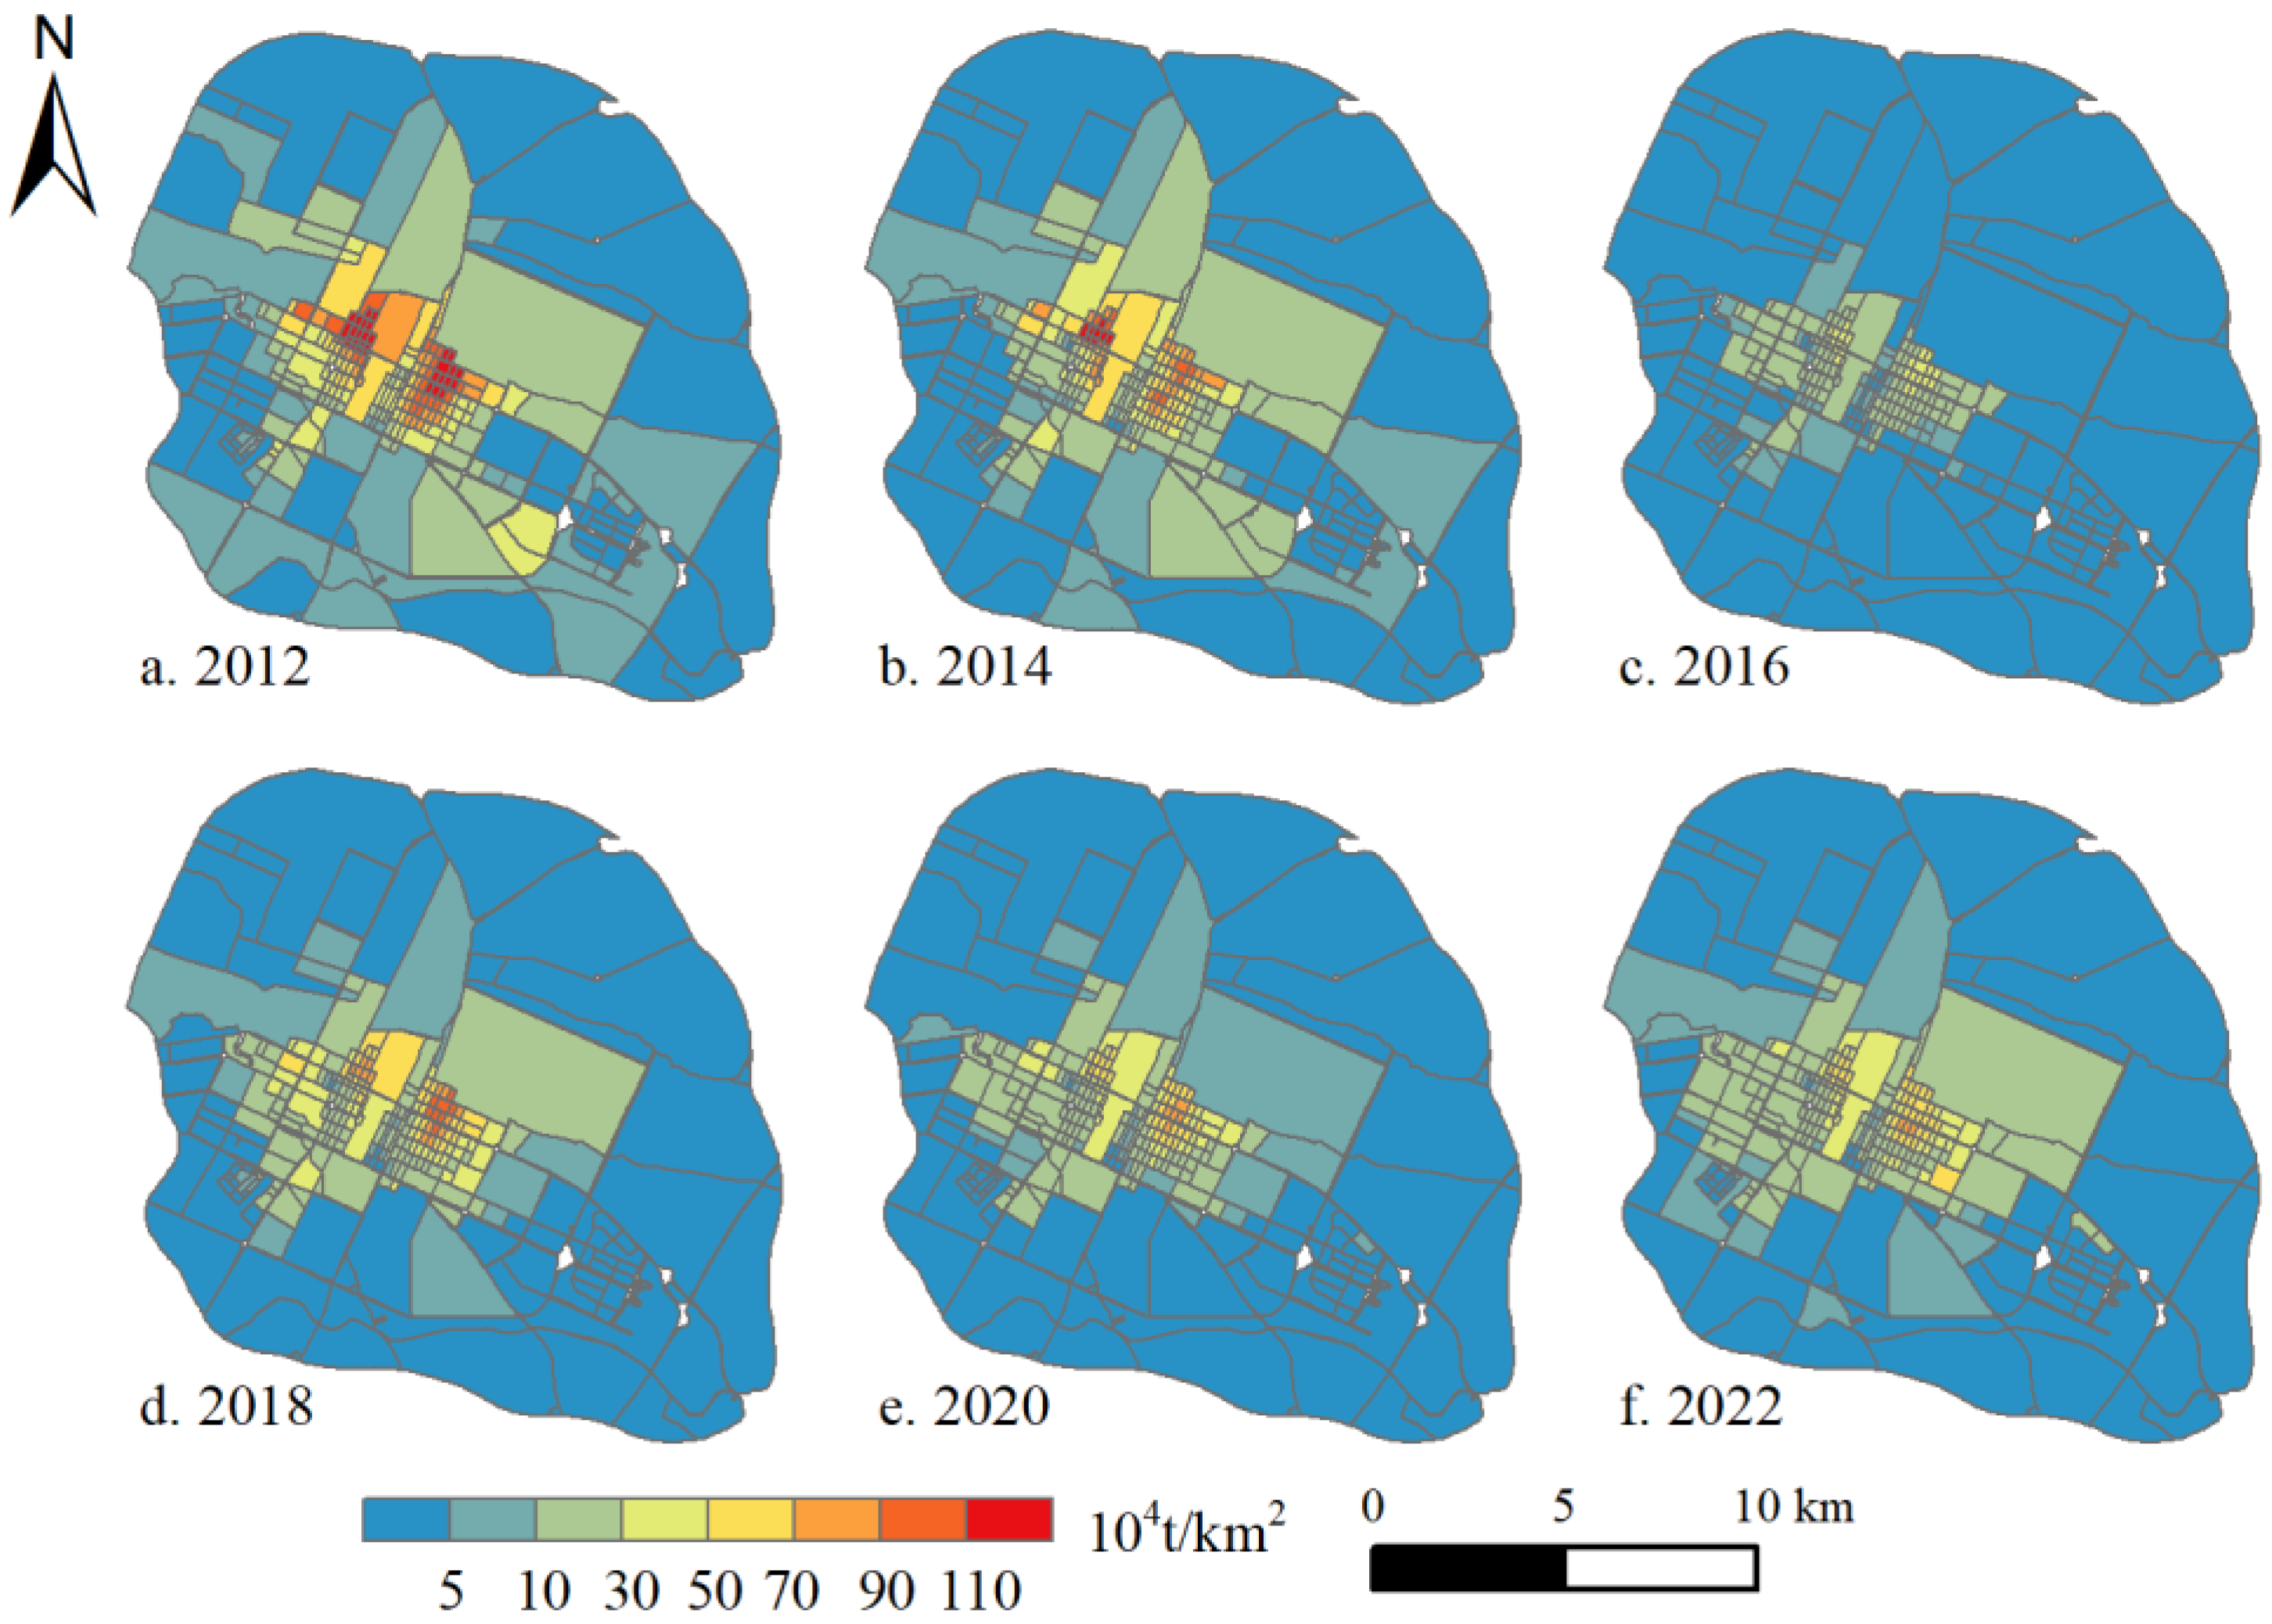
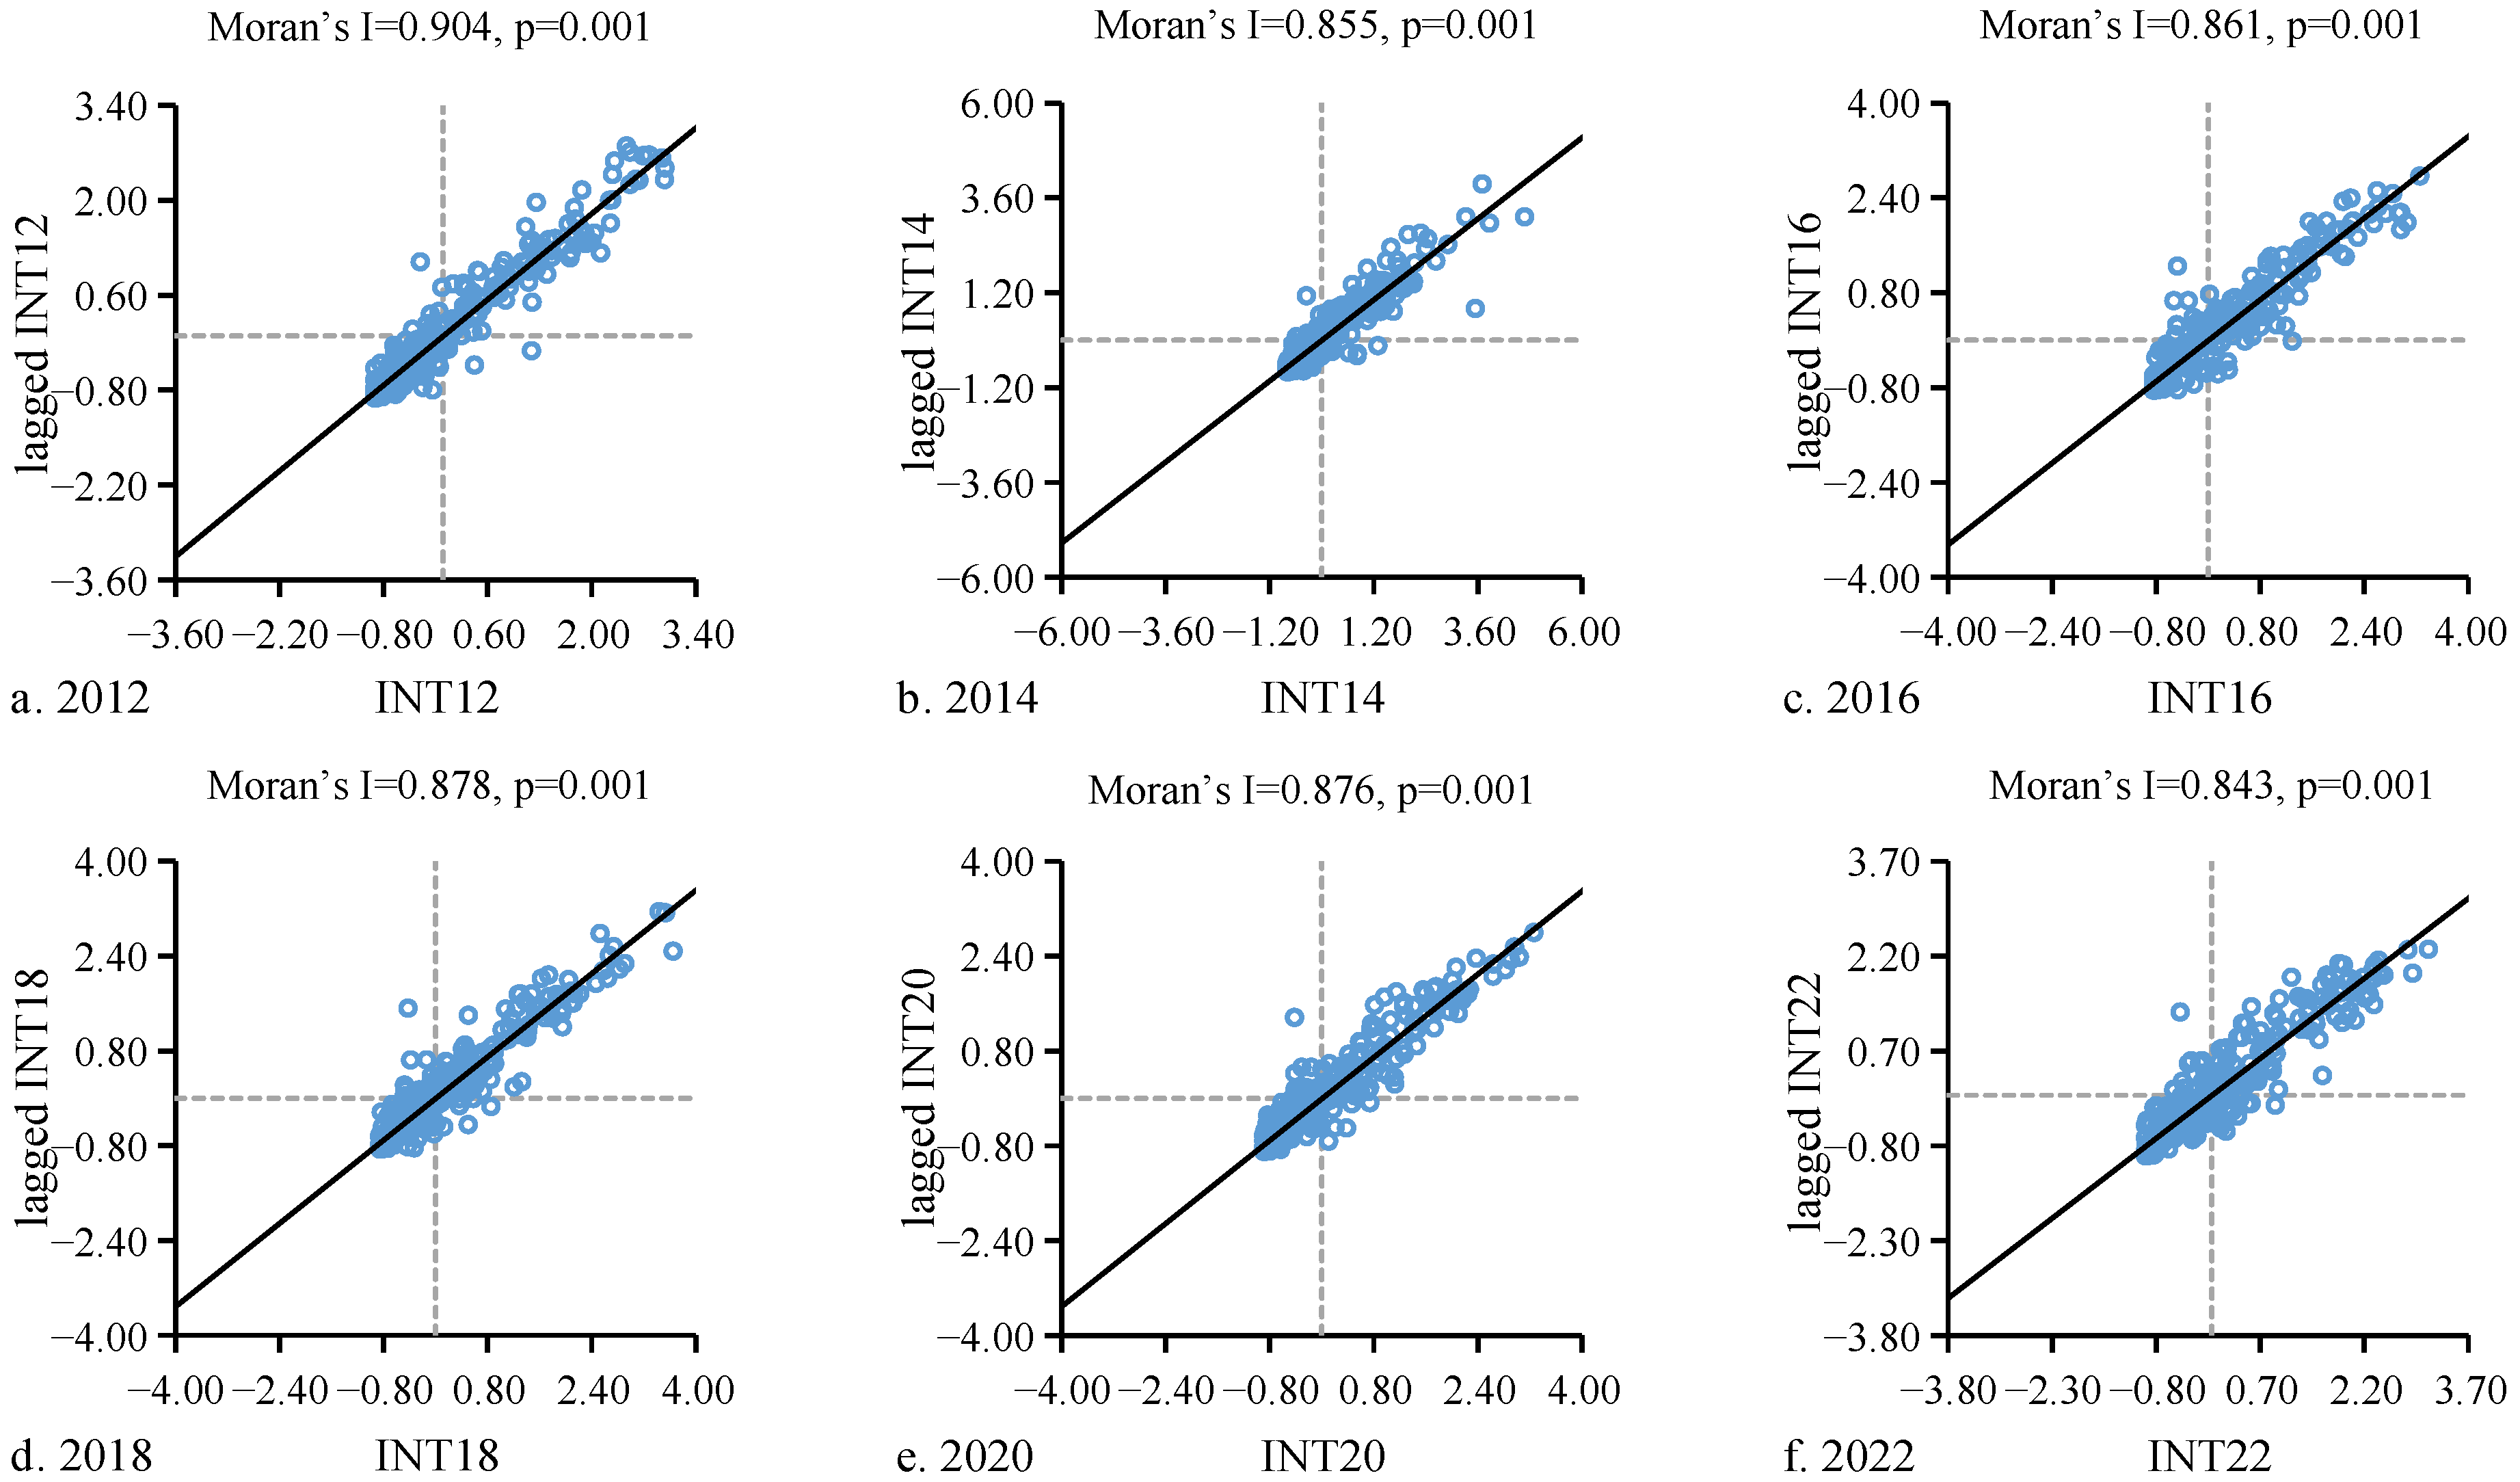
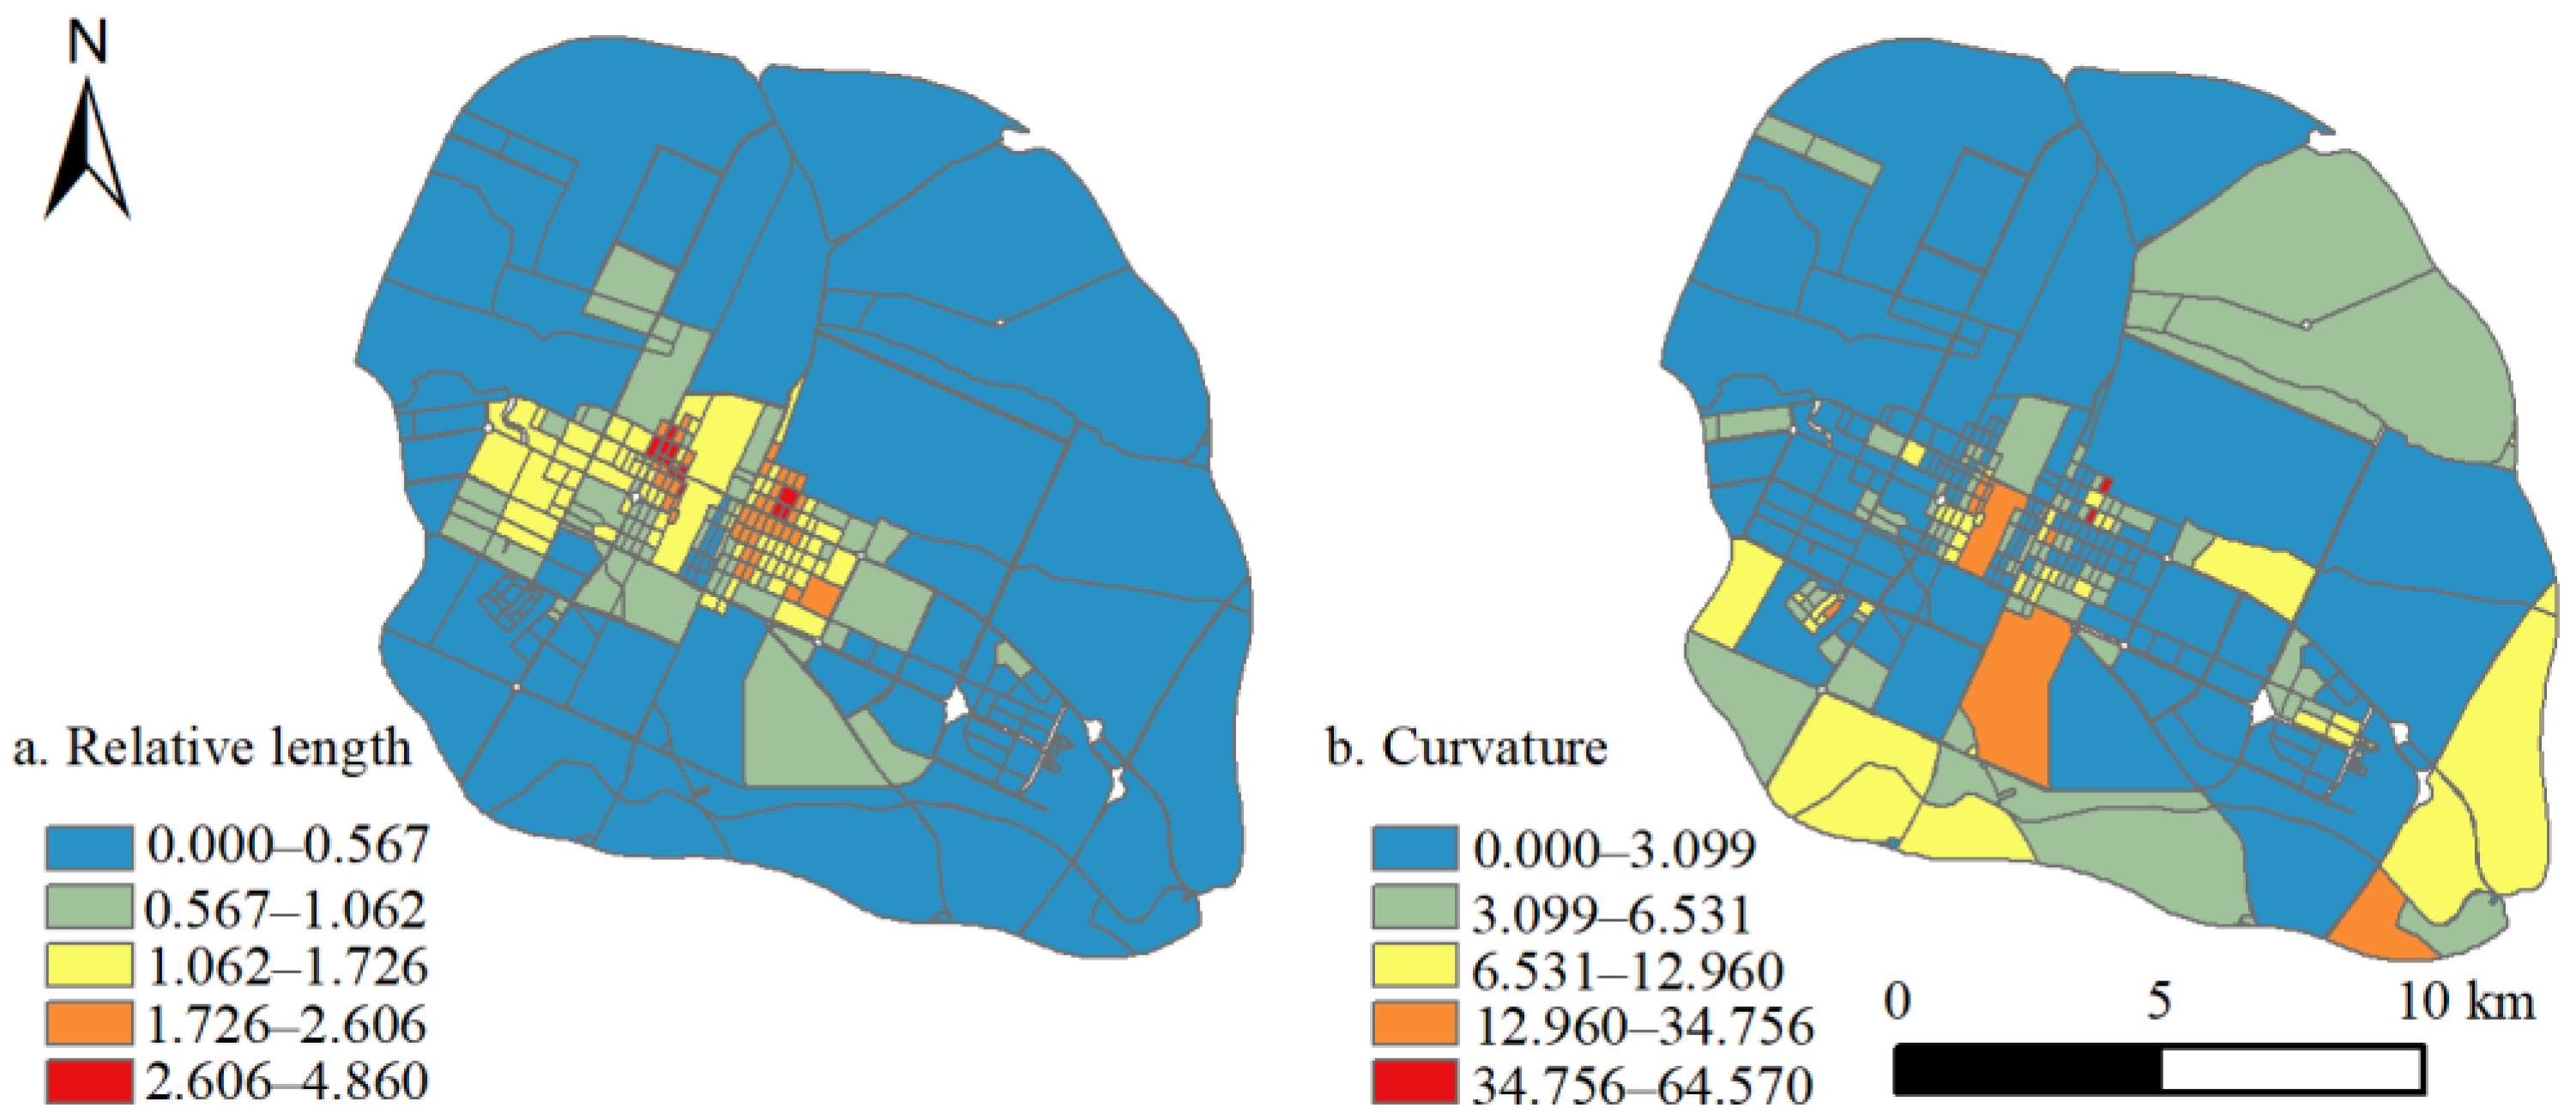
3.3. Spatial and Temporal Characteristics of Carbon Emission Intensity
4. Discussion
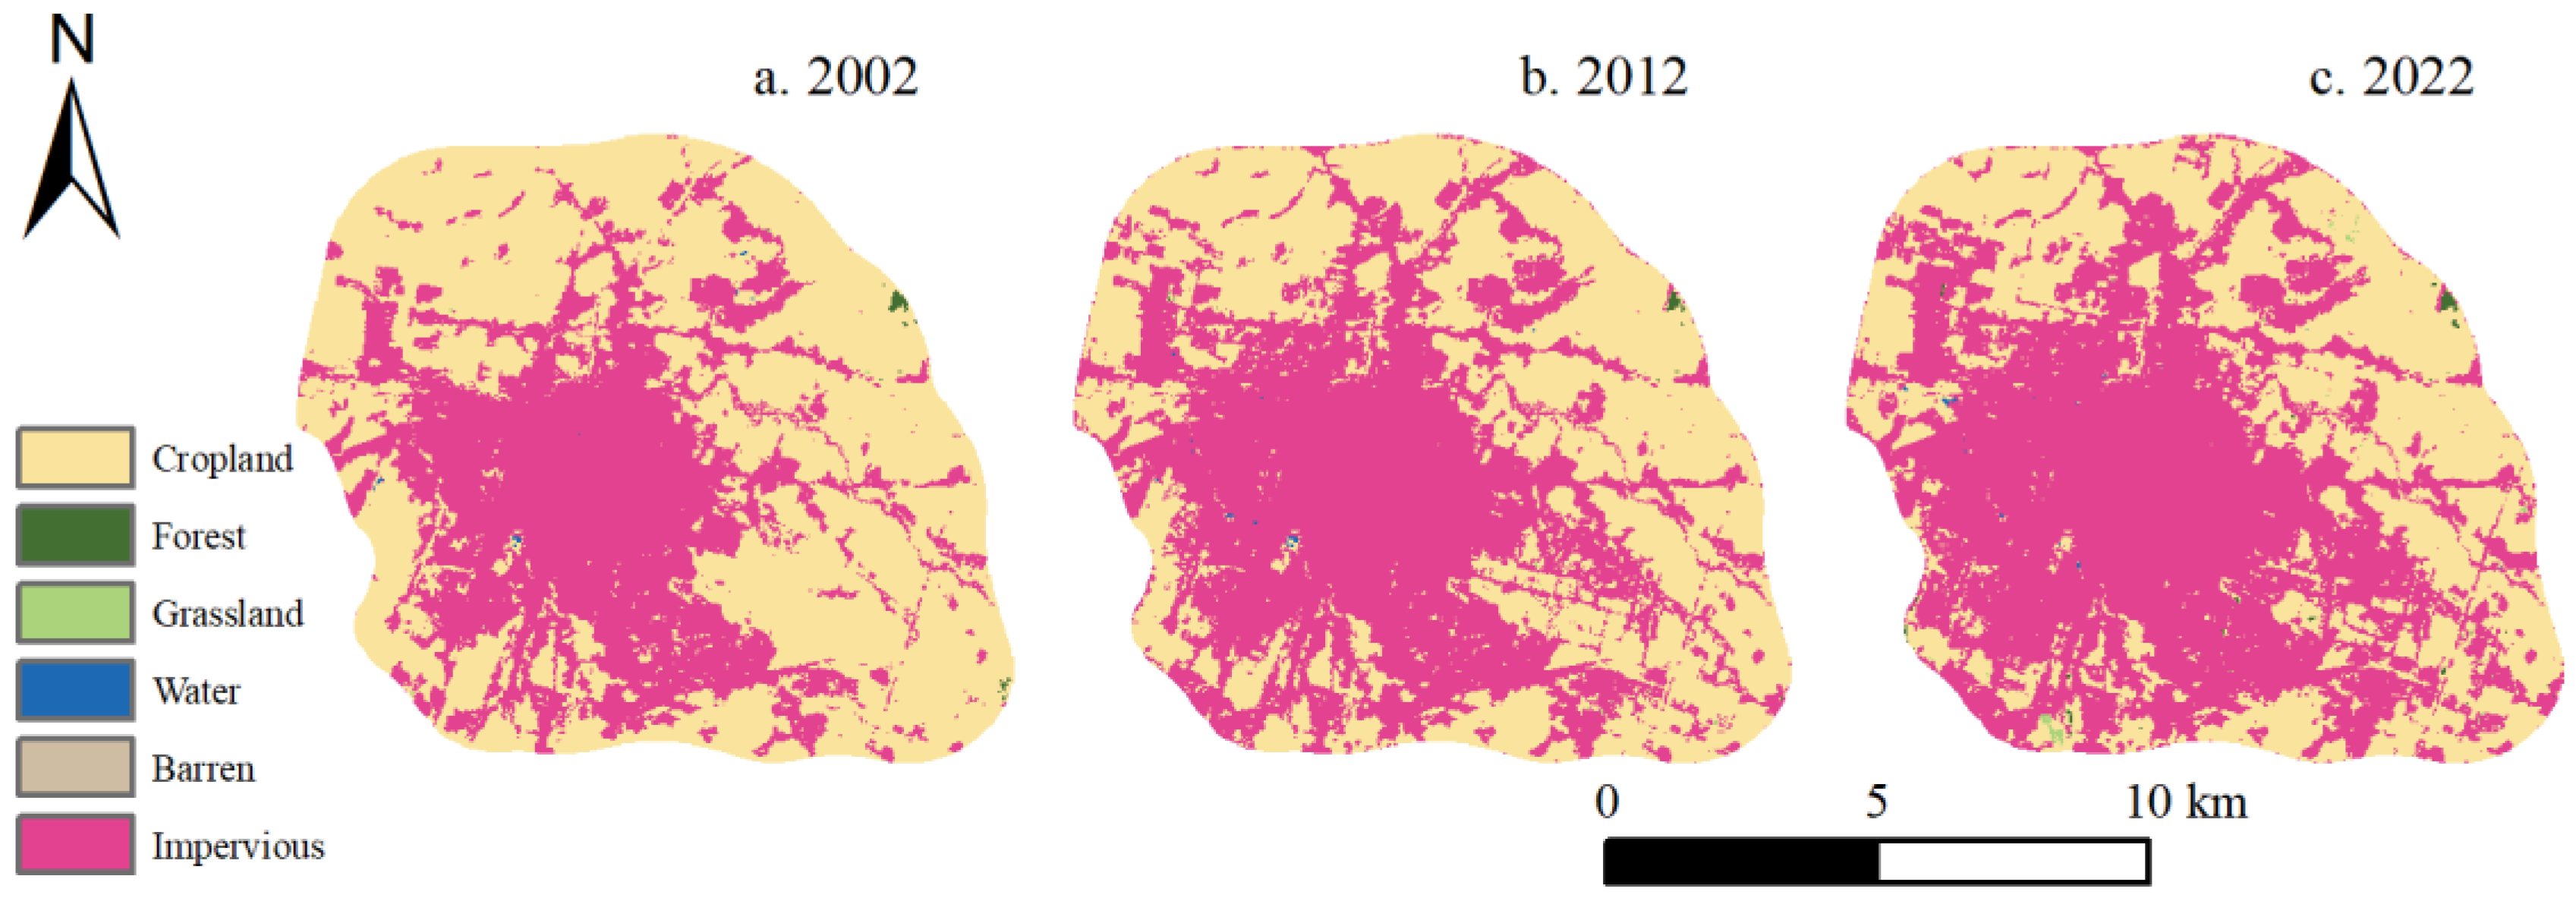
4.1. Influencing Factors of Spatial and Temporal Trends in Carbon Emissions
4.2. Accuracy of Spatial Estimation
4.3. Further Studies
5. Conclusions
Author Contributions
Funding
Data Availability Statement
Acknowledgments
Conflicts of Interest
Appendix A

| Cities | Urban Population (10,000 Persons) | Construction Land Area (Square Kilometre) | The Proportion of Secondary Industry in GRP (Municipal District) | |||||
|---|---|---|---|---|---|---|---|---|
| 2012 | 2022 | Growth Rate | 2012 | 2022 | Growth Rate | 2012 | 2022 | |
| Anshan | 151.88 | 125.24 | −17.54% | 151.44 | 178.55 | 17.90% | 52.20% | 49.58% |
| Fushun | 132.68 | 109.82 | −17.23% | 131.03 | 123.18 | −5.99% | 61.01% | 55.03% |
| Yingkou | 91.10 | 77.57 | −14.85% | 110.00 | 180.07 | 63.70% | 56.80% | 48.35% |
| Fuxin | 77.90 | 71.42 | −8.32% | 70.37 | 76.50 | 8.71% | 62.10% | 35.73% |
| Chaoyang | 56.00 | 48.37 | −13.63% | 39.80 | 61.64 | 54.87% | 47.48% | 31.03% |
| Siping | 60.57 | 44.91 | −25.85% | 53.51 | 66.20 | 23.72% | 61.39% | 37.22% |
| Liaoyuan | 50.00 | 37.80 | −24.40% | 46.33 | 46.70 | 0.80% | 59.12% | 30.29% |
| Jixi | 71.58 | 61.00 | −14.78% | 78.85 | 58.22 | −26.16% | 60.30% | 52.12% |
| Hegang | 57.52 | 49.14 | −14.57% | 50.71 | 48.63 | −4.10% | 68.29% | 55.62% |
| Yichun | 75.69 | 41.44 | −45.25% | 156.96 | 91.92 | −41.44% | 39.78% | 19.52% |
| Jiamusi | 60.00 | 54.71 | −8.82% | 98.08 | 73.20 | −25.37% | 36.59% | 24.16% |
| Mudanjiang | 70.29 | 55.04 | −21.70% | 82.92 | 61.59 | −25.72% | 46.69% | 24.33% |
References
- Friedlingstein, P.; O'Sullivan, M.; Jones, M.W.; Andrew, R.M.; Hauck, J.; Landschützer, P.; Le Quéré, C.; Li, H.; Luijkx, I.T.; Olsen, A.; et al. Global Carbon Budget 2024. Earth Syst. Sci. Data Discuss. 2024, preprint. [Google Scholar] [CrossRef]
- Intergovernmental Panel on Climate Change (IPCC). Climate Change 2022: Mitigation of Climate Change. 2022. Available online: https://www.ipcc.ch/report/ar6/wg3/downloads/report/IPCC_AR6_WGIII_FullReport.pdf (accessed on 18 December 2024).
- World Resource Institute (WRI). Low-Carbon City Development in China: Evaluation Results for More than 100 Cities Around the World; World Resource Institute (WRI): Washington, DC, USA, 2024. [Google Scholar] [CrossRef]
- Hong, S.; Hui, E.C.M.; Lin, Y. Relationship between Urban Spatial Structure and Carbon Emissions: A Literature Review. Ecol. Indic. 2022, 144, 109456. [Google Scholar]
- Sun, C.; Zhang, Y.; Ma, W.; Wu, R.; Wang, S. The Impacts of Urban Form on Carbon Emissions: A Comprehensive Review. Land 2022, 11, 1430. [Google Scholar] [CrossRef]
- Shi, F.; Liao, X.; Shen, L.; Meng, C.; Lai, Y. Exploring the Spatiotemporal Impacts of Urban Form on CO2 Emissions: Evidence and Implications from 256 Chinese Cities. Environ. Impact Asses. 2022, 96, 106850. [Google Scholar]
- Zheng, S.; Huang, Y.; Sun, Y. Effects of Urban Form on Carbon Emissions in China: Implications for Low-carbon Urban Planning. Land 2022, 11, 1343. [Google Scholar] [CrossRef]
- Makido, Y.; Dhakal, S.; Yamagata, Y. Relationship between Urban Form and CO2 Emissions: Evidence from Fifty Japanese Cities. Urban Clim. 2012, 2, 55–67. [Google Scholar] [CrossRef]
- Feng, T.; Zhou, B. Impact of Urban Spatial Structure Elements on Carbon Emissions Efficiency in Growing Megacities: The Case of Chengdu. Sci. Rep. 2023, 13, 9939. [Google Scholar]
- Abubakar, I.R.; Alshammari, M.S. Urban Planning Schemes for Develop Low-carbon cities in the Gulf Cooperation Council Region. Habitat Int. 2023, 138, 102881. [Google Scholar] [CrossRef]
- Van der Borght, R.; Barbera, M.P. How Urban Spatial Expansion Influences CO2 Emissions in Latin American Countries. Cities 2023, 139, 104389. [Google Scholar]
- Zhang, L.; Zhang, J.; Li, X.; Zhou, K.; Ye, J. The Impact of Urban Sprawl on Carbon Emissions from the Perspective of Nighttime Light Remote Sensing: A Case Study in Eastern China. Sustainability 2023, 15, 11940. [Google Scholar] [CrossRef]
- Wei, L.; Liu, Z. Spatial Heterogeneity of Demographic Structure Effects on Urban Carbon Emissions. Environ. Impact Asses. 2022, 95, 106790. [Google Scholar]
- Chen, J.; Gao, M.; Cheng, S.; Hou, W.; Song, M.; Liu, X.; Liu, Y.; Shan, Y. County-Level CO2 Emissions and Sequestration in China during 1997–2017. Sci. Data 2020, 7, 391. [Google Scholar]
- Xu, J.; Liu, Q.; Ruan, N.; Hu, F.; Jiang, W.; Li, Y.; Ma, W. The Allometric Relationship between Carbon emission and Economic Development in Yangtze River Delta: Fusion of Multi-source Remote Sensing Nighttime Light Data. Environ. Sci. Pollut. Res. 2023, 30, 120120–120136. [Google Scholar]
- Zhang, C.Y.; Zhao, L.; Zhang, H.; Chen, M.N.; Fang, R.Y.; Yao, Y.; Zhang, Q.P.; Wang, Q. Spatial-temporal Characteristics of Carbon Emissions from Land Use Change in Yellow River Delta Region, China. Ecol. Indic. 2022, 136, 108623. [Google Scholar]
- Chen, S.; Chen, B.; Feng, K.; Liu, Z.; Fromer, N.; Tan, X.; Alsaedi, A.; Hayat, T.; Weisz, H.; Schellnhuber, H.J.; et al. Physical and Virtual Carbon Metabolism of Global Cities. Nat. Commun. 2020, 11, 182. [Google Scholar]
- Wang, G.; Han, Q.; de Vries, B. A Geographic Carbon Emission Estimating Framework on the City Scale. J. Clean. Prod. 2020, 244, 118793. [Google Scholar]
- Yang, Y.; Takase, T. Spatial Characteristics of Carbon Dioxide Emission Intensity of Urban Road Traffic and Driving Factors: Road Network and Land Use. Sustain. Cities Soc. 2024, 113, 105700. [Google Scholar]
- United Nations Environment Programme (UNEP). 2022 Global Status Report for Buildings and Construction. 2022. Available online: https://www.unep.org/resources/publication/2022-global-status-report-buildings-and-construction (accessed on 18 December 2024).
- China Association of Building Energy Efficiency (CABEE). 2023 Carbon Emissions from Buildings and Urban Infrastructure in China. 2023. Available online: http://www.jzlj.org.cn/Item/Show.asp?m=1&d=9737 (accessed on 24 November 2024). (In Chinese).
- Huo, T.; Xu, L.; Liu, B.; Cai, W.; Feng, W. China’s Commercial Building Carbon Emissions Toward 2060: An Integrated Dynamic Emission Assessment Model. Appl. Energy 2022, 325, 119828. [Google Scholar]
- Wang, J.; Liu, W.; Sha, C.; Zhang, W.; Liu, Z.; Wang, Z.; Wang, R.; Du, X. Evaluation of the Impact of Urban Morphology on Commercial Building Carbon Emissions at the Block Scale–A Study of Commercial Buildings in Beijing. J. Clean. Prod. 2023, 408, 137191. [Google Scholar]
- Croci, E.; Lucchitta, B.; Molteni, T. Low Carbon Urban Strategies: An Investigation of 124 European Cities. Urban Clim. 2021, 40, 101022. [Google Scholar]
- Sun, Y. The Impact of Green Buildings on CO2 Emissions: Evidence from Commercial and Residential Buildings. J. Clean. Prod. 2024, 469, 143168. [Google Scholar] [CrossRef]
- Lian, H.; Zhang, J.; Li, G.; Ren, R. The Relationship between Residential Block Forms and Building Carbon Emissions to Achieve Carbon Neutrality Goals: A Case Study of Wuhan, China. Sustainability 2023, 15, 15751. [Google Scholar] [CrossRef]
- You, K.; Ren, H.; Cai, W.; Huang, R.; Li, Y. Modeling Carbon Emission Trend in China’s Building Sector to Year 2060. Resour. Conserv. Recycl. 2023, 188, 106679. [Google Scholar] [CrossRef]
- Chastas, P.; Theodosiou, T.; Kontoleon, K.J.; Bikas, D. Normalising and Assessing Carbon Emissions in the Building Sector: A Review on the Embodied CO2 Emissions of Residential Buildings. Build. Environ. 2018, 130, 212–226. [Google Scholar] [CrossRef]
- Mostafavi, F.; Tahsildoost, M.; Zomorodian, Z. Energy Efficiency and Carbon Emission in High-rise Buildings: A review (2005–2020). Build. Environ. 2021, 206, 108329. [Google Scholar] [CrossRef]
- Nematchoua, M.K.; Orosa, J.A.; Ricciardi, P.; Obonyo, E.; Sambatra, E.J.R.; Reiter, S. Transition to Zero Energy and Low Carbon Emission in Residential Buildings Located in Tropical and Temperate Climates. Energies 2021, 14, 4253. [Google Scholar] [CrossRef]
- Zhang, X.; Yan, F.; Liu, H.; Qiao, Z. Towards Low Carbon Cities: A Machine Learning Method for Predicting Urban Blocks Carbon Emissions (UBCE) Based on Built Environment Factors (BEF) in Changxing City, China. Sustain. Cities Soc. 2021, 69, 102875. [Google Scholar] [CrossRef]
- Zhang, N.; Luo, Z.; Liu, Y.; Feng, W.; Zhou, N.; Yang, L. Towards Low-carbon Cities through Building-stock-level Carbon Emission Analysis: A Calculating and Mapping Method. Sustain. Cities Soc. 2022, 78, 103633. [Google Scholar] [CrossRef]
- Niu, M.; Ji, Y.; Zhao, M.; Gu, J.; Li, A. A Study on Carbon Emission Calculation in Operation Stage of Residential Buildings Based on Micro Electricity Usage Behavior: Three Case Studies in China. Build. Simul. 2024, 17, 147–164. [Google Scholar] [CrossRef]
- Xiong, L.; Wang, M.; Mao, J.; Huang, B. A Review of Building Carbon Emission Accounting Methods under Low-Carbon Building Background. Buildings 2024, 14, 777. [Google Scholar] [CrossRef]
- Rong, P.; Zhang, Y.; Qin, Y.; Liu, G.; Liu, R. Spatial Differentiation of Carbon Emissions from Residential Energy Consumption: A Case Study in Kaifeng, China. J. Environ. Manag. 2020, 271, 110895. [Google Scholar]
- Carpio, A.; Ponce-Lopez, R.; Lozano-García, D.F. Urban form, Land Use, and Cover Change and Their Impact on Carbon Emissions in the Monterrey Metropolitan area, Mexico. Urban Clim. 2021, 39, 100947. [Google Scholar]
- Huang, C.; Zhuang, Q.; Meng, X.; Zhu, P.; Han, J.; Huang, L. A Fine Spatial Resolution Modeling of Urban Carbon Emissions: A Case Study of Shanghai, China. Sci. Rep. 2022, 12, 9255. [Google Scholar] [CrossRef] [PubMed]
- Wang, J.; Wei, J.; Zhang, W.; Liu, Z.; Du, X.; Liu, W.; Pan, K. High-resolution Temporal and Spatial Evolution of Carbon Emissions from Building Operations in Beijing. J. Clean. Prod. 2022, 376, 134272. [Google Scholar]
- Yang, S.; Yang, X.; Gao, X.; Zhang, J. Spatial and Temporal Distribution Characteristics of Carbon Emissions and Their Drivers in Shrinking Cities in China: Empirical Evidence Based on the NPP/VIIRS Nighttime Lighting Index. J. Environ. Manag. 2022, 322, 116082. [Google Scholar]
- Liu, X.; Wang, M.; Qiang, W.; Wu, K.; Wang, X. Urban Form, Shrinking Cities, and Residential Carbon Emissions: Evidence from Chinese City-regions. Appl. Energy 2020, 261, 114409. [Google Scholar] [CrossRef]
- Tong, X.; Guo, S.; Duan, H.; Duan, Z.; Gao, C.; Chen, W. Carbon-emission Characteristics and Influencing Factors in Growing and Shrinking Cities: Evidence from 280 Chinese Cities. Int. J. Environ. Res. Public Health 2022, 19, 2120. [Google Scholar] [CrossRef]
- Perera, A.T.D.; Javanroodi, K.; Mauree, D.; Nik, V.M.; Florio, P.; Hong, T.; Chen, D. Challenges Resulting from Urban Density and Climate Change for the EU Energy Transition. Nat. Energy 2023, 8, 397–412. [Google Scholar]
- Xin, Y.; Liu, Y.; Liu, L. The Influence of Population Growth and Shrinkage on Carbon Emission Intensity in Old Industrial Cities of China. Geo. Res. 2024, 43, 558–576. (In Chinese) [Google Scholar]
- He, J.; Liu, Y. Identification Measurement and Cause Analysis of Urban Contraction in Northeast China. Changbai J. 2022, 4, 103–111. (In Chinese) [Google Scholar]
- Siping Publising. Siping City Industrial Economic Development Achievements by 40 Years of Reform and Opening Up. 2022. Available online: https://mp.weixin.qq.com/s?__biz=MzAxMDAzNTUzOQ==&mid=2649804524&idx=3&sn=2df1cf933fd72b20c86dcc2abd48a335&chksm=8352e6d0b4256fc685d087777eb71cd8253f8d7dd26d6c92388d7485f8e9c27f407e1e563161&scene=27 (accessed on 18 December 2024). (In Chinese).
- Xue, J.; Li, Y. Analysis of the Difference and Influencing of Carbon Emission from Residential Energy Consumption in Hubao Eyu Urban Agglomeration. Forest. Ecol. Sci. 2024, 39, 180–189. (In Chinese) [Google Scholar]
- Wang, W.; Zhang, R.; Bi, J. Carbon Accounting for Chinese Cities—A Case of Wuxi City. China Environ. Sci. 2011, 31, 1029–1038. (In Chinese) [Google Scholar]
- Pan, J.; Zhang, Y. Spatiotemporal Patterns of Energy Carbon Footprint and Decoupling Effect in China. Acta Geogr. Sin. 2021, 76, 206–222. [Google Scholar]
- Liu, X.; Jin, X.; Luo, X.; Zhou, Y. Quantifying the Spatiotemporal Dynamics and Impact Factors of China’s County-level Carbon Emissions Using ESTDA and Spatial Econometric Models. J. Clean. Prod. 2023, 410, 137203. [Google Scholar] [CrossRef]
- Zeng, T.; Jin, H.; Geng, Z.; Kang, Z.; Zhang, Z. The Effect of Urban Shrinkage on Carbon Dioxide Emissions Efficiency in Northeast China. Int. J. Environ. Res. Public Health 2022, 19, 5772. [Google Scholar] [CrossRef]
- Chen, W.; Gu, T.; Fang, C.; Zeng, J. Global Urban Low-carbon Transitions: Multiscale Relationship between Urban Land and Carbon Emissions. Environ. Impact Asses. 2023, 100, 107076. [Google Scholar] [CrossRef]
- Xiao, Y.; Huang, H.; Qian, X.M.; Zhang, L.Y.; An, B.W. Can New-type Urbanization Reduce Urban Building Carbon Emissions? New Evidence from China. Sustain. Cities Soc. 2023, 90, 104410. [Google Scholar] [CrossRef]
- Cheng, Z.; Hu, X. The Effects of Urbanization and Urban Sprawl on CO2 Emissions in China. Environ. Dev. Sustain. 2023, 25, 1792–1808. [Google Scholar] [CrossRef]
- März, S.; Bierwirth, A.; Hauptstock, D. Rethink the Target: Drivers, Barriers and Path Dependencies for a Low-Carbon-Transition in Shrinking Cities; The Case of Oberhausen; European Council for an Energy Efficient Economy: Stockholm, Sweden, 2013. [Google Scholar]
- Miyauchi, T.; Setoguchi, T. Does Low Urban Density Increase Municipal Expenditure? Population Density as A Performance Target for Compact City Planning in Japan. J. Urban Manag. 2023, 12, 375–384. [Google Scholar] [CrossRef]
- Hong, S.; Hui, E.C.M.; Lin, Y. Relationships between Carbon Emissions and Urban Population Size and Density, Based on Geo-urban Scaling Analysis: A Multi-carbon Source Empirical Study. Urban Clim. 2022, 46, 101337. [Google Scholar] [CrossRef]
- Balezentis, T. Shrinking Ageing Population and Other Drivers of Energy Consumption and CO2 Emission in the Residential Sector: A Case from Eastern Europe. Energy Policy 2020, 140, 111433. [Google Scholar]
- Brown, M.A.; Southworth, F.; Sarzynski, A. Shrinking the Carbon Footprint of Metropolitan America; Brookings Institution: Washington, DC, USA, 2008; p. 83. [Google Scholar]
- Kain, J.H.; Adelfio, M.; Stenberg, J.; Thuvander, L. Towards A Systemic Understanding of Compact City Qualities. J. Urban Des. 2022, 27, 130–147. [Google Scholar]
- Miyauchi, T.; Setoguchi, T.; Ito, T. Quantitative Estimation Method for Urban Areas to Develop Compact Cities in View of Unprecedented Population Decline. Cities 2021, 114, 103151. [Google Scholar]
- Wang, Q.; Li, L. The Effects of Population Aging, Life Expectancy, Unemployment rate, Population Density, Per Capita GDP, Urbanization on Per Capita Carbon Emissions. Sustain. Prod. Consump. 2021, 28, 760–774. [Google Scholar]
- Byun, G.; Kim, Y. A Street-view-based Method to Detect Urban Growth and Decline: A Case Study of Midtown in Detroit, Michigan, USA. PLoS ONE 2022, 17, e0263775. [Google Scholar]


Disclaimer/Publisher’s Note: The statements, opinions and data contained in all publications are solely those of the individual author(s) and contributor(s) and not of MDPI and/or the editor(s). MDPI and/or the editor(s) disclaim responsibility for any injury to people or property resulting from any ideas, methods, instructions or products referred to in the content. |
© 2025 by the authors. Licensee MDPI, Basel, Switzerland. This article is an open access article distributed under the terms and conditions of the Creative Commons Attribution (CC BY) license (https://creativecommons.org/licenses/by/4.0/).
Share and Cite
Jia, Y.; Zhou, T.; Wang, X. The Spatiotemporal Evolution of Buildings’ Carbon Emissions in Siping, a Chinese Industrial City. Buildings 2025, 15, 1101. https://doi.org/10.3390/buildings15071101
Jia Y, Zhou T, Wang X. The Spatiotemporal Evolution of Buildings’ Carbon Emissions in Siping, a Chinese Industrial City. Buildings. 2025; 15(7):1101. https://doi.org/10.3390/buildings15071101
Chicago/Turabian StyleJia, Yuqiu, Taohong Zhou, and Xin Wang. 2025. "The Spatiotemporal Evolution of Buildings’ Carbon Emissions in Siping, a Chinese Industrial City" Buildings 15, no. 7: 1101. https://doi.org/10.3390/buildings15071101
APA StyleJia, Y., Zhou, T., & Wang, X. (2025). The Spatiotemporal Evolution of Buildings’ Carbon Emissions in Siping, a Chinese Industrial City. Buildings, 15(7), 1101. https://doi.org/10.3390/buildings15071101