Article

Design and Experimental Study of a Prefabricated Building Thermoelectric Power Generation–Wall System for Severe Cold Climates

School of Architecture, Inner Mongolia University of Technology, Hohhot 010051, China
*
Author to whom correspondence should be addressed.
Buildings 2025, 15(7), 1076; https://doi.org/10.3390/buildings15071076
Submission received: 30 January 2025 / Revised: 19 March 2025 / Accepted: 24 March 2025 / Published: 26 March 2025
(This article belongs to the Topic Building Energy and Environment, 2nd Edition)

Abstract

With the increasing global demand for sustainable energy, energy conservation and efficiency in buildings located in severe cold climate regions have attracted considerable research attention. Conventional exterior wall insulation and energy utilization strategies in such environments often fail to achieve the desired levels of efficiency, energy conservation, and productivity. To address these challenges, this study proposes a thermoelectric power generation–wall system (TEPG–Wall System) designed specifically for prefabricated buildings. The system utilizes Ni90Cr10-Ni45Cu55 thermoelectric material, integrated with a wall collector cavity design, to harness the temperature difference between indoor and outdoor environments for electricity generation. Through software simulations and experimental investigations, the thermoelectric performance of the system under severe cold climate conditions was analyzed. With only 15 parallel devices, the system achieved an average output power of 0.02 W under typical operating conditions, corresponding to an annual energy output of approximately 0.0586 kWh. Such an energy output is sufficient to power low-power building equipment.

1. Introduction

The increasing global demand for sustainable energy and heightened concerns about climate change [1] have prompted the exploration of more efficient and environmentally friendly energy utilization methods within the construction industry, a major energy consumer [2]. Severe cold climate zones, characterized by long and harsh winters, experience exceptionally high energy demands for building heating, placing significant pressure on energy supplies and environmental sustainability [3]. Assembled buildings are increasingly employed in the construction sector owing to their advantages, including rapid construction, consistent quality, environmental benefits, and energy conservation [4,5]. Integrating thermoelectric technology with prefabricated building envelopes to harness the substantial indoor–outdoor temperature difference in such regions offers a promising approach to achieving energy self-sufficiency in buildings.
The concept of thermoelectric technology originated in the early 19th century when German scientist Seebeck discovered that a circuit comprising two dissimilar metals produces an electric current when the temperatures at their contact points differ. This phenomenon, now known as the Seebeck effect, marked the beginning of thermoelectric research [6]. However, early thermoelectric materials, primarily metallic, exhibited low power generation efficiency, leading to limited technological advancement. In recent years, given the global emphasis on energy conservation and environmental protection, numerous studies have focused on thermoelectric power generation materials and their applications in construction. Thermoelectric power generation materials are broadly categorized based on their operational temperature ranges: low-temperature materials (lower than 373 K), medium-temperature materials (373–1000 K), and high-temperature materials (higher than 1000 K) [7,8]. Among low-temperature materials, Bi2Te3-based compounds are the most prominent [9]. In construction applications, these materials are often used to fabricate thermoelectric generators (TEGs). For instance, Win et al. embedded TEGs in 25 cm thick reinforced concrete walls, achieving measurable power output [10]. Byon and Jeong developed an energy-harvesting unit by integrating phase-change materials (PCMs) and aluminum blocks as heat sinks with TEGs, thereby enhancing the energy output when applied to walls [11]. Similarly, Hong et al. combined TEGs with PCMs and concrete walls to design a novel solar thermal wall system, which demonstrated output levels of up to 24.62 V/m2 during the day and 16.31 V/m2 at night in subtropical regions [12]. Thermoelectric power generation technology is often integrated with other energy systems, such as photovoltaic (PV) and ground-source heat pump technologies. For example, Chandel et al. investigated the synergy between thermoelectric and photovoltaic technologies in improving the energy efficiency of building-integrated PV systems. Their findings revealed the significant potential of thermoelectric modules (TEMs) in enhancing photovoltaic performance and serving as part of a combined heat and power system [13]. Similarly, Muhammad et al. proposed a hybrid solar thermoelectric system combining thermoelectric and photovoltaic technologies to enhance panel efficiency, reporting an efficiency increase of 15.5% [14]. Sommerfeldt et al., as early as 2016, explored the application of a photovoltaic–thermoelectric and ground-source heat pump hybrid system in European multifamily housing. Their study demonstrated that the integrated utilization of these technologies effectively enhanced energy efficiency and heat pump performance during the winter months [7].
Thermoelectric power generation materials commonly used in the construction field are predominantly Bi2Te3-based materials. Despite their favorable thermoelectric properties, these materials are associated with several limitations, including high cost and suboptimal mechanical performance, making them unsuitable for large-scale applications in building structures [15]. Additionally, the overall power generation efficiency of Bi2Te3-based materials remains low, rendering them impractical for widespread implementation. Although the integration of thermoelectric power generation with technologies such as photovoltaic systems and ground-source heat pumps enhances efficiency, such systems require stable lighting and abundant geothermal resources, which significantly constrain their large-scale applicability.
This paper proposes a thermoelectric power generation system for prefabricated building envelopes in severe cold climate regions, utilizing Ni90Cr10-Ni45Cu55 as the thermoelectric material. Ni90Cr10-Ni45Cu55 has demonstrated favorable power generation performance in low-temperature environments [16]. Furthermore, as Cu, Cr, and Ni are abundant, cost-effective, and chemically stable metals with excellent mechanical properties, they are well suited for large-scale use in construction. The proposed system operates under simple conditions, requiring only a temperature gradient between indoor and outdoor environments to generate electricity, without imposing constraints on building orientation, size, or location. Using software simulations and experimental validation, this study investigates the thermoelectric performance of the proposed system and its impact on building energy consumption. The findings provide both theoretical foundations and practical insights for the broader application of this system, contributing to advancements in energy conservation technologies for buildings in severe cold climate regions.

2. Materials and Methods

This study focuses on the design and evaluation of a thermoelectric power generation system, employing both software simulation and experimental validation. The relationship between temperature and electrical output was examined using software simulations, while an environmental chamber was utilized to simulate real-world conditions. The power generation performance of the system was verified through a combination of these methods, with feasibility determined based on the results. This approach provides a comprehensive evaluation process, integrating theoretical modeling with experimental data to ensure system reliability and effectiveness. The logical framework of the methodology is presented in Figure 1.

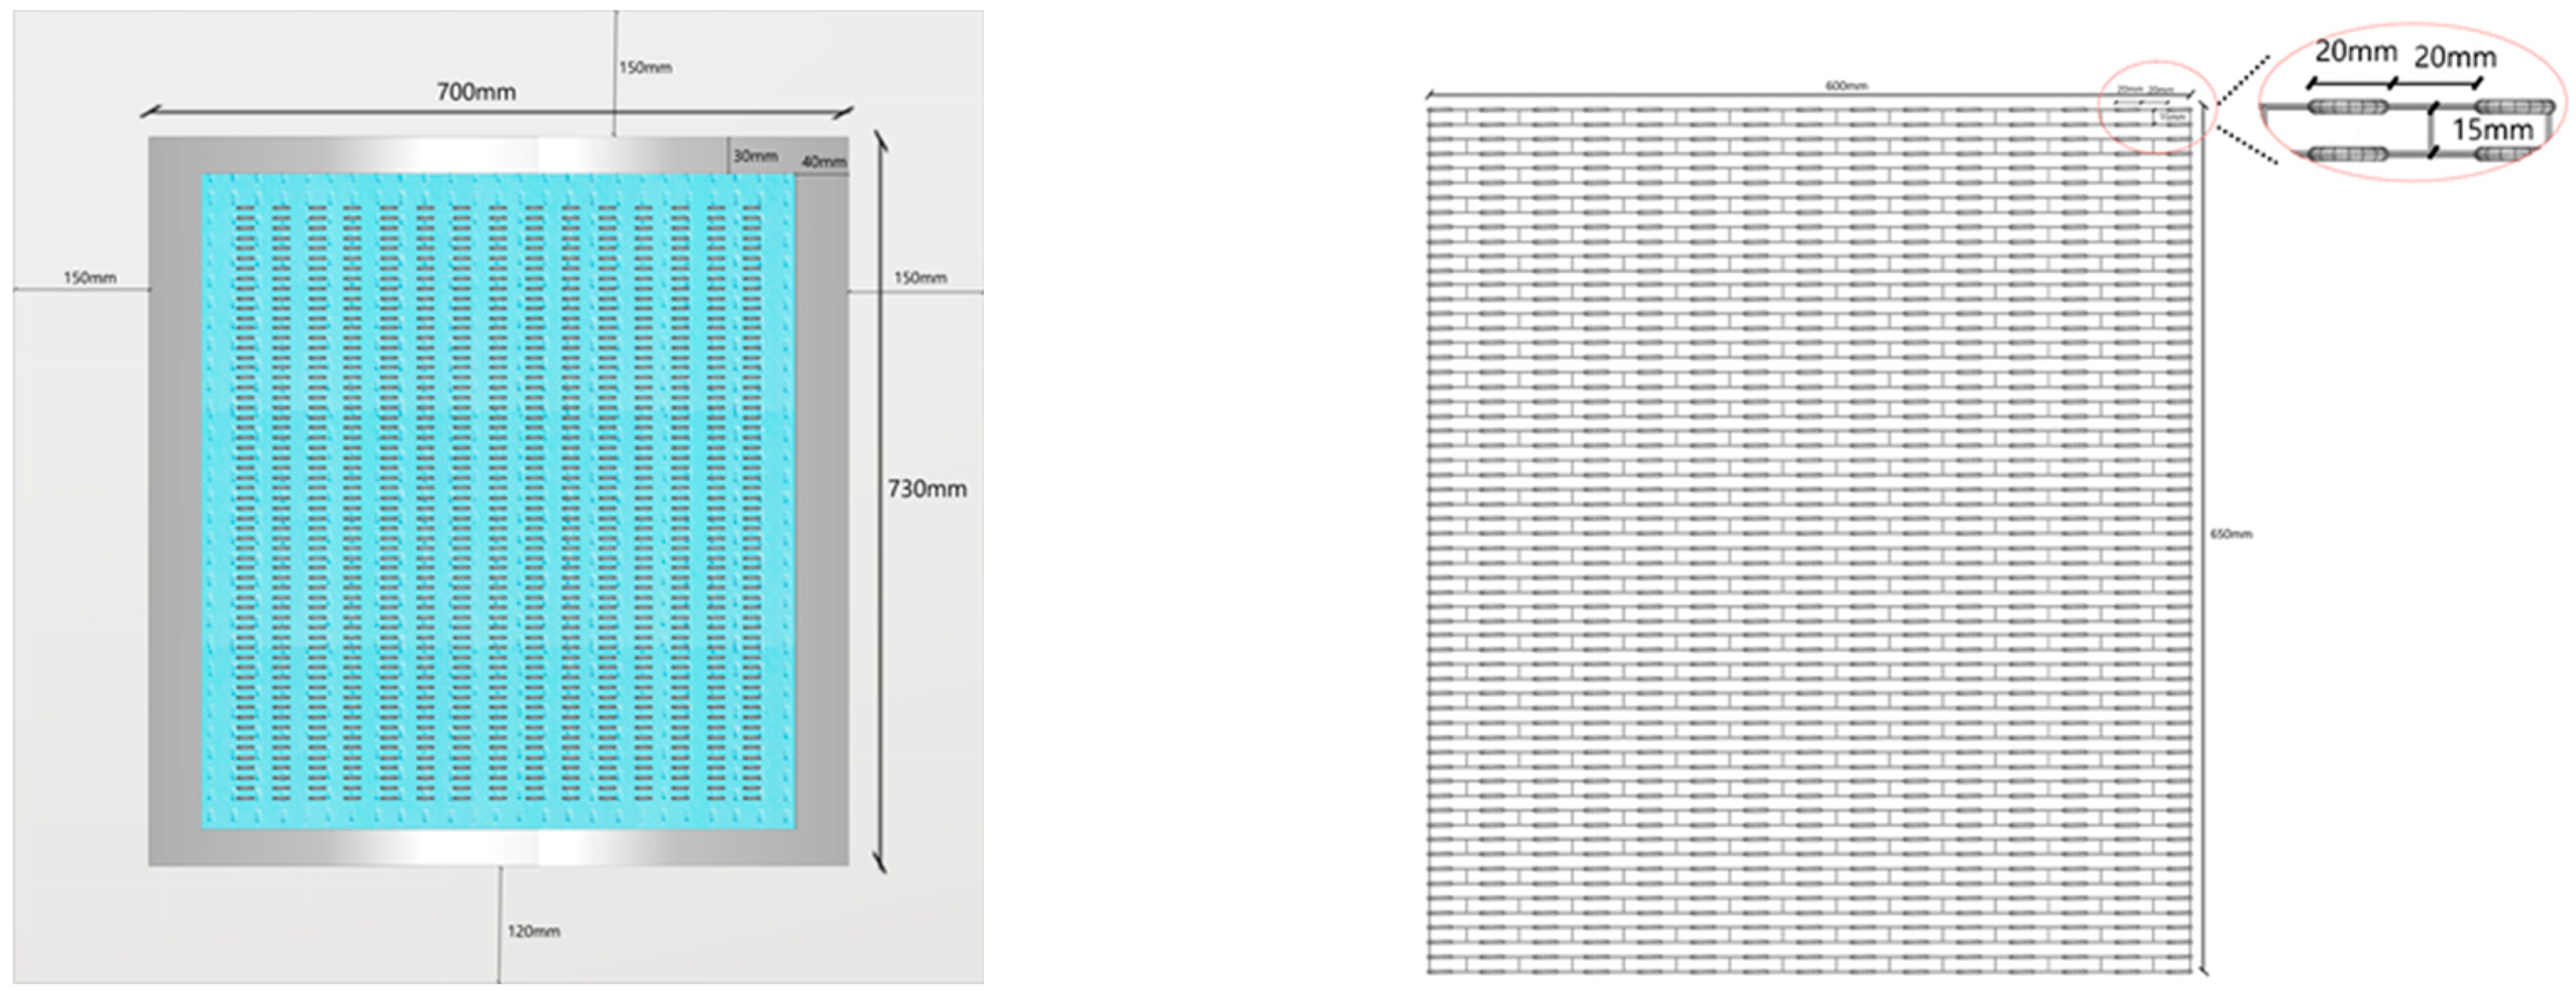
2.1. Thermoelectric Power Generation–Wall System Design

The thermoelectric material utilized in this study was Ni90Cr10-Ni45Cu55. The system incorporated a prefabricated solid precast concrete shear wall as the primary structural component. The thermoelectric module comprised 15 thermoelectric units, each containing Ni90Cr10-Ni45Cu55 material, with each unit forming a thermocouple pair through welding. To enhance the temperature gradient between the cold and hot ends, heat collection devices were installed on the inner and outer panels of the shear wall. In winter and transitional seasons, the hot end absorbed heat while the cold end dissipated it, creating a temperature difference for thermoelectric conversion. During summer, the cover plate could be adjusted to maintain the temperature gradient, enabling continuous thermoelectric power generation. The overall system structure is illustrated in Figure 2.

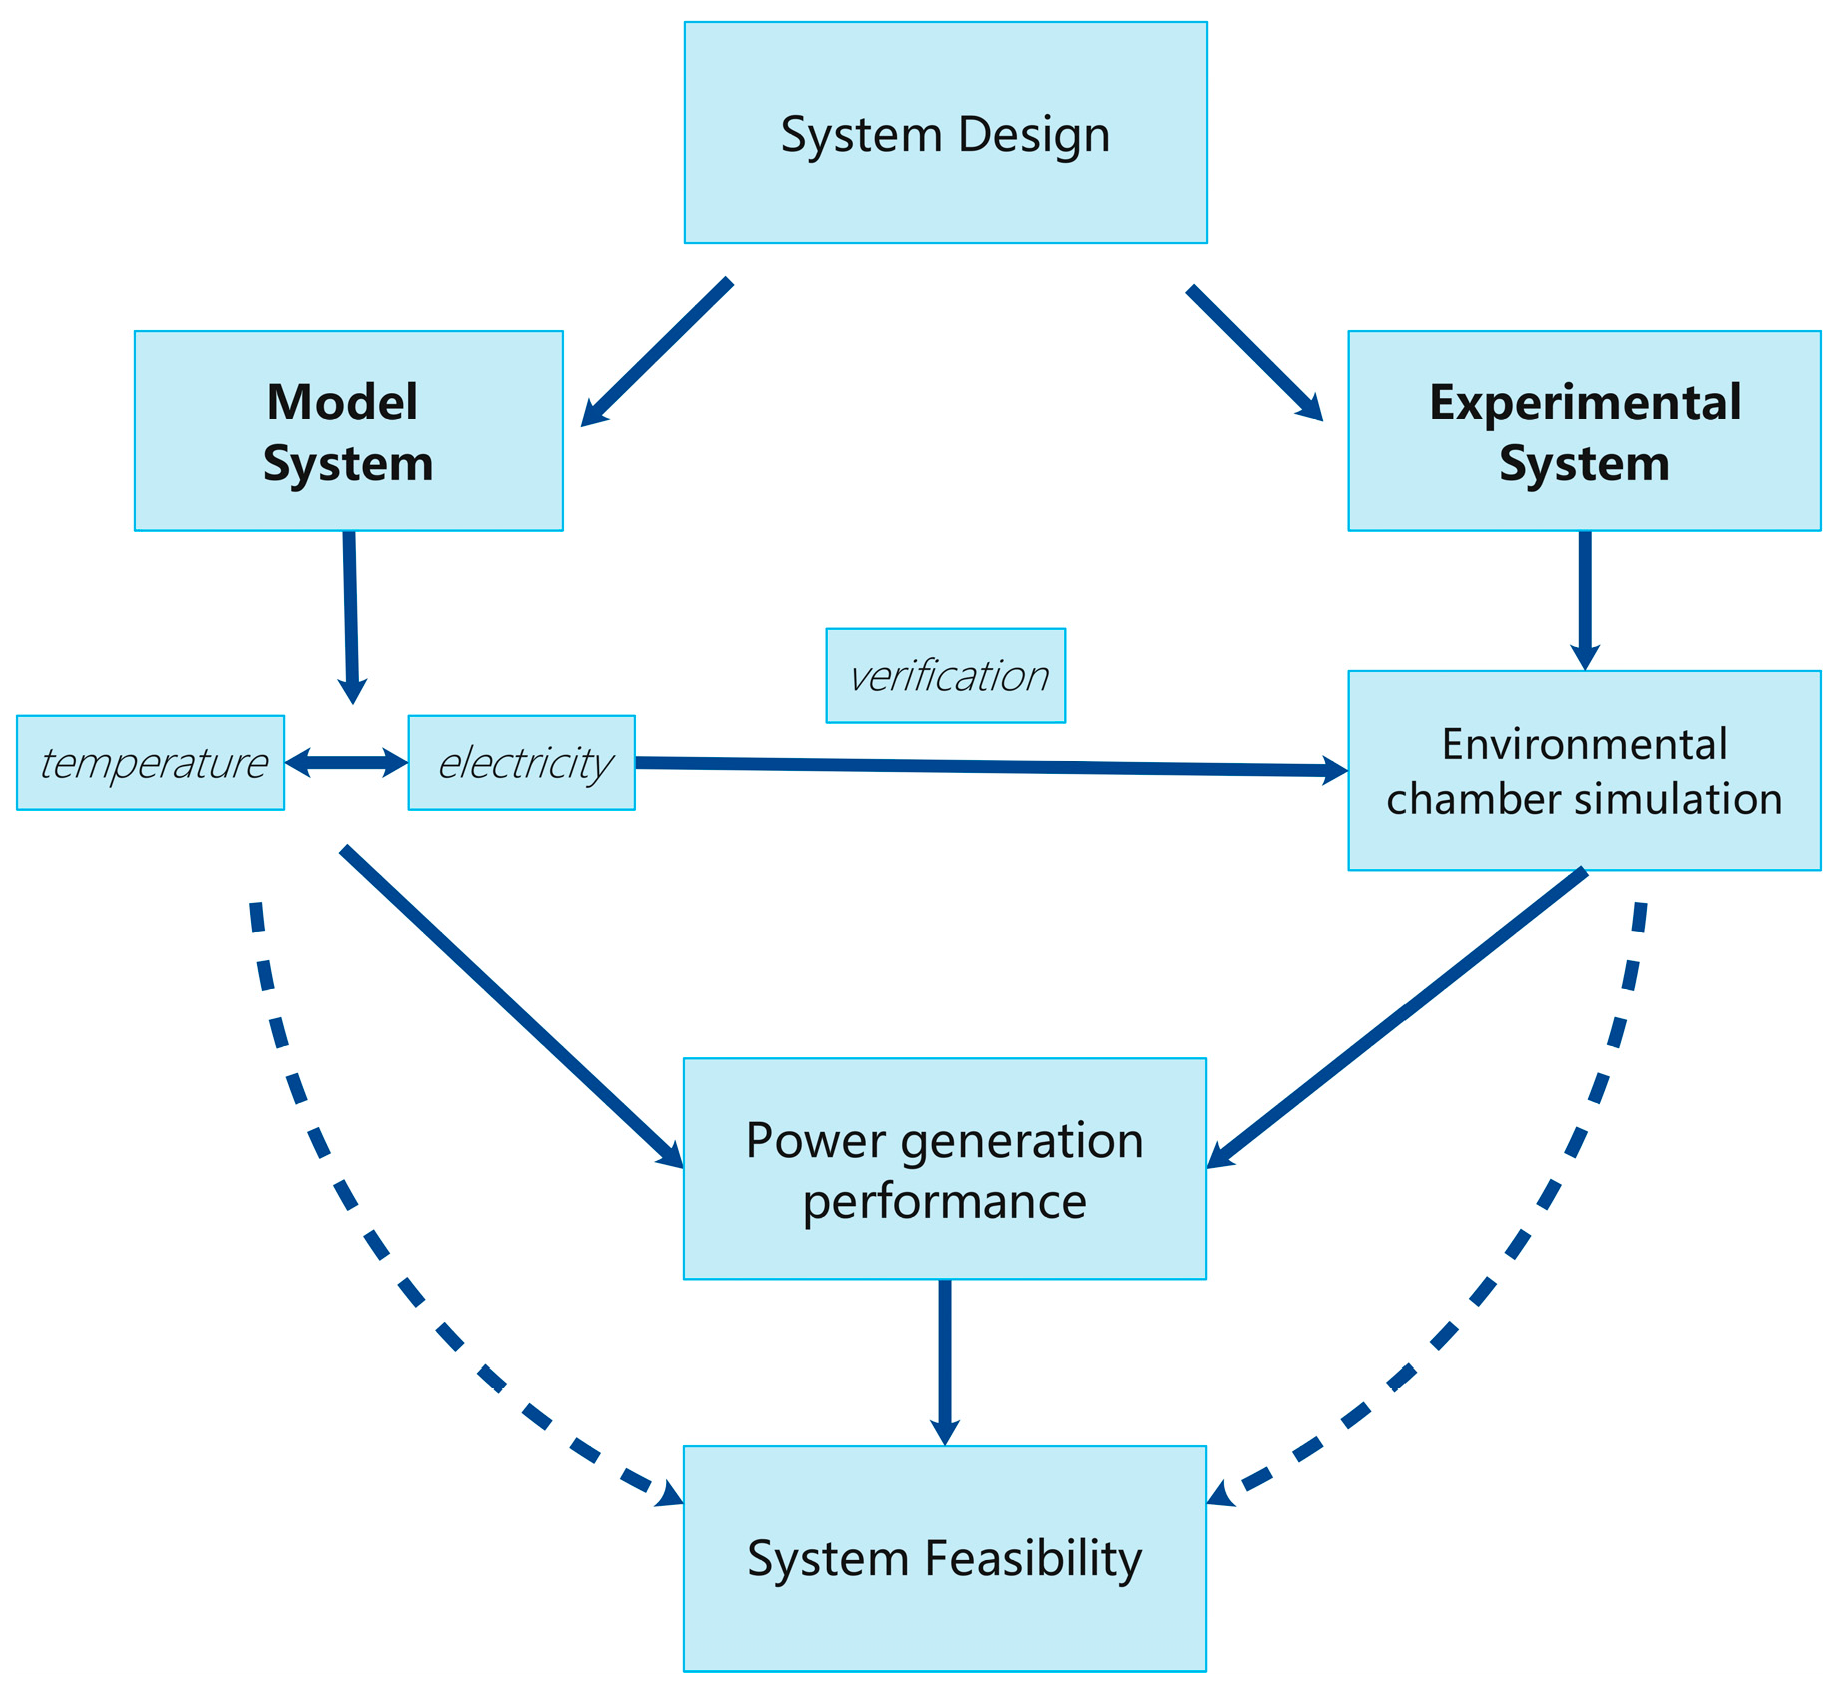
2.2. Software Simulation

COMSOL Multiphysics 6.1 software was employed to simulate the power generation process of the TEPG–Wall System, facilitating the observation of the current flow within the device.

2.2.1. Boundary Conditions and Principles
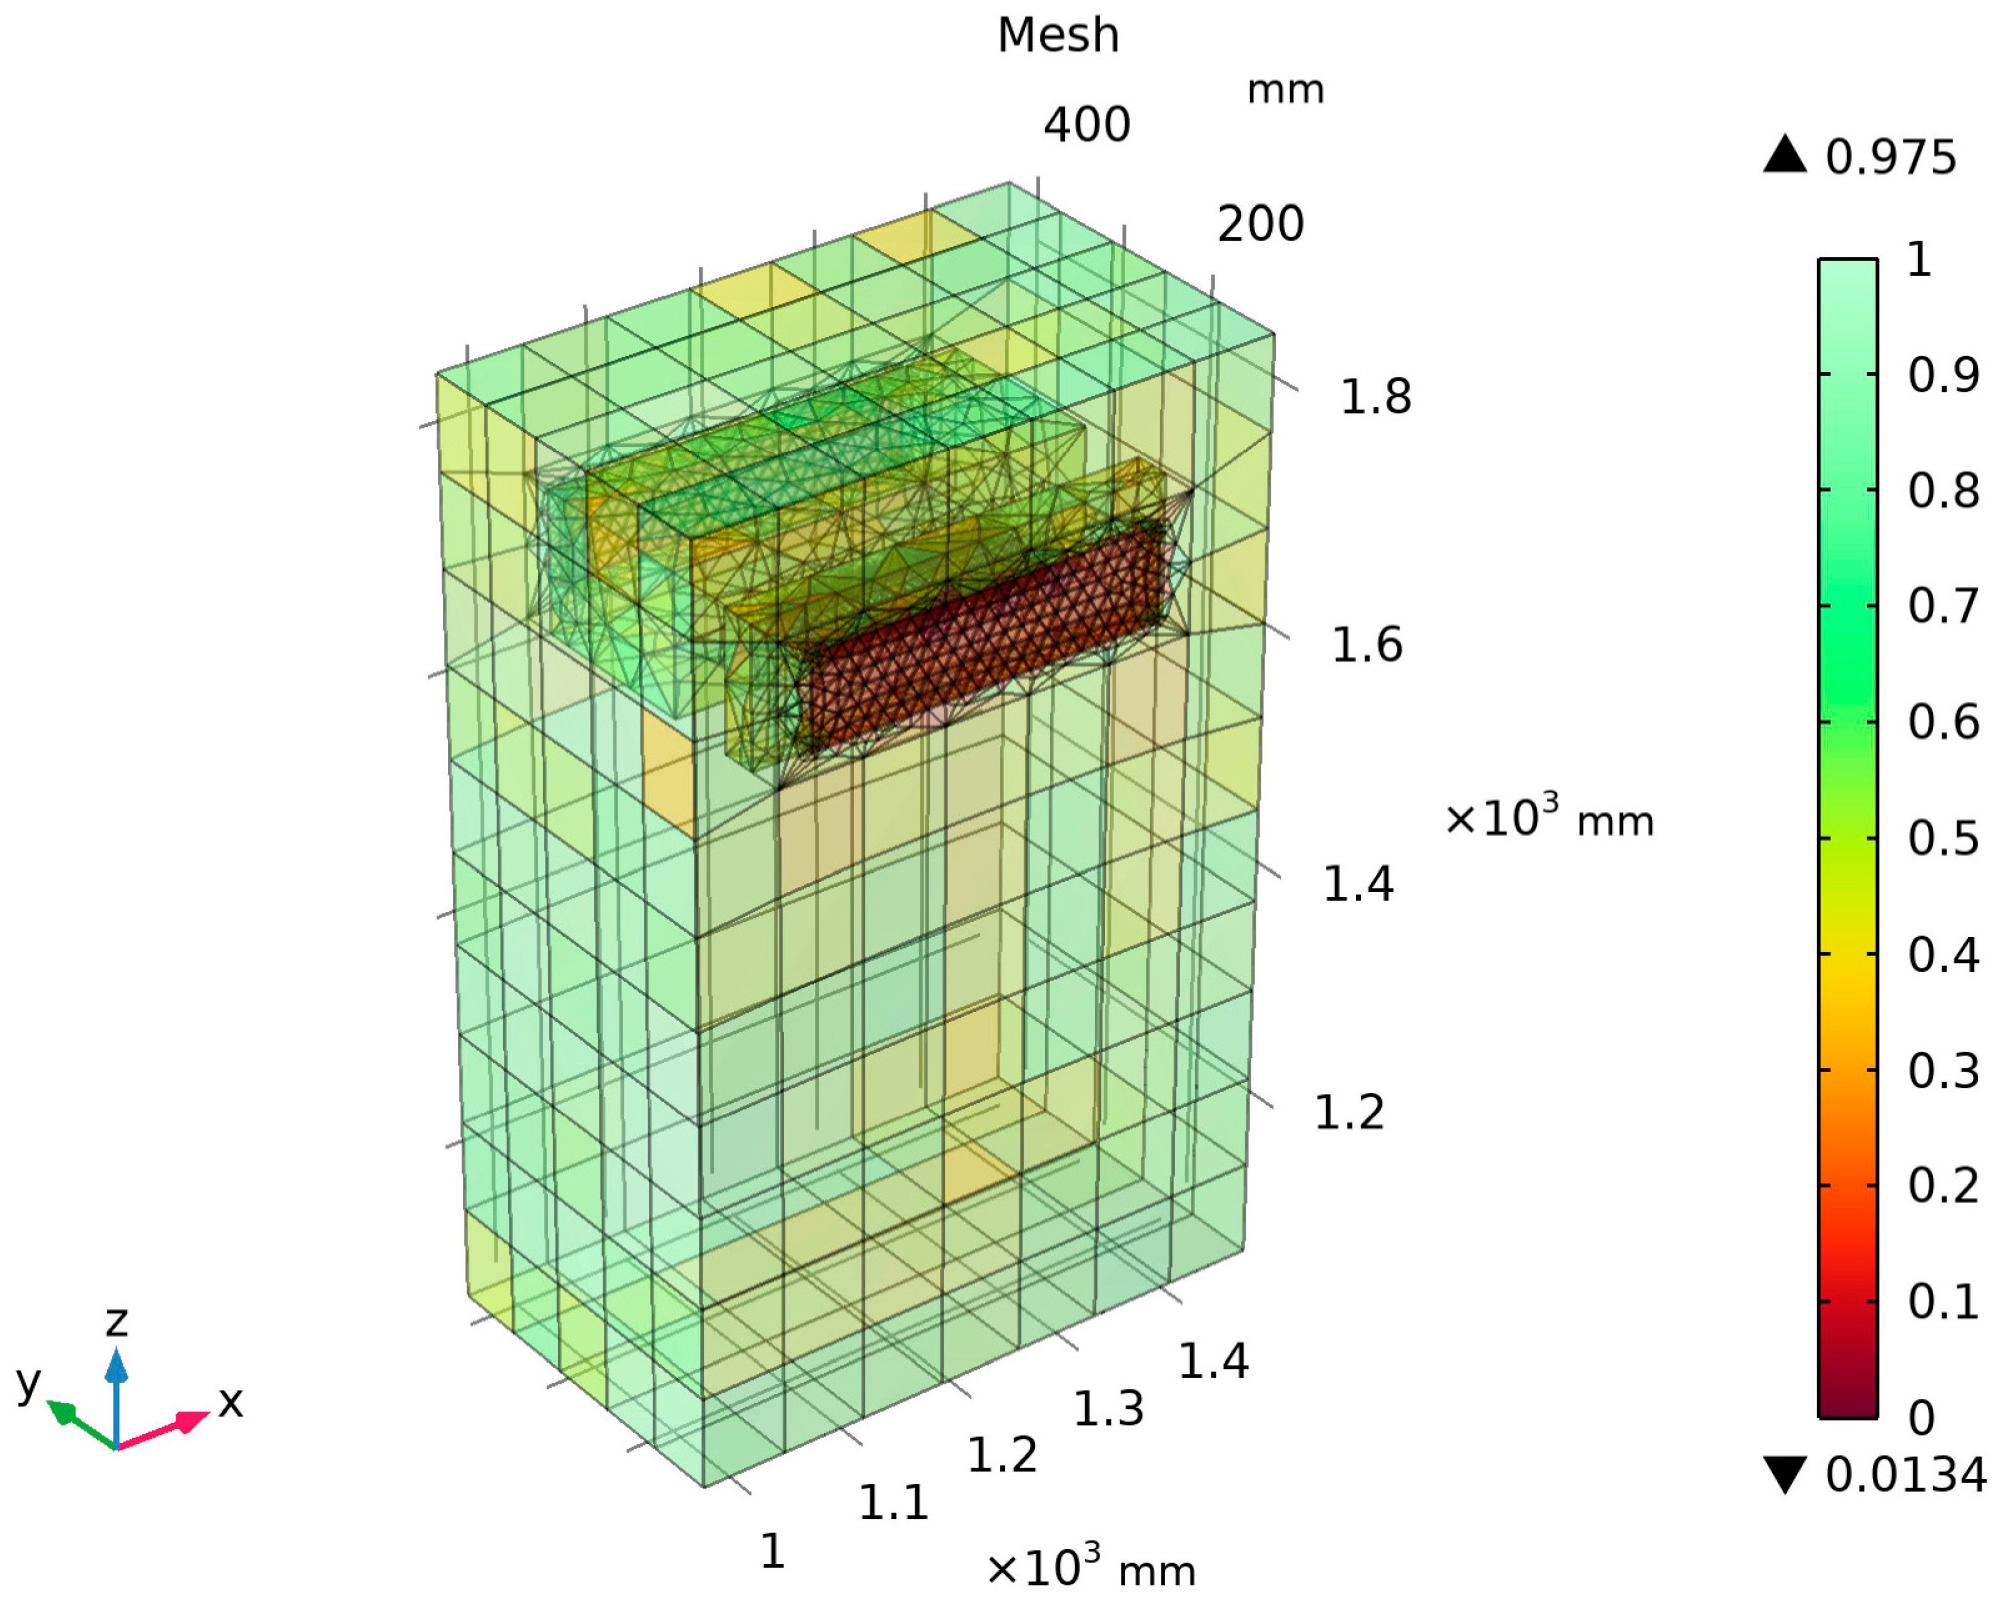
The simulation utilized temperature variations from the Hohhot region in 2023 as boundary conditions, divided into summer, winter, and transitional seasons. In summer, the average high and low temperatures were 30 °C and 18 °C, respectively; in winter, −4 °C and −23 °C; and during the transitional seasons, 15 °C and −8 °C. The minimum and maximum temperatures throughout the year were −29 °C and 31 °C, respectively. The indoor temperature was designed to remain between 18 °C and 28 °C, resulting in a maximum indoor–outdoor temperature difference of 57 °C.
Under steady-state conditions, a model was developed using the principles of solid heat transfer and the thermoelectric effect, addressing three key dimensions: heat transfer, electrical conductivity, and thermoelectric power generation. In the heat transfer model, the governing equation was ρ C p , u T + q = Q + Q t e d , where the heat flux q = k T , indicating synergy among the material density ρ specific heat C p , u and temperature layer T . The heat source term Q and heat generated by thermoelectric conversion Q t e d described the heat transfer dynamics.
For the electrical model, the governing equation was J = Q j , v where the current density J = σ E + J e , with electric field strength E being related to the potential layer, satisfying E = V . This equation characterized the charge flow behavior. The thermoelectric power generation model was defined by the following relationships: P = S T ; q = P J ; J e = σ S V T ; P represents thermoelectric potential, S is the Seebeck coefficient, T denotes temperature, q represents heat flow, J denotes current density, J e denotes electron current density, σ denotes conductivity, and V denotes voltage. Using these equations, the software calculated the potential difference and output current of the thermoelectric device under various temperature gradients, ultimately determining the output voltage and current.

2.2.2. COMSOL Model

This study incorporated the dimensions of the environmental chamber and modeled approximately one-ninth of the wall while maintaining its original thickness. The model included 15 thermoelectric power generation (TEPG) devices and retained essential structural components influencing the thermoelectric and fluid distribution fields, such as heat absorption plates, wall structures, and TEPG units. The simplified model is presented in Figure 3.
The material properties of the components, including concrete, XPS insulation boards, and the aluminum alloy frame, were defined using the material library. Specific material data are provided in Table 1.
The geometric model was discretized using a free tetrahedral mesh, consisting of 551,366 domain elements, 67,336 boundary elements, and 8481 edge elements. The minimum cell size was 0.0134, the maximum was 0.975, and the average cell size was 0.65. A mesh independence analysis was conducted to ensure that the numerical solution remained unaffected by the grid resolution. The specific mesh generation is shown in Figure 4.

2.2.3. Simulation Process

The whole simulation process is shown in Figure 5. It begins with the establishment of a three-dimensional steady-state model, including both material physical and geometric models. After mesh generation, critical parameters—thermal properties of the materials, electrical properties, and building structural configurations—are defined. A convergence check acts as a pivotal decision node: if the results are non-convergent (No), voltage and current simulations are carried out along with post-processing to refine the outcomes iteratively; if convergent (Yes), domain point probes are deployed for localized monitoring. The process concludes after finalizing these steps. This iterative design emphasizes parameter optimization and integrates coupled thermal–electrical–structural analyses to ensure the accuracy of the results before termination.

2.3. Experimental Research

In this experiment, a high-precision multimeter (model DT9205A) was used to measure the current value, with a test accuracy of ±0.05%. A multifunctional high-precision voltmeter (model BY539V) was used to measure the voltage value, also with a test accuracy of ±0.05%. An intelligent temperature controller was used to control the temperature of the hot end, with a test accuracy of ±0.5 °C. To ensure the accuracy of the experimental results, the uncertainty of the tested parameters in this experiment was calculated through the test accuracy and the Bessel equation of the standard deviation, as shown in Table 2.
It can be seen from this that the uncertainties of temperature, voltage, and current are ±5%, ±2%, and ±3%, respectively, which can ensure the accuracy of the experiment.

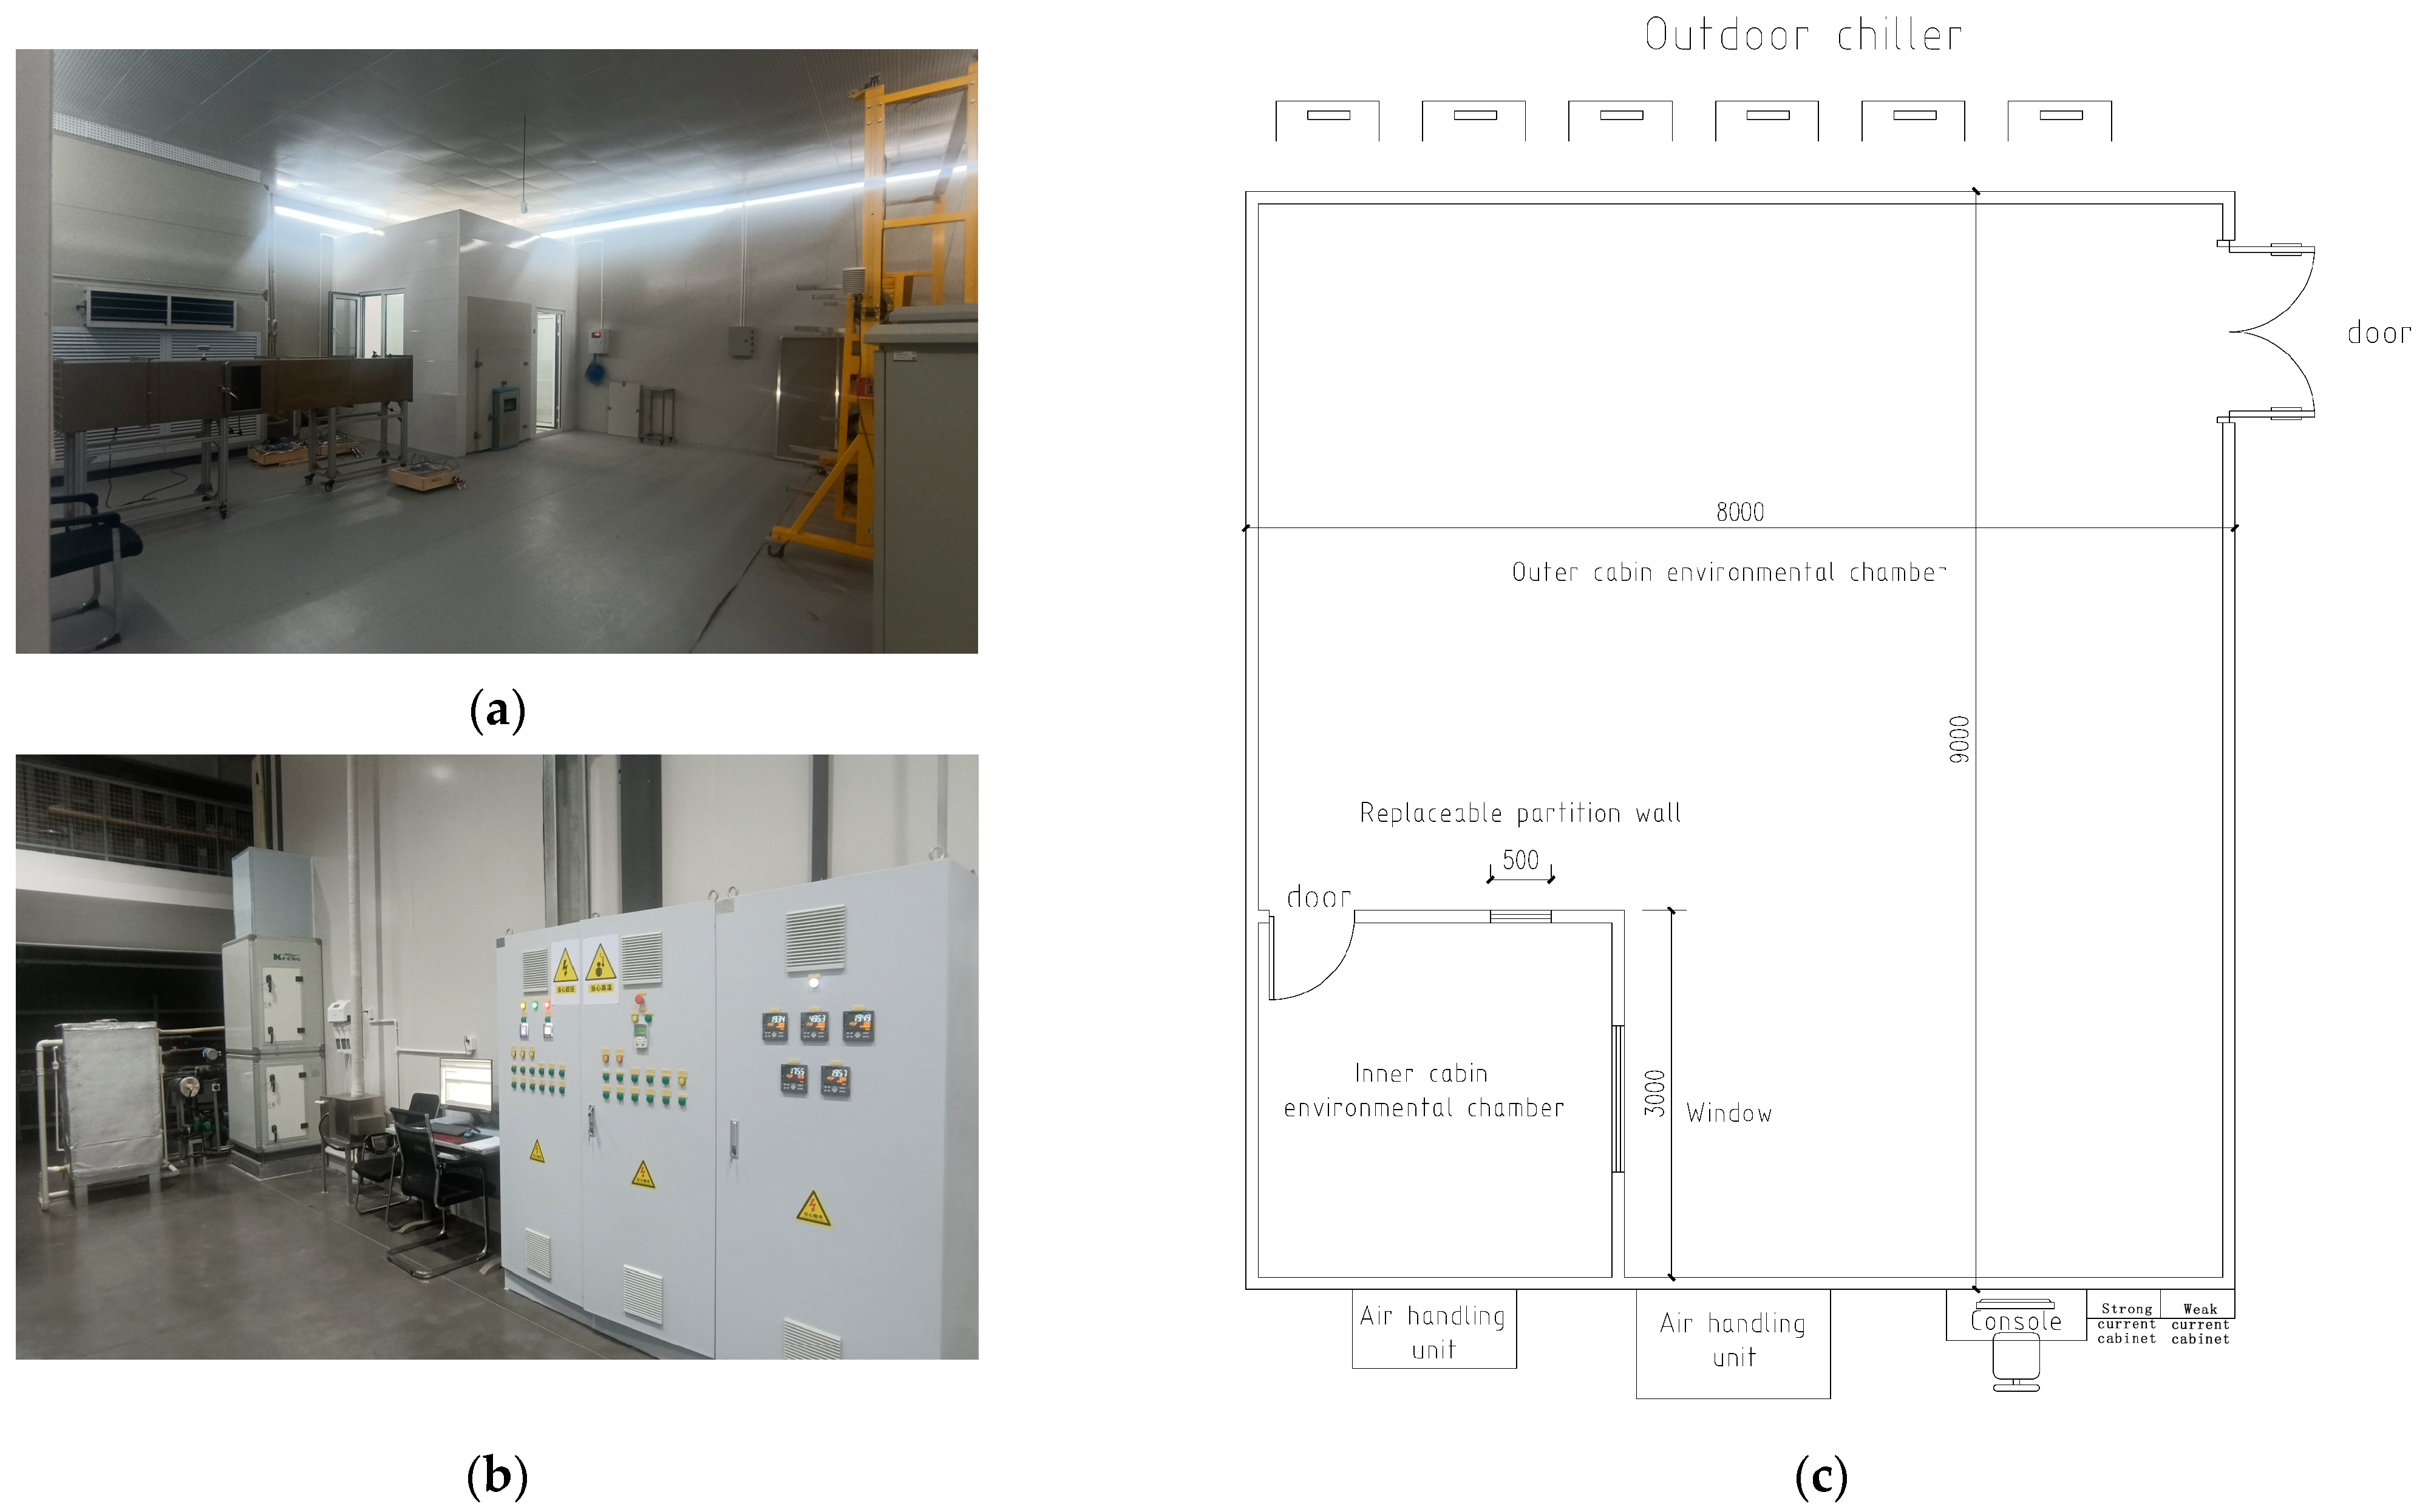
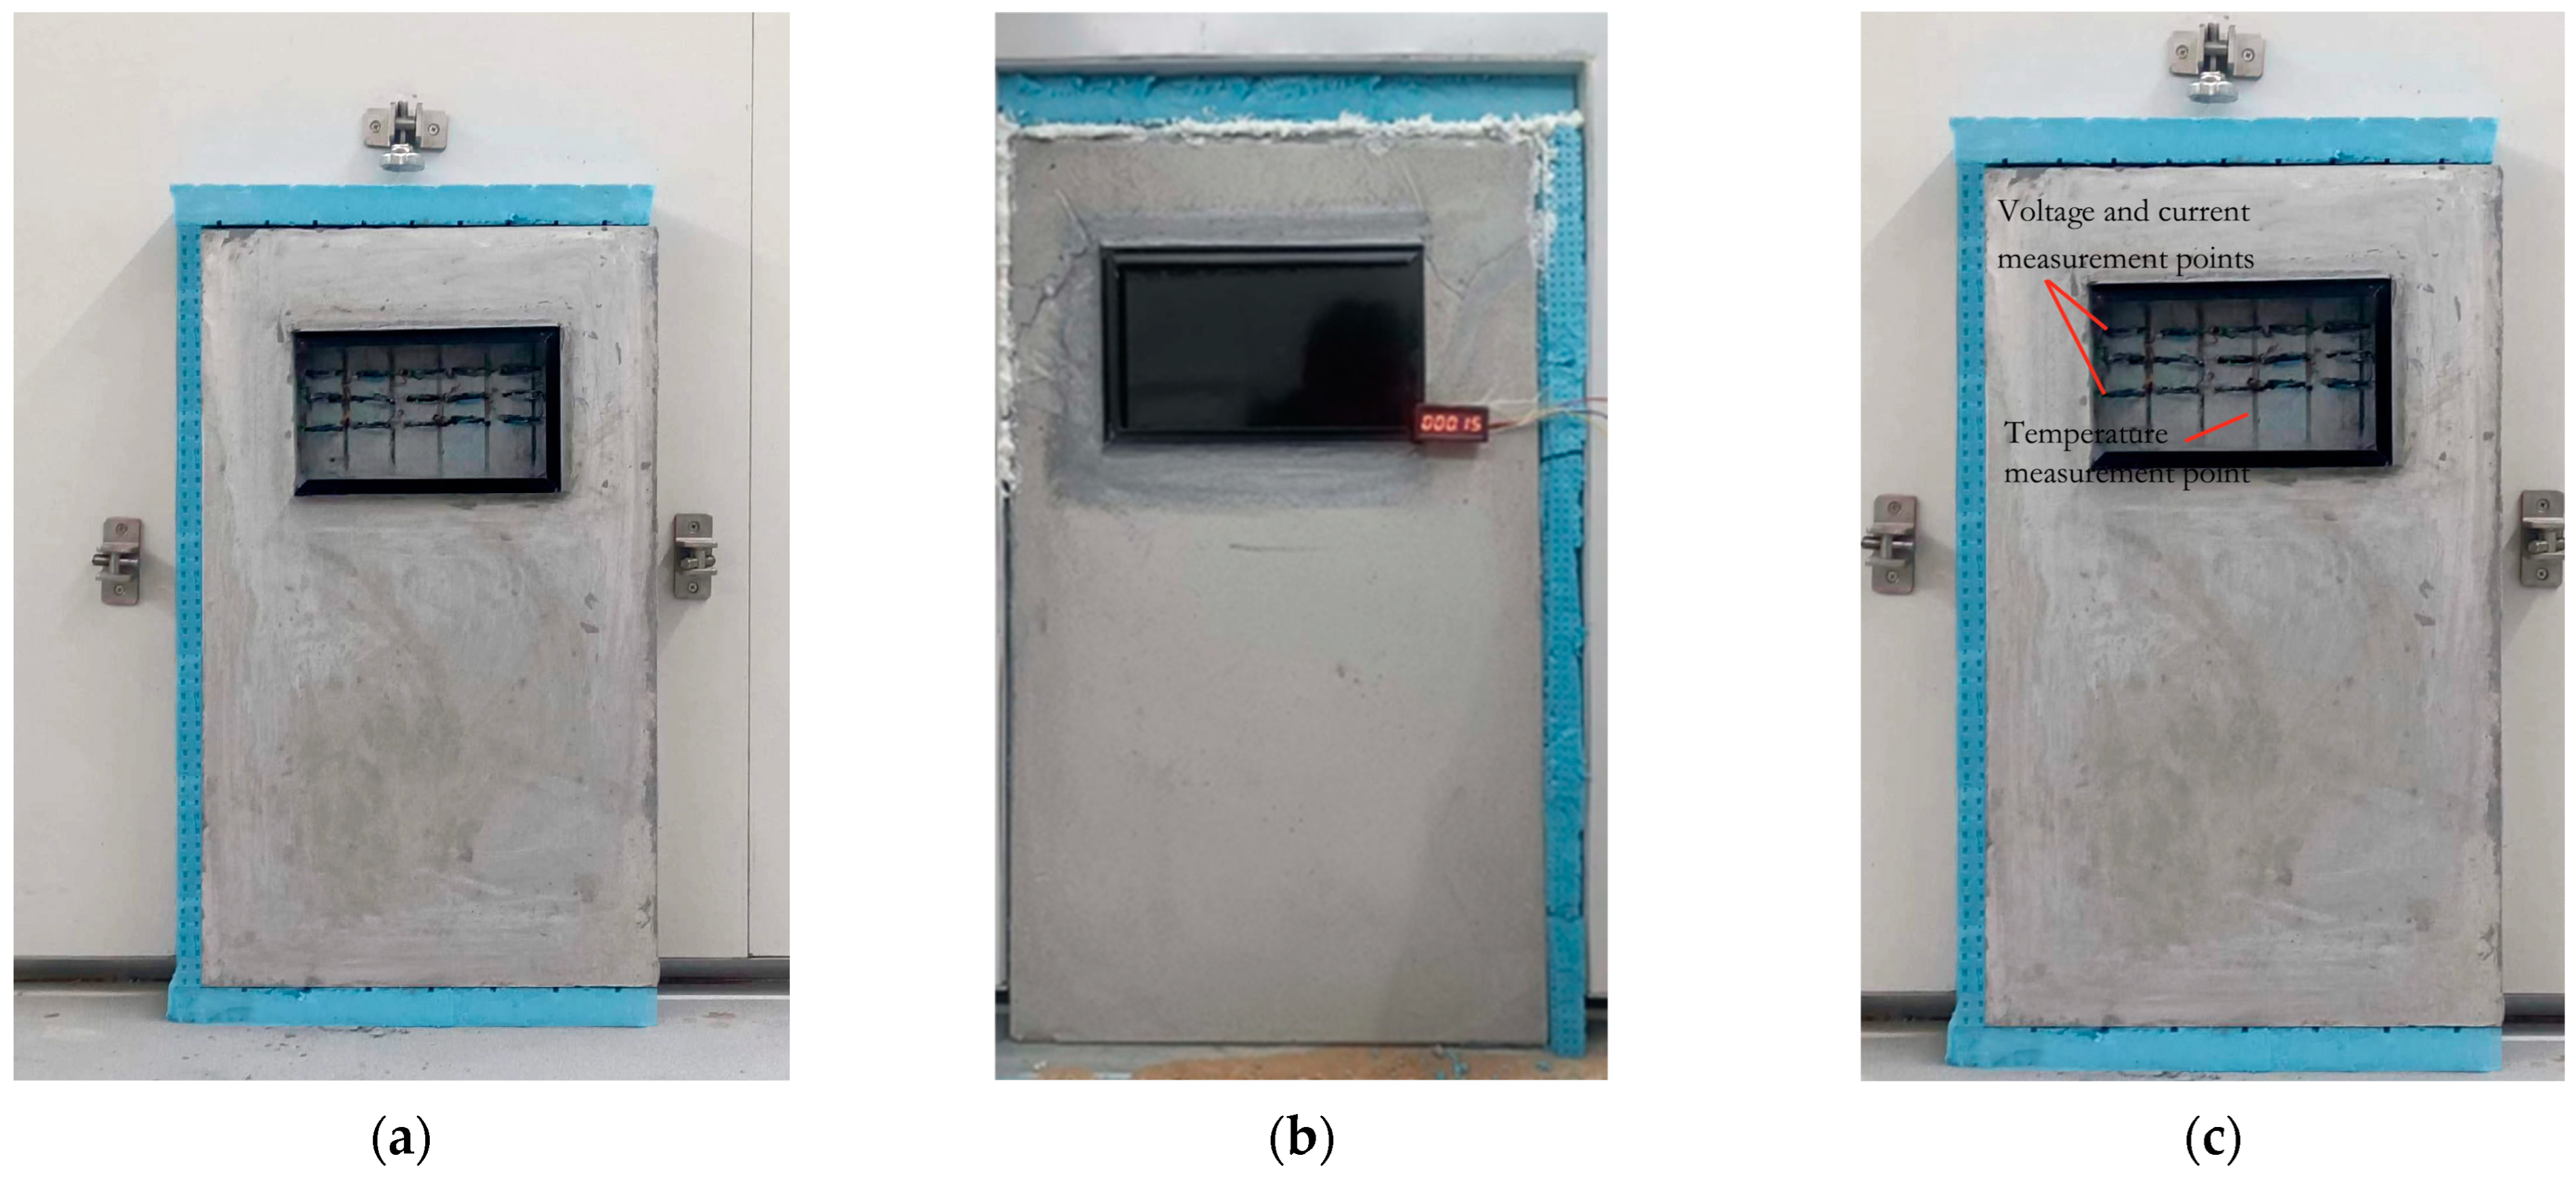
2.3.1. Experimental Setup

The experimental setup included the TEPG–Wall System, an environmental chamber, and measurement instruments. Figure 6 shows the experimental arrangement. The preparatory steps involved verifying the sealing between the inner and outer compartments of the environmental chamber, calibrating the temperature sensors, voltmeters, and ammeters, and inspecting the physical condition of the TEPG–Wall System.

2.3.2. Experimental Procedure

The TEPG devices were arranged in parallel within the insulation layer of the assembled wall and positioned between the inner and outer compartments of the chamber. Electrical connections were established between the TEPG devices, voltmeters, ammeters, and a data acquisition card. The temperature parameters were set, and the system was stabilized before data collection.
Data, including voltage, current, indoor and outdoor temperatures, humidity, and cavity temperatures, were recorded at 10 min intervals over two cycles. Output voltage and current values were captured via the data acquisition card. Figure 7b illustrates the voltage output dynamics under transient temperature gradients, captured experimentally during the stabilization phase of the environmental chamber. The physical model and representative experimental results are shown in Figure 7.

3. Results

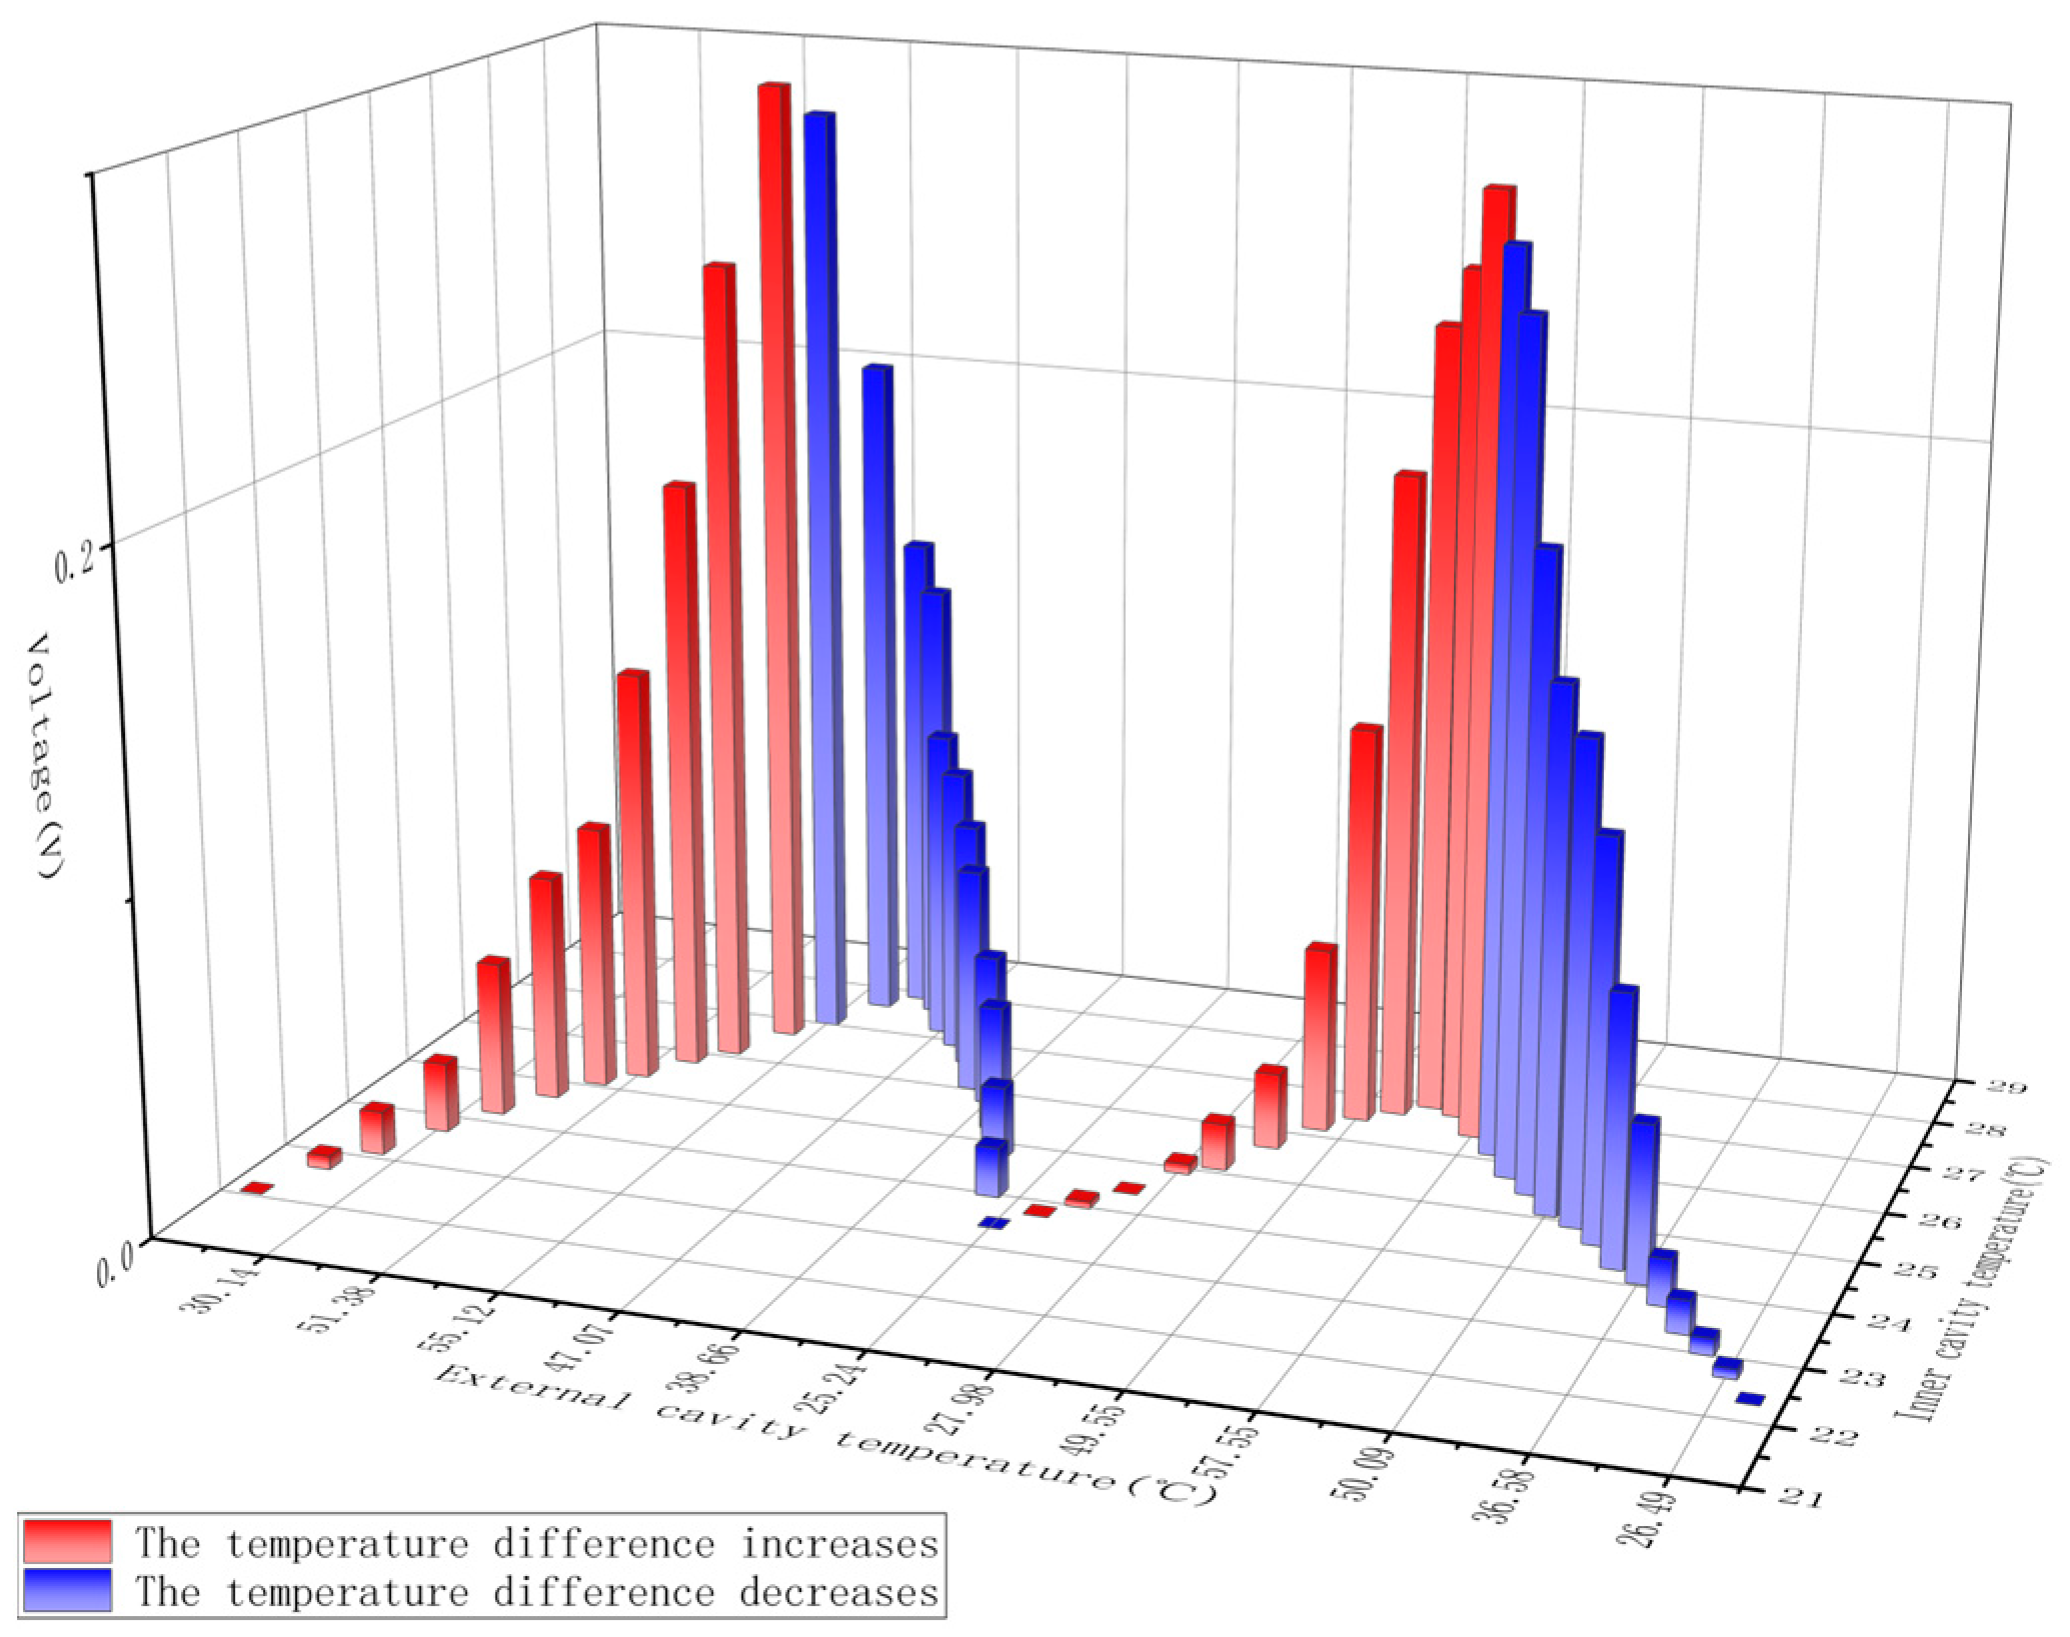
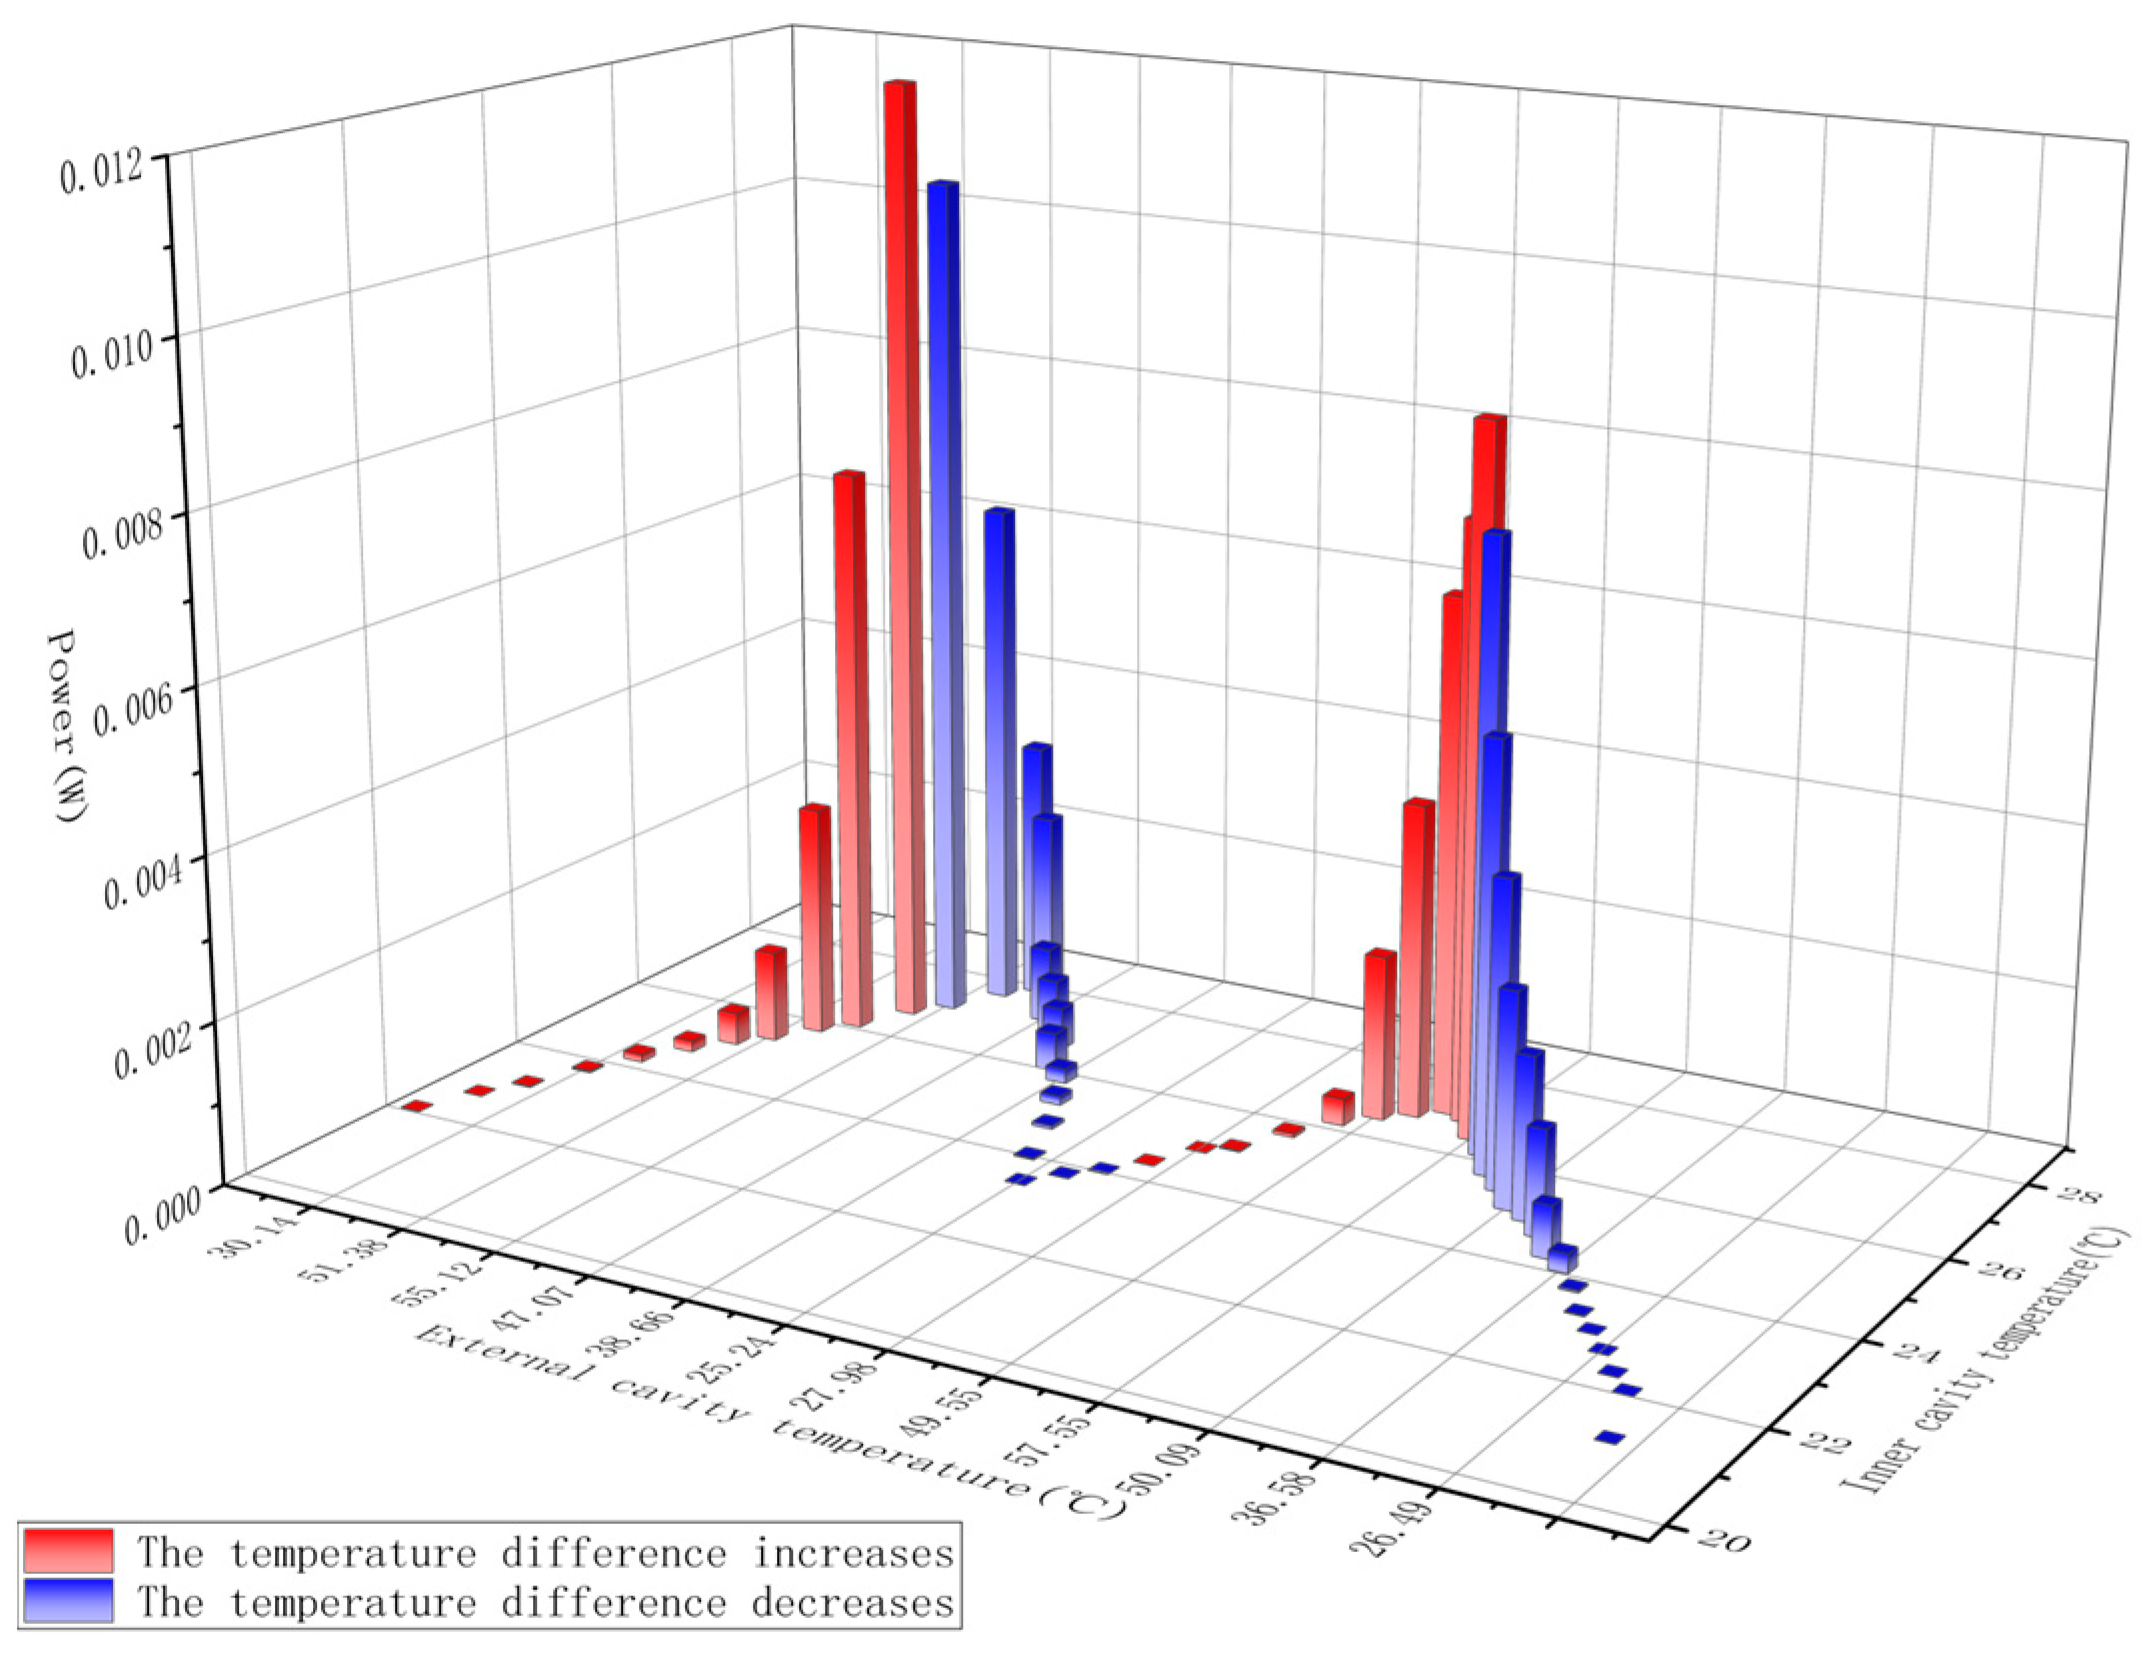
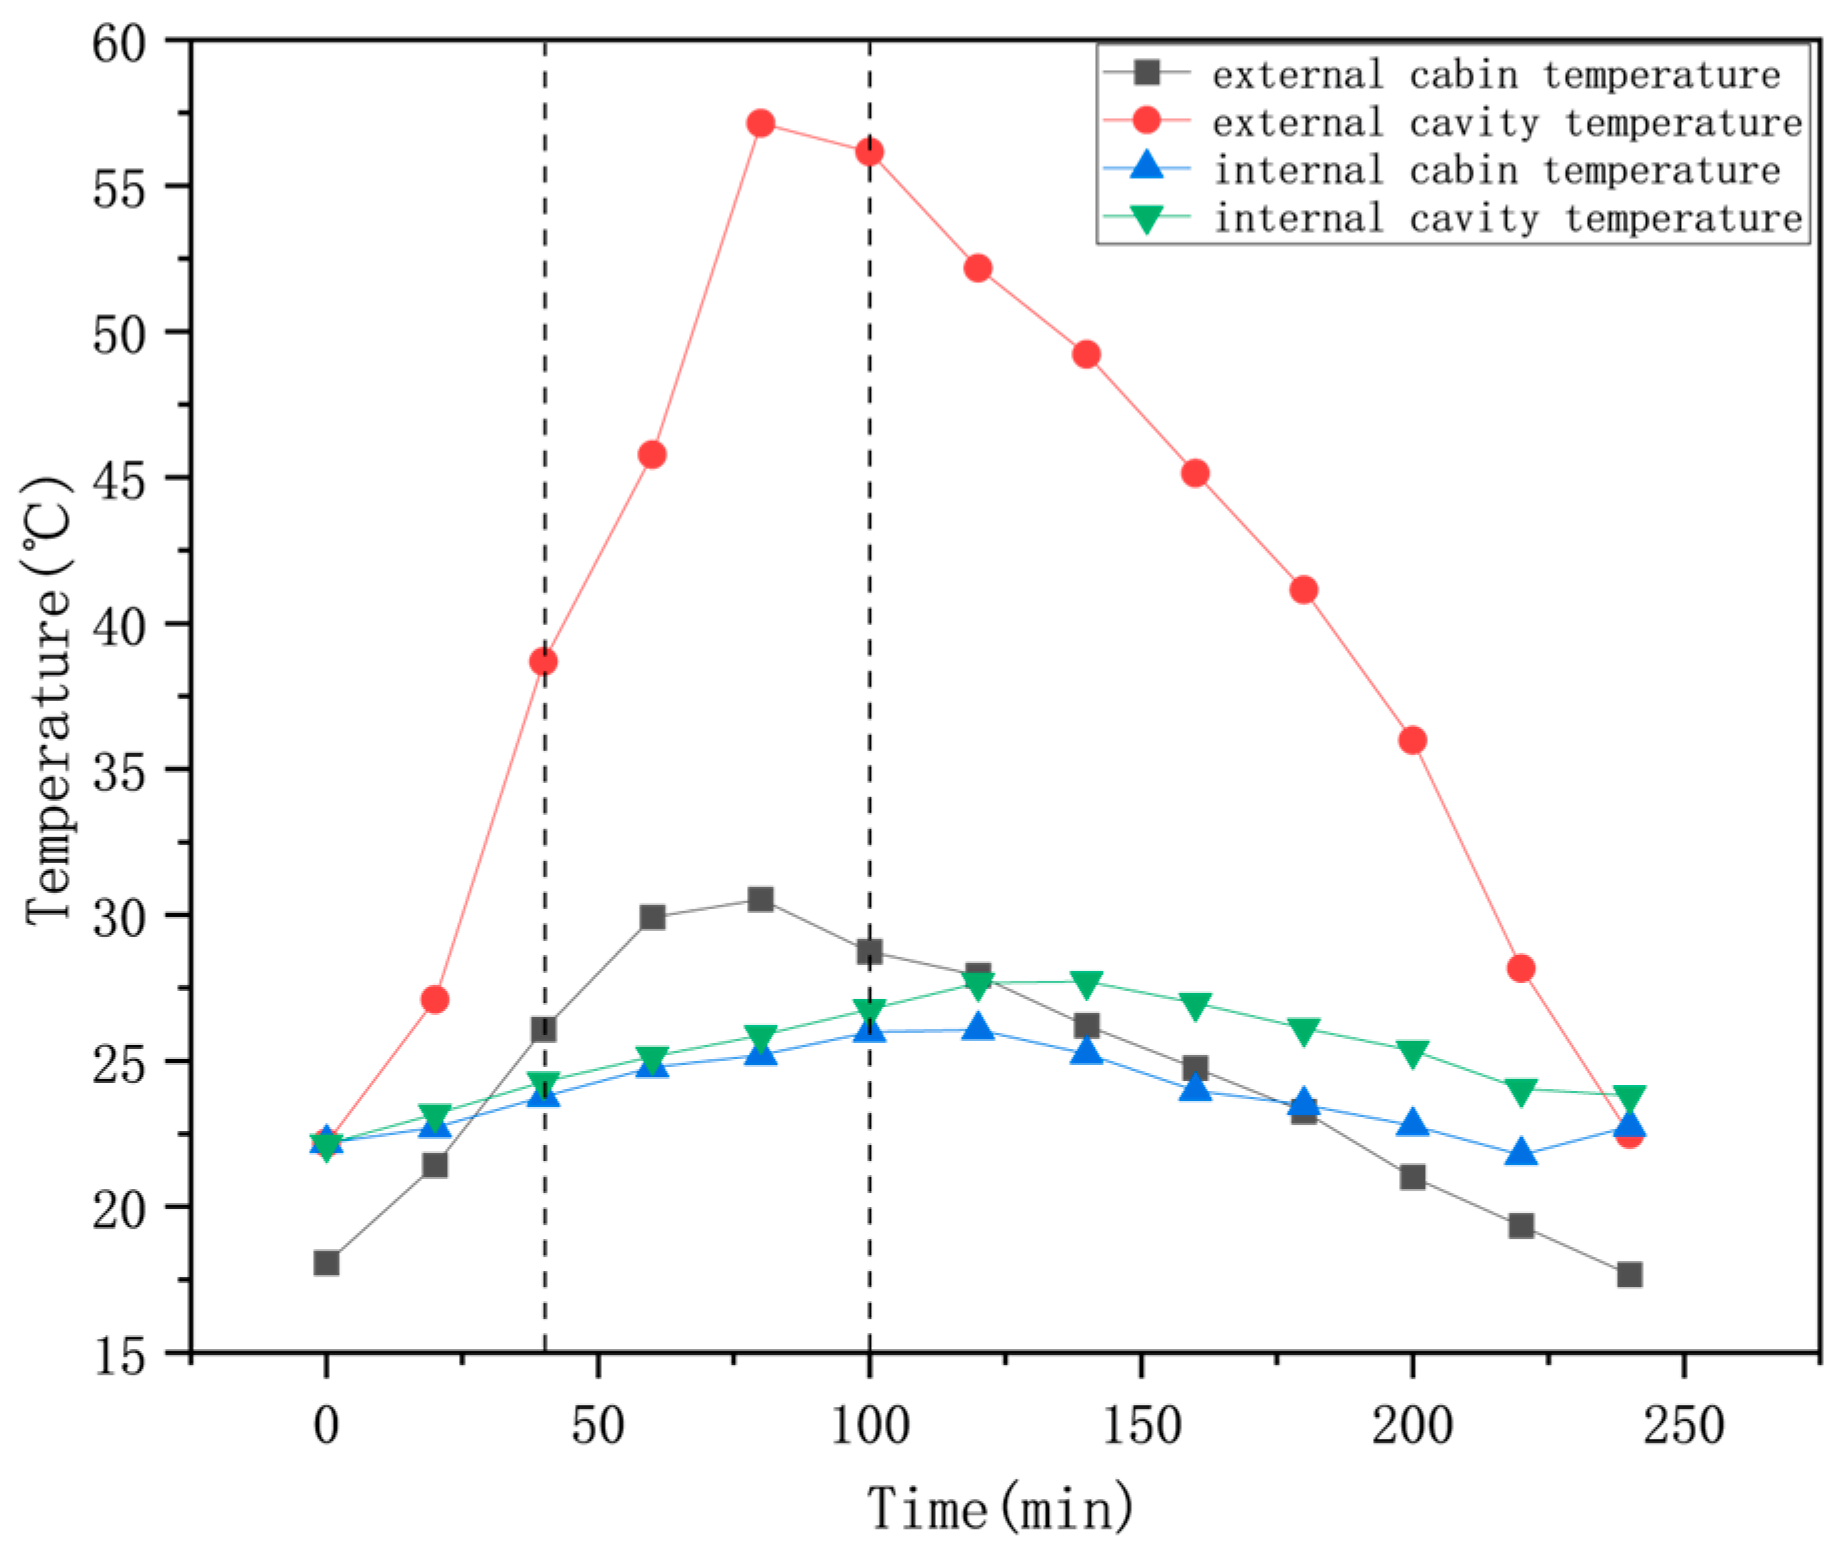
3.1. Summer Power Generation Performance

To ensure the accuracy of the experimental data, the temperature of the outer compartment was controlled to cycle between 18 °C and 30 °C, while the inner compartment temperature was maintained within the range of 16 °C to 28 °C. Under these conditions, multiple variables, including the ambient temperature of the outer compartment, cavity temperature of the outer and inner compartments, voltage, and current, were recorded under different conditions. The experimental results in summer are shown in Appendix A. Based on the collected data, the U/T and P/T diagrams for the TEPG–Wall System were generated, as shown in Figure 8 and Figure 9.
Figure 8 demonstrates that the TEPG–Wall System begins to generate voltage when a temperature difference of approximately 5 °C exists between the inner and outer compartments. The output voltage exhibits a positive correlation with the temperature difference, indicating that a larger temperature difference results in a higher voltage output. During the summer, the maximum voltage of approximately 0.3 V was recorded when the temperature of the outer compartment reached around 55 °C and the inner compartment temperature stabilized at approximately 26 °C.
Figure 9 reveals that power generation begins when a temperature difference of approximately 10 °C is established between the inner and outer cavity temperatures. The output power also demonstrates a positive correlation with the temperature difference, with greater temperature differences yielding higher power outputs. The system achieved a maximum power output of approximately 0.012 W during the summer when the temperature difference reached about 55 °C, with an inner cavity temperature of 26 °C. The average power output was approximately 0.001 W. The extrapolation assumes the temporal scalability of energy generation under representative average conditions. While this simplification introduces uncertainties—particularly regarding short-term thermal transients—the robustness of our dataset (spanning 50+ experimental trials across varying temperature differentials) supports its validity for estimating seasonal trends. Future studies incorporating real-time dynamic modeling could further refine these projections.
Thus, the experimental data were recorded every 10 min, with the average energy output per 10 min interval expressed as follows:
W = P t = 0.001 × 10 × 60 = 0.6 J
Thus, the total energy generated over 500 min was approximately 28.57 J. Extrapolating this to the entire summer, the total power generated was approximately 2.16 × 10⁻³ kWh.

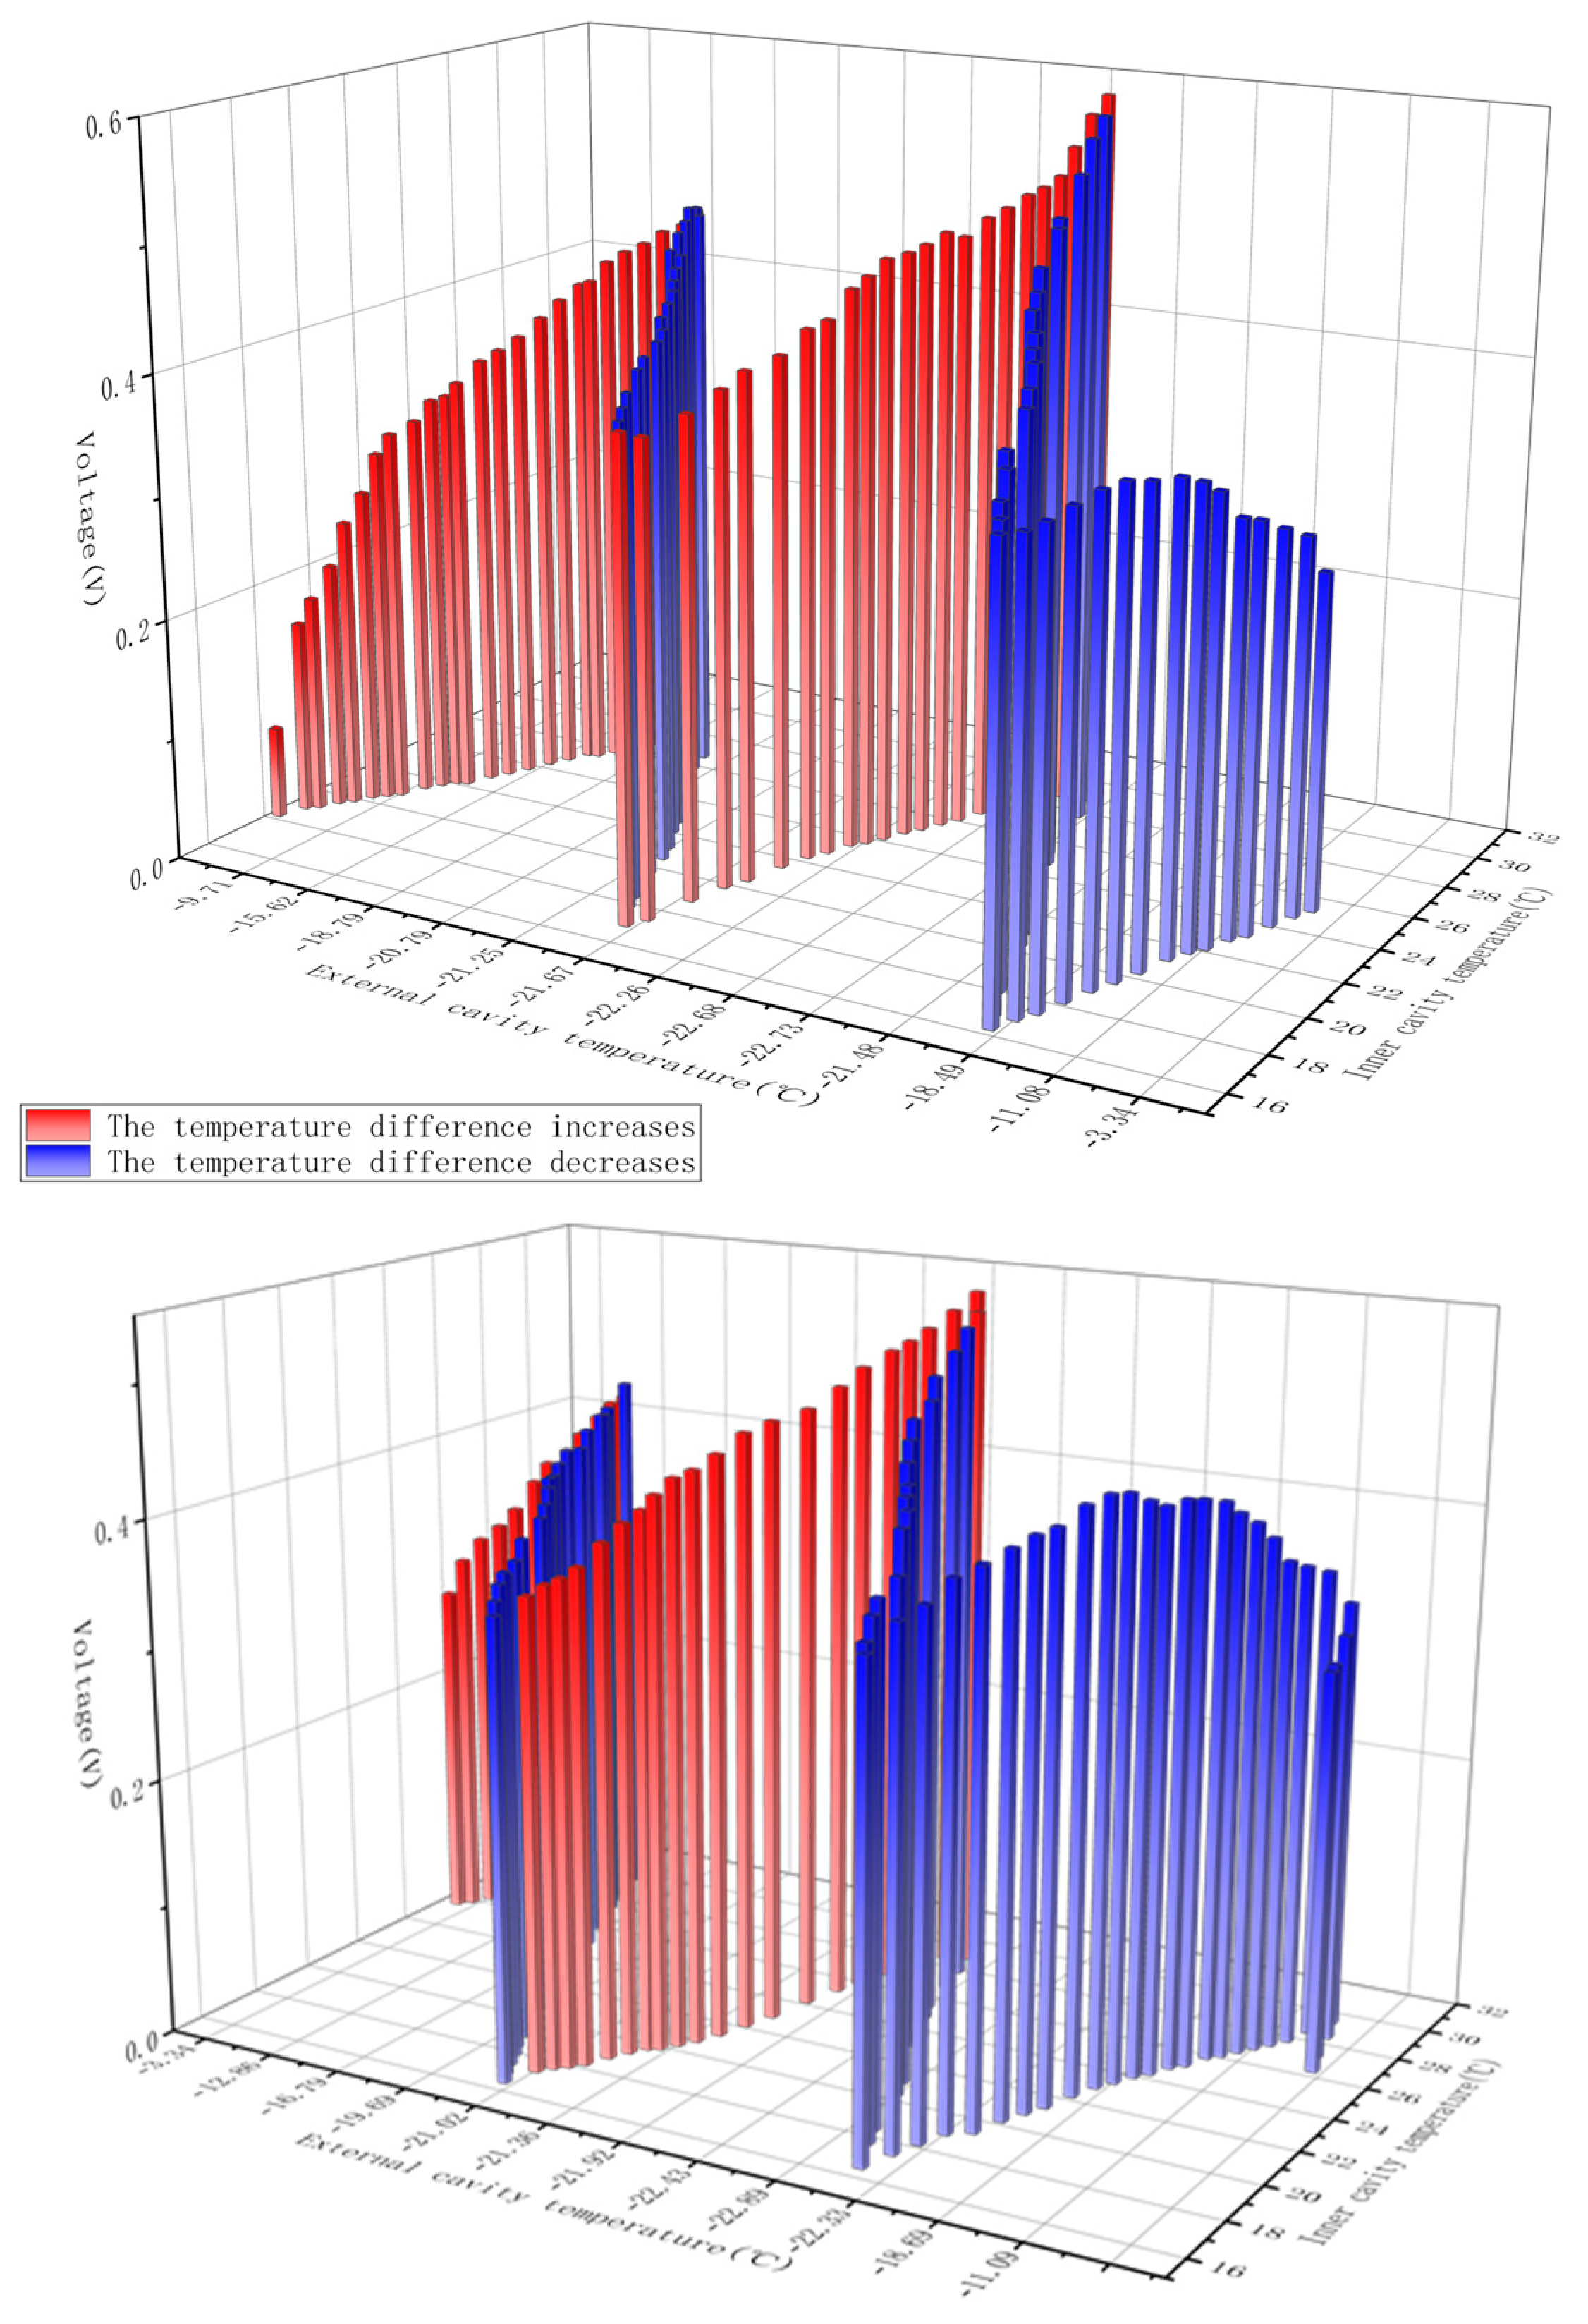
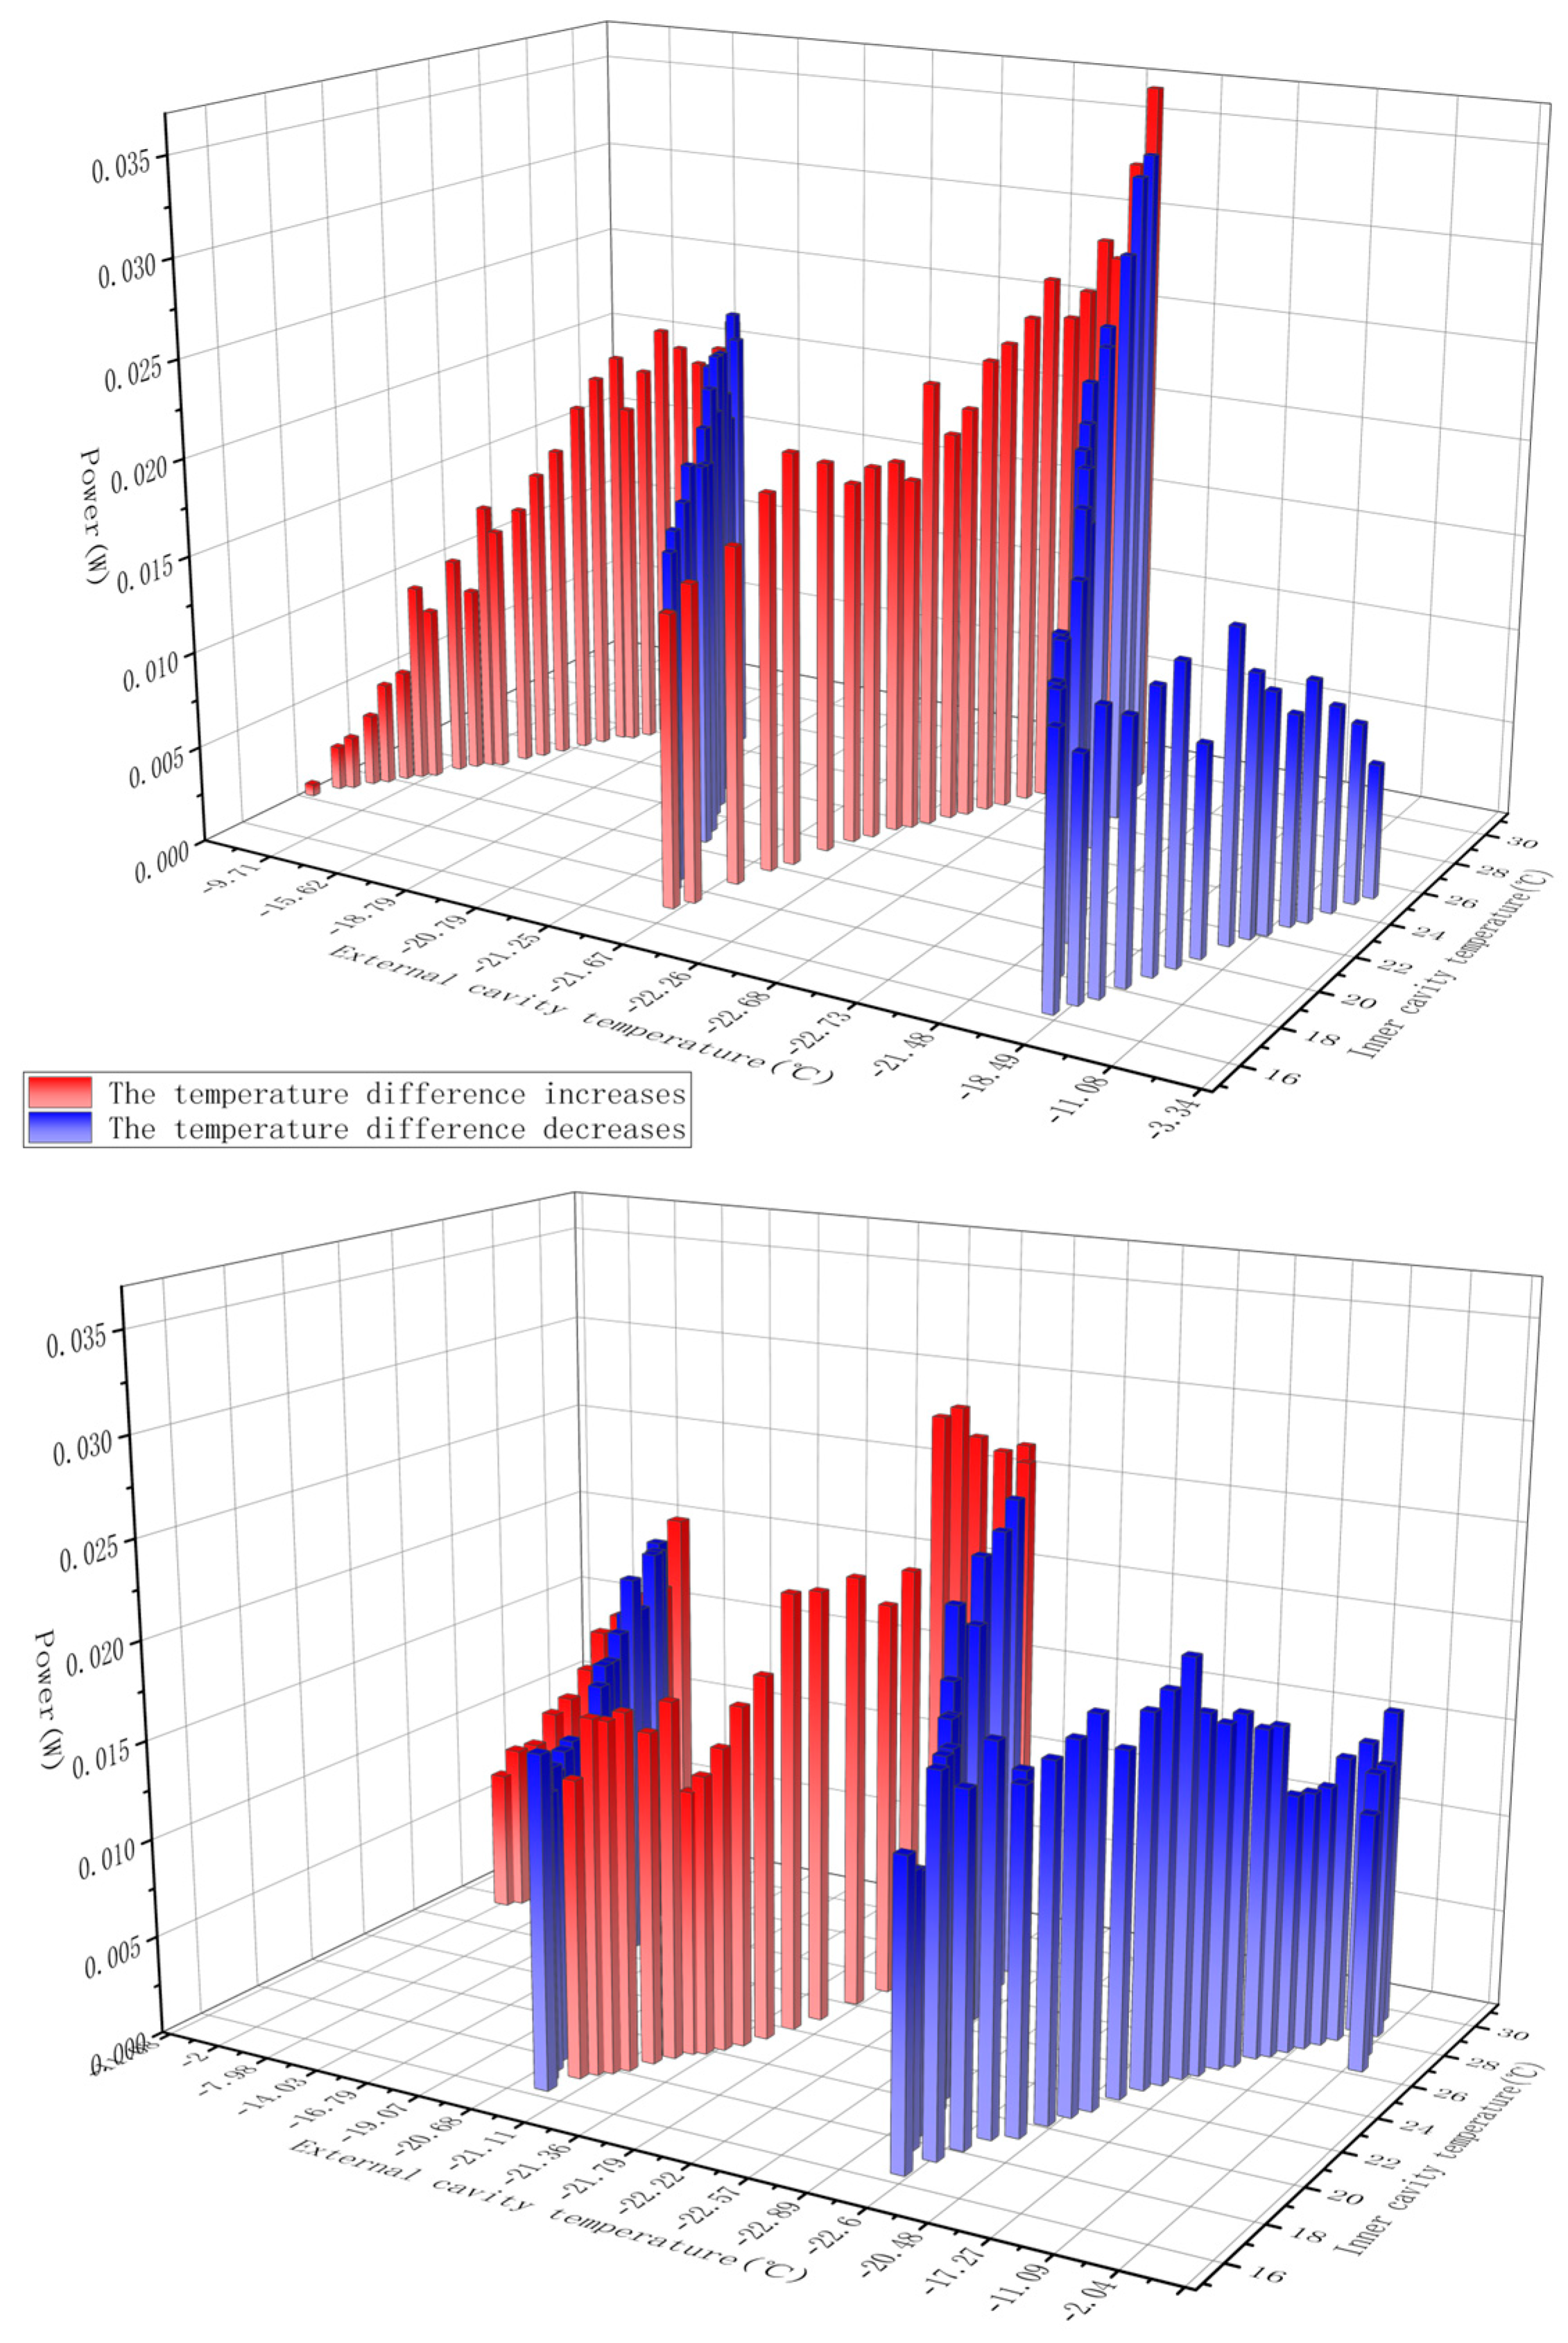
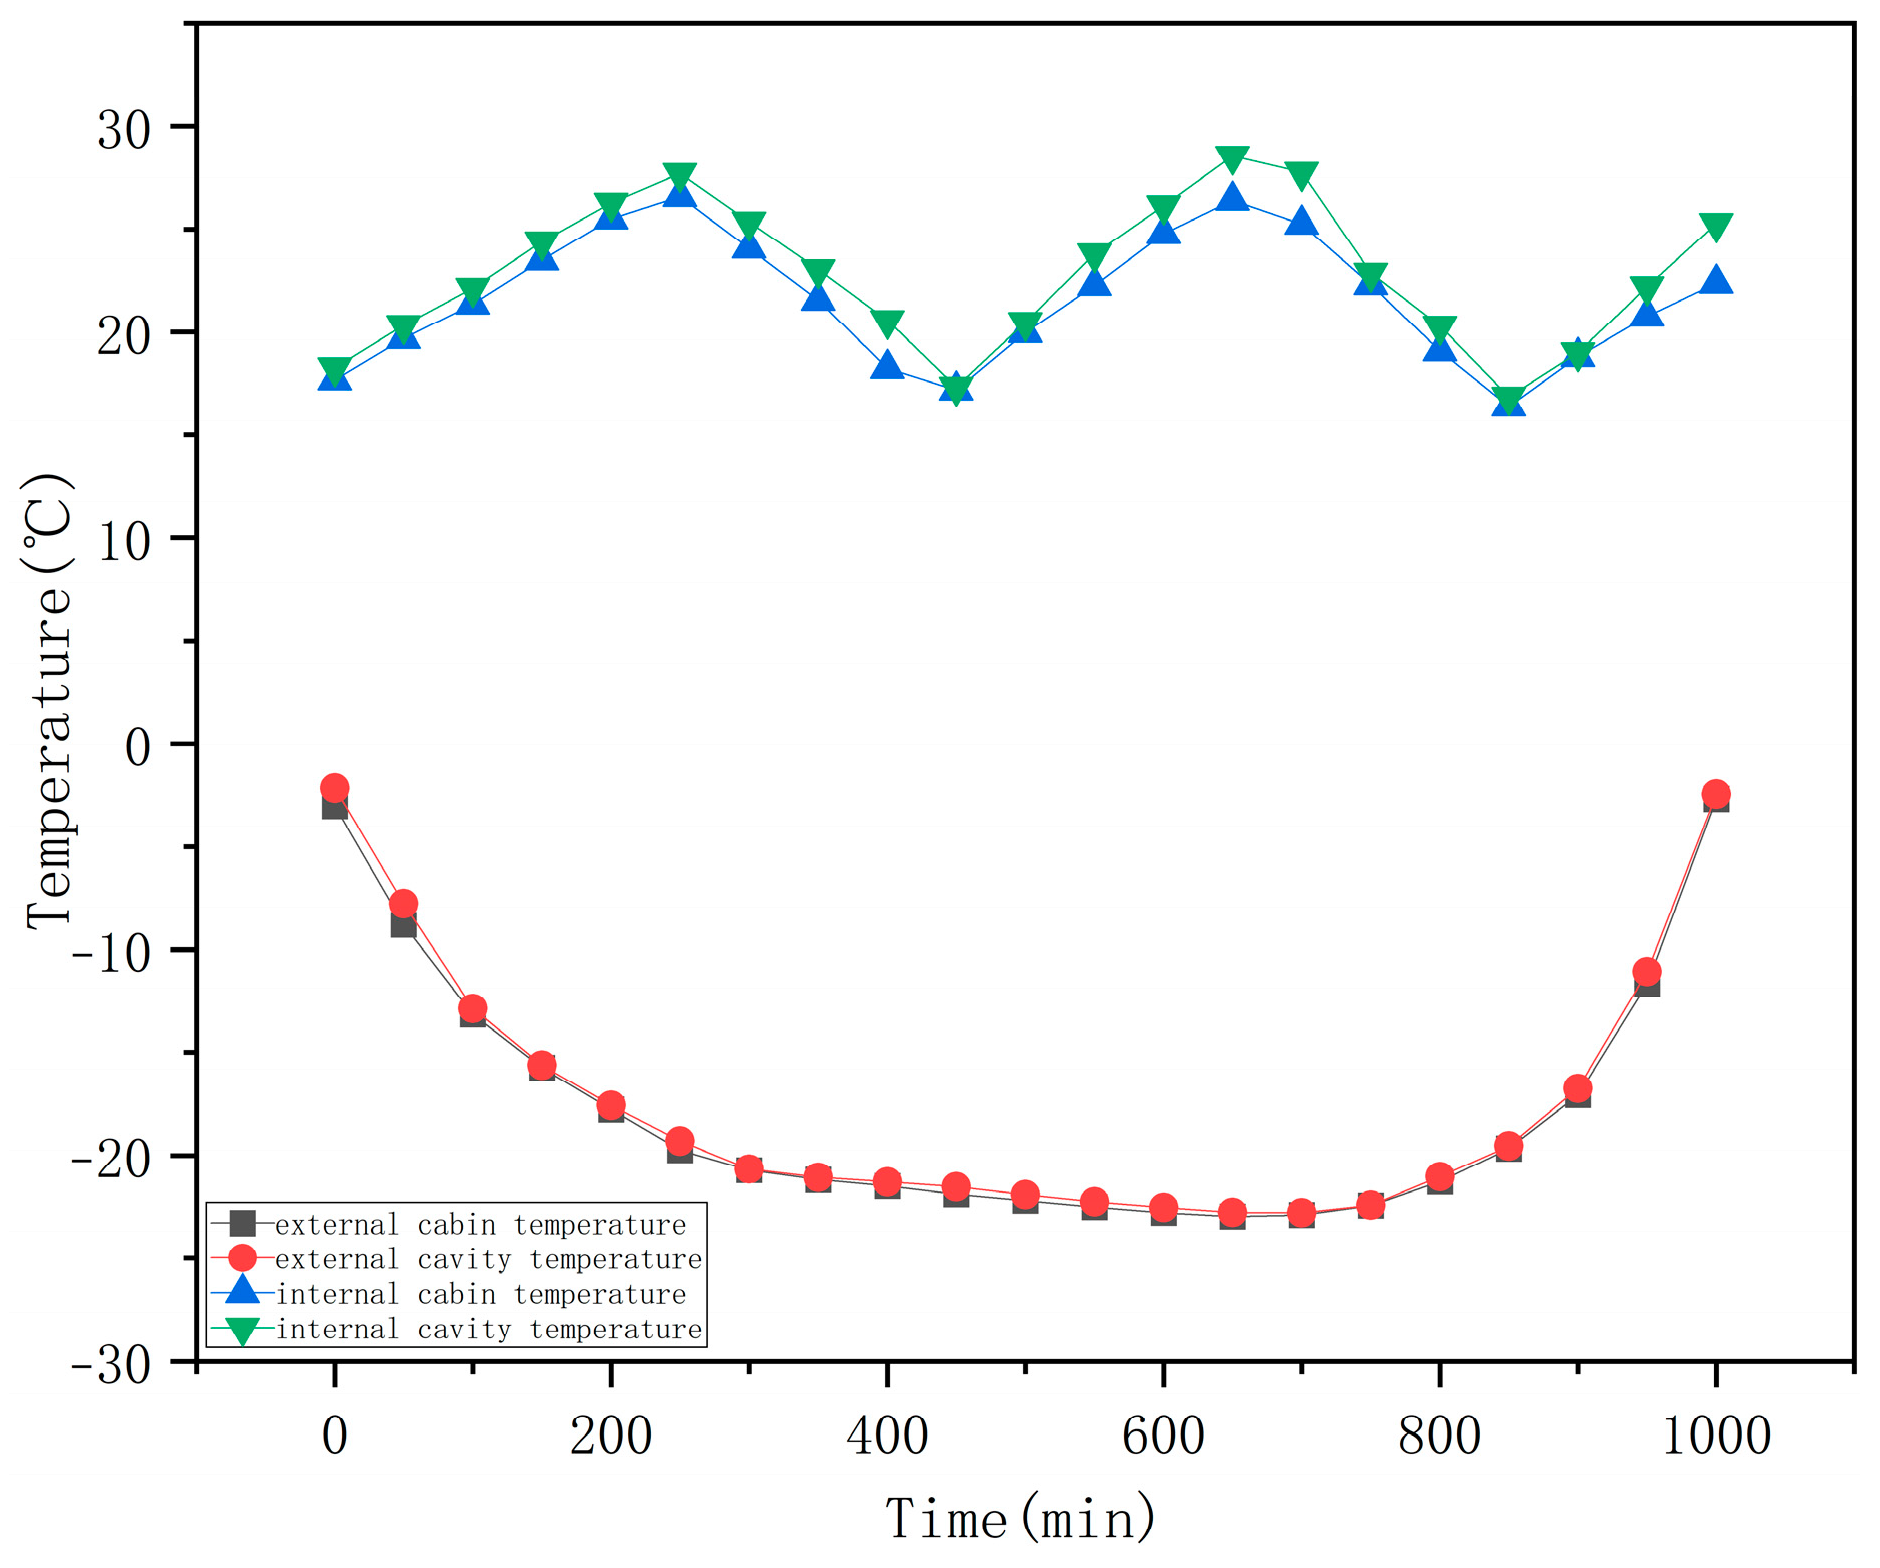
3.2. Winter Power Generation Performance

During the winter experiments, the outer compartment temperature was cycled between −4 °C and −23 °C over two iterations, while the inner compartment temperature was maintained within the range of 18 °C to 26 °C. Additionally, the heat-absorbing plate was replaced with a glass cover plate. The experimental results in winter are shown in Appendix B. Based on the recorded data, the U/T and P/T diagrams for the TEPG–Wall System are presented in Figure 10 and Figure 11.
The output voltage of the TEPG–Wall System exhibited a positive correlation with the temperature difference between the compartments. When the outer compartment temperature reached approximately −22 °C and the inner compartment temperature reached around 30 °C, the maximum voltage output was approximately 0.5 V.
Figure 11 illustrates the power generation performance of the system. The output power commenced at a minimum temperature difference of 20 °C between the inner and outer compartments. The power output was also positively correlated with the temperature difference. At the outer compartment temperature of −23 °C and the inner compartment temperature of 28 °C, corresponding to a temperature difference of approximately 51 °C, the maximum output power reached 0.037 W. The average output power was approximately 0.017 W.
The experimental data, recorded at 10 min intervals, indicated an average energy output of 10.2 J per 10 min. Over a 1980 min duration, the total energy output was calculated to be 2077.81 J, which equates to approximately 0.049 kWh for the entire winter season.

3.3. Power Generation Performance in the Transition Season

For the transition season experiment, the outer compartment temperature was cycled between −8 °C and 15 °C over two iterations, while the inner compartment temperature was maintained within the range of 18 °C to 26 °C. The positions of the heat absorption plate and the glass cover plate remained unchanged throughout the experiment. The experimental results in the transition season are shown in Appendix C. The U/T and P/T diagrams derived from the collected data are presented in Figure 12 and Figure 13.
The output voltage of the TEPG–Wall System was positively correlated with the temperature difference between the compartments. The voltage reached a maximum of approximately 0.28 V when the outer compartment temperature was −7 °C, the inner compartment temperature was 26 °C, and the temperature difference was approximately 33 °C. The rate of voltage increase varied across different temperature ranges. For instance, when the temperature difference increased from 2.33 °C to 10.4 °C, the voltage increased from 0.011 V to 0.037 V, indicating a relatively moderate growth rate. However, as the temperature difference increased from 25.77 °C to 36 °C, the voltage increased from 0.205 V to 0.259 V, reflecting a steeper growth rate.
The power generation performance, depicted in Figure 13, demonstrated that the system began generating power at a temperature difference of approximately 10 °C. The output power was positively correlated with the temperature difference. The maximum power output of approximately 0.0065 W was achieved when the outer compartment temperature was −8 °C, the inner compartment temperature was 26 °C, and the temperature difference was 34 °C. The average power output was approximately 0.002 W.
Based on the data collected at 10 min intervals, the average energy output per interval was 1.2 J. Over a 770 min duration, the total energy output was approximately 69.30 J, which corresponds to about 7.44 × 10⁻³ kWh for the entire transition season.

4. Discussion

4.1. Thermal Behavior of the System

4.1.1. Heat Collection Performance of the System Collector

As illustrated in Figure 14, when the heat-absorbing plate is positioned on the outer vane wall (summer configuration), the outer cavity temperature exhibits a marked increase with increasing ambient temperatures in the outer compartment. Specifically, as the ambient temperature increased from 18.07 °C to 30.94 °C, the outer cavity temperature increased from 22.18 °C to 56.48 °C, demonstrating a strong positive correlation. This correlation indicates the effectiveness of the endothermic plate and the cavity design on the outer vane wall in significantly elevating the temperature at the hot end of the thermoelectric power generation (TEPG) device. Conversely, when the ambient temperature of the inner compartment increased from 22.18 °C to 26.39 °C, the inner cavity temperature increased only modestly, from 22.14 °C to 27.10 °C, resulting in a noticeable temperature differential between the cavities.
Figure 15 shows that when the heat-absorbing plate is placed on the inner vane wall (winter configuration), the temperature of the inner cavity increases proportionally with the gradual increase in the inner compartment’s ambient temperature. This finding aligns with the observations of Wu et al. [17], reaffirming that the endothermic plate design significantly elevates the temperature at the hot end of the TEPG device. As the ambient temperature of the outer compartment decreases, the outer cavity temperature exhibits a corresponding decline, with both trends closely aligned. When the outer compartment temperature reaches its minimum, the outer cavity temperature also reaches its lowest value. These results suggest that the glass cover strongly influences the outer cavity temperature, ensuring a close correspondence with the ambient temperature of the outer compartment.

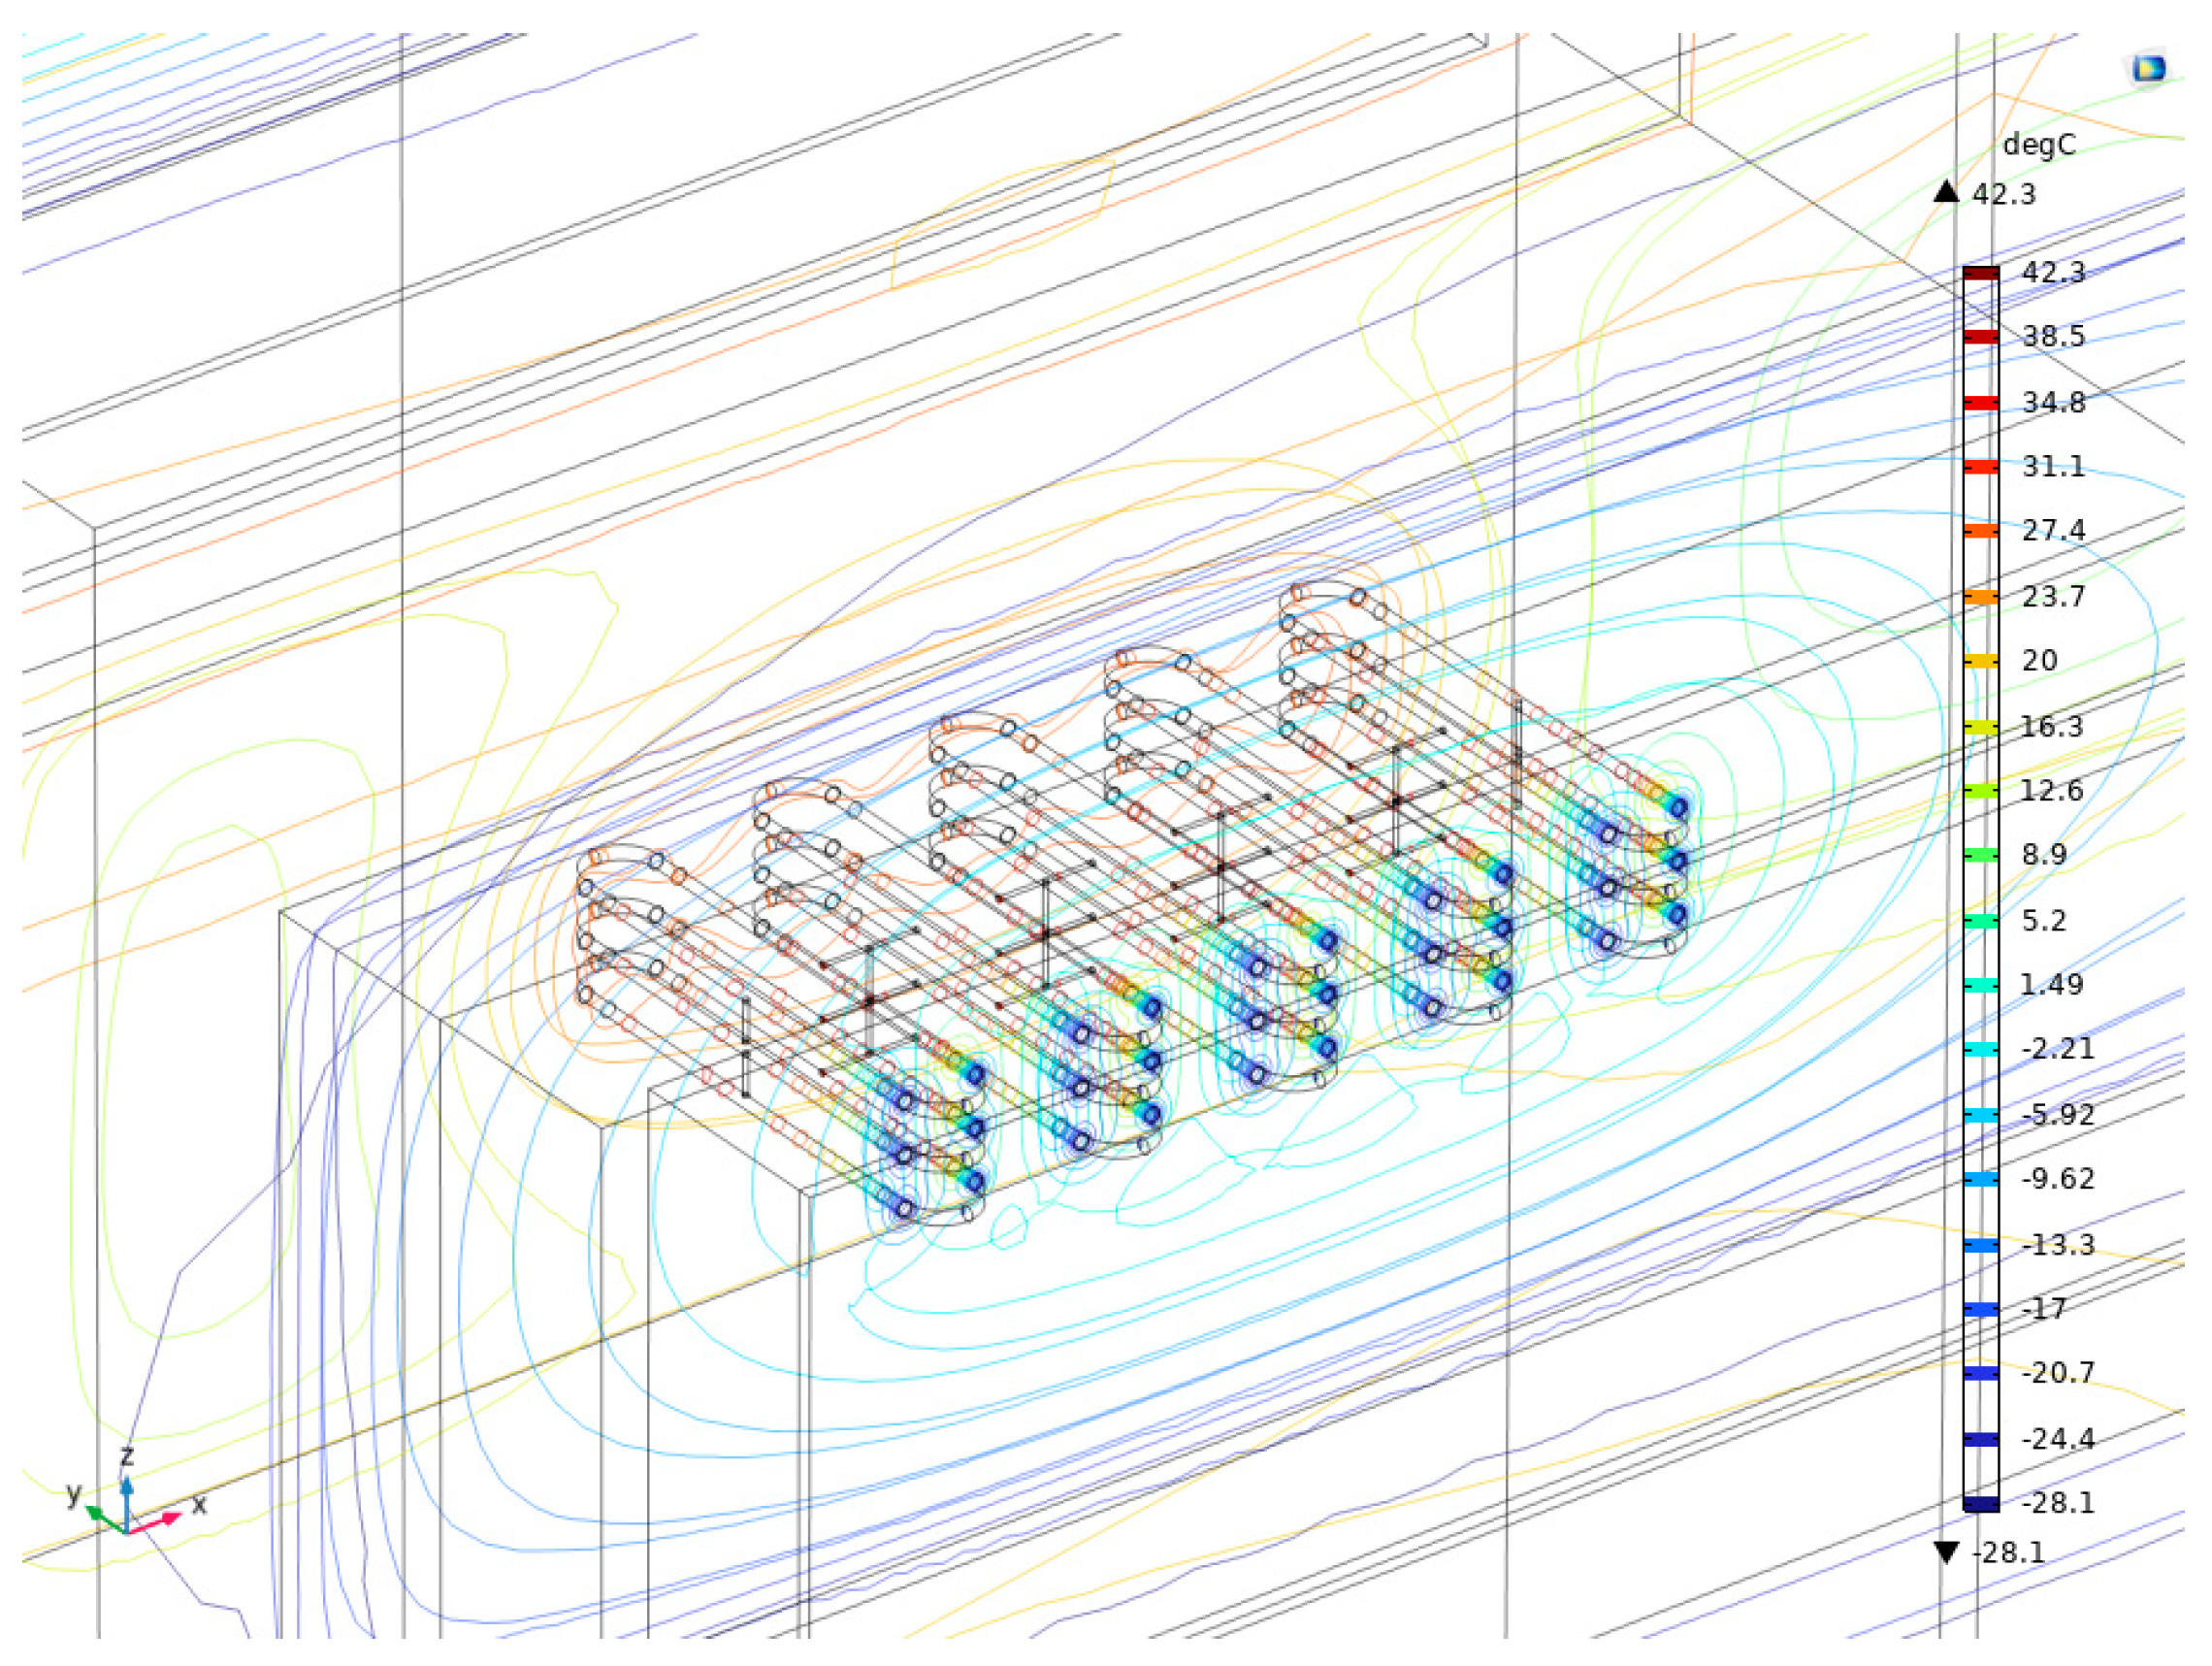
4.1.2. Temperature Field Distribution in the System

The distribution of the internal temperature field and the voltage generation results of the TEPG–Wall System are presented in Figure 16 and Figure 17. During the software simulations, the maximum temperature at the hot end reached 28 °C, while the temperature within the cavity reached 42.3 °C. This differs from the maximum temperature observed in experimental conditions, likely due to the non-uniform heating of the air fluid in the simulations. Despite this discrepancy, the maximum voltage generated in the simulation closely matches the experimental values. The temperature field distribution within the TEPG–Wall System is non-uniform but exhibits stratification. The temperature decreases progressively from the vicinity of the power generation device toward the outer regions. This distribution pattern differs from the findings of Luo et al. [18], as their building-integrated photovoltaic–thermoelectric wall system incorporated photovoltaic modules and thermoelectric radiation panels, both of which influenced the surrounding temperature field. These additional components contributed to a more complex and distinct temperature field distribution.

4.2. Electrical Behavior of the System

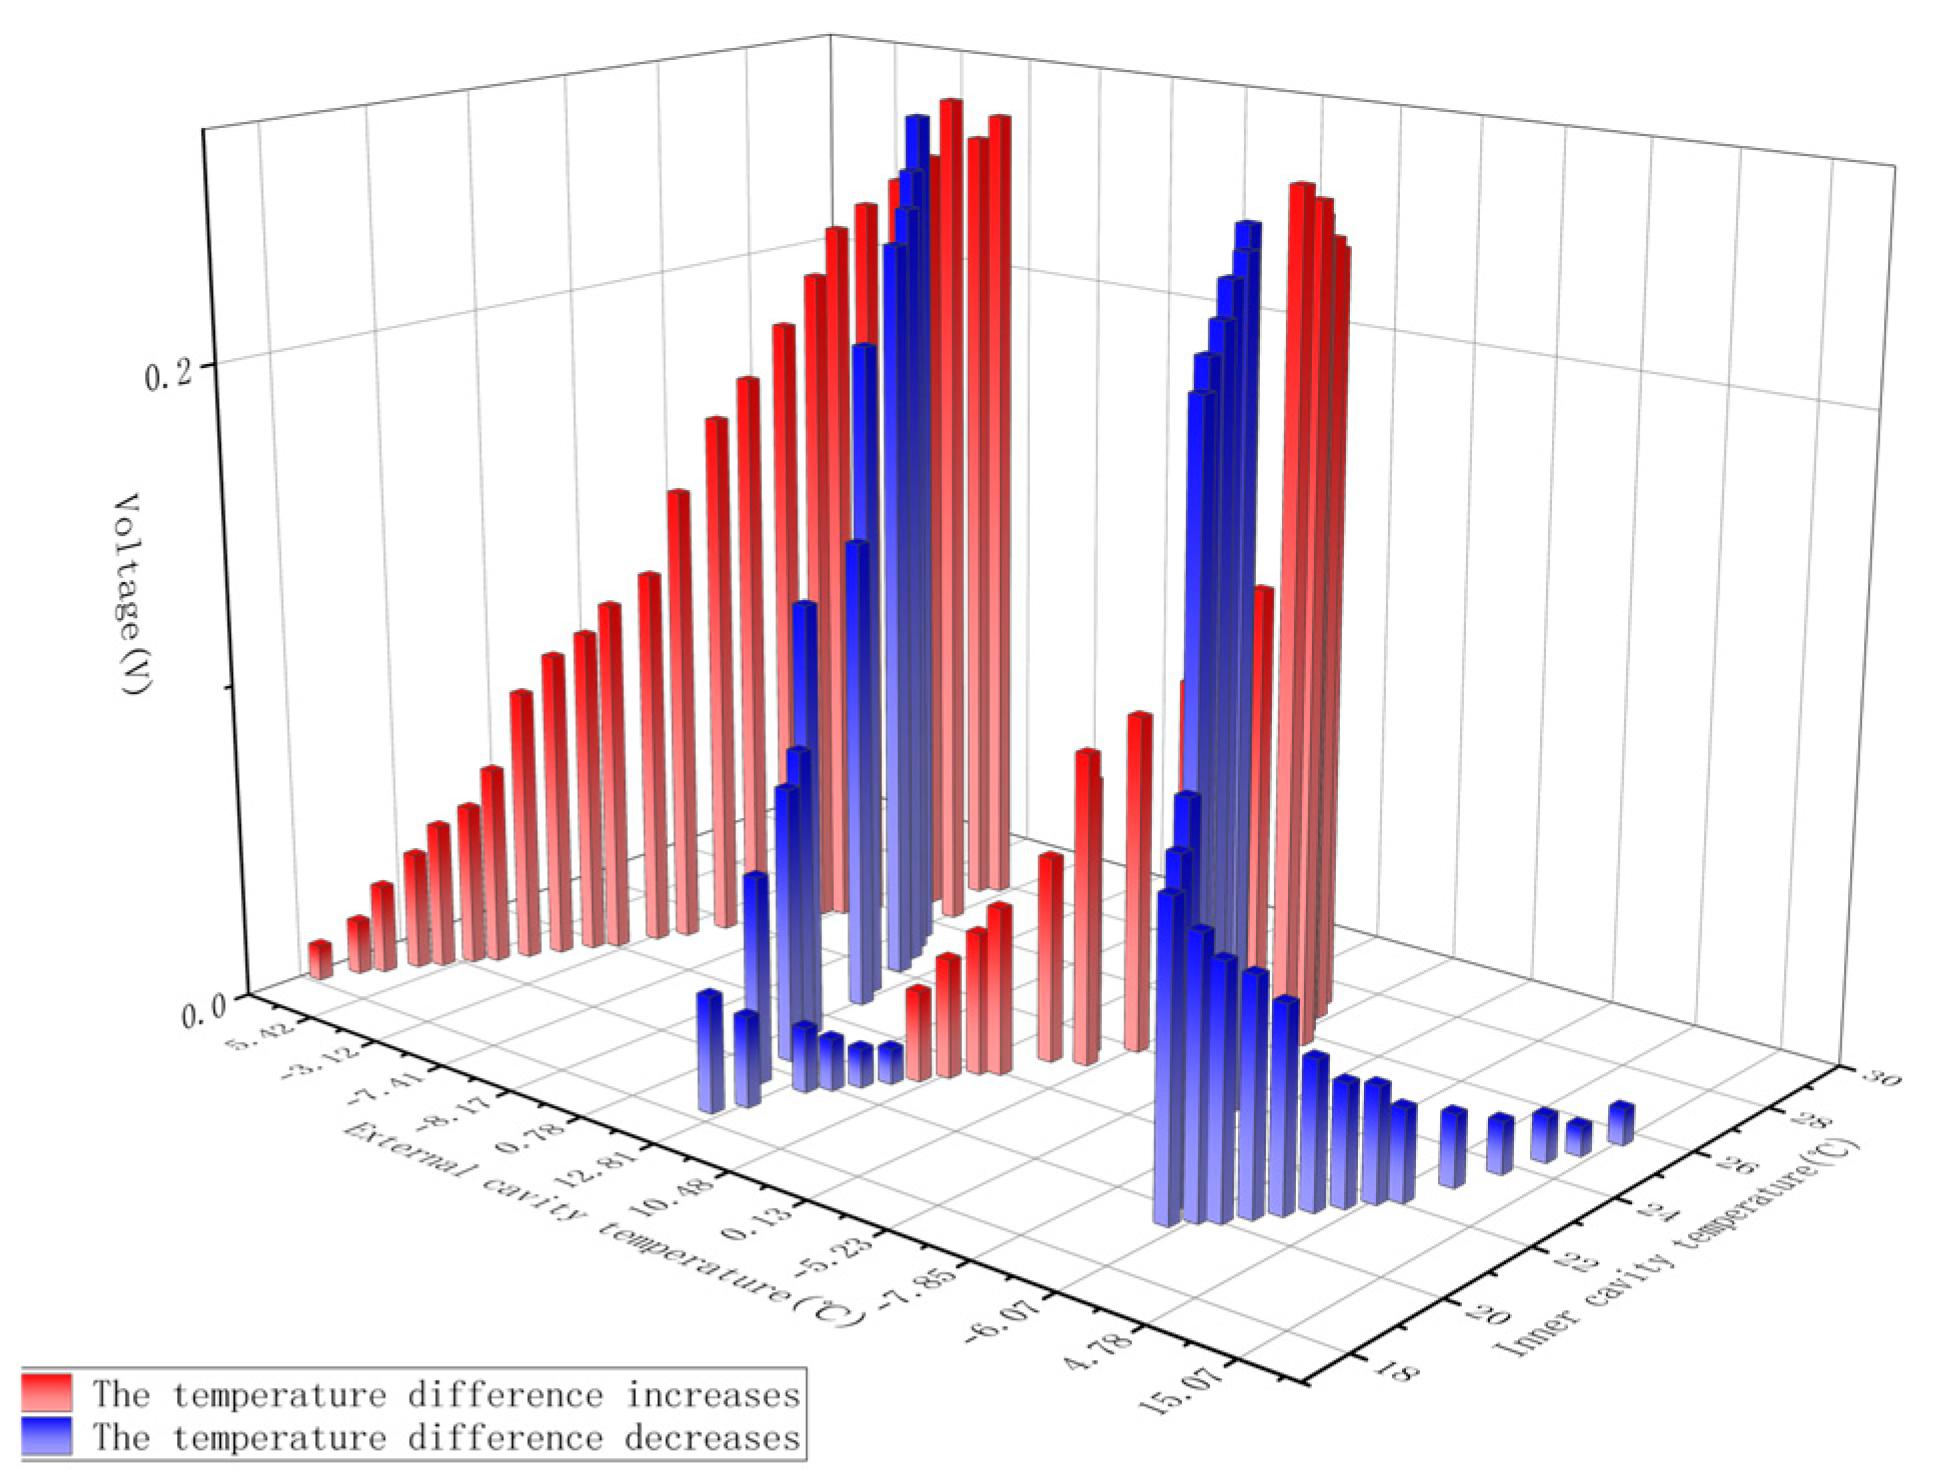
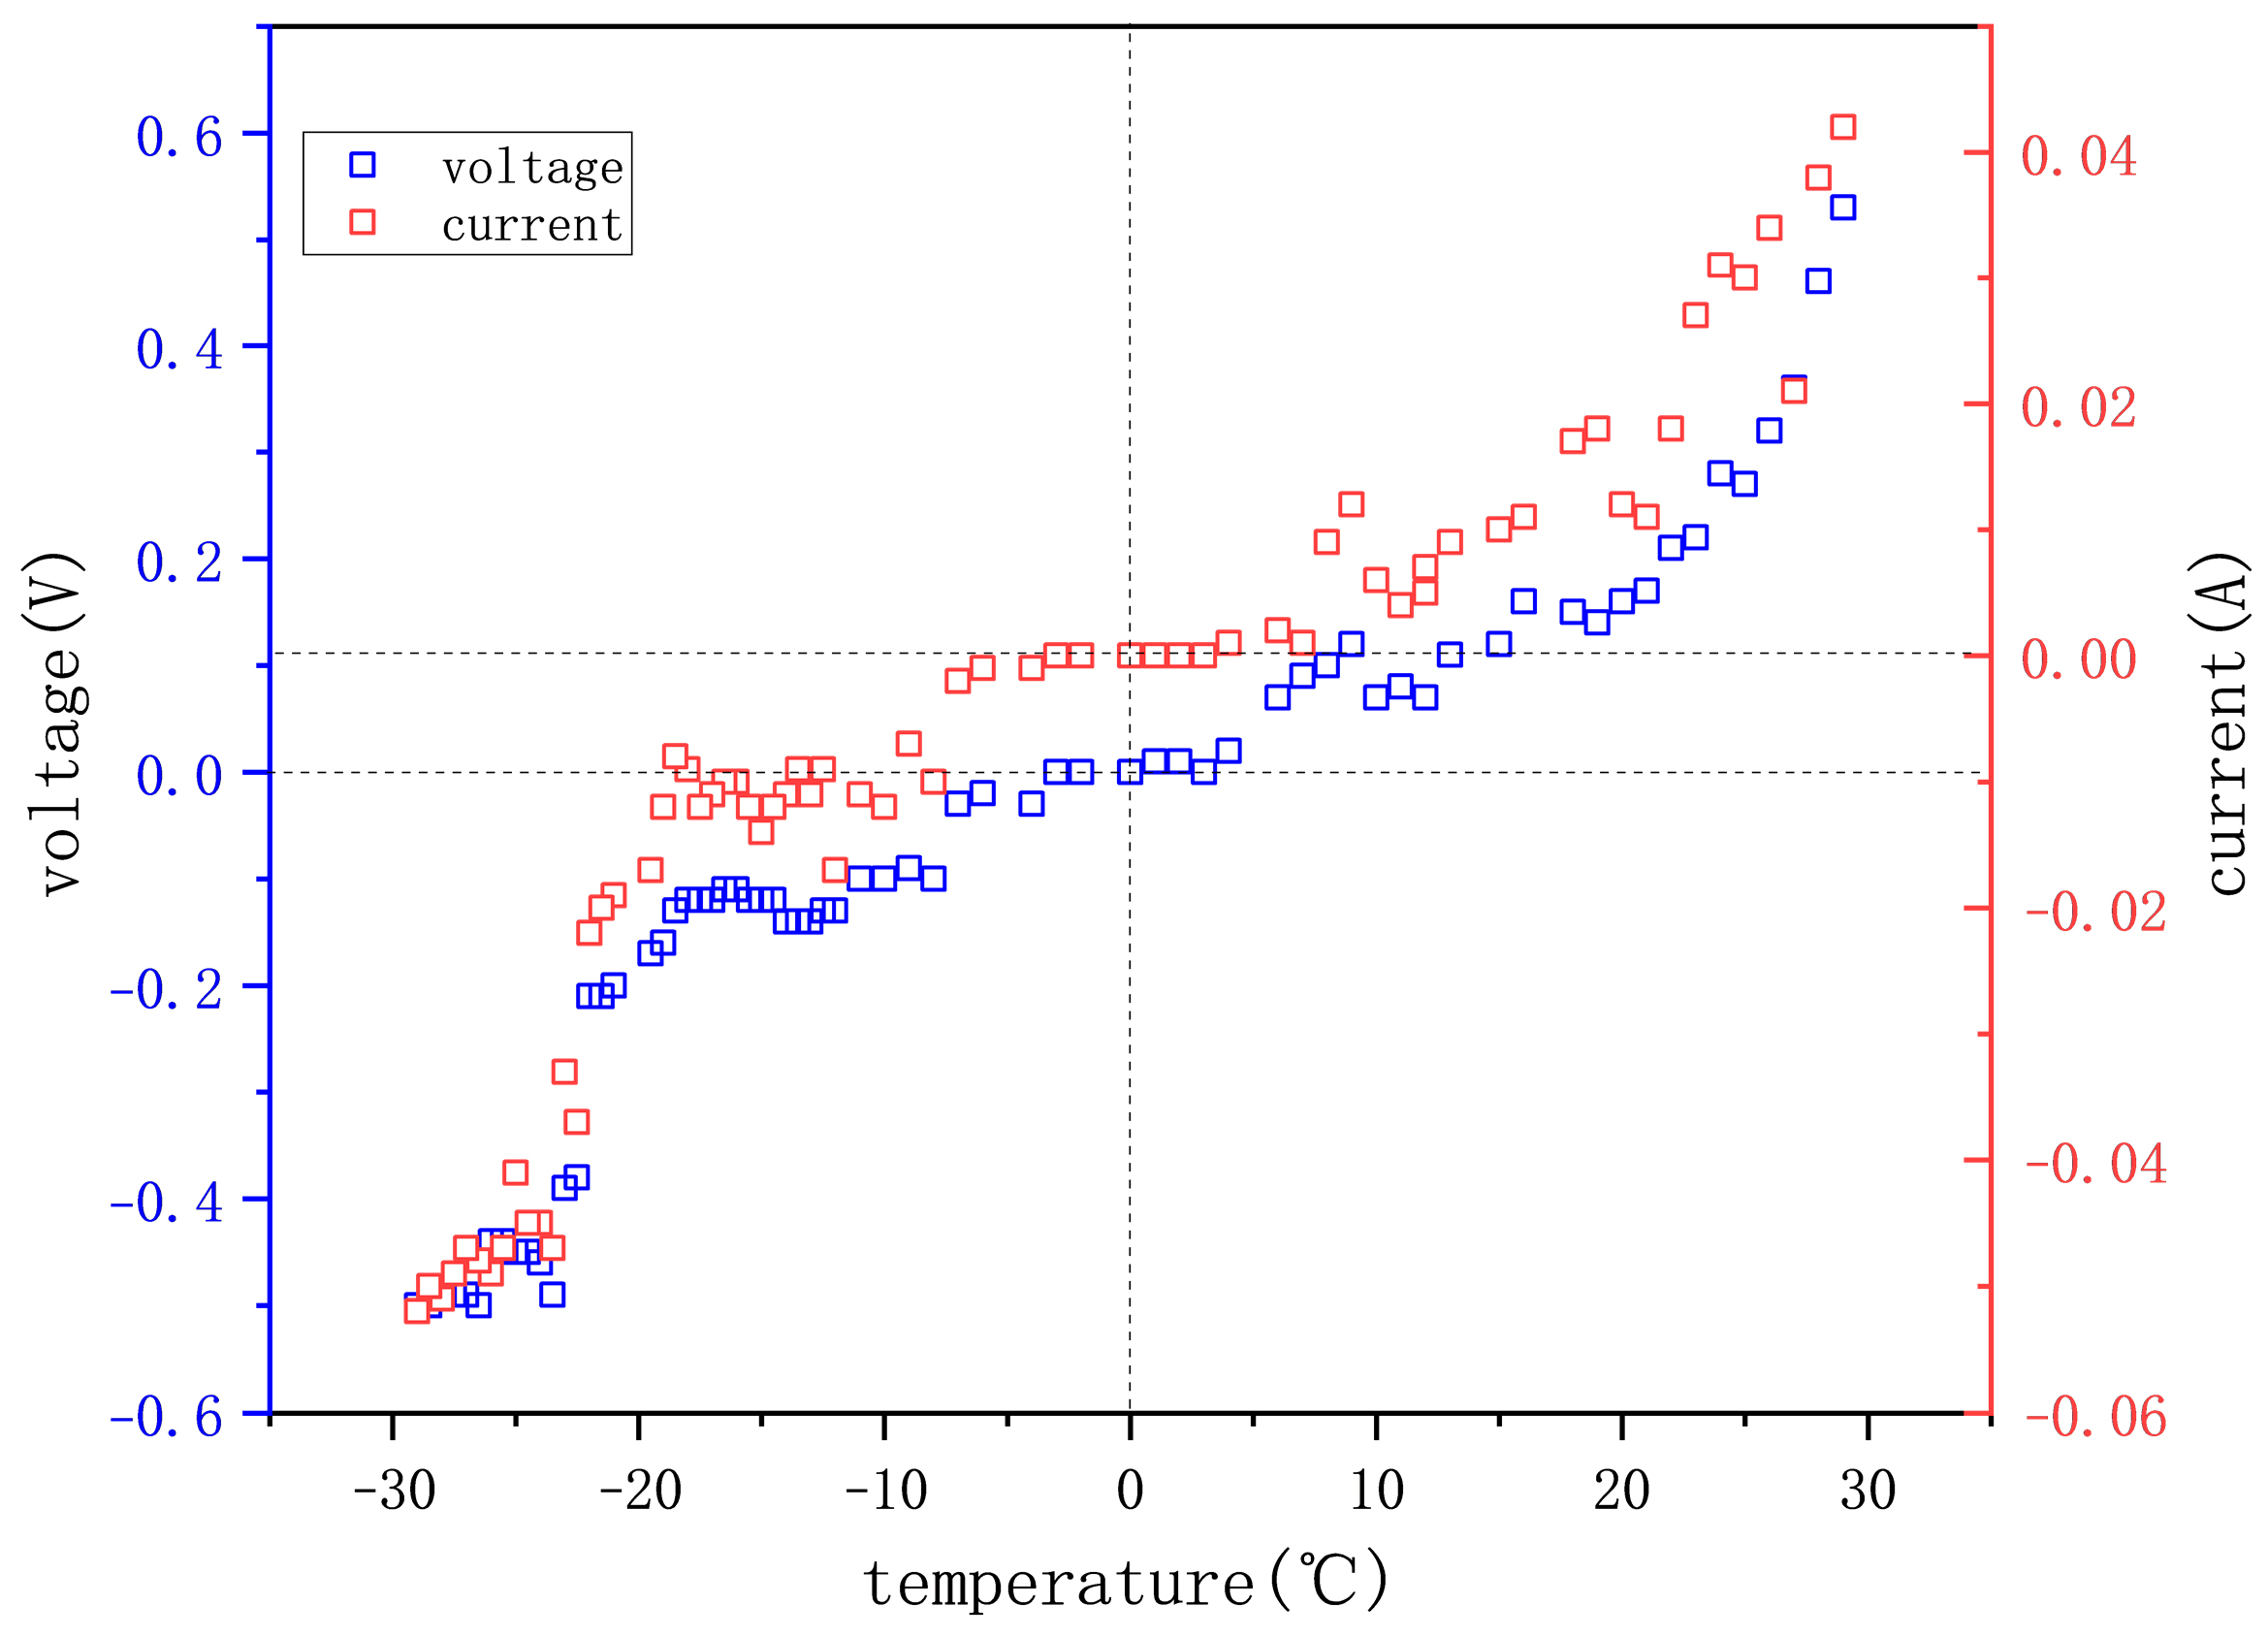
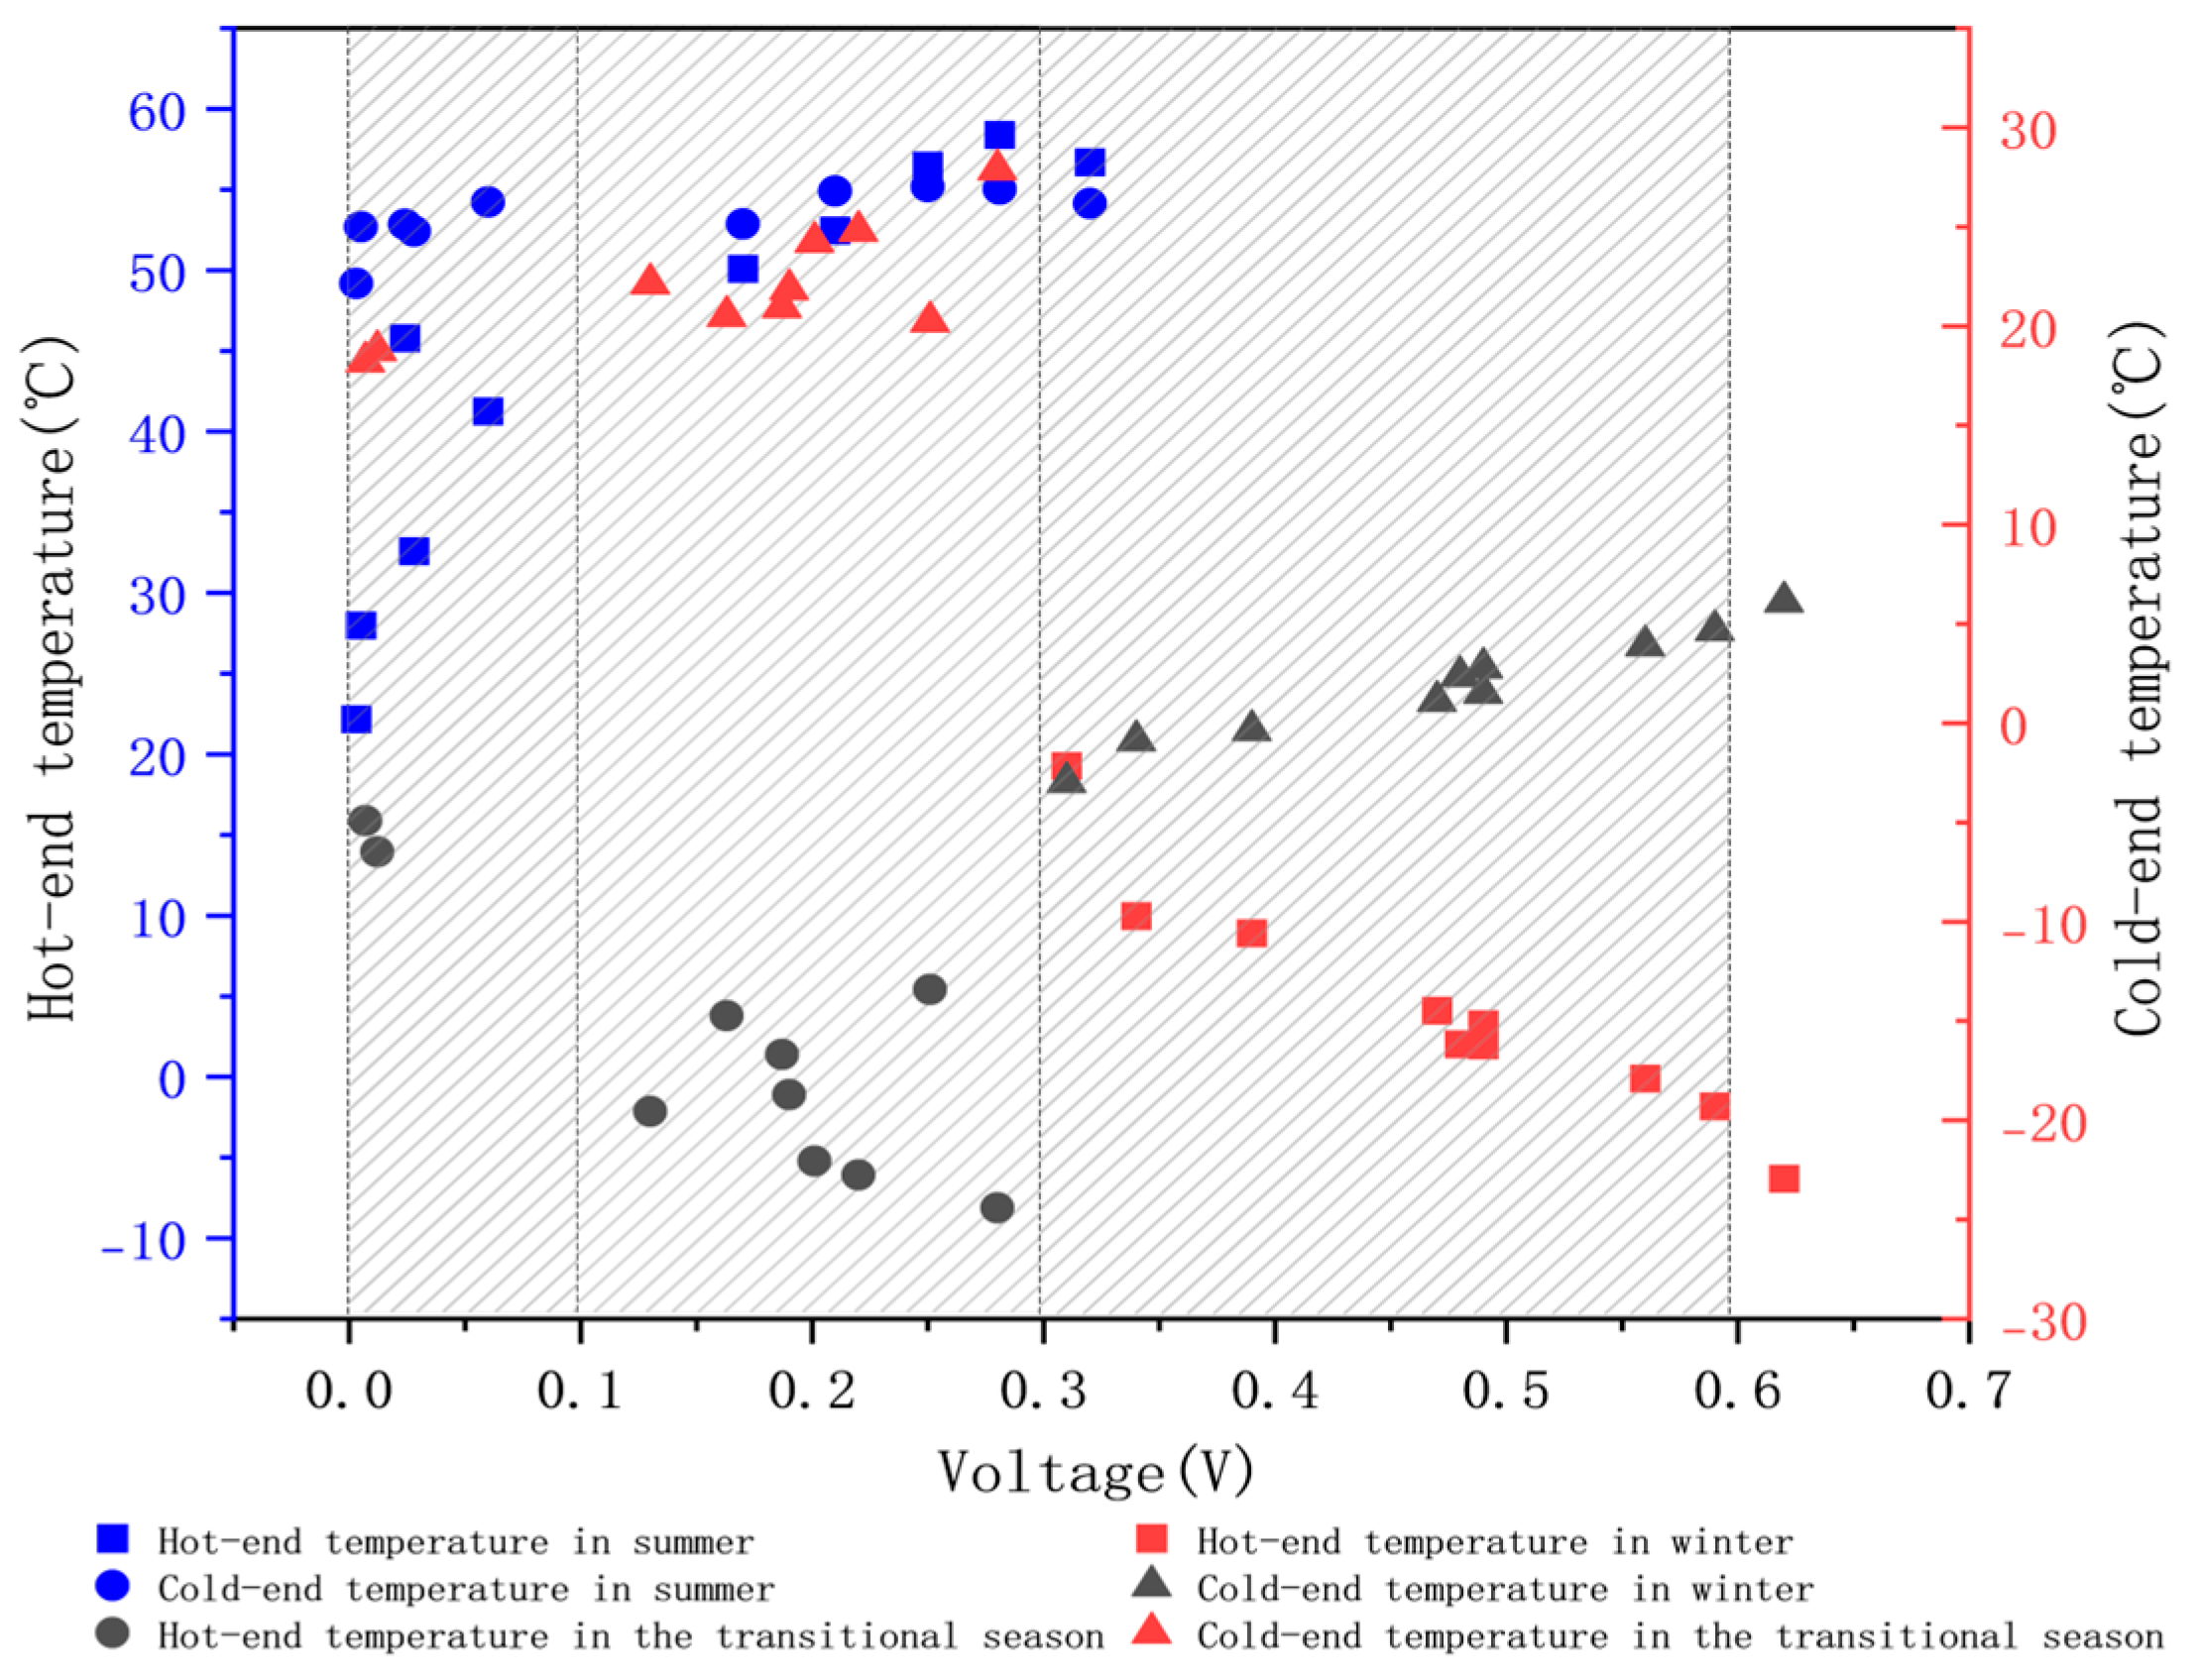
4.2.1. Voltage Variation Characteristics

As shown in Figure 17, the voltage variation of the TEPG–Wall System, comprising only 15 TEPG devices, ranged from −0.606 V to 0.537 V. The negative values denote the direction of the current, with the maximum output voltage reaching 0.606 V. The voltage variation trend is illustrated in Figure 18. The output voltage and current at a single point of the TEPG–Wall System exhibit instability but generally display a positive correlation with temperature. Specifically, higher temperatures correspond to increased voltage and current values. However, significant fluctuations in the voltage and current were observed with temperature changes. When the temperature falls below approximately 0 °C, the voltage and current increase in magnitude as the temperature decreases. The absolute values of both parameters gradually increase. As the temperature approaches 0 °C from below, the voltage and current values diminish and eventually approach 0 V. Above 0 °C, the voltage and current values become positive and increase progressively with increasing temperatures. At approximately 30 °C, the voltage reaches its maximum value of approximately 0.6 V.

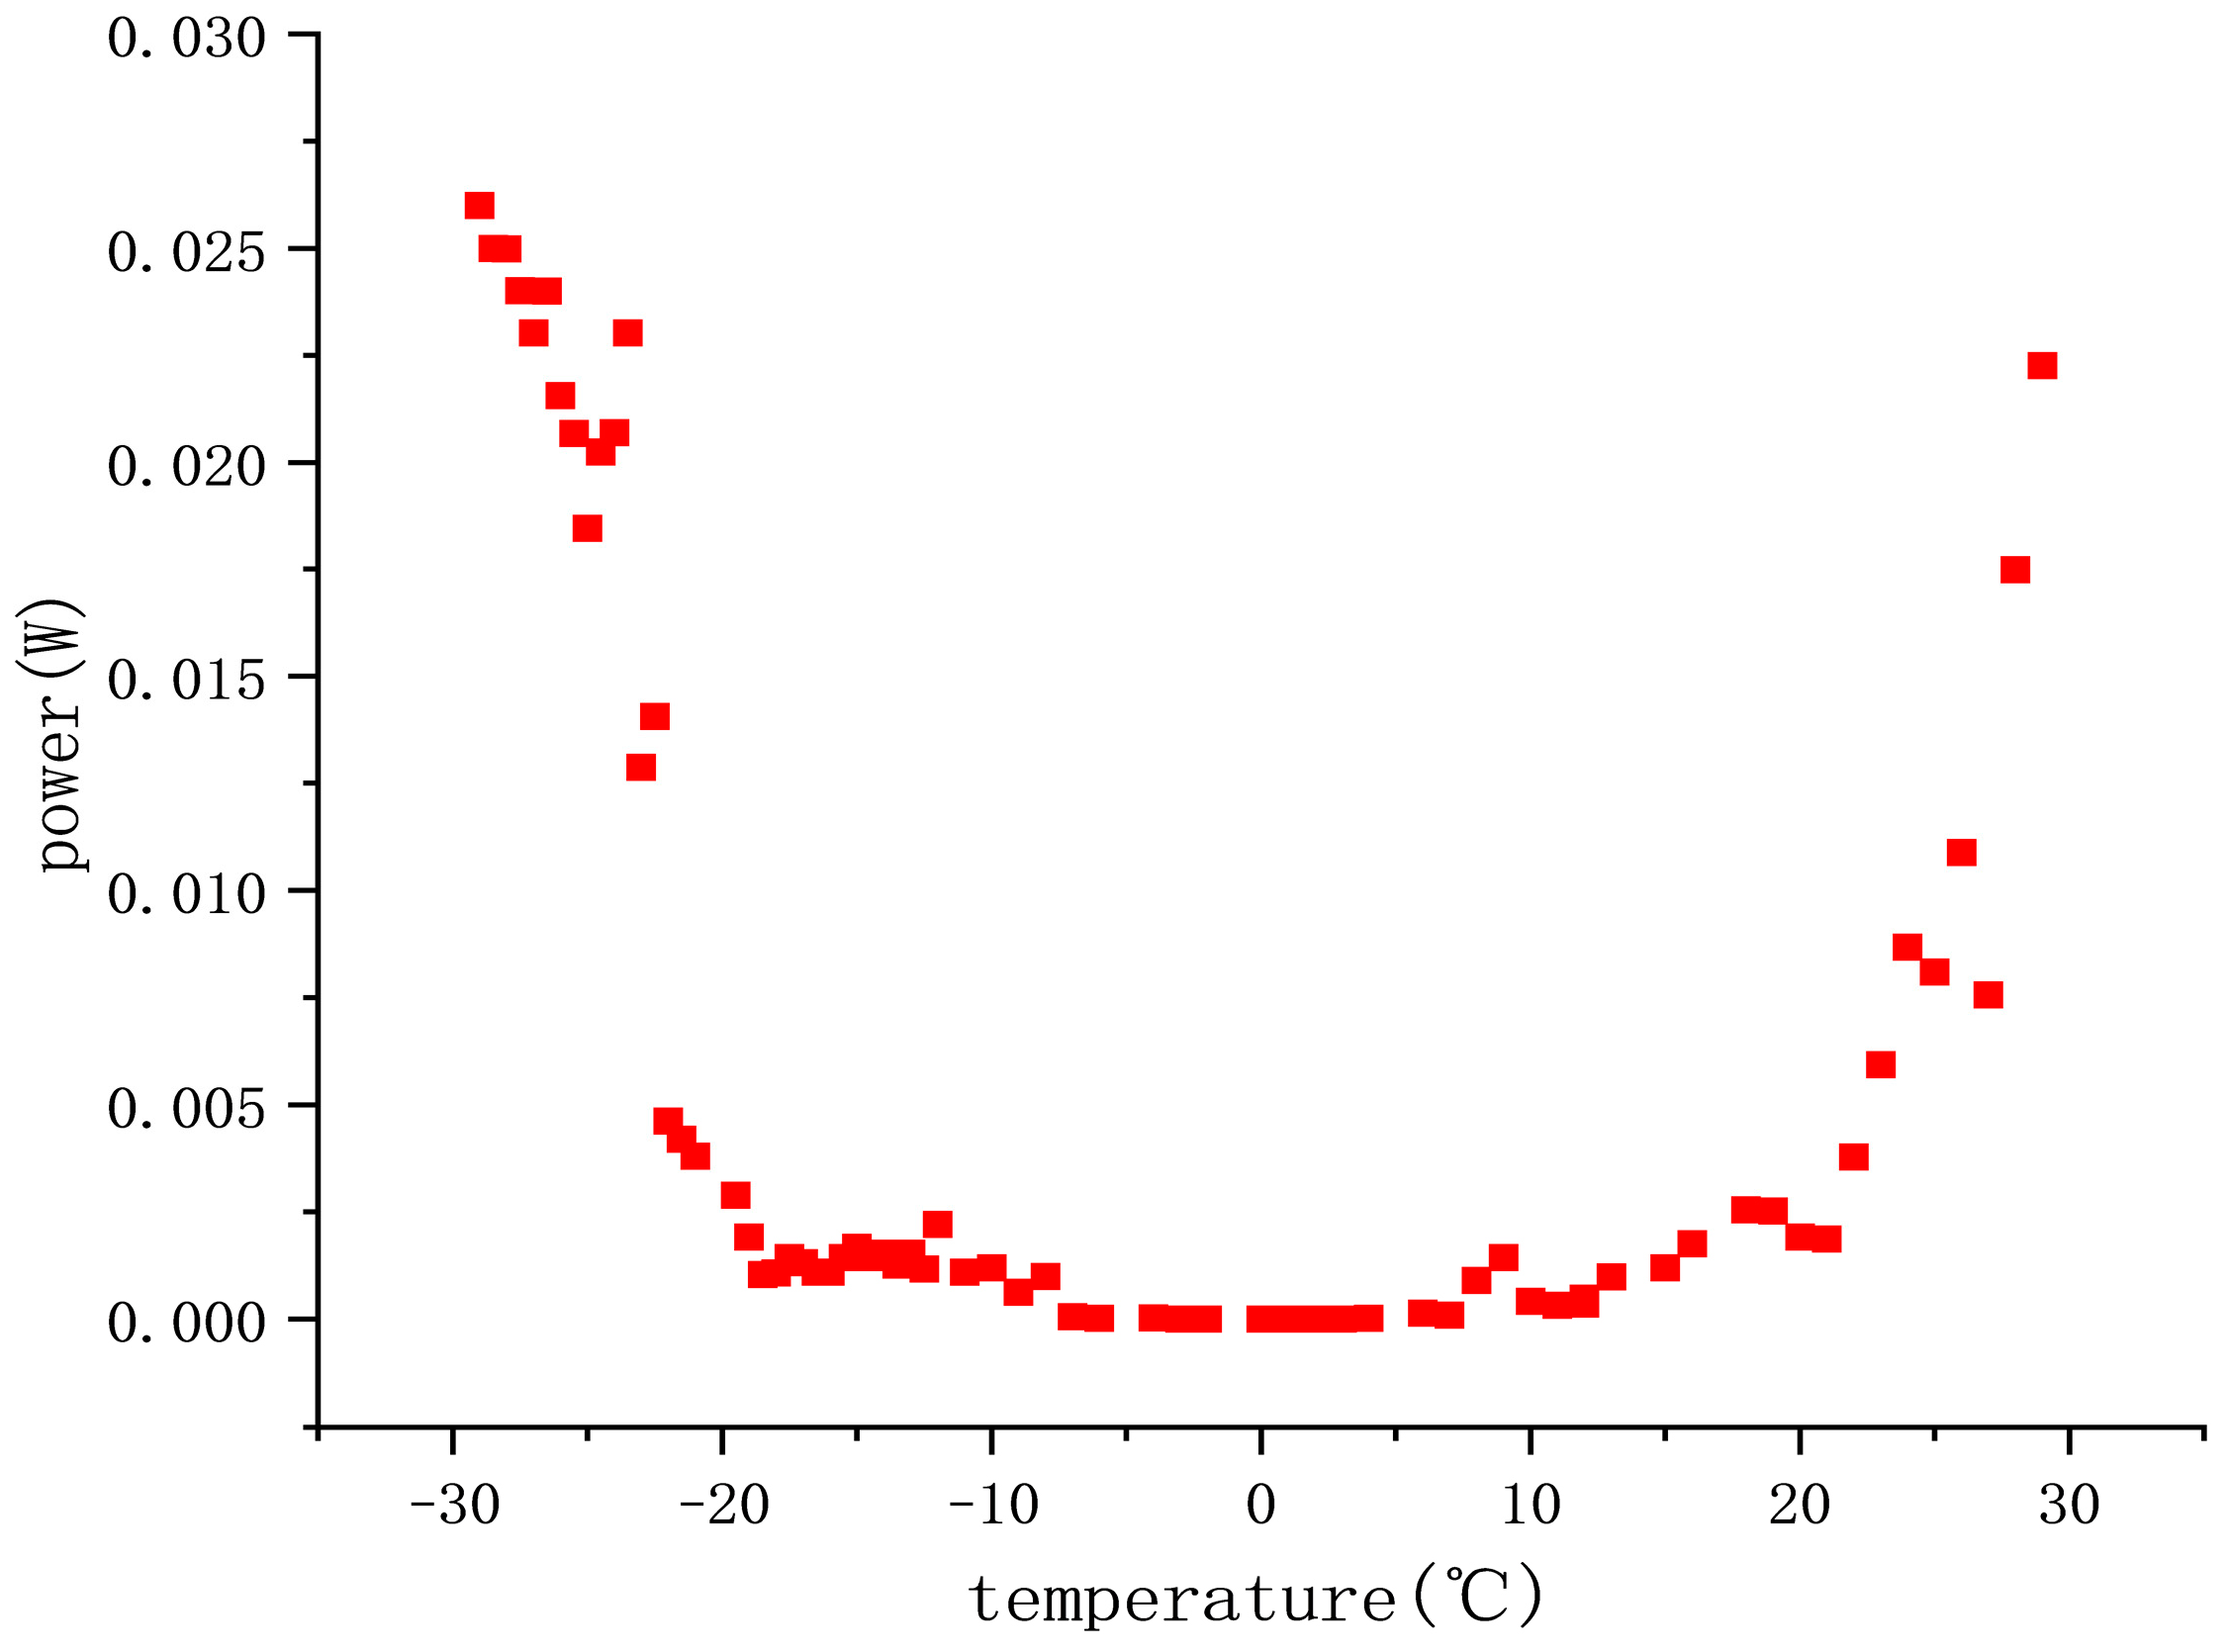
4.2.2. Power Variations at a Single Point of the System Device

The single-point output power of the TEPG–Wall System, shown in Figure 19, is also characterized by instability. Within the temperature range of −20 °C to 20 °C, the variation is relatively small. However, significant variations were observed in the ranges of −30 °C to −20 °C and 20 °C to 30 °C. At approximately 0 °C, when the temperature difference between the hot and cold ends is minimal, the system’s output power decreases to zero.
Overall, the positive correlation between the voltage, current, and temperature aligns with the findings reported by Lamba and Kaushik [19] and Liao et al. [20]. However, given the inclusion of photovoltaic devices in their studies, the power generation reported in those investigations exceeds the results of the present study. The disparity is attributable to the absence of auxiliary equipment and the limitation of only 15 devices in this experiment. Nevertheless, these findings highlight the notable effects of the selected Ni90Cr10-Ni45Cu55 thermoelectric material and the overall system architecture on the system’s electrical performance. The observed instability of the output power across different temperature ranges in this study diverges somewhat from the trends reported by Yin et al. [21] and Huq et al. [22]. This discrepancy can be attributed to variations in the thermoelectric materials utilized in their studies. Despite these differences, the overall trend remains consistent.

4.3. Thermoelectric Behavior of the System

The seasonal variations significantly influence the thermoelectric power generation behavior of the system.

4.3.1. Summer

The summer experiment analyzed the relationship between the ambient temperature of the outer compartment, the cavity temperature, and the system’s output voltage and power. As the ambient temperature increased, the outer cavity temperature exhibited an upward trend, facilitated by the heat-absorbing plate. This approach proved to be more concise and efficient than the method employed by Nanggar et al. [23], which utilized a solar parabolic dish concentrator to elevate the temperature of the hot end. Additionally, studies by Pintanel et al. [24] and Win et al. [10] emphasized the integration of thermoelectric devices with solar energy systems during summer. In these studies, energy generation depended heavily on the solar radiation intensity and the efficiency of the hybrid photovoltaic–thermoelectric systems. By contrast, the system analyzed in this study operates solely based on the indoor–outdoor temperature difference in the building, eliminating the influence of solar energy. This feature enhances its applicability across various building locations and orientations, regardless of sunlight availability.
In this study, when the temperature difference between the inner and outer chambers reached approximately 55 °C, the system achieved a maximum voltage of around 0.3 V and a maximum power of approximately 0.012 W. As shown in Table 3, this performance is comparable to that of the concentrating thermoelectric generator (CTEG) designed by Fan et al. [25]. However, differences in the thermoelectric materials and module designs result in notable variations in the power generation capacity. While Bi2Te3-based materials used in CTEG systems may provide higher power output under certain conditions, they also involve increased costs and complex manufacturing processes. In contrast, the Ni90Cr10-Ni45Cu55 material used in this study offers a cost-effective alternative with stable performance during summer operations.

4.3.2. Winter

During the winter experiment, as the outer chamber temperature decreased from −4 °C to −23 °C, the inner chamber temperature increased correspondingly, maintaining a large and stable temperature difference between the inner and outer chambers. This stable temperature difference facilitated a relatively high output voltage and power throughout the winter. When the temperature difference reached approximately 51 °C, the system achieved a maximum voltage of about 0.5 V and a maximum power of approximately 0.037 W.
Previous studies on thermoelectric power generation in winter have explored various strategies to maintain and exploit temperature differences. For example, Liu et al. examined the use of active solar technology to enhance the thermoelectric conversion efficiency [26], while An et al. improved the comprehensive thermoelectric performance by incorporating vacuum glass-covered photovoltaic solar thermal walls [27]. This study introduces an innovative approach by directly integrating thermoelectric devices into building walls and employing Ni90Cr10-Ni45Cu55 materials. This design provides a novel perspective in the field, offering advantages in material stability and structural design. These features enable reliable operation in cold winter conditions and ensure a relatively high power output compared to previous systems.

4.3.3. Transition Season

In the experiments conducted during the transition season, the system’s output voltage and power exhibited a positive correlation with the cavity temperature difference. A maximum voltage of approximately 0.28 V and a maximum power of about 0.0065 W were observed when the cavity temperature difference reached approximately 34 °C. This study addresses a notable gap in the literature, given that other studies have rarely examined the performance of thermoelectric systems in transition seasons.
Previous studies have primarily focused on summer and winter conditions, with limited attention given to the complex and fluctuating temperature variations characteristic of the transition season. This investigation provides a detailed analysis of the system’s voltage growth rate across different temperature ranges during this period. For instance, when the cavity temperature difference increased from 2.33 °C to 10.4 °C, the voltage increased from 0.011 V to 0.037 V, with a relatively moderate growth rate. Conversely, as the temperature difference increased from 25.77 °C to 36.00 °C, the voltage increased from 0.205 V to 0.259 V, exhibiting a steeper growth rate. Such trends, which are rarely detailed in prior research, highlight the dynamic response of the system during this season.
The experimental results during the transition season revealed distinct thermoelectric dynamics compared to the summer and winter conditions. As shown in Figure 12 and Figure 13, the output voltage exhibited a nonlinear growth pattern with increasing temperature differences. Specifically, when the cavity temperature difference (ΔT) rose from 2.33 °C to 10.4 °C, the voltage increased by 0.026 V (0.002 V/°C), whereas a ΔT increase from 25.77 °C to 36 °C resulted in a voltage rise of 0.054 V (0.005 V/°C). This nonlinearity aligns with the threshold behavior of the carrier mobility in Ni90Cr10-Ni45Cu55 thermoelectric materials, where thermal excitation dominates at higher ΔT [16,22].
This finding addresses a critical gap in the existing literature. Prior studies, such as those by Lamba and Kaushik [19] and Liao et al. [20], primarily focused on the steady-state thermoelectric performance during summer and winter but overlooked the transitional periods characterized by fluctuating ΔT. Table 4 summarizes the key limitations of previous works and contrasts them with the present study’s contributions.
These insights not only fill the gap in the literature but also provide actionable strategies for extending the TEPG–Wall System’s annual operational window. Future work should prioritize real-time ΔT forecasting models to enable proactive system reconfiguration, particularly in regions with pronounced seasonal transitions.

4.3.4. Annual Thermoelectric Power Generation Performance

The annual average thermoelectric output power of the 15 thermoelectric devices was calculated to be approximately 0.02 W, corresponding to an annual power generation of 0.0586 kWh. The data revealed that the output voltage of the TEPG–Wall System is closely tied to the thermal conditions at the hot and cold terminals of the thermoelectric devices, exhibiting dynamic variations rather than a fixed relationship between a specific temperature difference and a set output voltage.
When the temperature difference between the hot and cold terminals ranged from 0 °C to 20 °C, the system generated voltages between 0 and 0.1 V. In this range, the carrier mobility in the thermoelectric material remained relatively low, and the directional movement of electrons and holes driven by the temperature gradient was limited, resulting in a minimal voltage output. As the temperature difference increased to 20–40 °C, the output voltage increased to 0.1–0.3 V. This increase can be attributed to the greater energy acquired by the carriers, leading to enhanced mobility and a stronger thermoelectric effect. At a temperature difference of 40–60 °C, the system generated voltages in the range of 0.3–0.6 V. In this higher temperature range, thermal excitation effects within the thermoelectric material became more pronounced, activating a larger number of carriers and producing stronger current and voltage outputs.
Based on the experimental results obtained across all three seasons, five sets of temperature data from the hot and cold terminals within the intervals of 0–20 °C, 20–40 °C, and 40–60 °C were randomly selected for simulation using specialized software. The accuracy of the experimental data was assessed by comparing the simulated voltage values with the measured data. The comparison results are presented in Figure 20.
With minor exceptions, the majority of the simulated data closely align with the experimental measurements, confirming the reliability and accuracy of the experimental results.

4.3.5. Power Generation Performance of the TEPG–Wall System per Unit Area

While ensuring the aesthetic appearance, in order to maximize the power generation per unit area, the thermoelectric power generation devices are arranged in the pattern shown in Figure 21 according to the layout experience described earlier. Based on the dimensions of each device, thirty sets of devices are arranged as a whole with a length of 650 mm and a width of 600 mm, resulting in a system layout scheme for an area of 1 square meter. Through calculation, it can be obtained that the average power of this system is approximately 3.05 W, and the annual average power generation is 1.758 kWh. If the entire building is equipped with such devices, the power generation will be quite substantial. In addition, due to the Peltier effect, the TEPG–Wall System absorbs a certain amount of heat energy, which may potentially reduce the energy consumption of indoor air conditioners. However, due to space limitations, this aspect was not investigated in this study. We plan to conduct in-depth research on this in future studies.

4.4. Significance

The system effectively harnesses the temperature difference between indoor and outdoor environments in severe cold regions to generate electricity, offering an additional power source for buildings. This enhances the energy self-sufficiency of buildings, reducing reliance on conventional energy sources. From a broader perspective, this approach contributes to building energy conservation and the achievement of sustainable development objectives. On a large scale, the coordinated power generation of thermoelectric wall systems across multiple buildings could significantly influence regional energy supply structures by reducing carbon emissions and supporting global climate change mitigation strategies. This system provides an innovative pathway toward sustainable energy utilization and environmental protection, aligning with strategic goals for achieving sustainable energy development.

5. Conclusions

This study investigated the TEPG–Wall system for prefabricated buildings in severe cold climate regions. The following conclusions were derived from experimental and simulation analyses:
Under the experimental conditions specific to the Hohhot region, the annual average thermoelectric output power of the 15 parallel thermoelectric devices was 0.02 W, generating approximately 0.0586 kWh of electricity annually. The system’s power output was strongly correlated with the temperature difference, with the largest energy output occurring during winter because of the substantial temperature gradients compared to the summer and transitional seasons.
The Ni90Cr10-Ni45Cu55 thermoelectric material demonstrated stable performance throughout the experiments. It exhibited favorable thermoelectric, chemical, and physical properties, with low resistivity, ease of processing, and cost-effectiveness, while also showing resistance to oxidation and related degradation. These characteristics ensure the long-term stable operation of the system. Although the design of the collector cavity enhanced the heat absorption and conversion efficiency, further optimization of the structure and heat-absorbing materials remains necessary.
The system’s ability to utilize indoor and outdoor temperature differences for electricity generation holds significant potential for enhancing the energy self-sufficiency of buildings and addressing climate change challenges. However, the current power generation capacity is limited to low-power devices. Experimental errors were observed, primarily attributable to factors such as environmental simulation conditions, instrument precision, and thermal resistance during installation.
Future research should focus on several key areas. First, the development of advanced thermoelectric materials should be prioritized, including the discovery of new materials or the modification of existing ones to enhance the thermoelectric conversion efficiency. Second, the system design requires further optimization, including improved thermoelectric module configurations, enhanced cavity structures, and better integration with building envelopes. Third, the dynamic and long-term performance of the system across diverse climatic conditions should be extensively studied to establish accurate predictive models. These efforts will provide robust support for the advancement of energy conservation technologies in severe cold climates, fostering the sustainable development of building energy utilization.

Author Contributions

Conceptualization, R.H. and X.S.; methodology, R.H.; software, R.H.; validation, R.H., Z.H. and X.S.; formal analysis, Y.G.; investigation, J.L.; resources, X.S.; data curation, R.H. and Y.G.; writing—original draft preparation, R.H.; writing—review and editing, R.H. and Y.G.; visualization, R.H.; supervision, X.S.; project administration, Z.H.; funding acquisition, Z.H. All authors have read and agreed to the published version of the manuscript.

Funding

This research received no external funding.

Data Availability Statement

The datasets generated during and/or analyzed during the current study are available from the corresponding author on reasonable request.

Acknowledgments

We would like to thank Xiaoming Su and Zhanguo Hao for their technical assistance during the experiments.

Conflicts of Interest

The authors declare no conflicts of interest.

Abbreviations

The following abbreviations are used in this manuscript:
TEPG–WallThermoelectric power generation–wall system
TEPGThermoelectric power generation
PCMsPhase-change materials
CTEGConcentrating thermoelectric generator
TEGThermoelectric generator

Appendix A

Table A1. Summer experiment result data.
External Cabin Temperature/°CExternal Cavity Temperature/°CInternal Cabin Temperature/°CInternal Cavity Temperature/°CTemperature Difference in the Cavity/°CVoltage/VCurrent/A
18.0722.1822.1822.140.0400
19.3623.1222.2522.760.360.0040.000
21.4227.1022.7223.183.920.0130.001
24.3630.1423.4823.796.350.0210.001
26.0838.6823.7724.2814.400.0470.002
27.8241.4224.0124.7616.480.0690.002
29.9245.7824.7825.1520.630.0810.005
30.2151.3824.9225.4425.940.1270.009
30.5457.1425.2025.8731.270.1820.016
29.3758.1125.5926.1831.930.2470.029
28.7456.1525.9926.7629.390.2980.040
28.8155.1226.3927.1028.020.2880.037
27.9352.1726.0727.6724.500.2070.031
27.0750.8725.7627.9522.920.1490.022
26.2149.2125.2427.7221.490.1370.018
25.3447.0724.5727.2619.810.0960.010
24.7645.1423.9826.9818.160.0880.008
23.9142.2124.0626.6515.560.0760.007
23.2741.1423.4926.1115.030.0690.007
21.8938.6623.0125.8712.790.0460.004
21.0135.9822.7825.3510.630.0380.003
20.1732.5922.2924.787.810.0220.002
19.3428.1721.7824.044.130.0150.001
18.4225.2422.4423.471.7700
17.6722.4822.7623.81−1.3300
18.1721.6723.0124.08−2.410.0020
19.4624.8823.4924.470.4100
21.5227.9823.8824.992.990.0030
24.2631.7624.1725.176.590.0140.001
26.1836.1924.5525.7410.450.0230.002
27.9241.2625.0026.2415.020.0560.006
29.8249.5525.3826.5622.990.1210.017
30.4352.4625.7726.7925.670.1960.020
30.9456.4826.1427.0129.470.2390.027
29.9758.3825.8926.8931.490.2570.029
28.9457.5525.6626.5231.030.2830.031
28.6156.6925.3426.1830.510.2700.028
27.9455.4425.0725.7729.670.2540.021
27.2753.1724.6925.4927.680.1910.020
26.3150.0924.2225.1424.950.1570.017
25.4248.2223.7624.9823.240.1440.014
24.7645.8923.4424.7121.180.1200.011
23.9341.7723.1824.3217.450.0810.008
23.1736.5822.9424.1212.460.0470.005
22.6632.1122.6623.798.320.0140.002
21.8730.2422.4723.366.880.0100.001
21.0028.2722.1123.075.20.0050
20.1826.4921.8422.743.750.0030
19.3624.2422.0722.381.8600
18.4321.8822.3922.10−0.2200
17.6819.1922.8821.21−2.0200

Appendix B

Table A2. Winter experiment result data.
External Cabin Temperature/°CExternal Cavity Temperature/°CInternal Cabin Temperature/°CInternal Cavity Temperature/°CTemperature Difference in the Cavity/°CVoltage/VCurrent/A
−3.04−2.1517.6818.2720.420.0760.008
−4.29−3.1218.2518.9822.10.1610.014
−5.33−3.9718.4819.1923.160.1820.015
−6.61−4.8718.8819.6424.510.2070.018
−7.80−6.2119.0919.9226.130.2430.022
−8.80−7.7719.6720.3328.10.2660.022
−9.58−8.9419.9320.6129.550.2980.035
−10.44−9.7120.2820.8530.560.3140.029
−11.86−10.5820.5621.4932.070.3210.036
−12.47−11.6620.8821.8533.510.3370.029
−13.16−12.8521.3622.1334.980.3400.042
−13.71−13.2621.8522.2435.50.3510.037
−14.13−14.0222.1922.8836.90.3660.038
−14.61−14.4722.2623.3037.770.3730.042
−15.18−15.1522.7323.7938.940.3820.044
−15.74−15.6223.4924.38400.3950.048
−16.03−16.1723.9824.8541.020.4080.050
−16.79−16.2224.0325.3741.590.4190.051
−17.06−16.7824.7725.4542.230.4220.044
−17.55−17.0724.9325.8442.910.4370.047
−17.76−17.5625.4926.2743.830.4440.051
−18.11−17.8925.9826.7444.630.4490.048
−18.52−18.2426.3727.2145.450.4570.045
−19.07−18.7926.8827.7546.540.4610.046
−19.34−19.0027.0627.9946.990.4720.048
−19.73−19.2926.5727.7046.990.4710.045
−19.99−19.6725.7627.2946.960.4800.048
−20.27−19.9825.2426.8946.870.4840.049
−20.41−20.1924.5726.6646.850.4790.047
−20.58−20.4823.9825.8746.350.4910.038
−20.71−20.6624.0625.3546.010.4840.042
−20.83−20.7923.4924.6845.470.4790.044
−20.90−20.9023.0323.9844.880.4700.048
−20.98−20.9722.6924.0645.030.4660.050
−21.11−21.0122.1723.4944.500.4600.051
−21.17−21.0721.5323.0344.100.4540.044
−21.22−21.1021.0722.6643.760.4490.047
−21.29−21.1320.4622.0743.200.4440.051
−21.33−21.1819.7921.4342.610.4380.048
−21.40−21.2519.1821.1742.420.4310.045
−21.49−21.2918.2220.5641.850.4270.046
−21.58−21.3317.7919.6941.020.4220.048
−21.66−21.3817.2119.0840.460.4180.045
−21.71−21.4116.8918.3239.730.4070.044
−21.80−21.4716.3617.8039.270.4000.043
−21.88−21.5217.1717.3238.840.3950.037
−21.94−21.5918.2516.9738.560.3910.038
−22.00−21.6718.7917.4739.140.3840.042
−22.08−21.7819.2818.8540.630.3920.044
−22.14−21.8619.6919.8841.740.4040.048
−22.20−21.9119.9720.4742.380.4150.051
−22.28−21.9720.3821.5543.520.4200.048
−22.36−22.0820.8422.3444.420.4360.043
−22.42−22.1421.3722.8244.960.4410.044
−22.49−22.2121.9323.4745.680.4620.042
−22.52−22.2622.2523.7946.050.4710.039
−22.60−22.3022.7224.2146.510.4830.048
−22.66−22.3823.4824.7847.160.4850.042
−22.70−22.4223.7725.1747.590.4900.044
−22.74−22.4824.0125.6948.170.4970.048
−22.79−22.5424.7826.1348.670.4920.050
−22.82−22.5924.9226.7949.380.5040.051
−22.85−22.6225.2027.2749.890.5100.054
−22.90−22.6825.5927.8450.520.5180.049
−22.95−22.7425.9928.1750.910.5230.051
−22.98−22.7726.3928.5451.310.5310.055
−23.02−22.8226.7728.7651.580.5540.051
−23.05−22.9027.0729.1452.040.5790.057
−23.01−22.9326.5429.4752.40.5940.062
−22.96−22.8425.7628.8351.670.5810.058
−22.90−22.7925.2427.7650.550.5690.058
−22.81−22.7324.5726.7349.460.5470.054
−22.78−22.6823.6825.2747.950.5220.051
−22.66−22.6023.4624.7647.360.5180.050
−22.58−22.5222.7823.4545.970.4970.050
−22.44−22.4322.2922.8645.290.4830.048
−22.29−22.3921.7822.1844.570.4750.047
−22.11−22.2821.4421.8744.150.4610.047
−21.87−21.8920.7621.3143.20.4540.042
−21.55−21.4819.7820.9742.450.4470.044
−21.27−21.0319.0720.2841.310.4340.048
−21.06−20.8618.3119.6940.550.4250.042
−20.76−20.3717.9718.3838.750.4060.040
−20.47−20.0917.2817.9838.070.3970.041
−20.10−19.8816.6917.2737.150.3810.039
−19.66−19.5416.3816.8436.380.3730.040
−19.18−19.1317.2716.3335.460.3680.037
−18.54−18.4917.6516.9735.460.3660.033
−18.21−17.8817.9917.4635.340.3700.038
−17.68−17.2018.3718.2135.410.3760.035
−17.07−16.7318.7918.9935.720.3820.037
−16.31−16.0719.2819.6435.710.3840.039
−15.49−15.2919.6920.3535.640.3790.028
−14.20−14.1319.9721.2735.400.3750.042
−12.96−12.8820.3821.8334.710.3680.036
−11.67−11.0820.7622.1933.270.3590.034
−10.08−9.3721.0722.8832.250.3340.032
−9.21−8.7721.3823.2732.040.3300.037
−7.88−7.1421.8624.0331.170.3180.033
−5.37−5.2222.2024.7629.980.3070.030
−2.68−2.4522.3625.2727.720.2750.025
−2.39−2.0022.9325.6327.630.2710.027
−3.04−2.8923.5725.9328.820.2980.029
−4.07−3.3423.9726.3929.730.3140.028
−5.13−4.0124.1326.8730.880.3230.032
−6.21−5.2124.6727.2432.450.3360.033
−7.80−6.7824.9527.7734.550.3570.035
−9.00−7.9825.3928.0436.020.3720.039
−9.98−9.1725.8428.5637.730.3810.040
−11.44−10.5926.2728.8439.430.3940.039
−12.86−11.6726.8829.2740.940.4070.040
−13.47−12.8627.2329.5342.390.4180.038
−14.16−13.2727.4829.7643.030.4230.045
−14.61−14.0326.9729.4443.470.4360.047
−15.19−14.4825.8628.2742.750.4230.041
−15.84−15.1625.3427.7642.920.4200.048
−16.23−15.6324.7727.3542.980.4240.047
−16.78−16.1823.7826.8643.040.4270.047
−17.16−16.2323.3625.9142.140.4210.042
−17.76−16.7922.7625.0441.830.4070.044
−18.10−17.1722.2724.8742.040.4140.048
−18.42−17.5821.7923.9841.560.4180.042
−19.06−17.8921.4723.2641.150.4130.040
−19.37−18.2420.7322.6640.900.4080.041
−19.63−18.7919.7422.1340.920.4100.039
−19.98−19.0719.0921.7540.820.4060.032
−20.17−19.3918.5121.2740.660.3970.033
−20.40−19.6917.9820.7340.420.3910.035
−20.59−19.9917.2719.6439.630.3830.039
−20.75−20.2016.6819.0039.200.3720.040
−20.84−20.4716.3718.3138.780.3670.039
−20.91−20.6817.2817.8838.560.3730.040
−20.97−20.6917.6417.3738.060.3690.038
−21.12−20.9417.9316.8637.80.3610.045
−21.18−20.9818.3816.4737.450.3540.047
−21.23−21.0218.8917.3838.40.3630.041
−21.30−21.0819.3817.7338.810.3700.048
−21.34−21.1119.7917.9739.080.3740.047
−21.41−21.1419.9418.2839.420.3810.047
−21.50−21.1920.3418.8940.080.3960.042
−21.58−21.2620.7719.3840.640.4080.044
−21.64−21.2821.1719.7941.070.4160.032
−21.70−21.3321.4819.9441.270.4270.033
−21.79−21.3622.2320.3441.700.4380.035
−21.87−21.4322.5620.7742.200.4420.039
−21.94−21.4623.7721.3842.840.4510.041
−22.01−21.5123.9322.1743.680.4630.048
−22.08−21.5824.4322.9844.560.4680.047
−22.13−21.6624.8724.2245.880.4710.047
−22.19−21.7925.1725.2747.060.4830.042
−22.25−21.8725.3925.9347.80.4950.044
−22.31−21.9225.8426.8748.790.5040.058
−22.40−21.9826.2727.3149.290.5100.058
−22.47−22.1026.8827.7849.880.5180.054
−22.53−22.1527.2328.5650.710.5290.051
−22.61−22.2226.6429.2751.490.5410.050
−22.67−22.2725.7628.8451.110.5280.050
−22.71−22.3125.3327.8650.170.5210.048
−22.75−22.3924.7426.7949.180.5090.047
−22.79−22.4323.7625.3747.80.4980.047
−22.82−22.4823.3524.7547.230.4840.042
−22.85−22.5722.7723.4646.030.4780.044
−22.90−22.6022.2922.8745.470.4670.048
−22.94−22.6721.7422.2844.950.4550.042
−22.97−22.7121.4821.8944.60.4420.040
−23.02−22.7720.7221.3344.10.4380.041
−23.04−22.8319.6420.9943.820.4310.039
−23.01−22.8919.1920.2643.150.4240.040
−22.93−22.9318.5219.6742.60.3950.032
−22.82−22.8417.9518.3741.210.3900.033
−22.79−22.7917.2117.6740.460.3840.035
−22.68−22.7316.6316.9539.680.3720.039
−22.54−22.6816.3616.5339.210.3680.041
−22.48−22.6017.2917.4640.060.3850.048
−22.30−22.5217.6518.2140.730.3920.044
−22.14−22.3317.9418.9941.320.4060.047
−21.82−22.1918.8819.8442.030.4110.042
−21.57−21.2818.6919.3640.640.4140.041
−21.29−20.8919.4820.2441.130.4210.042
−21.16−20.4819.8920.8741.350.4270.043
−20.66−20.0320.3421.3941.420.4300.045
−20.37−19.8620.8722.2742.130.4410.039
−20.08−19.3721.1922.9842.350.4450.042
−19.46−18.6921.4723.4442.130.4440.044
−18.54−17.8922.2223.9741.860.4360.048
−18.22−17.2722.5724.3241.590.4310.042
−17.69−16.7323.6424.8941.620.4330.040
−17.09−16.0823.9125.2041.280.4320.041
−16.32−15.3024.5325.8741.170.4270.039
−15.50−14.1424.8826.1340.270.4180.040
−14.21−12.8725.2726.5639.430.4090.032
−12.86−11.0925.5026.9538.040.3960.033
−11.57−9.3825.8527.3436.720.3770.035
−10.00−8.7526.2727.7936.540.3710.039
−9.11−7.1726.7628.5335.700.3630.041
−7.89−5.2827.2429.3734.650.3340.048
−5.87−2.4726.6528.4630.930.3170.044
−3.78−2.0425.7927.1929.230.3060.047
−1.69−2.9026.0126.3729.270.3080.042

Appendix C

Table A3. Transition season experiment result data.
External Cabin Temperature/°CExternal Cavity Temperature/°CInternal Cabin Temperature/°CInternal Cavity Temperature/°CTemperature Difference in the Cavity/°CVoltage/VCurrent/A
15.9215.8817.8818.212.330.0110
12.6613.9618.2418.784.820.0170
9.8611.1018.4919.077.970.0280.001
7.559.1418.8719.5410.40.0370.001
5.656.6819.0719.8213.140.0460.002
4.205.4219.6620.2314.810.0510.003
2.693.7819.9220.5116.730.0630.005
1.351.3820.2720.9419.560.0870.009
0.220.1420.5521.3921.250.0980.012
−1.00−1.1120.8921.8422.950.1040.019
−2.03−2.1521.3722.1424.290.1130.011
−3.07−3.1221.8422.7625.880.1210.017
−3.83−3.9722.1823.1827.150.1470.011
−4.65−4.8722.2523.7928.660.1690.022
−5.34−5.2122.7224.2429.450.1810.018
−6.11−6.0723.4824.7930.860.1970.016
−6.74−7.1423.7725.2532.390.2120.020
−7.14−7.4124.0125.4832.890.2270.022
−7.08−7.5824.7825.8833.460.2340.021
−6.89−7.6624.9226.3834.040.2410.022
−7.62−7.8525.2426.7834.630.2480.024
−7.88−7.9624.5727.6635.620.2520.025
−7.94−8.1223.9827.8836.000.2590.026
−8.00−8.1723.4626.4834.650.2680.026
−6.46−7.6822.9425.4533.130.2660.024
−5.06−6.2922.5725.0431.330.2510.020
−3.78−5.4722.0024.6730.140.2410.022
−2.62−4.8921.5424.1529.040.2320.021
−1.67−2.5621.0823.2125.770.2050.019
0.120.7820.4922.7721.990.1470.015
2.461.9719.7821.3919.420.1350.014
4.534.4819.0720.9816.50.0930.010
6.456.6918.2120.4813.790.0850.009
8.218.8417.7719.5710.730.0640.006
9.9110.7718.3518.377.60.0360.004
11.4712.8118.9918.856.040.0280.003
13.0114.1419.2819.775.630.0200.002
15.1216.0719.5920.063.990.0160.002
16.4717.1119.8720.413.30.0120.001
15.6216.5820.2820.784.20.0110.001
12.9613.2120.5621.117.90.0280.003
9.7810.4820.9921.48110.0370.004
7.658.3421.2121.8613.520.0440.005
5.456.7621.5522.0415.280.0520.005
4.305.4621.8722.8817.420.0640.006
2.793.7722.1923.4619.690.0860.008
1.451.3722.9823.1121.740.0970.009
0.320.1323.6423.9823.850.1050.010
−1.07−1.1024.1124.8825.980.1120.011
−2.05−2.1624.7725.3427.500.1230.012
−3.08−3.1324.9125.8428.970.1380.014
−3.85−3.9825.2327.1831.160.2370.023
−4.67−4.8924.5626.7331.620.2420.024
−5.44−5.2323.9726.1131.340.2510.025
−6.21−6.0923.4725.7431.830.2570.026
−6.84−6.7722.9324.9831.750.2640.027
−7.32−7.4322.5623.4630.890.2580.026
−7.04−7.5722.0723.1130.680.2520.025
−5.93−7.6921.5522.4730.160.2470.024
−6.87−7.8521.1821.9929.840.2380.023
−7.43−7.9920.5921.3829.370.2310.023
−7.75−7.9619.9820.9628.920.2230.022
−7.91−8.1219.4720.4828.600.1150.014
−8.08−8.1718.6120.0128.180.1030.011
−6.86−7.5617.7419.5527.110.0950.010
−5.21−6.0718.3719.8725.940.0840.009
−3.79−4.2918.8920.0624.350.0760.008
−2.67−3.0719.2920.4223.490.0710.007
−1.57−2.5819.6720.7723.350.0620.006
0.130.8820.2821.1320.250.0450.005
2.482.9720.5721.4918.520.0370.004
4.564.7821.1921.8717.090.0350.003
6.476.9921.6122.1415.150.0280.003
8.288.9421.9522.9814.040.0220.002
9.9610.8722.3723.7612.890.0160.002
11.5712.0822.8924.4812.400.0140.001
13.2113.8623.2824.9711.110.0090.001
15.1715.0723.7925.6610.590.0110

References

  1. Sun, J.; Li, S.; Dong, Y. Multi-objective optimization of nearly zero energy building shape in cold regions with carbon neutrality orientation. J. Hum. Settl. West China 2024, 39, 87–95. [Google Scholar]
  2. Li, Z.Y.; Liu, J.S. Research on the development and countermeasures of green buildings under the dual carbon target. J. Southwest Financ. 2021, 55–66. (In Chinese) [Google Scholar]
  3. Wang, Y.Y.; Zhang, X.; Zhang, Y.F.; Zhang, H.; Xiong, B.; Shi, X.P. Multi-Objective Analysis of Visual, Thermal, and Energy Performance in Coordination with the Outdoor Thermal Environment of Productive Facades of Residential Communities in Guangzhou, China. Buildings 2023, 13, 1540. [Google Scholar] [CrossRef]
  4. Zhao, Y.H. Features and Construction of Prefabricated Buildings. In Proceedings of the 4th International Conference on Civil Engineering, Architecture and Building Materials (CEABM), Haikou, China, 24–25 May 2014. [Google Scholar]
  5. Chen, Y.; Hou, X.N.; Ma, C.Y.; Dou, Y.K.; Wu, W.T. Review of Development Status of Bi2Te3-Based Semiconductor Thermoelectric Power Generation. Adv. Mater. Sci. Eng. 2018, 2018, 1210562. [Google Scholar] [CrossRef]
  6. Seebeck, T.J. Ueber die magnetische Polarisation der Metalle und Erze durch Temperatur-Differenz. Ann. Phys. 1822, 82, 133–160. [Google Scholar] [CrossRef]
  7. Sommerfeldt, N.; Madani, H. Review of solar PV/thermal plus ground source heat pump systems for European multi-family houses. In Proceedings of the 11th ISES EuroSun Conference, Palma, Spain, 11–14 October 2016. [Google Scholar]
  8. Zhang, J.H.; Ming, H.W.; Li, D.; Qin, X.Y.; Zhang, J.; Huang, L.L.; Song, C.J.; Wang, L. Ultralow Thermal Conductivity and High Thermoelectric Performance of N-type Bi2Te2.7Se0.3-Based Composites Incorporated with GaAs Nanoinclusions. ACS Appl. Mater. Interfaces 2020, 12, 37155–37163. [Google Scholar] [CrossRef]
  9. Han, G.; Chen, Z.G.; Yang, L.; Hong, M.; Drennan, J.; Zou, J. Rational Design of Bi2Te3 Polycrystalline Whiskers for Thermoelectric Applications. ACS Appl. Mater. Interfaces 2015, 7, 989–995. [Google Scholar] [CrossRef]
  10. Win, S.L.Y.; Liao, C.T.; Chang, H.Y.; Lai, C.M. Experimental observations on electricity generation and thermal characteristics of TEG façades. Energy Build. 2023, 294, 113225. [Google Scholar] [CrossRef]
  11. Byon, Y.S.; Jeong, J.W. Annual energy harvesting performance of a phase change material-integrated thermoelectric power generation block in building walls. Energy Build. 2020, 228, 110470. [Google Scholar] [CrossRef]
  12. Hong, B.H.; Huang, X.Y.; He, J.W.; Cai, Y.; Wang, W.W.; Zhao, F.Y. Round-the-clock performance of solar thermoelectric wall with phase change material in subtropical climate: Critical analysis and parametric investigations. Energy 2023, 272, 127128. [Google Scholar] [CrossRef]
  13. Chandel, R.; Singh Chandel, S.; Prasad, D.; Prakash Dwivedi, R. Review on thermoelectric systems for enhancing photovoltaic power generation. Sustain. Energy Technol. Assess. 2022, 53, 102585. [Google Scholar] [CrossRef]
  14. Faheem, M.; Abu Bakr, M.; Ali, M.; Majeed, M.A.; Haider, Z.M.; Khan, M.O. Evaluation of Efficiency Enhancement in Photovoltaic Panels via Integrated Thermoelectric Cooling and Power Generation. Energies 2024, 17, 2590. [Google Scholar] [CrossRef]
  15. Sun, Q.; Du, C.; Chen, G. Thermoelectric materials and applications in buildings. Prog. Mater. Sci. 2025, 149, 101402. [Google Scholar]
  16. Bel-Hadj, I.; Bougrioua, Z.; Ziouche, K. Planar Micro-thermoelectric Generators Based on Cu55Ni45 and Ni90Cr10 Thermocouples for IoT Applications. In Advanced Computational Techniques for Renewable Energy Systems; Springer: Cham, Switzerland, 2023. [Google Scholar]
  17. Wu, J.; Liu, M.; Xu, X.; Zhang, Y.; Lao, X.; Li, K. Preparation and thermal properties of SiC based solar heat absorbing ceramic. J. Chin. Ceram. Soc. 2012, 40, 1685–1692. (In Chinese) [Google Scholar]
  18. Luo, Y.; Zhang, L.; Wu, J.; Liu, Z.; Wu, Z.; He, X. Dynamical simulation of building integrated photovoltaic thermoelectric wall system: Balancing calculation speed and accuracy. Appl. Energy 2017, 204, 887–897. [Google Scholar]
  19. Lamba, R.; Kaushik, S.C. Modeling and performance analysis of a concentrated photovoltaic–thermoelectric hybrid power generation system. Energy Convers. Manag. 2016, 115, 288–298. [Google Scholar]
  20. Liao, T.; Lin, B.; Yang, Z. Performance characteristics of a low concentrated photovoltaic–thermoelectric hybrid power generation device. Int. J. Therm. Sci. 2014, 77, 158–164. [Google Scholar]
  21. Yin, E.; Li, Q.; Xuan, Y. Feasibility analysis of a tandem photovoltaic-thermoelectric hybrid system under solar concentration. Renew. Energy 2020, 162, 1828–1841. [Google Scholar]
  22. Huq, M.; Jasi, A.M.; Poure, P.; Jovanovic, S.; Revol, I.; Lenoir, B. Critical analysis of optimized energy harvesting at small-scale by thermally coupled photovoltaic-thermoelectric systems. Renew. Sustain. Energy Rev. 2024, 195, 114331. [Google Scholar]
  23. Nyandang, A.N.; Singh, B.; Remeli, F.M.; Oberoi, A. Power Generation using Thermoelectric Power Generator with Parabolic Solar Dish Concentrator. J. Phys. Conf. Ser. 2021, 2013, 012004. [Google Scholar]
  24. Pintanel, M.T.; Martínez-Gracia, A.; Galindo, M.P.; Bayod-Rújula, A.A.; Uche, J.; Tejero, J.A.; del Amo, A. Analysis of the Experimental Integration of Thermoelectric Generators in Photovoltaic-Thermal Hybrid Panels. Appl. Sci. 2021, 11, 2915. [Google Scholar] [CrossRef]
  25. Fan, H.N.; Singh, R.; Akbarzadeh, A. Electric Power Generation from Thermoelectric Cells Using a Solar Dish Concentrator. J. Electron. Mater. 2011, 40, 1311–1320. [Google Scholar]
  26. Liu, Z.B.; Zhang, L.; Gong, G.C.; Luo, Y.Q.; Meng, F.F. Evaluation of a prototype active solar thermoelectric radiant wall system in winter conditions. Appl. Therm. Eng. 2015, 89, 36–43. [Google Scholar]
  27. An, Q.Q.; Zhang, T.T.; Han, D.L.; Tan, Y.F. Experimental study on thermoelectric performance of photovoltaic solar thermal wall in severe cold area. Gas Heat 2022, 42, 9–13. (In Chinese) [Google Scholar]
Figure 1. Logical framework diagram.
Buildings 15 01076 g001
Figure 2. Structural decomposition diagram of the TEPG–Wall System.
Buildings 15 01076 g002
Figure 3. Simplified model of the TEPG–Wall System.
Buildings 15 01076 g003
Figure 4. The mesh generation of the TEPG–Wall System.
Buildings 15 01076 g004
Figure 5. Simulation flow chart.
Buildings 15 01076 g005
Figure 6. Real-scene pictures of the environmental chamber: (a) Inside the environmental chamber; (b) Exterior of the environmental chamber; (c) Layout plan of the environmental chamber.
Buildings 15 01076 g006
Figure 7. Physical model of the TEPG–Wall System: (a) Physical model; (b) Experimental results; (c) Equipment placement diagram.
Buildings 15 01076 g007
Figure 8. U/T diagram of the TEPG–Wall System during the summer experiments.
Buildings 15 01076 g008
Figure 9. P/T diagram of the TEPG–Wall System during the summer experiments.
Buildings 15 01076 g009
Figure 10. U/T diagram of the experimental results of the TEPG–Wall System in winter.
Buildings 15 01076 g010
Figure 11. P/T diagram of the experimental results of the TEPG–Wall System in winter.
Buildings 15 01076 g011
Figure 12. U/T diagram of the experimental results of the TEPG–Wall System in the transition season.
Buildings 15 01076 g012
Figure 13. P/T diagram of the experimental results of the TEPG–Wall System in the transition season.
Buildings 15 01076 g013
Figure 14. Variation in the temperatures of the outer compartment, outer cavity, inner compartment, and inner cavity over time in summer.
Buildings 15 01076 g014
Figure 15. Variation in the temperatures of the outer compartment, outer cavity, inner compartment, and inner cavity over time in winter.
Buildings 15 01076 g015
Figure 16. Temperature field distribution in the TEPG–Wall System.
Buildings 15 01076 g016
Figure 17. Voltage simulation results.
Buildings 15 01076 g017
Figure 18. U/I-T diagram of the simulated TEPG–Wall System.
Buildings 15 01076 g018
Figure 19. P-T diagram of the simulated TEPG–Wall System.
Buildings 15 01076 g019
Figure 20. Comparison of the simulated and experimental data.
Buildings 15 01076 g020
Figure 21. Layout diagram of the thermoelectric device per unit area.
Buildings 15 01076 g021
Table 1. Physical characteristics of materials.
Thermal
Conductivity/W/(m·K)
Conductivity/(S/m)Seebeck
Coefficient/(V/K)
Density/(kg/m3)Constant-Pressure Heat
Capacity J/(kg·K)
Ni45Cu55202.04 × 106−3.5 × 10−58900205.9
Ni90Cr10111.42 × 1062.5 × 10−584004.6
Al2O339//3500765
Copper4005.998 × 1071.5 × 10−68960385
Aluminum alloy frame231//2850896
XPS0.041//341450
Concrete1.8//2300880
Table 2. Accuracy and uncertainty of test parameters.
VariableTemperatureVoltageCurrent
Measurement accuracy±3 °C±0.05%±0.5%
Uncertainty±5%±2%±3%
Table 3. Comparison of the power generation performance between the CTEG and TEPG–Wall System.
Equipment NameMaterialNumberDimensionTemperature
Difference
Output Power
CTEGBi2Te312740 mm(L) × 40 mm(W) × 3 mm(T)127 °C4.9 W
TEPG–Wall SystemNi90Cr10–Ni45Cu551580 mm(L) × 2 mm(D)55 °C0.012 W
Table 4. Comparative analysis of seasonal thermoelectric performance studies.
StudySeasonal CoverageΔT Range (°C)Key Limitations Addressed in This Work
Lamba and Kaushik [19]Summer/Winter30–100No transitional season analysis
Liao et al. [20]Summer20–60Limited to stable lighting conditions
Huq et al. [22]Laboratory-Simulated ΔT10–50Lack of real-world transitional data
This studySummer/Winter/Transition2–55Quantified nonlinear ΔT–voltage relationships in transitional climates
Disclaimer/Publisher’s Note: The statements, opinions and data contained in all publications are solely those of the individual author(s) and contributor(s) and not of MDPI and/or the editor(s). MDPI and/or the editor(s) disclaim responsibility for any injury to people or property resulting from any ideas, methods, instructions or products referred to in the content.

