
A Comparison of Different Types of Pull-Off Testing and Splitting Methods for Determining the Tensile Strength of Concrete


 ,
,  and
and
Abstract
1. Introduction
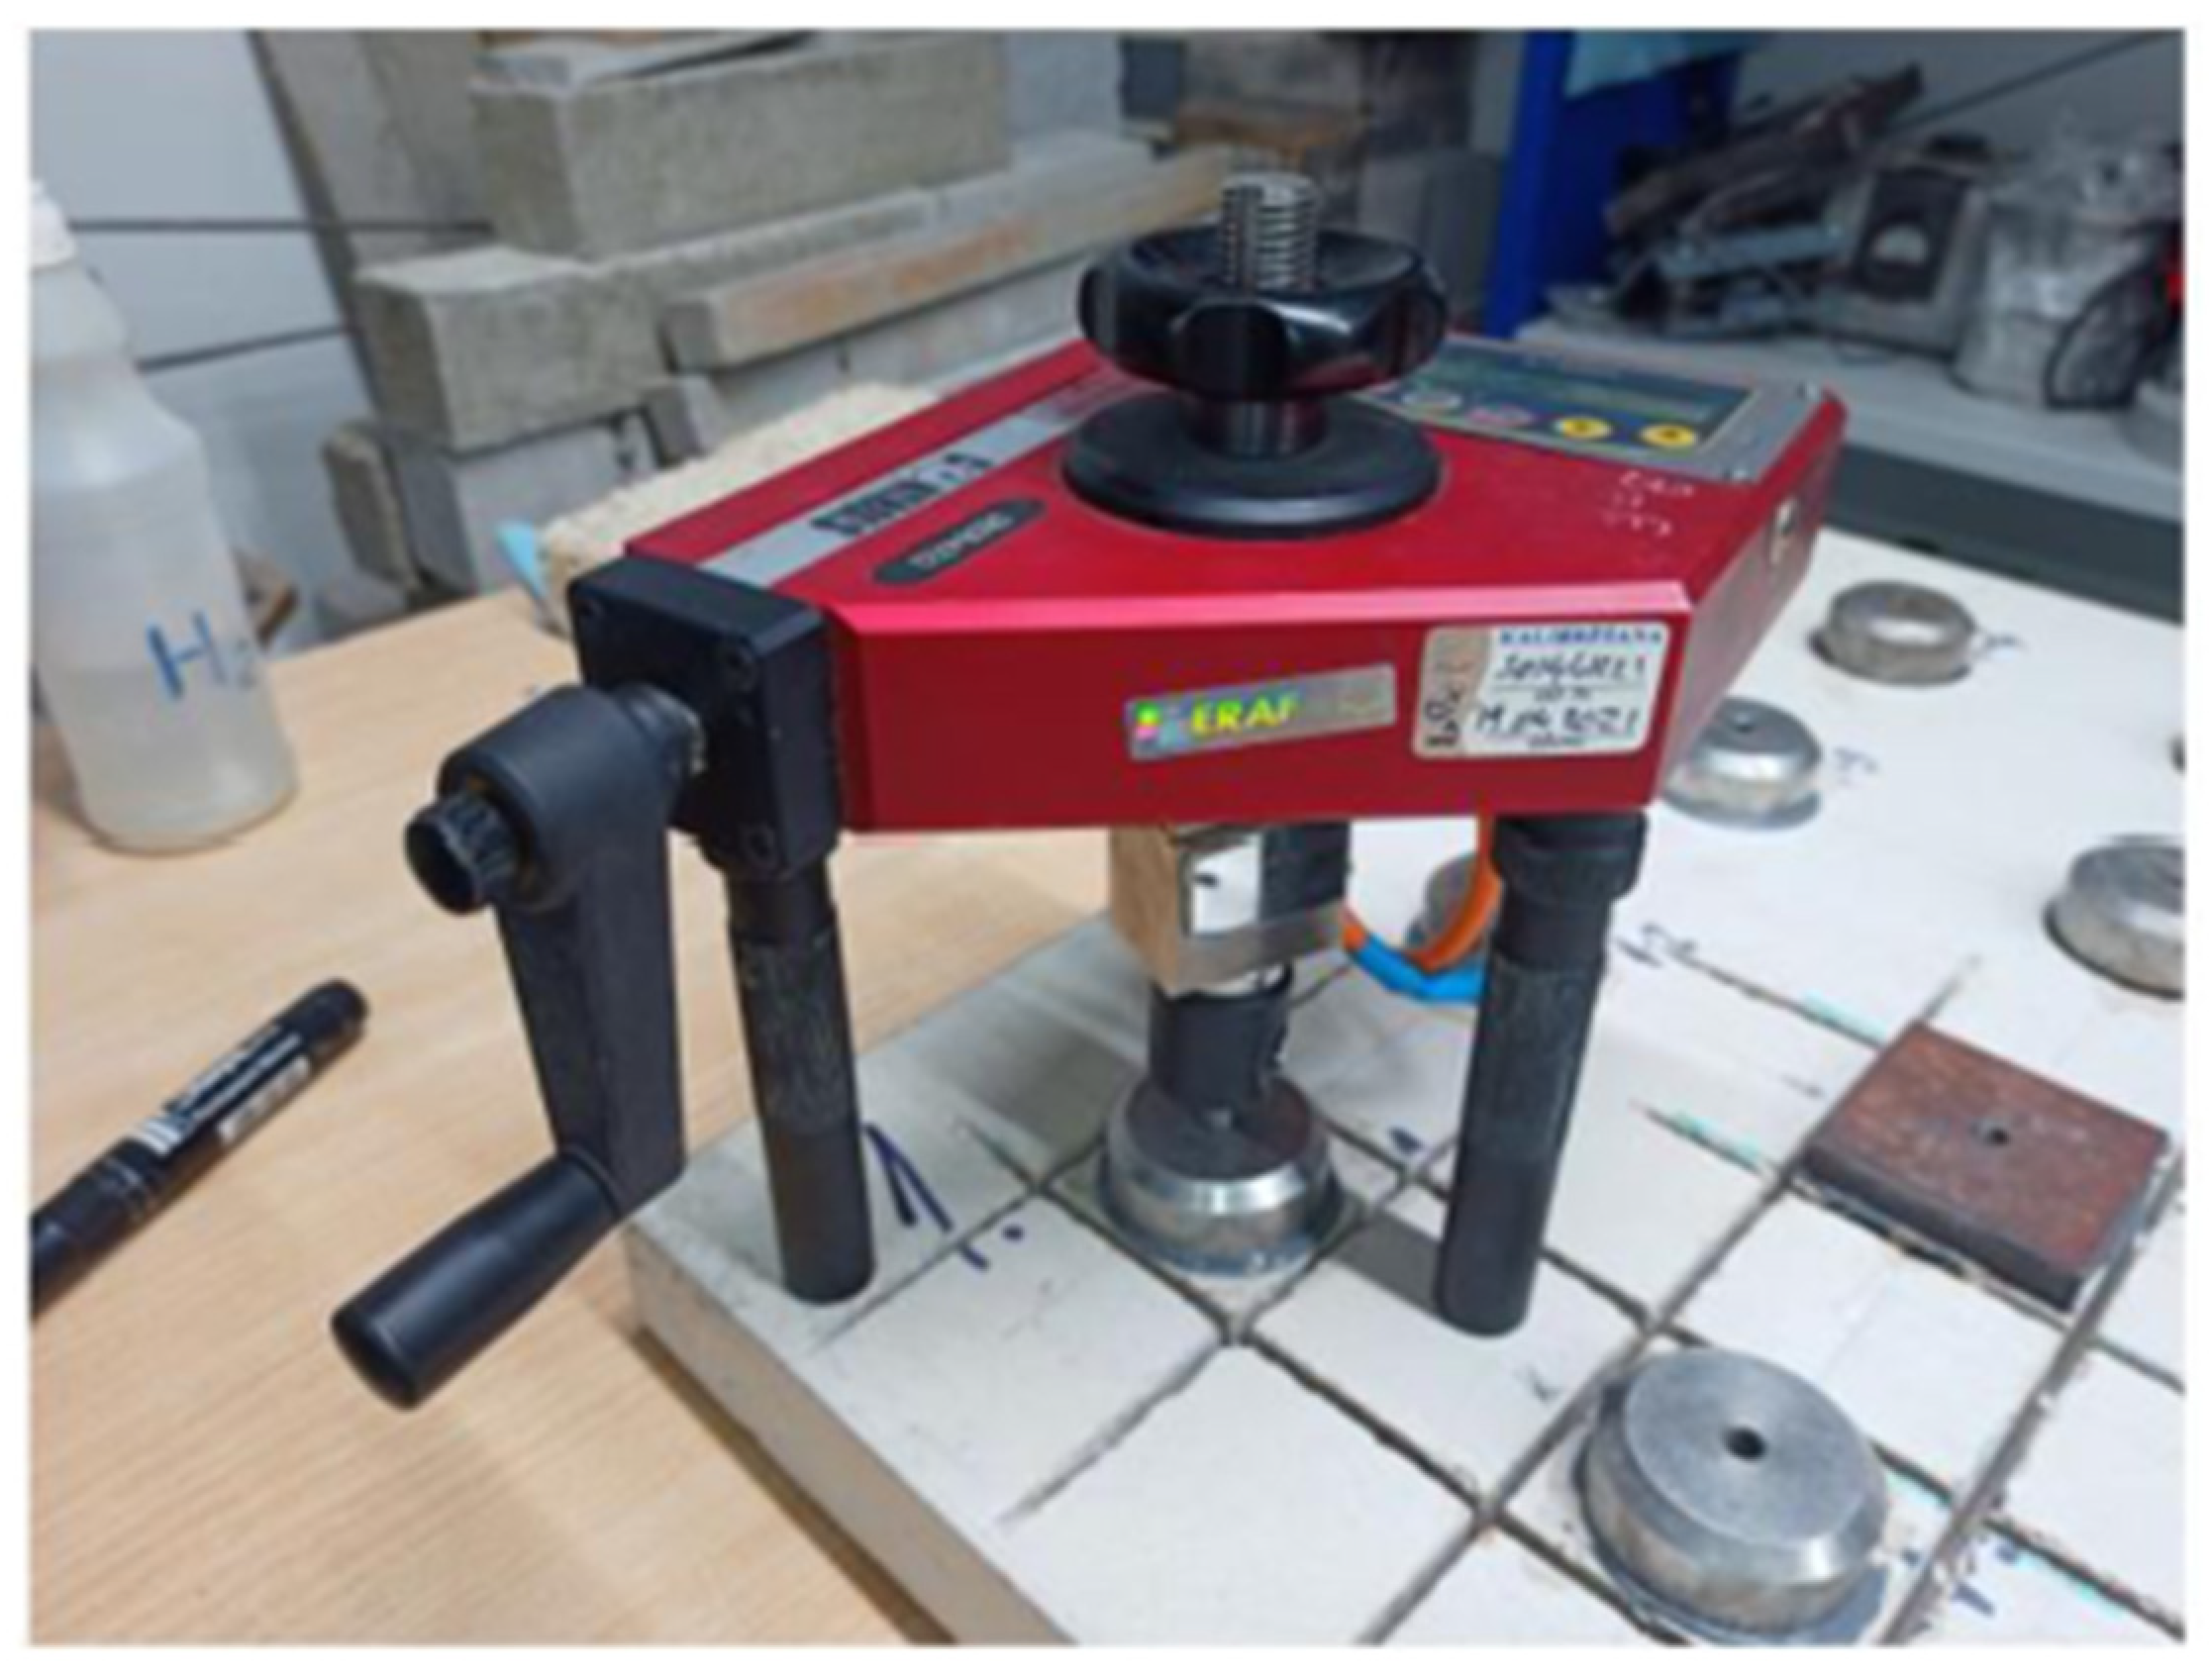
2. Materials and Methods
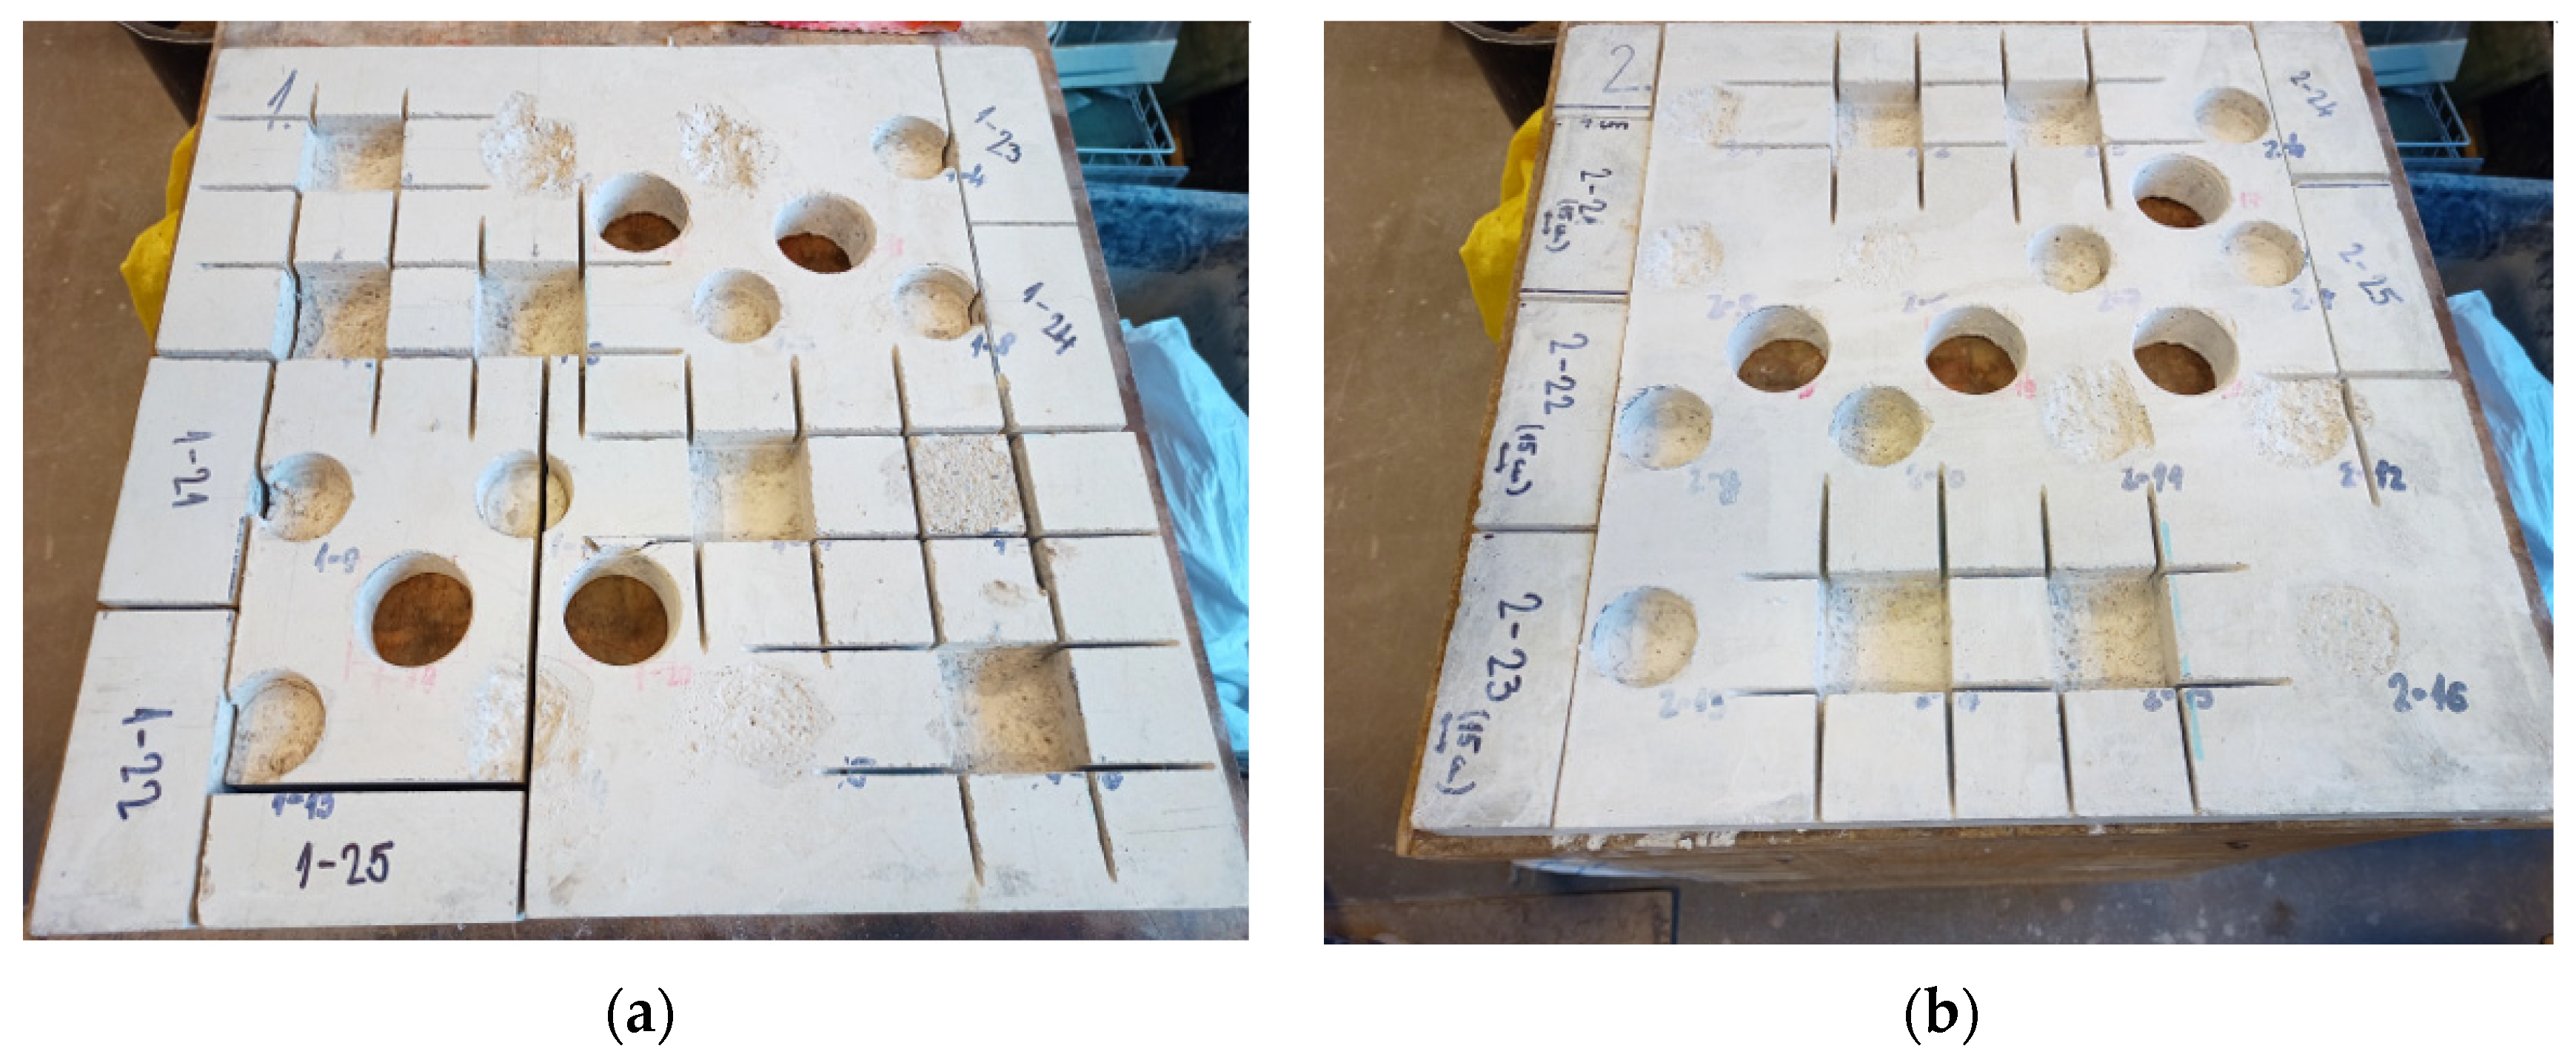
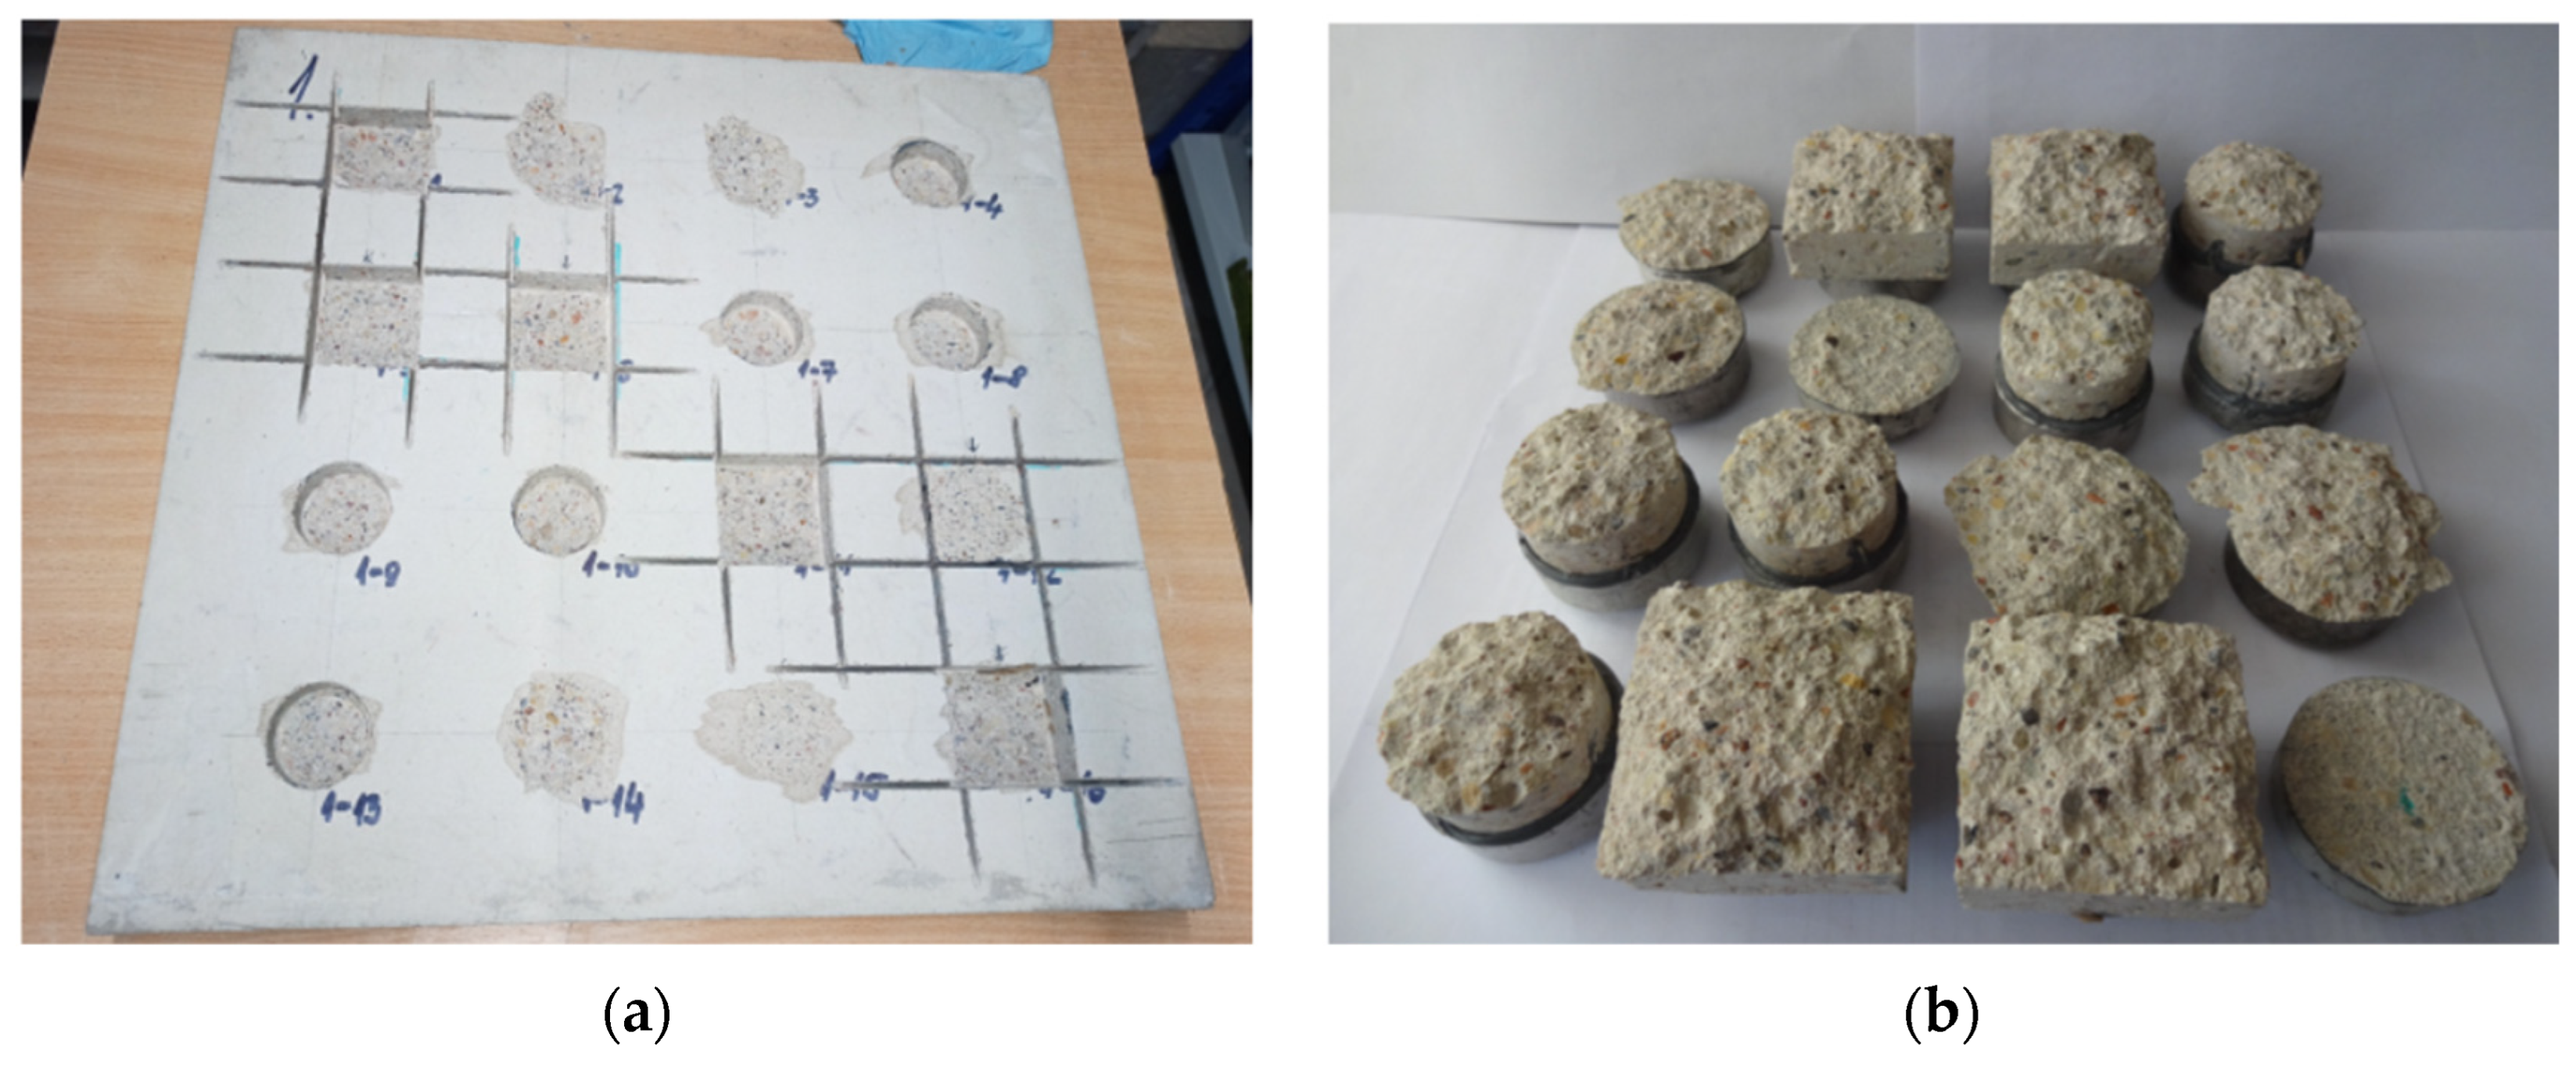
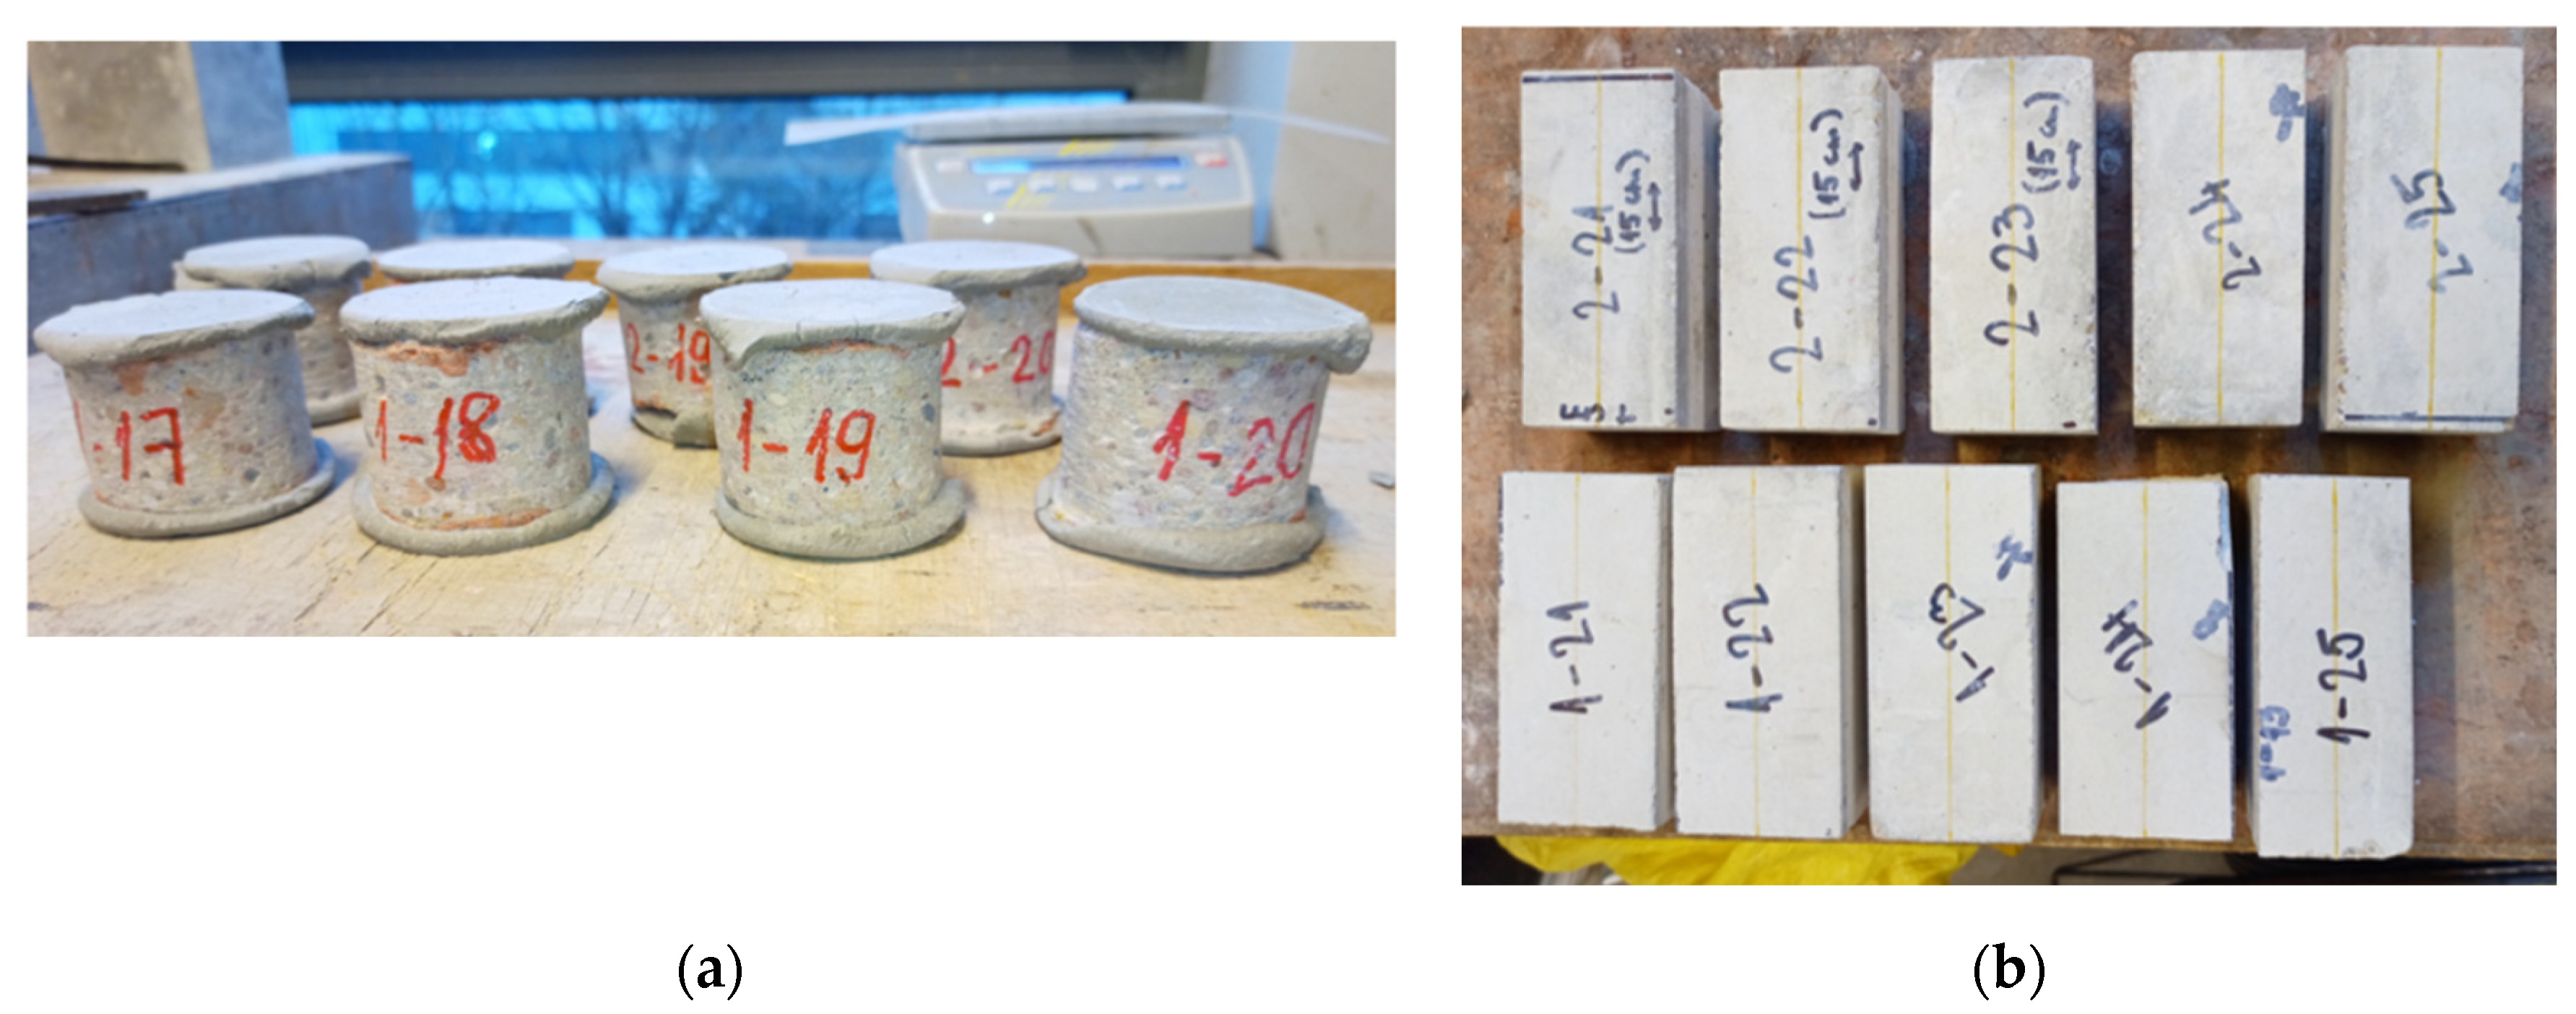
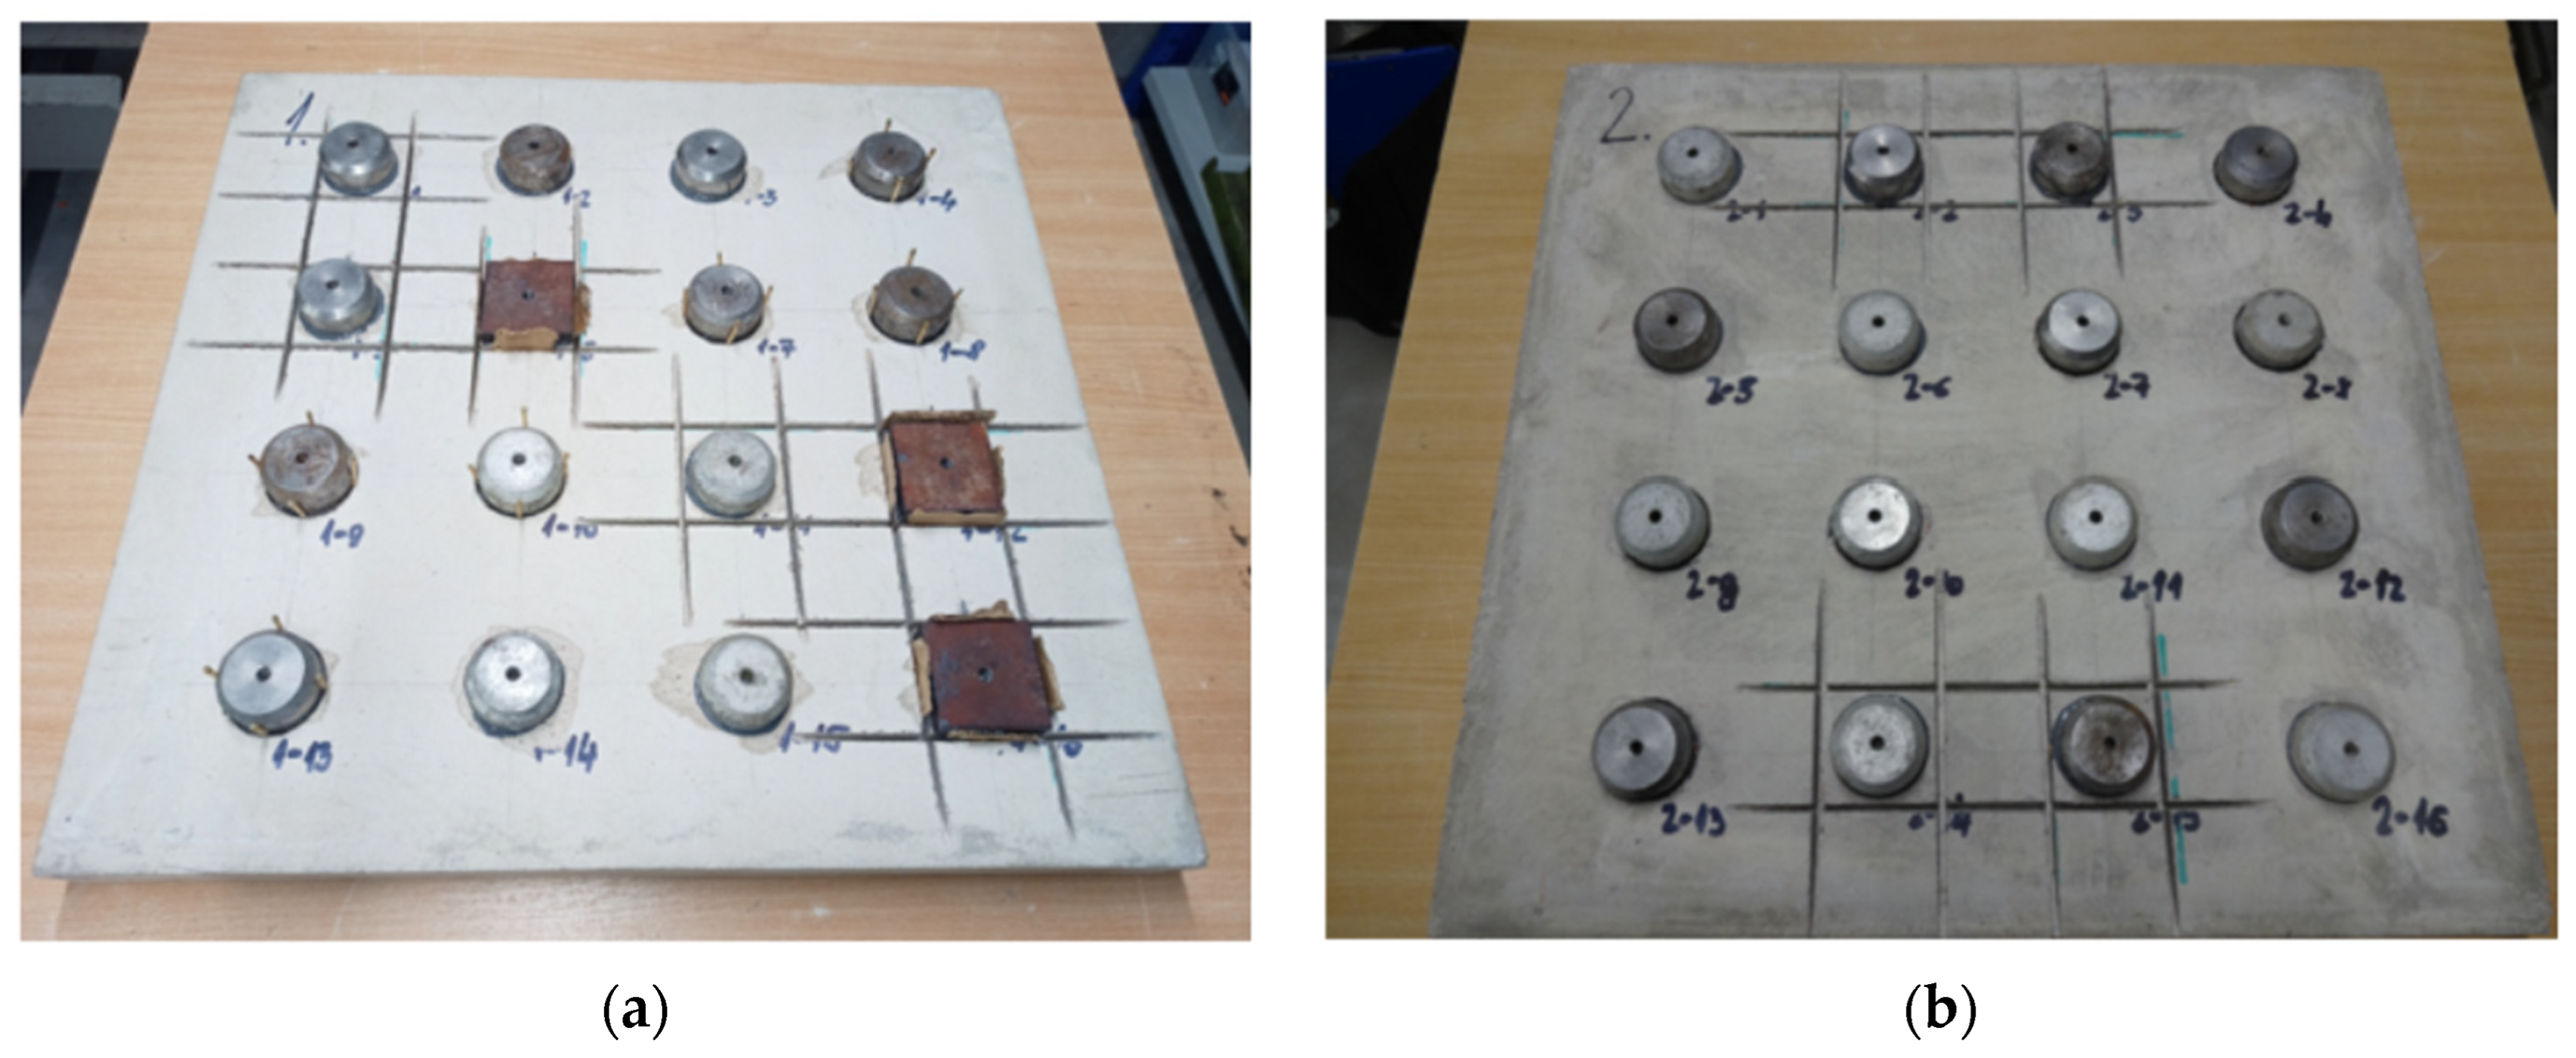
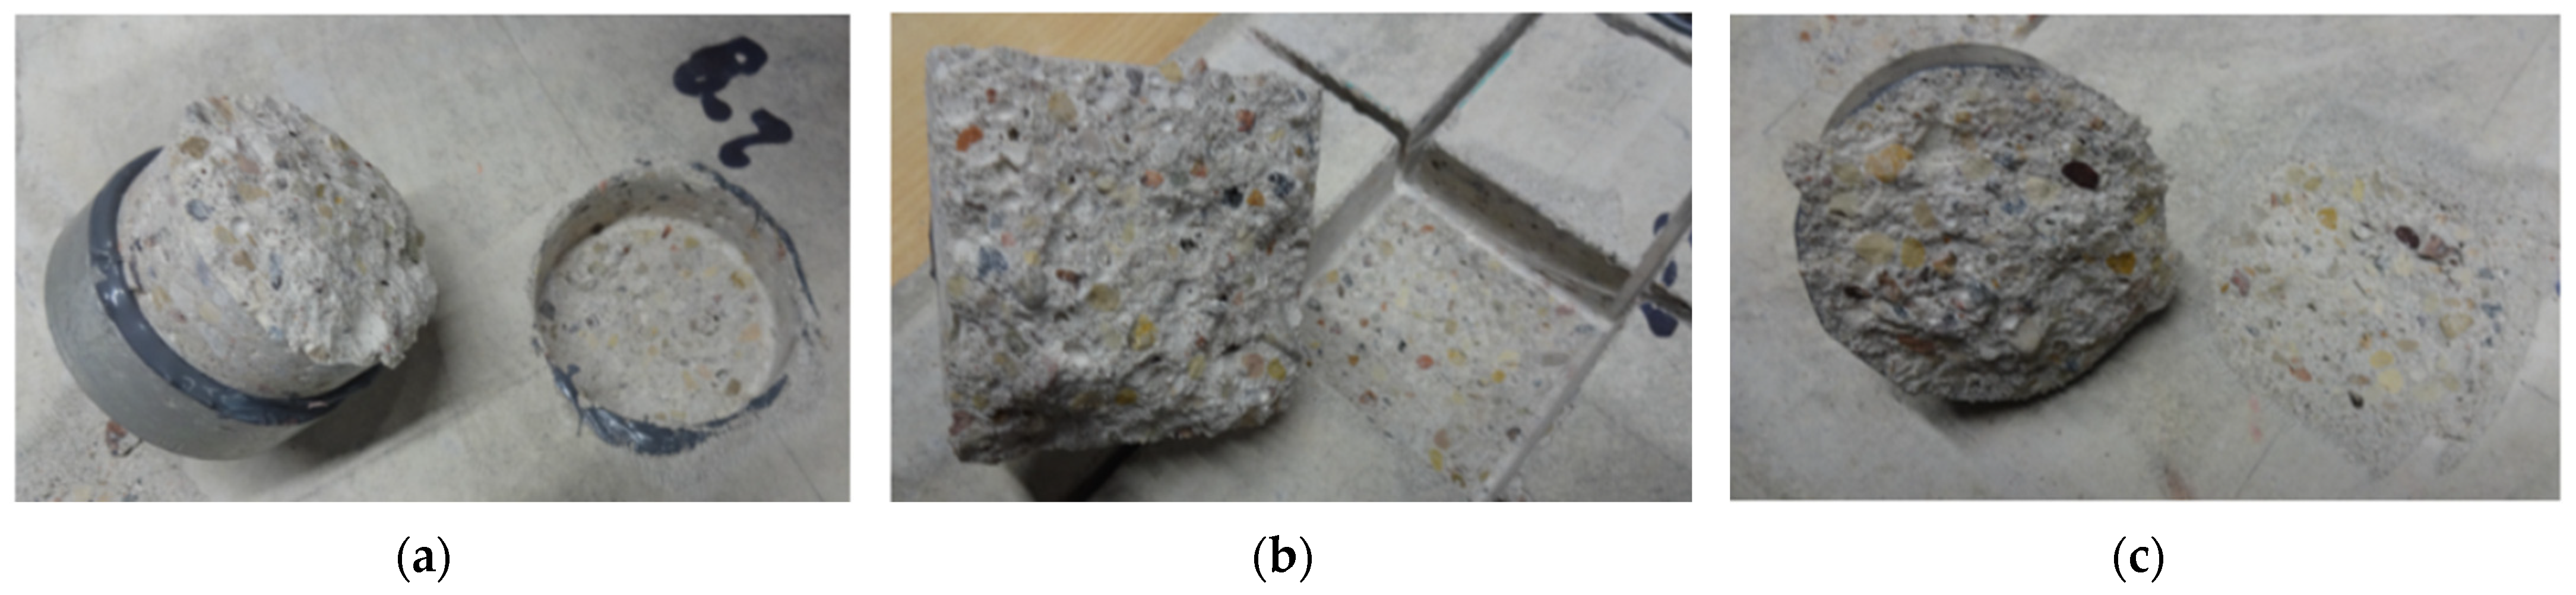
- Cylindrical specimens with a circular cutting depth, to the surface of which metal pull-head plates were glued, following the standard EN 13892-8:2002 [4]—standard method;
- Rectangular specimens with a square sawing depth, onto which metal pull-head plates were glued—rectangular method;
- Circular specimens bonded directly to a concrete surface without prior preparation, thereby not defining a regular failure zone—straight-to-surface method.
3. Results
4. Discussions
5. Conclusions
- The standard pull-off method showed the lowest deviation and may be much closer to the uniaxial tensile strength, making it the most reliable method for determining concrete’s tensile properties.
- The rectangular method produced tensile strength results that were 33% to 35% lower than the standard method. This is likely due to increased stress concentration at the corners of the rectangular pull-off region, which is less uniform compared to the circular method. Therefore, this method is not suitable for tensile strength determination.
- The straight-to-surface method was found to be unreliable, as the strength readings were highly dependent on the failure area size—larger failure areas resulted in lower strength readings. Moreover, the results of this method showed significantly greater dispersion.
- The average values of the tensile splitting strength were 14% to 37% higher in comparison to the pull-off test results for the standard method.
- Regarding the effect of increased water content, when the water content in the concrete mix was increased by 20%, only minor changes were observed in the pull-off test results. However, tensile splitting strength dropped by 20% to 54%, with higher deviations due to the complex stress state in the splitting test.
- Regarding the correlation between density, UPV, and rebound hardness, a high correlation (r = 0.81–0.88) was found between concrete density and ultrasonic pulse velocity (UPV). A strong correlation was also observed between rebound hardness and results from destructive testing methods.
Author Contributions
Funding
Data Availability Statement
Conflicts of Interest
Appendix A


| Specimen Designation | Diameter of Specimen d, mm | Tensile Area A, mm2 | Ultimate Tensile Force F, kN | Tensile Strength B, MPa | Minimum Drilling Depth, mm | Depth of Failure, mm |
|---|---|---|---|---|---|---|
| 1-4 | 44.8 | 1576 | 4.869 | 3.09 | 18.0 | 10.5–19.0 |
| 1-7 | 44.9 | 1583 | 4.601 | 2.91 | 17.4 | 8.5–20.5 |
| 1-8 | 44.7 | 1569 | 4.473 | 2.85 | 17.3 | 13.0–19.0 |
| 1-9 | 44.7 | 1569 | 4.374 | 2.79 | 17.5 | 16.0–22.5 |
| 1-10 | 44.7 | 1569 | 4.653 | 2.97 | 18.1 | 13.0–20.0 |
| 1-13 | 44.9 | 1583 | 4.917 | 3.11 | 17.0 | 13.0–18.0 |
| on average | 2.95 | - | - |
| Specimen Designation | Dimensions of the Sawn Rectangular Section, mm | Tensile Area A, mm2 | Ultimate Tensile Force F, kN | Tensile Strength B, MPa | Minimum Sawing Depth, mm | Depth of Failure, mm | |
|---|---|---|---|---|---|---|---|
| a | b | ||||||
| 1-1 | 59.1 | 56.2 | 3321 | 7.448 | 2.24 | 16.8 | 15.5–30.5 |
| 1-5 | 59.1 | 60.8 | 3593 | 6.659 | 1.85 | 20.0 | 8.0–31.0 |
| 1-6 * | 61.2 | 60.5 | 3703 | 7.233 | 1.95 | 18.9 | 18.0–34.0 |
| 1-11 | 61.1 | 61.1 | 3733 | 7.243 | 1.94 | 21.6 | 19.0–31.0 |
| 1-12 * | 60.3 | 59.3 | 3576 | 6.754 | 1.89 | 21.3 | 0.5–2.0 |
| 1-16 * | 59.5 | 61.3 | 3647 | 7.397 | 2.03 | 21.0 | 20.0–35.0 |
| on average | 1.98 | - | - | ||||
| Specimen Designation | Tensile Area A, mm2 | Ultimate Tensile Force F, kN | Tensile Strength B, MPa | Depth of Failure, mm |
|---|---|---|---|---|
| 1-2 | 3139 | 7.344 | 2.34 | 0.2–11.0 |
| 1-3 | 2588 | 8.395 | 3.24 | 0.2–7.5 |
| 1-14 | 2214 | 8.278 | 3.74 | 0.1–7.5 |
| 1-15 | 2205 | 6.921 | 3.14 | 0.1–0.3 |
| on average | 3.12 | - |
| Specimen Designation | Diameter of Specimen d, mm | Tensile Area A, mm2 | Ultimate Tensile Force F, kN | Tensile Strength B, MPa | Minimum Drilling Depth, mm | Depth of Failure, mm |
|---|---|---|---|---|---|---|
| 2-4 | 44.9 | 1583 | 4.989 | 3.15 | 19.1 | 17.0–29.5 |
| 2-7 | 45.0 | 1590 | 4.939 | 3.11 | 18.5 | 8.0–23.0 |
| 2-8 | 45.0 | 1590 | 4.262 | 2.68 | 17.0 | 15.0–20.5 |
| 2-9 | 45.0 | 1590 | 4.488 | 2.82 | 18.8 | 17.0–22.0 |
| 2-10 | 45.0 | 1590 | 4.782 | 3.01 | 18.0 | 13.0–22.0 |
| 2-13 | 44.9 | 1583 | 4.467 | 2.82 | 18.3 | 16.0–25.5 |
| on average | 2.93 | - | - |
| Specimen Designation | Dimensions of the Sawn Rectangular Section, mm | Tensile Area A, mm2 | Ultimate Tensile Force F, kN | Tensile Strength B, MPa | Minimum Sawing Depth, mm | Depth of Failure, mm | |
|---|---|---|---|---|---|---|---|
| a | b | ||||||
| 2-2 | 55.5 | 55.3 | 3069 | 5.603 | 1.83 | 19.6 | 18.5–29.0 |
| 2-3 | 56.3 | 58.6 | 3299 | 6.532 | 1.98 | 18.7 | 19.5–31.5 |
| 2-14 | 59.1 | 62.5 | 3694 | 6.951 | 1.88 | 19.2 | 19.0–30.5 |
| 2-15 | 57.8 | 59.0 | 3410 | 6.445 | 1.89 | 20.4 | 20.0–31.0 |
| on average | 1.89 | - | - | ||||
| Specimen Designation | Tensile Area A, mm2 | Ultimate Tensile Force F, kN | Tensile Strength B, MPa | Depth of Failure, mm |
|---|---|---|---|---|
| 2-1 | 2117 | 7.454 | 3.52 | 1.0–7.5 |
| 2-5 | 2177 | 6.385 | 2.93 | 0.5–9.0 |
| 2-6 | 2274 | 7.995 | 3.52 | 0.1–4.0 |
| 2-11 | 2902 | 7.974 | 2.75 | 0.3–10.5 |
| 2-12 | 3243 | 8.135 | 2.51 | 0.5–8.5 |
| 2-16 | 2241 | 7.231 | 3.23 | 0.1–4.0 |
| on average | 3.08 | - |
References
- Bai, Y.; Basheer, P.A.M.; Cleland, D.J.; Long, A.E. State-of-the-art applications of the pull-off test in civil engineering. Int. J. Struct. Eng. 2009, 1, 93–103. [Google Scholar] [CrossRef]
- ASTM D4541; Standard Test Method for Pull-Off Strength of Coating Using Portable Adhesion Testers. American Society for Testing and Materials: West Conshohocken, PA, USA, 2002.
- EN 1542; Products and Systems for the Protection and Repair of Concrete Structures—Test Methods—Measurement of Bond Strength by Pull-Off. European Committee for Standardization: Brussels, Belgium, 1999.
- EN 13892-8:2002; Methods of Test for Screed Materials—Part 8: Determination of Bond Strength. European Committee for Standardization: Brussel, Belgium, 2002.
- Nilimaa, J.; Nilforoush, R. A Direct tensile strength testing method for concrete from existing structures. CivilEng 2023, 4, 333–344. [Google Scholar] [CrossRef]
- Wu, Z.; Zhang, J.; Yu, H.; Wu, Q.; Da, B. Computer-aided investigation of the tensile behavior of concrete: Relationship between direct and splitting tensile strength. Structures 2023, 55, 453–467. [Google Scholar] [CrossRef]
- Olesen, J.F.; Østergaard, L.; Stang, H. Nonlinear fracture mechanics and plasticity of the split cylinder test. Mater. Struct. 2006, 39, 421–432. [Google Scholar] [CrossRef]
- Le, A.-T.; Hoang, A.L. Comparisons of flexural, split tensile, double punch, and direct tension tests on high-performance concrete reinforced with different fiber types. Case Stud. Constr. Mater. 2023, 19, e02413. [Google Scholar] [CrossRef]
- Rozsypalova, I.; Danek, P.; Karel, O. The bond strength by pull-off and direct tensile strength of concrete damaged by elevated temperatures. IOP Conf. Ser. Mater. Sci. Eng. 2018, 385, 012047. [Google Scholar] [CrossRef]
- Goaiz, H.A.; Yu, T.; Hadi, M.N.S. Quality evaluation tests for tensile strength of reactive powder concrete. J. Mater. Civil Eng. 2018, 30, 04018070. [Google Scholar] [CrossRef]
- Słowik, M.; Akram, A. Length effect at testing splitting tensile strength of concrete. Materials 2022, 15, 250. [Google Scholar] [CrossRef]
- Hasegawa, T.; Shioya, T.; Okada, T. Cracking and size effect in concrete—Splitting tensile strength of large concrete cylinder. J. Cem. Concr. 1986, 474, 6–20. [Google Scholar]
- Bazant, Z.P.; He, S.; Plesha, M.E.; Gettu, R.; Rowlands, R.E. Rate and size effect in concrete fracture: Implications for dams. In Proceedings of the International Conference on Dam Fracture, Denver, CO, USA, 11–13 September 1991; University of Colorado: Boulder, CO, USA, 1991; pp. 413–425. [Google Scholar]
- Kanos, A.; Kanos, A.; Perdikaris, P. Size effect on concrete splitting tensile strength and modulus of elasticity. In Measuring, Monitoring and Modeling Concrete Properties; Konsta-Gdoutos, M.S., Ed.; Springer: Dordrecht, The Netherlands, 2006; pp. 239–246. [Google Scholar] [CrossRef]
- Al-Abdaly, N.M.; Seno, M.E.; Thwaini, M.A.; Imran, H.; Ostrowski, K.A.; Furtak, K. Advanced ensemble machine-learning models for predicting splitting tensile strength in silica fume-modified concrete. Buildings 2024, 14, 4054. [Google Scholar] [CrossRef]
- EN 12390-1:2021; Testing Hardened Concrete—Part 1: Shape, Dimensions and Other Requirements for Specimens and Moulds. European Committee for Standardization: Brussels, Belgium, 2021.
- Ramos, N.M.M.; Simões, M.L.; Delgado, J.M.P.Q.; de Freitas, V.P. Applicability of the pull-off test: Teachings from a large sample of in situ tests. In Hygrothermal Behavior, Building Pathology and Durability; de Freitas, V.P., Delgado, J.M.P.Q., Eds.; Springer: Berlin/Heidelberg, Germany, 2013; pp. 165–181. [Google Scholar]
- Julio, E.N.B.S.; Branco, F.A.B.; Silva, V.D. Concrete-to-concrete bond strength. Influence of the roughness of substrate surface. Constr. Build. Mater. 2004, 18, 675–681. [Google Scholar] [CrossRef]
- Vaysburd, A.M. An Evaluation of Equipment and Procedures for Tensile Bond Testing of Concrete Repairs; Report REMR-CS-61; U.S. Army Corps of Engineers: Washington, DC, USA, 1999; Available online: https://apps.dtic.mil/sti/tr/pdf/ADA366843.pdf (accessed on 6 October 2024).
- Bungey, J.H.; Madandoust, R. Factors influencing pull-off tests on concrete. Mag. Concr. Res. 1992, 44, 21–30. [Google Scholar] [CrossRef]
- Ghavidel, R.; Madandoust, R.; Ranjbar, M.M. Reliability of pull-off test for steel fiber reinforced self-compacting concrete. Measurement 2015, 73, 628–639. [Google Scholar] [CrossRef]
- Das, K.K.; Lam, E.S.-S.; Ip, C.T.; Chau, Y.K.; Jang, J.G. Modified pull-off test evaluation of bond properties in preplaced aggregate concrete incorporating silica fume. J. Build. Eng. 2024, 82, 108264. [Google Scholar] [CrossRef]
- Pereira, E.; de Medeiros, M.H.F. Pull off test to evaluate the compressive strength of concrete: An alternative to Brazilian standard techniques. Rev. IBRACON Estrut. Mater. 2012, 5, 757–780. [Google Scholar] [CrossRef]
- Popovics, J.S.; Song, W.-J.; Ghandshari, M.; Subramaniam, K.V.; Achenbach, J.D.; Shah, S.P. Application of surface wave transmission measurements for crack depth determination in concrete. ACI Mater. J. 2000, 97, 127–135. [Google Scholar]
- ACI Committee 228. ACI 228.1R-19 Report on Methods for Estimating In-Place Concrete Strength; American Concrete Institute: Farmington Hills, MI, USA, 2019; Available online: https://www.scribd.com/document/606239231/ACI-228-1R-19-Report-on-Methods-for-Estimating-In-Place-Concrete-Strength (accessed on 6 October 2024).
- GOST 28570-2019; Concrete. Methods for Determining the Strength of Samples Taken from Structures. Russian Institute of Standardization, Russian Federation: Moscow, Russia, 2019. Available online: https://internet-law.ru/gosts/gost/70846/ (accessed on 12 March 2025). (In Russian)


| Component | Slab No. 1 [kg/m3] | Slab No. 2 [kg/m3] |
|---|---|---|
| Portland cement (CEM I 42.5N) | 300 | 300 |
| Water | 200 | 239 |
| Quartz sand (0/2) | 800 | 800 |
| Dolomite aggregates (2/8) | 1000 | 1000 |
| Superplasticizer (%) | 1.2 | – |
| w/c | 0.67 | 0.80 |
| Pull-Off Test Method | Slab No. 1 | Slab No. 2 |
|---|---|---|
| Standard | 6 | 6 |
| Rectangular | 6 | 4 |
| Straight-to-surface | 4 | 6 |
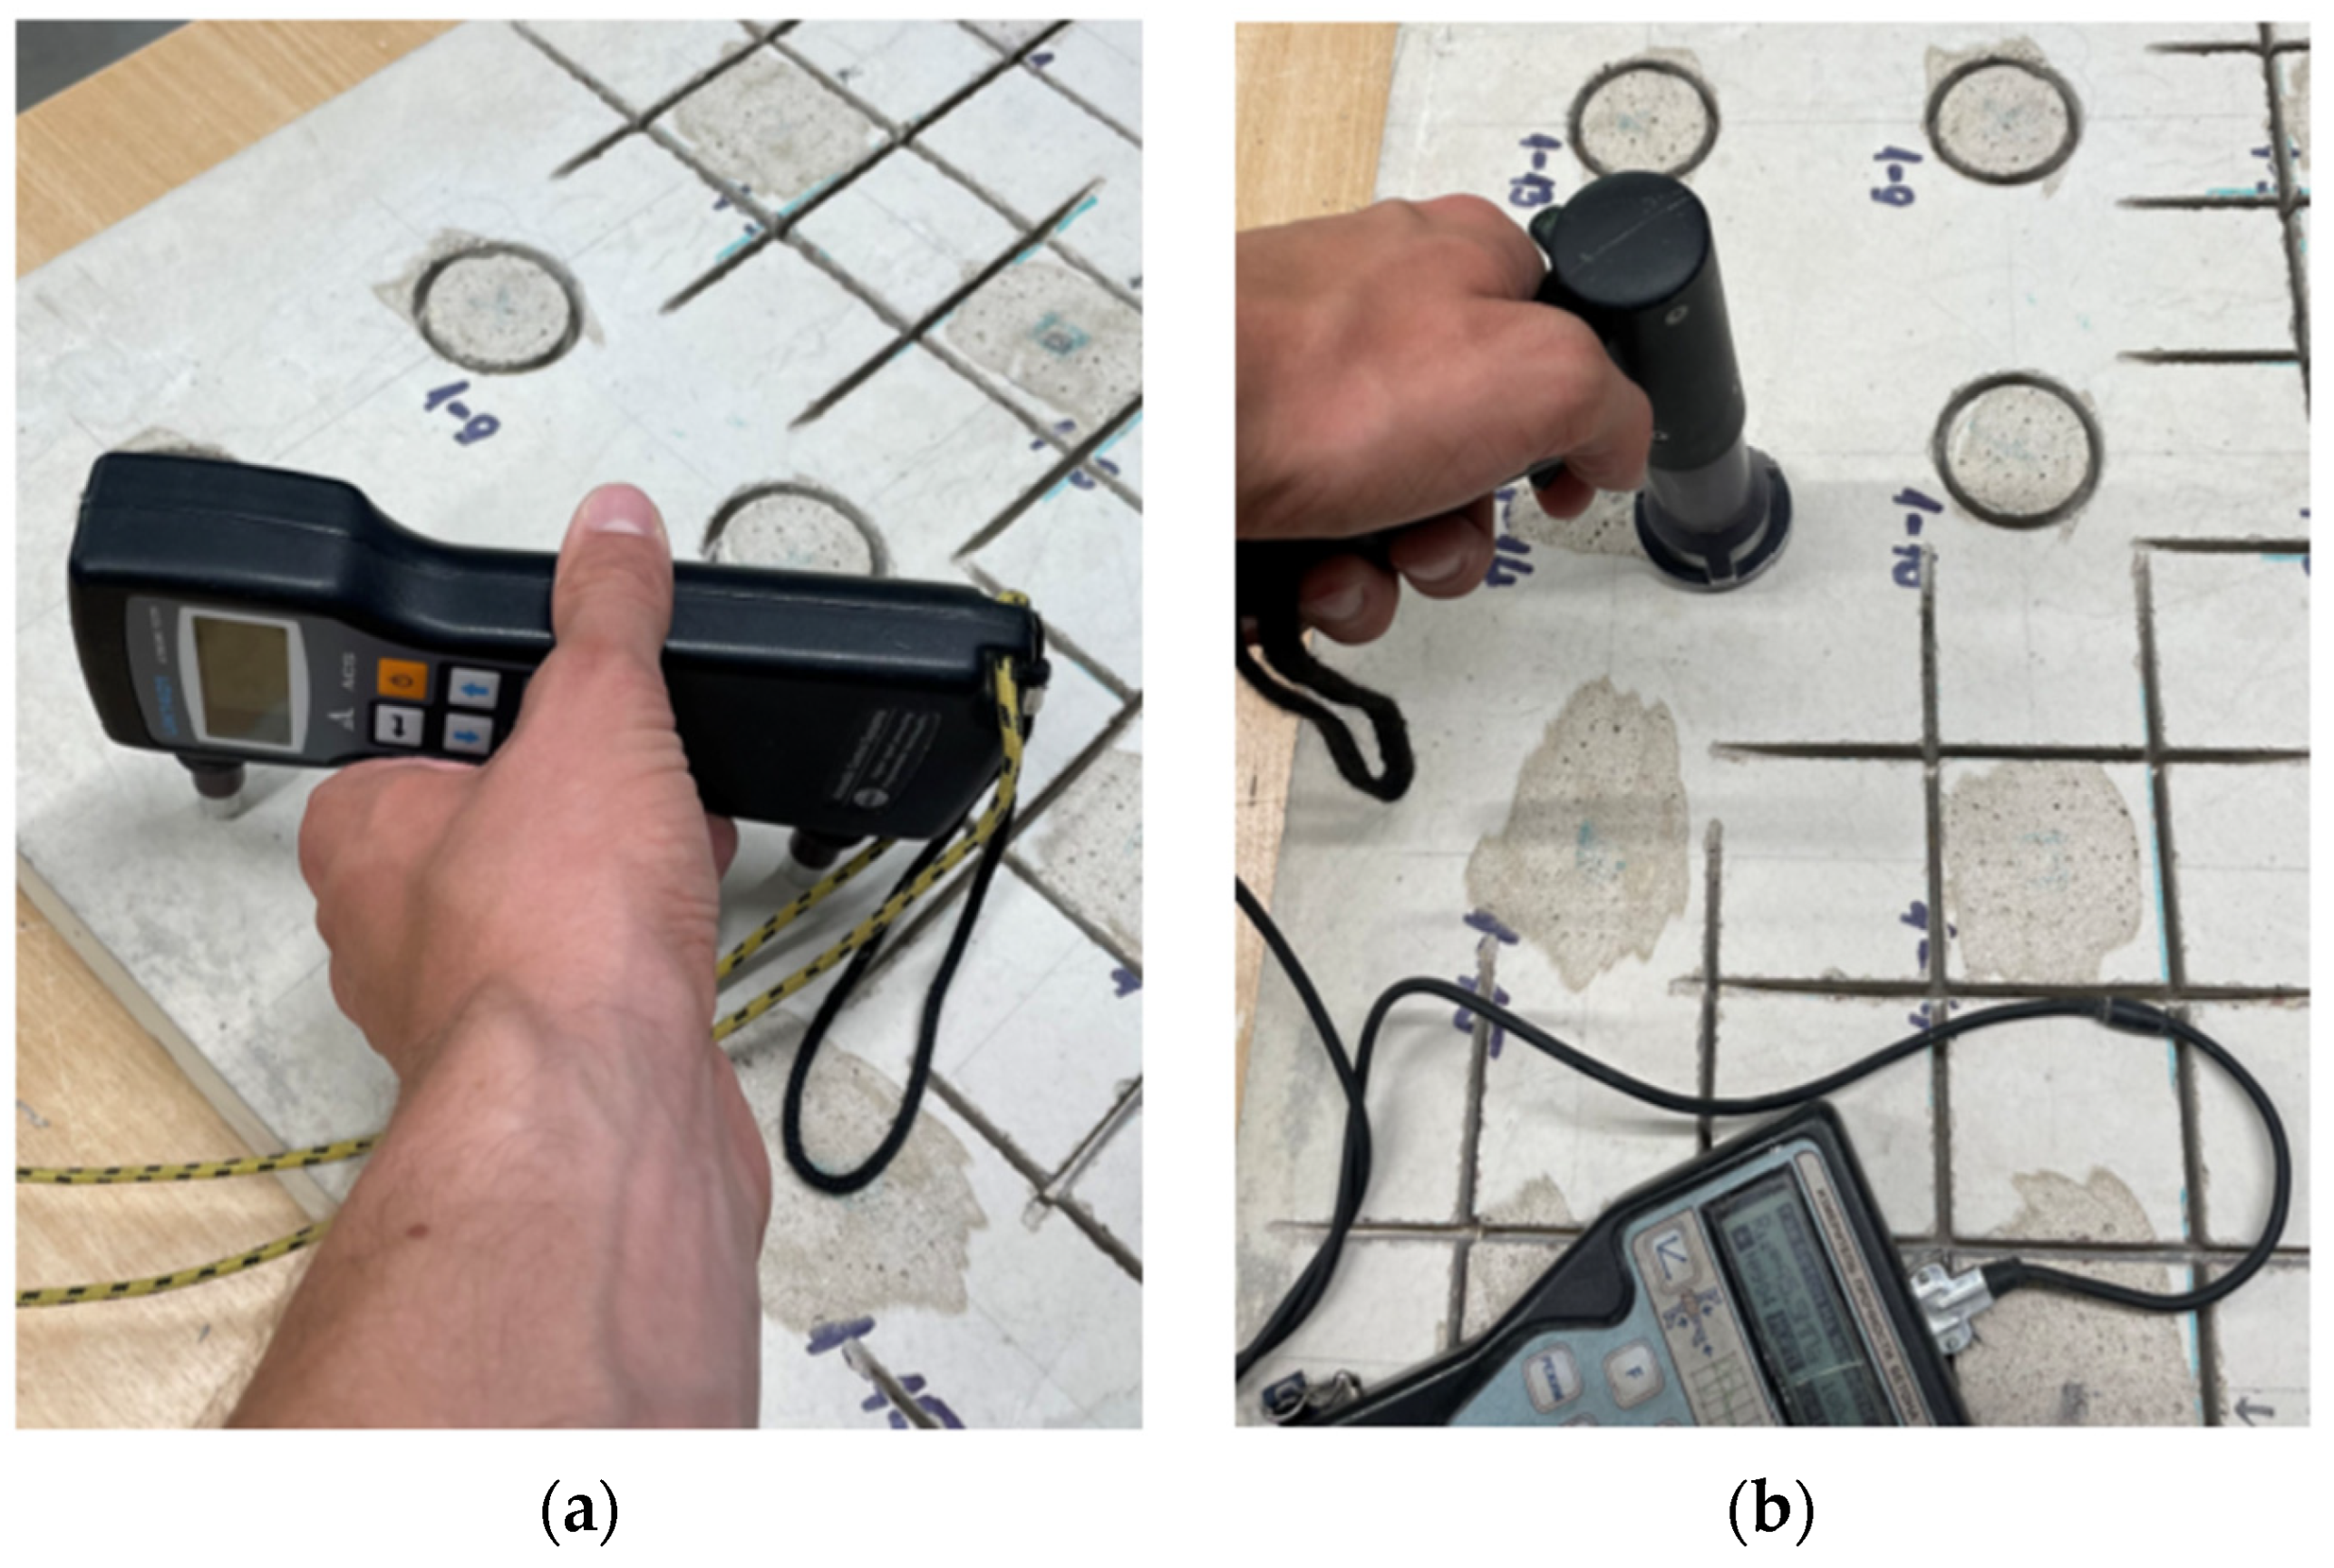
| Object | Slab No. 1 | Slab No. 2 | ||||
|---|---|---|---|---|---|---|
| Property | UPV, m/s | RH, MPa | Density, kg/m3 | UPV, m/s | RH, MPa | Density, kg/m3 |
| Average value | 4500 | 54.3 | 2269 | 4284 | 42.1 | 2191 |
| Minimum value | 4400 | 48.1 | 2245 | 4180 | 37.1 | 2176 |
| Maximum value | 4590 | 58.8 | 2284 | 4350 | 47.5 | 2220 |
| Standard deviation | 40 | 2.6 | 15 | 33 | 2.3 | 17 |
| Coefficient of variation, % | 0.9 | 4.7 | 0.7 | 0.8 | 5.5 | 0.8 |
| Object | Slab No. 1 | Slab No. 2 | ||||
|---|---|---|---|---|---|---|
| Pull-Off Test Method | Standard | Rectangular | Straight-to-Surface | Standard | Rectangular | Straight-to-Surface |
| Average value, MPa | 2.95 | 1.98 | 3.12 | 2.93 | 1.89 | 3.08 |
| Minimum value, MPa | 2.79 | 1.85 | 2.34 | 2.68 | 1.83 | 2.51 |
| Maximum value, MPa | 3.11 | 2.24 | 3.74 | 3.15 | 1.98 | 3.52 |
| Standard deviation, MPa | 0.13 | 0.14 | 0.58 | 0.19 | 0.06 | 0.42 |
| Coefficient of variation, % | 4.3 | 7.0 | 18.6 | 6.3 | 3.4 | 13.5 |
| Number of tests | 6 | 6 | 4 | 6 | 4 | 6 |
| Pull-Off Test Method | Tensile Strength, MPa | |||
|---|---|---|---|---|
| Slab No. 1 | Difference * | Slab No. 2 | Difference * | |
| Standard | 2.95 | - | 2.93 | - |
| Rectangular | 1.98 | −33% | 1.89 | −35% |
| Straight-to-surface | 3.12 | +6% | 3.08 | +5% |
| Object | Slab No. 1 | Slab No. 2 | ||
|---|---|---|---|---|
| Destructive Test Method | Compressive Strength | Tensile Splitting Strength | Compressive Strength | Tensile Splitting Strength |
| Average value, MPa | 47.7 | 4.04 | 34.9 | 3.33 |
| Minimum value, MPa | 44.4 | 3.30 | 32.2 | 2.33 |
| Maximum value, MPa | 51.9 | 5.08 | 37.3 | 4.05 |
| Standard deviation, MPa | 3.5 | 0.8 | 2.2 | 0.7 |
| Coefficient of variation, % | 7.3 | 19.2 | 6.3 | 20.6 |
| Number of tests | 4 | 5 | 4 | 5 |
| Object | UPV, m/s | RH, MPa | Density, kg/m3 | Tensile Strength *, MPa | Compressive Strength, MPa | Tensile Splitting Strength, MPa |
| Slab No. 1 | 4500 | 54.3 | 2269 | 2.95 | 47.7 | 4.04 |
| Slab No. 2 | 4284 | 42.1 | 2191 | 2.93 | 34.9 | 3.33 |
| Δ (Slab No. 1/Slab No. 2) | +5% | +22% | +3% | +1% | +27% | +18% |
Disclaimer/Publisher’s Note: The statements, opinions and data contained in all publications are solely those of the individual author(s) and contributor(s) and not of MDPI and/or the editor(s). MDPI and/or the editor(s) disclaim responsibility for any injury to people or property resulting from any ideas, methods, instructions or products referred to in the content. |
© 2025 by the authors. Licensee MDPI, Basel, Switzerland. This article is an open access article distributed under the terms and conditions of the Creative Commons Attribution (CC BY) license (https://creativecommons.org/licenses/by/4.0/).
Share and Cite
Lencis, U.; Udris, A.; Kara De Maeijer, P.; Korjakins, A.; Zvejnieks, E. A Comparison of Different Types of Pull-Off Testing and Splitting Methods for Determining the Tensile Strength of Concrete. Buildings 2025, 15, 1068. https://doi.org/10.3390/buildings15071068
Lencis U, Udris A, Kara De Maeijer P, Korjakins A, Zvejnieks E. A Comparison of Different Types of Pull-Off Testing and Splitting Methods for Determining the Tensile Strength of Concrete. Buildings. 2025; 15(7):1068. https://doi.org/10.3390/buildings15071068
Chicago/Turabian StyleLencis, Uldis, Aigars Udris, Patricia Kara De Maeijer, Aleksandrs Korjakins, and Egils Zvejnieks. 2025. "A Comparison of Different Types of Pull-Off Testing and Splitting Methods for Determining the Tensile Strength of Concrete" Buildings 15, no. 7: 1068. https://doi.org/10.3390/buildings15071068
APA StyleLencis, U., Udris, A., Kara De Maeijer, P., Korjakins, A., & Zvejnieks, E. (2025). A Comparison of Different Types of Pull-Off Testing and Splitting Methods for Determining the Tensile Strength of Concrete. Buildings, 15(7), 1068. https://doi.org/10.3390/buildings15071068