Article

The Multifaceted Impact of Public Spaces, Community Facilities, and Residents’ Needs on Community Participation Intentions: A Case Study of Tianjin, China

1
School of Architecture and Art Design, Hebei University of Technology, Tianjin 300130, China
2
Centre for Urban and Rural Renewal and Architectural Heritage Conservation, Hebei University of Technology, Tianjin 300130, China
*
Author to whom correspondence should be addressed.
Buildings 2025, 15(7), 1060; https://doi.org/10.3390/buildings15071060
Submission received: 8 February 2025 / Revised: 17 March 2025 / Accepted: 22 March 2025 / Published: 25 March 2025
(This article belongs to the Section Architectural Design, Urban Science, and Real Estate)

Abstract

The rise in population and housing mobility presents significant challenges for fostering social cohesion. This study, grounded in consistency theory, leverages survey data collected from various Tianjin regions and adopts a combination of quantitative and qualitative research methods to examine the multilevel influence of public spaces, community facilities, and individual motivation on community participation intention (CPI). We assess regional variations and distinguish between public spaces and the accessibility and usability of service facilities. Logistic regression results reveal that (1) age, family type, community types, the usability of facilities, residents’ needs, and neighborhood attachment have significant effects on CPI; (2) residents’ requirements for education, healthcare, and elderly services are strongly correlated with CPI, and high-quality public spaces and facilities significantly increase place attachment; and (3) the usage of some facilities negatively affects CPI under the influence of contextual factors. The results indicate the relationship between the built environment and CPI. This research contributes to the theoretical framework linking community participation and person–environment fit (P–E fit). It provides evidence-based insights for policymakers to consider inclusive urban development in community renewal and grassroots governance.

1. Introduction

Urbanization and population mobility profoundly affect communities by injecting vitality while reducing community awareness. Community awareness refers to “the shared belief among members about each other and the group” [1]. Urban renewal may disrupt local social relationships [2], causing a decline in residents’ well-being [3], exposing the floating population to social exclusion [4], exacerbating residential segregation, and reducing participation [5]. Research has indicated that community participation (CP) is closely related to strong community awareness [6]. Community engagement is the willingness of residents to invest time in social behaviors that benefit their place of residence, supported through interactions that promote inclusiveness within the constraints of interest or geography [7]. Wu identified the time residents spend in the community as a form of investment [8]. Resident participation in walking activities within the community [9], the amount of time residents invest in community activities, and the variety of activity types [10] were found to have a positive impact on the sense of community. On this basis, a sense of community realizes a pleasurable nature that goes beyond socialization and is strongly associated with further involvement in local affairs [11]. Social capital can be accumulated, neighborhood relationships can be improved [12,13], and social support and cohesion can be enhanced by promoting CP [14], which is also an important indicator of social integration [4]. A unique model of mass participation has emerged in China since the 1940s. With the transformation of the urban grassroots social management system from a unitary, street, and neighborhood system to a community system, the community, as a unit of national governance, has incorporated community autonomy into the mode of operation of the administrative system [15]. In this context, community participation is more complex, including both participation under state mobilization, such as urban renewal [16], as well as participation in organized associations and individual activities, such as informal day-to-day activities, which are carried out spontaneously by residents for the sake of common interests and benefits [17,18]. In social governance transformation, community autonomy and resident participation have become critical issues in China [16].
Researchers have analyzed the relationship between the physical environment and community awareness in depth; however, the conclusions are inconsistent. New urbanism advocates enhancing community awareness and guiding positive behaviors through environmental design [19,20], although the effectiveness of these approaches has been questioned. Talen, E. [21] argues that while the physical environment may contribute to weak social connections, place attachment relies more on individual factors than on environmental attributes. Ford, L. R. [22] stated that extreme environmental determinism is difficult to maintain because the influence of the environment on behavior depends largely on individual characteristics and interactions between individuals and their surroundings. Sociologists emphasize community liberation, which fosters more complex social networks by creating interest-based communities [23]. Social infrastructure, including parks, streets, and community facilities, is critical in promoting social interaction and developing social relationships. These spaces encourage place attachment through daily experiences [24]. Living in different types of neighborhoods has a differentiated impact on immigrants’ lives and shapes their sense of belonging to the city [25].
However, the strength of the built environment’s impact on CP remains a topic of debate. The role of the environment is influenced by individual resources and contextual factors, particularly the subjective perceptions of situational elements [26,27]. The person–environment fit (P–E fit) theory regards individuals and places as intricately linked entities within a shared behavioral environment. This theory posits that the interaction between environmental characteristics and residents’ psychological and social attributes influences behavior. The relationship between the environment and behavior is constrained by consistency factors [28]. According to consistency theory, this study examines the effects of environmental influences and residents’ motivations on CP and place attachment.
Tianjin is an important central city in northern China. It has experienced a substantial influx of people and significant residential migration trends [29]. The community environment has a larger influence on residents’ housing choices than housing characteristics [30]. Factors that meet residents’ needs, such as service facilities and transportation characteristics, are crucial determinants of residential relocation [31,32]. Therefore, in the context of demographic and residential mobility, analyzing residents’ requirements for community environments and the impact of the P–E fit on community participation intention (CPI) is vital for the sustainable development of communities.
We propose the following research questions: (1) What roles do the built environment of a neighborhood and residents’ needs play in predicting CPI and community attachment? (2) How do neighborhood spaces with different levels of publicness affect CPI and community attachment? (3) By including interaction terms, do CPI and community attachment differ across population densities and housing types? We examine these questions by collecting questionnaires from 836 participants from 14 administrative divisions in Tianjin, China. The basic theoretical framework is first discussed. Then, we use chi-square tests to analyze the distributional differences in residence satisfaction, CPI, and community attachment among socio-demographic, housing, and community characteristics. Afterward, we use binary logistic regression to determine the relative importance of needs and evaluations of the environment in predicting CPI and community attachment. Following the quantitative study, semi-structured interviews are conducted with different types of people in the community, including community workers, facility staff, and active community participants, to cross-check the questionnaire results through inductive methods and to fill in questions that could not be answered in the empirical study. The theoretical interpretation of the findings is provided in the Discussion section.

2. Literature Review

2.1. Person–Environment Fit Theory

The P–E fit theory was proposed by Kurt Lewin, who suggested that individual behavior is determined by the influence of individual traits and environmental factors [33]. Stokols extends the theory, using the example of the effects of high density on human well-being, to integrate people, places, and repetitive activities into a single concept, with specific environment–behavior relationships being in a particular situational condition. Individual behavior and psychological outcomes can change due to environmental influences and the fit factors (i.e., the degree of consistency) are crucial in determining whether individuals can achieve their goals and needs through their environment [28]. The theory indicates that integrating people and the environment in analysis is more effective for predicting individual behavior than examining them separately, which means that the combined use of objective and subjective representations of situations reduces two types of bias: the tendency to explain people’s behavior solely on the basis of objective features of the environment; or the failure to take into account the direct effects of environmental conditions on behavior [28].
The P–E fit theory has been extended from the individual to the community level to analyze the compatibility of physical and social characteristics of neighborhood environments [34]. Macro social and cultural contexts, as well as institutional environments, significantly impact the fit [35]. Situational factors are particularly critical because individuals’ perceptions of their environment depend on their subjective needs and their understanding of the context [36]. For instance, the relationship between environmental noise and individual distress depends on how individuals perceive noise [36].
The relationship between environmental needs and social capital has been analyzed, showing that different places might evoke attachment by fulfilling the diverse needs of residents [24]. Community environmental factors impact the residents’ physiological and higher-level needs based on Maslow’s hierarchy of needs [37]. Creating spaces that cater to residents’ needs can enhance social capital by fostering social interactions [38].
Although expectancy confirmation theory understands personal experience by examining expectations and argues that an individual’s past expectations and satisfaction influence people’s behavioral intentions, behavioral intentions are achieved through satisfaction with perceived usefulness [39]. However, residents’ satisfaction with their community environment did not significantly influence their willingness to participate in community renewal [16]. High levels of life stress and a lack of resource choices can lead to interdependent neighborhood relationships [40]. These findings indicate that the relationship between residents’ motivations and social capital depends on other factors.

2.2. The Physical Environment and Community Awareness

Certain physical characteristics and affective traits of the community environment are considered beneficial for well-being and life satisfaction [41,42]. However, research on the impact of the physical environment on community consciousness remains divided. New urbanism advocates for high-density, small-scale, and walkable community environments to promote social interactions among residents and enhance community consciousness [41]. Putnam, R. D. [13] emphasized the role of informal social networks in “civic infrastructure” because they contribute to improvements in civic culture, tolerance, and the quality of collective life. However, some scholars argue that although the physical environment can facilitate interactions at the behavioral level, it may not directly influence the emotional dimension of community consciousness [21,43].
Forming emotional connections is contingent on the quality of interactions among residents and the ability to forge emotional bonds, which is referred to as place attachment [44]. Place attachment is defined as the emotional bond between individuals and places [24]. In the person–process–place framework [45], intrinsic factors, such as resident homogeneity and duration of residence, influence place attachment, as also noted by Talen, E. [21]. Additionally, the place dimension is shaped by the interplay between social and physical environments [24,46]. The integration of safety and challenging elements may evoke the strongest attachment [24]. Perceived housing conditions, neighborhood characteristics, low building density, and the quality of the built environment are positively correlated with place dependence [47,48]. The perceived quality of public spaces was critical in shaping community awareness among new residents due to deep emotional connections [6].
Place attachment and CP represent different perspectives of a sense of place. Place attachment primarily reflects emotional connections, whereas CP is the manifestation of emotional attachment translated into concrete actions [49]. Furthermore, residents’ CP strengthens place attachment and enhances community cohesion [50]. However, based on expectancy confirmation theory, past participation behaviors and feedback or satisfaction with participation may influence individuals’ intentions and attitudes toward participating in future activities [51].

2.3. Public Spaces and Community Participation

The relationship between public spaces and CP has become a central theme in contemporary urban studies. In this research, CPI is defined as the voluntary engagement of residents in a wide range of activities, encompassing informal interactions and organized community affairs [7]. However, political involvement is excluded in this study. These activities facilitate neighborly interactions, foster emotional connections, and nurture community awareness [42]. As pivotal components of the social infrastructure, public spaces are essential for promoting social interactions among residents [52]. These spaces improve internal community ties and encourage cross-group interactions and understanding, mitigating intergroup prejudice [53].
However, the diversity of public spaces and patterns of human interaction results in diverse intergroup engagement experiences [54]. Traditional public spaces, such as parks and streets, may not foster deep social connections due to the transient nature of interactions [55]. Nevertheless, behavioral research indicates that walkable community environments significantly increase the frequency of CP by enhancing daily interactions among residents [56]. Furthermore, enclosed public spaces in urban enclaves facilitate collective mobilization [57].
In contrast, quasi-public spaces, such as retail venues and community facilities, facilitate meaningful interactions among residents through shared objectives, fostering intergroup cooperation [55]. Community facilities can improve the quality of life. Resources that provide continuous and repeated interactions in neighborhoods contribute significantly to social inclusion [43]. The pronounced neighborhood effect improves older adults’ access to social resources, services, and facilities, which is closely associated with increased social engagement [58]. Additionally, the quality of property management significantly influences residents’ satisfaction with their community [59]. High-quality management improves the living experience and promotes CP by increasing environmental quality [60].

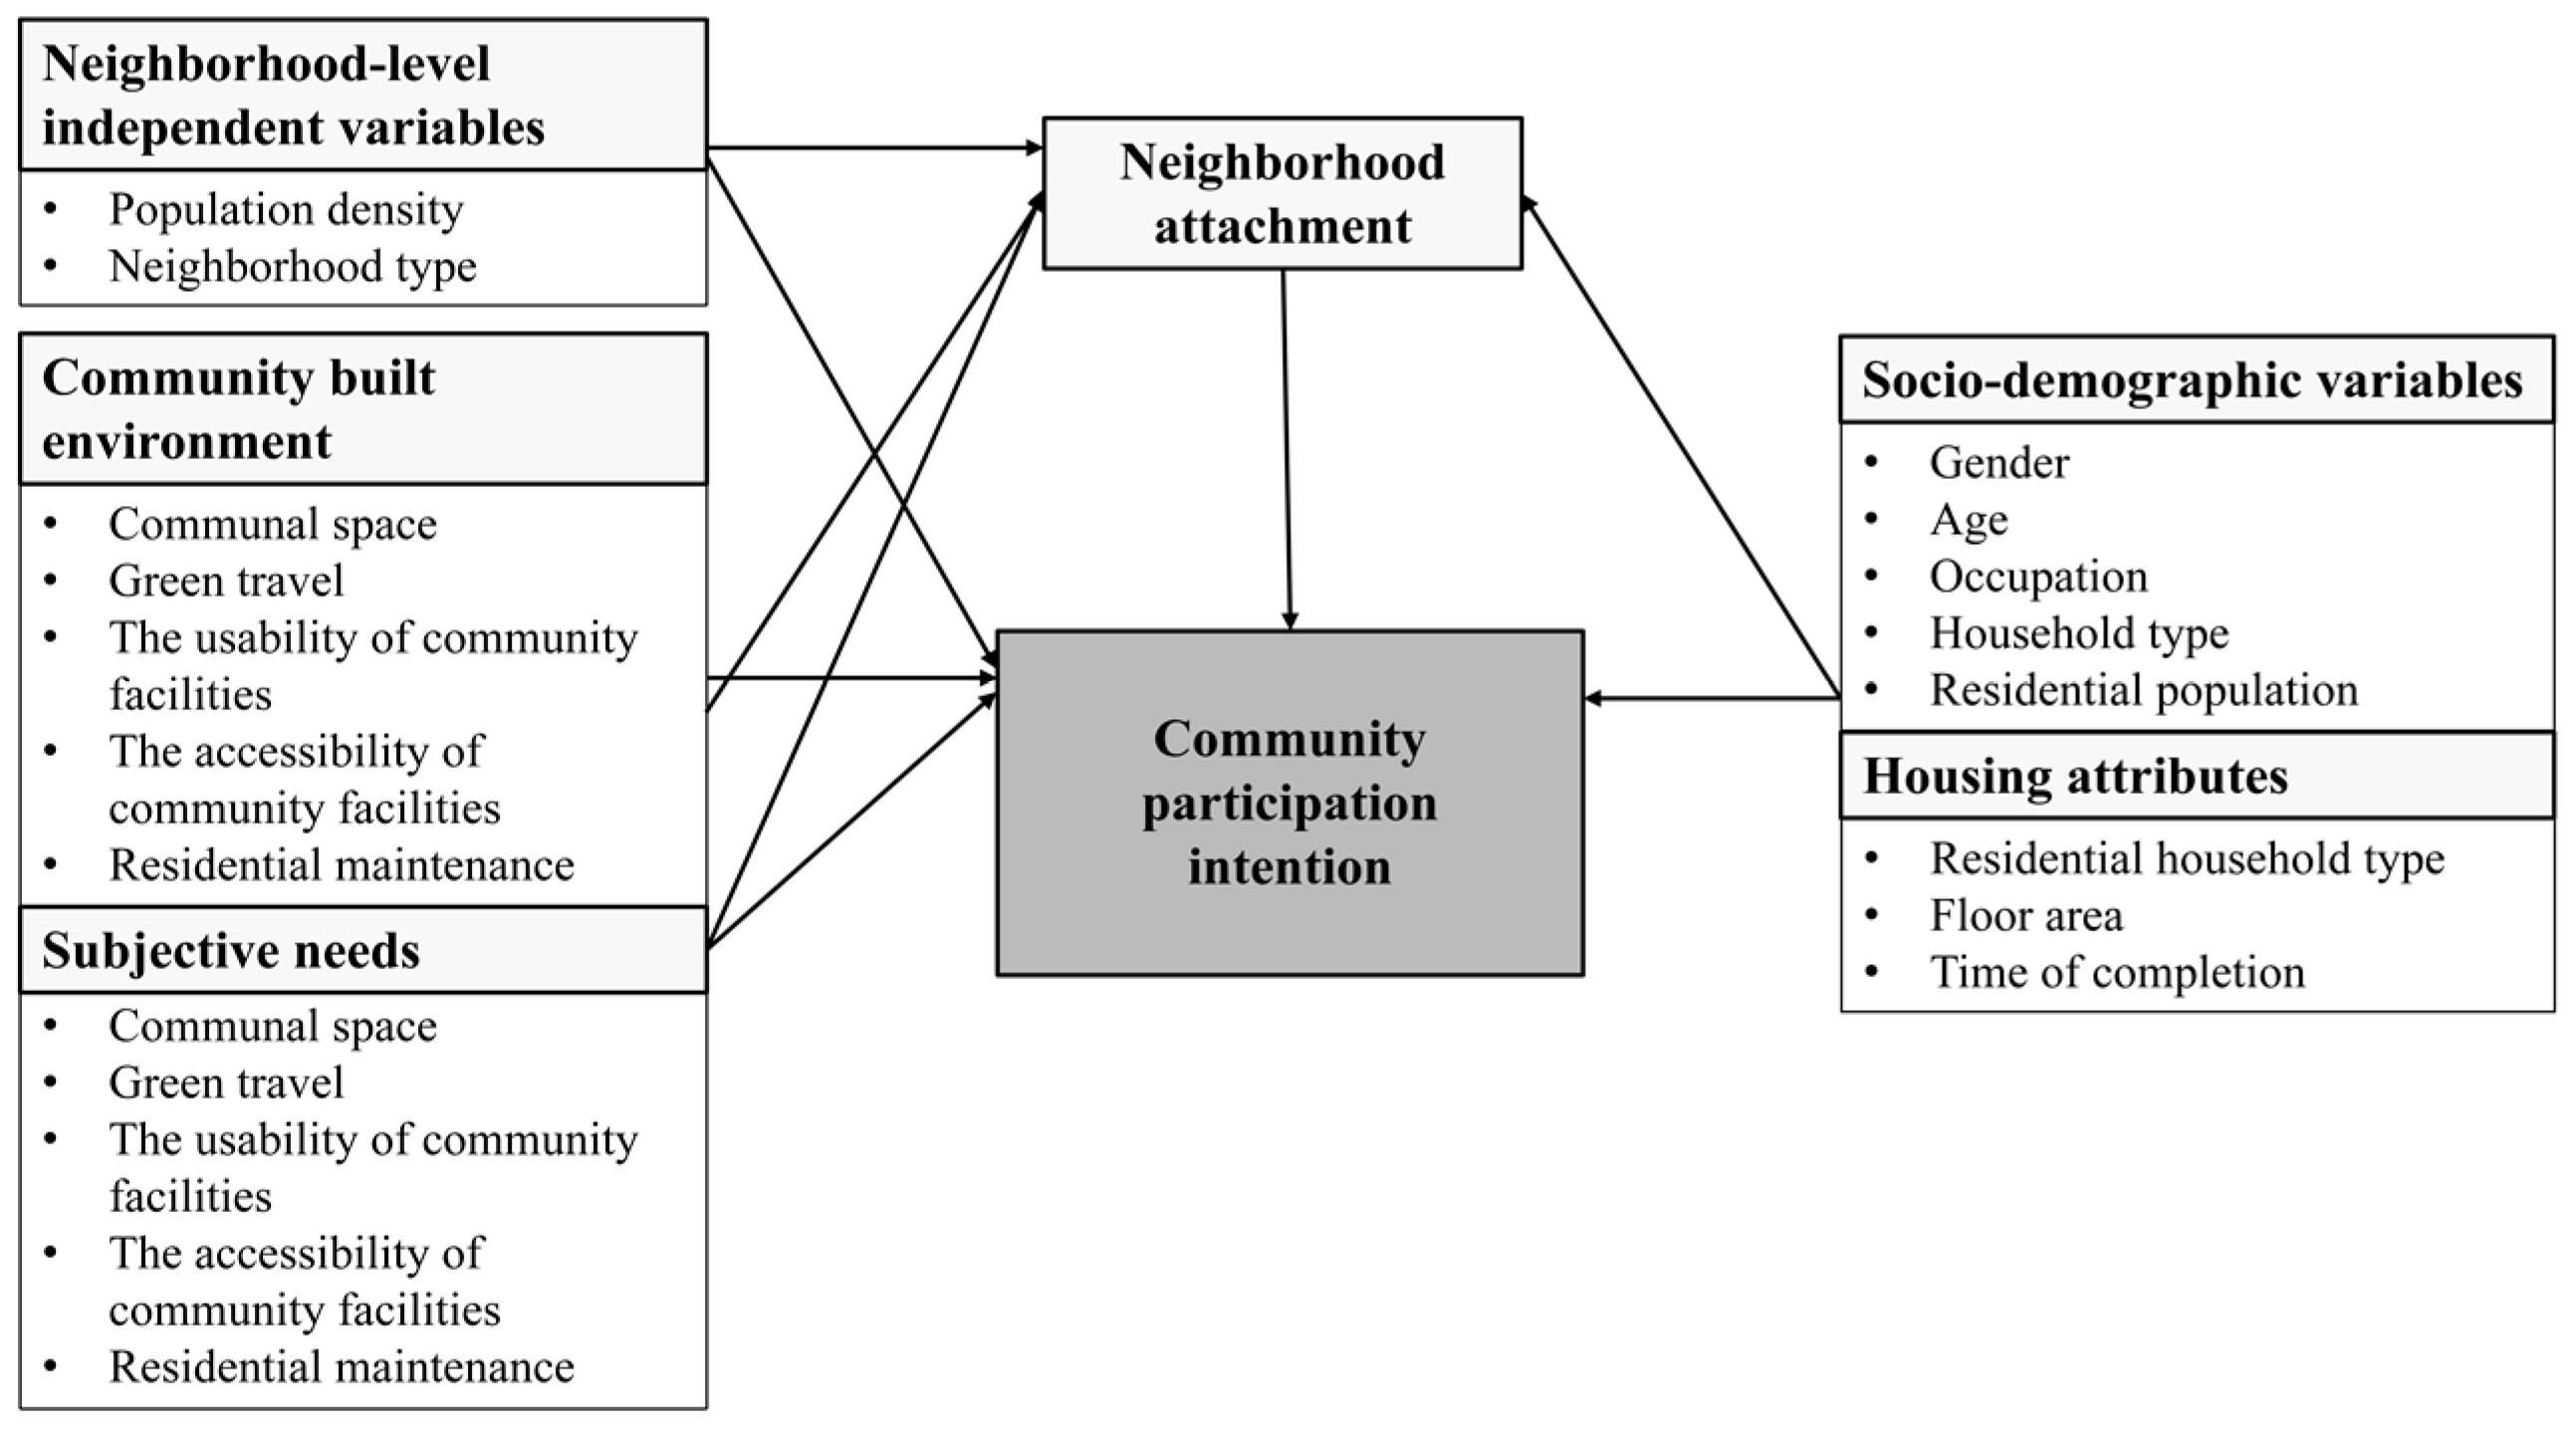
2.4. Research Gaps and Framework

This study focuses on the following issues. (1) Much of the literature concerns the influence of external factors, namely the physical environment [17], the social environment [17], and social capital [47], and research on environmental one-sidedness ignores human and situational factors. We introduce the demand–satisfaction relationship combined with fit theory into CPI and construct an analytical framework of individual demand–environmental satisfaction–situational factors (housing type–population density) to compensate for the lack of understanding of the satisfaction–demand relationship in traditional theories. (2) A large number of studies have explored the effects of BE on residents’ behavior [16] and sense of community [10]. Our study breaks away from the single analysis framework of CPI and community attachment in the existing literature and introduces the hierarchical theory of sense of place [49] to construct a multilevel explanatory framework of space–facilities–attachment CPI, which reveals the heterogeneous drivers of the two influences. We also differentiate between highly public spaces (parks and streets) and semi-public facilities in the community and separate the characteristics of facilities into accessibility and use. (3) Research also distinguishes between regional and individual-level differences, with established studies focusing on gated communities [57], flats, urban villages [61], or specific populations such as the elderly [62], immigrants [43], and sheltered housing communities [51]. However, systematic comparisons of different community characteristics (e.g., population density and housing type) are lacking. This study innovatively combines population density and housing type to reveal the differential moderating effects of population mobility and housing heterogeneity on CPI through interaction analysis. This study not only helps to enhance social support to improve urban inclusiveness but also provides theoretical support for community governance and environmental renewal policies in high-density cities. Figure 1 shows the conceptual model of hypotheses for this study.

3. Research Methods

3.1. Case Study Area

This study focuses on identifying the influencing factors of CP in the context of rapid urbanization. As a newly emerging first-tier city, Tianjin has attracted approximately 4 million regional migrants over the past 20 years [63] (Tianjin Municipal Bureau of Statistics [天津市统计局]. Tianjin Statistical Yearbook [2020]. China Statistics Press. https://stats.tj.gov.cn/nianjian/2020nj/zk/indexch.htm, accessed on 1 August 2020). The four districts surrounding the city have experienced significant population growth, increasing their population share by 8.6% in ten years. The substantial sales of newly constructed residential properties due to internal migration and the influx of new residents present challenges for inclusive development and effective community governance.
Additionally, this study examines the influence of social structure and spatial characteristics. Within the framework established by the Chinese government’s “Guidelines for Building Complete Residential Communities”, the availability of community facilities and services in living circles is crucial for residents’ daily activities and employment, particularly for those who depend on these services. Tianjin has diverse community types centered around an urban core and extending to suburban districts and rural areas, resulting in a multi-tiered urban network system (Figure 2). Significant differences exist in population density, aging demographics, and community facilities across these regions, providing rich empirical data for investigating the relationship between environmental characteristics and CP. The densely populated old town at the center has convenient amenities but suffers from the insufficient municipal infrastructure common in large cities, such as narrow roads and limited green spaces in parks. In contrast, the residential clusters in the surrounding four districts and the Binhai New Area exhibit medium-to-low density development with diverse community types, low housing prices, and many large green spaces. The rural outskirts encompass village areas, including agricultural land, arable land, and ecological zones. These diverse environmental characteristics render Tianjin an ideal case study (Table 1).

3.2. Data Sources

The data used in this study come from a national cross-sectional survey conducted in 2020 and sponsored by the China Real Estate Association (CREA). The survey was conducted between August and October 2020, lasting for two months. Empirical pre-selection and expert consultation were used to determine the environmental assessment indicators. The respondents rated their satisfaction with and the requirements for their residential environment. The aspects included neighborhood quality, building standards, residential attributes, and personal characteristics. The portion of data concerning neighborhood features was the core dataset for this study. The data sample of Tianjin was selected for this study because the region not only embodies typical urbanization and demographic characteristics but the differentiated regional characteristics also help to explore the interaction between environmental factors and community participation.
Data were collected using a combination of online and offline methods, with online data collected through an online platform (Wenjuanxing (Link to the Wenjuanxing website: https://www.wjx.cn/, accessed on 1 August 2020)), survey links sent via social media, and snowball sampling using social networks. The initial sample prioritized individuals from different population density areas and different housing types in Tianjin to ensure that the initial sample covered the population-area differences of concern for this study. The online questionnaire incorporated an IP address verification protocol to prevent duplicate responses. The participants received information on the purpose and requirements of this research. If they agreed to participate in the survey, they were required to sign an informed consent form and complete the questionnaire anonymously. The responses were kept confidential. Each participant’s questionnaire took approximately 20 min to complete.
To improve the representativeness of the survey sample, the group took the following measures: First, with the assistance of the Real Estate Association, real estate enterprises and property companies were mobilized. Secondly, the members of the group widely distributed questionnaires, mobilized the staff of enterprises and institutions and community staff, etc., to forward the link of the questionnaire to the relevant units and community WeChat groups, encouraged residents to actively participate and fill in the questionnaires, and tried to cover groups of various ages, occupations, types of housing, and housing conditions to ensure the representativeness of the survey. The offline survey was conducted by undergraduate students, who were trained to distribute paper questionnaires in community public spaces in different areas of Tianjin and collect data in a face-to-face manner. In total, 151 participants were recruited through the offline survey and 909 participants were recruited through snowball sampling.
Two researchers independently checked the valid questionnaires, removed 154 questionnaires with answer times less than 180 s, and manually reviewed and eliminated invalid questionnaires with a high consistency of completion, retaining 14 reasonable responses. On this basis, a strict data-cleaning process was implemented to eliminate questionnaires with logical errors. Multiple choice questions were used for all continuous variables in the questionnaire to effectively constrain the generation of extreme values. Statistical methods were then applied to identify and remove outliers, and a total of 836 valid questionnaires were finally recovered. The sample covers the diverse neighborhood locations in Tianjin (the central urban area, the four surrounding districts and Binhai New Area, and the five outer suburban districts), demographic patterns, housing types, household types, and family status. This non-probability sampling is not sufficient to ensure statistical representativeness but allows us to estimate within the sample [64].

3.3. Description of Variables

3.3.1. Dependent Variable

Community participation in established research includes participation behaviors such as frequency of participation [17], participation satisfaction [65], and attitudinal factors such as willingness to participate [51]. The theory of planned behavior suggests that behavioral intention is the main predictor of actual behavior [16]. Since it is also influenced by personal experiences (the effect of free-riding or dissatisfaction with the outcome of participation) [51], the influencing factors of participation behavior are more complex. Considering the Chinese government’s emphasis on community governance and the positive role of civic engagement, the study of CPI is relevant. The dependent variable in this study is the factor of residents’ attitudes toward community participation, which measures residents’ willingness to spend time participating in local social life, including interactions and mutual support among residents, emotional communication, and organized community activities but excluding participation in community decision-making and advocacy actions [42]. Using a simplified item, this was measured by asking the question “Do you wish to enhance resident participation and increase the diversity of community activities?” [17,66], with a “yes” or “no” response option. Approximately 48.9% of participants expressed a willingness to participate in community activities.

3.3.2. Independent Variables

This study aims to comprehensively assess the relationship between urban community environments and residents’ behavioral intentions by integrating neighborhood and individual variables. Population density and community type are crucial characteristics at the community level.
Population density directly affects resource allocation in communities and the availability of open spaces, affecting residents’ quality of life, urban vitality, and social cohesion [67]. We used data from statistical yearbooks to classify the administrative divisions of Tianjin into three categories according to population density: the central urban area, the four surrounding districts and the Binhai New Area, and the five outer suburban districts.
In the P–E fit theory, the collective environmental fit reflects the perceived quality of relationships between similar or shared groups and their environments, and the ideal environmental model has the potential to evolve from physical, functional, and participatory structures into a cultural structure of social capital [68]. Community type reflects not only physical conditions and economic attributes but also social class and social support [69] (Chen and Li 2015). Affordable housing is price- or rent-limited housing provided by the Chinese government for low- and middle-income households with housing difficulties, and this type of government-subsidized housing is associated with higher community satisfaction [61], social integration [51], place attachment, and social interaction [70]. Migrants living in commercial housing gain better pathways to belonging and social integration because they escape or bypass disadvantaged neighborhoods [25]. For residents living in mixed commercial and sheltered housing community environments, residents from sheltered housing communities can gain a stronger sense of community through frequent daily activities and the utilization of community facilities [10]. We categorized community types into market housing communities, affordable housing communities (including public rental housing), and other types of communities (such as apartments and others). These data were obtained from questionnaires.
Neighborhood characteristics were measured by individuals’ use evaluations, revealing how residents perceive their community environments at the micro level. This information is indispensable for obtaining a fine-grained perspective of community phenomena.
The environmental questionnaire was developed based on the concept of urban public space [43], distinguishing between public spaces accessible to all and community facilities targeted at specific groups [6]. It also covers environmental features related to green travel and residential area maintenance, which effectively illustrates the overall quality perceived by the neighborhood. They have also been used to measure concepts related to social sustainability [70] and place attachment [62]. Each dimension was measured using a five-point Likert scale, ranging from “very dissatisfied” to “very satisfied” with scores ranging from 1 to 5. The mean score was utilized to represent residents’ evaluation of each dimension.
Public spaces are based on the concept of a typical public space, including parks and sidewalk accessibility [55]. We measured parkland, open public spaces, streetscapes, parking, and accessibility [48]. The Cronbach’s alpha (reliability coefficient) in this survey was 0.866. The mean score was 3.307.
Green travel is based on the established literature, including walkability and connectivity. Walking in the community creates opportunities for informal interactions among residents [48]. The Cronbach’s alpha (coefficient of reliability) in this survey was 0.851. The mean score was 3.439.
For community facilities, we used information from the literature and the “Planning and Design Code for Urban Residential Areas [71]” to evaluate the layout and quality of service facilities. These facilities included community centers, healthcare services, convenience amenities, elder care facilities, kindergartens, and childcare spaces. Community facilities are used regularly and continuously and can significantly foster social interactions [43]. They promote shared objectives and collective cooperation, improving intergroup interactions and mitigating biases [72]. The Cronbach’s alpha values for accessibility and usability were 0.890 and 0.908, respectively, with mean scores of 3.591 and 3.368.
Residential maintenance encompasses security, cleanliness, equipment upkeep, and waste management, reflecting residents’ trust in property management. This category has been used more often in studies related to place attachment [62] and residence satisfaction [48], and includes maintenance of the building and neighborhood environment (e.g., cleanliness, standing water, graffiti, etc.) [73]. Due to the differences in dimensions between gated and ungated communities (e.g., residents’ SES (everyday identity) and home maintenance), the effect of gating on attachment may be related to SES [73] (Lewicka 2010); therefore, we did not have a separate question item for gating. The Cronbach’s alpha (reliability coefficient) in this survey was 0.943. The mean score was 3.460.
Neighborhood attachment was assessed through the respondents’ sense of belonging to community spaces and the ease of neighborly interactions, using methods referenced in [42,48]. This measurement method was chosen because it specifically focused on residents’ attachment to community spaces and neighborhood interactions, which are considered beneficial for neighborhood interaction. Scales from the literature also include concepts such as the willingness to move and identity recognition [48,74]. The mean score was 3.7 (Table 2).
Furthermore, residents’ needs were evaluated based on independent variables derived from assessments of the built environment. We used the following question: “Which aspects do you wish to improve in the future?” It was a multiple-choice question to collect data on residents’ requirements for public spaces, community facilities, and residential maintenance. The variable was binary, and the selected need was assigned a value of 1.

3.3.3. Control Variables

The control variables covered personal attributes, including gender, age, household type, number of residents, and occupation, as well as housing characteristics, such as residential type, building area, and construction date.

3.4. Data Analysis

We employed descriptive statistical analysis, chi-square tests, and binary logistic regression analysis. Descriptive statistical analysis enables a preliminary examination of respondents’ demographic characteristics, residential satisfaction, CPI, and neighborhood attachment. Before conducting regression analysis, significance tests (chi-square test) were performed to identify differences in independent and dependent variables (ordinal variables), facilitating a deeper analysis of the impacts of individual (socio-demographic factors) and neighborhood (population density and housing types) characteristics.
Subsequently, binary logistic regression analysis was conducted using SPSS 26.0 software to investigate the factors influencing CPI and place attachment. Logistic regression models are used to analyze the effects of multiple independent variables on the nominal dependent variable, and since the dependent variable CPI is dichotomous (0 = not willing to participate in the community,1 = willing to participate in the community), logistic regression models are more suitable for this analysis than linear regression models [2]. In the binary logistic regression model, the dependent variable is assumed to be y, and the n independent variables affecting y are x1, x2, x3, …, xn. P denotes the probability of the event occurring, and 1 − P denotes the probability of the event not occurring. The binary logistic regression equation is shown in Equation (1) as follows:
L o g i t P = log ( P 1 P ) = β 0 + β 1 x 1 + β 2 x 2 + β n x n
β0 is the constant of the regression equation; βi is the regression coefficient; and xi is the independent variable.
The ratio of the probability of an event occurring to the probability of it not occurring is usually called the odds ratio (OR), i.e., odds = P/(1 − P). We express the results as the ratio (OR) and 95% confidence interval (CI) of the binary logistic regression model. The OR is obtained by logarithmically transforming the regression coefficient “β”, i.e., the OR = exp(β), which reflects the degree of influence of the independent variable on the CPI and is characterized as follows: for the categorical forecasting variables, if the OR > 1, then the CPI will be affected by the independent variable, i.e., if the OR > 1, the CPI will be affected by the independent variable. If the OR > 1, it indicates that the CPI under the category of the independent variable is more likely; otherwise, it is lower. For continuous predictor variables (e.g., community environmental satisfaction), the OR indicates the trend in CPI for each unit increase in the predictor variable.
Prior research suggests that CPI may be influenced by a range of variables, including socio-demographic background, community environment, and individual subjective perceptions (community attachment and beliefs) [17]. Expectancy confirmation theory affirms that an individual’s expectations and satisfaction can influence behavioral intentions [16]; thus, we included environmental satisfaction ratings. Community public space has a facilitating effect on community and cross-group interactions but may have differential effects due to the diversity of spaces, such as traditional public spaces (parks and streets) and quasi-public spaces (consumer facilities, etc.) [55]. We therefore distinguish between community communal spaces and community facilities. In addition, yard maintenance and garbage disposal were found to be associated with older adults’ participation in community activities [60] and were therefore included in the evaluation dimension of the community environment. Established research has concluded that the built environment and community facilities significantly predict place attachment [48]. Stronger place attachment can promote citizen engagement to improve living conditions. Therefore, this study introduces neighborhood attachment into the model to verify the effect on CPI. Individuals’ subjective characteristics (e.g., functional dependence on local resources and community facilities, and the need for creating space) can reflect people’s attitudes and behavioral intentions toward place [75]. In addition, we controlled for individual socioeconomic attributes and living conditions to ensure the accuracy of the findings.
Stepwise selection methods are widely used to identify a limited number of covariates to be included in a regression model, screening out variables that may affect the dependent variable or have little or no effect. In this study, we use two methods, including the forward-conditional and backward-conditional methods, as stepwise selection methods because they are based on partial maximum likelihood estimation, which is considered to be the most reliable method [76].
In the first phase of this study for the neighborhood level, four binary logistic regression models were used to identify the key factors to ensure the stability of the model results. The first model was based on the enter method, where all neighborhood-level independent and control variables would enter the logistic regression model. The second and third models were based on the forward-conditional method with an entry probability of 0.05 and the backward-conditional method with a removal probability of 0.10, respectively, to obtain the key variables. The fourth model was also based on the enter method, but only statistically significant variables from models 1, 2, and 3 were entered into the binary logistic regression model. Model 4 was used to integrate all possible key variables that were statistically significant or considered very important from a professional point of view. Second, based on model 4, model 5 introduced the interaction terms of population density and house property to examine the heterogeneous effects of different neighborhood characteristics on CPI. In the second stage, four binary logistic regression models were built to identify the key factors to ensure the stability of the model results, similar to the methodology in the first stage, for the needs of the community environment. Neighborhood-level independent and control variables with significance identified in the first stage were incorporated, and demand variables were introduced in a hierarchical manner [76] (Wang, Lyu et al., 2021). Discontinuous variables were set up as dummy variables, using the first option as a reference.
Model validation was performed using the Hosmer–Lemeshow and likelihood ratio tests to assess the model’s goodness of fit. The results indicated a good model fit, and the independent variables adequately explained the variations in the dependent variable.

4. Results

4.1. Descriptive Statistics

The socioeconomic characteristics of the sample indicate a diverse range of residents of different genders and age groups (Table 3). The proportion of respondents under the age of 50 was high, with the majority representing three-member households. Commodity housing was dominant, with two-bedroom and three-bedroom units being the most common configurations. The majority of residents lived in housing with 91 to 144 square meters. Although the sample structure differed slightly from that of the 2020 Tianjin Seventh Population Census, it was representative. Given that the sampling method for the sample of this description is non-randomized, it does not fully generalize to the entire population.

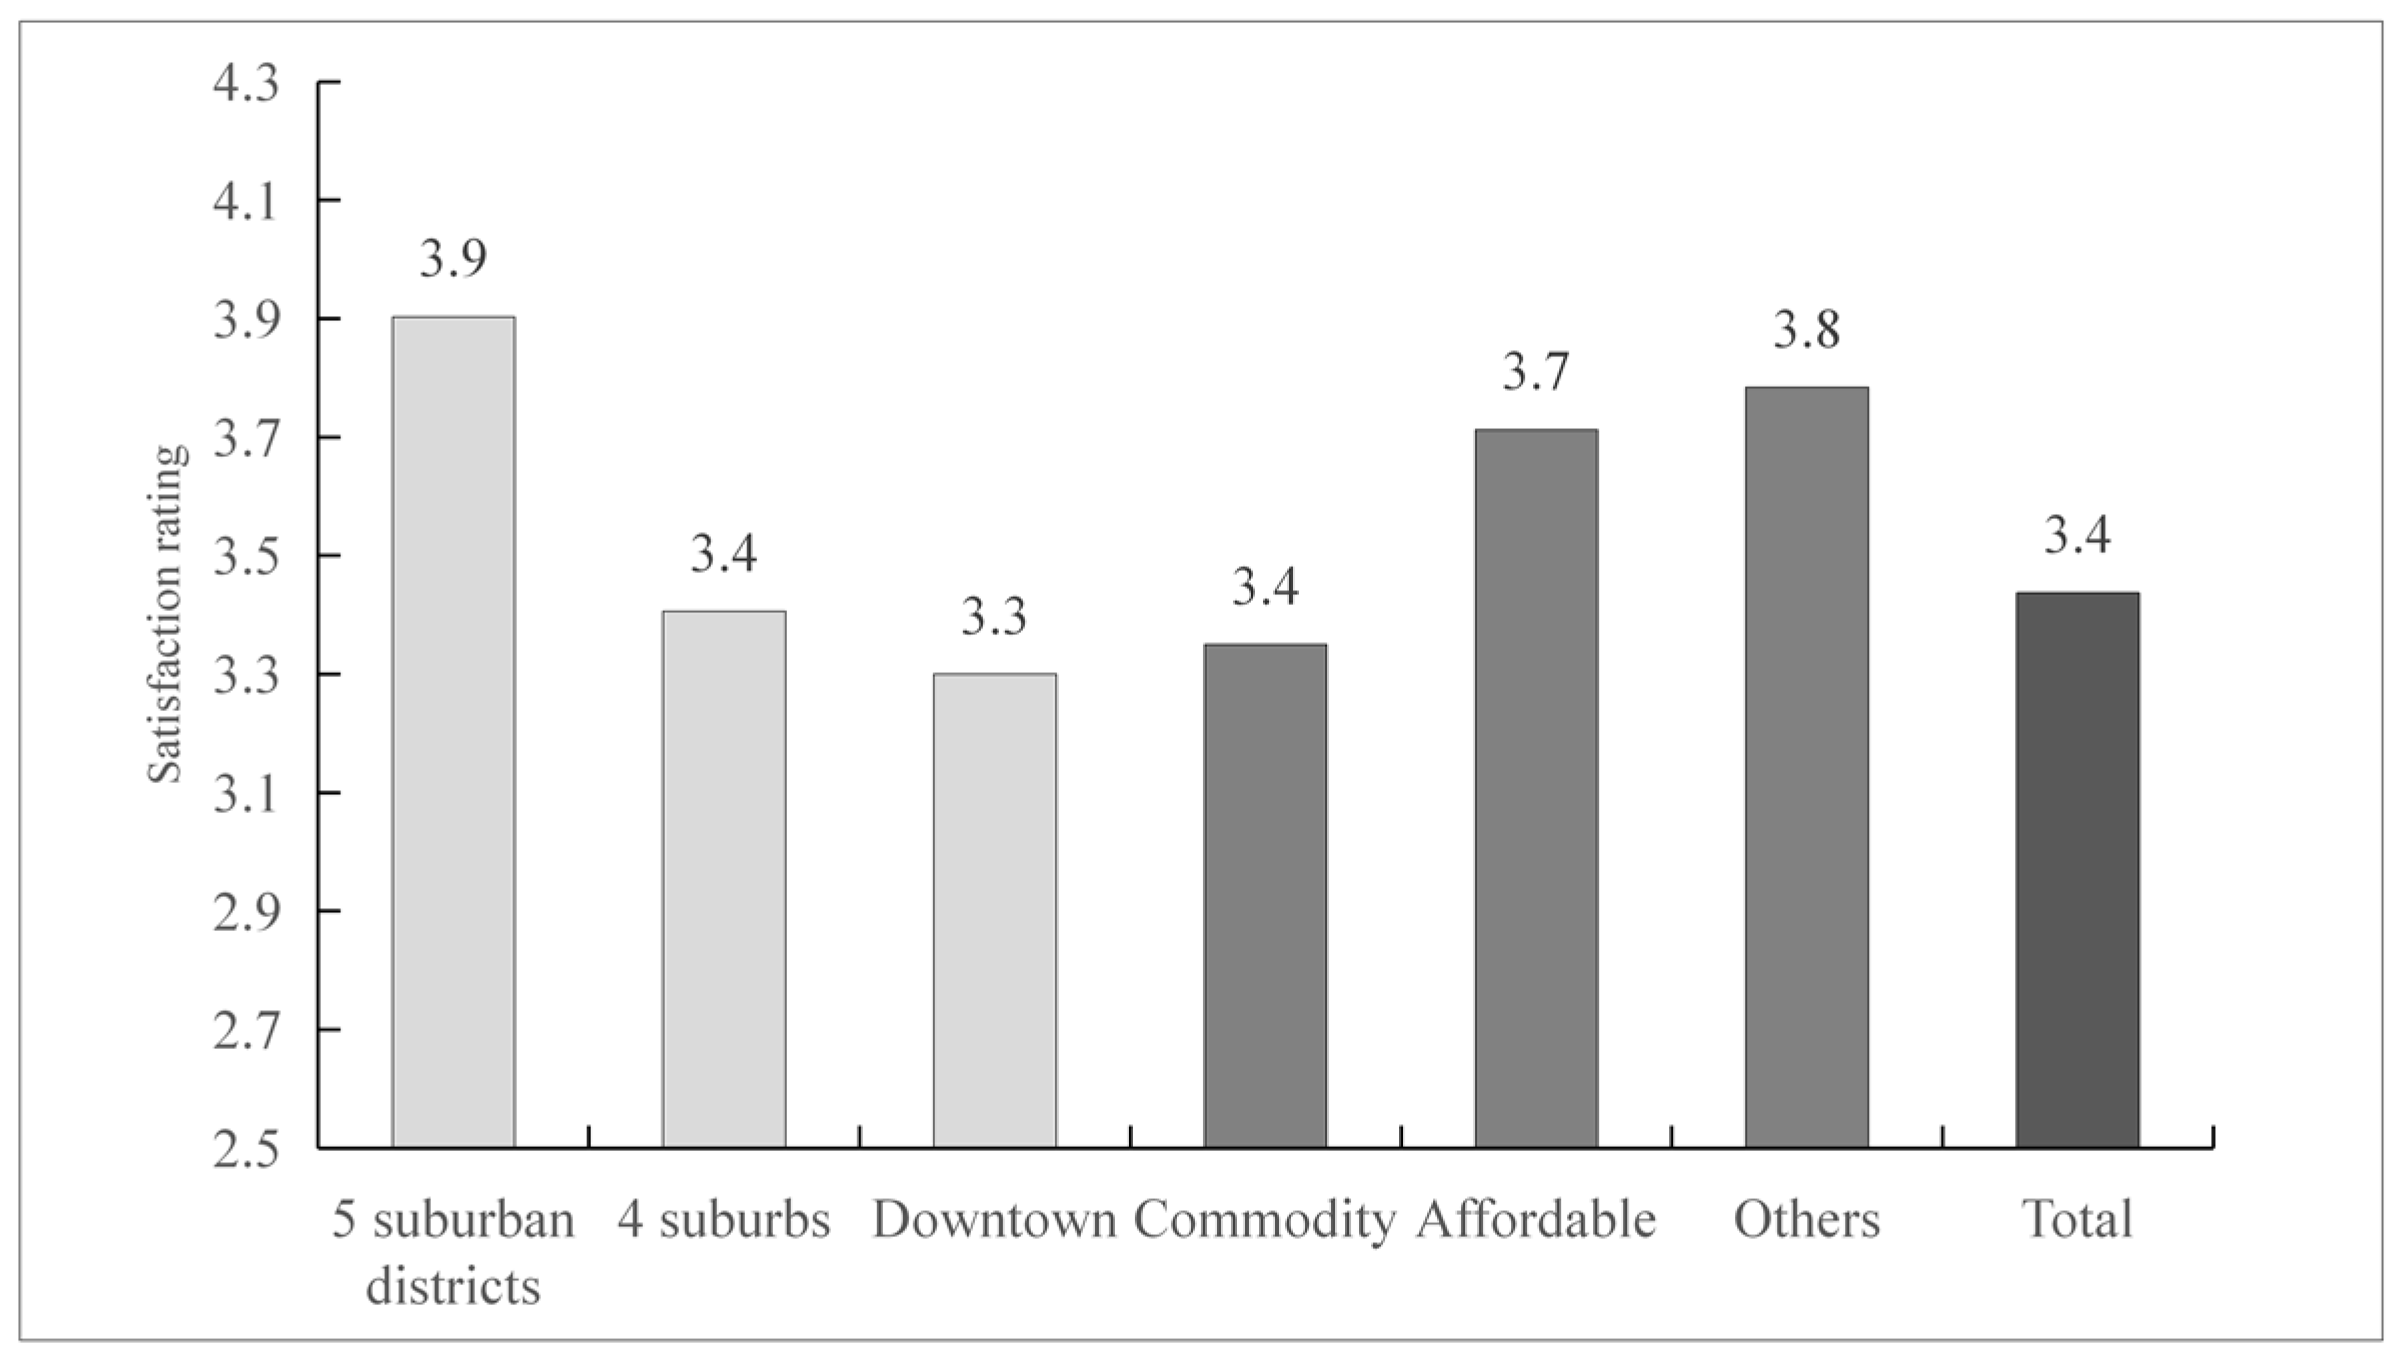
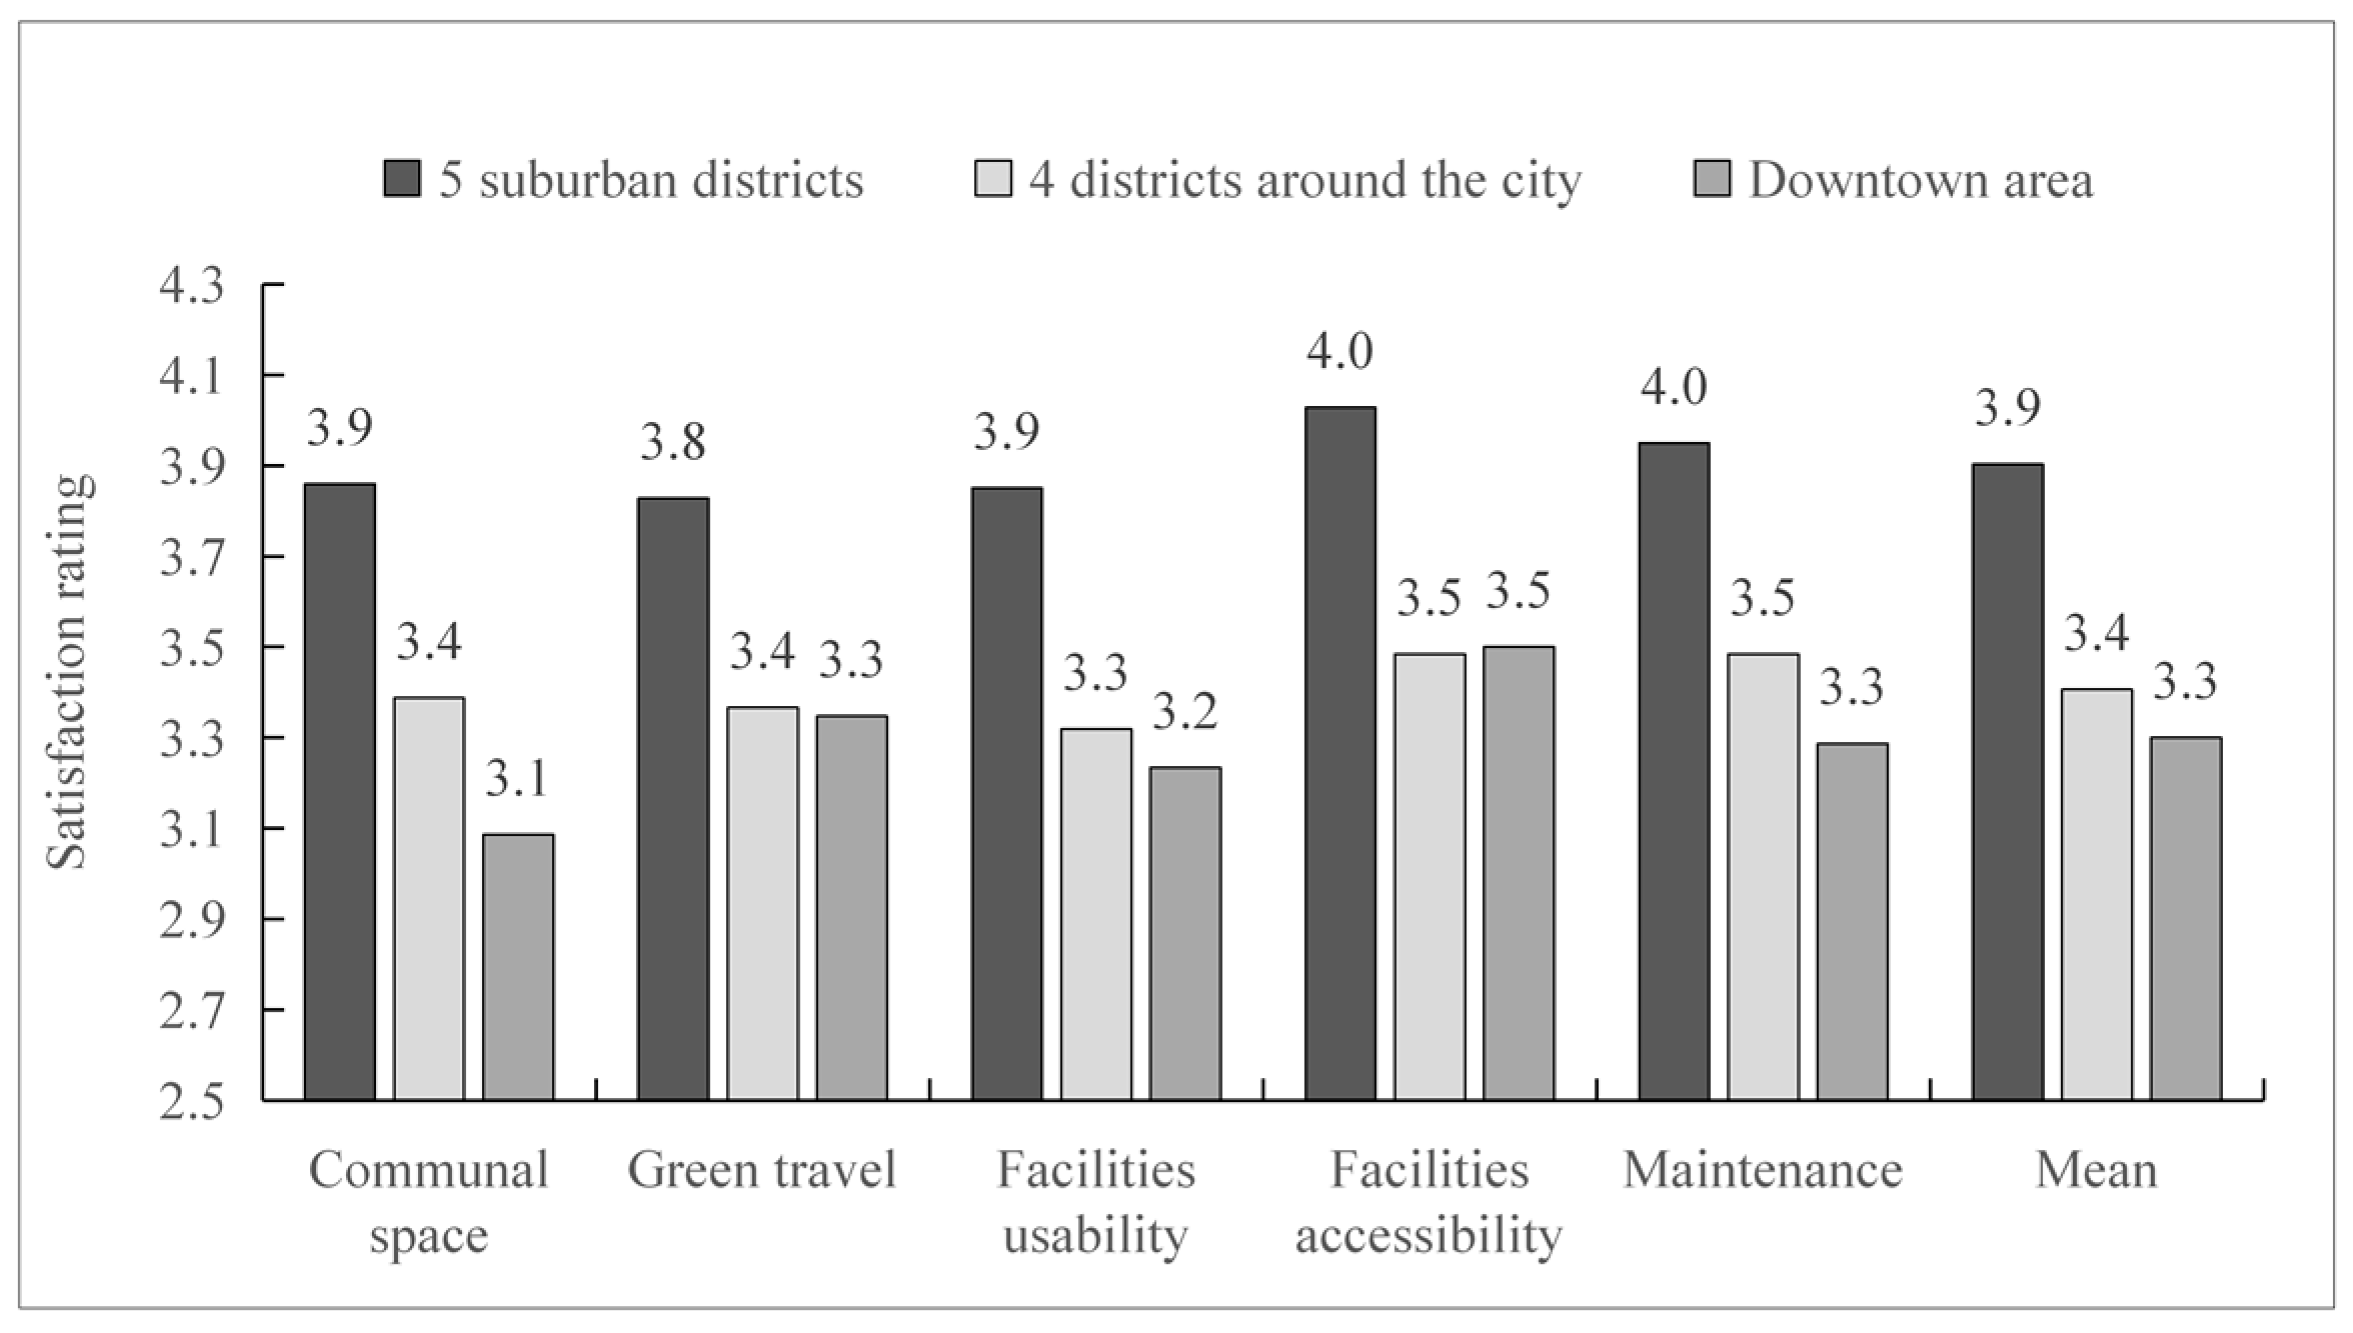
4.2. Neighborhood Characteristics

Respondents’ overall satisfaction with their living environment was high (Figure 3 and Figure 4). We used chi-square cross-tabulations to test the differences in the distribution of the three core variables of residential satisfaction, CPI, and community attachment across socio-demographic characteristics (gender, age, education level, etc.) and community characteristics (type of community, regional location, etc.). The satisfaction in the five outer districts significantly exceeded that of other areas (p = 0.000). As population density increased, satisfaction with public spaces, facility usage, and neighborhood maintenance declined, indicating a negative correlation between population density and environmental satisfaction. Furthermore, satisfaction levels varied significantly among different community types (p < 0.000), with residents in commodity housing communities expressing notably lower satisfaction than those in affordable housing communities.
Approximately 51.1% of the respondents indicated that they did not have CPI. Chi-square tests showed that CPI was higher in the central urban area and the four districts around the city than in the five districts in the far suburbs (X2 = 5.606, p < 0.01). In the housing analysis, respondents with 2–3 rooms had significantly higher CPI than one-bedroom households (p = 0.015). Demographic variables showed that age, household type, and occupation were significant predictors of CPI (p < 0.05).
The vast majority of respondents reported a sense of belonging in the community (90.1%). Community attachment was rated highest in the five districts of the far suburbs, followed by the four districts around the city and the central urban area (X2 = 22.095, p = 0.000) (Table 4). Community attachment possessed significant differences in occupation and household type.

4.3. Factors Influencing Community Participation Intentions

The regression analysis results indicated that several factors influenced CPI. The Hosmer–Lemeshow goodness-of-fit test result of 7.611 (Sig. = 0.472) suggests that the model fits the data well. A detailed summary of the findings is provided in Table 5a.

4.3.1. Binary Logistic Regression Classification Results

The classification results indicated that the binary logistic regression model had high predictive accuracy. Among the 427 respondents who did not exhibit CPI, 77.8% were correctly classified, and the model accurately predicted the CPI of those who expressed willingness to participate (72.9%). The predictive accuracy was 51.1% for the null model and 75.4% for the proposed model, demonstrating the model’s strong explanatory power for CPI (Table 6a). The likelihood ratio tests revealed that age, population density, public spaces, facility usage, place attachment, and demands significantly affected CPI. Removing these variables decreased the model’s fit substantially, indicating their critical role in predicting CPI (Table 7a).

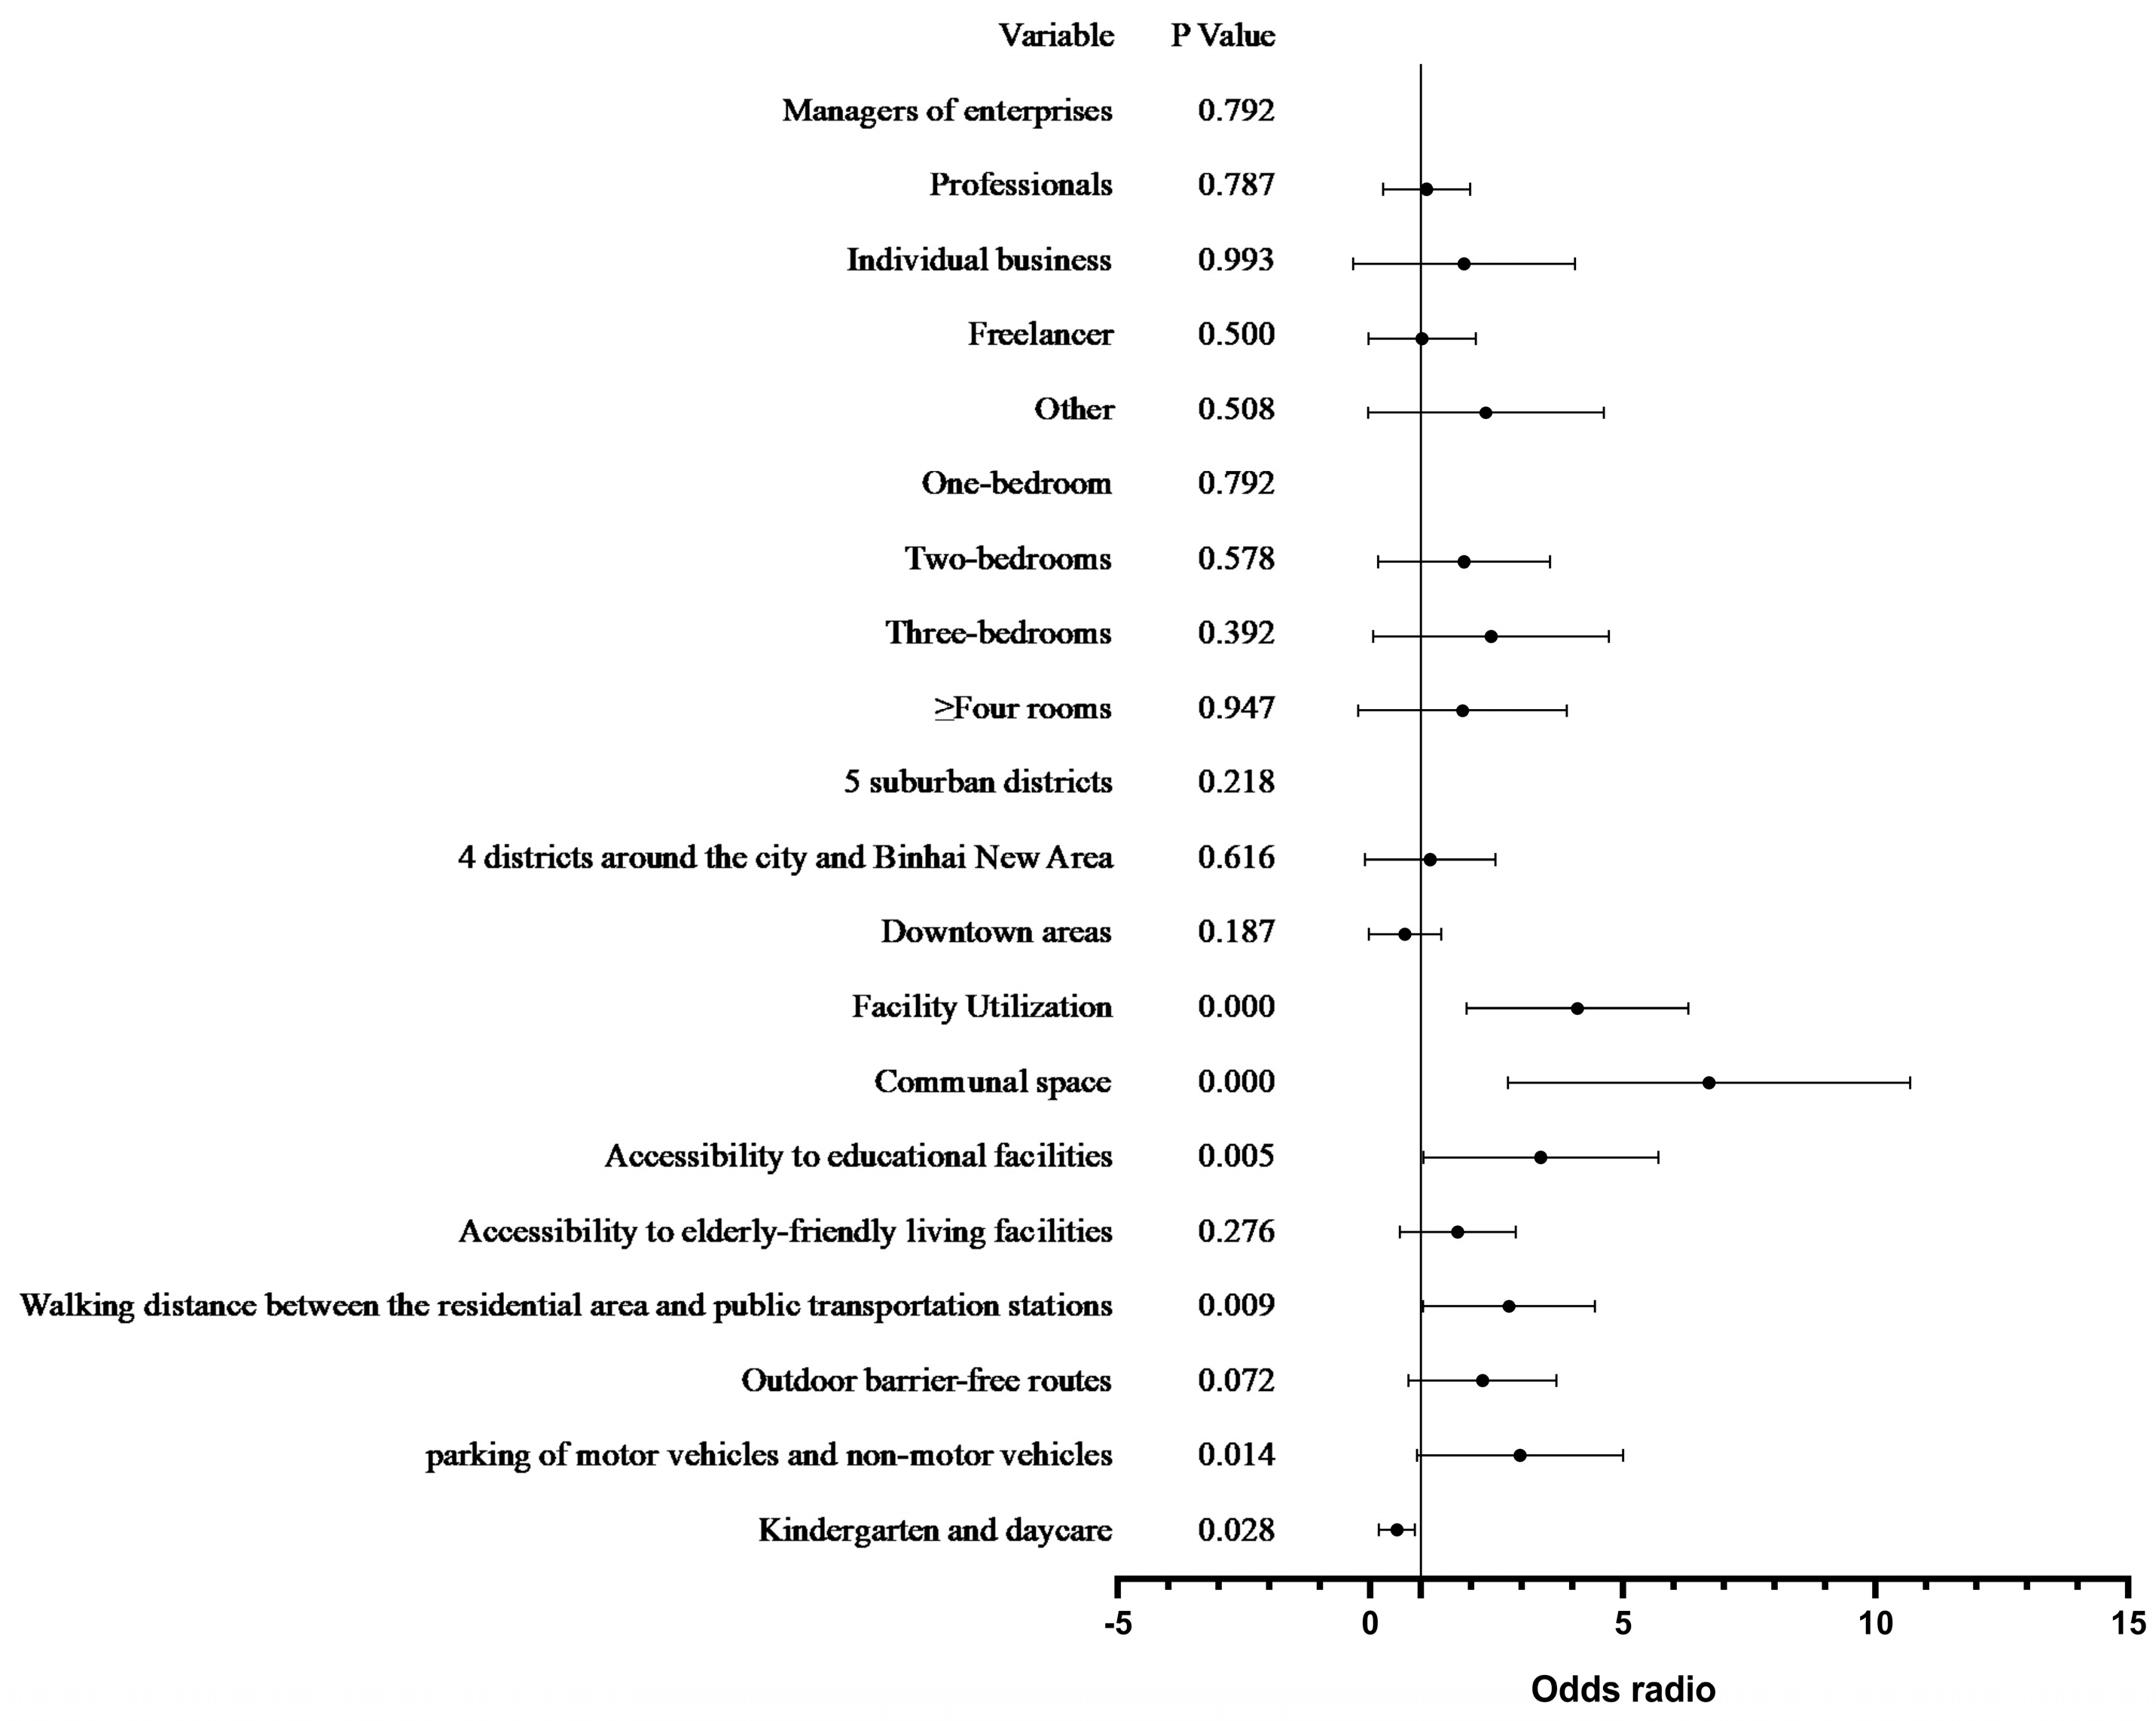
4.3.2. Parameter Estimates

The parameter estimates of the regression model identified several factors influencing CPI, including family type, community attributes, usability of facilities, neighborhood attachment, and residents’ requirements (Table 5a). Residents’ requirements are categorical variables that were transformed during regression. Data analysis revealed that many of the residents’ needs for the community environment were significant influences on CPI, including safety for green travel, open spaces, and the usability of community facilities. The expression of these demands significantly increased the likelihood of residents’ CPI, with the demand for sanitation services and health management facilities in the neighborhood having the greatest impact, increasing CPI by 2.174 times (p = 0.000).
Conversely, the usage of facilities negatively impacted CPI. Previous studies have observed that small-scale service facilities generally fostered community interaction and participation [77]. However, vulnerable groups, such as the elderly and low-income individuals, often report lower satisfaction. Nevertheless, when a high demand exists for specific facilities, these groups tend to engage in community activities to seek additional assistance due to a lack of alternative options [78]. In addition, there was no significant effect on the ratings of facility accessibility, green travel, communal space, and residential maintenance.
Residents with a strong sense of community attachment were more inclined to engage in community activities. A one-unit increase in the sense of belonging resulted in a 1.890-fold increase in CPI (p = 0.050).
Among community attributes, there were significant differences between areas according to population density, with higher CPI values (p < 0.050) in the central urban area and the four suburban areas compared to the far suburban areas in the first stage of model 2. After incorporating an interaction term for population density and neighborhood type, affordable housing in the central urban area and apartments in the suburbs had higher CPI compared to commercial housing in the far suburbs. Among the housing attributes, the number of bedrooms significantly affected CPI, with respondents with two or three bedrooms reporting higher CPI compared to respondents with only one bedroom (p < 0.050). At the individual level, conjugal families with unmarried children and three-generation families had higher CPI (p < 0.050) compared to single families, both of which had children. After including community variables, conjugal and unmarried children’s families had a CPI that was 1.790 times higher than single-family households (p = 0.046) (Figure 5).

4.4. Factors Influencing Neighborhood Attachment

We recoded place attachment into a binary variable to differentiate between individuals with a sense of belonging to community spaces (defined as very satisfied, satisfied, or neutral) and those without such a sense of belonging (categorized as dissatisfied or very dissatisfied). Satisfaction with community public spaces and facility usage were the most critical predictors of neighborhood attachment (p < 0.050) (Figure 6). The higher the satisfaction with community public spaces and facilities, the stronger the individuals’ neighborhood attachment. In the third step of the final model, respondents living in the central urban area reported a lower willingness to participate in the community compared to the far suburban areas (p < 0.01) (Table 5b).
Among the demand variables, proximity to educational facilities and travel-related needs, including walking distances to transit stops, accessible and barrier-free routes, and motor vehicle parking, were associated with higher neighborhood attachment (p < 0.050). The classification table and likelihood ratio test of binary logistic regression are shown in (Table 6b and Table 7b). Respondents who reported a need for kindergarten and childcare facilities had lower neighborhood attachment (p < 0.050).
Community attachment was significantly correlated with the number of bedrooms. Community attachment with three bedrooms was 2.496 times higher than with one bedroom (p = 0.028). Consistent with the established research, perceived housing conditions were the strongest predictor of place attachment [62].

4.5. Qualitative Research

After the quantitative study, we used semi-structured interviews to logically verify the pre-deductive conclusions through the inductive method. The interviews were conducted from 3 March to 12 March 2025, with a total of 11 interviewees in offline one-on-one mode, and the duration of a single interview was 25–35 min. Interviews were audio-recorded with the consent of the respondents, and handwritten notes were taken to record keywords. The first part of the interview opened with the evaluation of the community environment; the second part used the demand for the community as a prelude to prepare the topic and explore clues for the next part; and the third part used the experience of community participation as the main body of the interview, encouraging the interviewees to talk about the possibilities of participating in the community based on their experiences and triggering more in-depth thinking, with the aim of filling in the complete picture regarding questions that could not be answered in the empirical study. Special attention was paid to questions with a particularly high factor ranking, as well as questions about wanting to participate or not participate in the community.
Negative evaluations of community facilities promote CPI, possibly because participation in community activities can complement the deficiencies in the experience of using community facilities. Respondents may prefer to turn to the community out of perceived resistance to elderly facilities and financial concerns.
Interviewee ML09 said, “Many people who should be institutionalized are willing to stay at home, it is just hard to take the step to an institution. Cost-effective, but also the concept of Tianjin people is more attached to home. Elderly people in particularly good conditions, they choose to hire two nannies at home, not willing to come to the institution, their children will also feel that this is not filial piety. Residents in poor conditions, choose to accept community volunteers to come to their homes to take care of two hours a day”.
Interviewee ML08 said, “The demand for community kitchenettes is relatively high, we have several WeChat groups, and the number of people is just too many. We have a volunteer team in the community, where the younger seniors help the older ones who live alone with limited mobility, and this kind of activity is also more popular”.
Demand for early childhood care and education facilities also has an important influence on CPI. Educational orientation has prompted many families to choose to relocate to the central urban areas of Tianjin, where resources are better [5] (Yunxia, Sihang et al., 2021). However, the fact that community amenities are planned according to the size of the population leads to insufficient educational resources per capita in the central urban area. Strong motivation for child-rearing drives residents to be more involved in community activities.
Interviewee ML08 stated, “There are three campuses in my child’s school, but the classrooms in the first-grade campus are too small and shabby, and the classrooms in that other campus are okay, but the playground is too small. In this area, you can’t find many schools that are as good as the main school. The kids stay at the school all day, and after school the adults take the kids for activities. My child was bored at home on winter break, so I took her to a community event”.
Our results found that evaluations of public spaces do not significantly affect CPI, although demands for open spaces have a positive effect on CPI. The health benefits of open spaces are widely recognized, with established research showing that quality public spaces in a community promote a sense of community and cohesion [6]. Elderly people and adolescents spontaneously participate in group activities within community parks out of a need for health and recreation.
Respondent ML04 stated, “There’s this little park right in front of us, and that gas station takes up another piece of land, so the little park is getting smaller and smaller. There are too many children after school in the afternoon, and when they run, they can hit each other. We live in the neighborhood, and the people who come here are all from the surrounding area. At this age, I choose a park that is close by. If you go too far, it’s not convenient, it’s an hour and a half round trip by bus, and then exercise, not as convenient as here”.
Respondent ML08 said, “The community is generally faced with the elderly, and during the weekdays, the elderly participate more in the activities because the adults go to work and the children go to school. During the summer and winter vacations, adults will participate with their children”.

5. Discussion

5.1. Impact of the Built Environment

The relationship between the built environment and CP continues to generate debate in the academic literature. Zhu, Y. [17] observed that the impact of public spaces on CP was mediated by place attachment and social capital [17]. In contrast, other research suggests that the size of the built environment [64] and pedestrian-oriented, mixed-use characteristics related to the quality of public spaces are positively associated with CPI, underscoring the significance of the physical environment [56].
Our results do not find a significant relationship between the evaluation of public spaces and CPI. However, the demand for public spaces in the community can significantly increase CPI. Neighborhood characteristics play a more important role than housing itself in studies of households’ willingness to relocate, with people weighing various community resources [79,80]. Research on residential mobility in Tianjin points to both the neighborhood environment and service facilities as key elements in relocation choices [81].
The results of this study suggest that poor evaluations of amenity use may instead contribute to positive CPI. Similar to previous research, residents’ use of amenities provided by market participants outside of gated residential areas is negatively associated with CPI [57]. Community amenities, such as consumption places and institutional spaces, are amenities, with some amenities based on shared goals and intergroup cooperation [55] and some amenities that fulfill residents’ more purposeful needs in their daily lives. Adaptation theory states that when experiencing inconsistencies between people and environments, individuals adjust their selves to find more suitable environments to fulfill their needs [82], and residents who are dissatisfied with amenities are more likely to achieve compensation through participation in community activities. Organizational psychology further distinguishes between two approaches to fit: matching and complementing each other [82]. In the contextual effect, negative evaluations of community facilities drive participation in a compensatory manner. This finding calls for further discussion of the role of personal motivation on residents’ CPI.
Demand has been less addressed in environmental and CPI research, but this study shows its important role. Fit theory suggests that individual behaviors and emotions are shaped by a combination of psychological traits, living spaces, and the external environment [28]. The mutual incentives theory expands participation motivation from a collectivist perspective. For active participants in cooperative collective actions, the demand-side model in the participation chain includes shared goals, which are derived from common needs [83]. This study, on the other hand, looks through the lens of the individual and shows that CPI derives more from subjective demand for the environment and facilities. However, this consistency is not static, instead adjusting to individual needs, times, and life stages [36]. On the demand side of the participation chain, the need for facility usage, the proper allocation of open spaces, and a safe and convenient green travel environment constitute the main differentiating factors for CPI.

5.2. Neighborhood Attachment and Willingness to Participate in the Community

Research suggests that people who are highly attached to a place are more likely to participate in their neighborhoods in the manner of responsible caretakers [73], while other research suggests that higher levels of attachment do not necessarily translate into actual civic engagement [26]. This inconsistency may be related to residents’ personal resources, social backgrounds, and the level of community organization. Past participation experiences [51] and the presence of cultural capital [66] can enhance residents’ motivation to remain engaged. The role of attachment may differ in communities with different physical and social characteristics. In some communities, symbolic and emotional attachment can enhance residents’ engagement, whereas, in others, physical environmental features may inhibit this effect [64]. Thus, the complex relationship between attachment and CP means that environmental factors in different communities need to be contextualized in relation to specific social structures and resident needs to better understand their impact on engagement behaviors.
The results of our study show that there is a positive effect of neighborhood attachment on CPI, and the respondents’ familiarity with the convenience of living in the community and their surroundings brings about spontaneous collective activities between groups and active participation in community activities. The main subjects of such participation are the disadvantaged groups in the community, the material dependence and emotional attachment of the elderly to the community, and the importance attached to the education of minors. These findings resonate with established research that shows that older people’s dependence on the community increases as they age, and in the context of physical limitations and loneliness, community activities become an important channel for socialization [50], which is important for older people to create a P–E fit [47]. Interactions among children are an effective way to promote parental bonding and break down social class barriers [40].

5.3. Neighborhood Attachment

The results of our study show that the environmental predictors of neighborhood attachment were building features, public spaces, and facility usage. Public spaces, such as transportation hubs, schools, and commercial areas, are essential for fostering community social relations and inclusivity through regular interactions among residents [43]. Continuous engagement in these environments contributes to a heightened sense of belonging, reinforcing place attachment.
Additionally, this study revealed that people living in residences with more bedrooms had markedly higher neighborhood attachment. Larger living areas provide physical comfort and foster a sense of security and continuity within families [47]. This finding supports established research that the privacy and stability afforded by living spaces play an important role in promoting neighborhood attachment [24].
Individual needs had a smaller influence on neighborhood attachment than external environmental factors. In this study, the needs that significantly influenced neighborhood attachment were the need for transportation, accessibility to educational facilities, walking distances to bus stops, accessibility to walking environments, and the need for parking. Consistent with the established research, accessibility to quasi-public spaces such as bus stops and schools had a significant role in promoting neighborhood interactions and inclusive attitudes [43]. Although demand was strongly associated with CPI, it did not have as strong an effect on place attachment as the external environment. Overall, the combination of the multilevel nature of a sense of place suggests that the external environment (public spaces and community facilities) is important for place attachment, while resident motivation is the strongest driver of willingness to participate in the community.

6. Conclusions

Grassroots communities are critical in a highly centralized, large, unitary state, which is why the Chinese government places significant emphasis on community governance. Against the backdrop of global challenges related to community renewal, stimulating community vitality and enhancing resident participation to achieve grassroots self-management has become an important topic. This approach improves the physical environment and the social effects of the community [16].
This study conducted an empirical analysis of Tianjin, a highly urbanized region, expanding the research framework on CPI. The following conclusions were obtained. Promoting CPI should address two aspects: (1) the external environment, including the type of community and community facilities, and (2) residents’ needs for the built environment of the community, specifically access to community facilities, the rational allocation of open spaces, and a safe and convenient green travel environment. These constitute the main differentiating factors for CPI, and the need for travel-related needs constitutes factors for attachment to the community. Our results found that the core driver of CPI is the need for a built community environment, and that a satisfactory community environment does not necessarily promote CPI. Satisfying these needs strengthens one’s ties to the local area [10], which in turn fosters a higher sense of community. Community attachment, on the other hand, relies heavily on subjective evaluations of the use of community spaces and amenities, reflecting the experience-driven character of emotional attachment.
Community facilities represent more purposeful daily activities, and the frequent use of facilities significantly increases community attachment or physical dependence on community spaces. This is consistent with the established research, which shows that an increased frequency of facility use enhances residents’ sense of community, especially as the affordable housing group becomes more reliant on local facilities in their daily lives [10]. On the contrary, satisfaction with community facilities reduces CPI, probably because residents have already gained the convenience of life through the facilities. This result supports the theoretical proposition of the community as the basic unit of spatial governance in China, where social support networks can still realize functional compensation through community participation mechanisms when there is a gap in the provision of facilities within the daily living circle. This validates the concerted efforts of community amenities, community governance, and diverse community activities within the living circle in the complete community framework to form community strengths to meet heterogeneous needs. Community open spaces are the most important influencing factor of community attachment. A lot of spontaneous collective activities occur here, representing daily casual activities. Although satisfaction with open spaces does not directly increase CPI, dependence on open spaces can significantly increase CPI. Dependence on the green travel environment can also significantly increase CPI. Among the community characteristics, affordable housing in the central urban area has higher CPI, and the interaction of population density and housing type is significant.
This study was limited by a cross-sectional design that temporarily prevented access to follow-up data, resulting in the inability to determine causality. In addition, the multiple dimensions of place attachment were not measured due to questionnaire length considerations, which may not fully capture the complexity of the variables, and potential response bias may also arise from subjective measures of satisfaction with the community environment. Finally, the case cities in this study have a typical circling urban structure and diverse community types, and our findings are informative for community development and governance in other high-density areas of Asia. Considering the effects of time and environmental changes, future studies will incorporate multi-city comparisons and time-series longitudinal studies. To more fully examine the underlying mechanisms of CPI, environmental measurements will be further refined to include objective data that respond to environmental characteristics and examine the role of society, culture, and policy.

Author Contributions

Conceptualization, P.S., W.H. and R.L.; methodology, W.H. and R.L.; software, W.H. and R.L.; validation, D.R. and R.L.; formal analysis, D.R. and R.L.; investigation, W.H., D.R. and R.L.; resources, W.H. and D.R.; data curation, W.H. and D.R.; writing—original draft preparation, W.H. and R.L.; writing—review and editing, W.H. and R.L.; visualization, W.H. and D.R.; supervision, P.S.; project administration, D.R.; funding acquisition, D.R. All authors have read and agreed to the published version of the manuscript.

Funding

This research was funded by the National Nature Science Foundation of China, grant number 52078178; the Humanities and Social Sciences Research Project of Higher Education Institutions in Hebei Province, grant number SQ2022075; and The Central Government Leading Local (Hebei) Science and Technology Development Funding Project, grant number 246Z7603G.

Institutional Review Board Statement

All subjects gave their informed consent for inclusion before they participated in the study. The study was conducted in accordance with the Declaration of Helsinki, and the protocol was approved by the Ethics Committee of Hebei University of Technology (HEBUTHMEC2020017).

Informed Consent Statement

Informed consent was obtained from all subjects involved in the study.

Data Availability Statement

The data from this study are not publicly available due to participant confidentiality and privacy concerns. Further inquiries can be directed to the corresponding author.

Acknowledgments

The authors would like to thank the China Real Estate Association for their generous support during data collection.

Conflicts of Interest

The authors declare no conflict of interest.

Abbreviations

The following abbreviations are used in this manuscript:
P-E fitPerson–environment fit
CPIcommunity participation intention
CPcommunity participation

References

  1. McMillan, D.W.; Chavis, D.M. Sense of community: A definition and theory. J. Community Psychol. 1986, 14, 6–23. [Google Scholar]
  2. Zhang, C.; Lu, B. Residential satisfaction in traditional and redeveloped inner city neighborhood: A tale of two neighborhoods in Beijing. Travel Behav. Soc. 2016, 5, 23–36. [Google Scholar] [CrossRef]
  3. Srivarathan, A.; Jørgensen, T.S.H.; Lund, R.; Nygaard, S.S.; Kristiansen, M. “They are breaking us into pieces”: A longitudinal multi-method study on urban regeneration and place-based social relations among social housing residents in Denmark. Health Place 2023, 79, 102965. [Google Scholar] [CrossRef] [PubMed]
  4. Xu, G.; Ma, Y.; Zhu, Y. Social participation of migrant population under the background of social integration in China—Based on group identity and social exclusion perspectives. Cities 2024, 147, 104850. [Google Scholar] [CrossRef]
  5. Liu, Y.; Yu, S.; Sun, T. Heterogeneous housing choice and residential mobility under housing reform in China: Evidence from Tianjin. Appl. Geogr. 2021, 129, 102417. [Google Scholar] [CrossRef]
  6. Francis, J.; Giles-Corti, B.; Wood, L.; Knuiman, M. Creating sense of community: The role of public space. J. Environ. Psychol. 2012, 32, 401–409. [Google Scholar] [CrossRef]
  7. Wakefield, S.E.L.; Elliott, S.J.; Cole, D.C.; Eyles, J.D. Environmental risk and (re)action: Air quality, health, and civic involvement in an urban industrial neighbourhood. Health Place 2001, 7, 163–177. [Google Scholar] [CrossRef]
  8. Wu, F.; Logan, J. Do rural migrants “float” in urban China? Neighbouring and neighbourhood sentiment in Beijing. Urban Stud. 2016, 53, 2973–2990. [Google Scholar]
  9. Toit, L.D.; Cerin, E.; Leslie, E.; Owen, N. Does Walking in the Neighbourhood Enhance Local Sociability? Urban Stud. 2007, 44, 1677–1695. [Google Scholar]
  10. Zhang, X.; Cheng, H.; Tao, Y.; Chai, Y. Housing-related differences in sense of community in mixed housing neighborhood: Impacts of residents’ daily activities and facility utilization. Cities 2024, 149, 104912. [Google Scholar] [CrossRef]
  11. Kim, M.; Cho, M. Examining the role of sense of community: Linking local government public relationships and community-building. Public Relat. Rev. 2019, 45, 297–306. [Google Scholar]
  12. Benoit, A.; Townshend, I.J.; Johnston, T.; Newberry, J. Neighbourhood participation and social inclusion: Case studies of Calgary, Alberta. Geoforum 2022, 132, 20–31. [Google Scholar] [CrossRef]
  13. Putnam, R.D. Democracies in Flux: The Evolution of Social Capital in Contemporary Society; Oxford University Press: Cary, NC, USA, 2002. [Google Scholar]
  14. Wang, Z.; Zhang, F.; Wu, F. Neighbourhood cohesion under the influx of migrants in Shanghai. Environ. Plan. A Econ. Space 2016, 49, 407–425. [Google Scholar] [CrossRef]
  15. Yang, M. Community as a Unit of National Governance—A Case Study of Residents’ Community Participation and Community Perceptions in the Process of Urban Community Building Movement. Sociol. Res. 2007, 4, 28. [Google Scholar] [CrossRef]
  16. Tang, D.; Gong, X.; Liu, M. Residents’ behavioral intention to participate in neighborhood micro-renewal based on an extended theory of planned behavior: A case study in Shanghai, China. Habitat Int. 2022, 129, 102672. [Google Scholar] [CrossRef]
  17. Zhu, Y. Toward community engagement: Can the built environment help? Grassroots participation and communal space in Chinese urban communities. Habitat Int. 2015, 46, 44–53. [Google Scholar] [CrossRef]
  18. Yang, M. Civic Participation, Mass Participation, and Community Participation. Society 2005, 5, 78–95. [Google Scholar] [CrossRef]
  19. Davies, W.K.; Townshend, I.J. New urbanisms: From neo-traditional neighbourhoods to new regionalism. In Theme Cities: Solutions for Urban Problems; Springer: London, UK, 2015; pp. 17–61. [Google Scholar]
  20. Grant, J. Planning the Good Community: New Urbanism in Theory and Practice; Routledge: Oxfordshire, UK, 2005. [Google Scholar]
  21. Talen, E. Sense of community and neighbourhood form: An assessment of the social doctrine of new urbanism. Urban Stud. 1999, 36, 1361–1379. [Google Scholar] [CrossRef]
  22. Ford, L.R. Lynch revisited: New urbanism and theories of good city form. Cities 1999, 16, 247–257. [Google Scholar] [CrossRef]
  23. Glynn, T.J. Neighborhood and sense of community. J. Community Psychol. 1986, 14, 341–352. [Google Scholar] [CrossRef]
  24. Lewicka, M. Place attachment: How far have we come in the last 40 years? J. Environ. Psychol. 2011, 31, 207–230. [Google Scholar] [CrossRef]
  25. Liu, S.; Zhang, F.; Wu, F. Contrasting migrants’ sense of belonging to the city in selected peri-urban neighbourhoods in Beijing. Cities 2022, 120, 103499. [Google Scholar] [CrossRef]
  26. Palmer, N.A.; Perkins, D.D.; Xu, Q. Social capital and community participation among migrant workers in China. J. Community Psychol. 2011, 39, 89–105. [Google Scholar]
  27. Anton, C.E.; Lawrence, C. The relationship between place attachment, the theory of planned behaviour and residents’ response to place change. J. Environ. Psychol. 2016, 47, 145–154. [Google Scholar]
  28. Stokols, D. Conceptual strategies of environmental psychology. In Handbook of Environmental Psychology; Stokols, D., Altman, I., Eds.; John Wiley & Sons: New York, NY, USA, 1987; Volume 1. [Google Scholar]
  29. Nie, X.; Han, M.; Yang, D. Escaping from the identity enclave: Social inclusion events and floating migrants’ settlement intention in China. Popul. Space Place 2023, 29, e2695. [Google Scholar] [CrossRef]
  30. Dieleman, F.M.; Mulder, C.H. The geography of residential choice. In Residential Environments Choice Satisfaction & Behavior; Praeger Publishers Inc.: Westport, CT, USA, 2002; pp. 35–54. [Google Scholar]
  31. Caplan, A.J.; Akhundjanov, S.B.; Toll, K. Measuring heterogeneous preferences for residential amenities. Reg. Sci. Urban Econ. 2021, 87, 103646. [Google Scholar] [CrossRef]
  32. Cockx, K.; Canters, F. Determining heterogeneity of residential location preferences of households in Belgium. Appl. Geogr. 2020, 124, 102271. [Google Scholar] [CrossRef]
  33. Ross, L.; Nisbett, R.E. The Person and the Situation: Perspectives of Social Psychology; Pinter & Martin Publishers: London, UK, 2011. [Google Scholar]
  34. Kahana, E.; Lovegreen, L.; Kahana, B.; Kahana, M. Person, environment, and person-environment fit as influences on residential satisfaction of elders. Environ. Behav. 2003, 35, 434–453. [Google Scholar]
  35. Van Vianen, A.E. Person–environment fit: A review of its basic tenets. Annu. Rev. Organ. Psychol. Organ. Behav. 2018, 5, 75–101. [Google Scholar] [CrossRef]
  36. Moser, G. Quality of life and sustainability: Toward person–environment congruity. J. Environ. Psychol. 2009, 29, 351–357. [Google Scholar] [CrossRef]
  37. McCray, J.W.; Day, S.S. Housing values, aspirations, and satisfactions as indicators of housing needs. Home Econ. Res. J. 1977, 5, 244–254. [Google Scholar] [CrossRef]
  38. Whitham, M.M. Community Connections: Social Capital and Community Success 1. Sociol. Forum 2012, 27, 441–457. [Google Scholar] [CrossRef]
  39. Brown, S.A.; Venkatesh, V.; Goyal, S. Expectation confirmation in technology use. Inf. Syst. Res. 2012, 23, 474–487. [Google Scholar] [CrossRef]
  40. Riger, S.; Lavrakas, P.J. Community ties: Patterns of attachment and social interaction in urban neighborhoods. Am. J. Community Psychol. 1981, 9, 55–66. [Google Scholar] [CrossRef]
  41. Chan, E.T.; Li, T.E. The effects of neighbourhood attachment and built environment on walking and life satisfaction: A case study of Shenzhen. Cities 2022, 130, 103940. [Google Scholar] [CrossRef]
  42. Townshend, I.J. The contribution of social and experiential community structures to the intra-urban ecology of well-being. Can. J. Urban Res. 2001, 10, 175–215. [Google Scholar]
  43. Wang, X.; Liu, Z. Neighborhood environments and inclusive cities: An empirical study of local residents’ attitudes toward migrant social integration in Beijing, China. Landsc. Urban Plan. 2022, 226, 104495. [Google Scholar] [CrossRef]
  44. Low, S.M.; Altman, I. Place attachment: A conceptual inquiry. In Place Attachment; Springer: New York, NY, USA, 1992; pp. 1–12. [Google Scholar]
  45. Scannell, L.; Gifford, R. The relations between natural and civic place attachment and pro-environmental behavior. J. Environ. Psychol. 2010, 30, 289–297. [Google Scholar] [CrossRef]
  46. Sun, B.; Lin, J.; Yin, C. Impacts of the built environment on social capital in China: Mediating effects of commuting time and perceived neighborhood safety. Travel Behav. Soc. 2022, 29, 350–357. [Google Scholar] [CrossRef]
  47. Chang, J.; Lin, Z.; Vojnovic, I.; Qi, J.; Wu, R.; Xie, D. Social environments still matter: The role of physical and social environments in place attachment in a transitional city, Guangzhou, China. Landsc. Urban Plan. 2023, 232, 104680. [Google Scholar] [CrossRef]
  48. Abass, Z.; Tucker, R. White picket fences & other features of the suburban physical environment: Correlates of neighbourhood attachment in 3 australian low-density suburbs. Landsc. Urban Plan. 2017, 170, 231–240. [Google Scholar] [CrossRef]
  49. Shamai, S. Sense of place: An empirical measurement. Geoforum 1991, 22, 347–358. [Google Scholar] [CrossRef]
  50. Cheng, X.; Zhong, W.; Li, D. Urban neighborhood self-governance and community attachment: Evidence from southwest China. Cities 2021, 112, 103128. [Google Scholar] [CrossRef]
  51. Wu, R.; Li, Z.; Liu, Y.; Huang, X.; Liu, Y. Neighborhood governance in post-reform Urban China: Place attachment impact on civic engagement in Guangzhou. Land Use Policy 2019, 81, 472–482. [Google Scholar] [CrossRef]
  52. Klinenberg, E. Palaces for the People: How Social Infrastructure Can Help Fight Inequality, Polarization, and the Decline of Civic Life; Crown: New York, NY, USA, 2018. [Google Scholar]
  53. Blommaert, J. Infrastructures of superdiversity: Conviviality and language in an Antwerp neighborhood. Eur. J. Cult. Stud. 2014, 17, 431–451. [Google Scholar] [CrossRef]
  54. Matejskova, T.; Leitner, H. Urban encounters with difference: The contact hypothesis and immigrant integration projects in eastern Berlin. Soc. Cult. Geogr. 2011, 12, 717–741. [Google Scholar] [CrossRef]
  55. Piekut, A.; Valentine, G. Spaces of encounter and attitudes towards difference: A comparative study of two European cities. Soc. Sci. Res. 2017, 62, 175–188. [Google Scholar] [CrossRef]
  56. Stroope, J. Active transportation and social capital: The association between walking or biking for transportation and community participation. Prev. Med. 2021, 150, 106666. [Google Scholar] [CrossRef]
  57. Shen, J.; Lu, T.; Luo, X. Urban enclosure, neighbourhood commons, and community participation willingness: Evidence from Shanghai, China. Geoforum 2023, 141, 103719. [Google Scholar] [CrossRef]
  58. Bowling, A.; Stafford, M. How do objective and subjective assessments of neighbourhood influence social and physical functioning in older age? Findings from a British survey of ageing. Soc. Sci. Med. 2007, 64, 2533–2549. [Google Scholar] [CrossRef]
  59. Cong, W.; Su, Y.; Pan, S. Owners’ satisfaction on passive housing based on structural equation mode. J. Eng. Manag. 2018, 32, 144–148. [Google Scholar]
  60. King, D. Neighborhood and individual factors in activity in older adults: Results from the neighborhood and senior health study. J. Aging Phys. Act. 2008, 16, 144–170. [Google Scholar] [CrossRef] [PubMed]
  61. Sheng, M.; Hu, L.; Zhang, B.; Deng, L.; Zhao, Y. Housing tenure and neighbourhood satisfaction in transitional urban China: Evidence from Changchun. Habitat Int. 2021, 112, 102358. [Google Scholar] [CrossRef]
  62. Sun, Y.; Fang, Y.; Yung, E.H.; Chao, T.-Y.S.; Chan, E.H. Investigating the links between environment and older people’s place attachment in densely populated urban areas. Landsc. Urban Plan. 2020, 203, 103897. [Google Scholar] [CrossRef]
  63. Tianjin Municipal Bureau of Statistics. Tianjin Statistical Yearbook; China Statistics Press: Tianjin, China, 2020. Available online: https://stats.tj.gov.cn/nianjian/2020nj/zk/indexch.htm (accessed on 8 April 2023).
  64. Bottini, L. The effects of built environment on community participation in urban neighbourhoods: An empirical exploration. Cities 2018, 81, 108–114. [Google Scholar] [CrossRef]
  65. Shin, J.; Yang, H.J. Does residential stability lead to civic participation?: The mediating role of place attachment. Cities 2022, 126, 103700. [Google Scholar] [CrossRef]
  66. Stefaniak, A.; Bilewicz, M.; Lewicka, M. The merits of teaching local history: Increased place attachment enhances civic engagement and social trust. J. Environ. Psychol. 2017, 51, 217–225. [Google Scholar] [CrossRef]
  67. Zhang, R.; Zhang, C.; Lai, P.C.; Kwan, M. Park and neighbourhood environmental characteristics associated with park-based physical activity among children in a high-density city. Urban For. Urban Green. 2022, 68, 127479. [Google Scholar] [CrossRef]
  68. Horelli, L. Environmental human-friendliness as a contextual determinant for quality of life. Eur. Rev. Appl. Psychol. 2006, 56, 15–22. [Google Scholar] [CrossRef]
  69. Chen, H.; Li, Z. Social integration of social housing communities in big cities of china: A case study of guangzhou city. City Plan. Rev. (Chengshi Guihua) 2015, 39, 33–39. [Google Scholar]
  70. Soltani, S.; Gu, N.; Ochoa, J.J.; Sivam, A. The role of spatial configuration in moderating the relationship between social sustainability and urban density. Cities 2022, 121, 103519. [Google Scholar] [CrossRef]
  71. GB50180-93; Planning and Design Code for Urban Residential Areas (2002 Edition). China Architecture & Building Press: Beijing, China, 2002.
  72. Pettigrew, T.F.; Tropp, L.R. A meta-analytic test of intergroup contact theory. J. Personal. Soc. Psychol. 2006, 90, 751–783. [Google Scholar] [CrossRef] [PubMed]
  73. Lewicka, M. What makes neighborhood different from home and city? Effects of place scale on place attachment. J. Environ. Psychol. 2010, 30, 35–51. [Google Scholar] [CrossRef]
  74. Rogers, G.O.; Sukolratanametee, S. Neighborhood design and sense of community: Comparing suburban neighborhoods in Houston Texas. Landsc. Urban Plan. 2009, 92, 325–334. [Google Scholar] [CrossRef]
  75. Jorgensen, B.S.; Stedman, R. Sense of place as an attitude: Lakeshore owners attitudes toward their properties. J. Environ. Psychol. 2001, 21, 233–248. [Google Scholar] [CrossRef]
  76. Wang, P.; Lyu, L.; Xu, J. Factors Influencing Rural Households’ Decision-Making Behavior on Residential Relocation: Willingness and Destination. Land 2021, 10, 1285. [Google Scholar] [CrossRef]
  77. Parisi, D.; Michael Grice, S.; Taquino, M.; Gill, D.A. Building capacity for community efficacy for economic development in Mississippi. Community Dev. 2002, 33, 19–38. [Google Scholar] [CrossRef]
  78. Gough, C.; Lewis, L.K.; Barr, C.; Maeder, A.; George, S. Community participation of community dwelling older adults: A cross-sectional study. BMC Public Health 2021, 21, 612. [Google Scholar] [CrossRef]
  79. Tan, T.-H. Meeting first-time buyers’ housing needs and preferences in greater Kuala Lumpur. Cities 2012, 29, 389–396. [Google Scholar] [CrossRef]
  80. Wang, D.; Li, S.-M. Housing preferences in a transitional housing system: The case of Beijing, China. Environ. Plan. 2004, 36, 69–87. [Google Scholar] [CrossRef]
  81. Wen, H.; Zhang, Y.; Zhang, L. Do educational facilities affect housing price? An empirical study in Hangzhou, China. Habitat Int. 2014, 42, 155–163. [Google Scholar] [CrossRef]
  82. Yu, K.Y. A motivational model of person-environment fit: Psychological motives as drivers of change. Organ. Fit: Key Issues New Dir. 2013, 246, 21–49. [Google Scholar]
  83. Birchall, J.; Simmons, R. What motivates members to participate in cooperative and mutual businesses? Ann. Public Coop. Econ. 2004, 75, 465–495. [Google Scholar] [CrossRef]
Figure 1. Hypothesized Conceptual Model.
Buildings 15 01060 g001
Figure 2. Location of the research area.
Buildings 15 01060 g002
Figure 3. Itemized differences in satisfaction.
Buildings 15 01060 g003
Figure 4. Regional differences in satisfaction.
Buildings 15 01060 g004
Figure 5. Forest plots for binary logistic regression of CPI.
Buildings 15 01060 g005
Figure 6. Forest plots for binary logistic regression of community attachment.
Buildings 15 01060 g006
Table 1. Comparison of the city center and periphery areas in Tianjin.
RegionAdministrative DistrictsPrimary IndustryPopulation Density (Person/km2)Rural Population RatioHousing Price
(CNY 1000/m2)
The downtown areaHeping, Hedong, Hexi, Nankai, Hebei, HongqiaoNo43,986–19,185029 (Hedong)–54 (Hebei)
Four districts around the city and the Binhai New AreaDongli, Xiqing, Jinnan, Beichen, Binhai,Yes1271–62712% (Binhai)–62% (Beichen)14 (Jinnan)–19 (Xiqing)
Five suburban districtsWuqing, Baodi, Jinghai, Jizhou, Ninghe,No545–31058%(Wuqing)–84%(Jinghai)8 (Ninghe)–14 (Wuqing)
Note. The data are from the yearbook of 2020.
Table 2. Variables and measurement items.
CategoryVariableItemReferences
Dependent Variable
CPICommunity participation intentionDo you wish to enhance resident participation and increase the diversity of community activities?[42,66]
Core Independent Variables
Community build environmentThe accessibility of community facilitiesHow satisfied are you with the street landscape in your neighborhood?[57]
How satisfied are you with the accessibility to the city’s open public spaces, parks, and sports fields?
How satisfied are you with the accessibility to commercial/cultural/medical facilities in your neighborhood?
How satisfied are you with the accessibility to educational facilities (schools/youth activity centers) in your neighborhood?
How satisfied are you with the accessibility to elderly-friendly living facilities in your neighborhood?
Green travelHow satisfied are you with the walking distance between the residential area and public transportation stations?[48]
How satisfied are you with the connectivity of pedestrian/bicycle paths and parking facilities to commercial areas?
How satisfied are you with the pedestrian accessibility to elementary schools from your residence?
How satisfied are you with outdoor barrier-free routes?
How satisfied are you with the separation of pedestrians and vehicles on the roads?
Communal spaceHow satisfied are you with the natural ecological environment (parks/green spaces) in your neighborhood?[48]
How satisfied are you with the landscape design and residential building aesthetics in your community?
How satisfied are you with the urban open public spaces in your neighborhood?
How satisfied are you with the parking of motor vehicles and non-motor vehicles?
How satisfied are you with the barrier-free passages on the internal roads of the residential area?
The usability of community facilitiesHow satisfied are you with the clubhouse with sports and fitness facilities in your neighborhood?[71]
How satisfied are you with the clinic services and health management facilities in your neighborhood?
How satisfied are you with the living facilities, such as the wet market and the convenience store?
How satisfied are you with the home service facilities for the elderly in your neighborhood?
How satisfied are you with the kindergarten and daycare spaces in your neighborhood?
Residential maintenanceHow satisfied are you with the public security and smart management systems in your community?[17,62]
How satisfied are you with the cleanliness and sanitation maintenance in your community?
How satisfied are you with the maintenance of public areas in your community?
How satisfied are you with the waste management system in your community?
Neighborhood attachmentThe courtyard and street designs in our neighborhood facilitate neighborly interactions and strengthen community belonging.[17,42,66]
Table 3. Characteristics of the questionnaire respondents.
Item Num%Item Num%
GenderMale41950.1House propertyMarket housing
communities
65778.6
Female41749.9Affordable housing718.5
Age≤34 yrs26932.2Other10812.9
35–49 yrs37244.5
≥50 yrs19523.3
Family typeSingle family819.7House typeOne bedroom 9611.5
Conjugal family23227.8Two bedrooms 37344.6
Conjugal and unmarried children31137.2Three bedrooms 28834.4
Three-generation family16419.6≥Four rooms 799.4
Other485.7
Household size
(persons)
1–2 20925.0Housing
area
(m2)
≤6013115.7
3 33339.861–9021826.1
4 16319.591–14438445.9
5 789.3145–200759.0
>5 536.3>200283.3
OccupationManagers of enterprises 14217.0Completion timeBefore 1970s101.2
Professionals34741.51980s11013.2
Individual business10512.61990s13416.0
Freelancer779.22000–201036243.3
Other16519.7After 201122026.3
Note. Affordable housing or social housing (Resettlement housing and co-ownership housing, excluding public rental housing).
Table 4. Measurement of CPI and sense of belonging.
VariableCPI (Willingness to Participate)Community Attachment (Satisfied)
%NumChi-Square Test% NumChi-Square Test
Age≤34 yrs.28.1%115X2 = 6.086
p = 0.048
32.5%245X2 = 0.908
p = 0.635
35–49 yrs.47.4%19444.0%331
≥50 yrs.24.4%10023.5%177
Family typeSingle family7.1%29X2 = 10.111
p = 0.039
10.1%76X2 = 3.219
p = 0.522
Conjugal family26.7%10928.3%213
Conjugal and unmarried children41.3%16936.5%275
Three-generation family19.8%8119.4%146
Other5.1%215.7%43
OccupationManagers of enterprises16.1%66X2 = 9.320
p = 0.054
17.1%129X2 = 14.830
p = 0.005
Professionals46.5%19039.6%298
Individual business10.3%4213.3%100
Freelancer8.6%359.2%69
Other18.6%7620.8%157
House type1 bedroom 8.10%33X2 = 10.271
p = 0.015
11.3%85X2 = 7.023
p = 0.071
2 bedrooms 47.4%19443.4%327
3 bedrooms 35.7%14635.9%270
≥4 bedrooms 8.8%369.4%71
Population density5 suburban
districts
14.9%61X2 = 5.606
p = 0.061
19.1%144X2 = 22.095
p = 0.000
4 districts around the city 29.3%12027.9%210
Downtown areas55.7%22853.0%399
House propertyCommodity housing 80.0%327X2 = 1.087
p = 0.581
78.1%588X2 = 2.694
p = 0.260
Affordable housing and public rental housing8.30%348.4%63
Apartments and others11.7%4813.5%102
Total 48.9%836 90.1%753
Table 5. (a) Binary logistic regression coefficients explaining the odds of having CPI in the final model (N = 836). (b) Binary logistic regression coefficients explaining the odds of having neighborhood attachment in the final model (N = 836).
(a)
VariableStep 1Step 2Step 3
BORBORBOR
AgeAge (≤34 yrs.)
35–49 yrs.0.1621.1750.1451.1560.0091.009
≥50 yrs.0.350 *1.4190.2371.2680.2401.271
Family typeSingle family
Conjugal family0.2661.3040.3101.3630.3381.403
Conjugal and unmarried children0.530 *1.6980.582 **1.7900.5201.682
Three-generation family0.3971.4880.4881.6290.3391.404
Other0.2121.2360.1371.1470.0631.065
OccupationManagers of enterprises
Professionals0.359 *1.4330.2601.2970.2851.330
Individual business−0.1410.8690.1041.1090.1121.118
Freelancer0.0241.024−0.0660.9360.2871.333
Other0.0791.0820.1971.2170.0851.089
House typeOne bedroom
Two bedrooms0.582 **1.7900.647 ***1.9100.594 **1.811
Three bedrooms0.501 *1.6510.688 ***1.9890.648 **1.912
≥Four rooms0.3471.4150.5481.7290.4431.558
Population density5 suburban districts
4 districts around the city and the Binhai New Area 0.0851.0890.1211.129
Downtown areas −0.0320.9680.2141.238
5 suburban districts * market housing communities
4 districts around the city * affordable housing 0.1541.1660.1861.205
4 districts around the city * other 0.933 ***2.5431.181 ***3.257
Downtown areas * affordable housing 0.923 ***2.5160.968 ***2.632
Downtown areas * other 0.2431.2740.7062.025
Built EnvironmentFacility utilization −0.629 ***0.533−0.1700.844
Neighborhood attachmentNeighborhood attachment 0.835 ***2.3050.637 **1.890
DemandsStreet landscape in your neighborhood 0.2211.248
Accessibility to the city’s open public spaces 0.367 *1.443
Accessibility to educational facilities 0.1781.195
Accessibility to elderly-friendly living facilities 0.1761.192
Walking distance between the residential area and public transportation stations 0.3011.351
Pedestrian connectivity to elementary schools 0.447 **1.564
Outdoor barrier-free routes 0.348 *1.417
Separation of pedestrians and vehicles on the roads 0.437 **1.548
Communal space 0.337 *1.400
Barrier-free passage on the internal roads of the residential area 0.419 **1.520
Clubhouse with sports and fitness facilities 0.419 **1.520
Clinic services and health management facilities 0.776 ***2.174
Home service facilities for the elderly 0.448 **1.565
Kindergarten and daycare 0.630 ***1.878
Constant−0.1840.8320.6041.829−3.982 ***0.019
Cox and Snell R20.085 0.069 0.311
Nagelkerke R20.114 0.092 0.415
Hosmer and Lemeshow test (p)0.850 0.424 0.472
Correctly predicted values (%)61.4 61.2 75.4
(b)
VariableStep 1Step 2Step 3Step 4
BORBORBORBOR
OccupationManagers of enterprises
Professionals−0.4900.613−0.440.646−0.340.709−0.1160.891
Individual business0.7012.0160.8492.3360.6871.988−0.0060.994
Freelancer−0.1400.86900.999−0.010.994−0.4190.658
Other0.6821.9780.83 *2.2930.842 *2.3200.4021.495
House typeOne bedroom
Two bedrooms 0.0981.1030.0131.0130.2921.339
Three bedrooms 0.915 **2.4960.772 *2.1650.4901.632
≥Four rooms 0.2591.2960.0561.0580.0471.048
Population density5 suburban districts
4 districts around the city and the Binhai New Area −0.2610.771−0.3340.716
Downtown areas −0.861 *0.423−0.8240.439
Built EnvironmentFacility utilization 1.311 ***3.708
Communal space 1.777 ***5.914
DemandsAccessibility to educational facilities 1.044 ***2.840
Accessibility to elderly-friendly living facilities 0.3911.478
Walking distance between the residential area and public transportation stations 0.873 ***2.395
Outdoor barrier-free routes 0.641 *1.898
parking of motor vehicles and non-motor vehicles 0.916 **2.499
Kindergarten and daycare −0.805 **0.447
Constant2.295 ***9.9231.885 ***6.5862.564 ***12.99−6.871 ***0.001
Cox and Snell R20.024 0.032 0.204 0.244
Nagelkerke R20.049 0.067 0.429 0.512
Hosmer and Lemeshow test (p)0.664 0.627 0.141 0.668
Correctly predicted values (%)90.1 90.1 92.0 92.1
Note: * p < 0.1, ** p < 0.05, *** p < 0.01.
Table 6. (a) Classification table of CPI. (b) Classification table of neighborhood attachment.
(a)
ObservedPredicted
Unwilling to ParticipateWilling to ParticipatePercent Correct
Unwilling to participate3329577.8
Willing to participate11129672.9
Overall Percentage 75.4
(b)
ObservedPredicted
Unsatisfactory
Neighborhood Attachment
Satisfactory
Neighborhood Attachment
Percent Correct
Unsatisfactory neighborhood attachment295434.9
Satisfactory neighborhood attachment1274198.4
Overall Percentage 92.1
Note. Cells in the diagonal and in bold are correct predictions of the model, while cells off the diagonal (not bold) are incorrect predictions.
Table 7. (a) Likelihood ratio tests of statistically significant independent variables in the binary logistic regression of CPI. (b) Likelihood ratio tests of statistically significant independent variables in the binary logistic regression of neighborhood attachment.
(a)
EffectModel Fitting CriteriaLikelihood Ratio Tests
−2 log Likelihood of Reduced ModelChi-SquaredfSig.
Personal attribute1137.47721.078100.021
Housing attribute1131.54015.51880.050
Community attribute1090.38768.167200
Neighborhood attachment1080.65777.898210
Demands847.163 311.391360
(b)
EffectModel Fitting CriteriaLikelihood Ratio Tests
−2 log Likelihood of Reduced ModelChi-SquaredfSig.
Personal attribute525.10115.79630.003
Housing attribute515.54025.35870.001
Community attribute508.44732.45090
Neighborhood attachment348.512192.386110
Demands306.309234.589180
Disclaimer/Publisher’s Note: The statements, opinions and data contained in all publications are solely those of the individual author(s) and contributor(s) and not of MDPI and/or the editor(s). MDPI and/or the editor(s) disclaim responsibility for any injury to people or property resulting from any ideas, methods, instructions or products referred to in the content.

