Article

Research on Mechanical Properties of Non-Directly Welded Reinforced Casings Under High Stress Ratio

1
China Metallurgical Construction Research Institute Co., Ltd., Beijing 100088, China
2
Inspection and Certification Co., Ltd., China Metallurgical Group Corporation, Beijing 100088, China
3
School of Civil Engineering, Shandong Jianzhu University, Jinan 250101, China
*
Author to whom correspondence should be addressed.
Buildings 2025, 15(7), 1042; https://doi.org/10.3390/buildings15071042
Submission received: 3 March 2025 / Revised: 17 March 2025 / Accepted: 21 March 2025 / Published: 24 March 2025
(This article belongs to the Section Building Structures)

Abstract

Aiming at the requirement of high stress ratio reinforcement in space steel structures, a novel method for enshancing the load-bearing capacity of casings through indirect welding to produce a reinforced steel pipe is introduced. To investigate how the mechanical properties of steel pipe members change when reinforced using this method, a series of welding reinforcement axial compression tests were designed, incorporating local reinforcements at various positions and with different initial stress ratios. By comparing the reinforced specimens with those left unreinforced, we obtained insights into the failure modes, ultimate bearing capacities, and strain data of the steel pipes. To further validate the findings, 236 finite element models were developed. These models allowed for a comprehensive analysis of the numerical results alongside the experimental data, taking into account the thermal effects of welding. Quantitative analyses were performed to assess the impact of the initial stress ratio, initial defects, welding heat effects, slenderness ratio, the area ratio between the reinforcement and the pipe, and the length of the reinforcement on the ultimate bearing capacity of the reinforced members. The findings indicate that residual stresses resulting from the welding process have a minimal influence on the ultimate bearing capacity. The method maintains over 75% of its efficiency even at initial stress ratios up to 0.8. Additionally, the study elucidates the rules governing the impact of localized reinforcement on the mechanical properties of loaded steel pipe members. Combining the theoretical calculations with numerical simulations, an empirical formula for estimating the ultimate bearing capacity of the reinforced pipe specimens was derived. The relative error of the formula is less than 10% with the experimental outcomes and the finite element analysis results thereby offering a reliable tool for engineering applications.

1. Introduction

Steel structures have a long history of development. As their service life increases, the probability of component failure also rises. Many existing steel structures now struggle to meet the current structural requirements, while a significant number of spatial steel structure facilities face the need for transformation. Consequently, the reinforcement and upgrading of steel structures have emerged as a prominent area within the construction industry. In the steel reinforcement method, welding reinforcement has been the most widely used steel structure reinforcement method for many years because of its flexible construction and less preparation work. Up to now, there have been many studies on welding reinforcement. Al Ali M. [1], Liu Y. [2], Erfani S. [3], Xiangyang, J. [4], Zhongwei, Z. [5] and others have systematically studied the welding reinforcement methods of I-beams, square steel pipes and other section steel. The experimental research on welding and strengthening of axial compression members, bias members and flexural members, the numerical analysis of thermal-force coupling, and theoretical calculation are carried out. The residual stress generated by the thermal effect in the process of welding reinforcement will seriously affect the ultimate bearing capacity of the component, especially for thin-walled steel pipe components. In order to more accurately simulate the impact of the residual stress caused by the thermal effect in the welding process, and then study the overall stability factors of the component in the welding process, Goldak J. [6] developed a new type of moving double ellipsoid welding heat source model, and verified the accuracy of welding heat input according to experiments. Marzouk H. [7] derived the analytical formula of the bearing capacity of the member considering the superposition of the original residual stress, welding residual stress, and stress under the initial load. The nonlinear finite element analysis of steel members under the influence of welding residual stress based on large deformation stability theory is carried out.
However, as the demand for reinforcement and the requirements of engineering projects have increased, the application of complete unloading for reinforcement in actual projects has gradually decreased. This is particularly true for space steel structures, where most steel pipe members in long-span grid structures need to be strengthened either under load or with incomplete unloading. In the 1960s, O’Sullivan [8] began to study the reinforcement of steel structures under load, and proposed the basic principle for calculating the reinforcement of structures under load. Tafsirojjaman, T. [9,10] studied CFPR reinforced steel members under load. Wei, J. [11] studied reinforcement with steel plate-UHPC under vertical load. Açıkel H. [12] and Bingsheng, H. et al. [13] studied the axial compression performance of the reinforced casing under the load of round steel tubes. The axial compression tests of unreinforced steel tubes, stainless steel hoop tubes and sticky steel tubes were carried out, respectively, and the ultimate bearing capacity of the tubes under different initial stress ratios was obtained. Wang Yuanqing [14] and Jiang Li et al. [15] conducted axial compression and bias tests on I-steel after welding and strengthening under an initial load, simulated the impact of the welding process on the overall bearing capacity through finite element analysis, and verified the feasibility of the indirect thermo-mechanical coupling analysis method for welding thermal analysis. Liu, H. [16,17] and Zhao, X. [18] conducted a test on the reinforcement of welded casing on this basis, followed the thermo-mechanical coupling analysis to simulate the welding process, and obtained the influencing factors and the ultimate bearing capacity formula of welded reinforced steel pipe members under load.
At present, there is little research on the reinforcement of steel pipe members via welding casing under load, and there is also a gap in the research of local reinforcement. In large-span spatial structures, scenarios necessitating the reinforcement of steel tube members under load due to increased loading or reduced cross-sectional integrity are becoming increasingly prevalent. Among them, the residual stress caused by welding has a great influence on the ultimate bearing capacity of thin-walled steel pipe members, and considering that the context of steel tube reinforcement in spatial steel structures often involves high stress ratios, it is imperative to investigate the methods for reinforcing steel tube members under high stress conditions while minimizing the residual stresses. The existing research focuses on low stress ratio scenarios, but the reinforcement mechanism and design method under a high stress ratio (initial stress ratio ≥ 0.6) are still blank. This paper fills the gap in the field through experiments and simulations. Based on the existing research foundation, a new method for strengthening casing welding is proposed in this paper, which is particularly suitable for large-scale space steel structures where load-bearing members often operate under high stress ratios and cannot be fully unloaded. The method can effectively reduce the effect of welding heat on the mechanical properties of steel pipes. The testing and numerical simulation of welded steel pipe members under high load were carried out, and the reinforcement efficiency of local reinforcement at different positions and lengths was studied. The impact of different factors on the ultimate bearing capacity of the members was compared and analyzed, validating the feasibility of this method for high-load reinforcement. An empirical formula for the ultimate bearing capacity of steel pipe members under this strengthening method is presented, which provides a reference for practical engineering applications.

2. Experimental Scheme

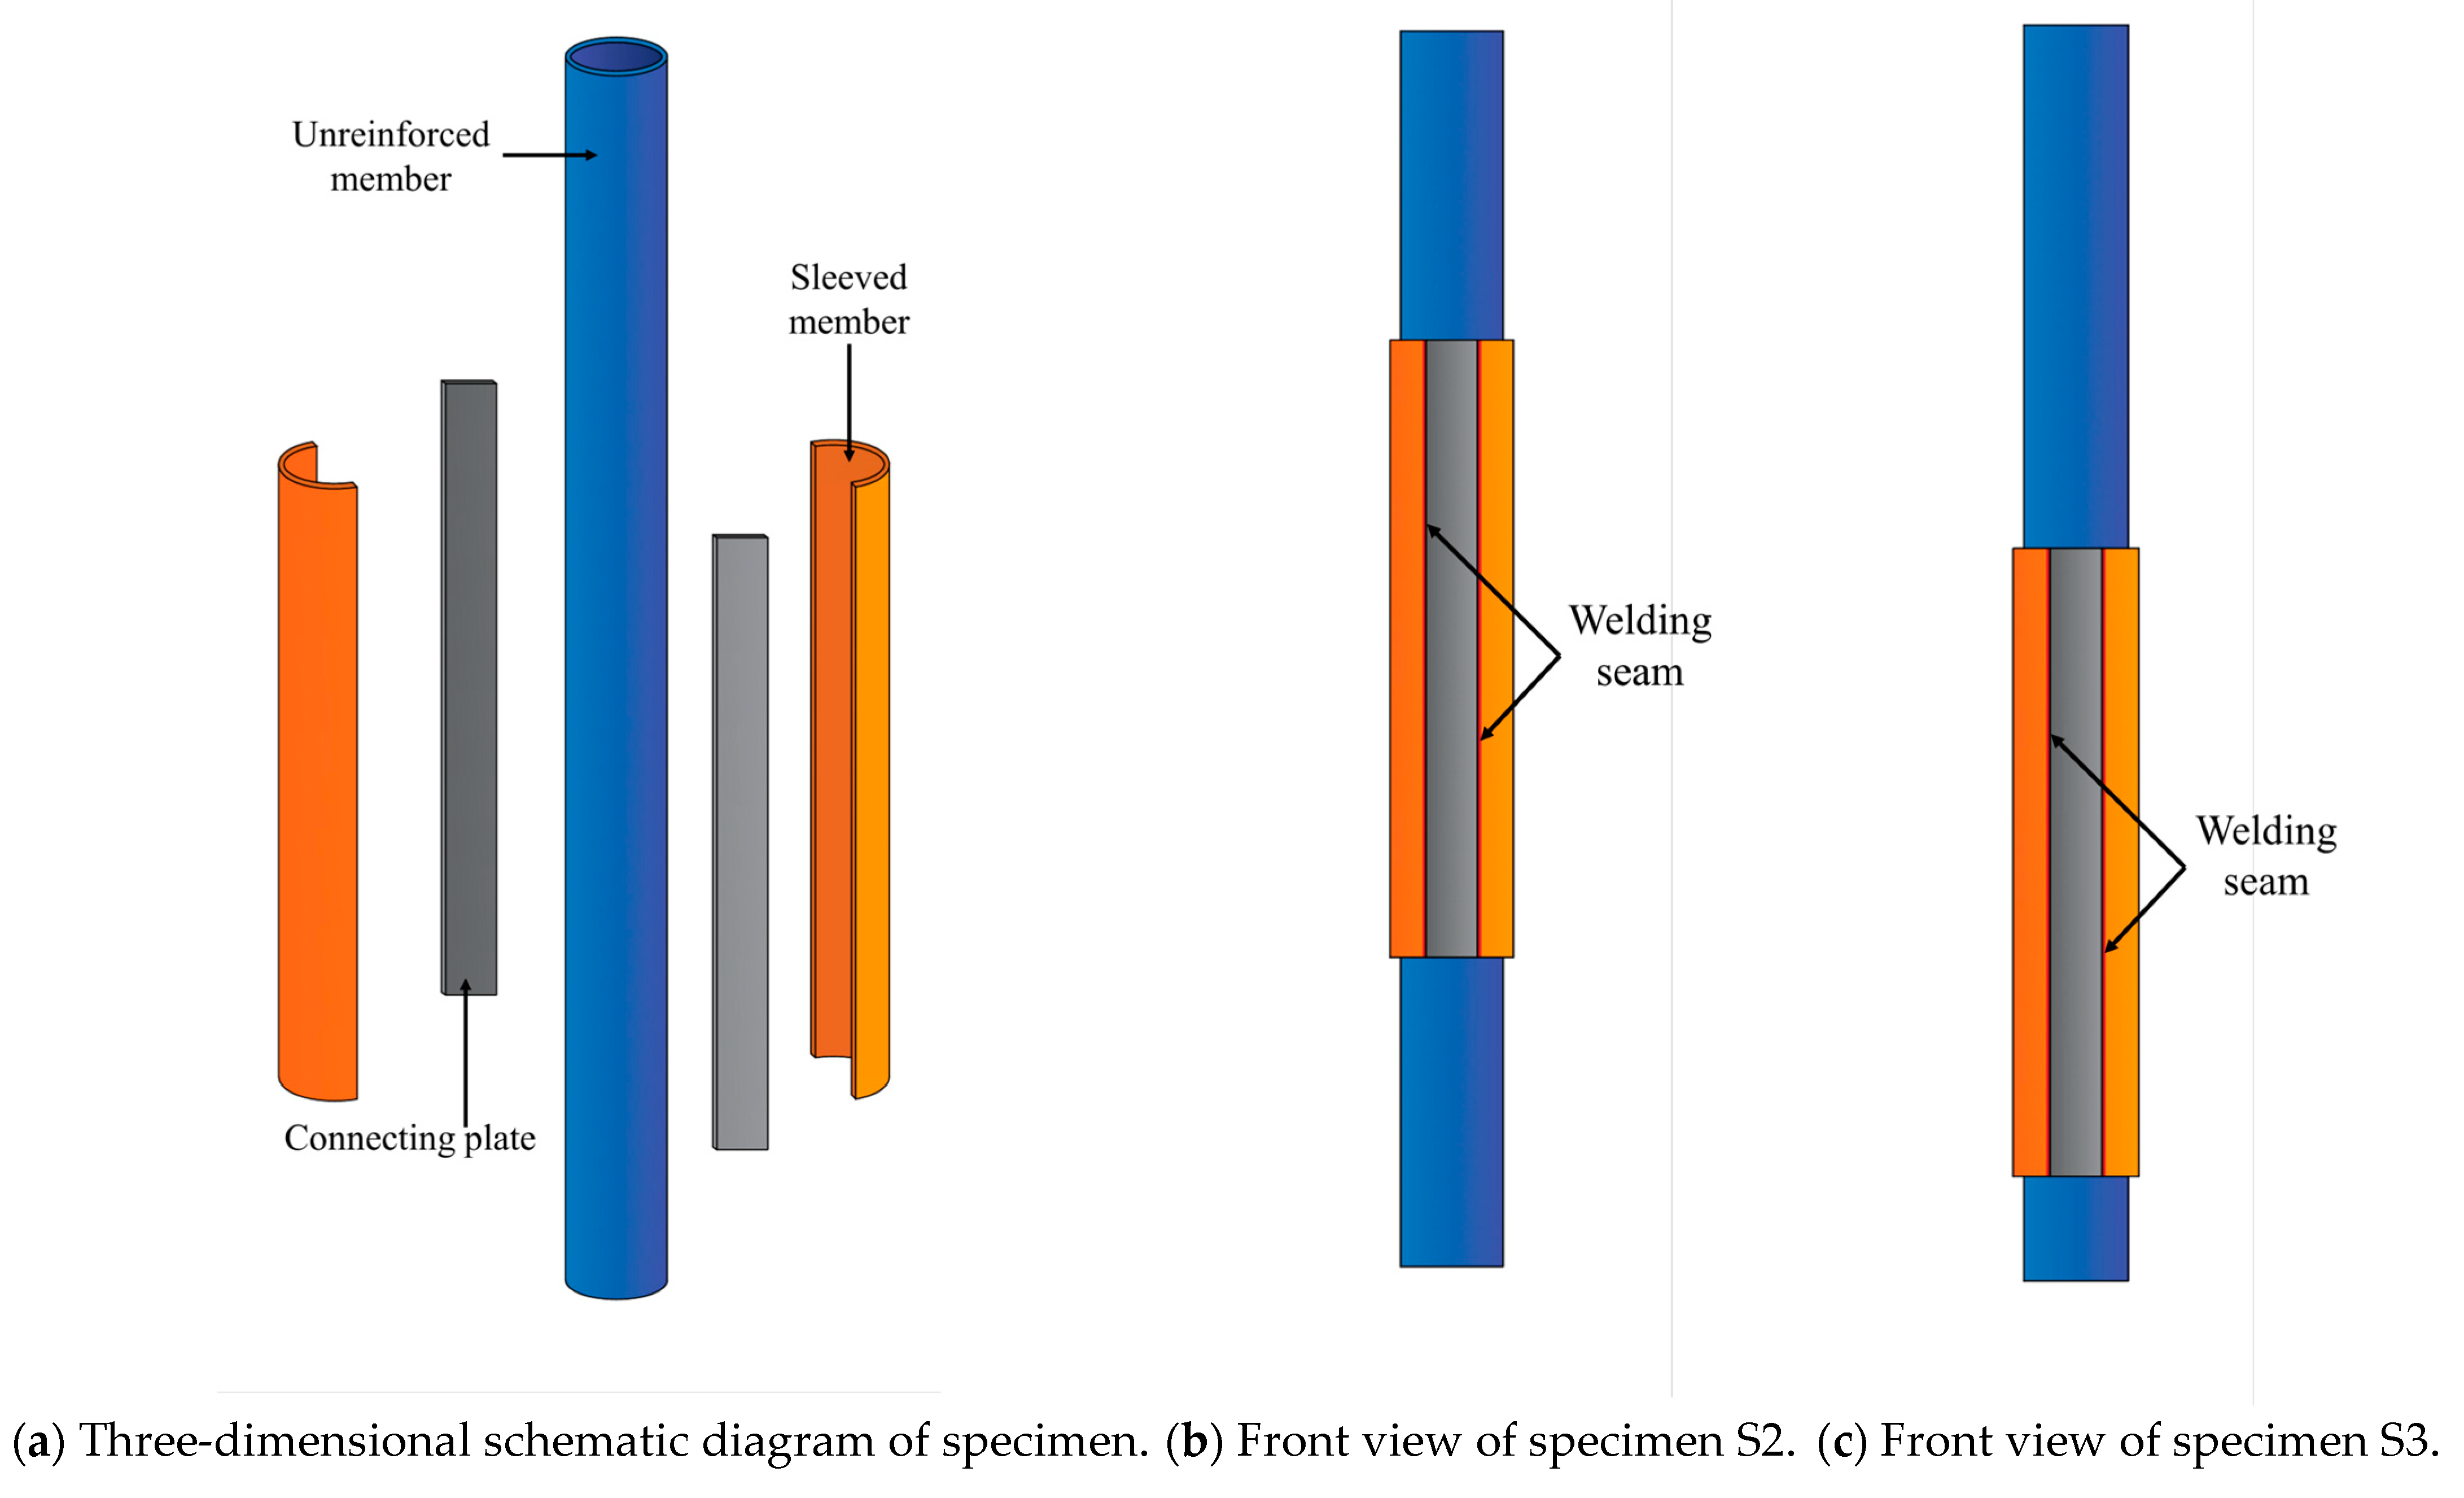
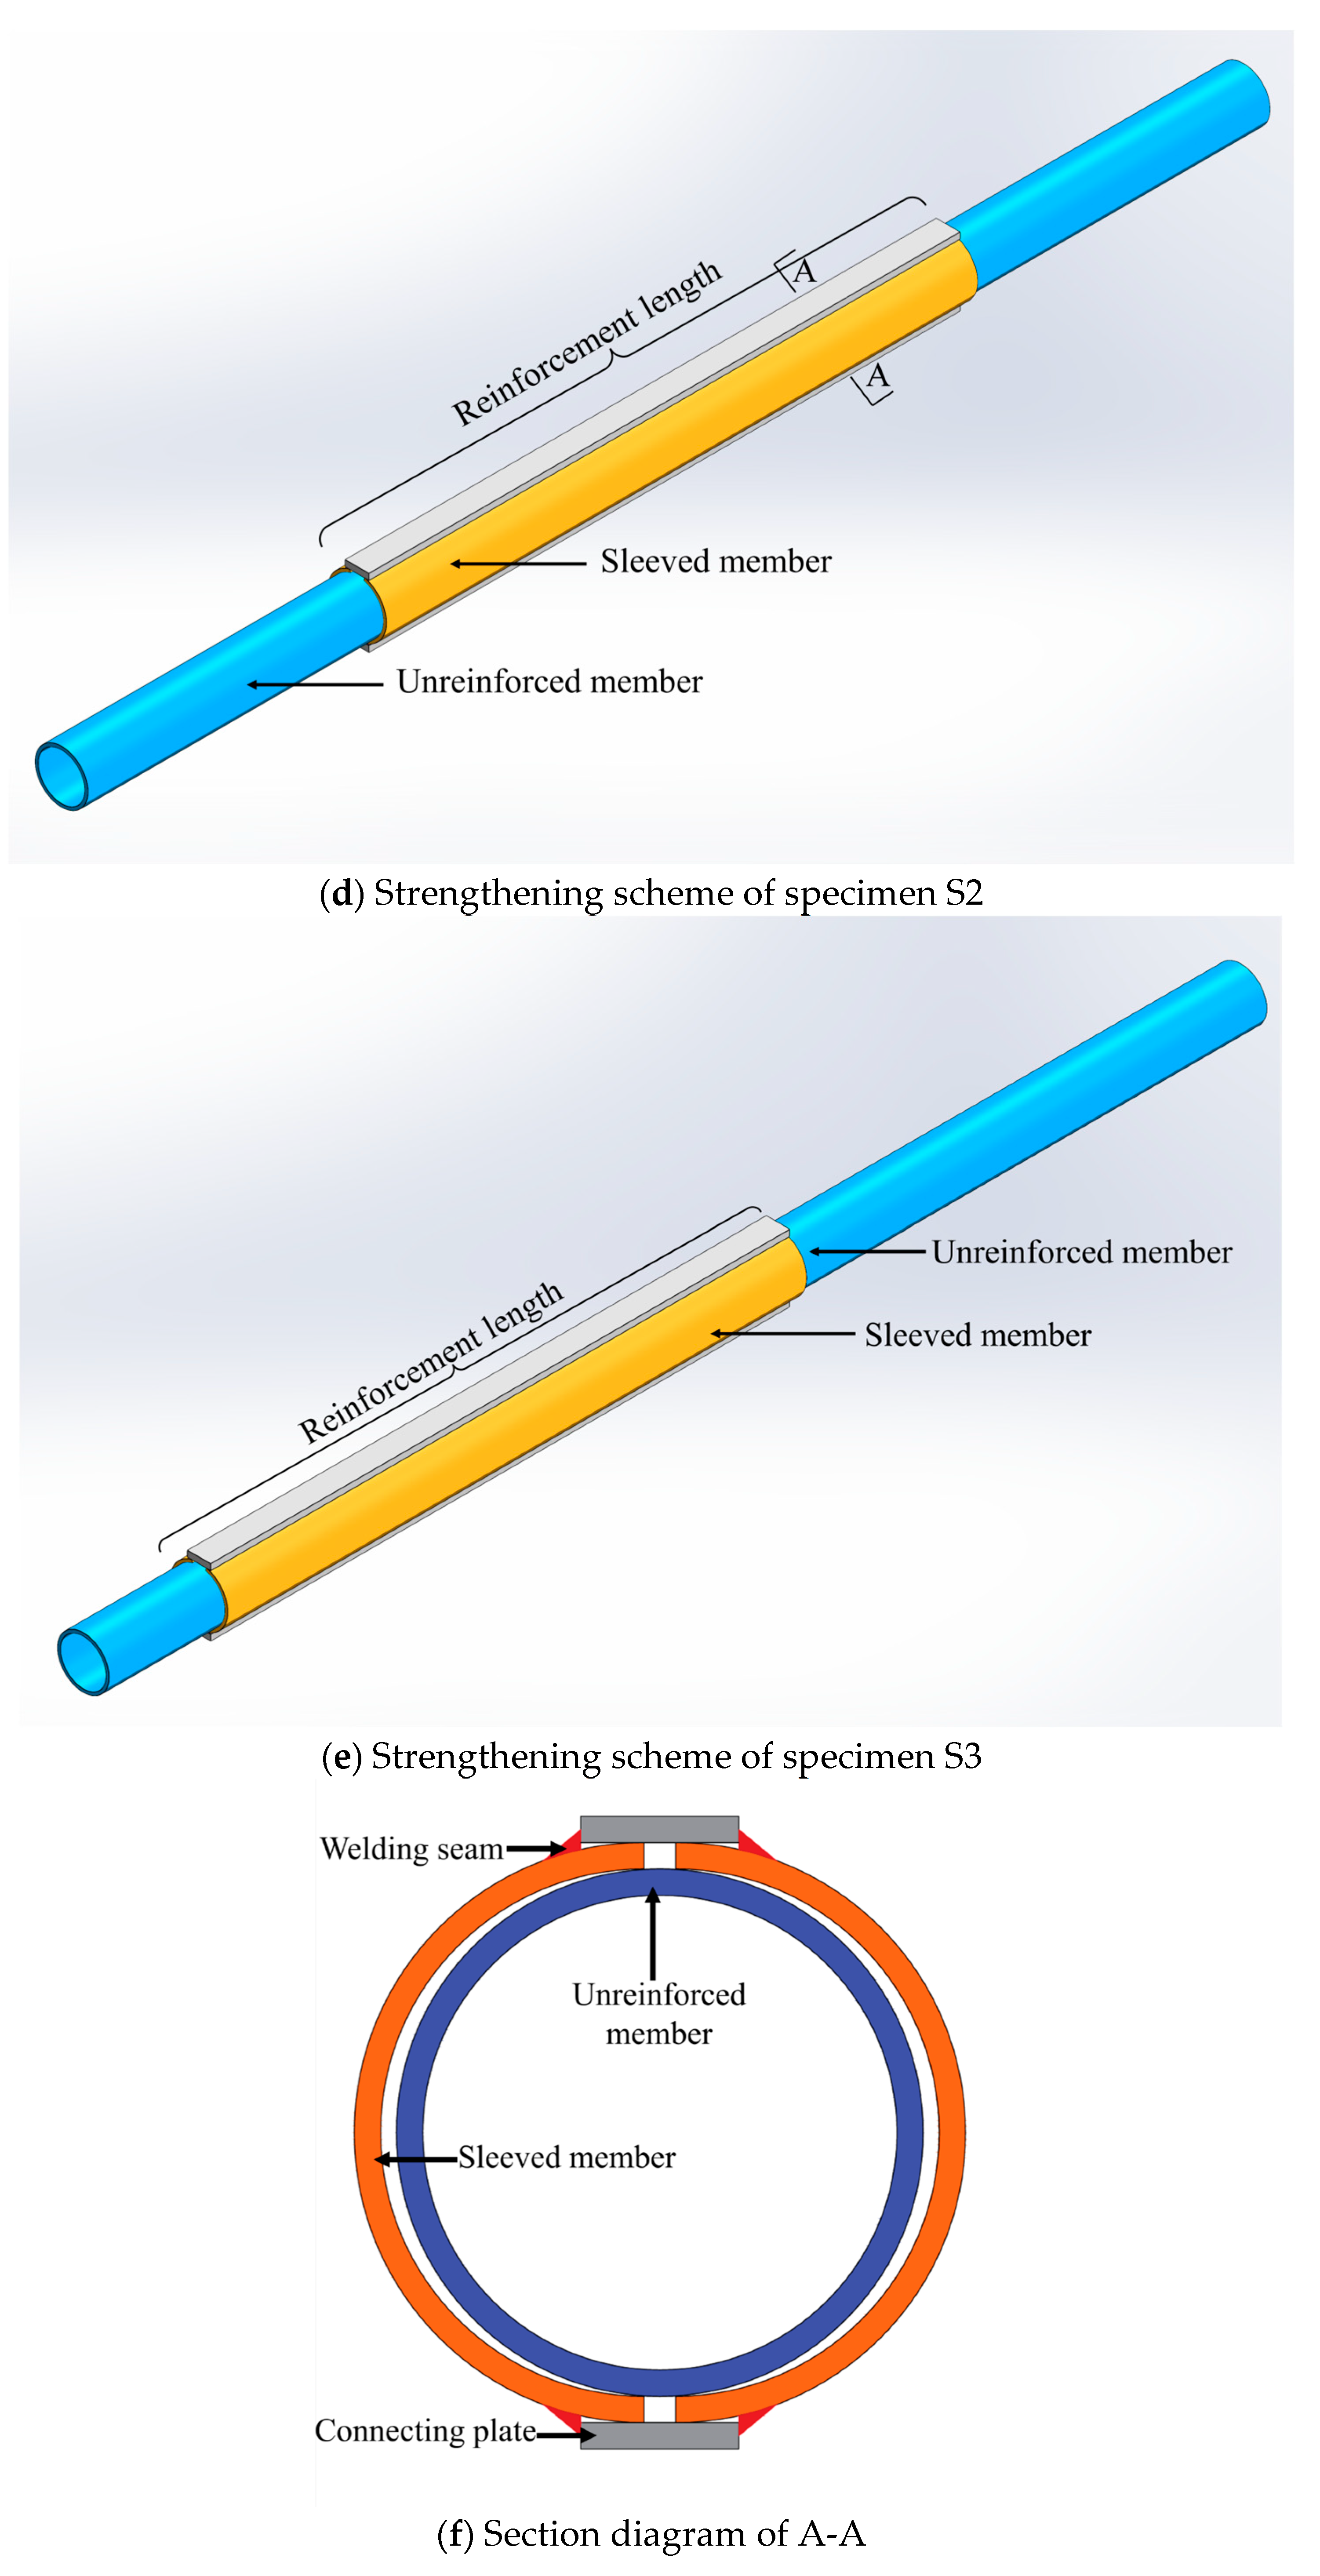
2.1. Specimen Design

According to the specifications of round pipes commonly used in engineering, three components were designed in the test, whose numbers are S1, S2, and S3, respectively. Steel pipes measuring Φ89 × 5 mm were used as reinforced parts, and Φ89 × 5 mm steel pipes were also used as sleeved parts. The reinforcement diagram of specimens is shown in Figure 1. S1 is an unreinforced steel pipe, S2 was reinforced in the middle span of the steel pipe, and S3 was reinforced at the bottom of the steel pipe. In order to prevent the thermal effect generated during reinforcement from directly welding on the reinforced steel pipe, causing stress concentration of the reinforced part and then affecting the stiffness and bearing capacity of the whole member, the sleeved part and the connecting steel plate were reinforced via welding (arc welding) in this test. After the welding and cooling, the reinforced part naturally shrank and tightened the reinforced round steel pipe. Unlike the traditional welding methods that directly apply heat to the reinforced member, this method eliminates residual stress accumulation in the unreinforced member.
In order to study the bearing capacity of the steel tube after reinforcement under load and the influence of different reinforcement positions on the reinforcement performance, the three designed specimens were all subjected to an axial load. The detailed designs of each specimen are shown in Table 1. Among them, the height of the reinforced part was 2.0 m, the height of the reinforced part was 1.0 m, the steel grade was Q345, the distance between the loading plate and the testing machine support was 200 mm, and the cross-section of the round steel tube was Φ89 × 5 mm.

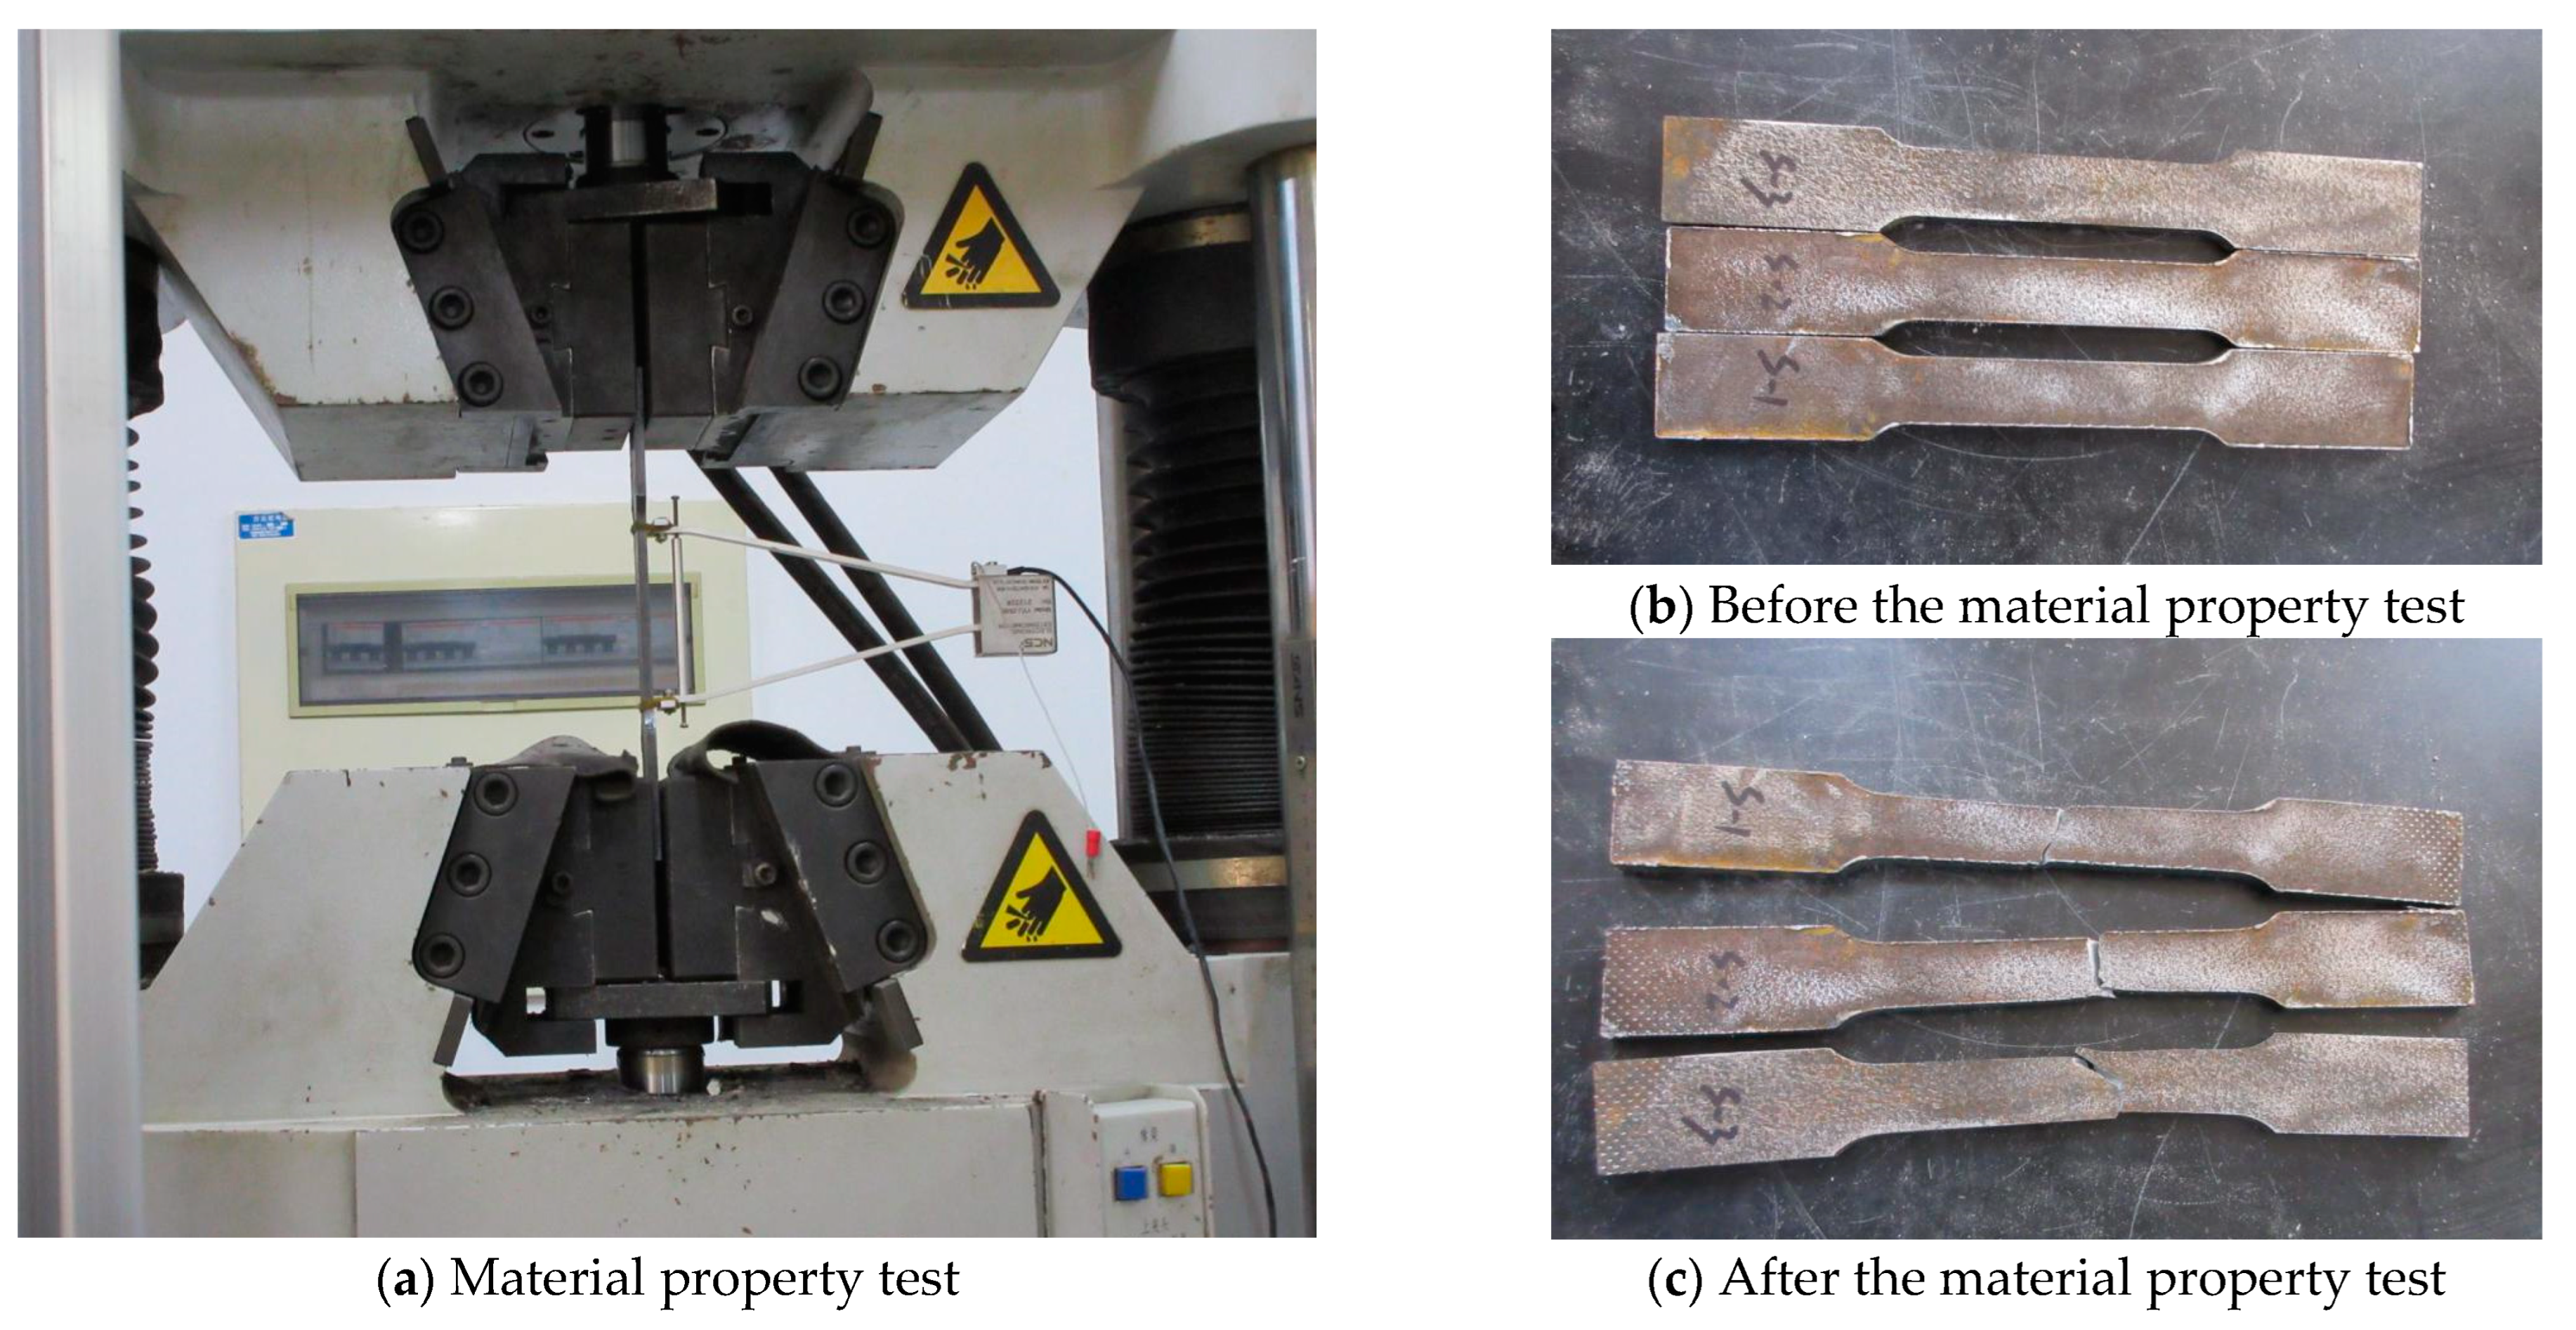
2.2. Material Property Test
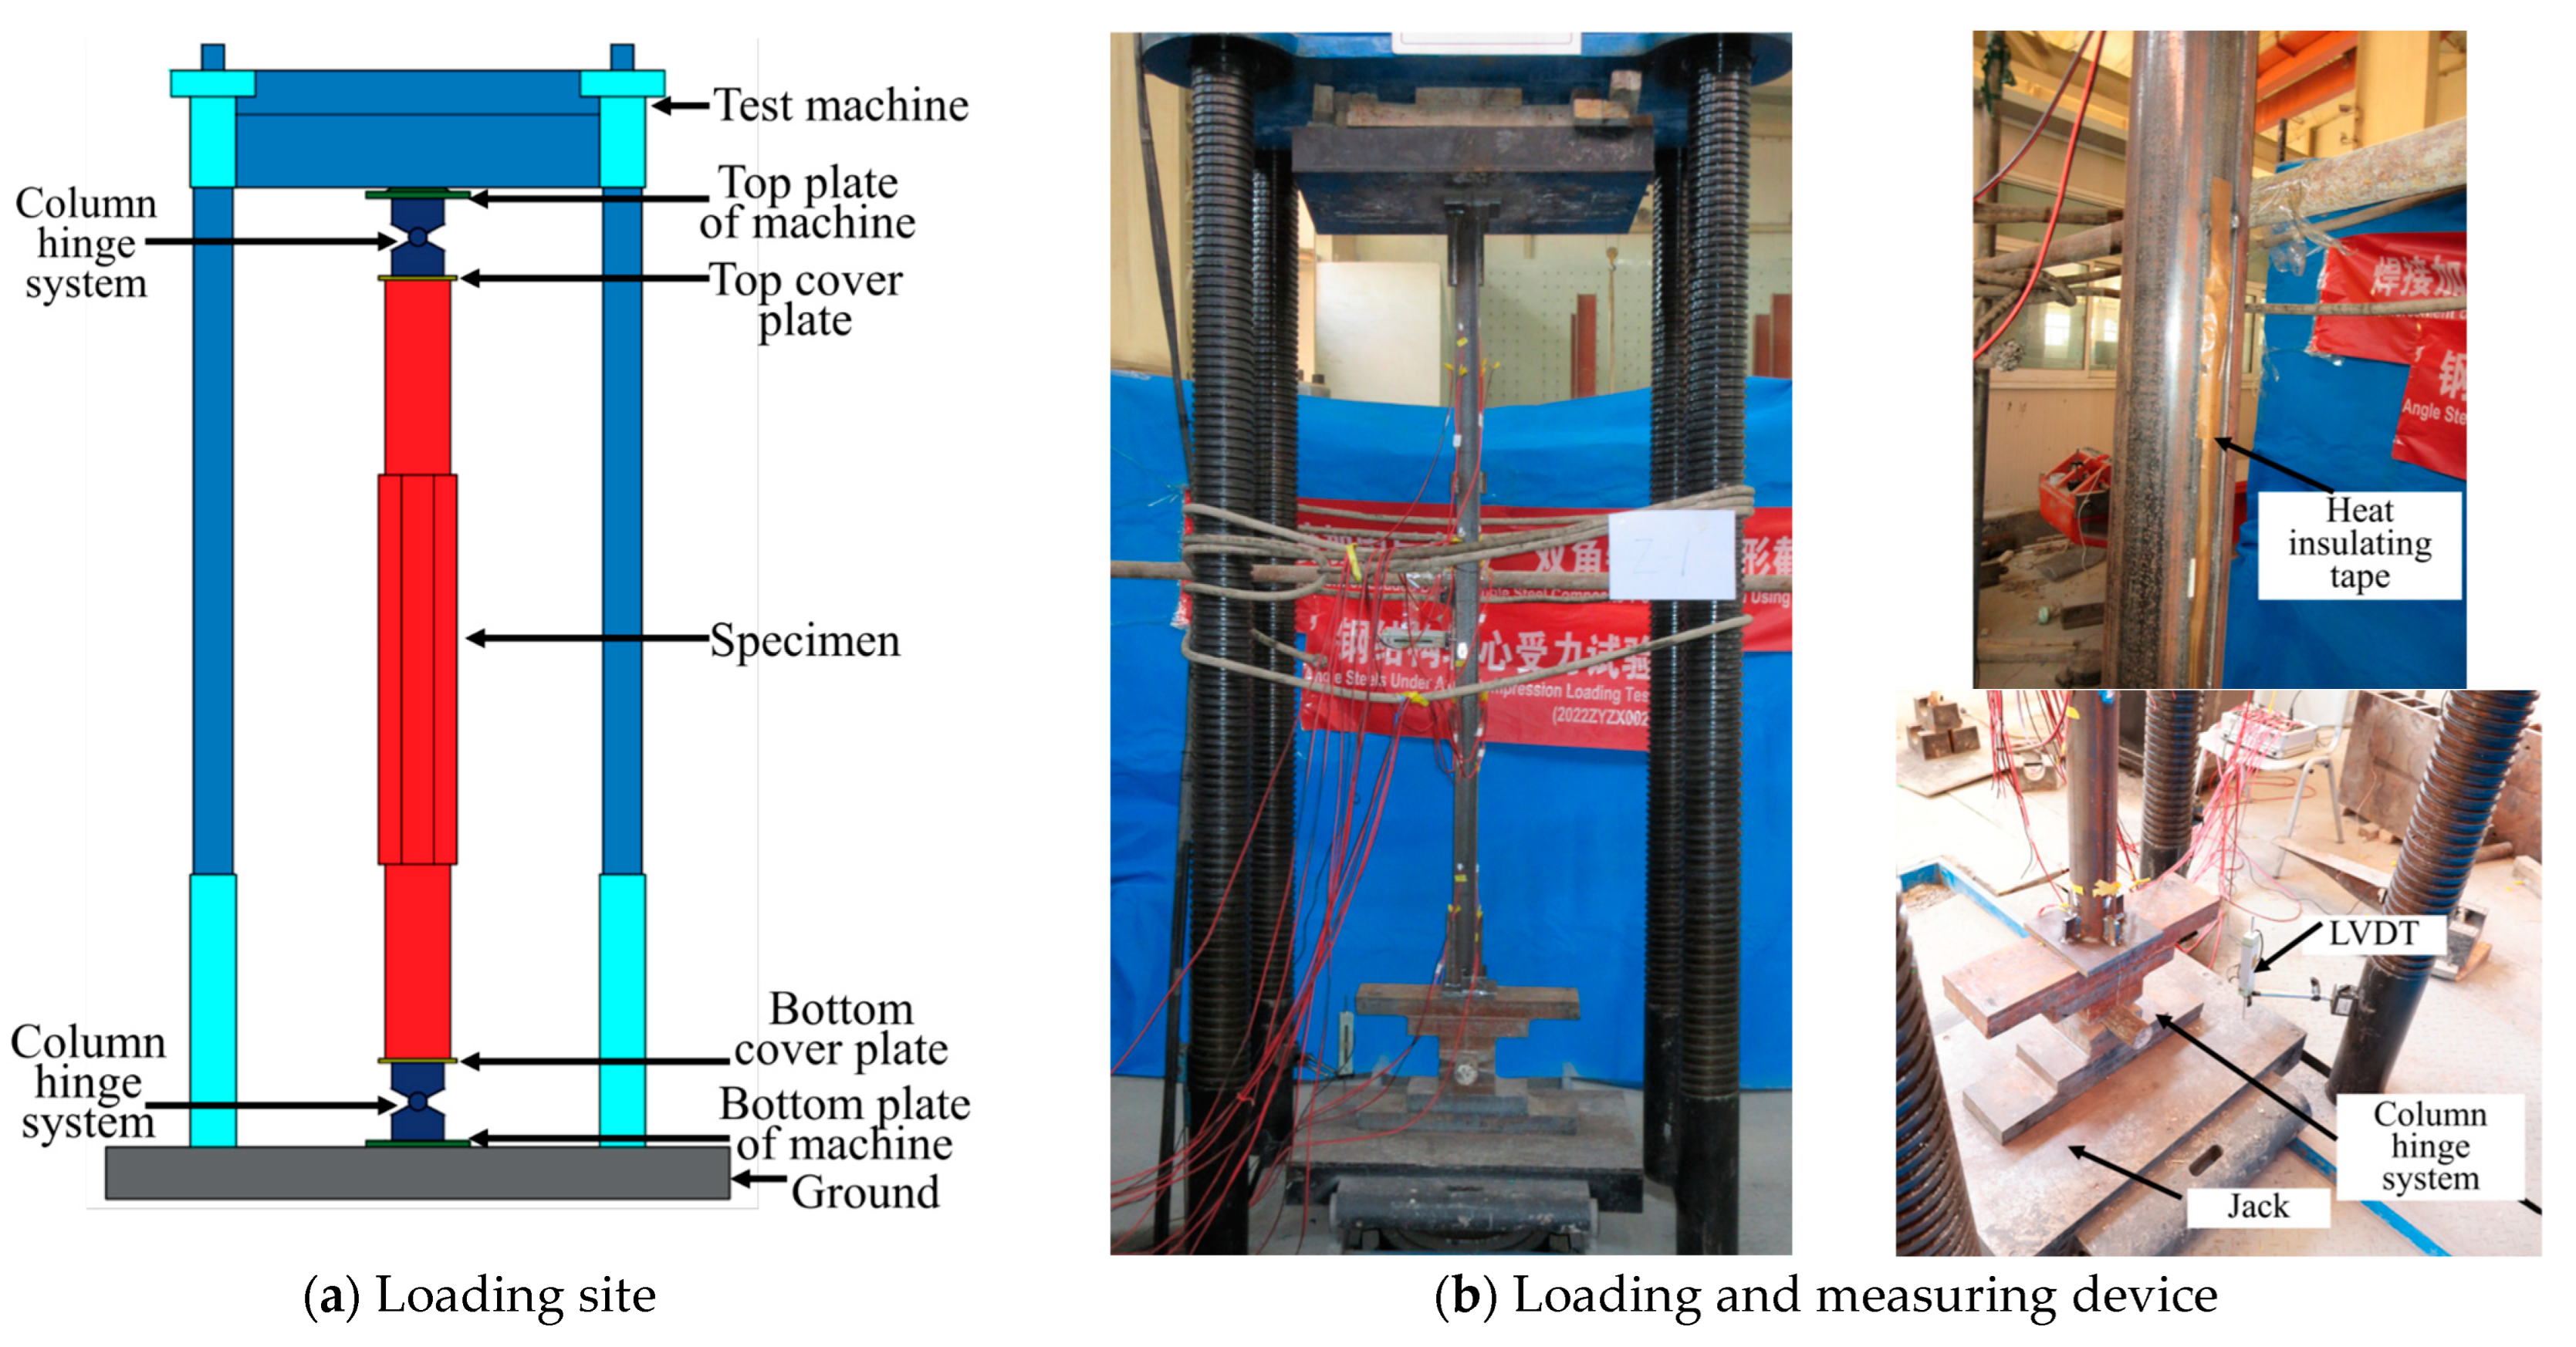
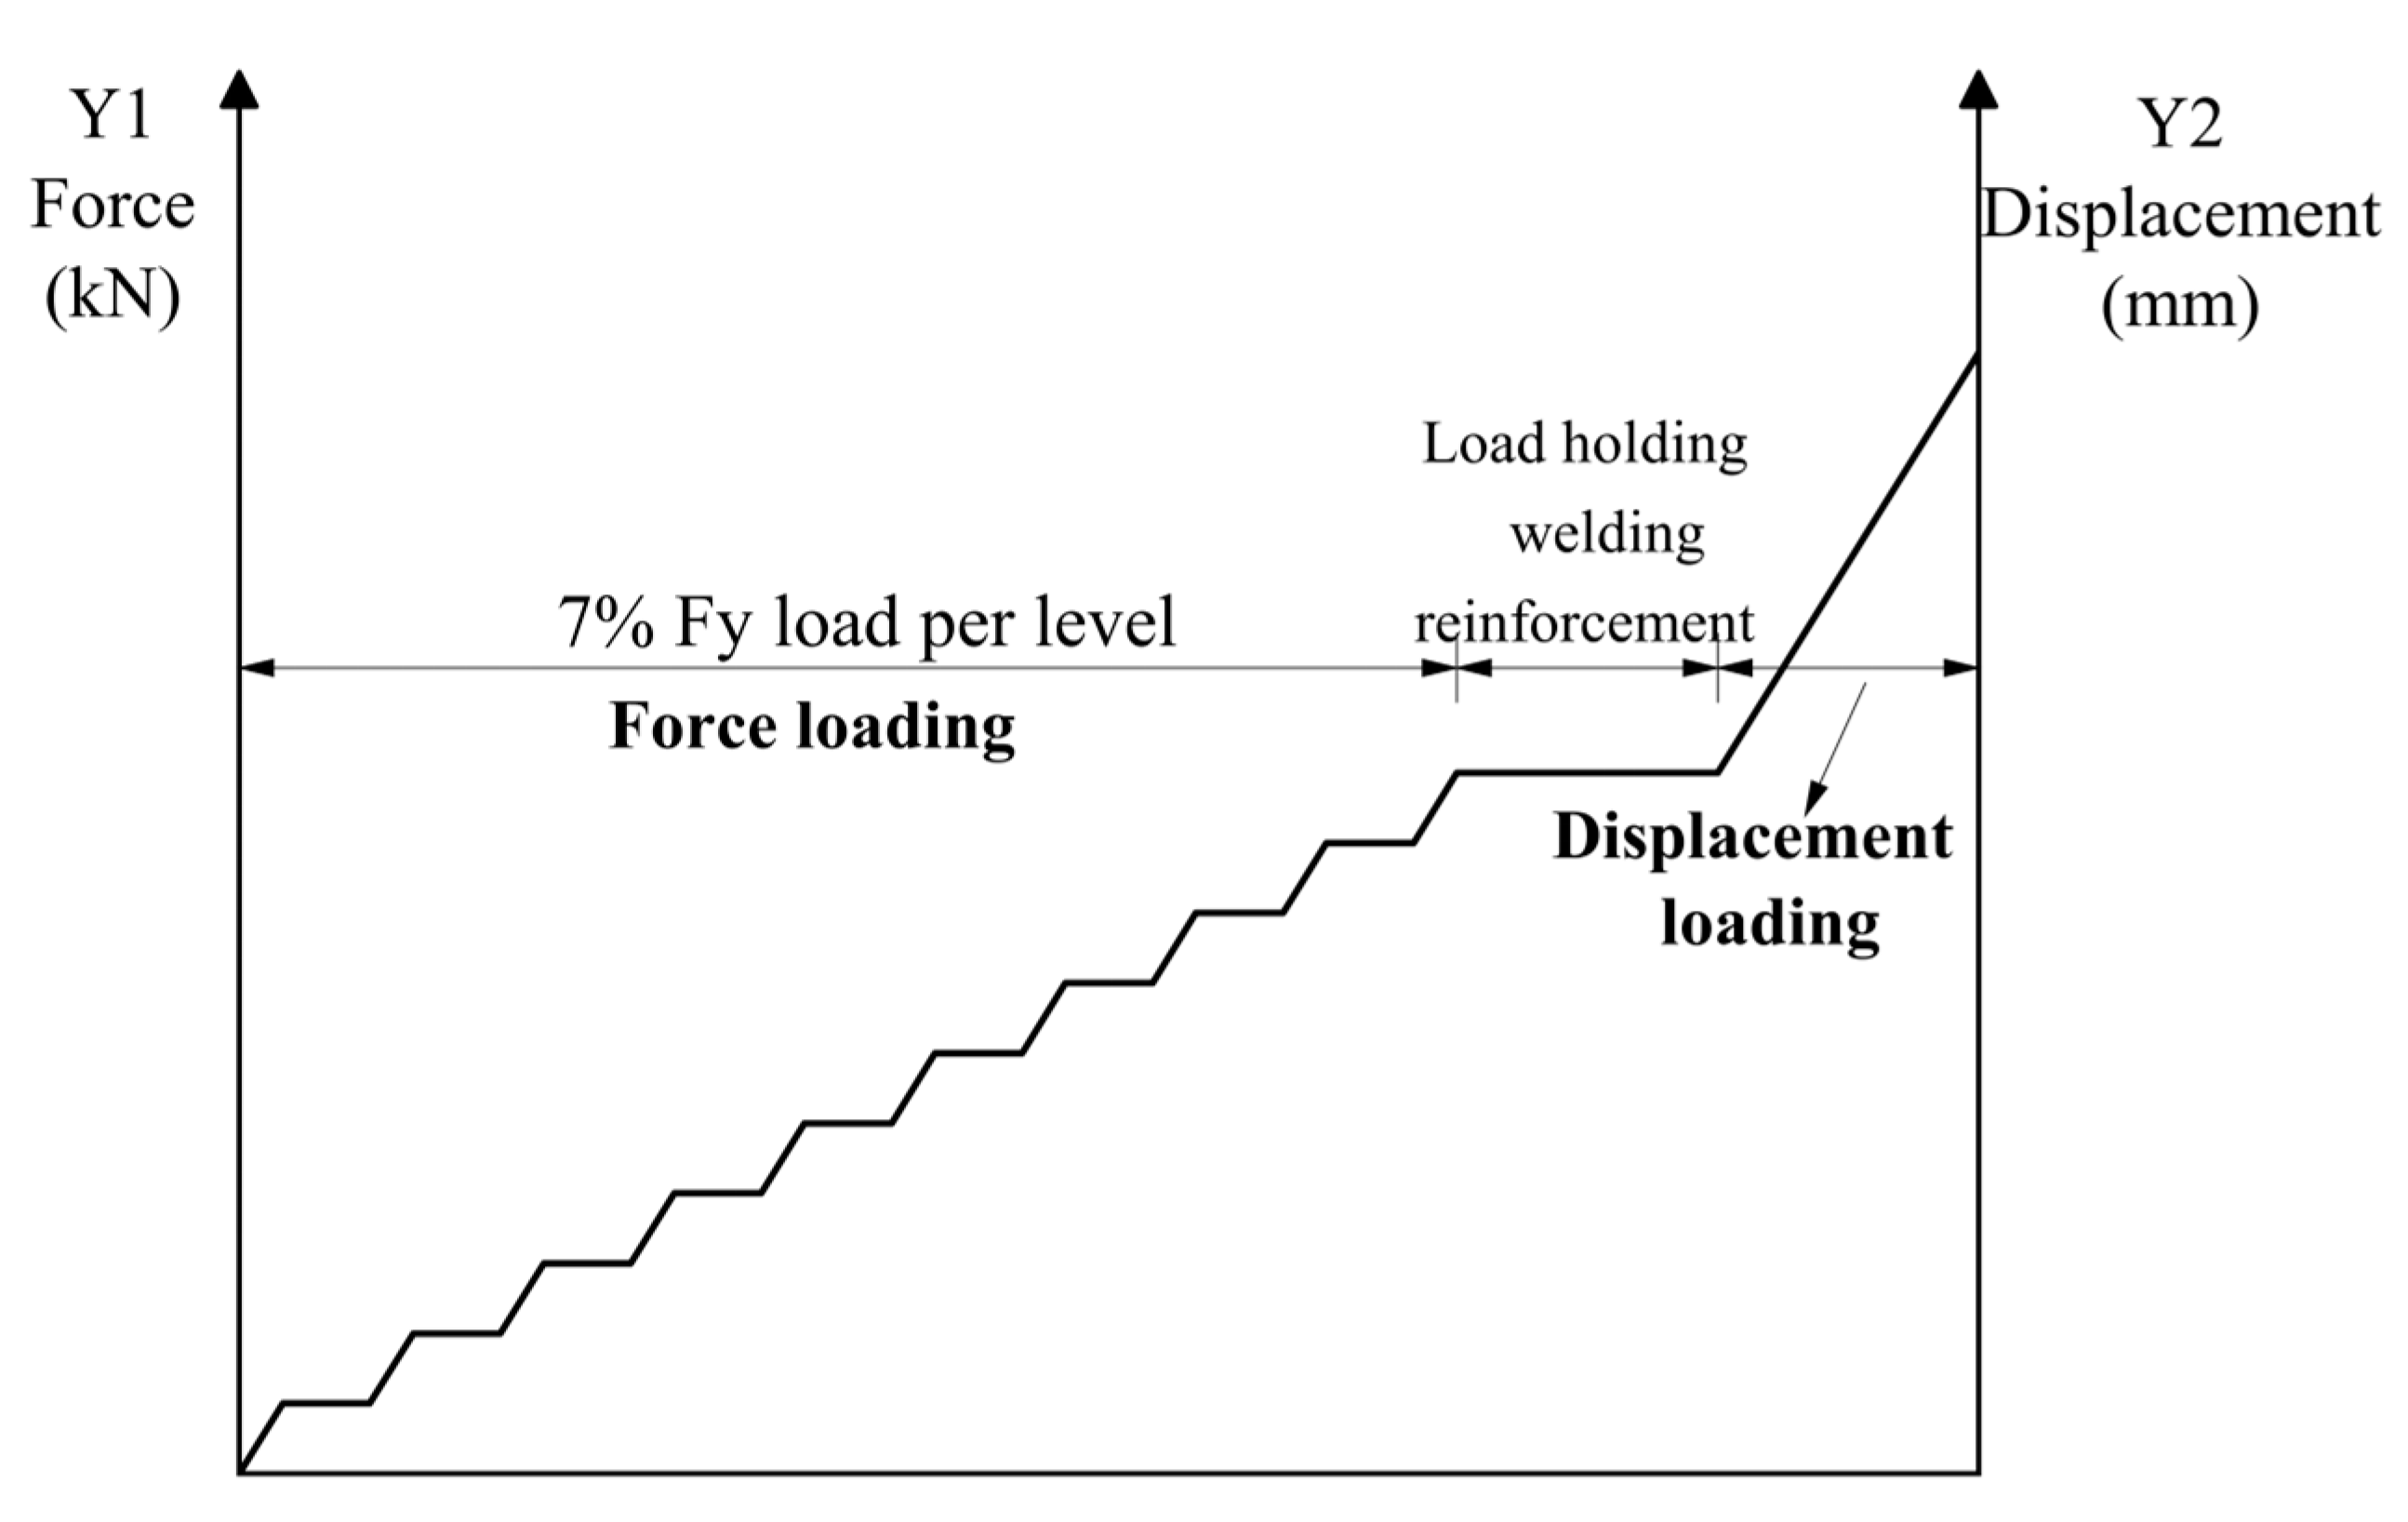
The sample was extracted from the round steel tube used in the test, and the standard static tensile specimen was prepared from it. Through a static tensile test at the normal temperature, the mechanical properties at the normal temperature (20 °C) were obtained. The material test member is shown in Figure 2, and the stress–strain curve of the material specimen is shown in Figure 3. The average values of the final steel material property parameters were taken from the results of the three specimens, and the results are shown in Table 2, where E represents the elastic modulus, fy represents the yield strength, fu represents the ultimate tensile strength, εs represents the corresponding strain at yield, εst represents the strain at the terminal yield platform, and εu represents the ultimate strain at fu.

2.3. Loading Scheme

The test used a 500-ton microcomputer-controlled electro-hydraulic servo press for axial compression loading. The loading procedure involved initial force control followed by displacement control, ensuring that the loading rate remained below 5 kN/min. The loading test sequence was as follows: (1) Apply the initial load and hold it. (2) Perform welding reinforcement and allow the specimen to cool to room temperature. (3) Continue monotonic loading until the specimen fails. When the load reached 70% of the expected bearing capacity of the member, the displacement control hydraulic press was used to provide continuous loading until the member failed. The test loading device is shown in Figure 4. The specific loading values used in the test are shown in Figure 5.

2.4. Test Point Arrangement

Considering the failure position of the member and the work of the strain gauge during the reinforcement process, the strain gauge was arranged longitudinally along the span and quarter section of the steel pipe of the strengthened part and the strengthening part, and at the same time in the outer span of the connecting steel plate. The strain gauge arrangement is shown in Figure 6. The horizontal displacement sensor was arranged in the span of the specimen to measure the lateral deformation of the whole specimen. The vertical displacement sensor was arranged on the loading platform of the testing machine to measure the axial deformation of the specimen caused by the external load.

3. Test Results and Analysis

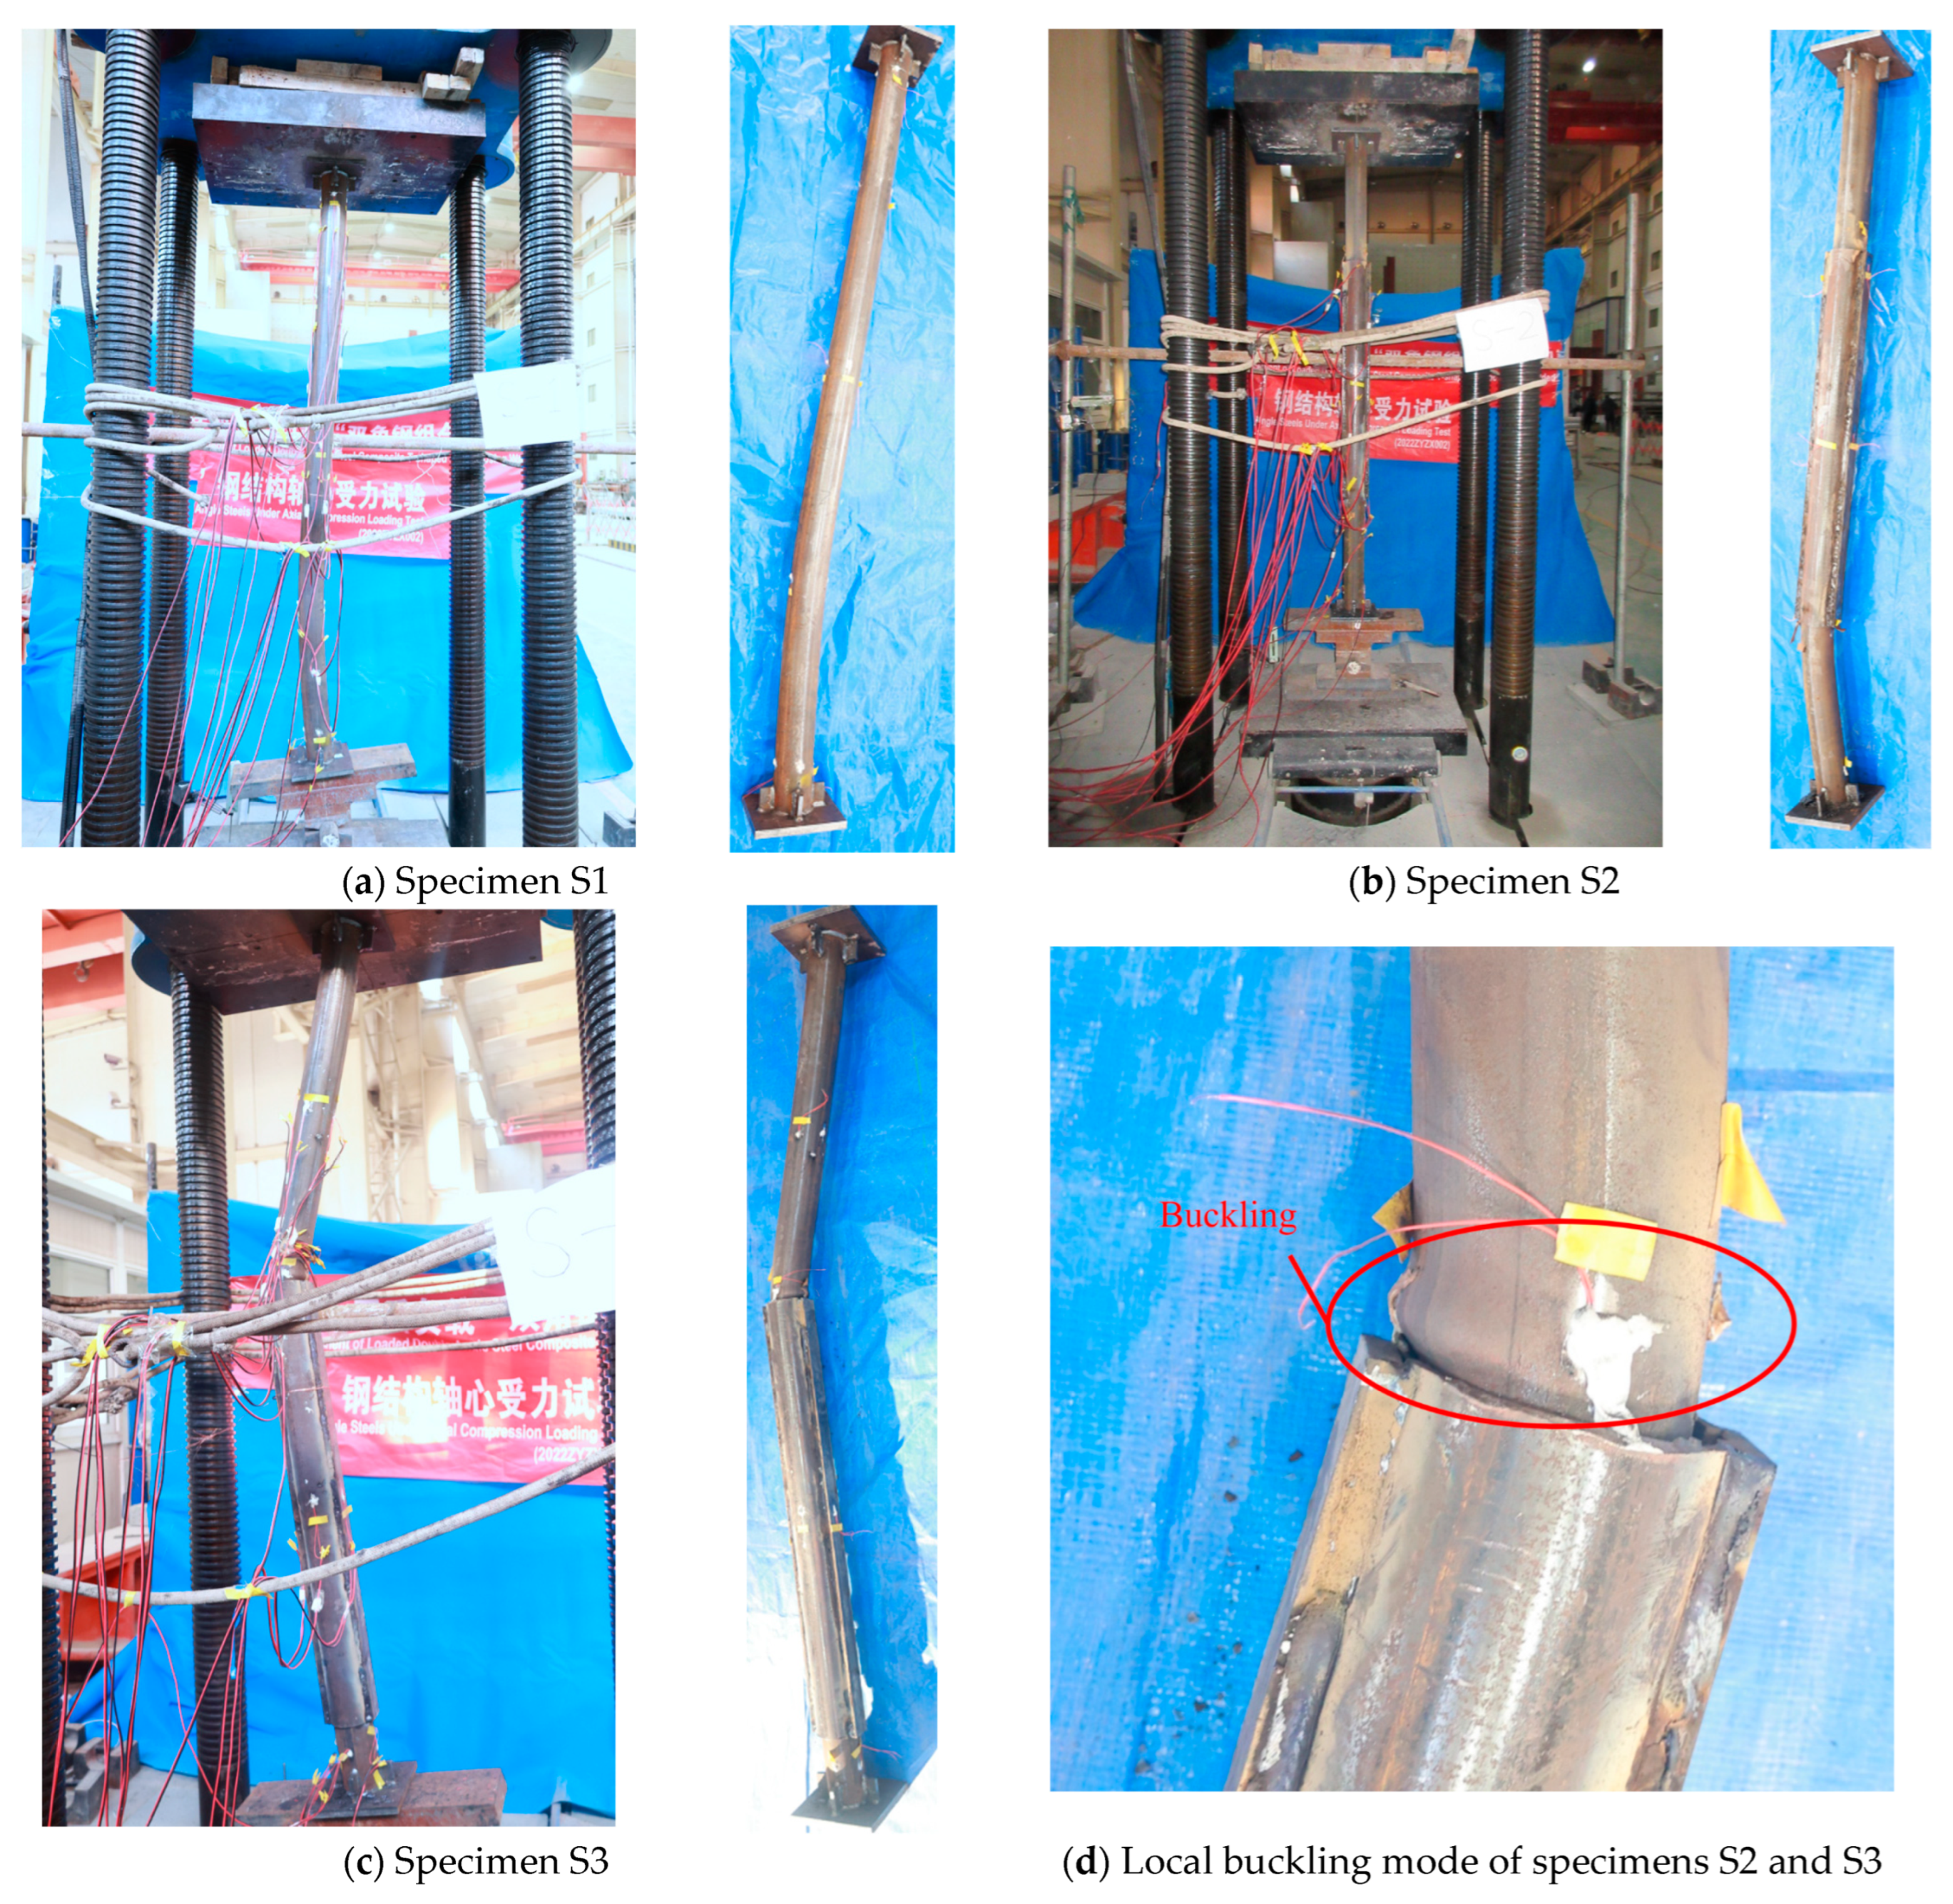
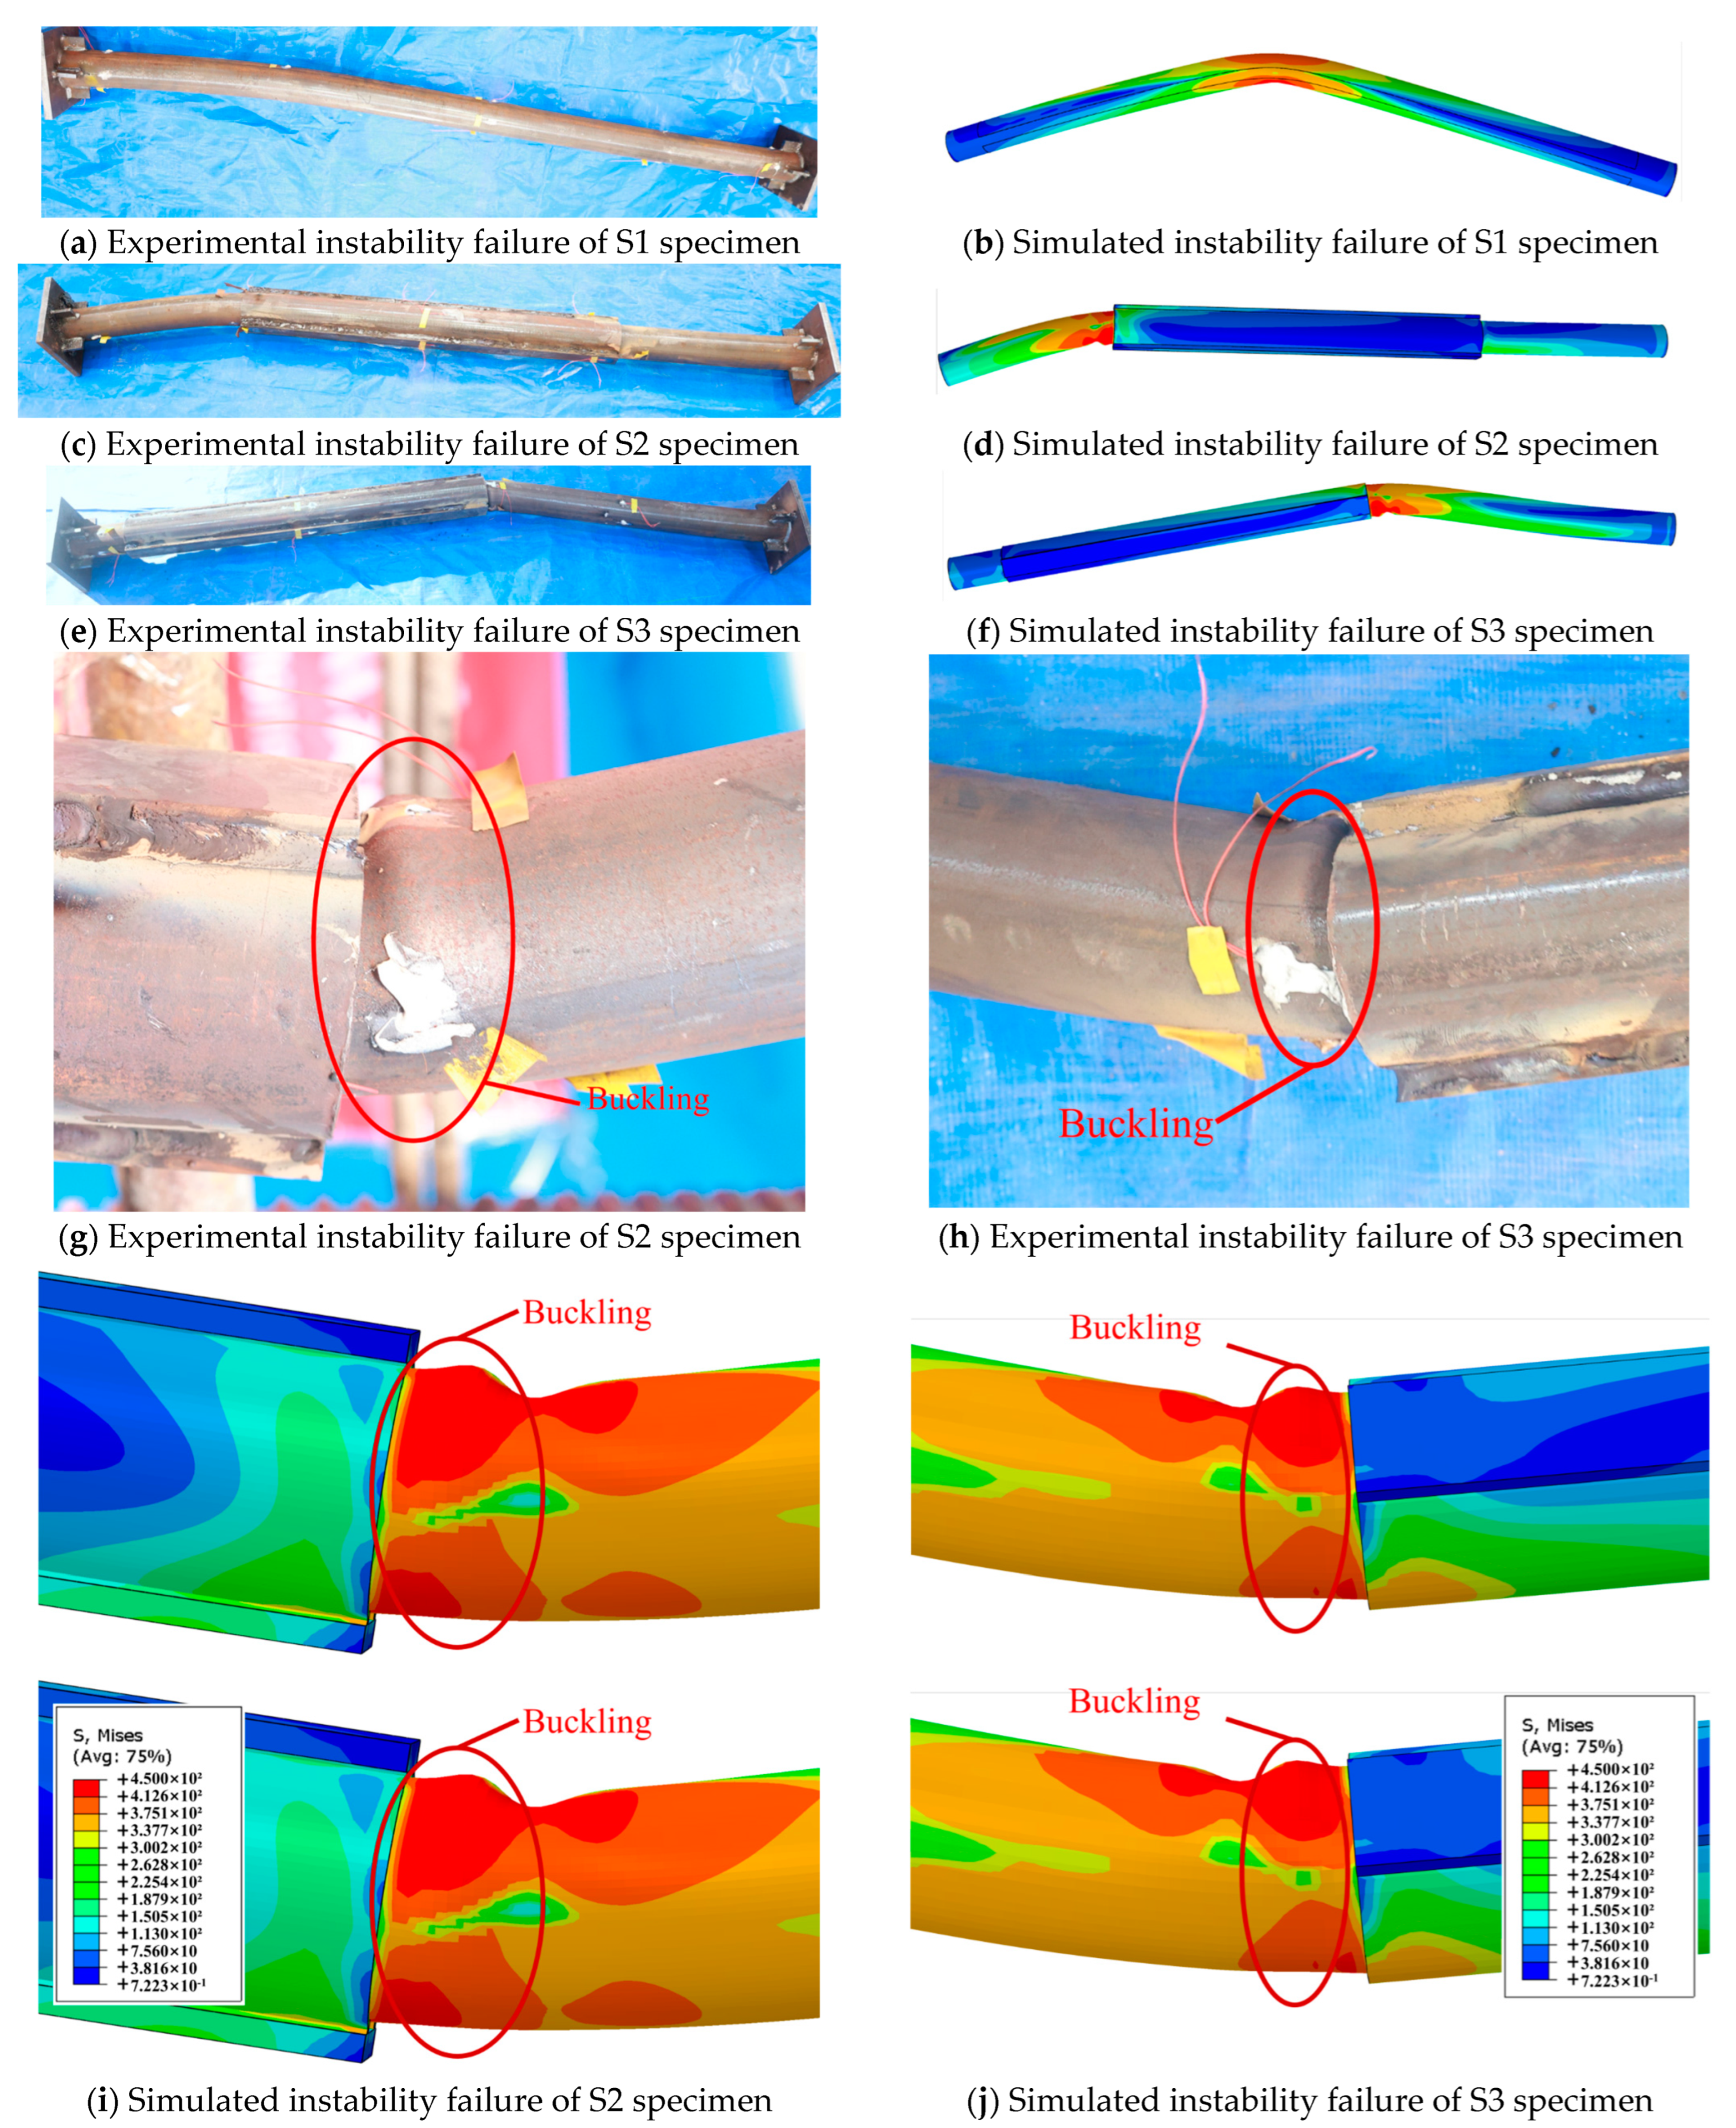
3.1. Phenomenon of Destruction

Figure 7 shows the failure patterns of each specimen. As can be seen from the figure, the unreinforced specimen S1 exhibited overall instability. In contrast, specimens S2 and S3 showed local buckling on the side that was locally reinforced [19]. After local buckling, the reinforced steel pipes experienced overall instability, but no obvious deformation was observed in the reinforced areas. The failure position for the unreinforced specimen (S1) occurred at the lower part of the entire span, while the failure position for specimens S2 and S3 was on the locally reinforced side.

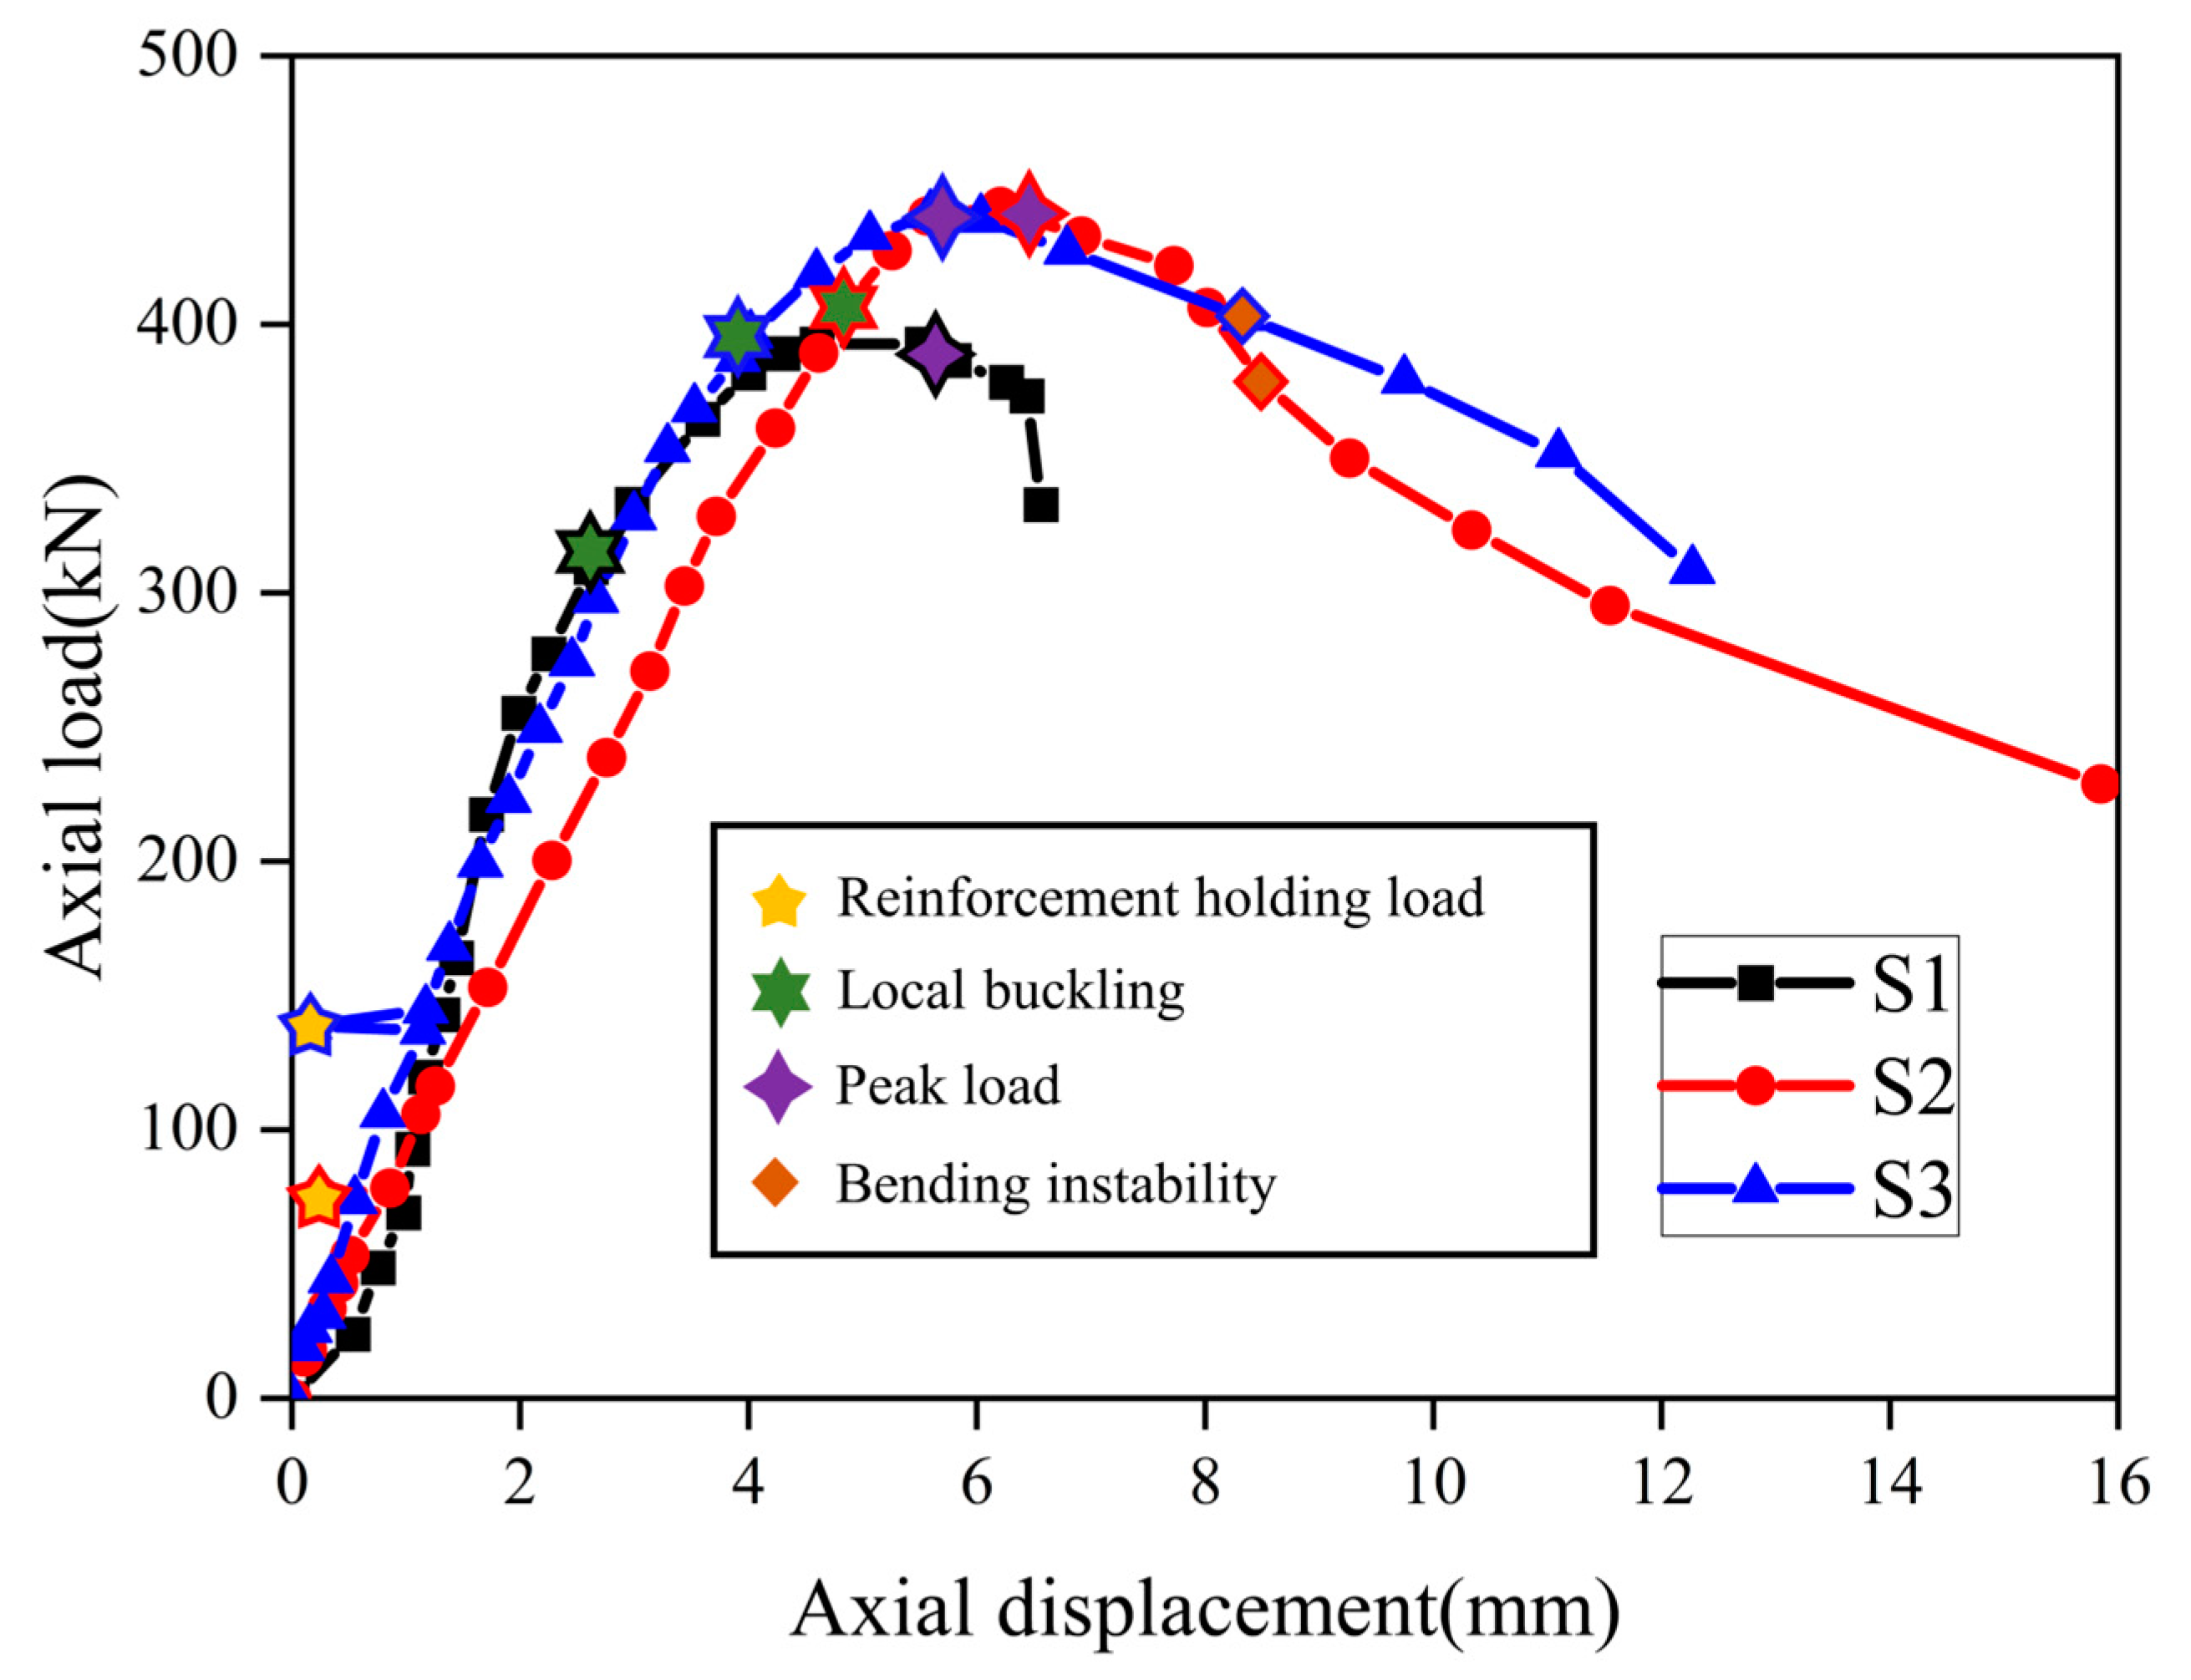
3.2. Carrying Capacity Analysis

The ultimate bearing capacity of the specimens is shown in Table 3, and the comparison of load–axial displacement curves is shown in Figure 8. The load level represents the ratio of the axial load during on-load welding to the ultimate bearing capacity of the specimen without reinforcement. The test results show that the reinforcement can effectively improve the axial bearing capacity of the steel pipe under load, but the different locations of local reinforcement have no significant effect on the bearing capacity. With the increase in the initial stress ratio, the bearing capacity decreases slightly, and both the high stress ratio and low stress ratio can effectively improve the performance of the member and increased the ultimate bearing capacity of the member. In the test, when the initial stress ratio increased from 0.384 to 0.668, the ultimate bearing capacity decreased by less than 10%, which proved that the welding reinforcement is controllable under high loads. Because the area ratio between the strengthened specimen and the strengthening specimen is 100%, and the overall slenderness ratio of the specimen is small, the ultimate bearing capacity of the reinforced specimen undergoes a moderate increase. The unreinforced component, S1, presents sudden failure after instability, while the reinforced components, S2 and S3, present a tendency of delayed failure after instability. Because the welding action does not directly act on the reinforced member, the axial stiffness of the specimen decreases slightly, and the welding under load causes fluctuations in the axial force condition, but has basically no effect on the axial displacement. The reinforced specimens are capable of maintaining a certain bearing capacity subsequent to instability failure and still possess post-failure stiffness.

3.3. Strain Variation Analysis

Figure 9 shows the loading strain curve by reading the data of the nearest strain gauge across the mid-distance failure location and the strain gauge at the non-yield section. In S1, points 5 and 6 are the strain gauge closest to the failure position, of which point 5 is the tension side and point 6 is the compression side, and points 8 and 10 are the non-yield section, of which point 8 is the tension side and point 10 is the compression side. In the S2 specimen, the strain gauge is nearest to the failure position at points 4 and 5, of which point 4 is the tension side and point 5 is the compression side, and points 12 and 13 are the non-yielding section, of which point 12 is the tension side and point 13 is the compression side. Specimen S1 is an unreinforced specimen. Due to the initial defects, the strain changes of the component conform to the typical buckling failure mode under axial pressure. Before the failure of the member, all points of the steel pipe are subjected to pressure. After reaching the ultimate bearing capacity, the compressive stress side strain increases, and the tensile stress side strain decreases gradually. The failure position of the S2 and S3 specimens occurred in the unreinforced area, and the strain at the buckling position was similar to that of S1.
Figure 10 shows the strain gauge data for reading the same points of the reinforcement part of S2 and the reinforcement part. Points 12, 13, 9, and 11 of S2 are strain gauges at the same point in the reinforcement section, of which strain gauges 9 and 11 are located on the connecting steel plate of the reinforcement member, strain gauges 12 and 13 are located on the reinforced steel pipe, and points 12 and 9 are the tension side. The 13 and 11 points are the pressure side. As can be seen from the above, the failure position of the S2 and S3 specimens occurred in the unreinforced section, and the reinforced section region was still in the co-working state. Because the reinforced round steel pipe is not directly affected by the welding heat, the residual stress is not obvious in the welding reinforcement. The strain of the reinforced part in the welding section fluctuates. After welding, the strain of the strengthened part and the strengthening part keeps the same trend with time, and the strain growth is almost the same, which indicates that after the welding connection, the two parts are jointly stressed, and the deformation is well coordinated. The larger initial load will cause the strain difference between the strengthened part and the strengthened part to increase, and the utilization rate of the reinforced part will slightly decrease.

4. Numerical Simulation Analysis

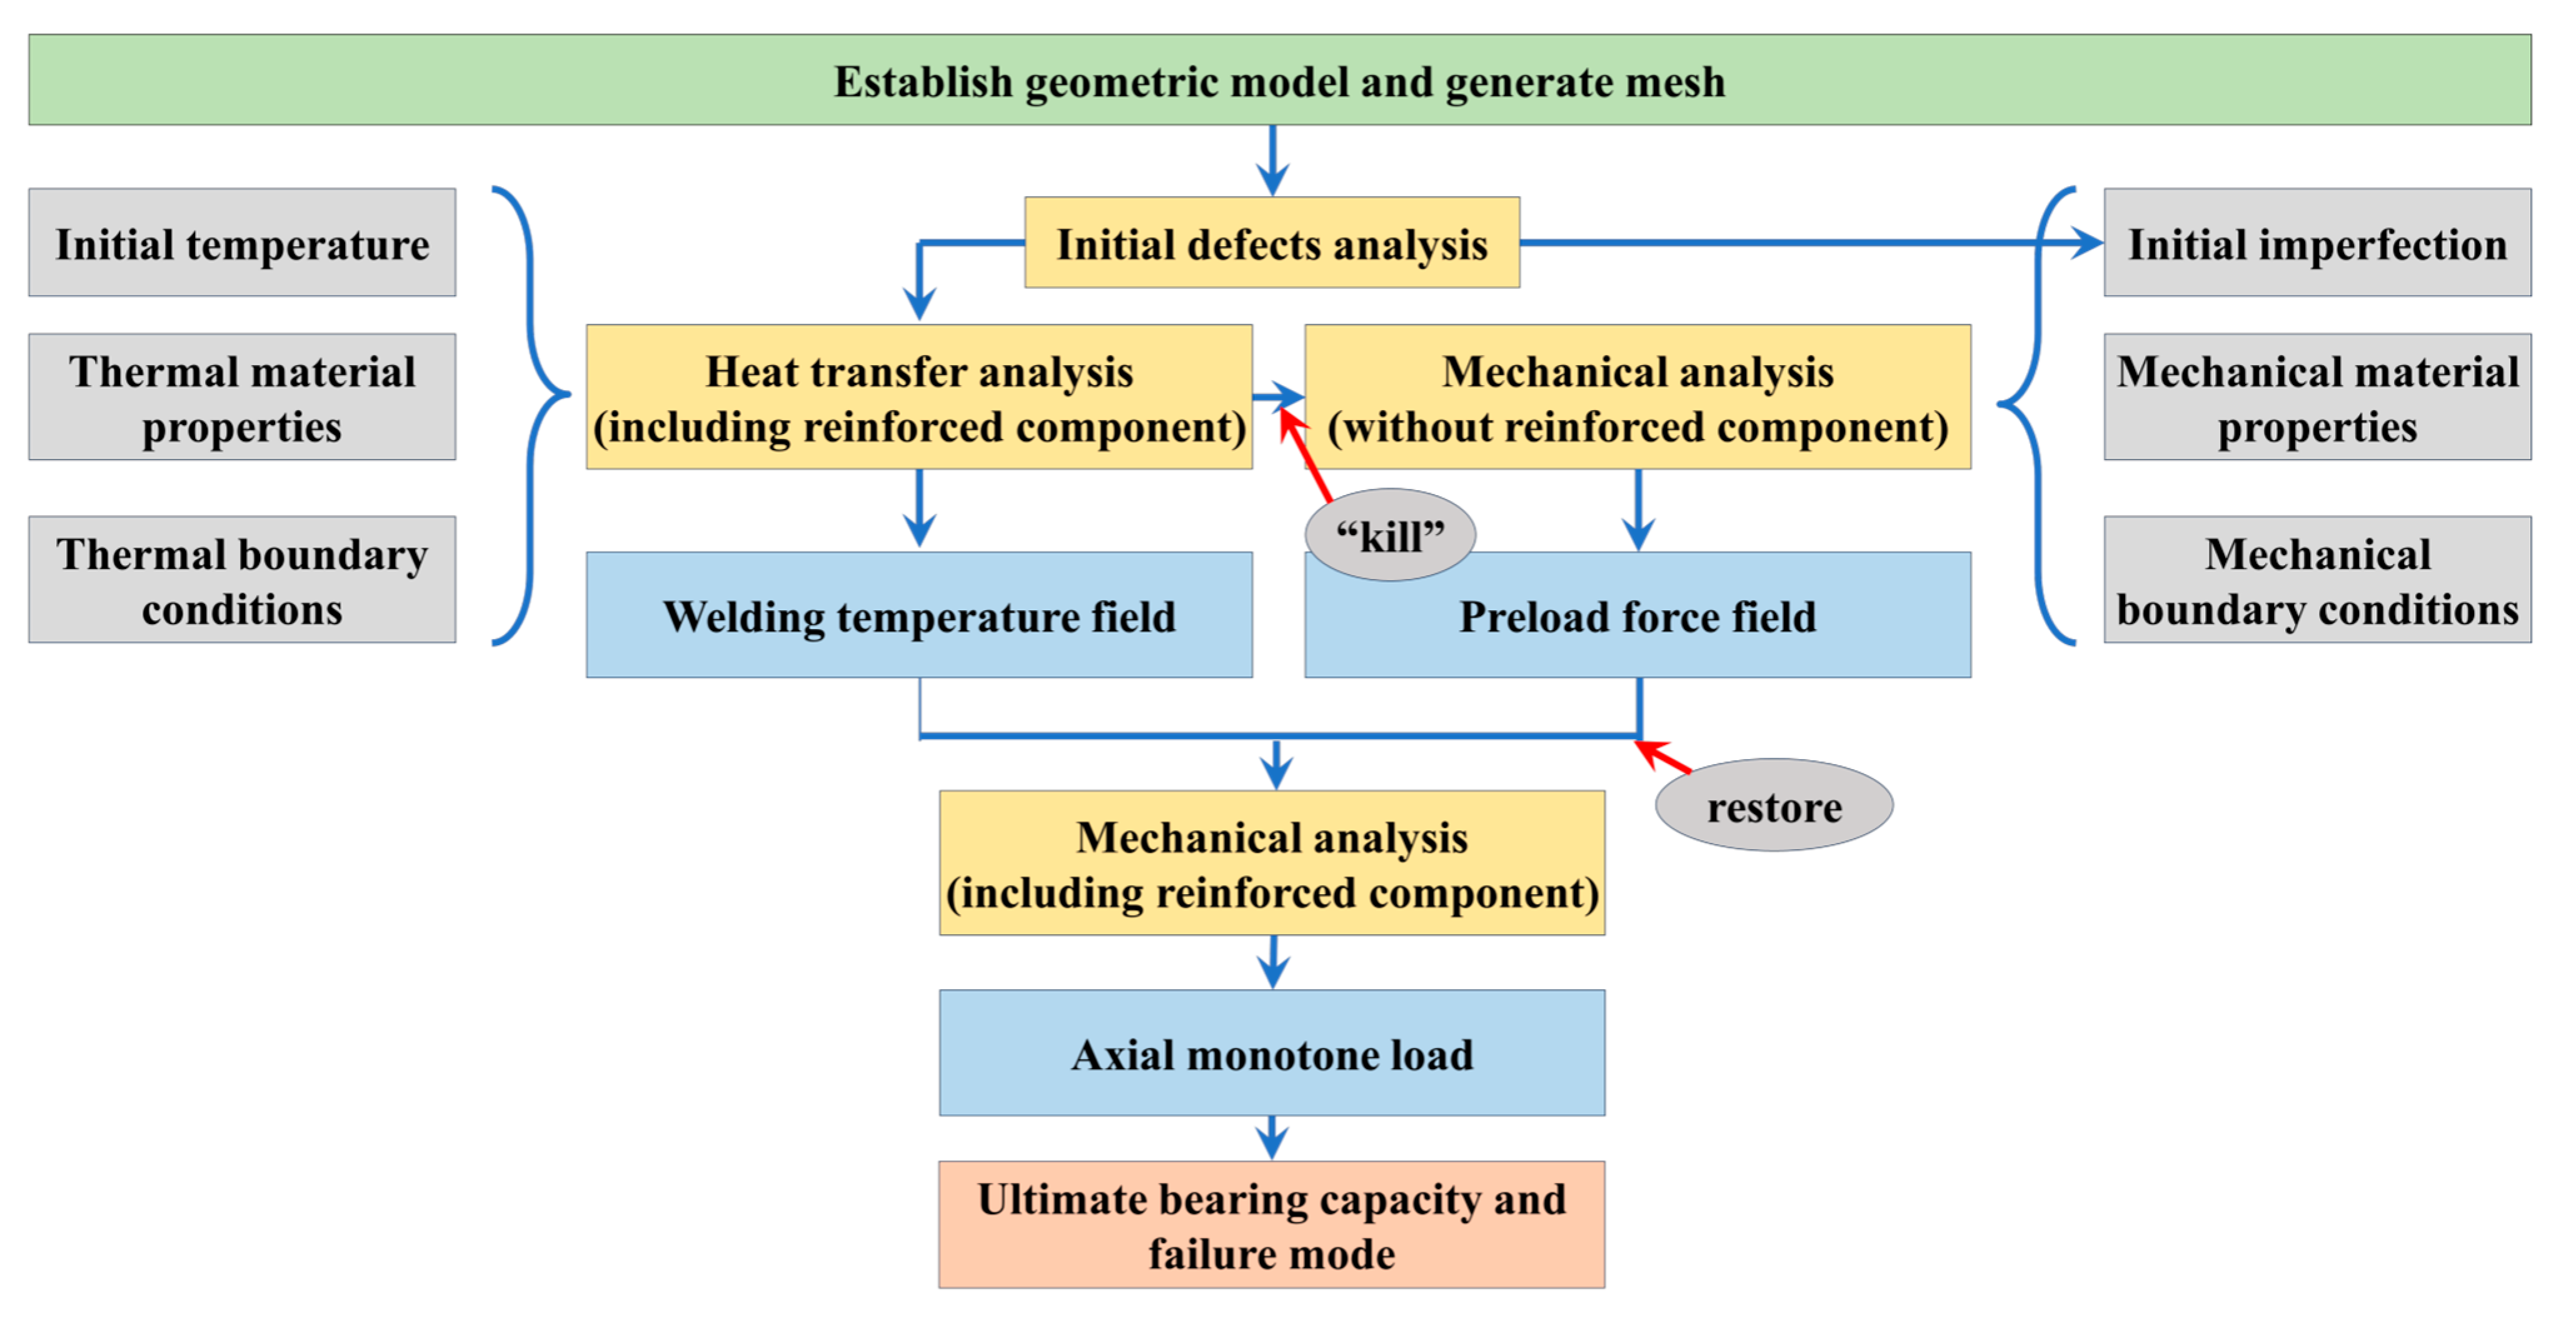
4.1. Finite Element Simulation Process

In this research, ABAQUS software was used to establish finite element models. The numerical analysis included welding temperature field analysis and mechanical properties analysis under axial pressure conditions. The welding process and temperature field analysis were simulated by using the birth–death element method. Fortran subroutine was used for the secondary development of ABAQUS for the welding temperature field analysis. In the process of the axial compression analysis, the C3D8R element was used to establish the finite element models, and the welding reinforcement process and axial compression test were simulated via the indirect heat–force coupling analysis method.
According to the results of the material properties test above, the elastic–plastic constitutive model was used to analyze the specimens numerically in the finite element analysis. The constitutive relation of steel was parameterized by the ideal elastic–plastic double fold model. Due to the influence of the welding thermal effect on the temperature during the simulation process, the yield strength of steel at the normal temperature was defined as 345 MPa, the elastic modulus was defined as 206,000 MPa, the Poisson ratio was defined as 0.3, the von mises model was used as the plastic yield criterion, and isotropic hardening was used as the strain-hardening model. In the numerical simulation of the welding process, a temperature change will affect the mechanical properties of steel. According to the reduction coefficient in the Code for Fire Protection of Building Steel Structures, the mechanical properties of steel at a high temperature, such as the elastic modulus, yield strength, and ductility, are reduced.
In the modeling analysis of the component, the contact between the strengthened part and the strengthening part is defined as the hard contact of normal action, the tangential action is defined as the penalty, and the friction coefficient is 0.3. The coupling constraints are defined at both ends of the component, and the boundary conditions, force, and displacement loads are applied to the whole component through the coupling constraint points. Due to the hinged action of the two ends of the hydraulic loading device set in the limiting direction during the test and due to the symmetry in the plane of the tube, the translational freedom of the two ends in three directions is restricted by coupling constraints, while the rotational freedom in the z-axis direction is restricted. The preload and subsequent applied loads are along the z-axis direction [20].
The buckling mode of the unreinforced member was obtained via Buckle analysis in the numerical simulation process, and the ultimate bearing capacity of the member under the initial defect could be obtained via Riks nonlinear buckling analysis when axial force is applied to the buckling mode. The results of the Riks nonlinear buckling analysis were imported into the reinforced member model to obtain the initial defect model of the member in the z-axis direction of 1/1000, and the calculation results were more similar to those of the test.
The welding process in the test will produce residual stress on the whole reinforced component [21]. The aim was to effectively simulate the welding process so that it was enough to affect the accuracy of the numerical analysis results. In this research, the temperature field changes generated by the welding were calculated separately. In the test, the reinforced steel pipe and the connecting steel plate were arc welded. In the simulation process, a Gaussian heat source is used to simulate the welding process [22].
q ( x , y , z ) = α R P π r 0 2 e x p { r 2 r 0 2 }
q s = α R P π r 0 2
In the formula, x, y, and z are the coordinate values in the thermal analysis model, and α R represents the absorption rate of the material; P represents the energy and power in the welding, determined by the voltage and current in the welding, and r 0 represents the radius of the heat source; r represents the distance from the welding center point, and q s represents the heat flux. The heat of each unit in the welding simulation can be obtained by using this method, so as to complete the calculation of the temperature field. In this paper, the thermal efficiency coefficient is 0.8, the voltage U = 220 V, and the current I = 6 A according to the field welding data, and the heat change was introduced into the ABAQUS temperature field model through a Fortran subroutine for secondary development, and the thermal analysis steps under welding were obtained.
In the finite element analysis, solid element modeling was used, and the welding simulation between the strengthened part and the strengthening part was carried out by using the life-and-death element method. Since the test adopts the process of reinforcement under load, in the finite element simulation, the model of the whole component, including the strengthened component, the strengthening component, and the weld seam, was first established, and then the reinforced component was “kill”. Through this operation, the condition of the component before reinforcement was restored, and the static load was carried out in the state of the component without reinforcement, so as to achieve the load condition under load. The previously “kill”-reinforced member was restored under the initial load of the unreinforced member, and the calculation results of the previously calculated temperature field were imported to effectively simulate the influence of the thermal effect on the member during the welding process. After combining the calculation results of the temperature field and preload force field, the axial compression simulation of the whole reinforced component was carried out to obtain the ultimate bearing capacity and failure mode of the final reinforced component. The finite element calculation results were compared with the test results to obtain a more accurate finite element analysis process. Figure 11 shows the finite element analysis carried out by using the life-and-death element method.

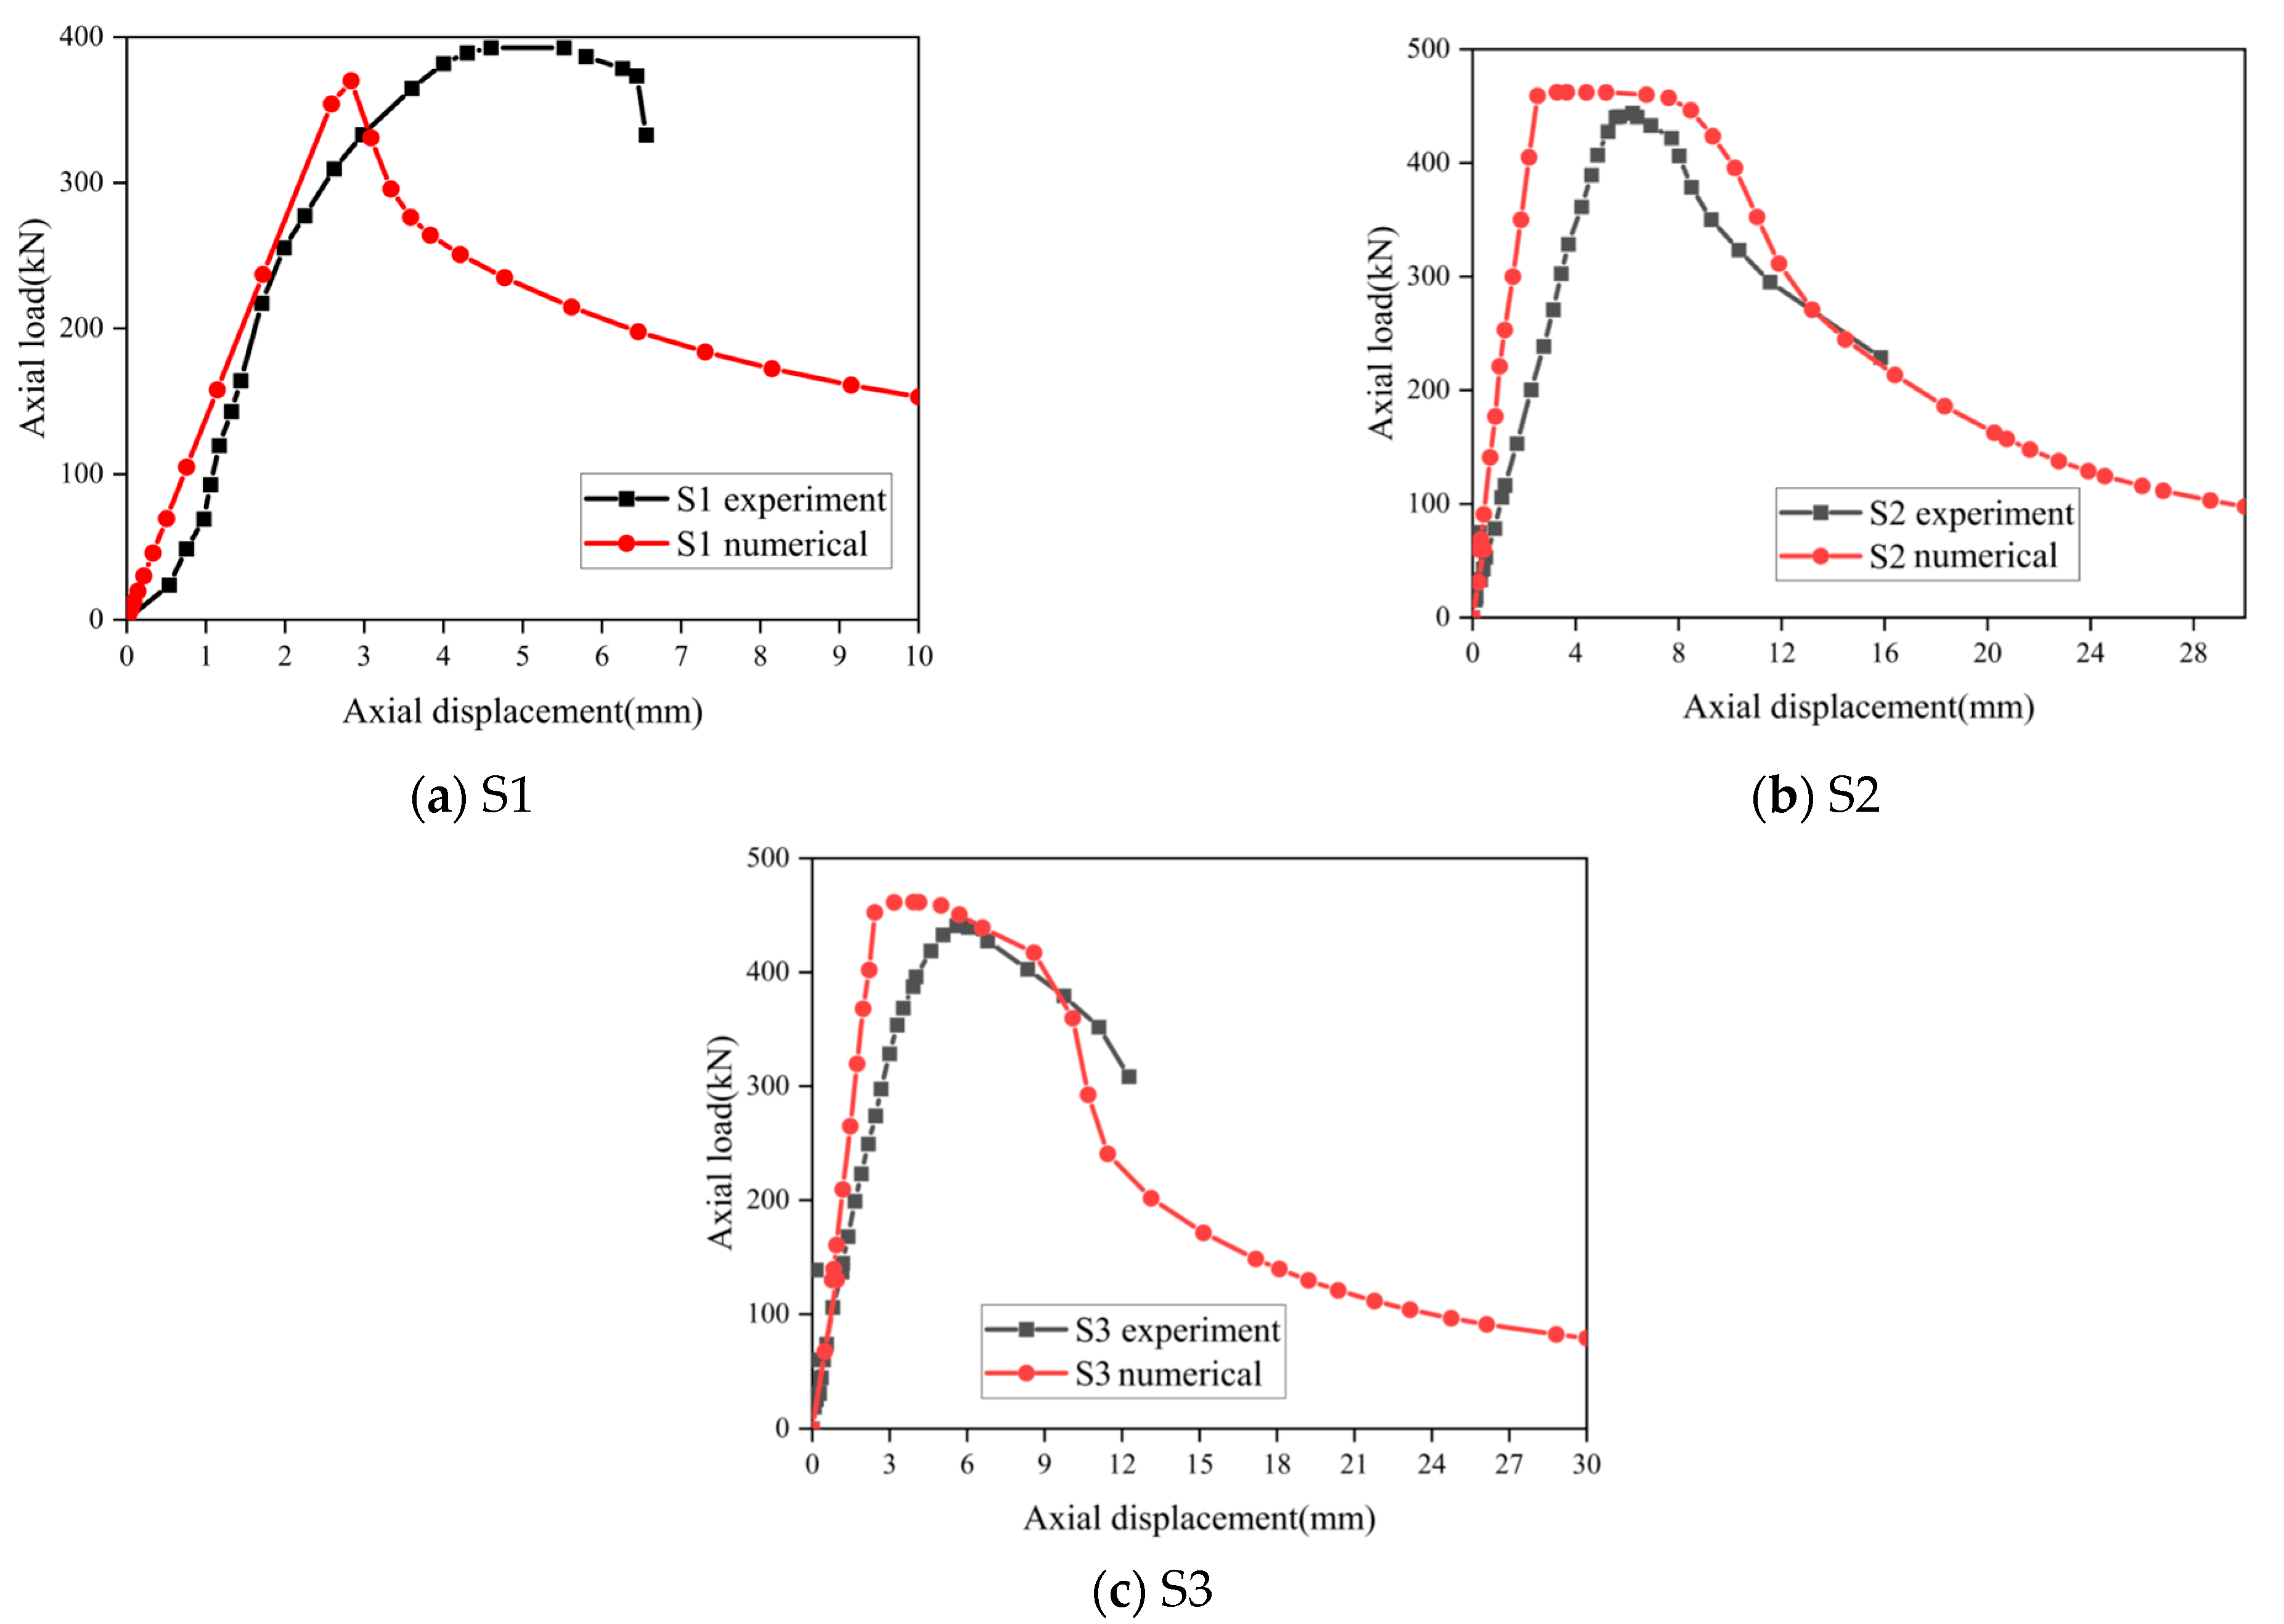
4.2. Finite Element Simulation Verification

The finite element model simulation calculation method is described above, and the ultimate bearing capacity of the specimens and the finite element simulation calculation ultimate bearing capacity are shown in Table 4. Considering the effect of welding heat, the relative error between the numerical analysis of the ultimate bearing capacity under axial pressure and the experimental ultimate bearing capacity is less than 6%. Compared with the load–axial displacement curve in Figure 12, it can be seen that the ultimate bearing capacity of S1, S2, and S3 specimens obtained are basically consistent with the experimental results. In the process of reinforcement under load, it is necessary to carry out the reinforcement on the hydraulic test machine, which will cause the axial displacement fluctuation at the load level. The simulation results show that the reinforced bar can still bear the load after reaching the yield point, and the load capacity after yielding, while the loading level of the unreinforced bar decreases rapidly after reaching the ultimate bearing capacity, which is consistent with the test results.
As shown in Figure 13, the failure modes of specimens in the numerical simulation results are compared with those in the test. It can be seen that the failure modes of the unreinforced parts are the overall instability, while the failure modes of the reinforced parts are the local buckling generated near the sleeved parts, resulting in the overall instability of the members. The experimental results are in good agreement with the numerical simulation results.
Figure 14 presents the axial normal stress contour diagram for the compressive buckling section of the bar before and after reinforcement. It is evident that the upper portion of the yield section is subjected to compressive stress, while the lower portion experiences tensile stress. The stress variation trend on both sides aligns with the strain gauge readings depicted in Figure 10. Additionally, the local buckling phenomenon in the reinforced member is more pronounced compared to the unreinforced condition. In summary, the finite element analysis model established considering the welding thermal effect is reasonable and reliable, and can be used for subsequent parameter analysis.

4.3. Parametric Analysis

Based on the finite element analysis method mentioned above, 236 finite element analysis models were established for the above tests. These models were used to study the influence of various factors on the ultimate bearing capacity of the members. Specifically, the effects of the initial stress ratio, initial defects, slenderness ratio, area ratio of the sleeved part to the reinforced part, welding heat effect, reinforcement length, and reinforcement position on the ultimate bearing capacity were analyzed.

4.3.1. Initial Stress Ratio

The initial stress ratio level will affect the efficiency and level of reinforcement. The numerical simulation results show that the initial load reduces the ultimate bearing capacity of the member. The initial bending of the round steel tube caused by the initial load can be regarded as a geometric defect, which will aggravate the overall instability of the member, so the ultimate bearing capacity of the member strengthened under load is lower than that under zero load. According to the Euler stability formula, the effect of load reinforcement is mainly related to the slenderness ratio, the initial stress ratio, the overall stiffness, and other factors. The influence of the initial stress ratio on the ultimate bearing capacity can be expressed by the ratio of the ultimate bearing capacity strengthened under load and zero load to the ultimate bearing capacity without reinforcement, as shown in Figure 14.
When the slenderness ratio is small, the member can be regarded as a short column, the strength failure occurs, and the initial bending caused by the initial load has little effect on the ultimate bearing capacity of the member. However, when the slenderness ratio of the member is large, the instability failure is the main failure mode. With the increase in the initial bending caused by the initial load, the ultimate bearing capacity decreases, as shown in Figure 15. When the slenderness ratio is constant, the bearing capacity of the member decreases with the increase in the initial stress ratio. When the initial stress ratio is less than 0.4, the reduction in the bearing capacity of the member with the increase in the initial stress ratio is less than 10%. When the initial stress ratio of the component is greater than 0.6, it can be regarded as the reinforcement of the member under a high stress ratio. Under this reinforcement method, the ultimate bearing capacity of the component can still be effectively improved, and the method maintains over 75% of its efficiency even at initial stress ratios up to 0.8, which verifies the reliability of the welded reinforced steel pipe component under a high load.
During local reinforcement, the initial bending caused by the initial load will have different effects on the member with different global stiffness values due to the different position and length of the reinforcement. As the local reinforcement fails to increase the full-length stiffness of the member compared with the overall reinforcement, the ability of the member to overcome bending deformation decreases when instability occurs. The reinforcement effects can be represented by the ratio of the ultimate bearing capacity under local reinforcement and general length reinforcement under load to the ultimate bearing capacity under zero load, as shown in Figure 16. The efficiency of the partial reinforcement is slightly higher than that of the pass-length reinforcement. The interaction effect between the initial stress ratio and reinforcement length is illustrated in Figure 17. It can be observed that when the initial stress ratio is relatively low (initial stress ratio < 0.4), its impact on the overall ultimate load is minimal. Conversely, when the initial stress ratio exceeds 0.6, a notable decline in the ultimate bearing capacity becomes apparent.

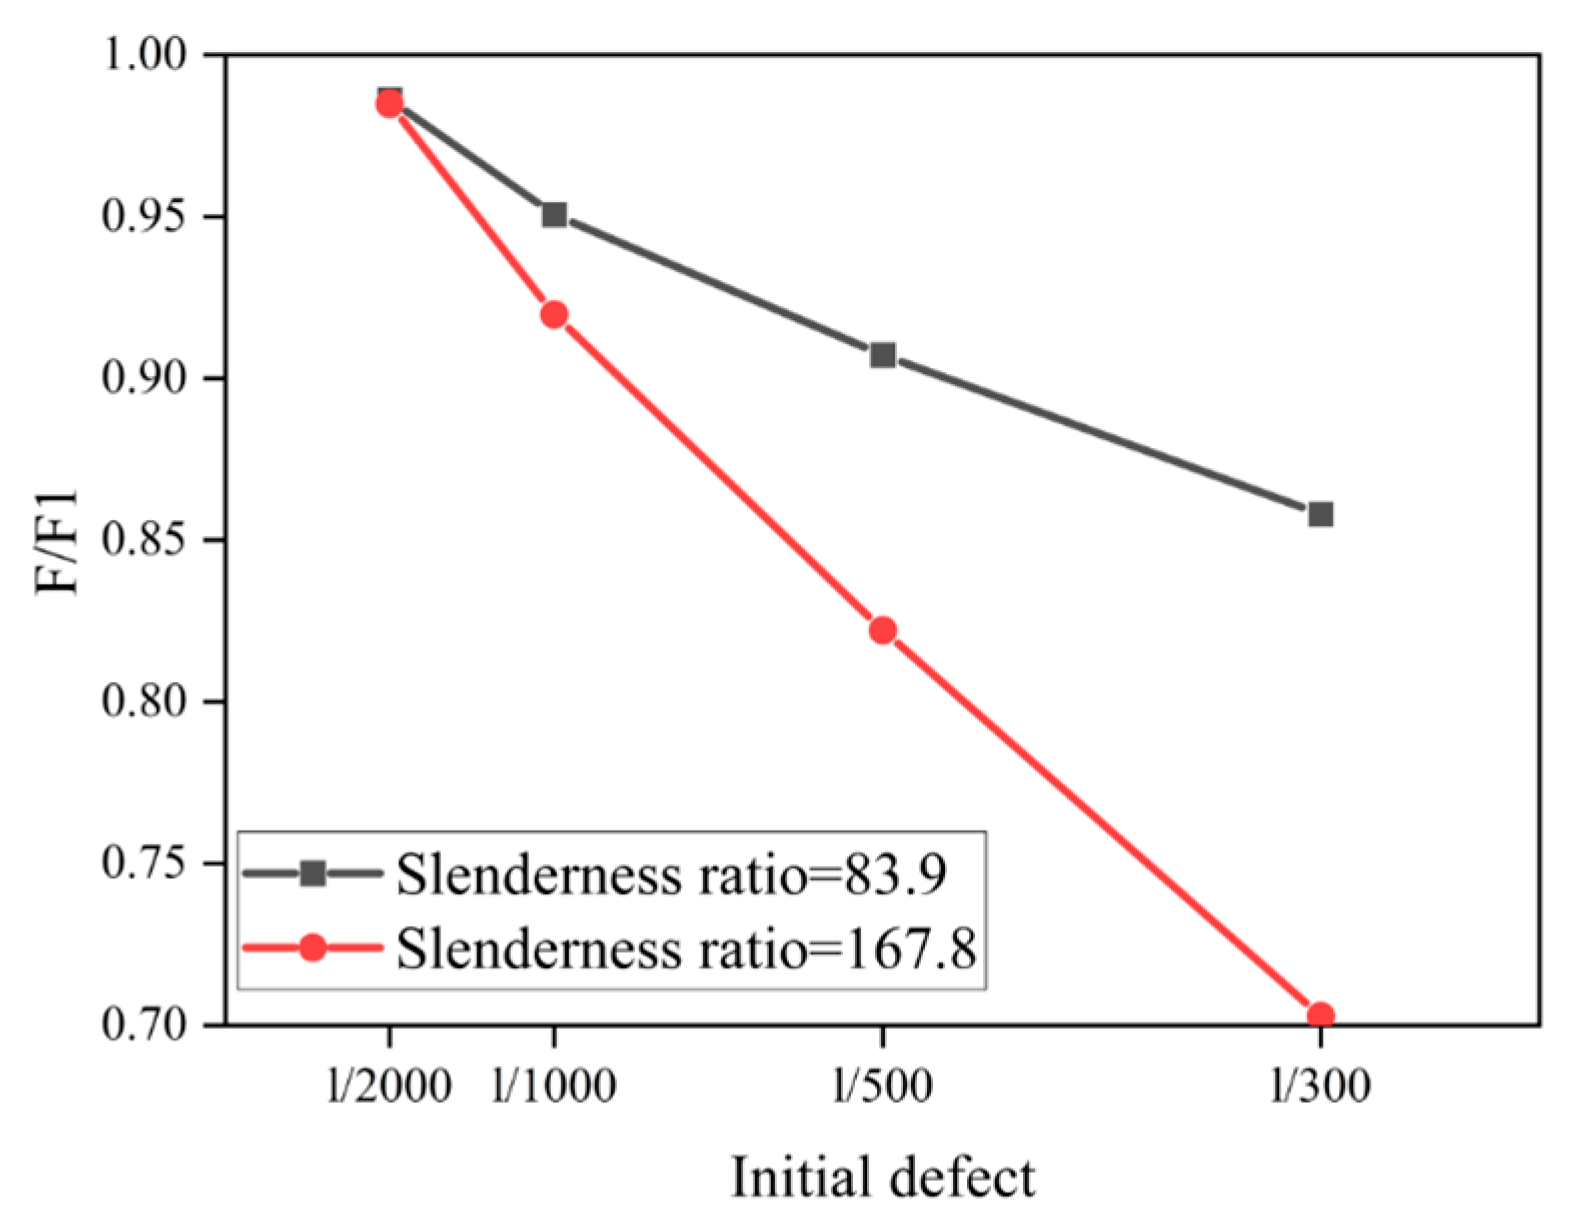
4.3.2. Initial Defects

The initial defects will cause a certain initial bending of the round steel pipe before the reinforcement, and the initial defects of different sizes will aggravate the instability and failure of the rod. In this research, the RIKs mode was used to analyze the change in the ultimate bearing capacity of the member with initial defects, and the reinforcement efficiency of the member with different geometric defects was studied. The ultimate bearing capacity of the member under different initial defects is shown in Figure 18. In the member with a slenderness ratio of 167.8, the initial defect increases from L/2000 to L/300, and the ultimate bearing capacity of the member decreases significantly. Comparing and analyzing the simulation results with the test results, it is recommended to use the initial defect level of L/500, and the selection of the initial defect level is related to the slenderness ratio of the component. When the slenderness ratio of the specimen is large, the initial defect level in the calculation can be appropriately reduced.

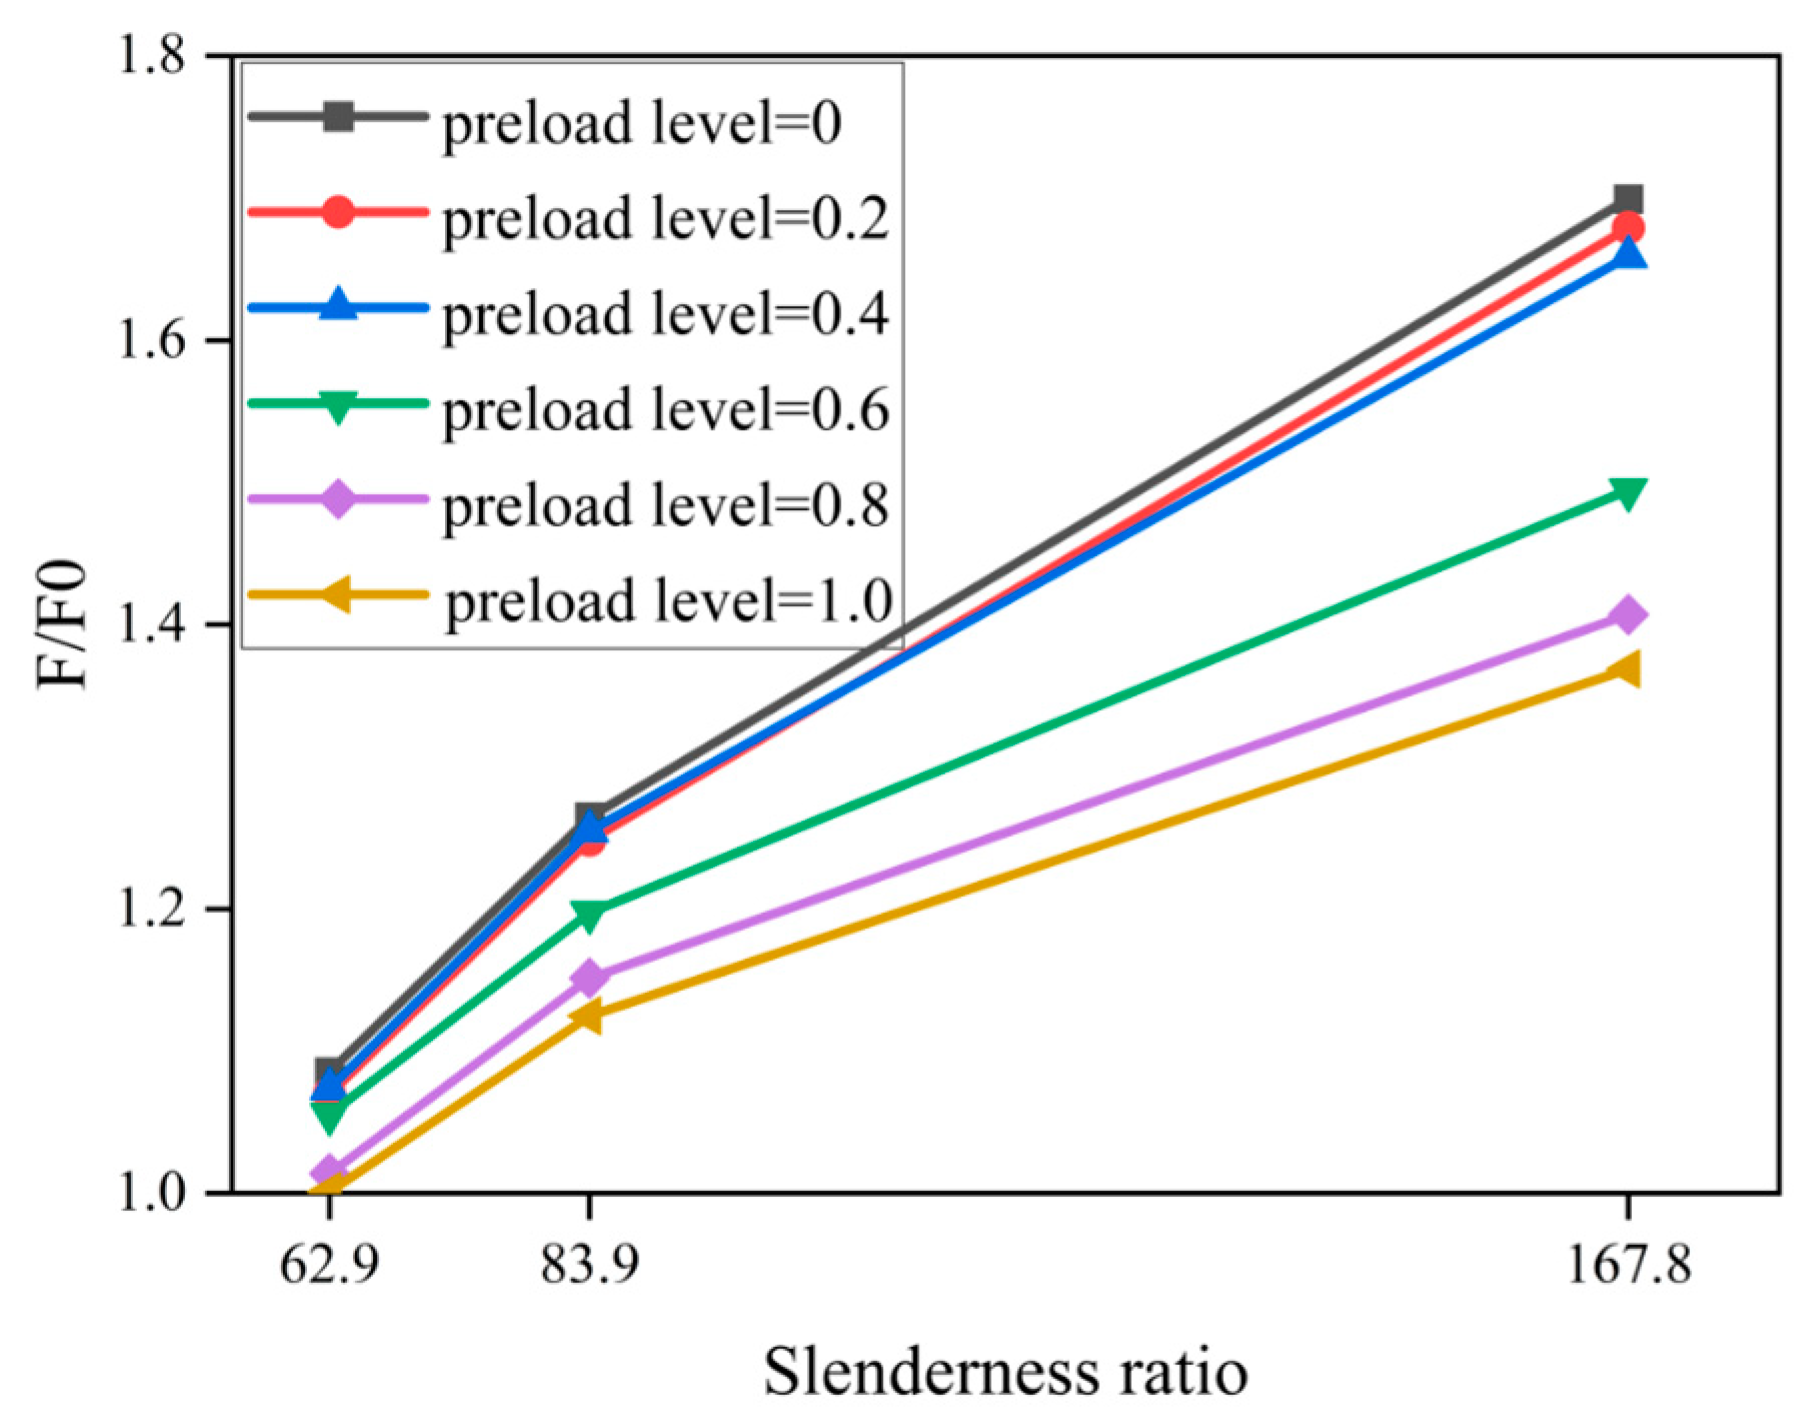
4.3.3. Slenderness Ratio

The slenderness ratio is one of the main factors that affect the performance of casing reinforcement. Since the size of the slenderness ratio is directly related to the instability failure of the member, generally speaking, the member with a large slenderness ratio is prone to instability failure, and the strength failure will occur when the slenderness ratio is small. In order to analyze the reinforcement efficiency of the casing reinforcement under different slenderness ratios, Figure 19 shows finite element models under different slenderness ratios, and Figure 20 shows how the ratio of reinforced and unreinforced ultimate bearing capacity varies with the slenderness ratio under different load conditions under the local reinforcement of 50% of its length. The simulation results show that the greater the slenderness ratio, the higher the reinforcement efficiency of the member and the stronger the effectiveness of the casing local reinforcement. When the slenderness ratio is large, the member tends to be unstable, and the local reinforcement can effectively increase the ultimate bearing capacity. However, when the member is small and tends to undergo strength failure, the influence of the local reinforcement on the ultimate bearing capacity of the member is limited compared with the overall reinforcement.

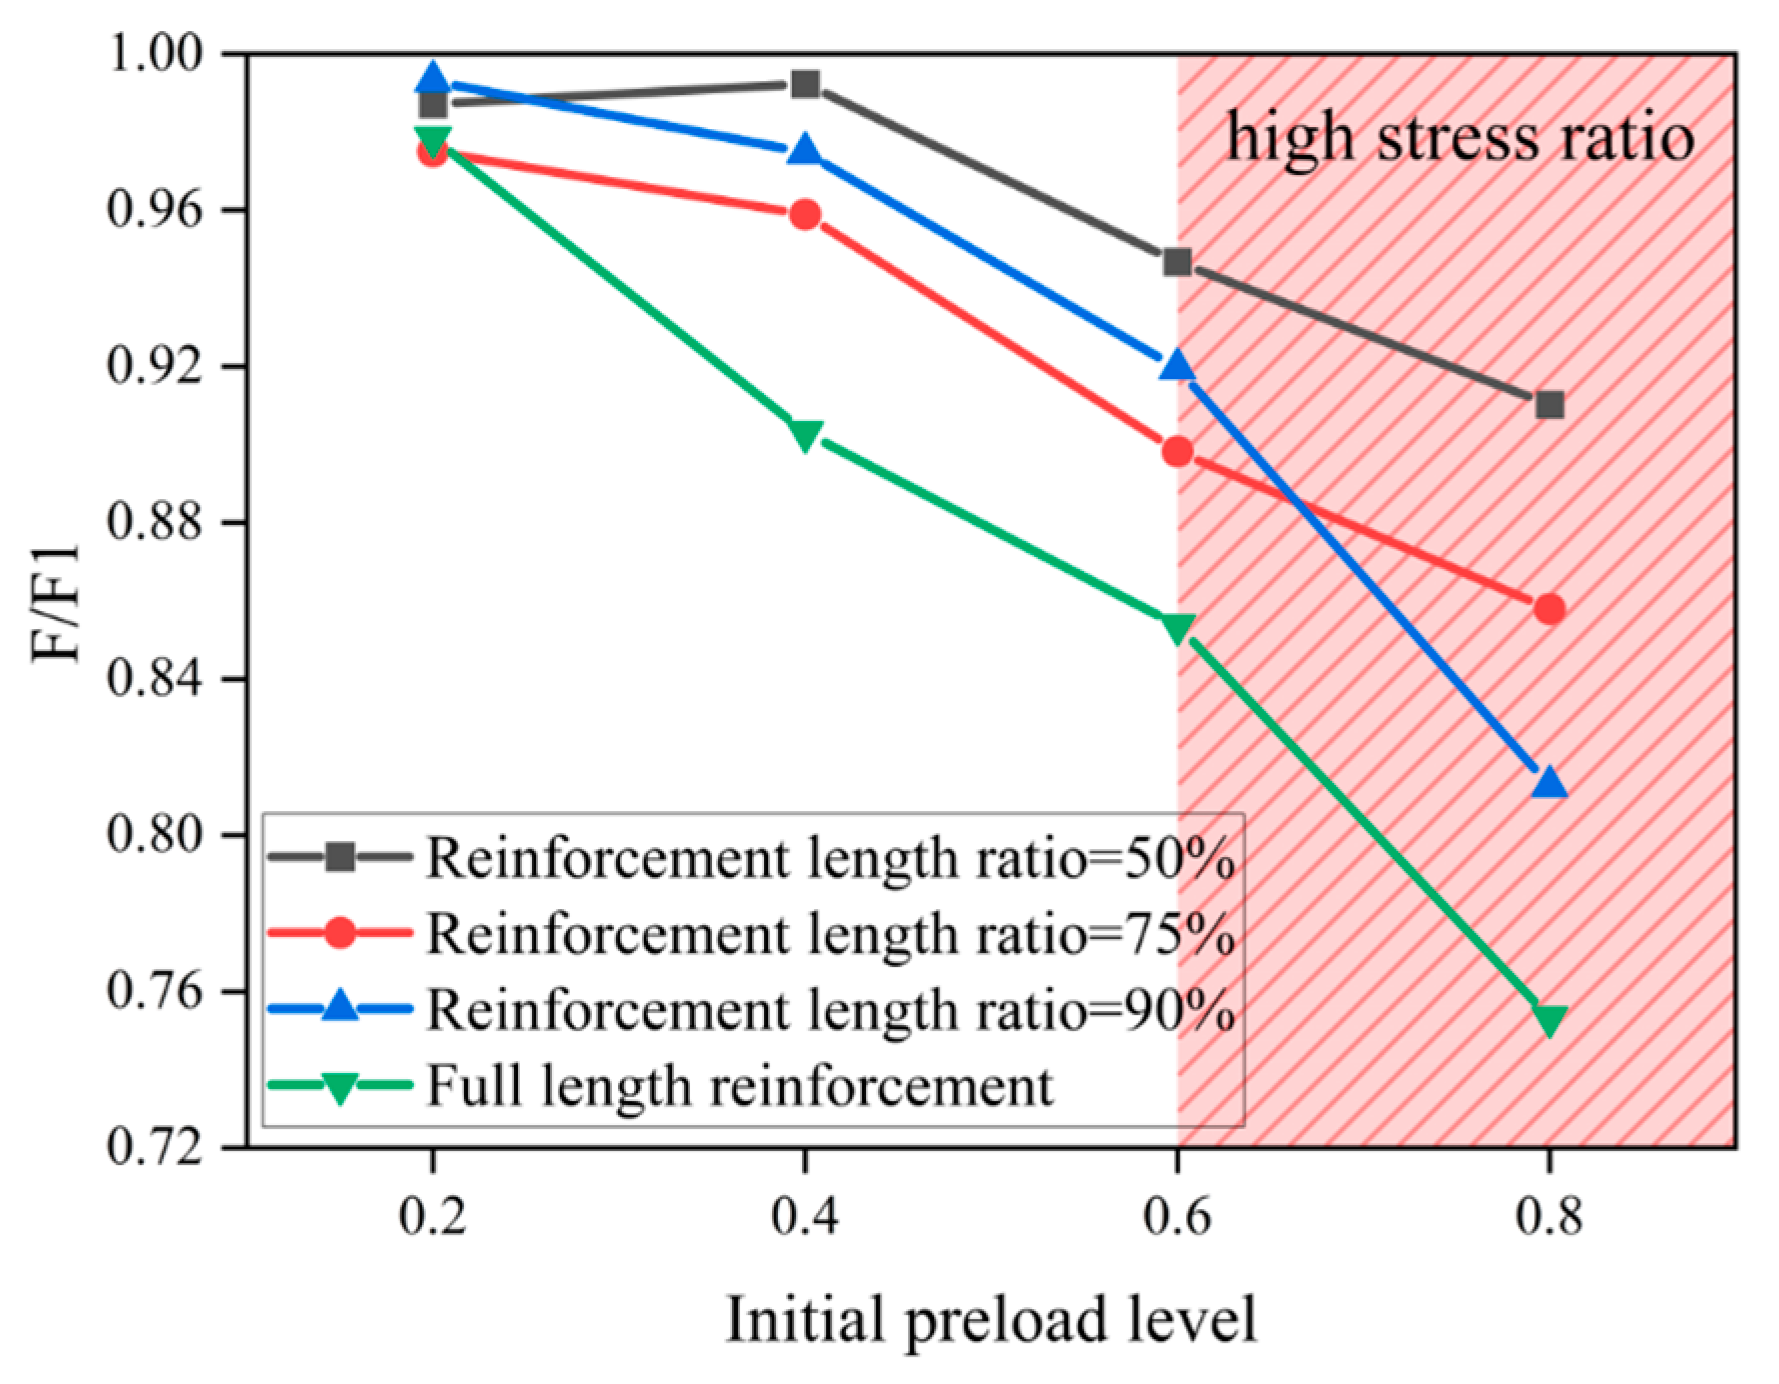
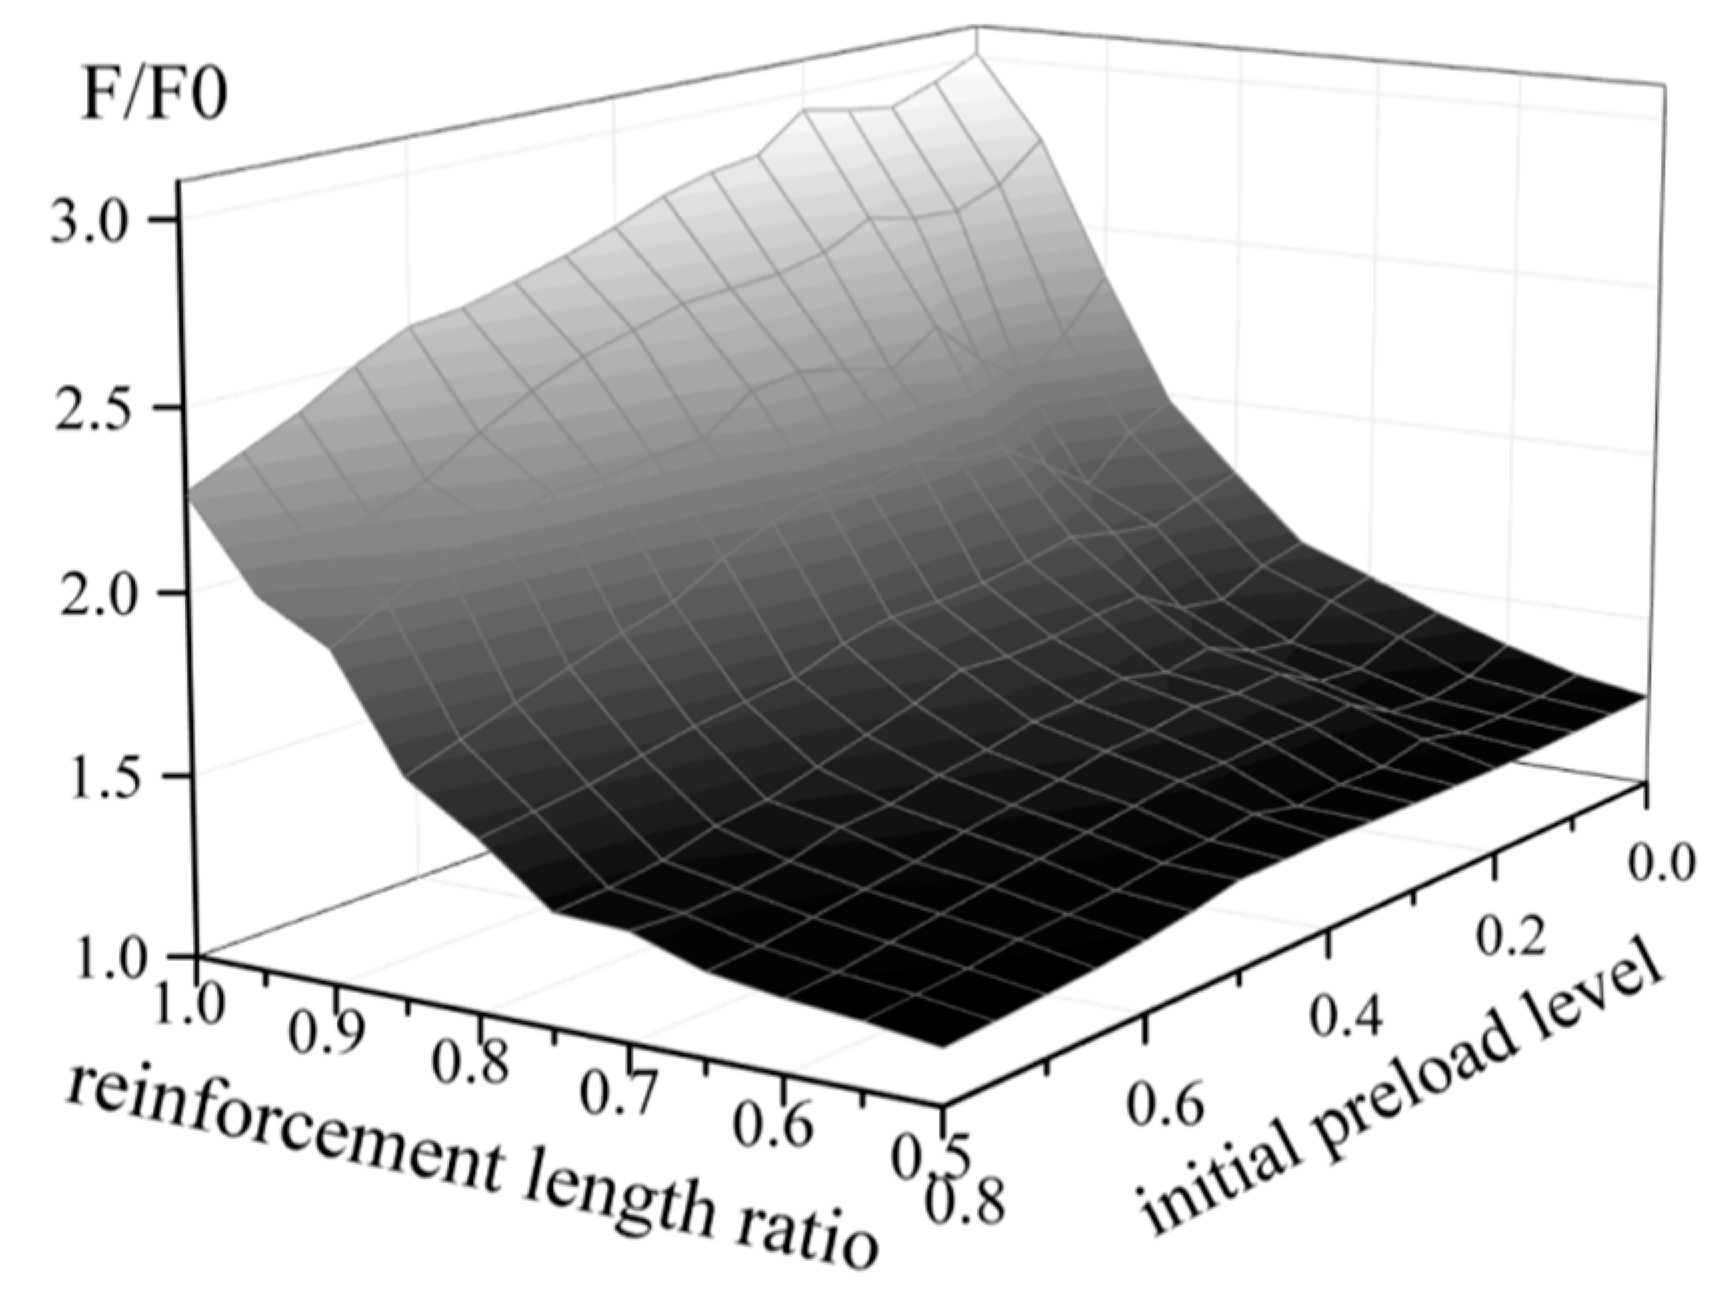
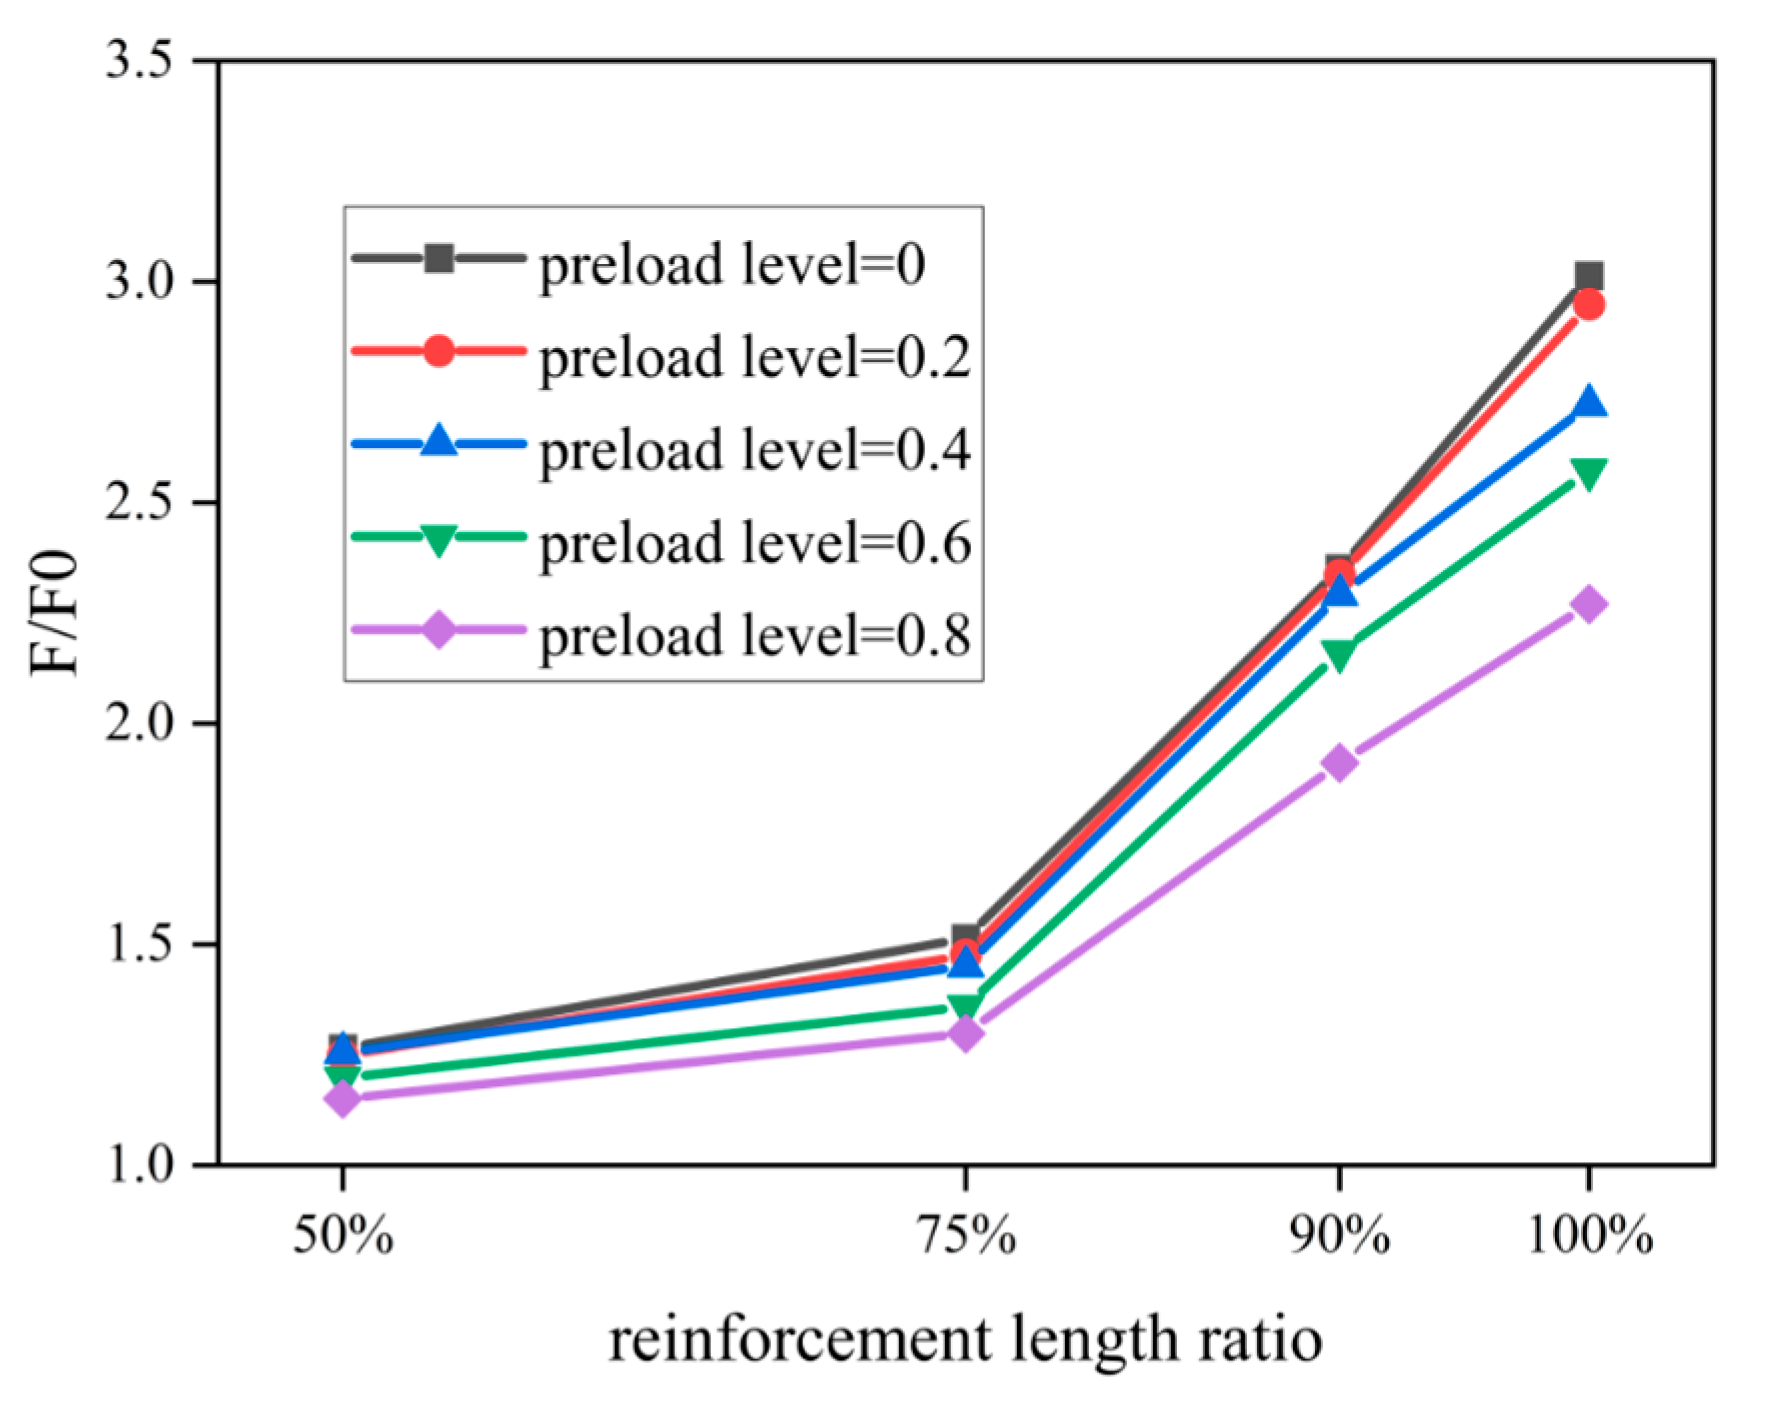
4.3.4. Reinforcement Length

As the ultimate failure of the rod is mostly unstable failure, the local reinforcement of the round steel pipe can improve the local stiffness of the members, thereby increasing the Euler load and increasing the ultimate bearing capacity. However, the local reinforcement of different lengths will affect the increased level of ultimate bearing capacity.
When it is assumed that the locally strengthened steel pipe member is a three-stage double-step column [23], it can be assumed that the member is an ideal compression rod and conforms to the assumption of a plain section, and the failure mode of the whole rod is instability failure. In order to make the three members reach the unstable failure state at the same time, so as to achieve the maximum utilization efficiency during the local reinforcement, the theoretical solution can be calculated through the flexural equation of the pressure rod:
k 1 k 2 t a n k 1 l 1 t a n k 2 l 2 + k 1 2 t a n k 1 l 1 t a n k 1 l 3 + k 1 k 2 t a n k 2 l 2 t a n k 1 l 3 = k 2 2
where k 1 = N E I 1 , k 2 = N E I 2 , the lower, middle, and upper three component lengths are   l 1 ,   l 2 ,   l 3 , the moment of inertia of the lower, middle, and upper members is I 1 ,   I 2 , I 3 , respectively, and the axial force is N. According to the formula, the optimum reinforcement length ratio can be determined when the upper, middle, and lower sections are subjected to the Euler critical bearing capacity. In the long member with a slenderness ratio of 167.8, according to the above formula, it can be calculated that 56.6% of the long steel pipe member with local reinforcement can optimally exert its performance after reinforcement, ensures the overall instability failure of the member after reinforcement, and mitigates the potential for wasted reinforcement performance stemming from instability subsequent to localized buckling. When reinforcing components are characterized by a large slenderness ratio, a local reinforcement length of 50% to 65% may be considered, as this approach maximizes the mechanical properties of the reinforced components and optimizes the reinforcement costs for economic efficiency.
However, in practical engineering, the instability failure of all three sections of pressure rods after local reinforcement is ideal, and especially in short columns, the strength failure caused by local buckling should be considered. Figure 21 shows finite element models under different reinforcement lengths, and Figure 22 shows the ultimate bearing capacity of a component short column with a slenderness ratio of 83.9 under different local reinforcement lengths. The most economical and appropriate local reinforcement scheme can be selected according to the different reinforcement requirements. In short column reinforcement, the reinforcement length can be appropriately increased to 75~90% to ensure an improved reinforcement efficiency.

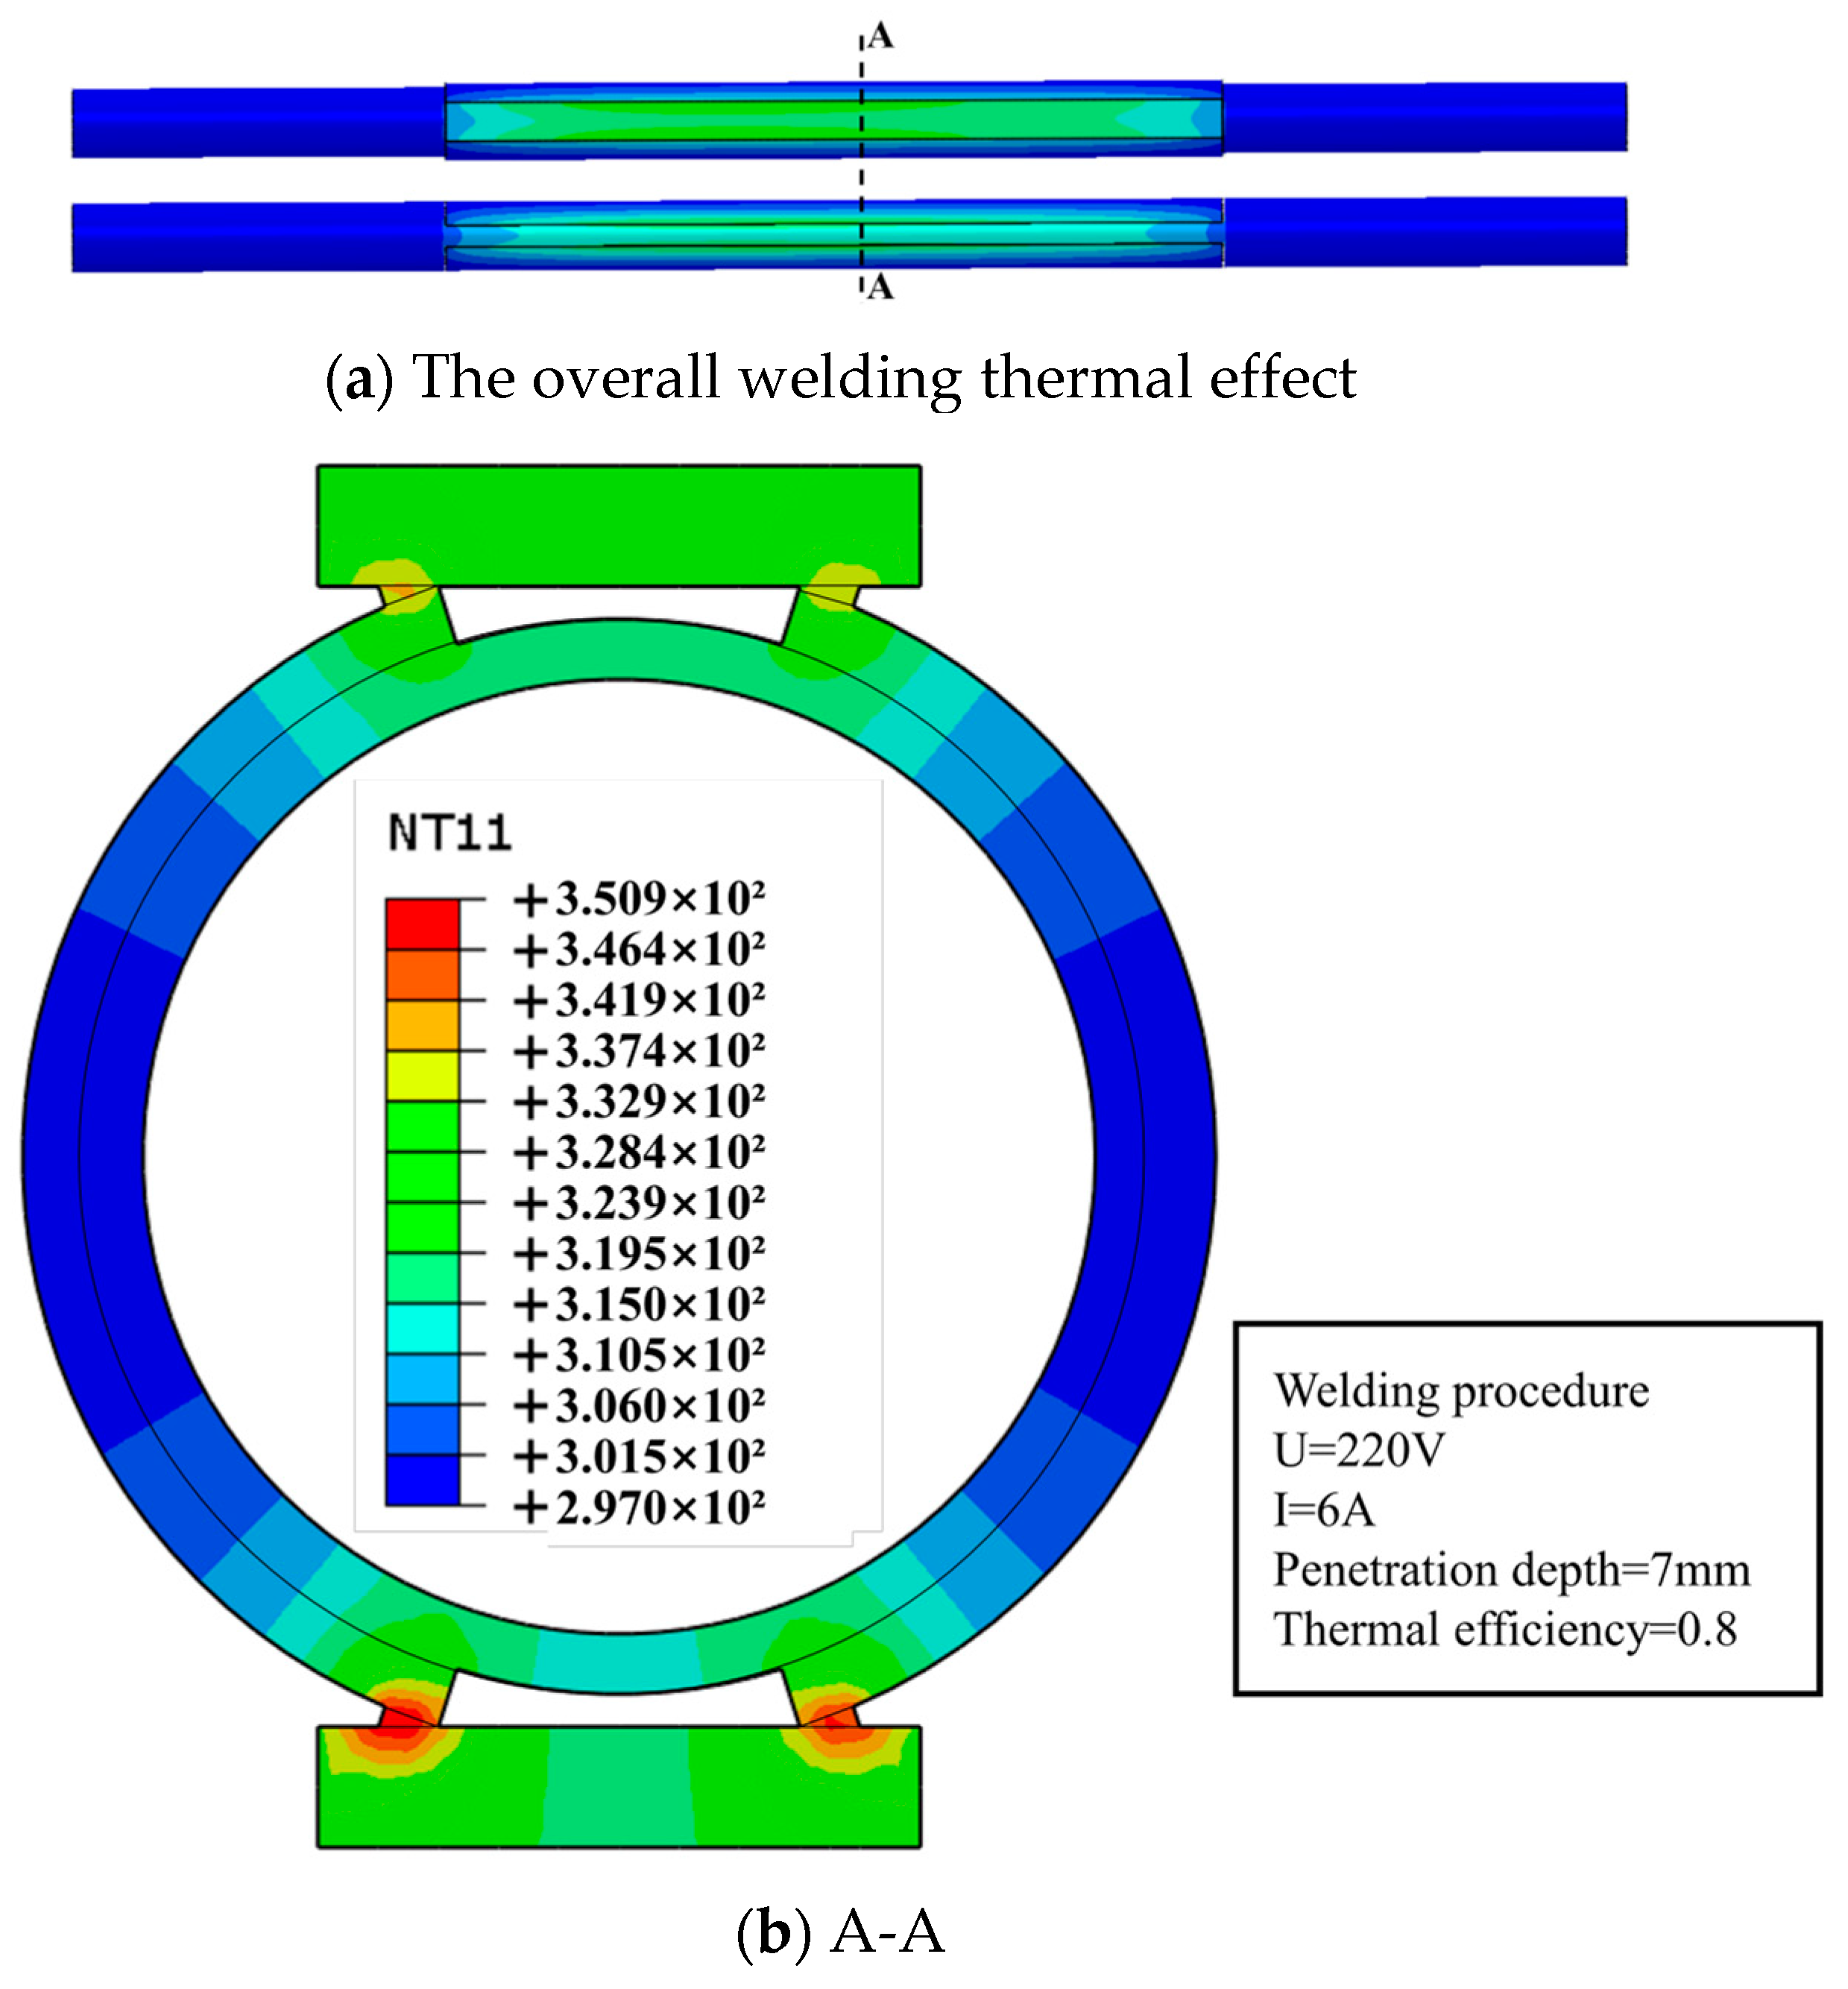
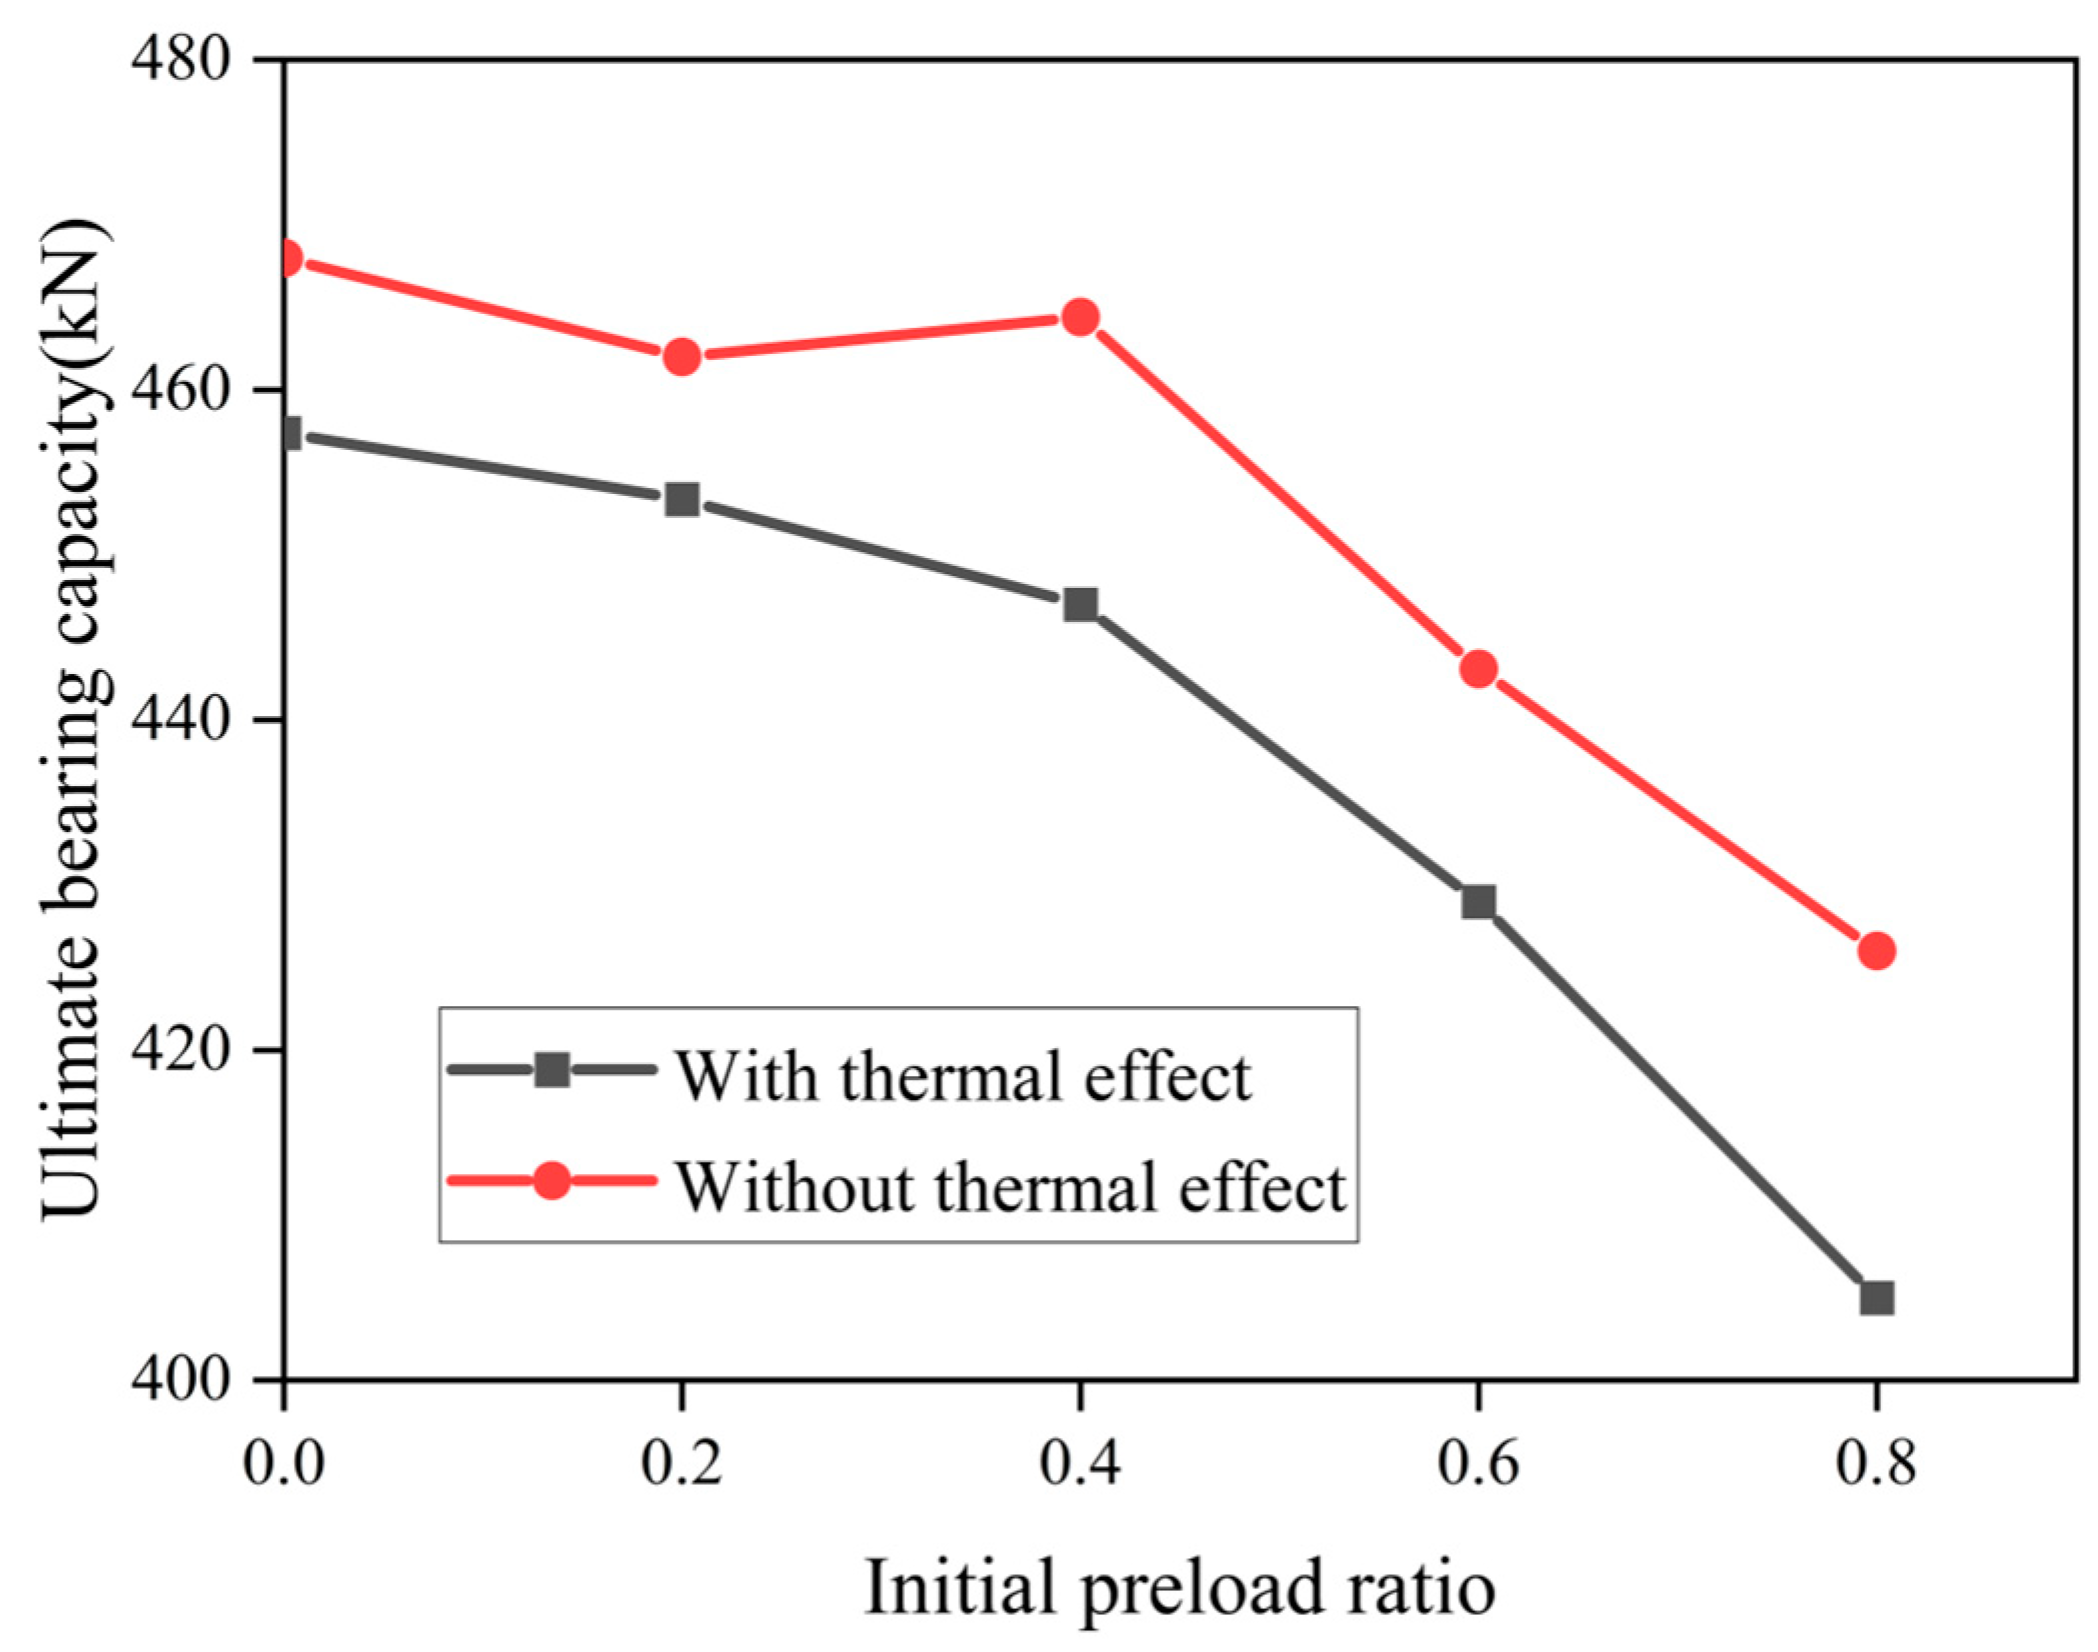
4.3.5. Welding Thermal Influence

The thermal influence generated during the welding and reinforcement of steel members will produce residual stress in the members, resulting in mechanical defects at the level of the whole member. The residual compressive stress will make a part of the compression rod yield in advance, thereby reducing the local stiffness and promoting the instability of the member [24,25]. When the welding directly acts on the reinforced member, it is necessary to select the stability coefficient of the pressure rod according to the influence of the residual stress, and revise the calculation results of the theoretical calculation [26].
However, in the reinforcement method in this paper, because the welding position is on the reinforcement part and the connecting steel plate, the reinforced part does not directly participate in the welding process, the residual stress is small, and the welding thermal influence has little influence on the ultimate bearing capacity of the member. The thermal effect of the cross-section during welding and the welding procedure are shown in Figure 23. The simulation results without a thermal effect and with a thermal effect are shown in Figure 24.

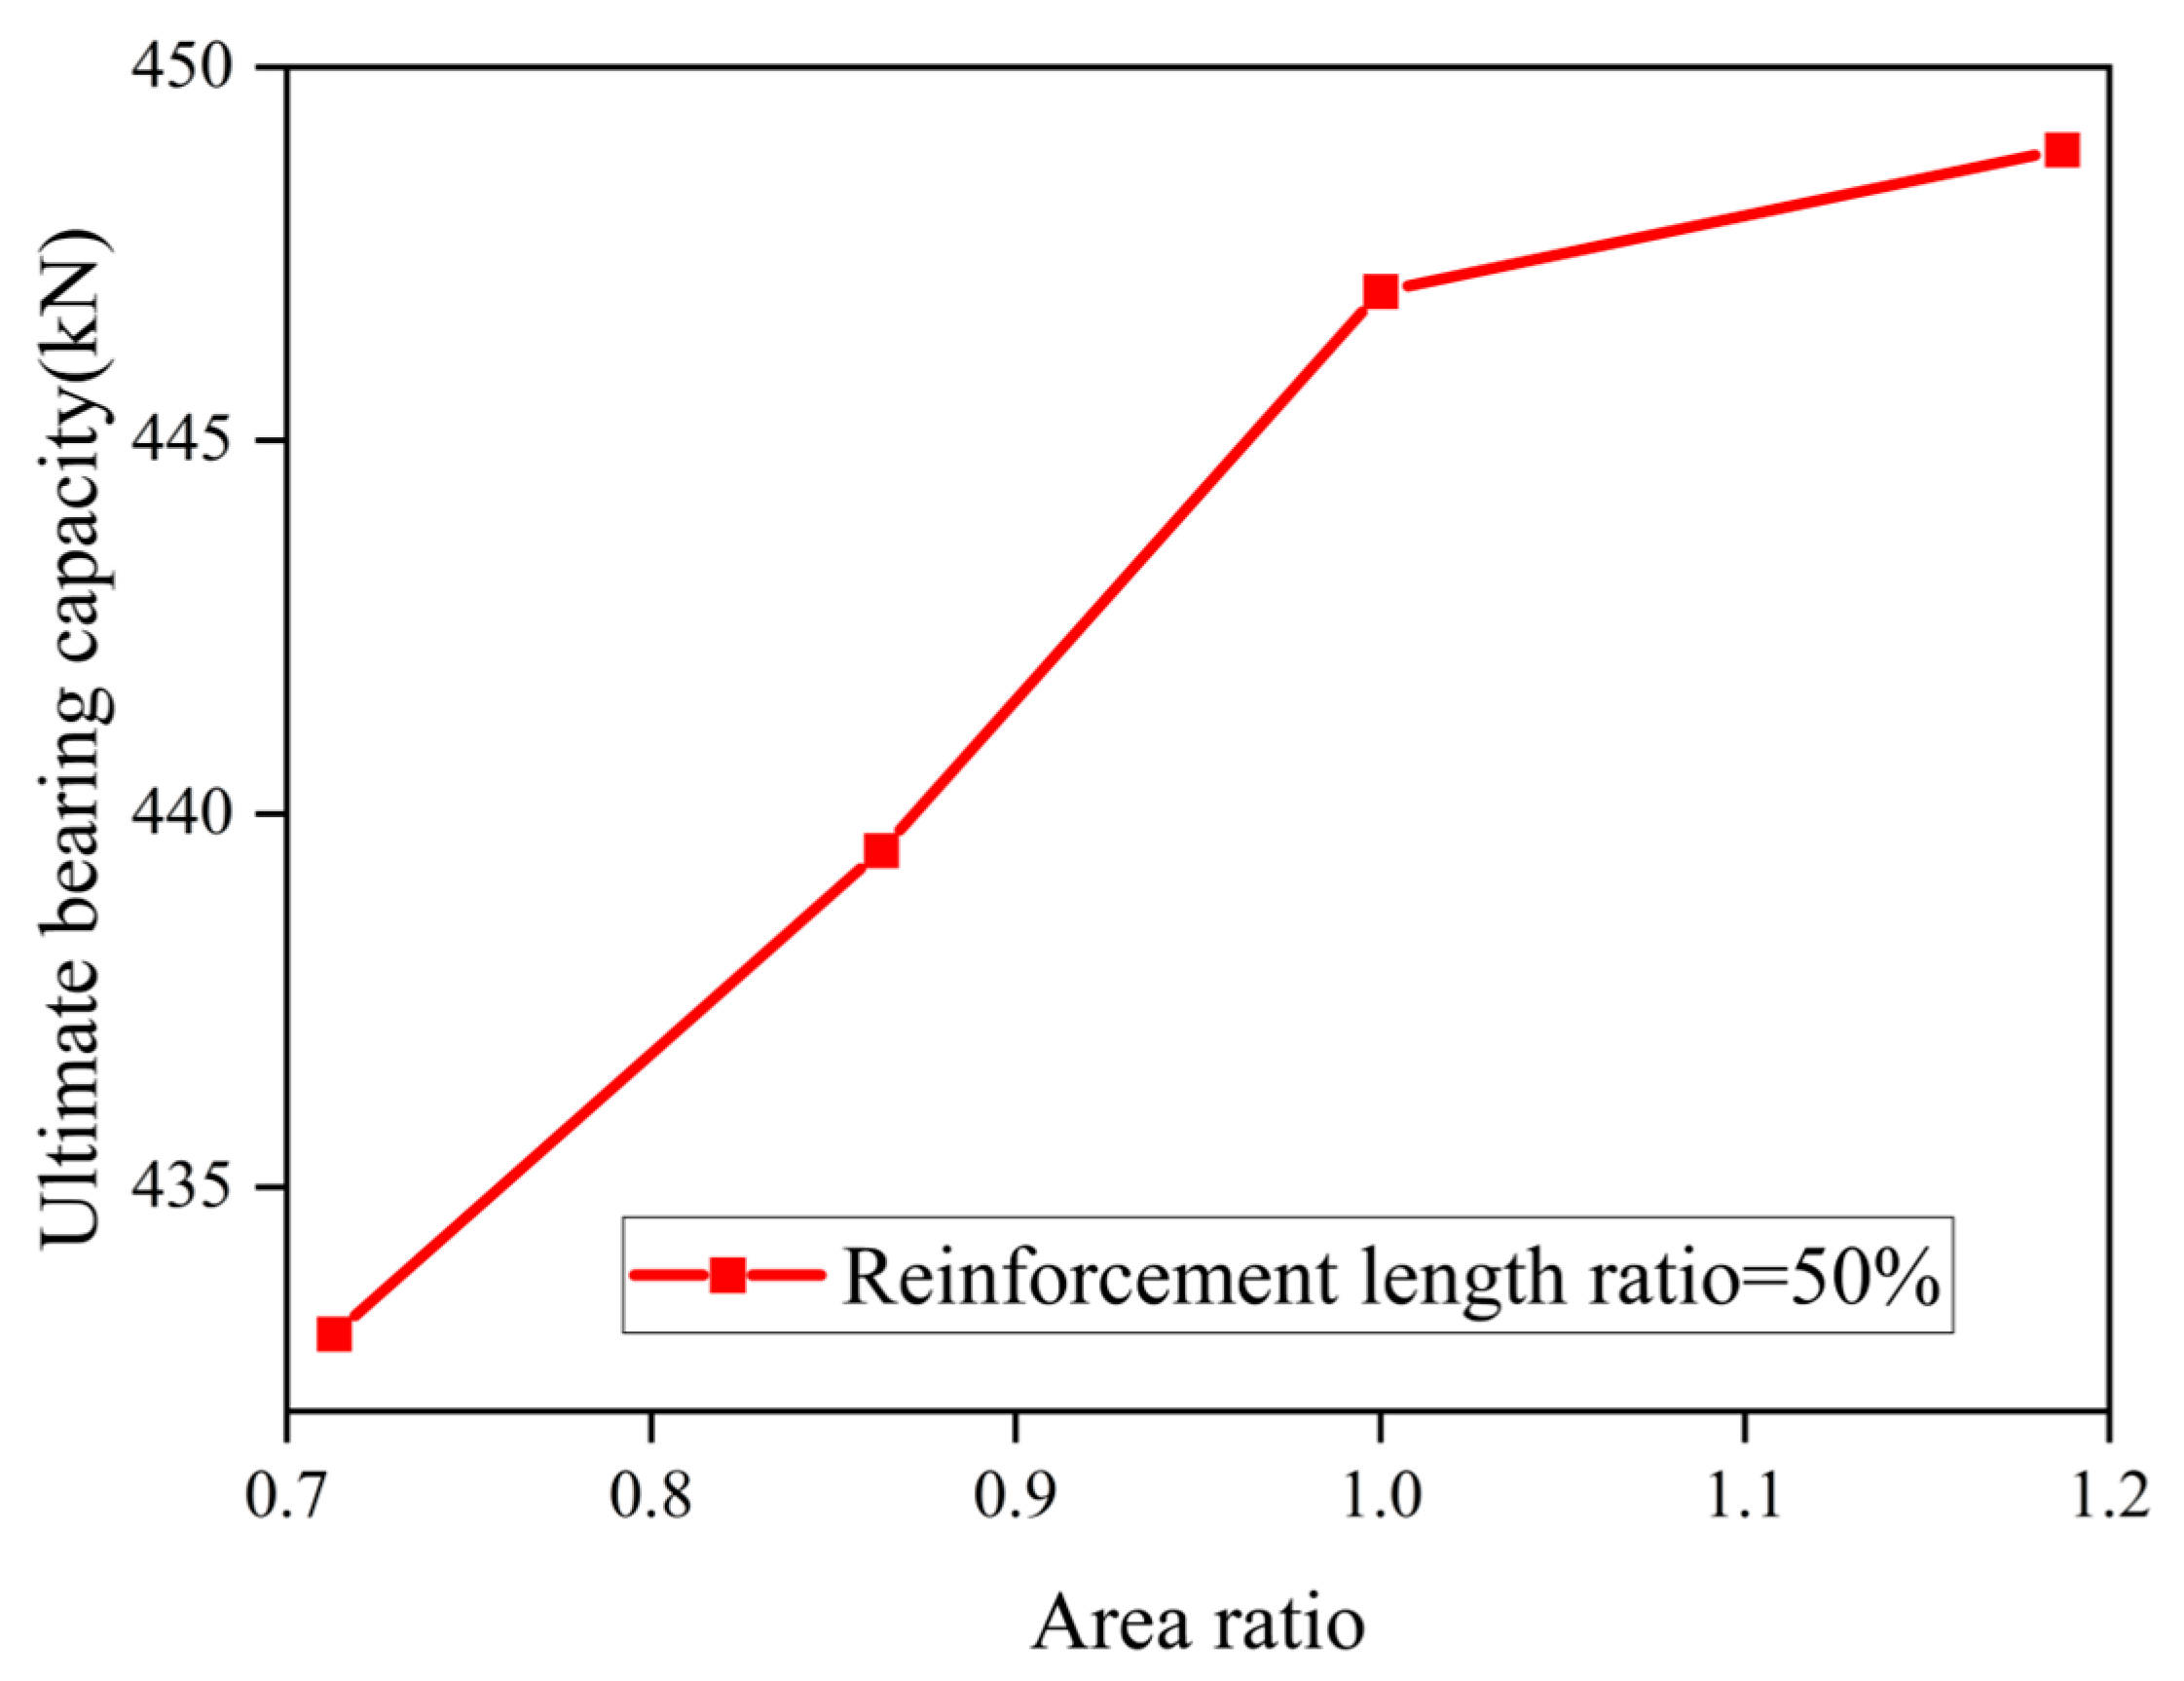
4.3.6. Reinforced Area Ratio

The section area ratio of different strengthening parts to the strengthened parts will also affect the reinforcement efficiency. The ultimate bearing capacity of the member increases with the increase in the area ratio of the reinforced member. However, when the area ratio of the reinforced member is greater than 1, the increasing trend of the ultimate bearing capacity of the member decreases, and the efficiency of the reinforcement with a larger section decreases. The reinforcement with an excessively large section wastes a lot of material properties, which is particularly significant in the local reinforcement. Figure 25 shows the ultimate bearing capacity under different area ratios of reinforcement parts under local reinforcement of 50% of the member’s length.

4.3.7. Weld Distribution

The distribution of welds affects the residual stress region generated in the welding process of components, and the larger the residual stress distribution region, the wider the area of advance yield caused by residual compressive stress, which also leads to greater mechanical defects in the long weld compared with the intermittent weld. However, in order to ensure the co-working state of the strengthening part and the strengthened part, the weld must meet the sufficient length to ensure the increase in the equivalent cross-sectional area of the reinforced member under the increased cross-section method, thus increasing the overall stiffness of the member and thus increasing the ultimate bearing capacity under the instability failure. Therefore, it is necessary to obtain the optimal welding scheme under the balance of weld length and residual stress distribution.
In this research, the welding takes place between the reinforced part and the connecting steel plate, and the residual stress on the reinforced part is small. Therefore, the full-length weld is selected to ensure that the strengthening part and the strengthened part are closely connected, and the joint working efficiency is maximized.

5. Calculation of the Ultimate Bearing Capacity

Based on the aforementioned parametric analysis, a sensitivity analysis was conducted to evaluate the impact of various parameters and derive the empirical formula under the reinforcement method. The ratio, Ra, of the ultimate bearing capacity after reinforcement to the bearing capacity of the unreinforced component represents the reinforcing efficiency of this method. The independent effects of different parameters on the Ra were quantified using ANOVA, while the contribution of each parameter to the Ra was assessed through the standardized regression coefficient (SRC).
S R C = β i × σ i σ R a
In the formula, β i is the regression coefficient, σ i is the standard deviation of the parameter, and σ R a is the standard deviation of the Ra. The sensitivity factors for each coefficient are presented in Table 4.
Through a large number of finite element analyses, the results of ultimate bearing capacity were obtained, and four parameters that have a relatively significant influence on the ultimate bearing capacity were identified: the initial preload ratio, the reinforcement length, the slenderness ratio, and the initial defect. The ratio Ra obtained through nonlinear regression analysis by using Origin software is as shown in Equation (4). Each parameter of this regression equation is p < 0.05, and R 2 = 0.922 , indicating a good fitting result.
R a = 0.821 + 0.667 α + 2675 e 0 + 8.715 l 0 2 + 0.206 λ 0 2 5598 l 0 e 0
In the formula, α is the initial stress ratio when the member is reinforced, e 0 is the ratio of the initial defect size of the unreinforced member to the overall length, l 0 is the ratio of the reinforcement length to the overall length of the member, and λ 0 is the normalized slenderness ratio of the unreinforced member. This formula is generally applicable when the ratio of the cross-sectional area of the reinforced member to that of the unreinforced member is greater than 0.6. The formula serves as a conservative design tool within the tested domain and recommended probabilistic safety factors (e.g., γ = 1.2) for untested scenarios.
Equation (4) is compared with the above experimental values and finite element simulation results. The relative errors of the ultimate bearing capacity test results, simulation results, and calculation results of this equation under non-direct welding sleeve reinforcement are all within the range of ±10%, as shown in Figure 26. Therefore, this equation can calculate the ultimate bearing capacity under sleeve reinforcement relatively accurately, and the calculation of the ultimate bearing capacity under this reinforcement method is shown in Equation (5).
N d = R a · N 0 = R a · φ A C f y
In the formula, φ is the stability factor of a steel tube, A C is the section area of an unreinforced steel pipe, and f y is the yield strength of a steel pipe member.

6. Conclusions

  • In this paper, a new method for strengthening welded casings is proposed. Instead of direct welding, the reinforced part is attached using natural cooling and shrinkage after welding. This reduces residual stress and mechanical defects. The proposed method demonstrates competitive efficiency for steel pipes under high loads compared to the conventional welding techniques, with superior residual stress control and a shorter installation time. The finite element analysis shows the minimal impact of welding heat on the ultimate bearing capacity, providing an effective strengthening scheme for space steel structures. Compared to the traditional welding methods, the proposed method reduces the labor hours by 30% and lowers the labor costs.
  • In this research, axial compression tests were conducted on welded pipe reinforcements under load. The results show that reinforcement significantly increases the bearing capacity. Before reinforcement, members fail due to instability; after reinforcement, they fail due to overall buckling after local buckling. The yield load of the reinforced members was increased by 30–40%, which verified the feasibility of this reinforcement method.
  • In order to make the finite element simulation method more reliable, a combined method of live/dead elements and thermo-mechanical coupling was used for finite element simulations. By comparing the simulation results with the experimental data, the relative error of the ultimate bearing capacity of the two is less than 6%, which confirms the accuracy of the numerical simulation process.
  • The test and simulation results were compared to study the ultimate bearing capacity of reinforced steel pipes under load. An improved formula for the local reinforcement length and axial compression force was derived. Recommendations for optimal reinforcement lengths for long and short columns are provided (50~65% for long columns and 75~90% for short columns).
  • Finite element models were used to study the effects of preload level, initial defects, slenderness ratio, reinforcement length, area ratio, and welding thermal influence on the ultimate bearing capacity. Quantitative analysis provides a reference for reinforcing steel members under various loads.
  • To further validate the practical application effectiveness of this reinforcement method, it is necessary to propose large-scale structural testing and long-term fatigue monitoring and evaluate the metallurgical defects, thereby optimizing the overall reinforcement process.

Author Contributions

Conceptualization, Y.L. and K.X.; Methodology, Y.F., Y.L. and K.X.; Software, Y.F.; Validation, Y.F.; Formal analysis, Y.F.; Investigation, Y.F. and Y.L.; Resources, Y.L., K.X. and Z.L.; Data curation, Y.L. and Z.L.; Writing—original draft, Y.F.; Writing—review & editing, Y.F., Y.L., K.X. and Z.L.; Visualization, Y.F.; Supervision, Y.L., K.X. and Z.L.; Project administration, Y.L., K.X. and Z.L.; Funding acquisition, K.X. All authors have read and agreed to the published version of the manuscript.

Funding

This research received no external funding.

Data Availability Statement

The original contributions presented in this study are included in the article. Further inquiries can be directed to the corresponding author.

Conflicts of Interest

Author Yiwei Fang was employed by the company China Metallurgical Construction Research Institute Co., Ltd. Yuming Li was employed by the company Inspection and Certification Co., Ltd. The remaining author declare that the research was conducted in the absence of any commercial or financial relationships that could be construed as a potential conflict of interest.

References

  1. Al Ali, M.; Kvočák, V.; Platko, P. Stress State of Steel Column Strengthened Under Load. Procedia Eng. 2017, 190, 632–636. [Google Scholar] [CrossRef]
  2. Liu, Y.; Gannon, L. Experimental behavior and strength of steel beams strengthened while under load. J. Constr. Steel Res. 2009, 65, 1346–1354. [Google Scholar] [CrossRef]
  3. Erfani, S.; Naseri, M.; Akrami, V. Effect of in-service strengthening on the axial load carrying capacity of steel box columns. Int. J. Steel Struct. 2017, 17, 231–244. [Google Scholar] [CrossRef]
  4. Xiangyang, J.; Haiqing, L.; Zhongwei, Z.; Xiufeng, W.; Ming, L.; Zimu, C. A study of the mechanical behavior of rectangular steel tubular column strengthened using intermittent welding angle steel. Structures 2021, 33, 3298–3310. [Google Scholar]
  5. Zhongwei, Z.; Pingyi, Z.; Song, Z. Loading capacity of welded hollow spherical joints strengthened by cone member. Structures 2023, 58, 105634. [Google Scholar]
  6. Goldak, J.; Chakravarti, A.; Bibby, M. A new finite element model for welding heat sources. Metall. Trans. B 1984, 15, 299–305. [Google Scholar] [CrossRef]
  7. Marzouk, H.; Mohan, S. Strengthening of wide-flange columns under load. Can. J. Civ. Eng. 1990, 17, 835–843. [Google Scholar] [CrossRef]
  8. O’Sullivan, T.P. Strengthening of steel structures under load. Proc. Inst. Civ. Eng. 1953, 2, 76–95. [Google Scholar]
  9. Tafsirojjaman, T.; Fawzia, S.; Thambiratnam, D. Investigation on the behaviour of CFRP strengthened CHS members under monotonic loading through finite element modelling. Structures 2020, 28, 297–308. [Google Scholar] [CrossRef]
  10. Tafsirojjaman, T.; Miri, A.; Khuda, E.N.S.; Ahmed, A.; Islam, A.S.; Khan, M. Structural performance of CFRP strengthened SHS beam-column connections subjected to monotonic loading: A numerical simulation. Structures 2024, 61, 106030. [Google Scholar] [CrossRef]
  11. Wei, J.; Ding, Z.; Shen, W.; Xiaoqin, L. Mechanical Characteristics of Cracked Lining Reinforced with Steel Plate–UHPC Subjected to Vertical Load. Buildings 2024, 14, 1515. [Google Scholar] [CrossRef]
  12. Açıkel, H.; Kaltakcı, M.Y.; Sönmez, A. Reinforcement of Steel Tubes with Rings under Compression. Mater. Test. 2013, 55, 772–780. [Google Scholar]
  13. Bingsheng, H.; Haitao, C.; Fang, Y. Experimental study on axial compressive behavior of circular steel tubes strengthened by sleeved pipe. J. Build. Struct. 2020, 41, 198–206. [Google Scholar]
  14. Yuanqing, W.; Ruixiang, Z.; Guoxin, D. Experimental study on load-carrying behavior of I section steel columns strengthened by welding with initial load. J. Build. Struct. 2014, 35, 78–86. [Google Scholar]
  15. Li, J.; Yuanqing, W.; Guoxin, D. Influence Factor Analysis of Mechanical Behavior of Compression-bending Member of Steel Structure Strengthened by Welding Under Load. J. Archit. Civ. Eng. 2016, 33, 120–126. [Google Scholar]
  16. Liu, H.; Hu, J.; Chen, Z.; Wang, L.; Mashrah, W.A.H. Reinforcement of Circular Steel Tubes Using Welded Casings Under Axial Compression Loading. Int. J. Steel Struct. 2022, 22, 894–912. [Google Scholar]
  17. Hongbo, L.; Jie, H.; Yuan, Y.; Zhihua, C.; Longxuan, W. Circular steel tubes strengthened by welding angle steel under preloading condition. J. Constr. Steel Res. 2021, 184, 106816. [Google Scholar]
  18. Zhao, X.; Lyu, J.; Yan, S.; Chen, X.; Wu, X.; Xu, X.; Gao, F. Performance evaluation of axial-loaded circular steel tubes strengthened by welding under service load. Eng. Struct. 2022, 271, 114948. [Google Scholar]
  19. Vild, M.; Bajer, M. Strengthening Under Load: Numerical Study of Flexural Buckling of Columns. Procedia Eng. 2017, 190, 118–125. [Google Scholar]
  20. Mourad, K.; Amar, K.; Marc, O. Modelling of Strengthened Steel Connections under Static and Cyclic Loading. Buildings 2022, 12, 1962. [Google Scholar] [CrossRef]
  21. Ji-hao, C.; Yu-xin, W.; Qian, Z.; Ming-zhen, G.; Bu-qiao, F. Mechanical properties and reinforcement technology of deep joints under static and fatigue loads. Structures 2023, 47, 1182–1195. [Google Scholar]
  22. Bibby, M.J.; Chong, L.M.; Goldak, J.A. Predicting Heat-affected Zone Hardness by the weld test method. J. Test. Eval. 1982, 11, 56–57. [Google Scholar]
  23. Weifeng, T.; Jialiang, S.; Jiping, H. Effective length factors of stepped columns considering interaction effect among columns. J. Build. Struct. 2021, 42, 159–171. [Google Scholar]
  24. Kyvelou, P.; Huang, C.; Li, J.; Gardner, L. Residual stresses in steel I-sections strengthened by wire arc additive manufacturing. Structures 2024, 60, 105828. [Google Scholar]
  25. Jaromir, M.; Jiri, S.; Pavel, S.; Robin, T. Heat Input Influence on the Fatigue Life of Welds from Steel S460MC. Metal 2020, 10, 1288. [Google Scholar]
  26. Zheng, X.; Li, D.; Liao, W.; He, Z. Residual Stress and Fatigue Strength Analysis of Stiffener Welds of Steel-Plate Composite Girder Bridge Considering Welding Sequence. Buildings 2024, 14, 1801. [Google Scholar] [CrossRef]
Figure 1. Diagram of specimen after reinforcement.
Buildings 15 01042 g001aBuildings 15 01042 g001b
Figure 2. Diagram of tested specimens for material property test.
Buildings 15 01042 g002
Figure 3. Diagram of stress–strain in curves for material property test.
Buildings 15 01042 g003
Figure 4. Test loading device.
Buildings 15 01042 g004
Figure 5. Monotone loading system.
Buildings 15 01042 g005
Figure 6. Arrangement of strain gauge.
Buildings 15 01042 g006
Figure 7. Instability mode of specimens.
Buildings 15 01042 g007
Figure 8. Load–displacement curve.
Buildings 15 01042 g008
Figure 9. Load–strain curve for unreinforced section.
Buildings 15 01042 g009
Figure 10. Load–strain curve for reinforced section.
Buildings 15 01042 g010
Figure 11. Finite element analysis process allowing for welding process.
Buildings 15 01042 g011
Figure 12. Load–axial displacement curve.
Buildings 15 01042 g012
Figure 13. Failure mode of experiment and simulation.
Buildings 15 01042 g013
Figure 14. Axial normal stress contour diagrams.
Buildings 15 01042 g014
Figure 15. Reinforcement ratio under different preload levels.
Buildings 15 01042 g015
Figure 16. Reinforcement effects under different preload levels.
Buildings 15 01042 g016
Figure 17. Coupled effects of initial preload and length ratio on the reinforcement ratio.
Buildings 15 01042 g017
Figure 18. Reinforcement effects under different initial defects.
Buildings 15 01042 g018
Figure 19. Specimens under different slenderness ratios.
Buildings 15 01042 g019
Figure 20. Reinforcement ratio under different slenderness ratios.
Buildings 15 01042 g020
Figure 21. Specimens under different reinforcement lengths.
Buildings 15 01042 g021
Figure 22. Reinforcement ratio under different reinforcement lengths.
Buildings 15 01042 g022
Figure 23. The welding thermal effects of cross-section.
Buildings 15 01042 g023
Figure 24. Bearing capacity under different welding thermal effects.
Buildings 15 01042 g024
Figure 25. Bearing capacity under different area ratios.
Buildings 15 01042 g025
Figure 26. Comparison between calculated and simulated values.
Buildings 15 01042 g026
Table 1. Main parameters of specimens.
SpecimenDiameter of the Circular Steel Tube (mm)Reinforcement PositonDiameter of the Casing (mm)Method of ReinforcementSlenderness Ratio of Steel Pipe
S-1Φ89 × 5//Unreinforced83.9
S-2Φ89 × 5Steel pipe midspanΦ89 × 5Load-reinforced83.9
S-3Φ89 × 5Stell pipe lower partΦ89 × 5Load-reinforced83.9
Table 2. Material property test results.
Specimenfy (Mean ± SD)
(N/mm2)
fu (Mean ± SD)
(N/mm2)
Es
(N/mm2)
εs (%)εst (%)εu (%)COV (%)
Φ89 × 5361.4 ± 2.7515 ± 3.72.06 × 1050.1850.7825.6900.61
Table 3. Bearing capacity of specimens.
SpecimenNy (kN)Yield Load (kN)Pu (kN)Preload (kN)Preload Level
S-1203.9309.5392.7--
S-2203.9406.9443.978.30.384
S-3203.9396.1441.5136.30.668
Table 4. Sensitivity factors of parameters.
ParameterReinforcement LengthSlenderness RatioReinforced Area RatioInitial Stress RatioInitial Defect
σ i 0.19850.27880.058870.25025.783 × 10−4
SRC0.780.360.020.280.11
Disclaimer/Publisher’s Note: The statements, opinions and data contained in all publications are solely those of the individual author(s) and contributor(s) and not of MDPI and/or the editor(s). MDPI and/or the editor(s) disclaim responsibility for any injury to people or property resulting from any ideas, methods, instructions or products referred to in the content.

