1. Introduction
In the post-pandemic era, the global coronavirus disease 2019 (COVID-19) pandemic has underscored the significance of indoor air quality for human health and well-being. Since people spend approximately 70% of their time indoors, the quality of the indoor environment has a profound impact on our health [
1,
2]. The COVID-19 pandemic has urgently compelled the construction industry to reimagine ventilation systems and has accelerated advancements in the fields of healthy and green building, focusing on the critical balance between indoor health and energy consumption. This paradigm shift necessitates innovative solutions that harmonize infection control with energy sustainability, particularly in high-risk environments like hospitals. Maintaining rigorously safe indoor air quality at safe levels is pivotal for preventing the spread of airborne viruses [
3], which is especially crucial in managing the COVID-19 pandemic and mitigating the risk of other airborne respiratory diseases such as influenza, tuberculosis, mumps, and measles [
4].
During the epidemic era, there were several super-spread outbreaks in healthcare buildings, and the risk of nosocomial transmission became a great challenge for outbreak prevention and control. Healthcare buildings, particularly secondary general hospitals, serve as the primary providers of community healthcare in China and face significant challenges in controlling respiratory infections [
5,
6]. A large proportion of outpatients may carry respiratory pathogens [
7,
8], leading to a higher risk of cross-infection [
9]. Many of these hospitals were constructed several decades ago, exacerbated by the continuous rise in outpatient volumes [
10,
11], which has made infection control and energy consumption issues increasingly prominent [
12,
13]. Thus, implementing effective ventilation and infection control strategies in medical facilities is of paramount importance.
Studies have confirmed that aerosols are a major transmission pathway for respiratory particles carrying the virus in the hospital [
14], and this transmission route can be effectively controlled by properly designed ventilation systems, thus reducing the likelihood of indoor infection [
15,
16,
17]. In hospitals, mechanical and hybrid ventilation systems are often used to ensure indoor air quality because of their stable air supply and high system controllability [
18,
19]. Mechanical ventilation, which increases the air change rate (ACH), has been shown in numerous studies to significantly reduce the concentration of pathogens in indoor air [
20,
21,
22]. During the pandemic, Cheong et al. [
23] used computational fluid dynamics to demonstrate that increasing the mechanical ventilation rate in emergency rooms is one of the most effective ways to lower pathogen concentration and infection risk. However, while mechanical ventilation improves air circulation, it inevitably increases energy consumption due to the operation of fans and control systems.
Despite the difficulty in predicting and precisely controlling natural ventilation, its capacity to deliver substantial airflow and its potential for energy savings has led many researchers to study its effects on infection risk and energy consumption. Studies by Escombe and Qian et al. [
24,
25] on reducing tuberculosis transmission explored various methods to enhance natural ventilation rates, demonstrating their effectiveness in lowering infection risk for respiratory diseases. Similarly, Li et al. [
26] found that using the chimney effect to enhance natural ventilation in semi-enclosed hospital areas can dilute viral aerosols and significantly reduce the risk of COVID-19 transmission. Natural ventilation offers significant energy-saving benefits, particularly in warmer seasons, and is an important measure for reducing energy consumption [
27,
28]. Luo et al. conducted a systematic study on window-opening configurations in long-distance buses to identify optimal ventilation strategies for mitigating airborne infection risks in enclosed spaces [
29].
In addition to the research on ventilation strategies for controlling infection risk, scholars also investigated the management of building energy consumption during the COVID-19 pandemic. Zheng’s study highlights that measures such as extended HVAC operation hours and auxiliary equipment significantly impact energy use. In China, for instance, HVAC energy consumption surged by 128% during the pandemic, underscoring the need for designs that balance normal and pandemic conditions while minimizing energy use during outbreaks [
30]. Therefore, in the context of the COVID-19 pandemic, some scholars have begun to focus on the complex balance between infection risk and energy use. Li et al. [
31] proposed a novel multi-zone variable air volume system designed to optimize the switching of ventilation modes between normal and pandemic settings to strike a balance between these two objectives. Likewise, Risbeck et al. [
32] introduced a set of dynamic models that estimate both airborne infection risk and energy consumption in a building’s heating, ventilation, and air-conditioning system (HVAC) based on controller setpoints and weather forecasts. Nasim Samadi et al. [
33] designed a nonlinear model predictive controller to optimize the HVAC systems in a university building, aiming to minimize COVID-19 transmission risk and reduce energy consumption. Beyond optimizing control systems, reducing infection risks during seasonal disease peaks proves effective in balancing energy efficiency and infection risk. Vouriot et al. [
34] found through monitoring the existing carbon dioxide in classrooms that there is a significant seasonal variation in the risk of airborne transmission of respiratory infectious diseases in schools, with January and February being the high-incidence months in the UK. Pang’s EnergyPlus-based analysis reveals that COVID-19 risk is significantly influenced by climate and season, with increased outdoor air ratios effectively reducing infection risks across U.S. climate zones [
35].
While research on building ventilation strategies during the COVID-19 pandemic has addressed the balance between infection risk and energy consumption, significant limitations remain as follows. (i) Most studies have focused on common public buildings such as schools, offices, and shopping malls, with relatively little attention given to healthcare and hospital buildings, which are high-risk environments for infection. (ii) Existing research has primarily concentrated on strategies for mitigating COVID-19 transmission, with limited exploration of strategies for other infectious diseases that also pose high infection risks and without considering the seasonal variations in respiratory infectious diseases. (iii) Current improvements to ventilation systems tend to focus on modifying mechanical ventilation, while research on natural ventilation largely targets new buildings, overlooking the potential of hybrid ventilation strategies for reducing both infection risk and energy consumption in existing buildings.
In response to these identified gaps, this study proposes a novel multi-zone air-conditioning system for both newly constructed and retrofitted hospitals by seamlessly integrating adjustable window units into the existing fresh-air-handling unit (FAU) + fan coil unit (FCU) systems, which are commonly utilized in hospital settings, as detailed in
Section 2.1. Moreover,
Section 2.2 elaborates on the development of an advanced ventilation strategy specifically designed to enhance both infection control and energy efficiency within hospital air-conditioning systems. Furthermore,
Section 2.3 highlights our adaptation of the Wells–Riley model to incorporate seasonal coefficients, enabling a more accurate evaluation of transmission risks for five prevalent respiratory diseases.
Section 3 provides a comprehensive outline of the specific parameter configurations for a representative hospital building, including the functional spaces typically found in outpatient departments and the disease information required for calculating infection risks.
Section 4 evaluates the performance of existing ventilation systems while demonstrating the significant effectiveness of the proposed strategy in simultaneously reducing infection risks and energy consumption. Additionally, this section analyzes the variations in strategy performance across different diseases (
Section 5.1) and climate zones (
Section 5.2), further emphasizing its adaptability. Finally,
Section 6 summarizes the key findings of this study, providing a comprehensive overview of the research outcomes and their implications.
2. Proposed Hospital Air-Conditioning System and Optimal Ventilation Control Strategy
The novel multi-zone air-conditioning system targeted for hospital buildings is introduced in
Section 2.1, followed by the proposed optimal ventilation strategy elaborated in
Section 2.2. In addition, the seasonal transmission characteristics of respiratory infectious diseases and their innovative adaptation to the Wells–Riley model are thoroughly discussed in
Section 2.3.
2.1. Proposed Air-Conditioning System for Hospital Buildings
Figure 1 illustrates the schematic diagram of the proposed novel air-conditioning system specifically designed for hospital buildings. The proposed system consists of three key components: the fresh-air-handling unit (FAU), the automatic window-controlling unit (AWU), and the fan coil unit (FCU). The FAU delivers fresh outdoor air into indoor spaces through mechanical ventilation to meet the fresh air requirements of hospital occupants. Meanwhile, the multiple FCU systems, which represent the most prevalent HVAC configuration in Chinese hospitals [
36], manage the remaining indoor sensible load to maintain thermal comfort across multiple zones within hospital facilities, e.g., waiting rooms, corridors, and consult rooms [
37]. The AWU, serving as an innovative additional unit compared to conventional hospital air-conditioning systems, modulates window-opening degree, accommodating diverse design and operational requirements across various disease types and climate zones.
The operational principle of the fresh-air-handling unit (FAU) + automatic window-controlling unit (AWU) + fan coil unit (FCU) system for hospital buildings is described as follows. The AWU intelligently adjusts window openings based on real-time infection risk assessments derived from indoor air quality monitoring and occupancy patterns. If the ventilation rate falls below the GB55015-2021 [
38] requirements for pathogen dilution, the AWU adjusts the window-opening degree to introduce natural ventilation for infection risk mitigation. If natural airflow remains insufficient, the FAU supplements ventilation mechanically, and the unit automatically deactivates when the introduced ventilation volume satisfies the infection risk reduction criteria. If natural ventilation is sufficient, AWU shuts down after the indoor infection risk is reduced to the specified value. A dynamic window-opening schedule is developed based on calculated infection risk levels of different types, incorporating room-specific characteristics and occupant behavior patterns. Should the natural ventilation airflow remain inadequate for effective risk mitigation, the FAU activates its mechanical ventilation system to provide supplementary airflow with precise ventilation control. The FCU system works alongside both the FAU and AWU, mainly responsible for maintaining the indoor environmental settings. In hospital settings, where the primary occupants are patients and their families—many of whom have compromised immune systems or underlying health conditions—the maintenance of stable and precise indoor environmental parameters is particularly critical. The system’s performance is essential for ensuring thermal comfort and air quality, as any fluctuations or suboptimal conditions could potentially exacerbate patients’ health conditions or impede their recovery process.
2.2. Proposed Optimal Multi-Zone Ventilation Strategy for the FAU + AWU + FCU System
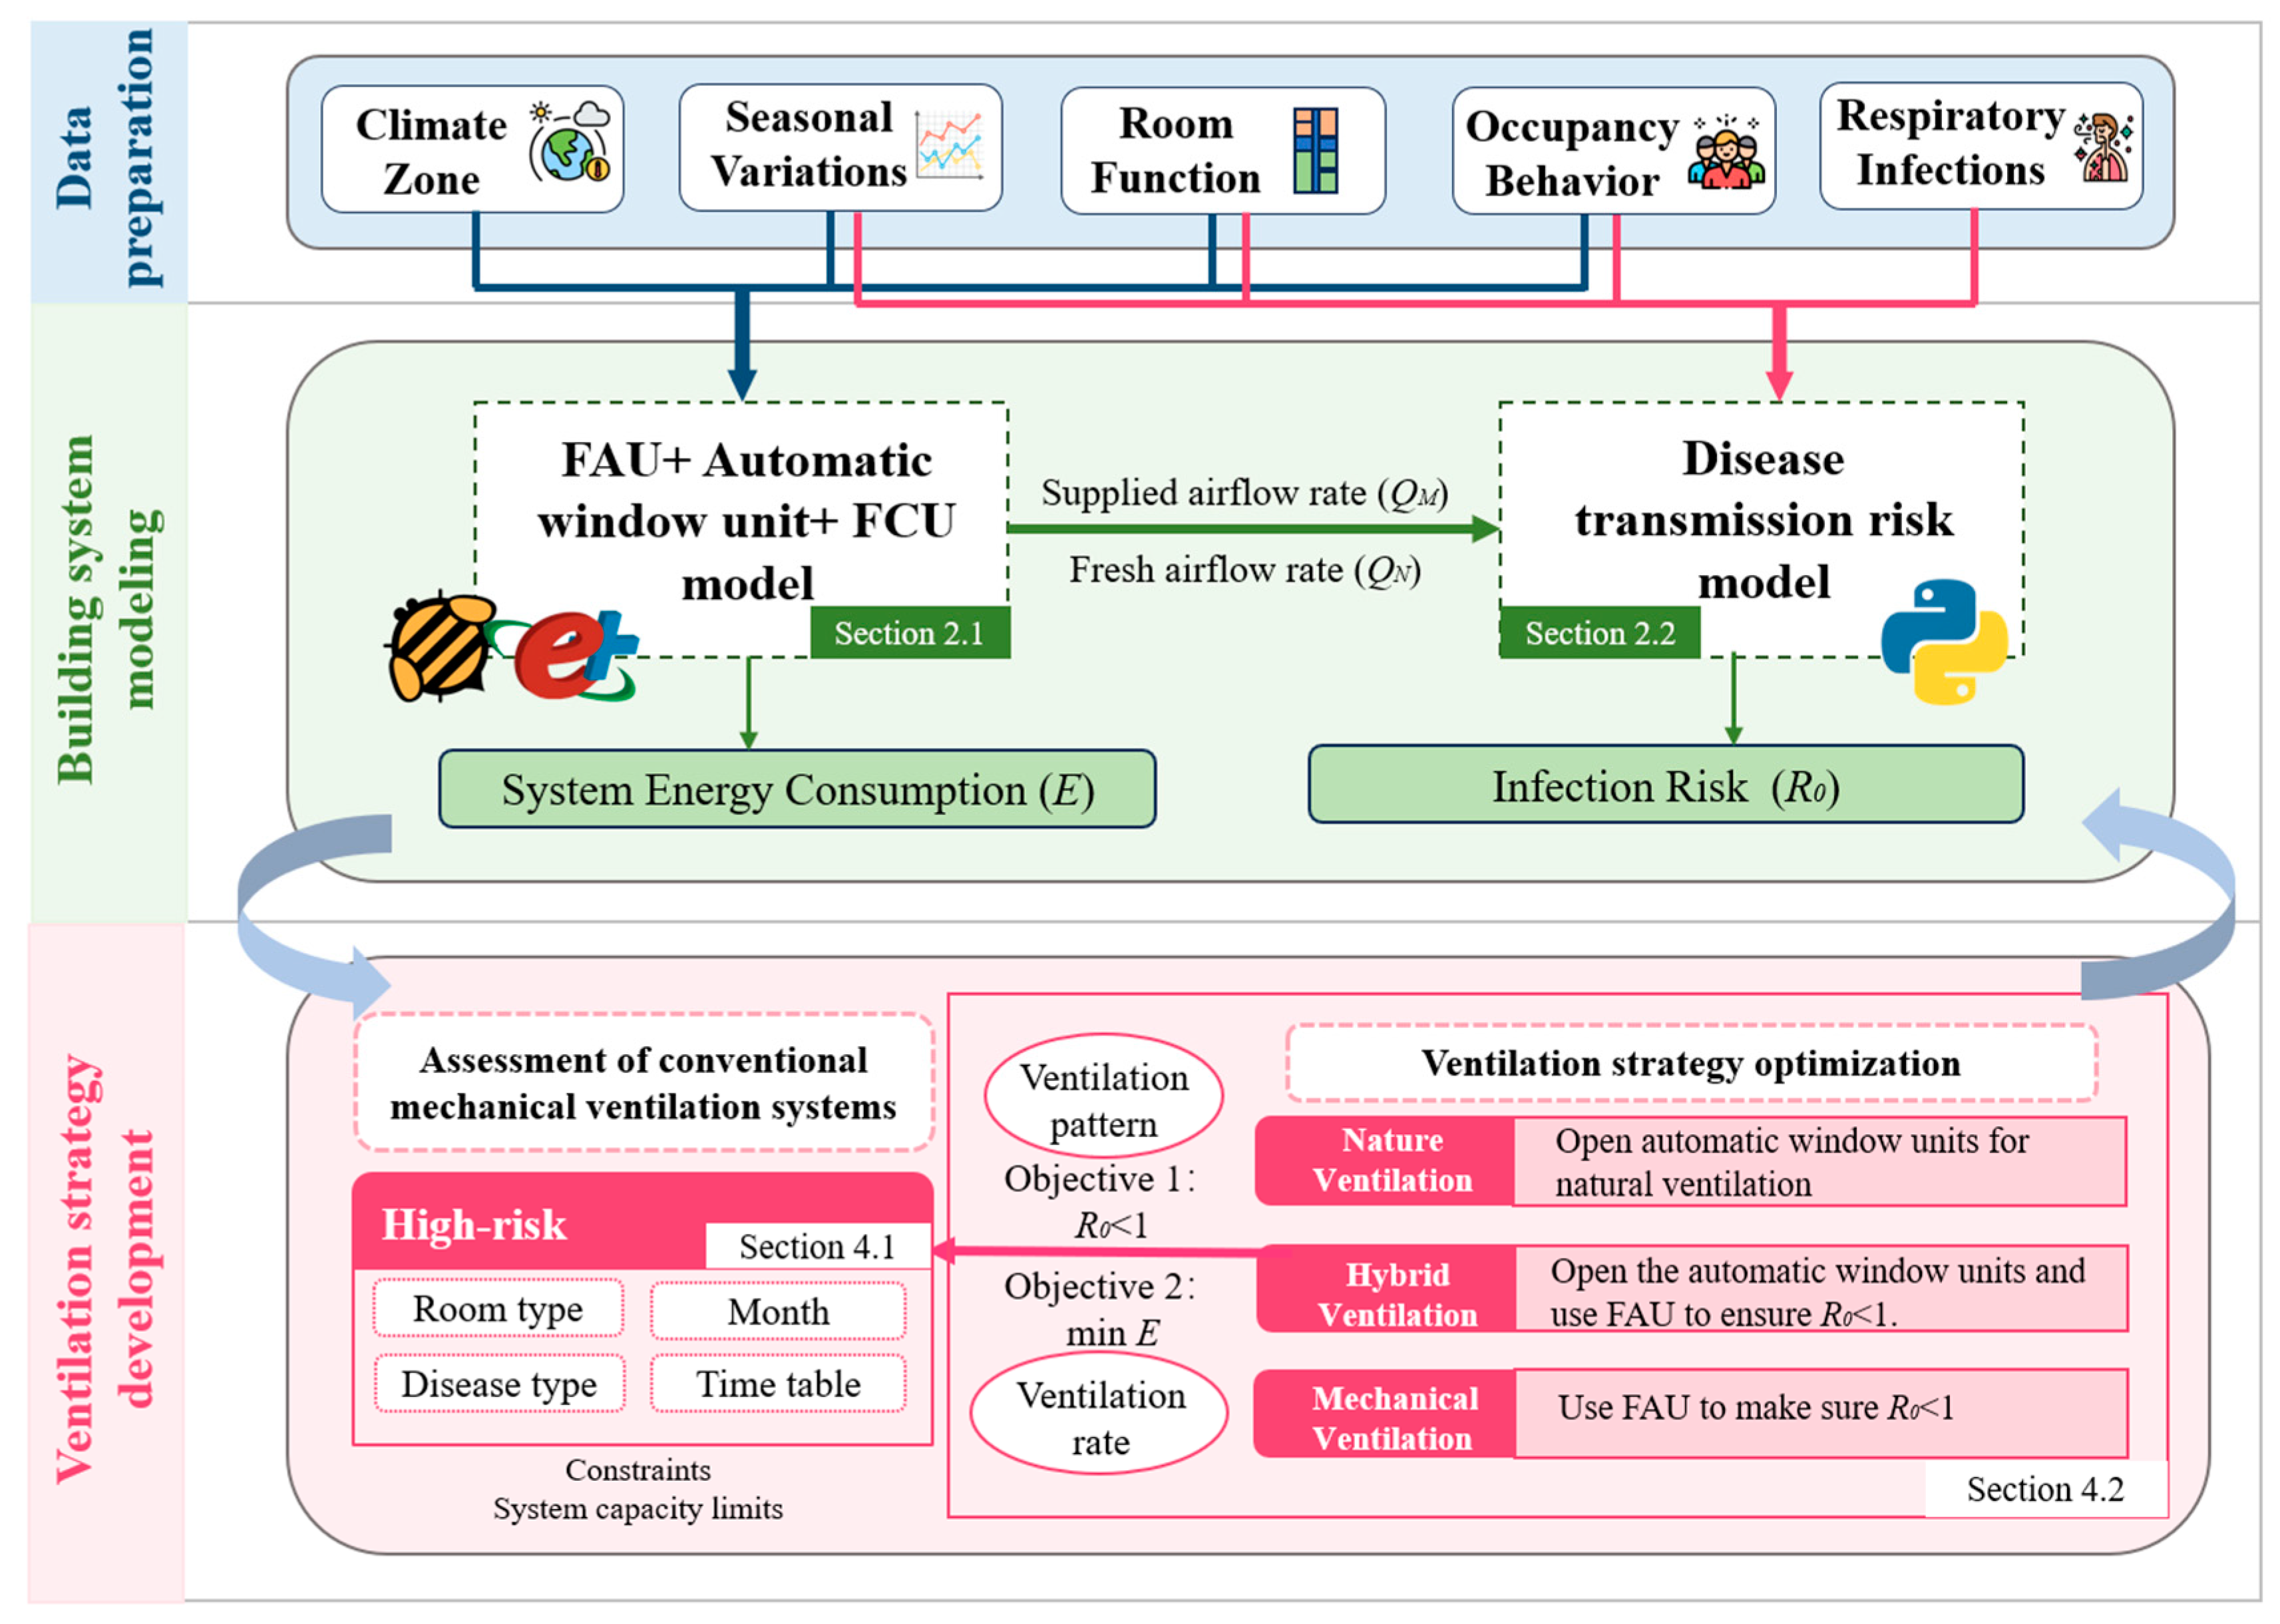
Figure 2 presents the outline of the corresponding proposed optimal multi-zone ventilation strategy for the FAU + AWU + FCU system in hospital buildings with multiple service rooms, including the following three steps: data preparation, building system modeling, and ventilation strategy development. The proposed strategy incorporates a novel air-conditioning system model enhanced with an AWU module and integrates the seasonal transmission characteristics of common respiratory diseases into the disease-transmission model to develop effective ventilation strategies. Additionally, the proposed strategy is designed to adapt to real-world applications by considering variations (e.g., disease types, climate zones, seasonal changes), ensuring a balanced approach to infection control and energy efficiency.
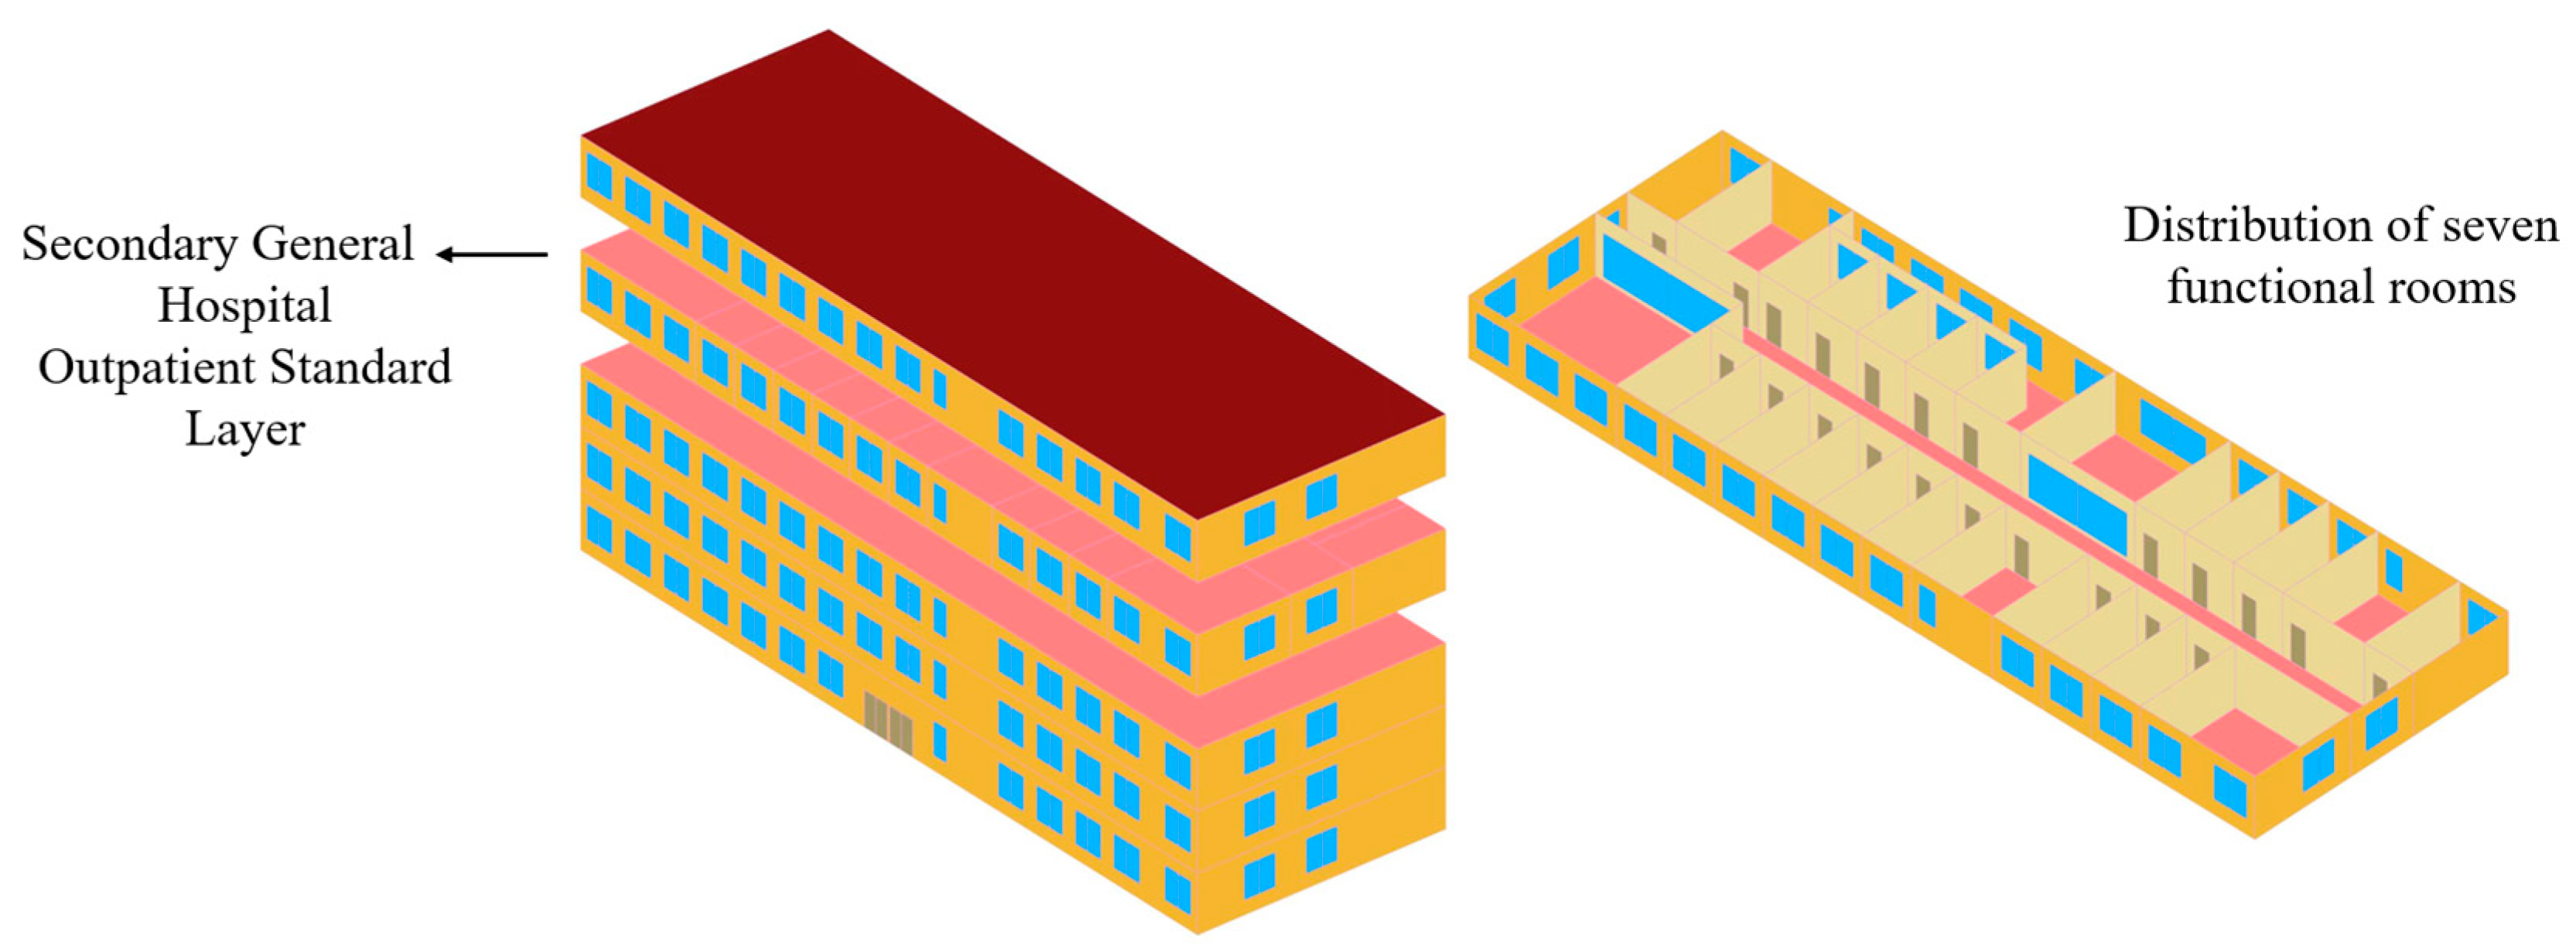
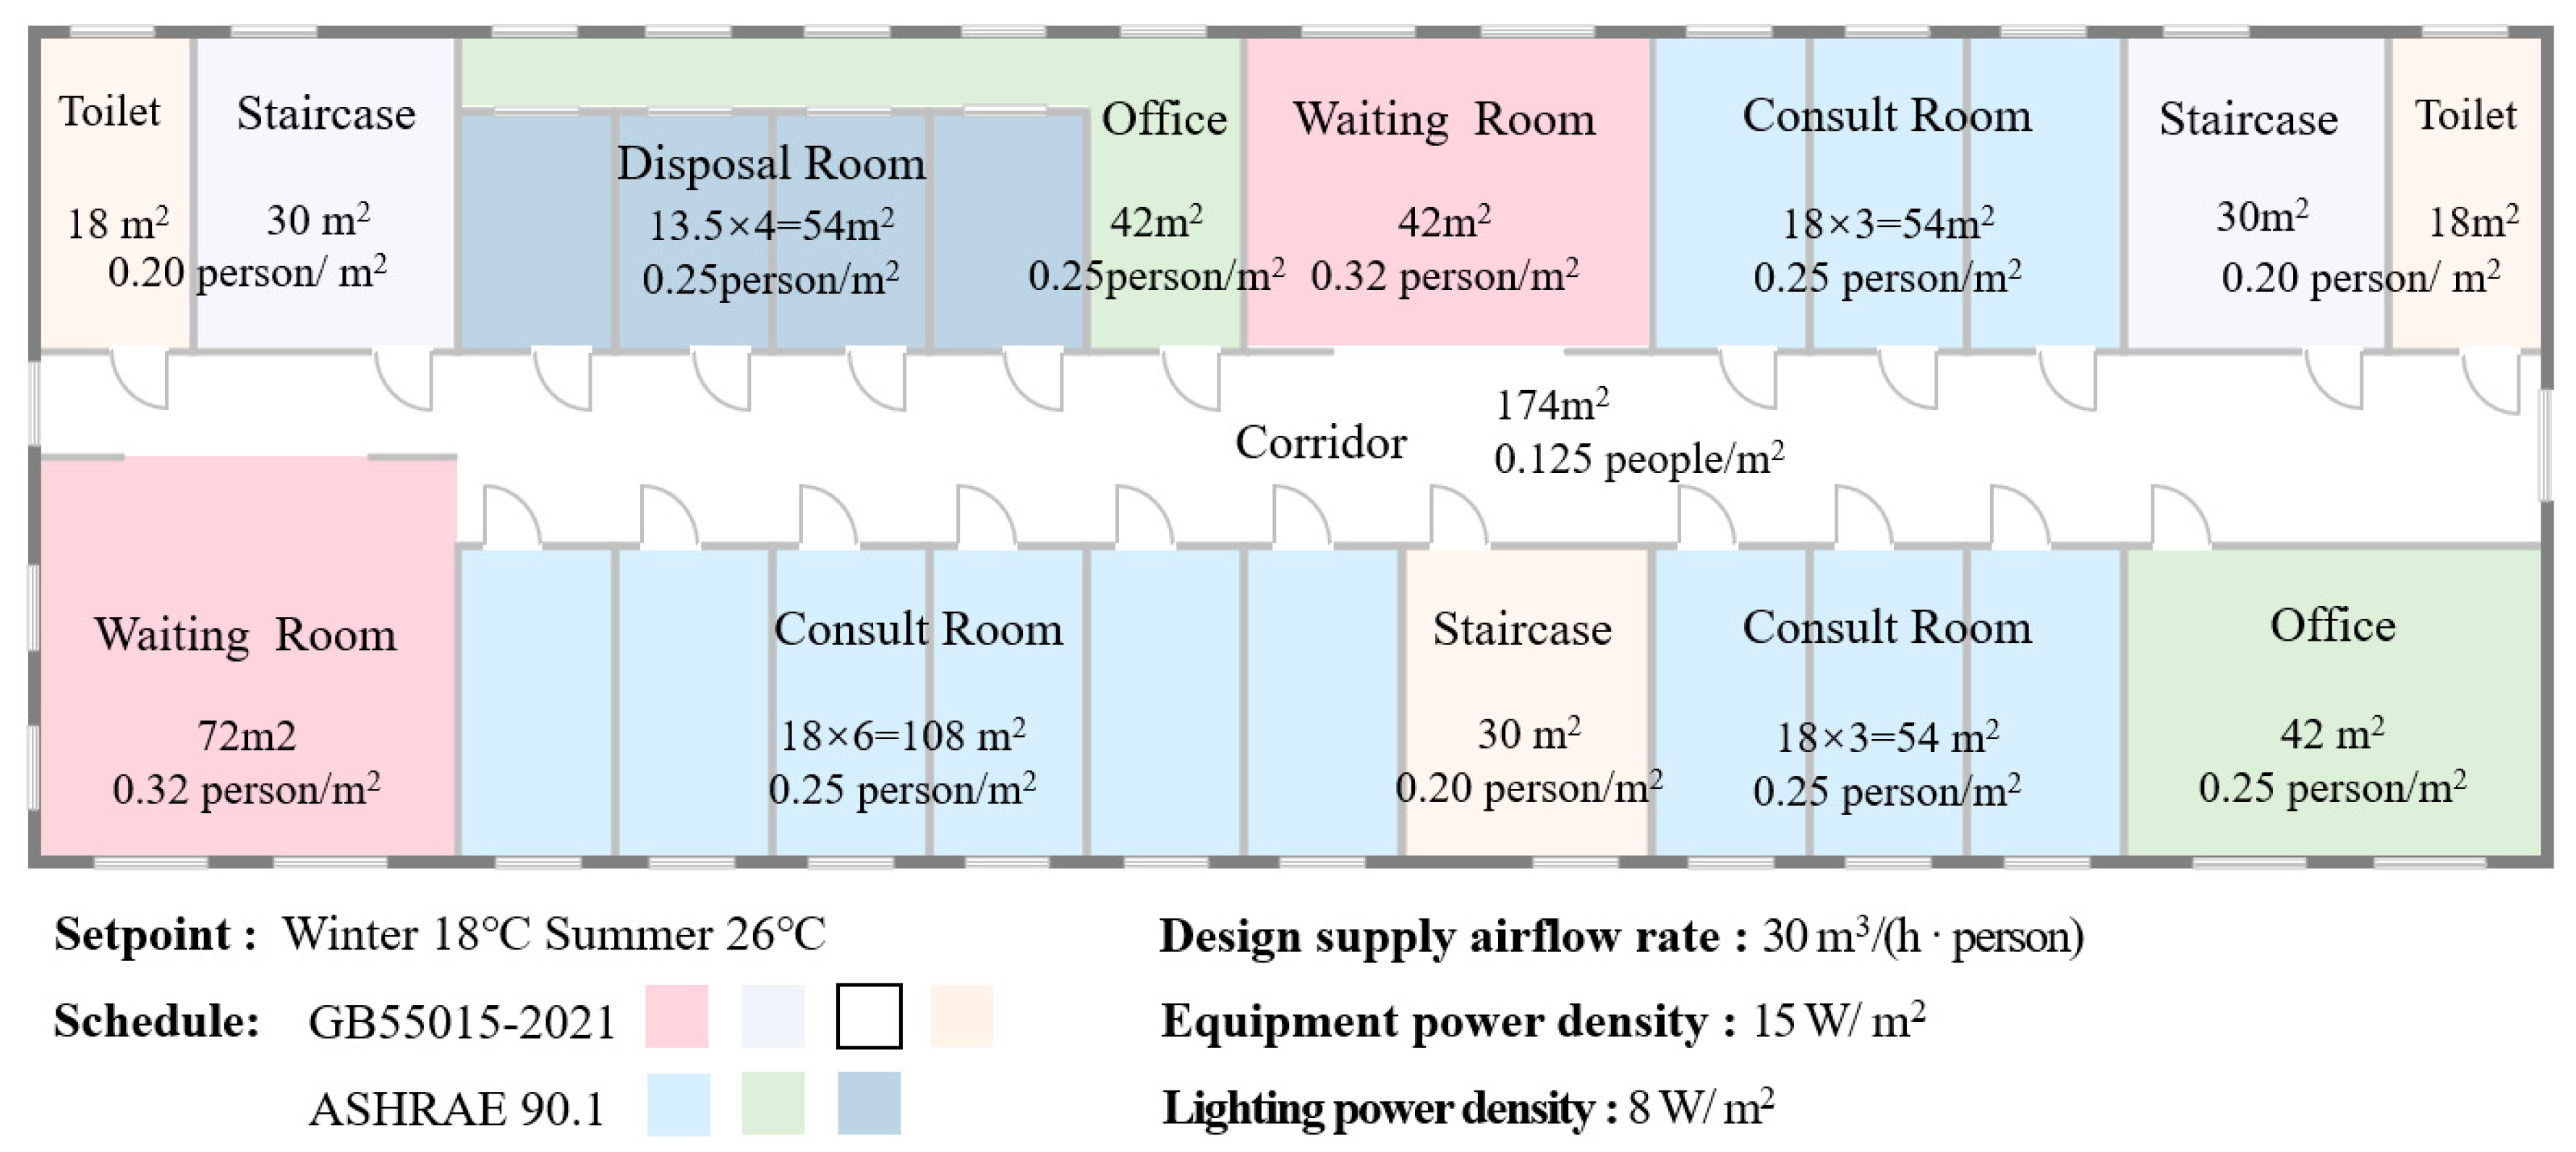
Data preparation: A comprehensive range of data and factors influencing both energy consumption and disease transmission are carefully considered to enhance the adaptability of the strategy and model. These factors include climate zone, seasonal variation, room function, occupant behavior, and types of respiratory diseases. To represent the diverse climatic conditions across China, five representative cities are selected to reflect the country’s major climate zones: severe cold (1B), cold (2B), hot summer and cold winter (3A), hot summer and warm winter (4B), and mild (5A) zones. Regarding room function, the study specifically focuses on occupant density and operational schedules for different room types, selecting seven primary spaces from hospital outpatient departments for detailed analysis. Moreover, both seasonal variation and occupant behavior are thoroughly accounted for, considering the differences in energy consumption across climate zones, disease-transmission patterns, and variations in occupancy schedules and activity levels. Finally, the study addresses five of the most common respiratory infectious diseases in China, chosen for their distinct transmission patterns and characteristics.
Building system modeling: Two key models are developed: an energy consumption model and a disease-transmission risk model. These models calculate multi-zone building energy consumption and infection risk across various climate zones and are linked through supplied airflow rate (
QM) and fresh airflow rate (
QN). Energy consumption models of the conventional air-conditioning system and the proposed air-conditioning system are developed in Rhino7with the Grasshopper plugin. The models incorporate Ladybug1.6.0 and Honeybee1.6.0 modules to interface with the EnergyPlus engine [
39]. The disease-transmission risk model is developed using the enhanced Wells–Riley equation and implemented with Python3.11, ensuring accurate infection risk estimation and enabling interaction between ventilation rate and infection control.
Ventilation strategy development: The transmission of respiratory infectious diseases within the hospital building is first assessed in terms of room type, disease type, and infection period, and the ventilation strategy is subsequently optimized based on these results. In low-risk rooms and during low-risk periods, the proposed strategy maintains the conventional ventilation conditions while preserving the original ventilation strategy wherever it proves to be effective. For high-risk periods and areas, the proposed strategy compares three ventilation modes to ensure the basic reproduction number (R0) for each disease remains below 1:
- (i)
Natural ventilation: When natural ventilation conditions are sufficient, the AWU is utilized to introduce natural airflow.
- (ii)
Hybrid ventilation: Natural ventilation is used first, with mechanical ventilation supplemented as needed to meet airflow requirements.
- (iii)
Mechanical ventilation: Only the FAU is used to deliver precise ventilation rates to each zone.
The proposed strategy optimizes ventilation modes and airflow rates to minimize energy consumption while reducing infection risk. By tailoring this approach to each climate zone and operational conditions, the proposed strategy ensures adaptability and effectiveness in diverse hospital settings.
2.3. Enhanced Disease-Transmission Risk Model Considering Seasonal Transmission Characteristics
The Wells–Riley equation [
40], traditionally used to estimate the infection risk
P of airborne diseases in hospitals, is a common model for assessing disease-transmission risk. The traditional Wells–Riley equation (as shown in Equation (1) [
40]) incorporates three main categories of parameters: (i) parameters related to spatial characteristics, such as exposure time, which is usually linked to room function, and ventilation rate
Q, determined by the ventilation system settings; (ii) parameters associated with human activity, such as the pulmonary ventilation rates
p (m
3/h), which varies depending on the occupant’s behavior; (iii) parameters related to the virus, including the quanta generation rate
q (quanta/h), which depends on the disease type, and the number of infectious individuals
I, which fluctuates according to the seasonal and cyclical nature of disease outbreaks.
During the SARS and COVID-19 pandemics, increased public concern over indoor air quality and health led to significant modifications of the Wells–Riley equation. Scientists introduced correction factors such as the rebreathed fraction [
40] and risk competition models [
41], accounting for pathogen viability, deposition characteristics, and engineering control measures (Equation (2) [
41]). These adjustments improved the model’s accuracy and relevance for real-world indoor infection risk assessments.
where
R0 is the basic number of infections, a commonly used indicator in epidemiology.
R0 < 1 indicates that the infection will gradually disappear, and there is no risk of infection.
n is the total number of people in the room.
Φ is the efficiency of the use of personal protective equipment (e.g., masks) [
42,
43].
ACH is the overall number of air changes in the room.
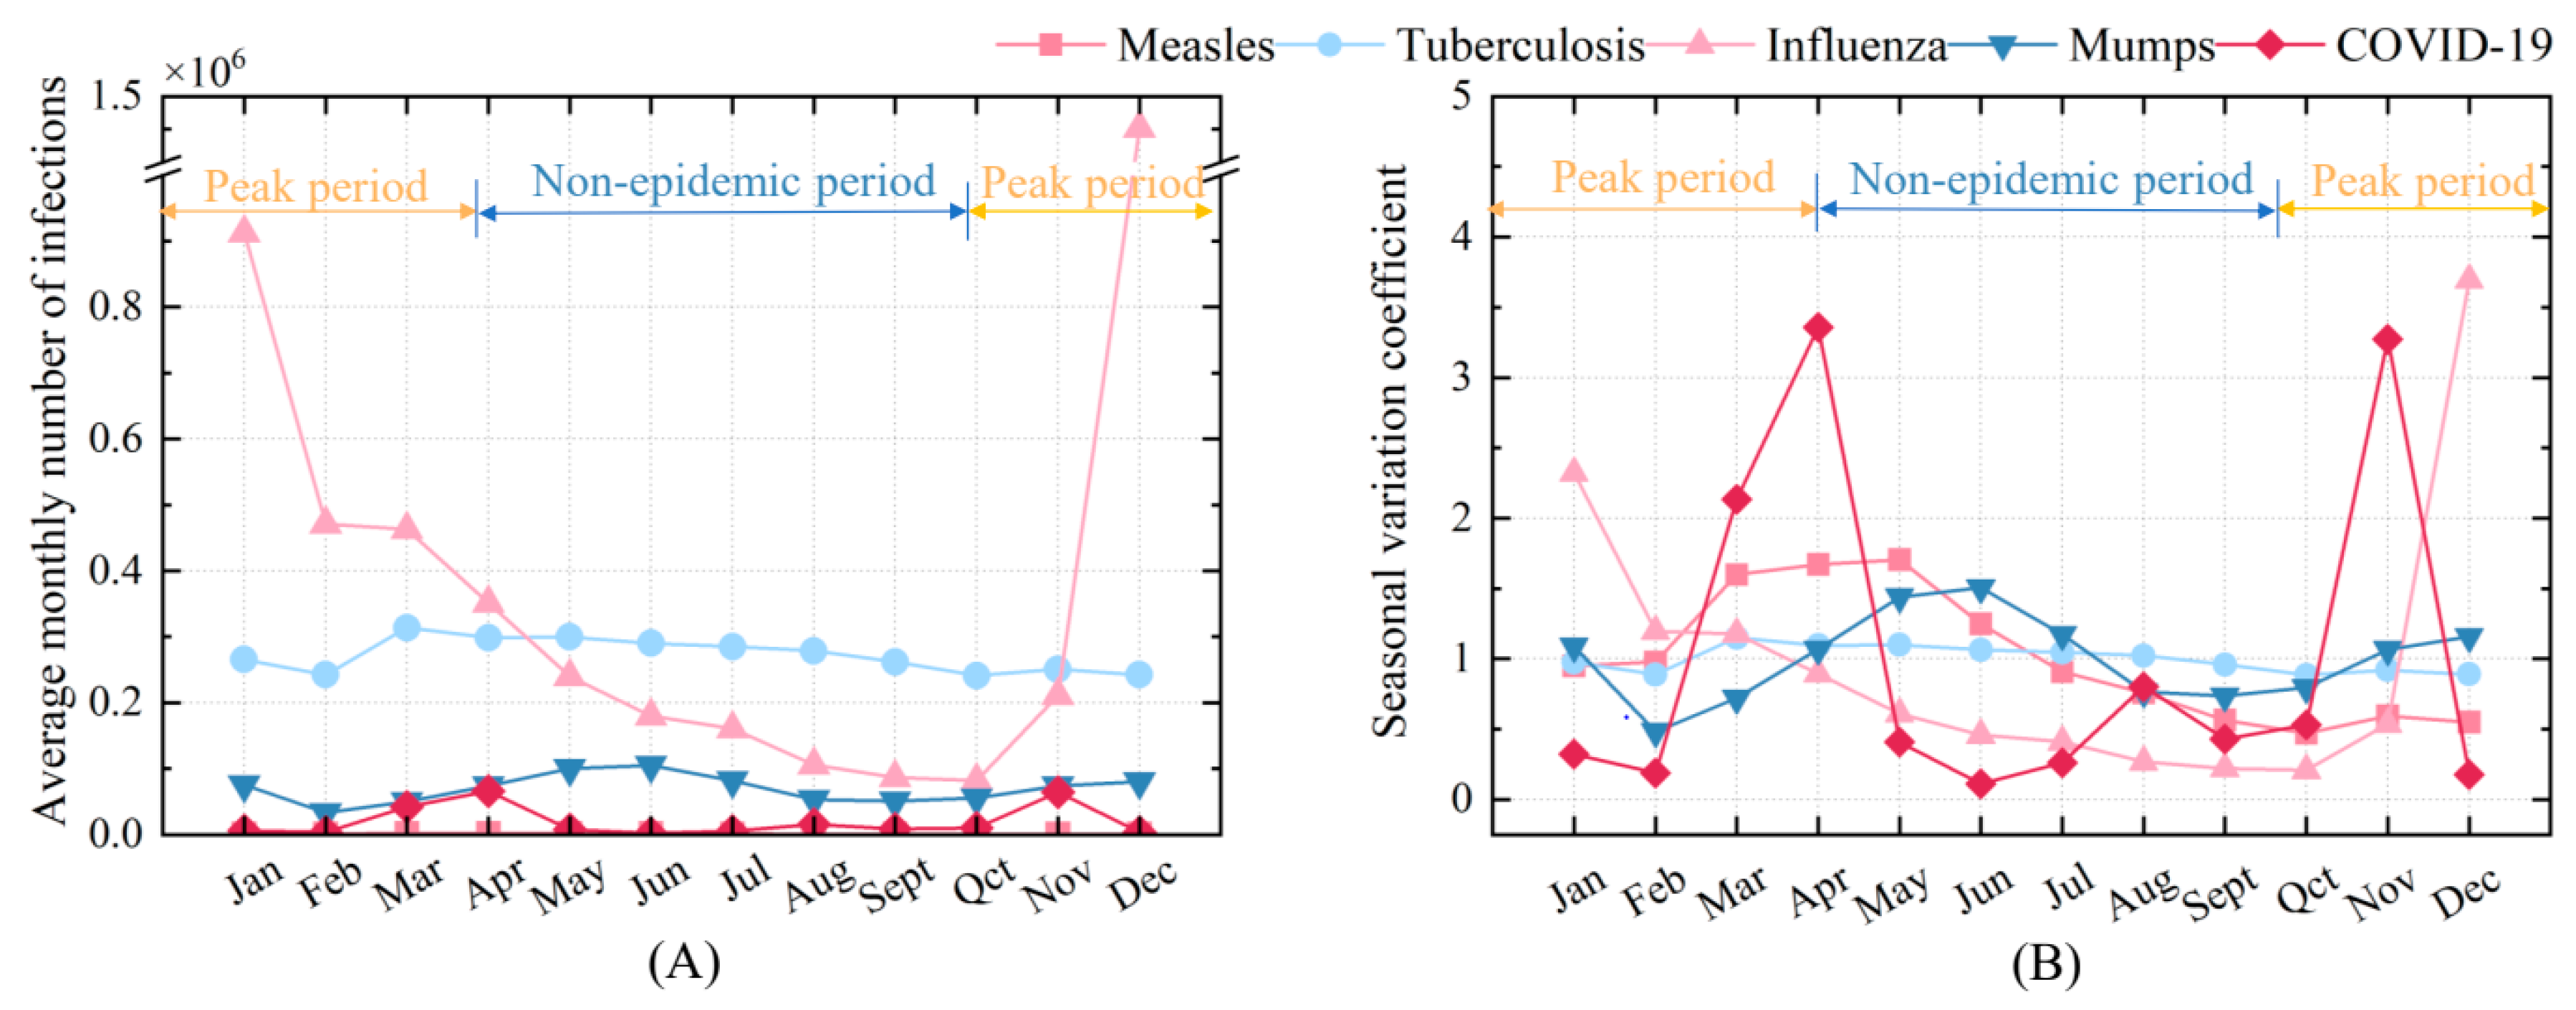
As previous studies have demonstrated, infectious diseases tend to exhibit seasonal patterns [
44,
45], which result in corresponding fluctuations in the number of infected individuals within a given space. To assess the impact of seasonal variation on disease transmission, an enhanced disease-transmission risk model considering seasonal transmission characteristics incorporating a seasonal variation coefficient
S is introduced, as shown in Equations (3) and (4). This coefficient reflects the ratio of the actual number of infections each month (
Ninfect, mon) to the average number of infections for that month (
Navg, infection, mon), revealing the seasonal fluctuation patterns of the five respiratory diseases (i.e., COVID-19, influenza, measles, mumps, and tuberculosis). In most current studies, the infection count
I is typically set to 1 for infection risk simulations [
46]. In the actual hospital environment, seasonal changes are often manifested in the peak season, during which the number of virus and bacteria carriers in the hospital increases [
7,
8]. Therefore, in this modified equation, Equation (4),
S represents the actual number of infections adjusted for seasonal variation within the indoor environment, which are considered in terms of their monthly incidence rates, as shown in
Figure 3, in China from January 2018 to December 2023. The data used are sourced from the official monthly reports on infectious disease epidemics published by the Chinese Center for Disease Control and Prevention (China CDC) [
47].
Figure 3 shows the seasonal varying characteristics of five respiratory infectious diseases provided by the Chinese Center for Disease Control and Prevention [
46], serving as the basis for this study. Spring and winter are the primary high-incidence seasons, with transitional months also exhibiting elevated infection rates. Notably, influenza, COVID-19, measles, and mumps demonstrate pronounced seasonal transmission characteristics, while tuberculosis shows less distinct seasonal variation. COVID-19 peaks in March, April, and November; measles from March to June; influenza in December and January; mumps from April to July; and tuberculosis in March and April.
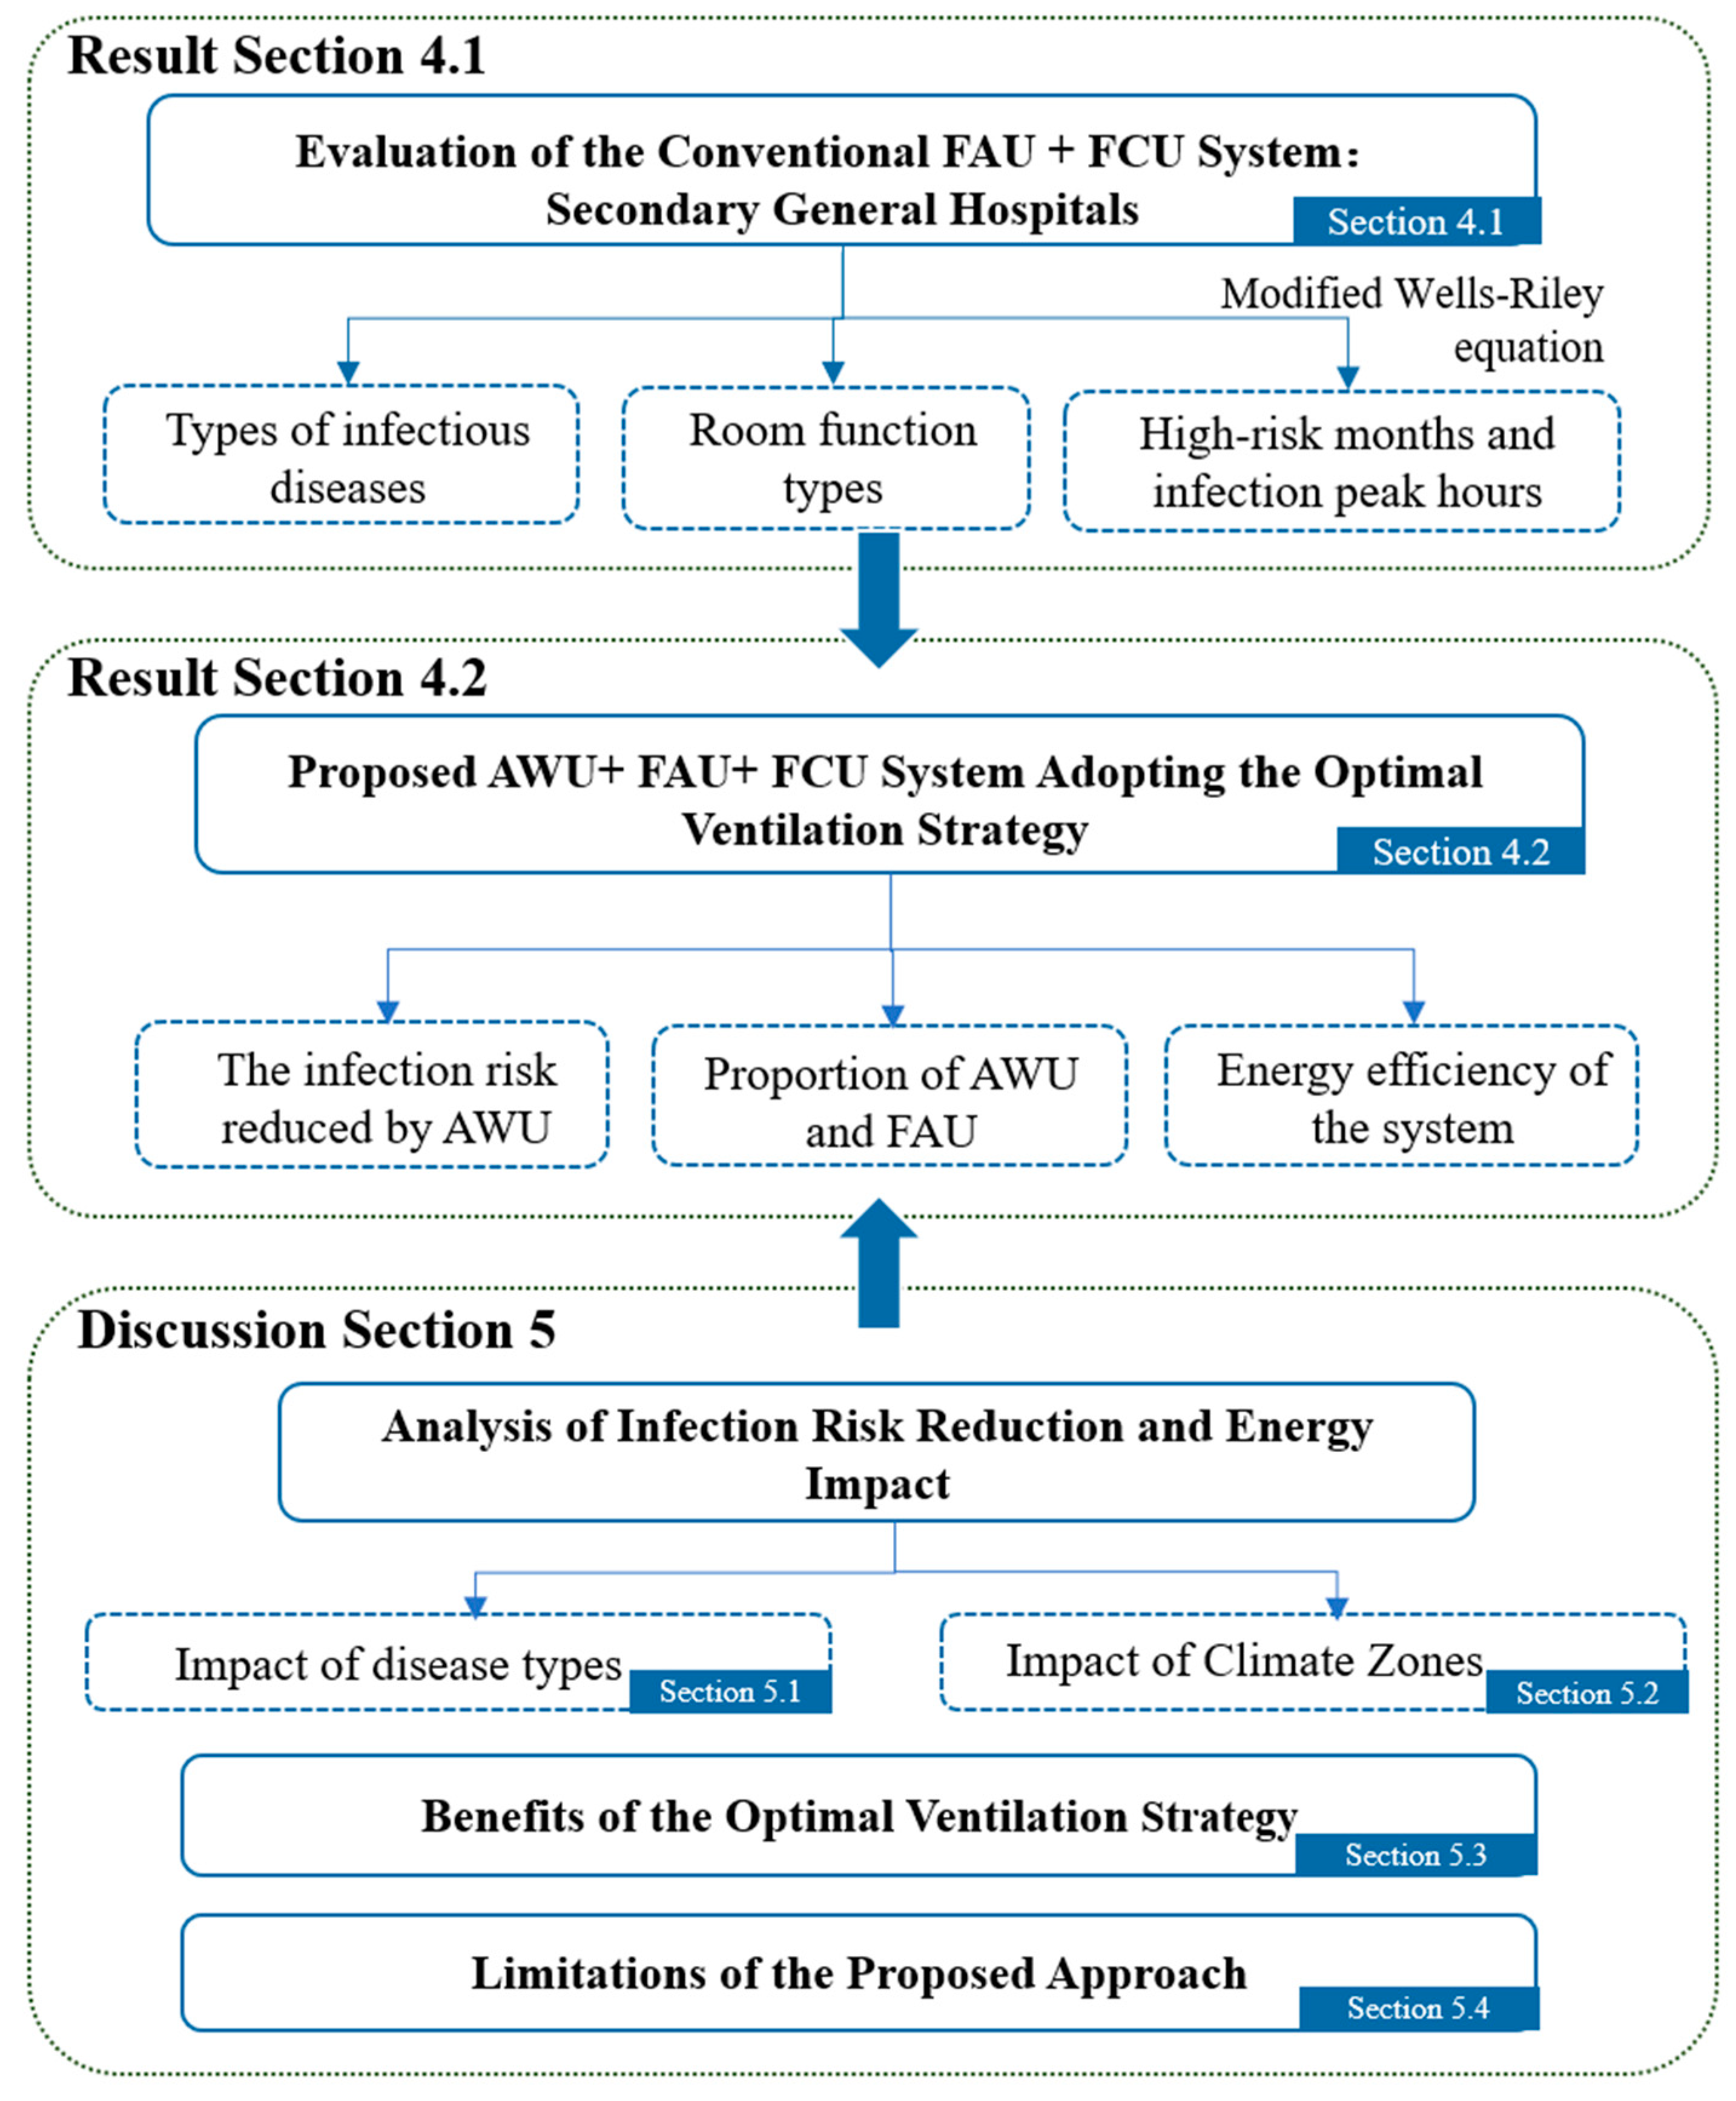
4. Results
Based on
Figure 6,
Section 4 analyzes the performance of both the conventional FAU + FCU system and the proposed FAU + AWU + FCU system in reducing infection risks and optimizing energy efficiency in secondary general hospitals. The evaluation focuses on infection risk levels (
R0) and energy consumption under different ventilation strategies across five representative climate zones.
Section 4.1 evaluates the conventional FAU + FCU system using the modified Wells–Riley equation to assess infection risks (
R0) in various hospital rooms. The analysis considers types of infectious diseases, room function types, high-risk months, and peak infection periods.
Section 4.2 introduces the proposed AWU + FAU + FCU system, aimed at optimizing ventilation strategies by integrating the AWU system to reduce infection risks and enhance energy efficiency.
In the Discussion section, the reduction in infection risks and the impact on energy consumption are analyzed, focusing on the influence of disease types and climate zones. Additionally, the benefits of the optimal ventilation strategy and the limitations of the proposed approach are discussed, offering a comprehensive assessment of its feasibility and application across different settings.
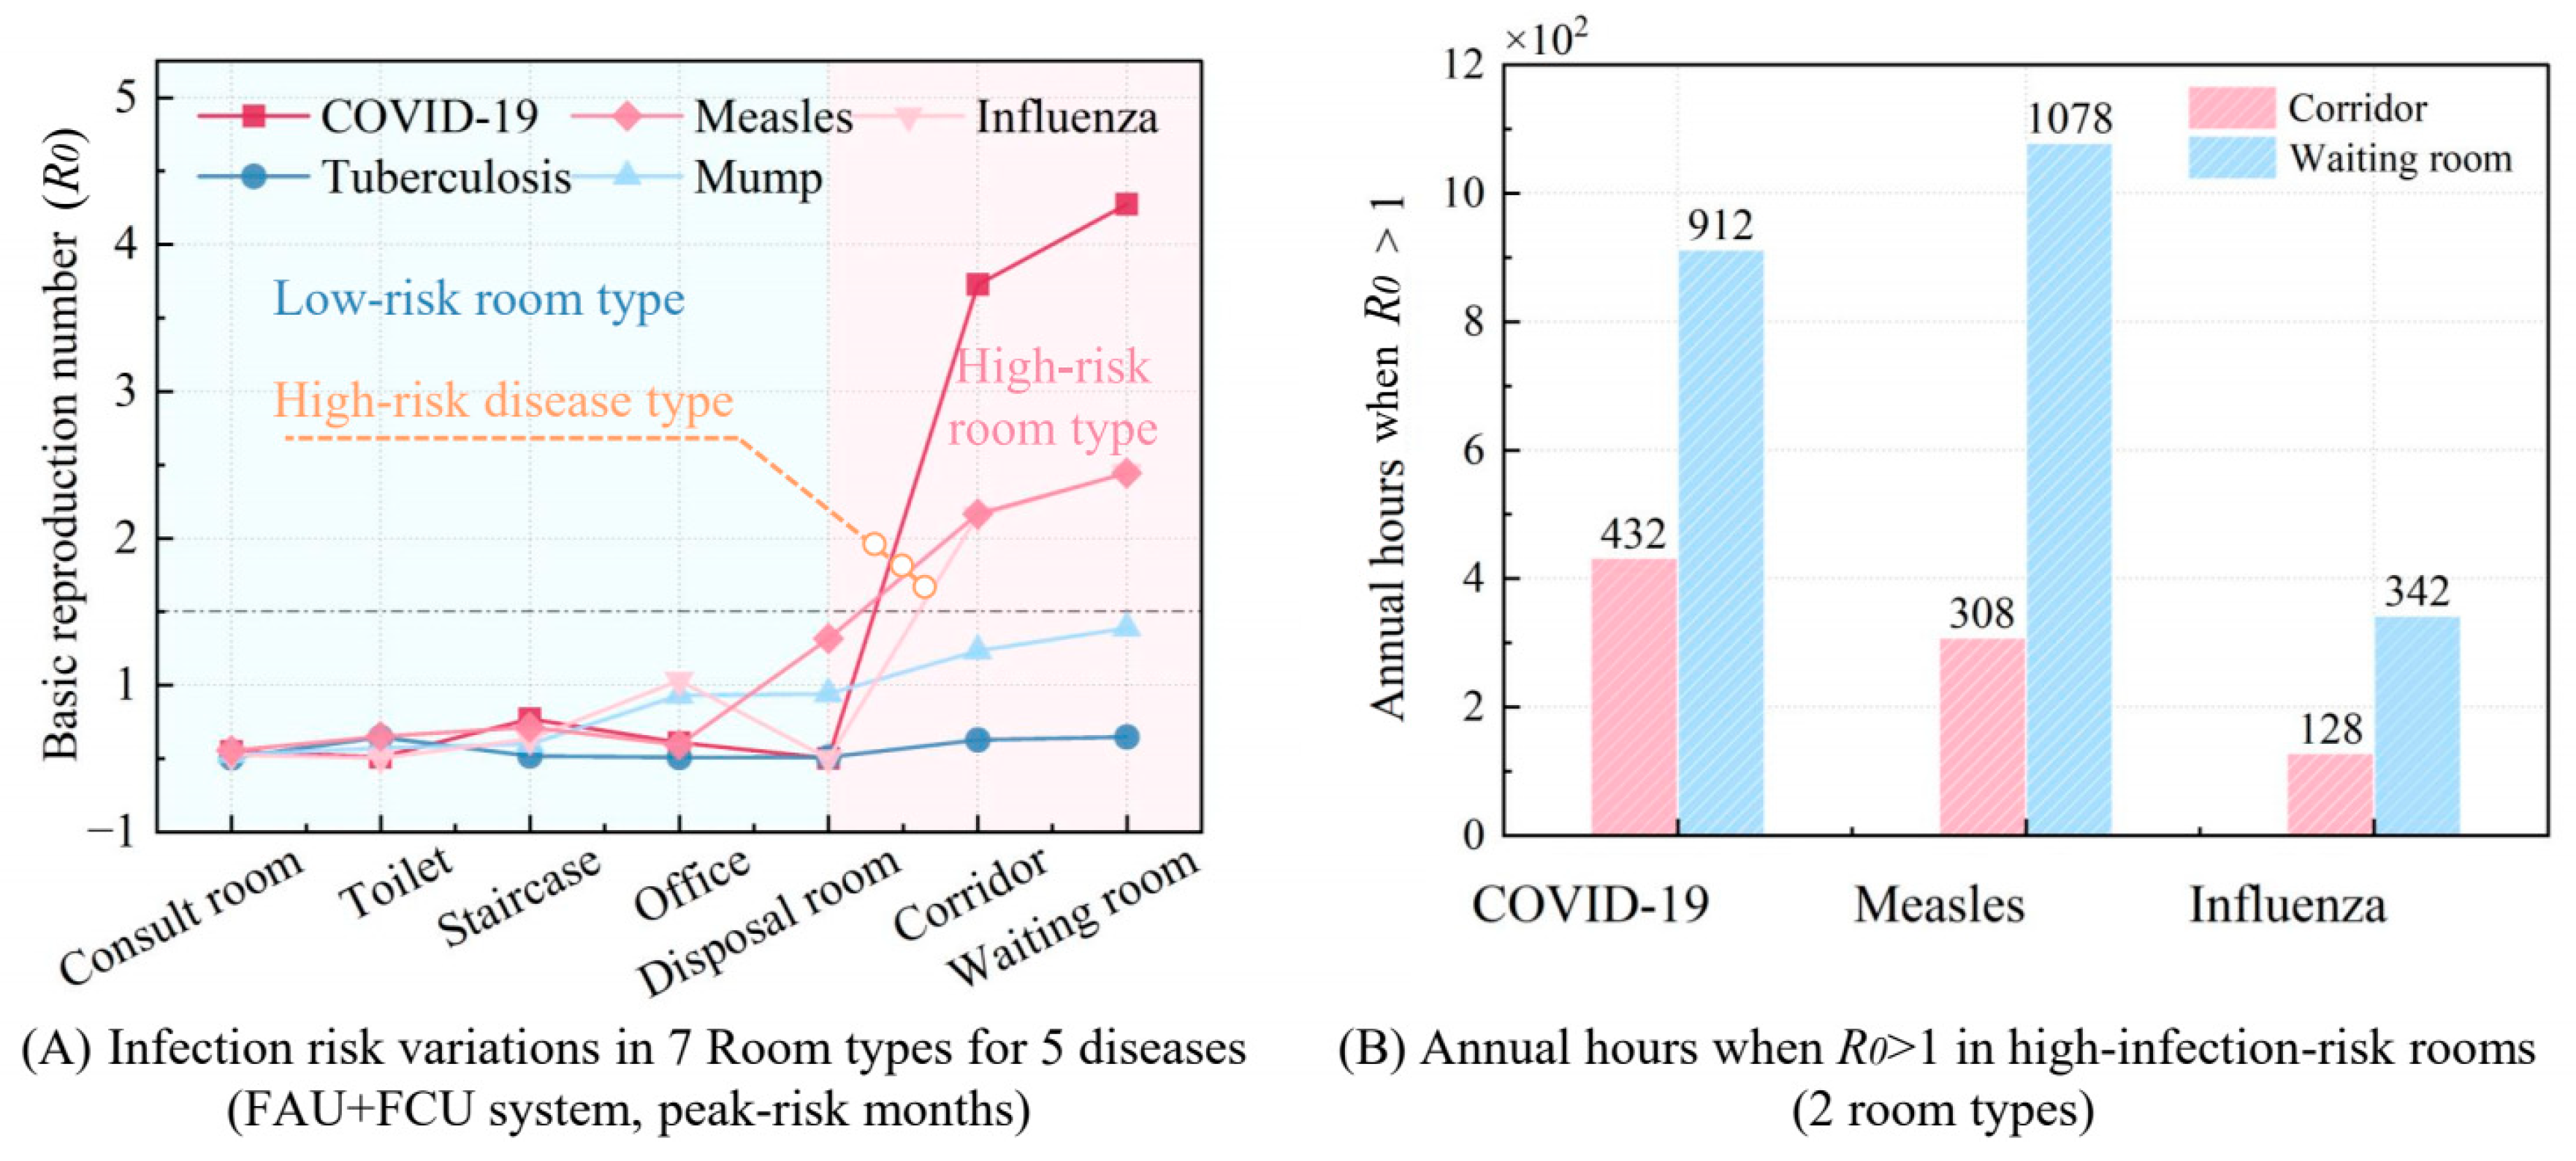
4.1. Performance of the Conventional FAU + FCU System Adopting the Mechanical Ventilation Strategy
Figure 7 illustrates the performance of conventional ventilation systems in high-risk rooms during the peak infection months for five respiratory diseases, while also presenting the annual number of hours during which the infection risk (
R0 > 1) remains high for these diseases. In
Figure 7A, the infection risk (
R0) for seven room types and five respiratory diseases was calculated under an extreme scenario, corresponding to the peak infection period during the highest-risk month of the year, based on the disease-transmission risk model. The peak infection month for each disease was determined using data from
Figure 3, which shows the monthly number of infected individuals and the seasonal variation coefficient. The peak infection months for each disease are as follows: measles (May), influenza (December), COVID-19 (April), tuberculosis (March), and mumps (June). This method allows for an effective screening of diseases and room types. If a room’s infection risk (
R0) for a particular disease is below 1 during its peak transmission period, the existing ventilation system is sufficient to control cross-infection within that room type, even during high-risk months. For such diseases, no additional ventilation strategies or system adjustments would be necessary during months with lower infection risks, thereby reducing unnecessary resource consumption and avoiding system modifications for low-risk periods.
According to the results of
Figure 7A, tuberculosis and mumps can reduce the infection risk
R0 to below 1 through the original system during the peak-risk months of the disease, while measles, influenza, and COVID-19 have a high risk of infection, and the magnitude of their infection risk is related to the quanta generation rates (
q). This is because diseases such as tuberculosis and mumps, with their low quanta generation rates (
q = 13.00 and 59.17 quanta/h, respectively), consistently exhibit minimal in-hospital transmission risks (
R0 < 1). On the contrary, highly contagious diseases like influenza, measles, and COVID-19, which have higher quanta generation rates, require enhanced ventilation during their peak transmission seasons.
Additionally, infection risk differs significantly between private and public spaces. Private areas such as consult rooms, disposal rooms, staircases, doctor’s offices, and toilets generally maintain R0 values below 1, mainly due to low occupancy, doctors wearing masks, and short duration of stay. Conversely, high-traffic public zones, such as corridors and waiting rooms, present markedly elevated risks (R0 = 3.23–3.77), driven by prolonged occupancy and inadequate natural airflow.
Figure 7B deeply illustrates the annual hours with
R0 > 1 for three high-infection-risk diseases (COVID-19, influenza, and measles) in high-risk public areas, specifically corridors and waiting rooms. COVID-19 and measles exhibit significantly higher annual
R0 > 1 durations (1344 and 1386 h) compared to influenza (470 h), attributable to their elevated
q value (as established in preceding analyses) and extended high-risk periods, whereas influenza’s transmission is constrained by lower
q values and seasonal peaks limited to winter months. Notably, waiting rooms exhibit higher
R0 > 1 h across all three diseases compared to corridors, attributable to their higher room density, larger spatial volume, and prolonged occupant exposure durations.
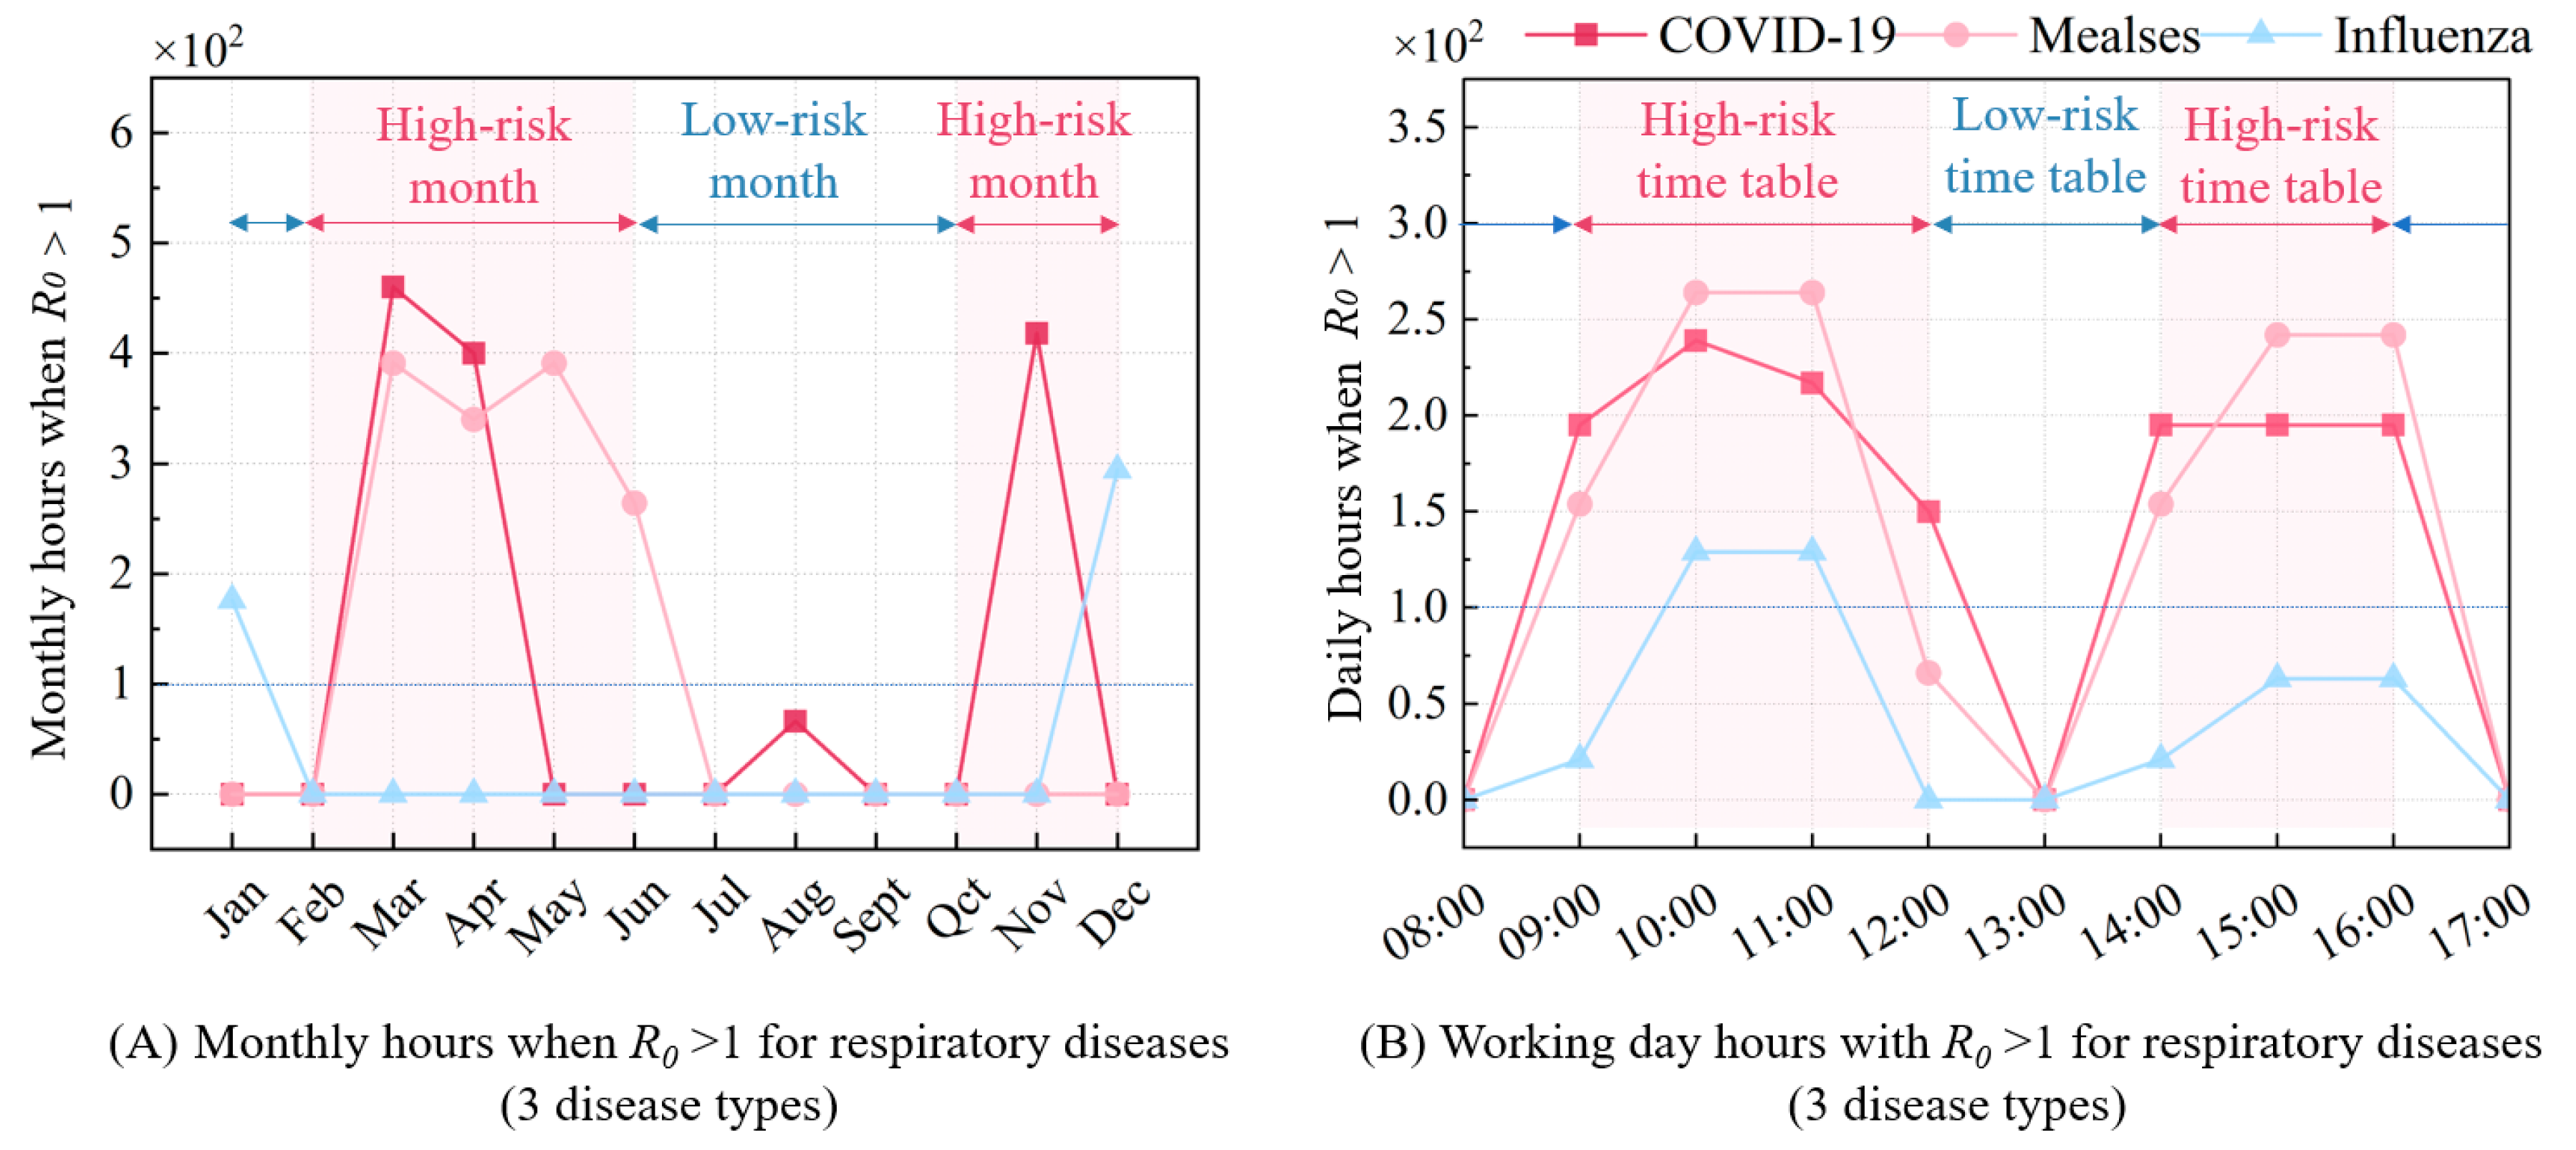
Furthermore,
Figure 8A presents the monthly
R0 > 1 h for three respiratory infectious diseases, showing trends that align with the transmission characteristics described in
Figure 3. The high-incidence months for COVID-19 are concentrated in March, April, and November, while measles peaks from March to June, and influenza in January and December. During these peak months, enhanced ventilation strategies are required to mitigate infection risks, whereas conventional ventilation standards are sufficient to control risks in other months. For precise disease control, the monthly
R0 > 1 h should be further broken down to a daily level.
Figure 8B illustrates that disease-specific
R0 > 1 patterns throughout the day closely mirror human activity, with peak infection risks occurring between 10–11 a.m. and 3–4 p.m. Conversely, lower risks are observed at 8 a.m., 1 p.m., and 5–6 p.m., where
R0 values fall below 1, indicating no need for additional ventilation during these times. This temporal variation in infection risk aligns with the occupancy schedule, particularly in public areas where crowding is more common.
In summary, using the GB55015-2021 [
38] ventilation standards with the FAU + FCU system reveals that infection risks vary by disease, room type, month, and time of day. Highly contagious diseases like COVID-19, measles, and influenza require increased ventilation during peak seasons. Moreover, public spaces like waiting rooms carry higher risks compared to private areas due to crowding and longer occupancy. In addition, infection risks peak in certain months and times of the day, which aligns with transmission characteristics and human activity patterns. Therefore, tailored ventilation strategies are essential to effectively reduce transmission risks.
4.2. Performance of the Proposed System Adopting the Optimal Ventilation Strategy
The proposed ventilation strategy critically leverages outdoor wind pressure and heat pressing to maximize natural ventilation, thereby significantly reducing infection risks as measured by the decline in hours with
R0 > 1. By effectively diluting viral concentrations through natural airflow, this approach demonstrates remarkable efficacy in high-risk hospital rooms. Following optimal natural ventilation utilization, the FCU system further refines airflow control to suppress R
0 below 1, simultaneously stabilizing energy consumption. As illustrated in
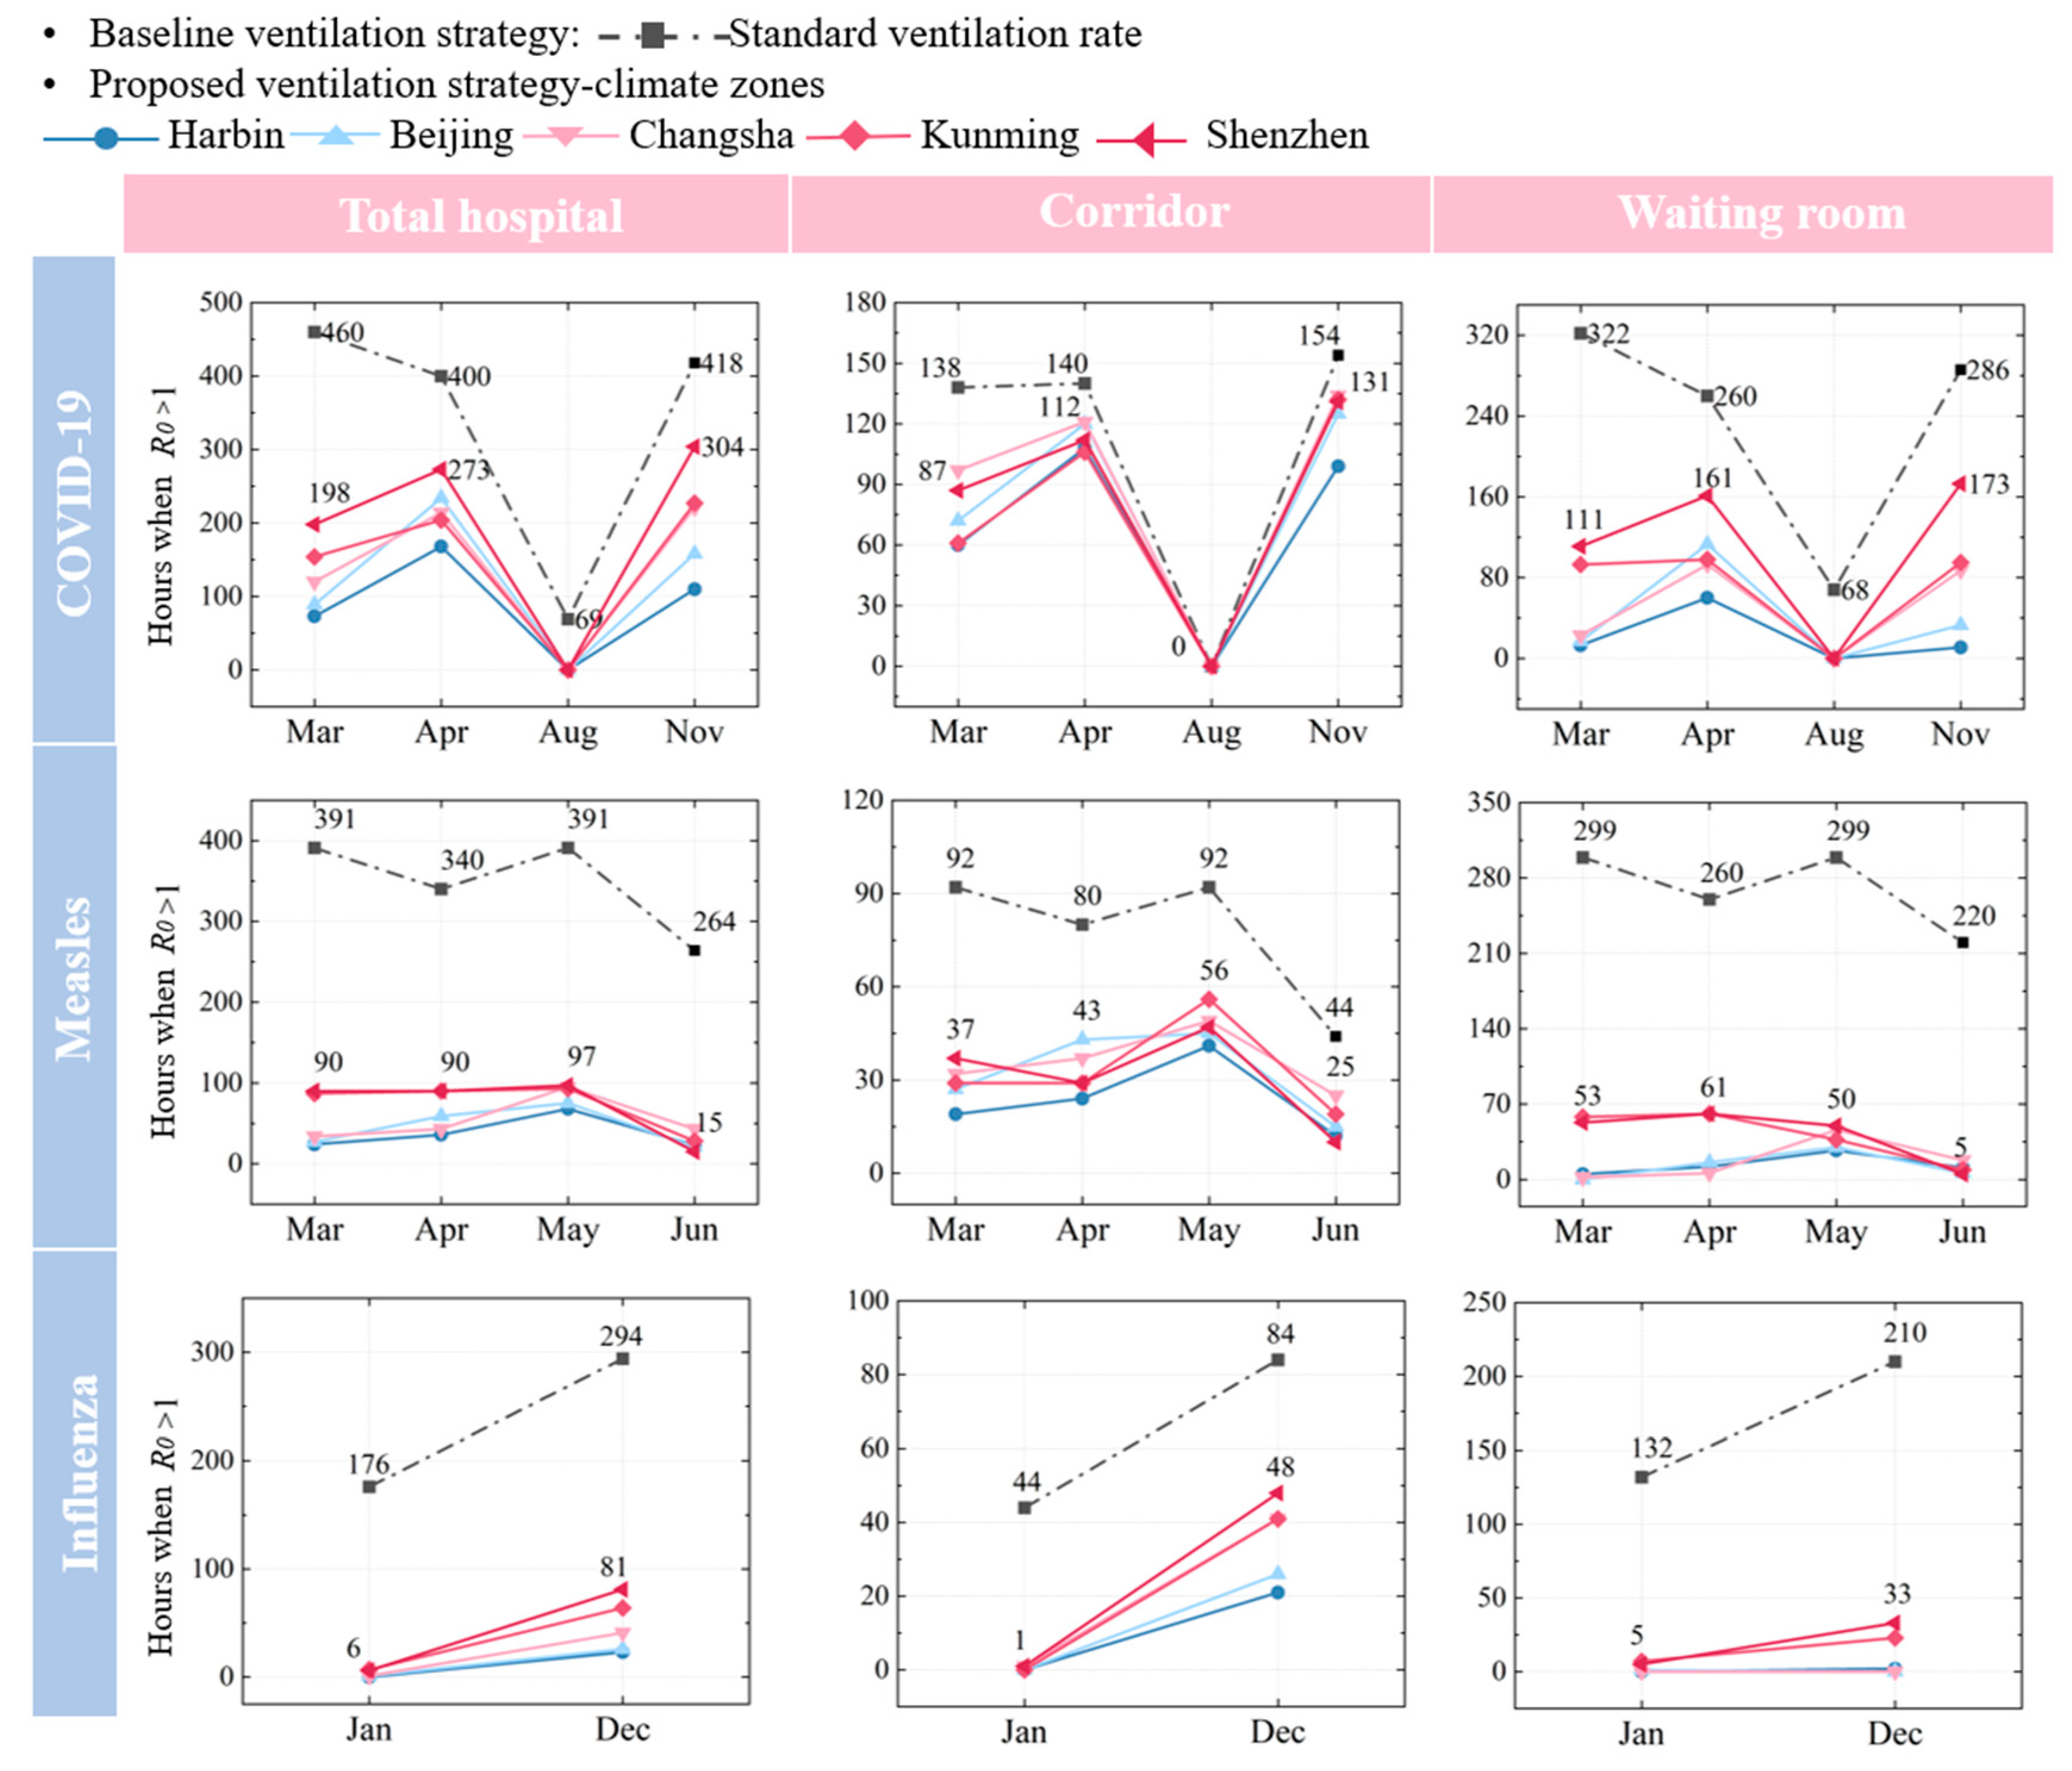
Figure 9, natural ventilation reduces infection risks by 27.2–100.0% across five cities, with variations tied to room function, disease type, seasonal peaks, and climate. Strikingly, the strategy achieves complete risk elimination (100.0%) for influenza in specific months, underscoring its adaptability to diverse environments.
Notably, influenza demonstrates the most substantial risk reduction, achieving 100.0% mitigation in January and 72.4% in December. In stark contrast, COVID-19 exhibits the least effective reduction (27.2–100.0%) during its peak months. Despite fewer high-risk hours than measles, COVID-19’s elevated
R0 necessitates proportionally greater ventilation efforts (detailed in
Section 5.1). Furthermore, under identical outdoor ventilation conditions in March and April, measles infection risk decreases by 21.0% more than COVID-19, emphasizing the differences between the diseases.
The effectiveness of natural ventilation in controlling disease transmission varies significantly across regions due to climate conditions. In colder climate zones, such as Harbin and Beijing, natural ventilation is more effective during the colder months (e.g., January, March, and December). This is primarily due to a larger indoor–outdoor temperature differential, which promotes air movement and reduces viral concentrations. Additionally, northern regions are heavily influenced by the northerly winter monsoon during winter and spring, further enhancing the effectiveness of natural ventilation and reducing the risk of infection. For instance, in Harbin, under the combined effects of temperature and monsoon winds, the COVID-19 infection risk is reduced by 84.1% in March and 73.6% in November. In Beijing, the infection risk reductions are 80.7% and 62.2% in March and November, respectively. In contrast, in southern cities such as Shenzhen and Kunming, natural ventilation is less effective during warmer months due to a smaller temperature differential, and it is less affected by the monsoon. In Shenzhen, the COVID-19 infection risk is reduced by 56.9% in March and 27.2% in November, while in Kunming, the reductions are 66.5% and 47.3%, respectively.
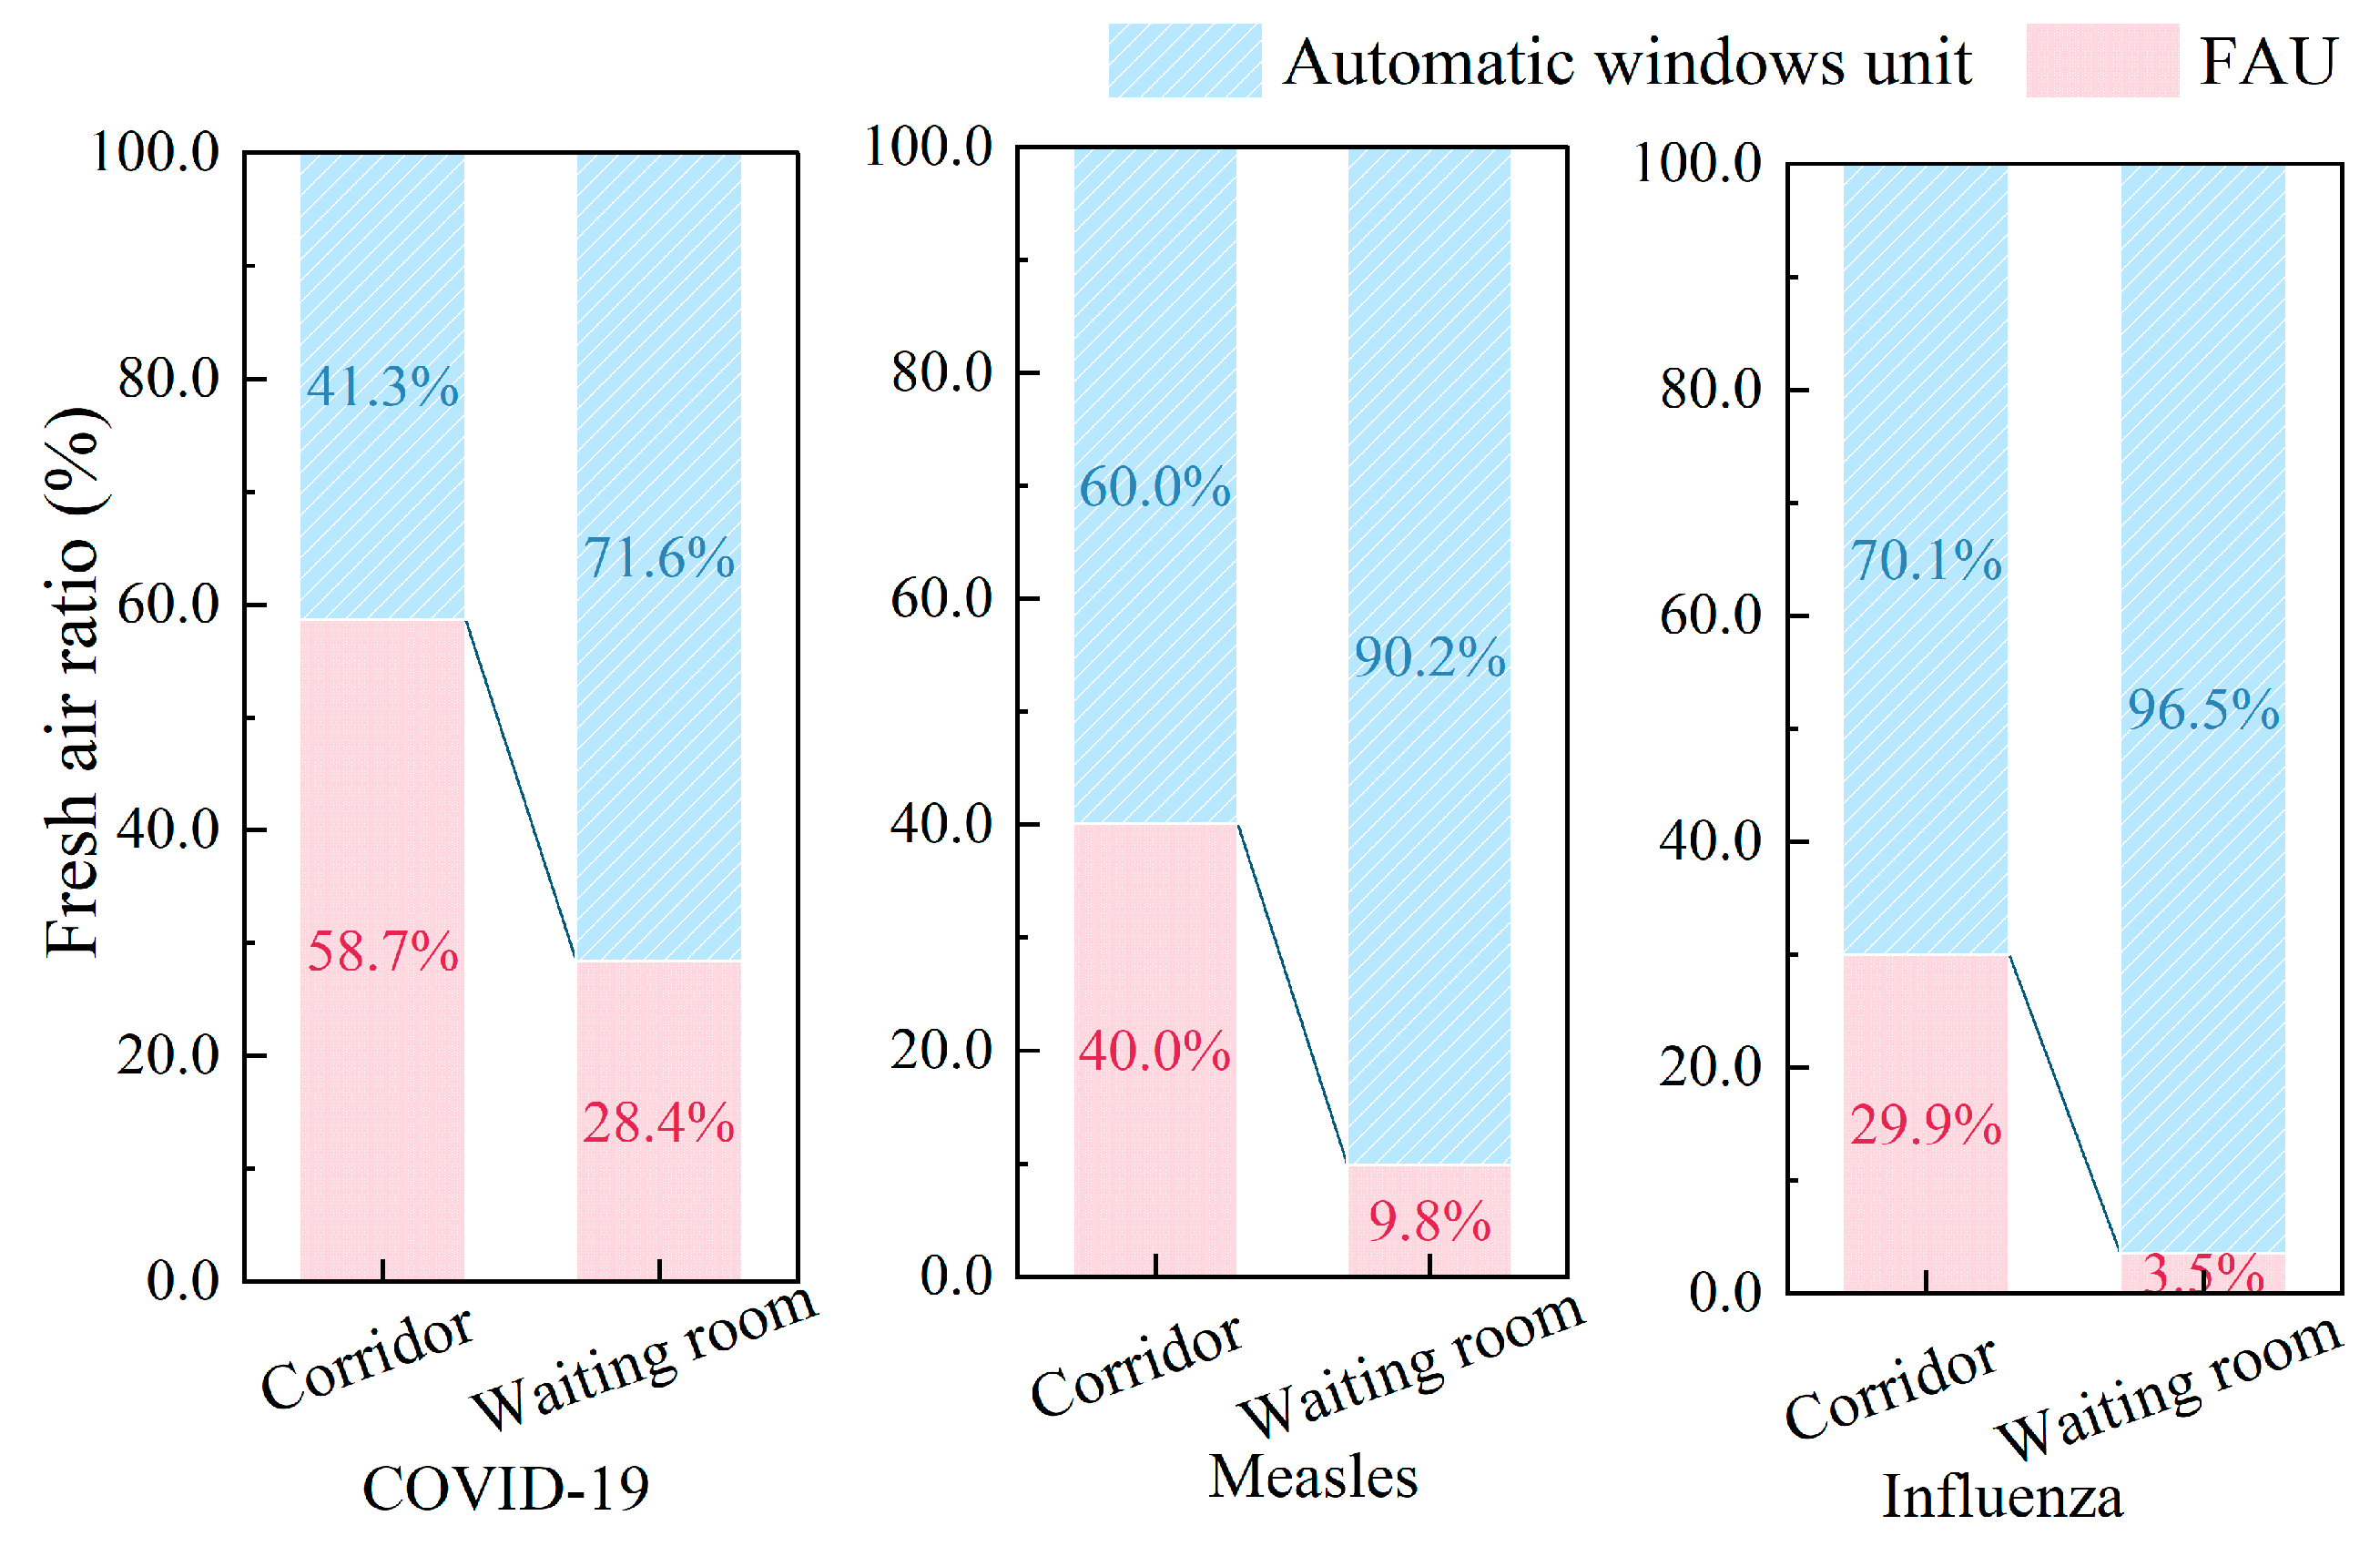
Figure 10 illustrates the proportion of mechanical ventilation (FAU) versus natural ventilation (AWU) across different room types, including corridors and waiting rooms, for COVID-19, measles, and influenza. It is noteworthy that COVID-19 has a reliance on mechanical systems (FAU: 58.7% in corridors, 28.4% in waiting rooms) compared to measles (40.0%, 9.8%) and influenza’s minimal needs (29.9%, 3.5%), consistent with their respective transmission risk profiles. The difference in the proportion of ventilation volume is also related to room types: waiting rooms achieve 71.6–96.5% natural ventilation (AWU) through optimized airflow design, while corridors remain mechanically dependent (41–70.1% FAU) due to linear layouts and restricted fenestration. These findings collectively advocate strategic room allocation in hospitals, prioritizing high-infection-risk zones in naturally ventilatable spaces to concurrently mitigate pathogen spread and energy expenditure.
Figure 11 evaluates the additional energy consumption required to reduce infection risks (
R0 < 1) for COVID-19, measles, and influenza across five cities, i.e., Harbin, Beijing, Changsha, Kunming, and Shenzhen. When natural ventilation is insufficient, supplementary mechanical ventilation increases energy consumption. Overall, the additional energy consumption for reducing respiratory disease transmission varies between 3% and 10% across different climate zones, as ventilation control is only required during specific periods. The extent of this increase depends on both the disease type and the climate conditions. COVID-19 consistently leads to higher energy consumption compared to measles and influenza, as it requires more ventilation to reduce transmission. For instance, in Harbin, energy consumption for COVID-19 peaks at 24.54 kWh/m
2 in March, while measles reaches 21.21 kWh/m
2. Among the cities, Harbin exhibits the highest energy consumption, particularly in colder months, due to the larger temperature difference between indoor and outdoor air. In contrast, Kunming shows the lowest energy consumption, reflecting its milder climate. Shenzhen and Beijing also experience noticeable peaks during high-risk periods, though their energy use remains lower than Harbin’s. These results highlight how both disease characteristics and climate conditions influence the energy demands for ventilation.
Above all, the proposed ventilation strategy effectively mitigates infection risks while optimizing energy efficiency through the strategic implementation of natural and mechanical ventilation. Natural ventilation reduces infection risk by 27.2–100.0%, leveraging regional wind patterns, disease characteristics (quanta generation rates), and seasonal temperature differentials. Influenza demonstrates the highest risk reduction (up to 100%) under natural ventilation, whereas COVID-19 requires significantly greater mechanical ventilation support due to its prolonged transmission risks. Geographically, northern cities like Harbin and Beijing achieve enhanced wintertime risk reduction through amplified indoor–outdoor thermal gradients, while milder climates (e.g., Kunming) minimize energy demands via natural ventilation optimization. Mechanical ventilation increases energy consumption by 3–10%, particularly for COVID-19 control, yet remains essential for spaces with limited natural airflow potential. These variations in infection risk and energy performance are systematically governed by disease type (
Section 5.1) and climatic zones (
Section 5.2), confirming the need for adaptive ventilation protocols in hospitals.
5. Discussion
The potential relationships of disease types and regional climatic conditions on infection risk and energy efficiency are elaborated in
Section 5.1 and
Section 5.2. Following these analyses,
Section 5.3 delineates the benefits of the optimal ventilation strategy, and
Section 5.4 subsequently addresses limitation to proposed approach.
5.1. Impact of Disease Types on Infection Risk and Energy Efficiency
To better analyze disease-specific impacts on ventilation strategies,
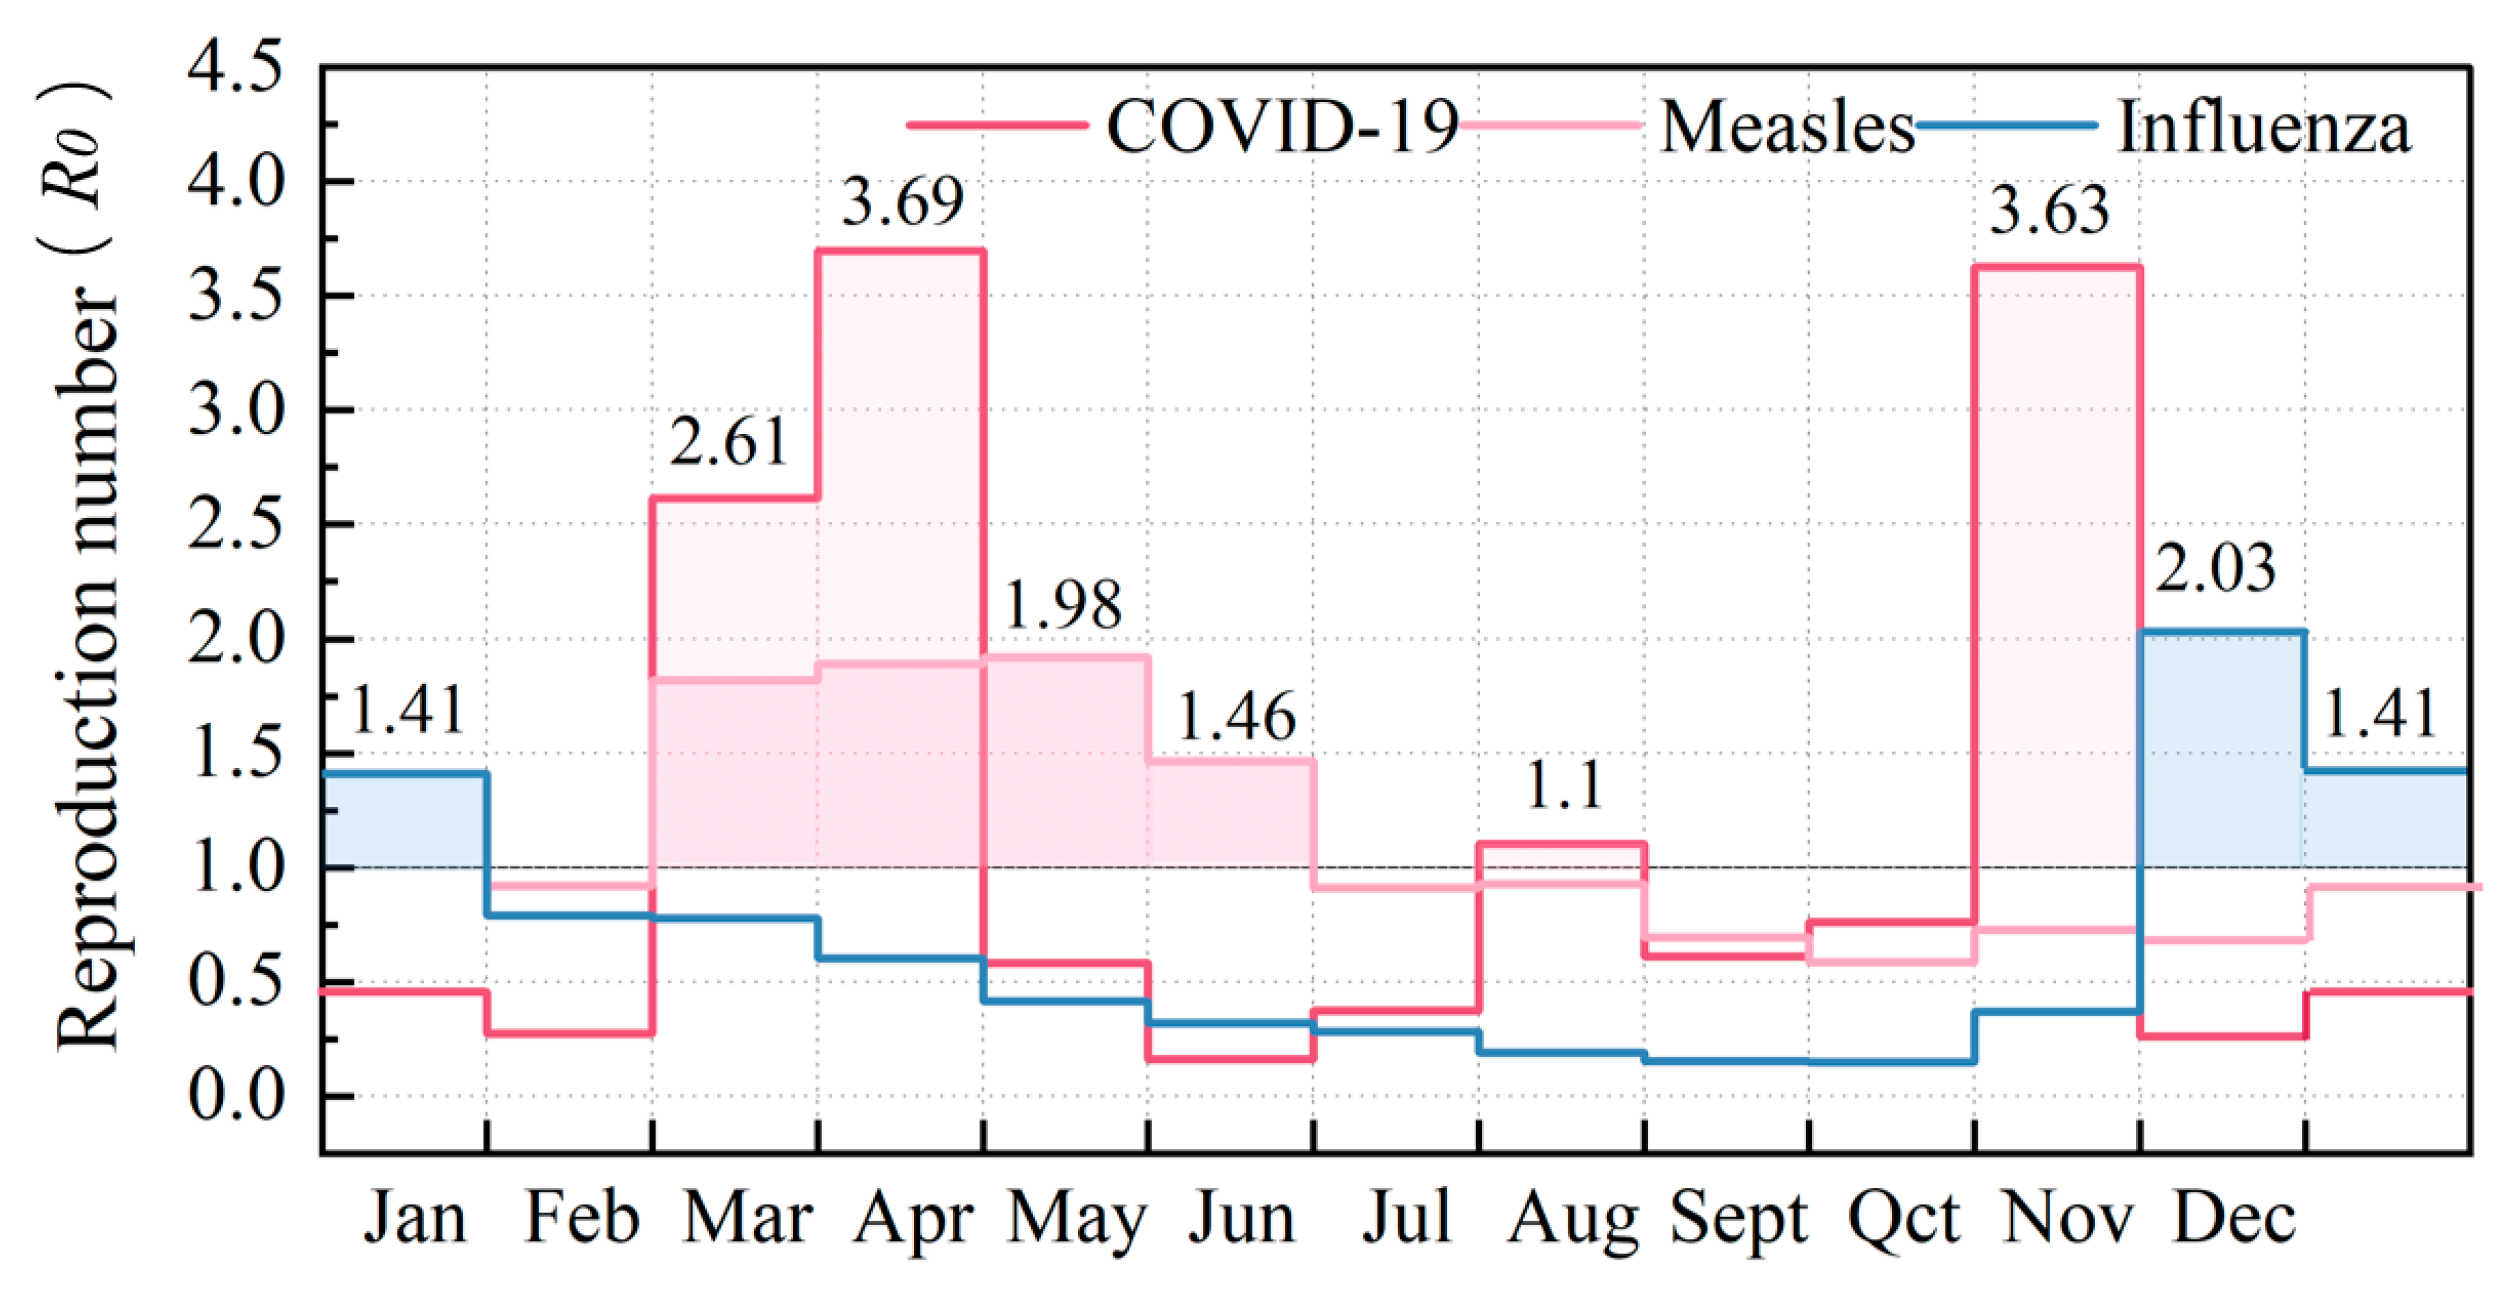
Figure 12 demonstrates the annual variation in infection risk (
R0) for COVID-19, measles, and influenza during peak occupancy hours (10 a.m.) in hospital waiting rooms—representative high-risk zones. It is noteworthy that the seasonal transmission patterns captured in
Figure 8A exert substantial influence on these
R0 fluctuations. In particular, COVID-19 displays marked seasonal peaks, registering
R0 values of 3.69 in April and 3.63 in November—a clear indicator of its sensitivity to seasonal variations. Conversely, measles manifests moderate springtime resurgence, with
R0 values predominantly clustered between March and June while generally maintaining levels below 2. Although measles experiences more high-risk hours compared to COVID-19, its lower peak
R0 translates to relatively reduced ventilation requirements and energy consumption. Meanwhile, influenza presents consistently lower
R0 values throughout the year, exhibiting modest winter peaks of 2.01 in December and 1.41 in January. These observations collectively emphasize how seasonal transmission dynamics fundamentally dictate ventilation demands. Whereas COVID-19’s elevated
R0 values compel significant airflow modifications, both measles and influenza impose comparatively less strenuous ventilation demands due to their lower peak
R0 thresholds.
According to the disease-transmission risk model, seasonal-pathogen synergy, quantified by the product of the multiplication of seasonal coefficient
S and quanta rates
q (
S⋅
q), emerges as the dominant driver of
R0 disparities, with COVID-19’s peak
S⋅
q value demanding higher ventilation than measles and influenza. When the infection risk
R0 is controlled below 1, the required ventilation rate
Q is proportional to
S⋅
q. In other words, a higher
S⋅
q value demands a greater
Q, as explained in Equation (5), which is simplified from the disease-transmission model used in this study.
As shown in Equation (5),
S⋅
q values exhibit an almost linear relationship with ventilation rates, emphasizing the critical role of disease-specific transmission characteristics in determining ventilation needs.
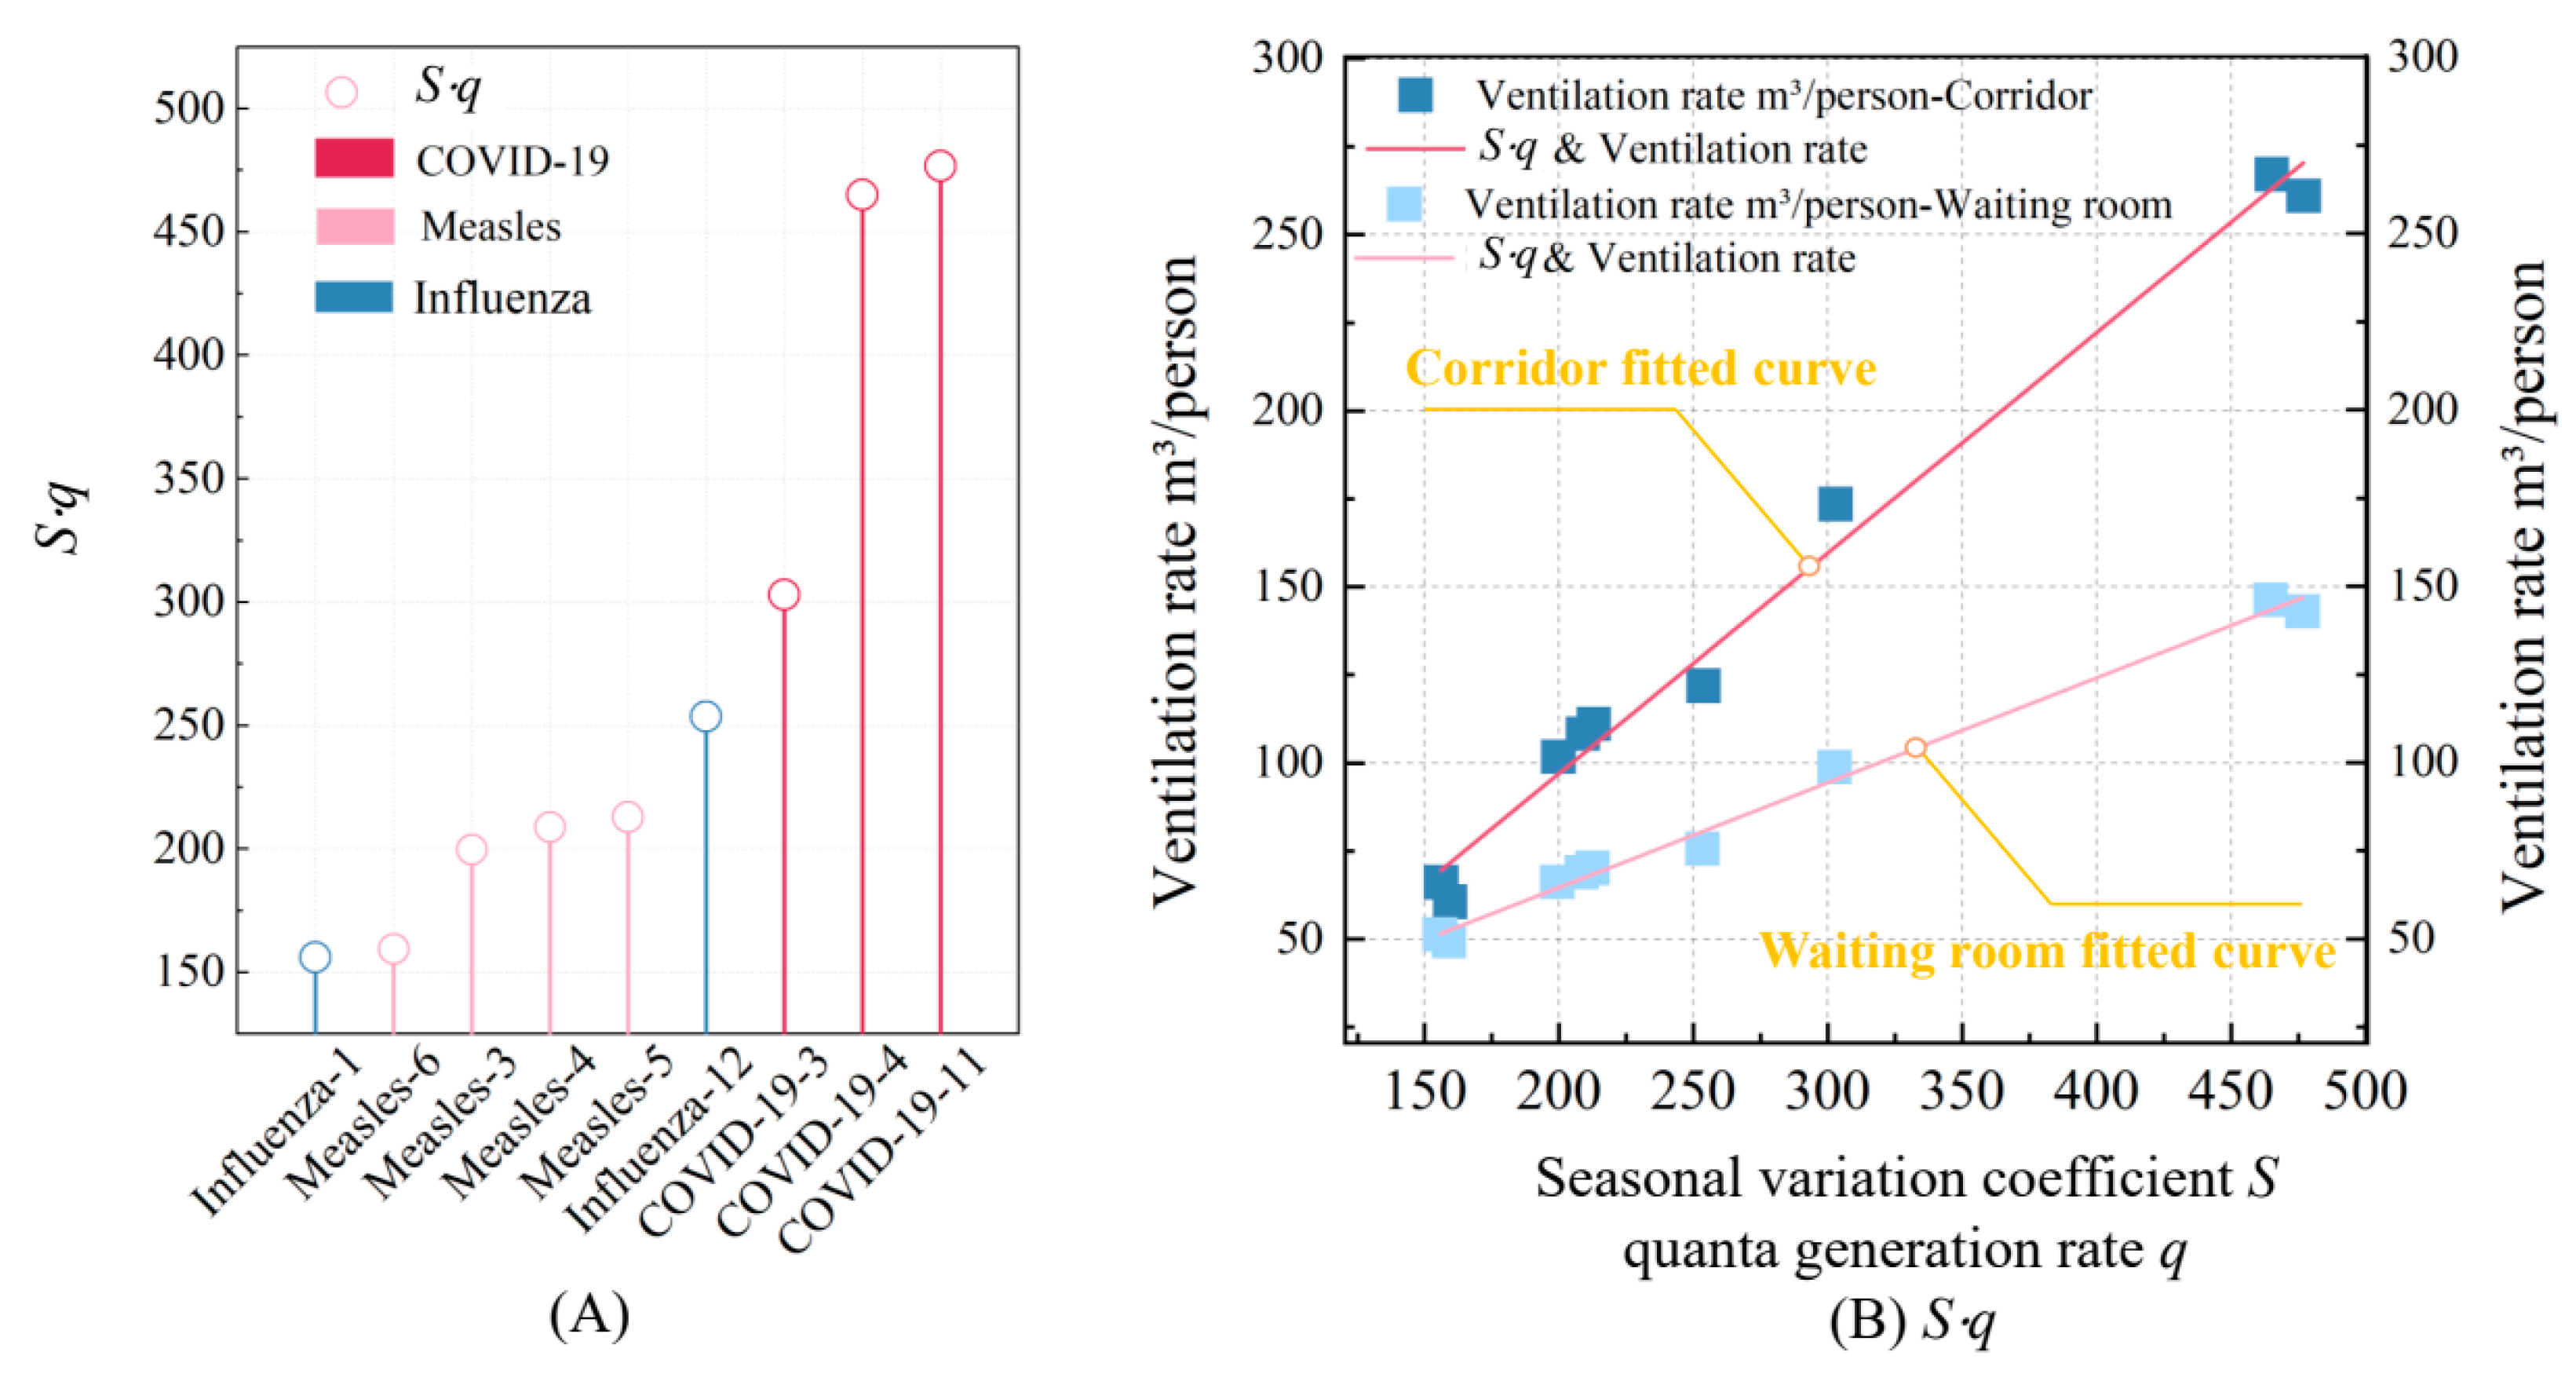
Figure 13A illustrates the
S⋅
q values for each disease during their peak months. Among the diseases analyzed, COVID-19 consistently shows the highest
S⋅
q values, reaching 476.84 m
3/(person·h) in its peak month of April, reflecting its high transmissibility and significant seasonal variation. Inversely, measles exhibits lower
S⋅
q values, while influenza shows the smallest, with a minimum of 156.12 m
3/(person·h), indicating its relatively lower ventilation demands.
Figure 13B displays the linear relationship between
S⋅
q values and the required ventilation volume
Q for each disease. As the
S⋅
q value increases, the required ventilation volume also rises, which aligns with the trend in Equation (5). Furthermore, the gradient of change is influenced by factors such as room type, occupant density, activity level, and mask usage. These variations in ventilation volume directly affect fan energy consumption, leading to overall changes in energy use, as shown in
Figure 14.
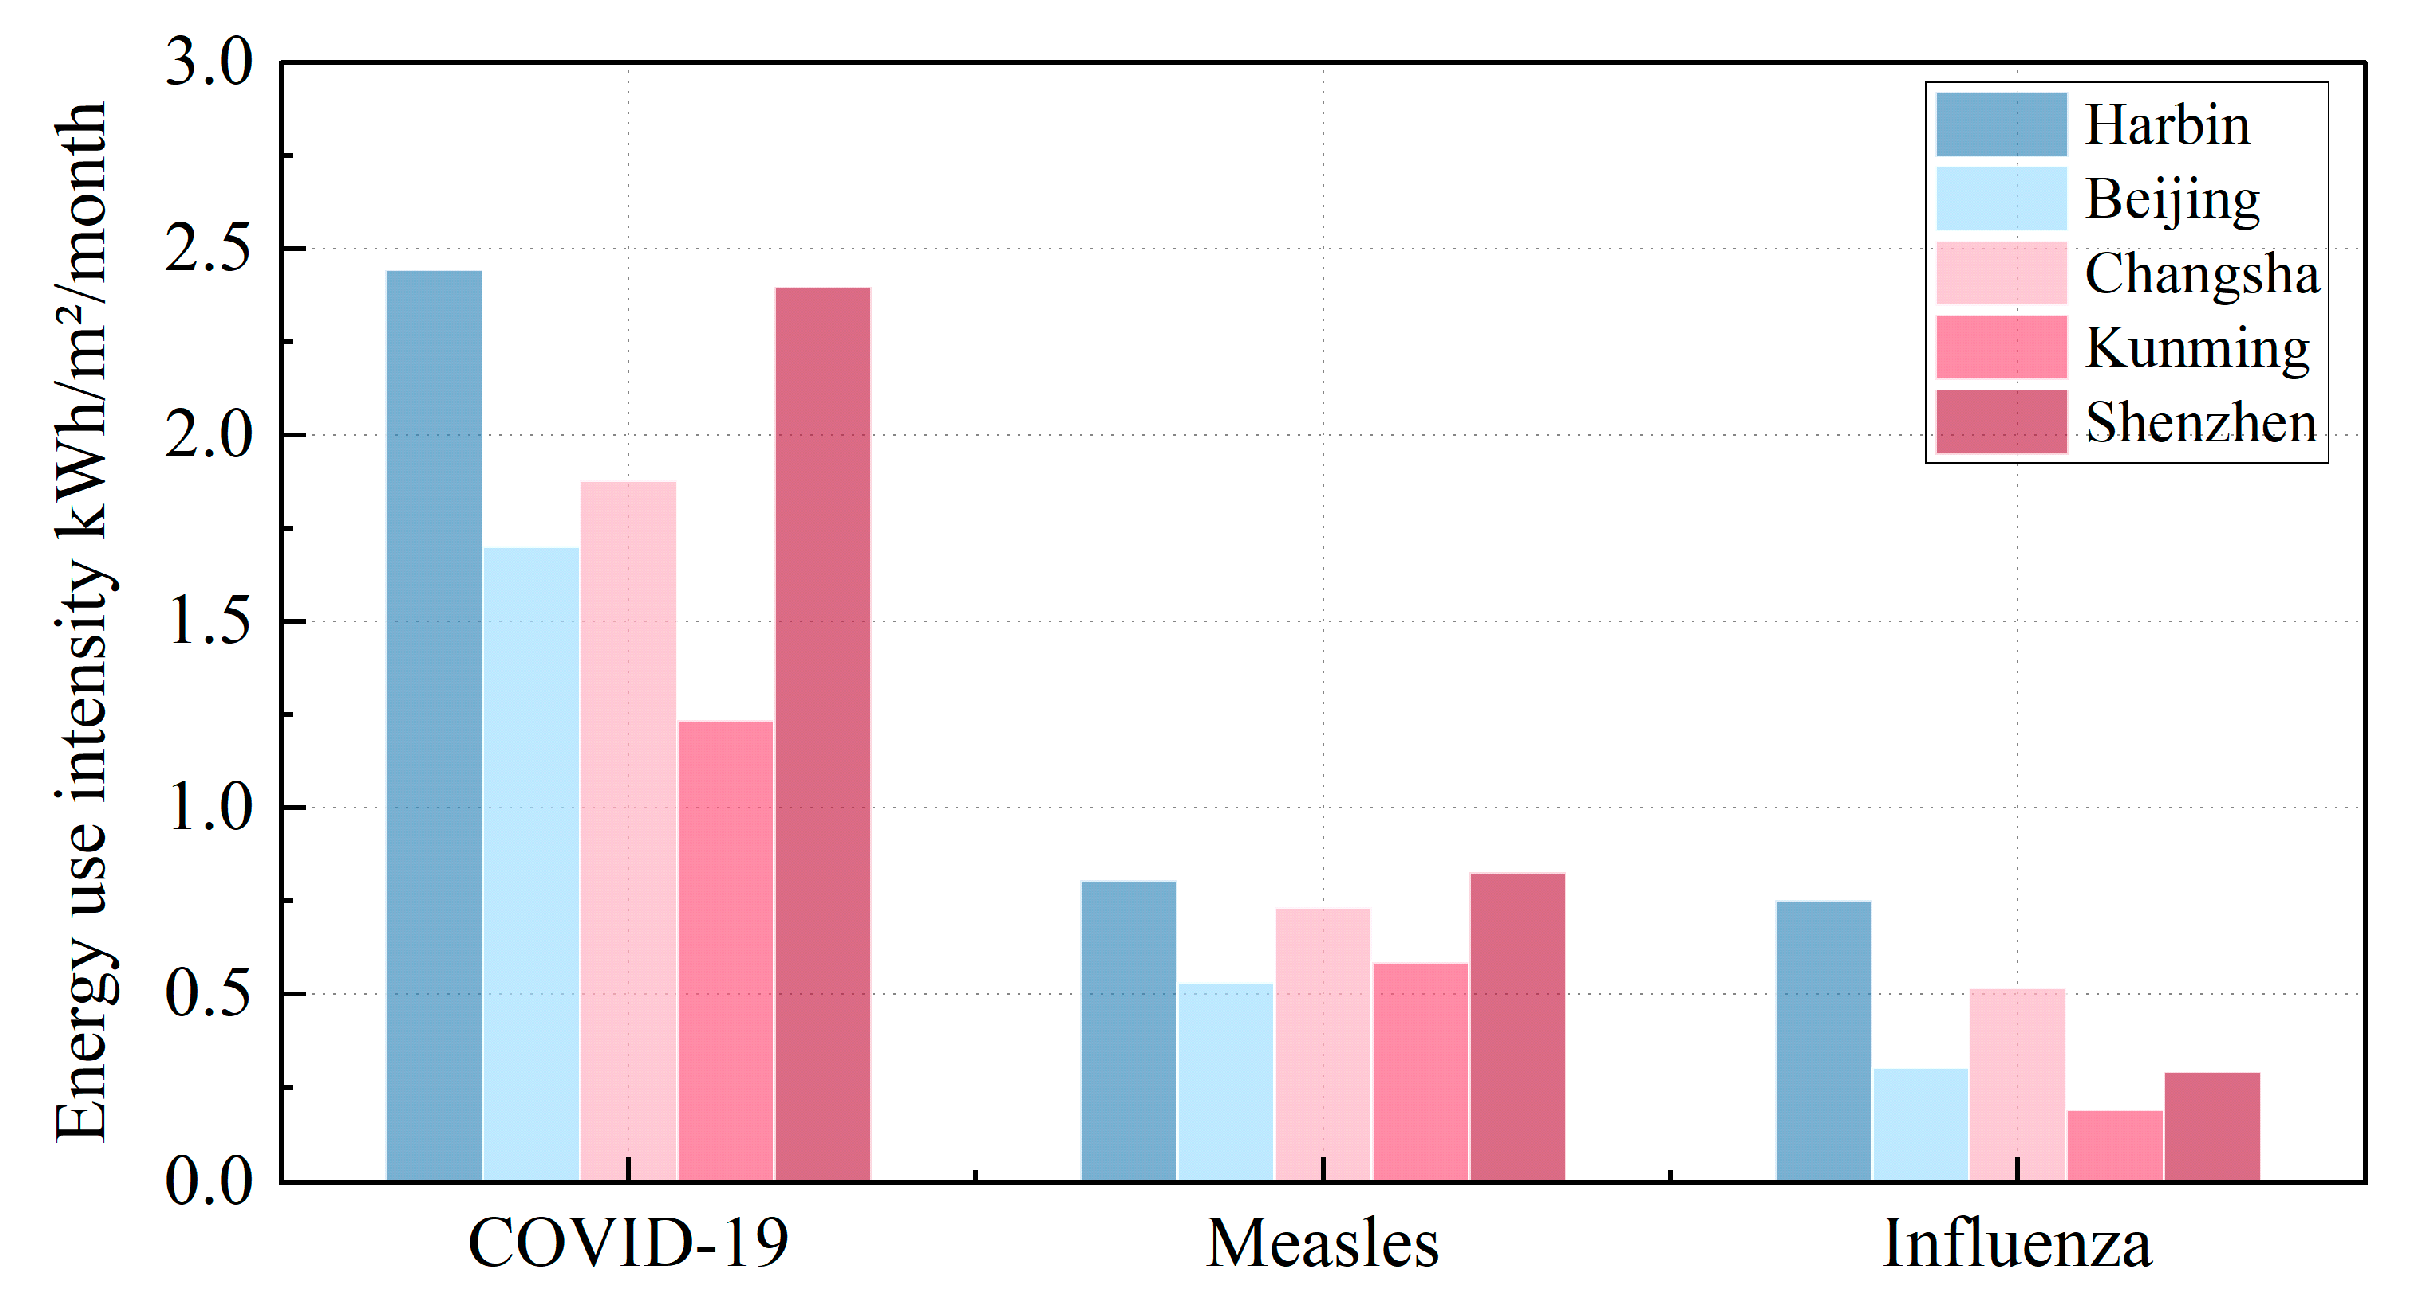
According to
Figure 14, the three diseases considered in this study have varying lengths of peak transmission periods—some have a high-risk period lasting only two months, while others span four months. Therefore, selecting the monthly average values allows us to better analyze the overall impact of disease control on energy consumption across the entire year, accounting for both the seasonal variation and the characteristics of each disease. In addition, the EUI value represents the monthly average energy consumption. The variation in energy use across the months is influenced by both outdoor climate conditions and the specific characteristics of the diseases being controlled. Since the peak transmission periods of the three diseases differ, as well as their transmission intensity, the energy consumption fluctuates from month to month. For the same disease, the primary factor affecting energy consumption differences is the variation in outdoor climate conditions across different climate zones. However, when comparing different diseases, the impact of seasonal variation (S) and disease characteristics (quanta generation rate, q) is more significant. Specifically, COVID-19’s exceptionally high transmissibility necessitates the highest energy consumption—nearly double that of measles, while influenza requires the least energy due to its lower
S⋅
q values. While disease type is a key driver of energy consumption, climate zones also significantly influence energy-use patterns.
Remarkedly, ventilation demand and energy-use intensity maintain consistently hierarchical patterns: peaking for COVID-19, moderately elevated for measles, and relatively minimized for influenza—a stratification stemming primarily from their respective seasonal quanta generation rates (
S·q). Importantly, a near-linear proportionality emerges between
S·q values and ventilation demand, thereby amplifying energy consumption through direct mechanistic coupling. This correlation becomes evident when examining COVID-19’s dominant
S·q profile, which dramatically elevates both airflow requirements and energy expenditures, whereas influenza’s attenuated
S·q correspondingly curtails these parameters. Crucially, regional climatic variables—particularly thermal gradients and turbulent airflow regimes—exert statistically significant modulation on these relationships, as quantified in
Section 5.2’s multivariate analysis. Collectively, these insights forcefully validate the imperative for ventilation protocols to simultaneously align with both pathogen-specific aerosol dynamics and geographically constrained microclimatic conditions, thereby achieving optimal equilibrium between airborne pathogen suppression and energy conservation imperatives.
5.2. Impact of Climate Zones on Infection Risk and Energy Efficiency
Outdoor climate conditions play a crucial role in shaping both energy consumption and infection risk, primarily through their impact on ventilation rates. While ventilation directly reduces infection risk, it also contributes to energy consumption, which is further influenced by the ventilation ratio and outdoor temperatures. Specifically, in northern cities, dry-bulb temperature is the most significant factor affecting energy use, whereas in southern cities, wet-bulb temperature becomes the dominant determinant [
60]. To effectively control infection risk and ensure that
R0 remains below 1, maintaining a required ventilation rate is essential. This can be achieved either through the use of AWU or by introducing fresh air via a dedicated FAU. However, regional variations in urban wind environments introduce significant differences in the effectiveness of infection risk mitigation. These variations, largely dictated by factors such as wind speed and direction, strongly influence the ability of natural ventilation to meet the required ventilation rates.
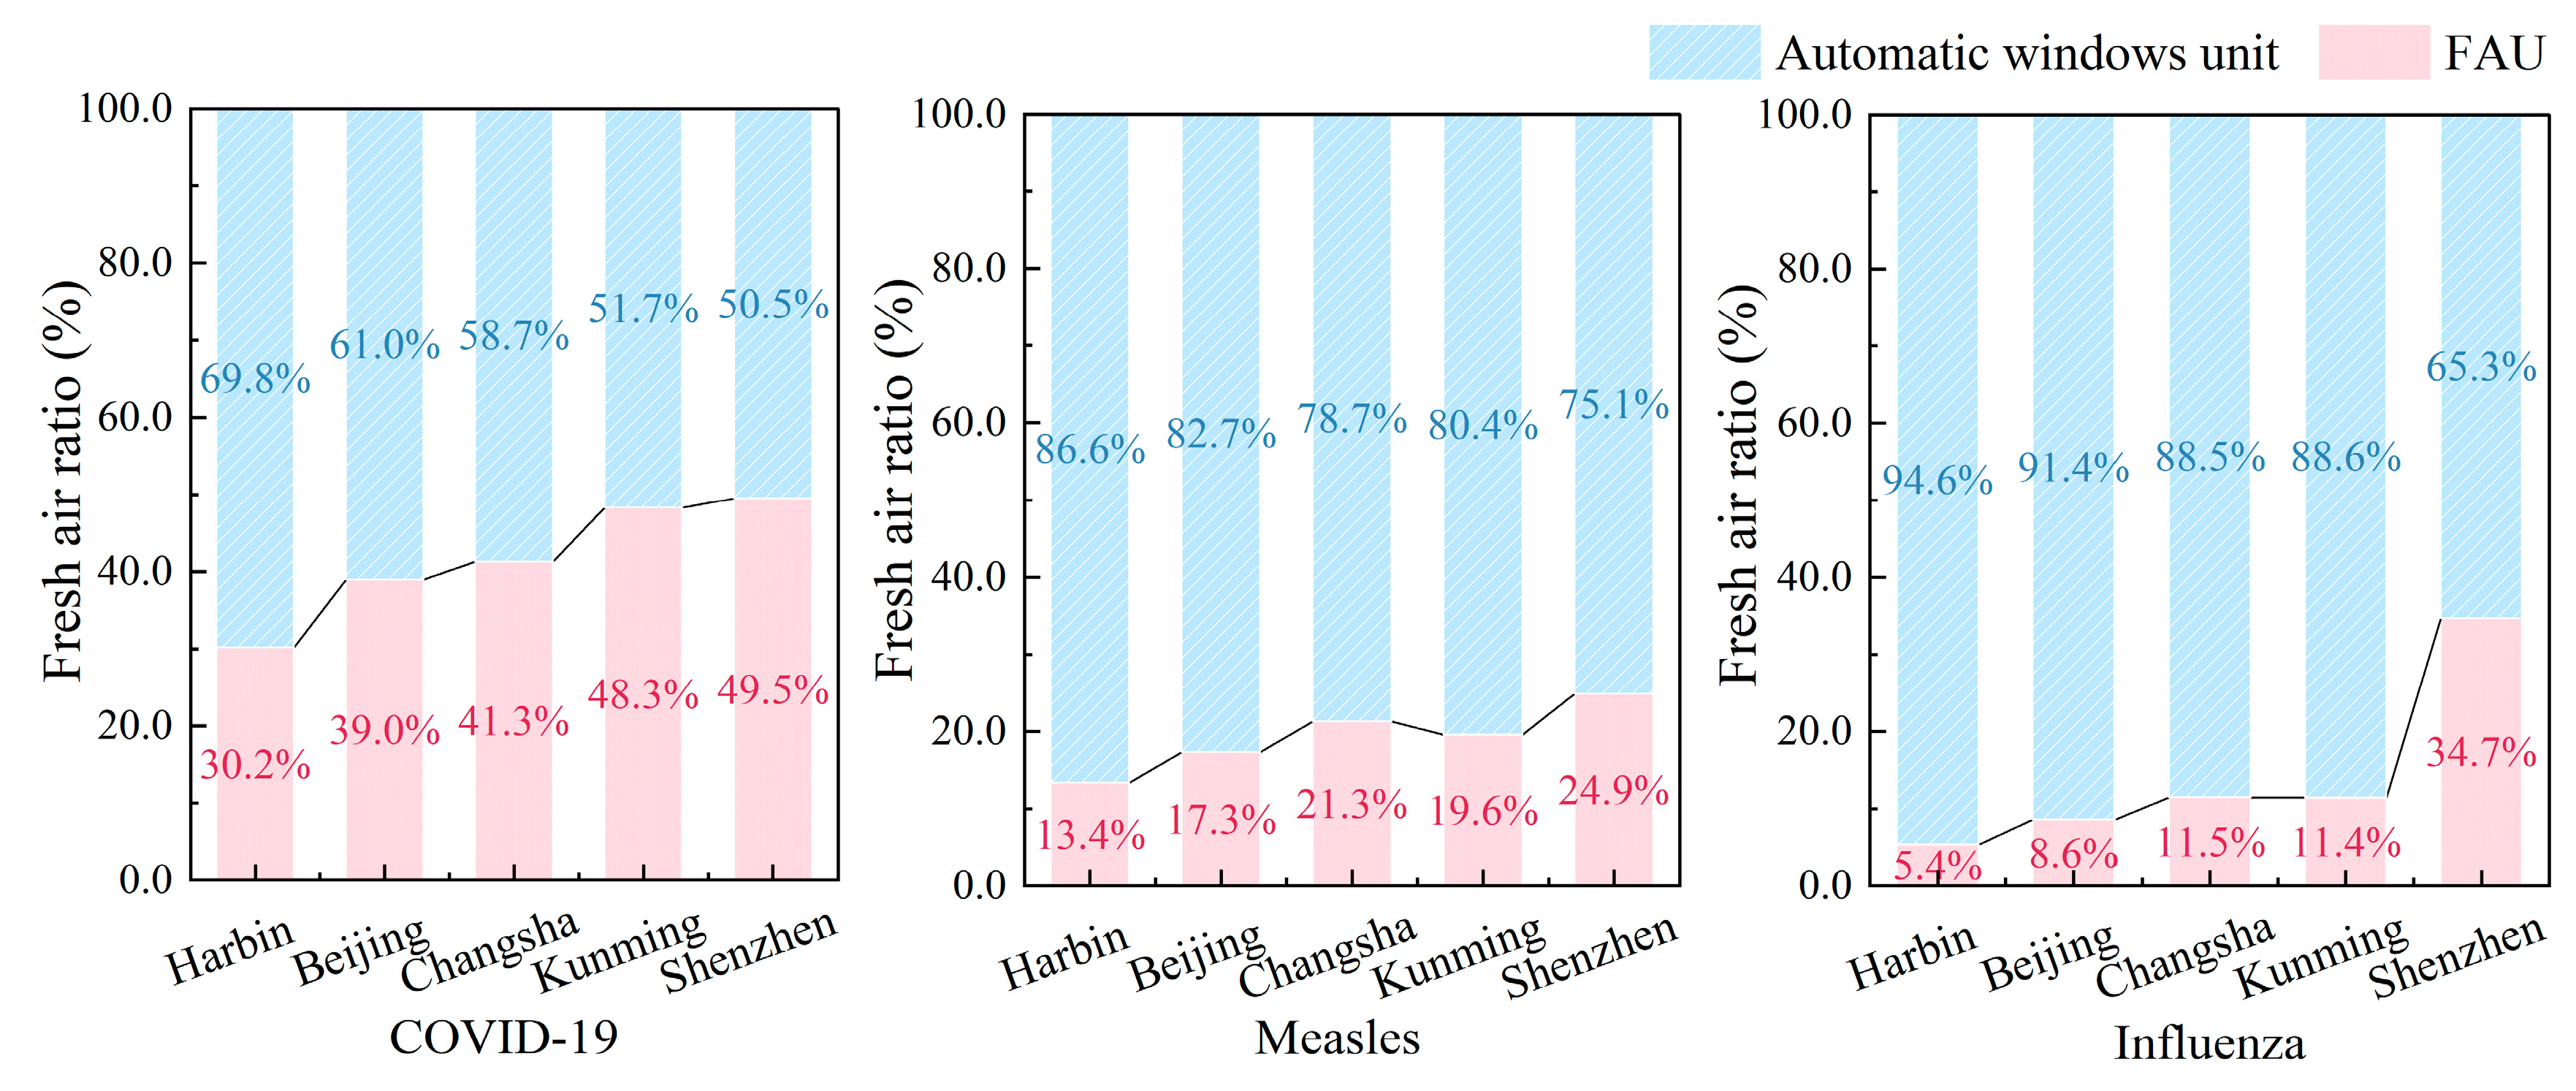
Figure 15 reveals divergent ventilation strategies across five Chinese cities (i.e., Harbin, Beijing, Changsha, Kunming, and Shenzhen), demonstrating a pronounced latitudinal gradient in system utilization. Specifically, natural ventilation dominates northern cities with implementation rates of 61.0–94.6%, whereas southern regions rely predominantly on mechanical ventilation at 50.5–88.5% adoption—a dichotomy stemming from contrasting climatic drivers: sustained winter airflow (velocity > 2.8 m/s) and thermal buoyancy (ΔT > 15 °C) in the north versus attenuated wind resources (velocity < 1.2 m/s) and minimal thermal gradients (ΔT < 8 °C) in the south. Crucially, the pathogen-specific analysis further delineates operational nuances: measles and influenza mitigation consistently prioritize natural ventilation across latitudes (north: 82.7–94.6%, south: 65.3–88.6%), in stark contrast to COVID-19’s stringent requirements. Notably, even northern cities with climate-optimized natural ventilation must supplement COVID-19 control with substantial mechanical ventilation inputs (Harbin: 30.2%, Beijing: 39.0%), escalating mechanical ventilation usage in southern municipalities where natural airflow proves inadequate. Collectively, the data establish that regional climatic conditions fundamentally dictate ventilation modality development.
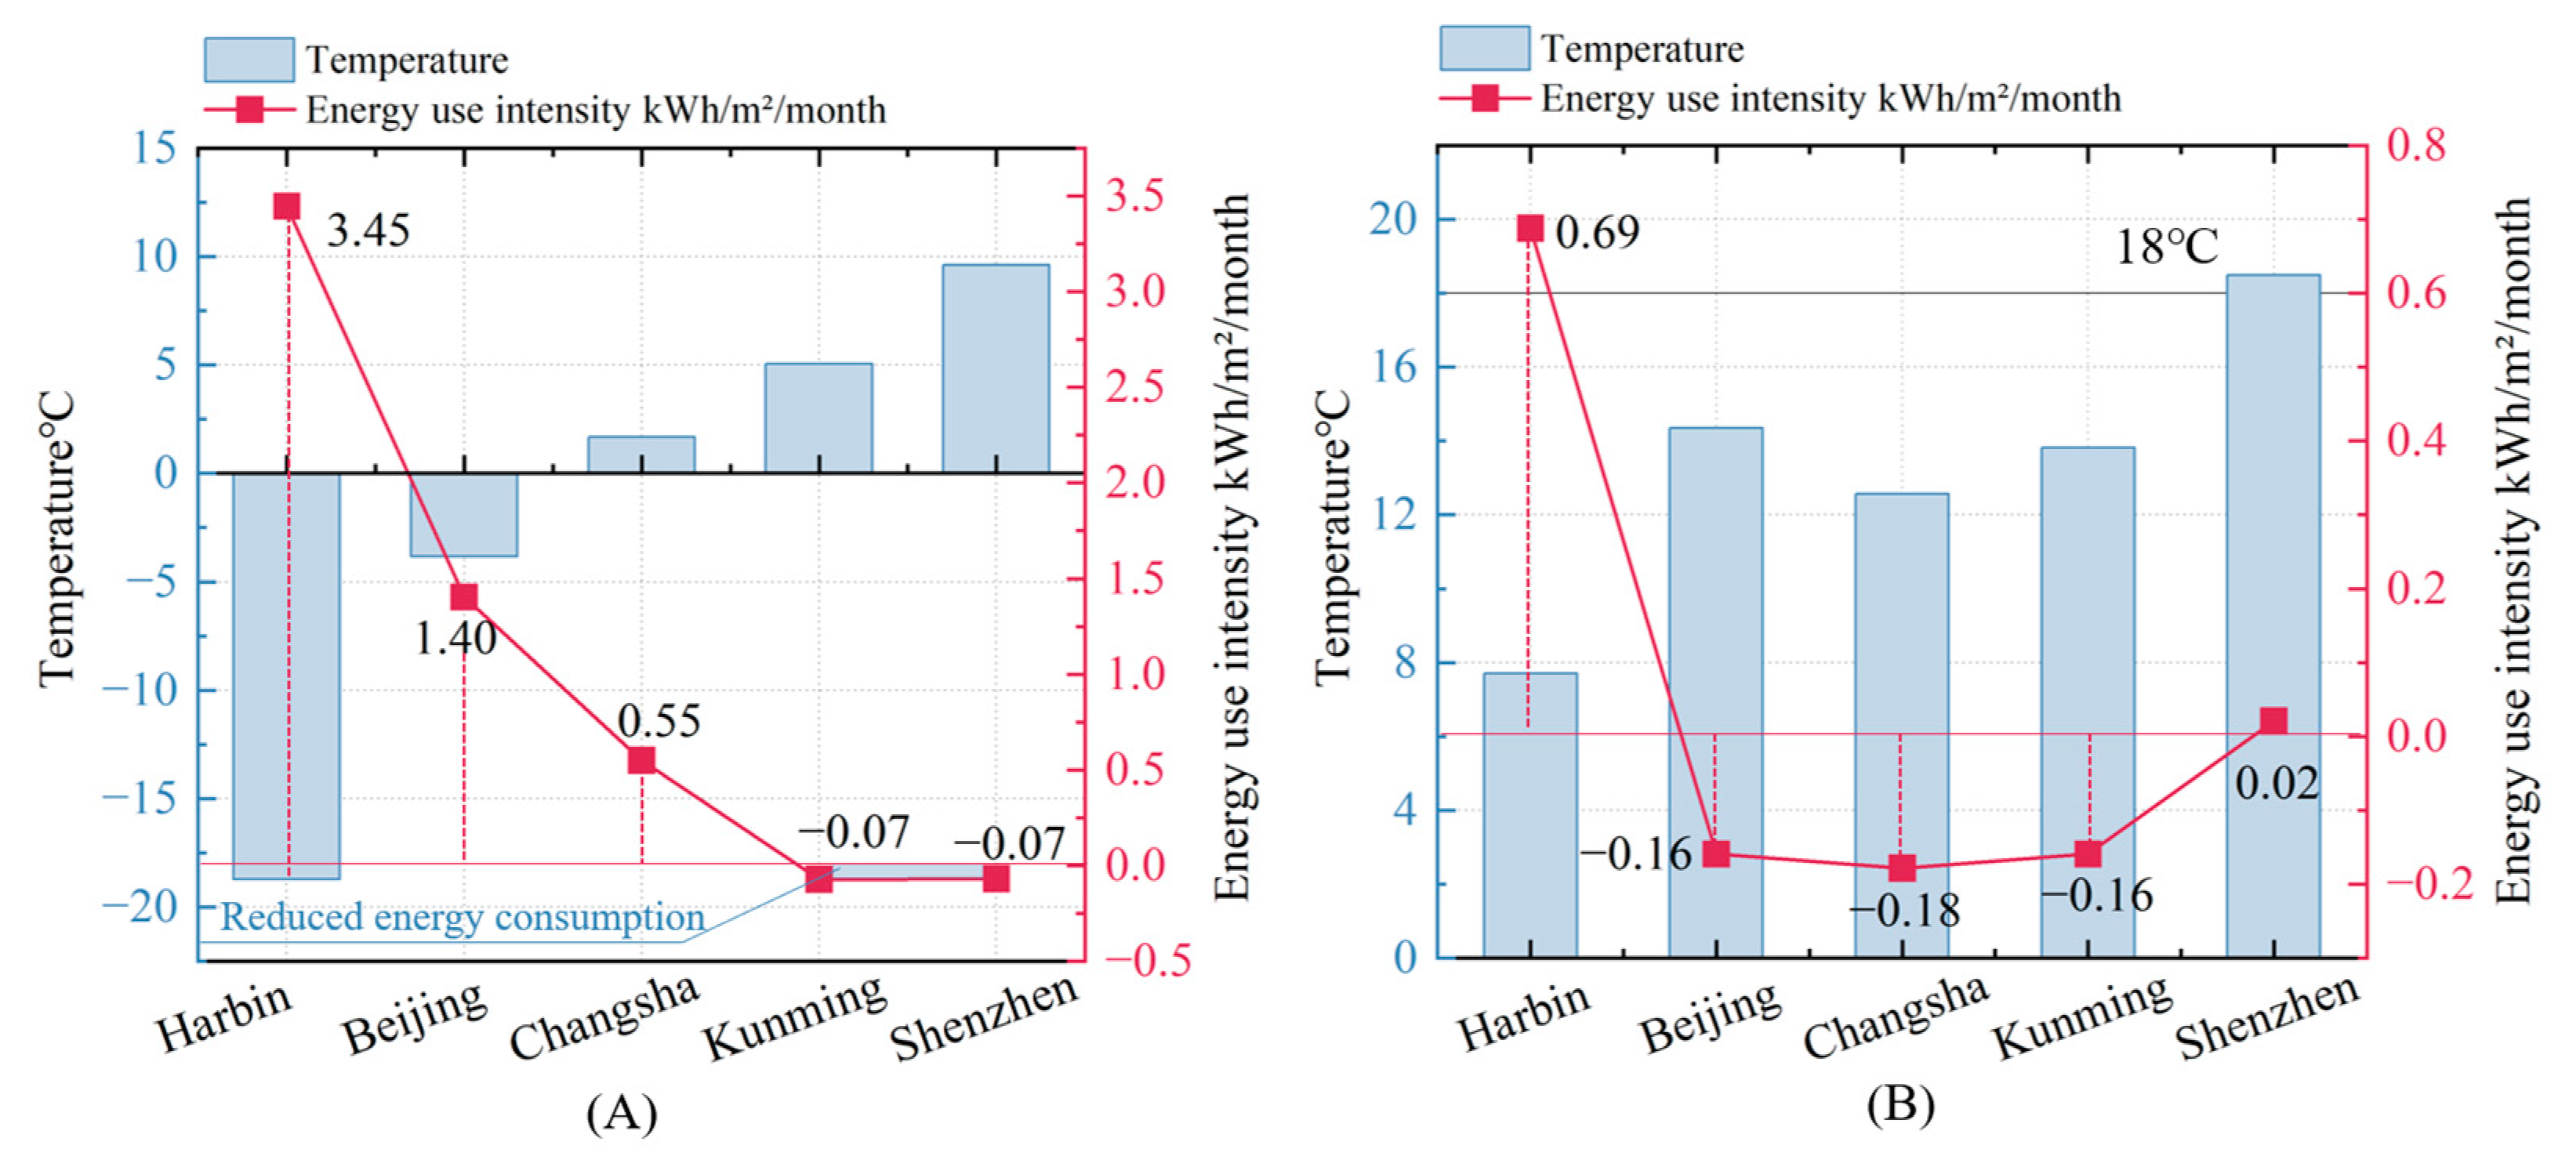
Figure 16 illustrates the relationship between energy-use intensity (EUI) and outdoor temperatures in five cities (Harbin, Beijing, Changsha, Kunming, and Shenzhen), represented by January (
Figure 16A) in winter and April (
Figure 16B) in the transitional season. In January, the risk of influenza infection can be effectively controlled through natural ventilation alone, eliminating the energy consumption of mechanical systems. This highlights the direct influence of outdoor conditions on energy efficiency. The data show a clear inverse relationship between temperature and EUI. In colder northern cities like Harbin and Beijing, higher heating demands significantly increase energy use, with the energy consumption variation in Harbin reaching 3.45 kWh/m
2/month and the energy consumption variation in Beijing reaching 1.40 kWh/m
2/month. On the other hand, southern cities like Changsha (5 °C), Kunming (15 °C), and Shenzhen (18 °C) demonstrate much lower EUI, with the energy consumption variation in Changsha at 0.55 kWh/m
2/month, while Kunming and Shenzhen show almost zero energy use (−0.07 and −0.07 kWh/m
2/month, respectively).
As outdoor temperatures rise in April, narrowing indoor–outdoor thermal gradients, strategic natural ventilation introduction avoids excessive heat loads while reducing mechanical system reliance—notably lowering energy use in Beijing, Changsha, and Kunming. By contrast, Shenzhen’s consistently warm climate maintains stable energy demands, whereas Harbin observes modest consumption increases yet remains below January levels. Critically, this seasonal pattern demonstrates natural ventilation’s capacity to simultaneously mitigate infection risks and optimize energy efficiency during transitional periods, even across diverse climatic zones. These outcomes starkly contrast colder climates’ elevated heating burdens with warmer regions’ reduced mechanical dependencies, collectively underscoring that climate-responsive ventilation adaptation—particularly in high-risk hospitals—effectively balances airborne pathogen control and sustainable energy use.
Figure 17 analyzes changes in the energy consumption and fresh-air ratio of AWU under April conditions for controlling COVID-19 and measles. To focus on the relationship between AWU-introduced airflow and energy consumption, this analysis excludes Harbin due to its low outdoor temperatures, which lead to significant heat loss during ventilation and require additional heating. Instead, the study focuses on four cities—Beijing, Changsha, Shenzhen, and Kunming—where outdoor temperatures have minimal influence on energy consumption, as shown in
Figure 16. In these cities, whether for measles or COVID-19, the higher the mechanical ventilation rate, the lower the reliance on natural ventilation, allowing for a clearer comparison of the impact of the AWU and FAU ratio on energy use. Specifically, for measles, the analysis reveals that AWU contributes significantly to natural ventilation, with Beijing showing the highest contribution (82.9%) and Shenzhen the lowest (71.6%). Conversely, energy consumption follows an inverse trend, with Shenzhen exhibiting the highest increase (3.27 kWh/m
2/month) and Beijing the lowest (1.6 kWh/m
2/month). Although the airflow contributions of AWU for COVID-19 are lower than those for measles, the same trend is observed across the four cities. For COVID-19, AWU contributions range from 41.8% in Shenzhen to 55.0% in Kunming, with energy consumption increasing accordingly.
These findings strongly highlight the pivotal role of regional climate conditions in shaping effective ventilation strategies. In northern cities, typically characterized by strong and consistent winds, natural ventilation proves particularly effective in reducing infection risks during winter and transitional seasons when respiratory diseases are most actively prevalent. In contrast, southern cities, where winds are generally weaker and more unpredictably variable, often necessitate a greater dependence on mechanical ventilation systems to adequately ensure infection control.
From an energy perspective, significantly large temperature differentials between indoor and outdoor environments lead to increased energy consumption when AWUs are utilized for ventilation. However, during transitional seasons like April, natural ventilation through AWU can substantially lower energy consumption without the need for outdoor temperatures to precisely match indoor setpoints (18 °C). The inverse correlation between AWU-driven natural ventilation and energy consumption further underscores the value of strategically optimizing AWU usage to effectively enhance energy efficiency while simultaneously mitigating infection risks. Ultimately, adapting ventilation strategies to the distinctly unique climatic features of each region is absolutely crucial for achieving an optimal balance between infection control and energy sustainability.
5.3. Benefits of the Optimal Ventilation Strategy
This study comprehensively investigated adaptive ventilation strategies for hospital environments, proposing a novel hybrid system integrating natural and mechanical ventilation (FAU + AWU + FCU) to mitigate airborne infection risks while optimizing energy efficiency. The major benefits and concerns of the novel air-conditioning system and the corresponding optimal multi-zone ventilation strategy can be drawn as follows.
- (i)
Optimizing ventilation strategies during pandemics: This study provides valuable methods for enhancing indoor air quality, mitigating disease transmission, and achieving energy-efficient operation during high-incidence respiratory infection periods through optimized ventilation strategies using the FAU + AWU + FCU system.
- (ii)
Balancing infection risk and energy efficiency: This study addresses the critical challenge of balancing infection risk reduction and energy efficiency across diverse seasonal conditions. By integrating the AWU module and incorporating seasonal transmission characteristics of respiratory diseases, the proposed strategy dynamically adapts to climatic and epidemiological variations.
- (iii)
Incorporating seasonal variations in diseases: This study introduces a seasonal coefficient into the infection risk model, enabling seasonal infection risk assessments. Building operators can apply this coefficient to identify high-risk areas and periods, allowing preventive adjustments to reduce infection risks during specific times and locations.
- (iv)
Informing HVAC system design and retrofitting: By incorporating a window control device to manage window-opening times and enhance natural ventilation, this study maximizes infection risk reduction and offers valuable insights for HVAC design and retrofitting. Architects and engineers can apply this study’s assessment methods to optimize component selection, ensuring systems include essential pandemic-response capabilities from the design stage.
- (v)
Guiding building codes and standards: Simulations of outdoor ventilation conditions and the introduction of timely natural ventilation allow industry organizations to update HVAC design guidelines, particularly during high-incidence respiratory infection periods. Integrating this study’s findings into building codes promotes best practices that prioritize public health and safety.
5.4. Limitations of the Proposed Approach
While the proposed system demonstrates significant potential in balancing infection control and energy efficiency, three limitations warrant consideration for future research and practical applications:
- (i)
Context-specific parameterization: The seasonal variation coefficients and transmission risk model parameters are tailored to secondary general hospitals in China. Their applicability to other healthcare facilities or non-hospital environments remains to be validated.
- (ii)
Spatial scope constraints: The study focuses on seven functional spaces within outpatient departments, excluding critical areas such as inpatient wards and emergency rooms.
- (iii)
Simplified co-transmission dynamics: The current model assumes single-disease-transmission scenarios without addressing potential interactions among multiple respiratory pathogens. Future work could explore multi-pathogen transmission dynamics to enhance model robustness.


