
Three-Dimensional Simulation of Seismic Structure–Soil–Structure Interaction for Mid-Rise Buildings near Dense Shallow Sloping Soils Under the Impact of 6 February 2023 Kahramanmaraş-Pazarcık Earthquake


Abstract
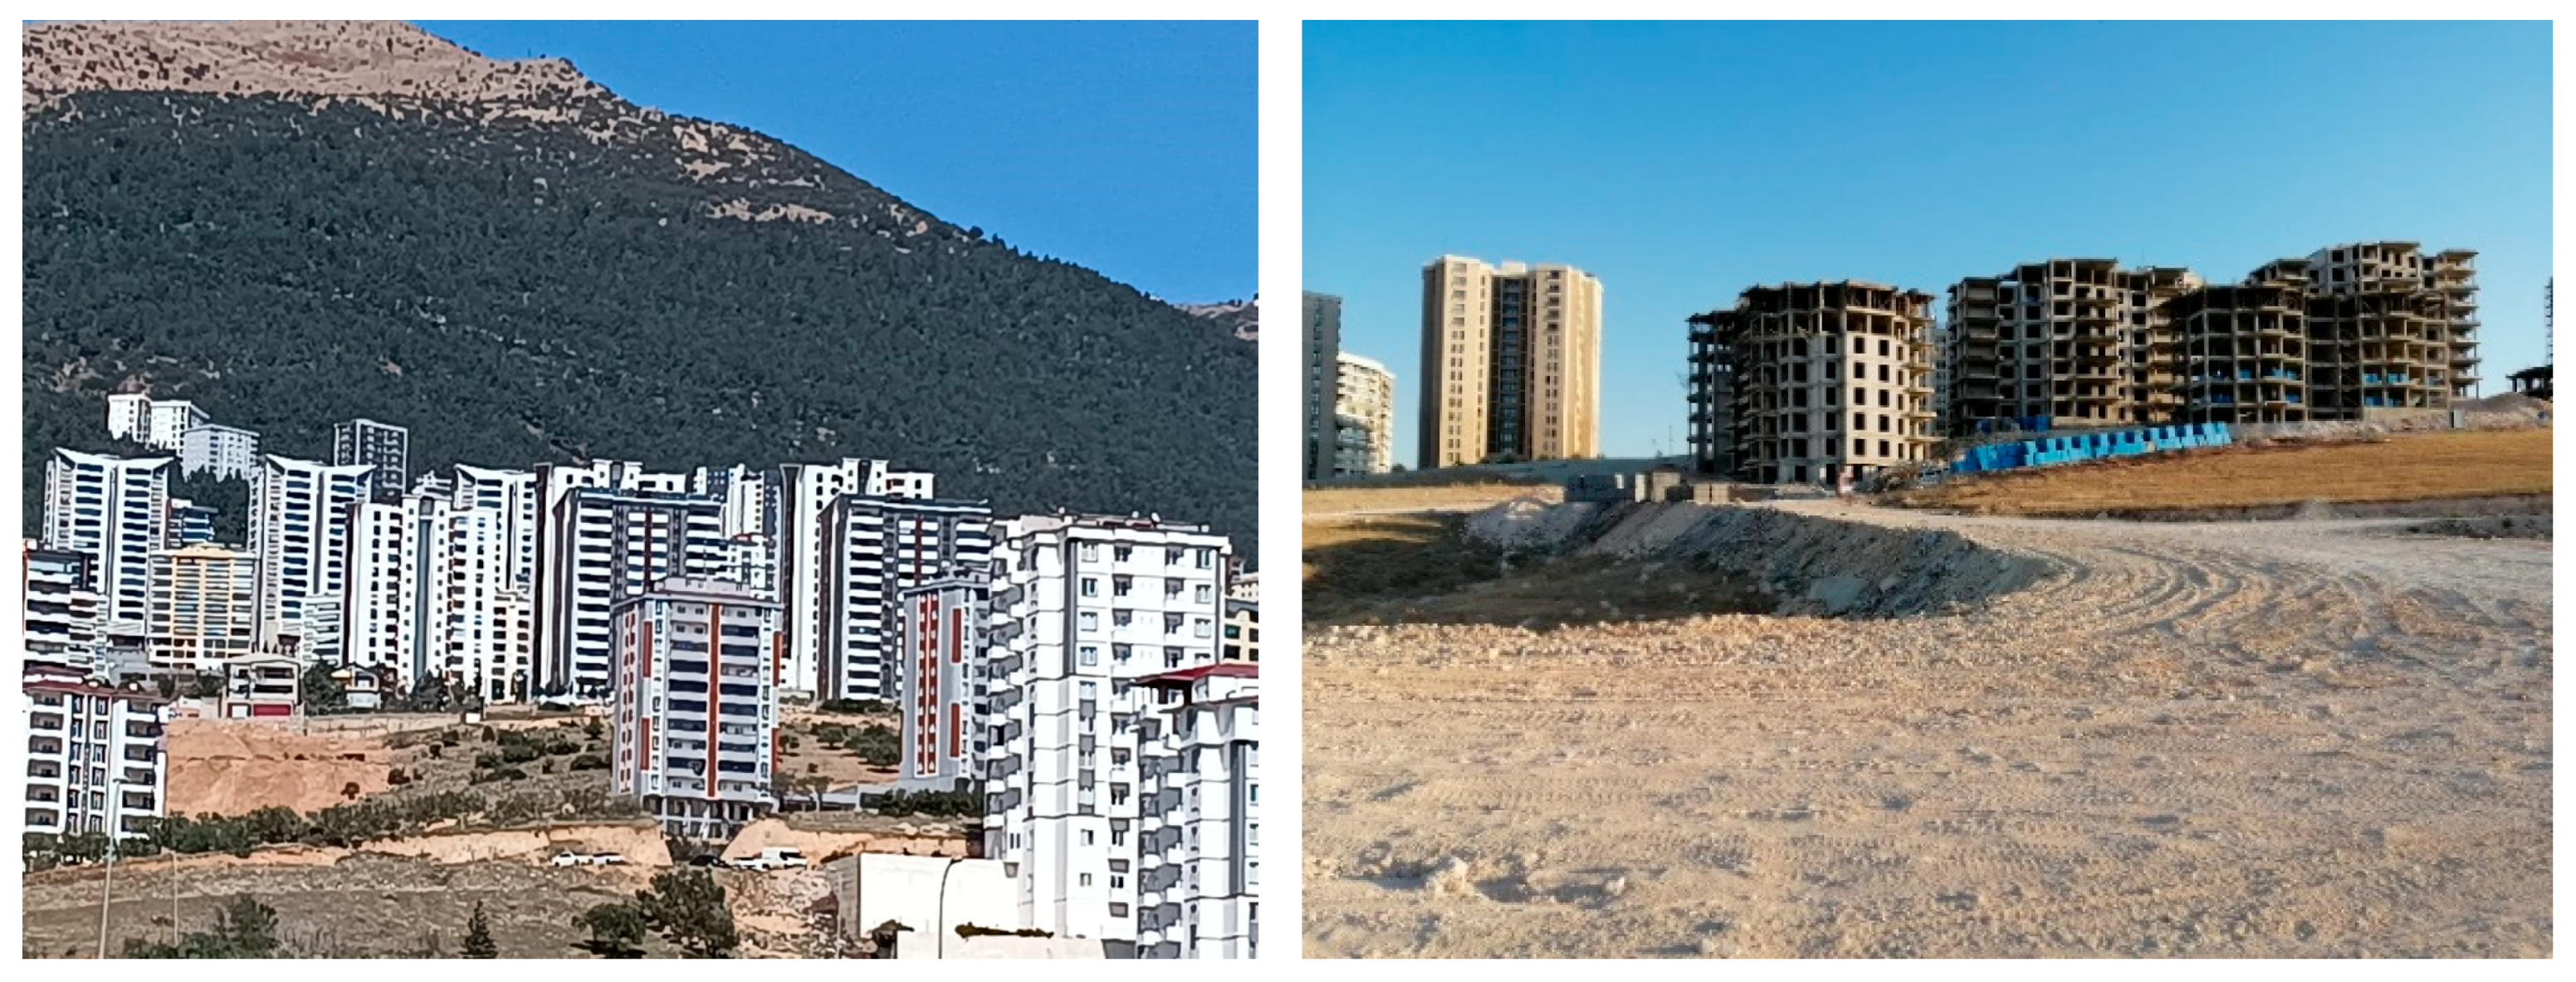
1. Introduction
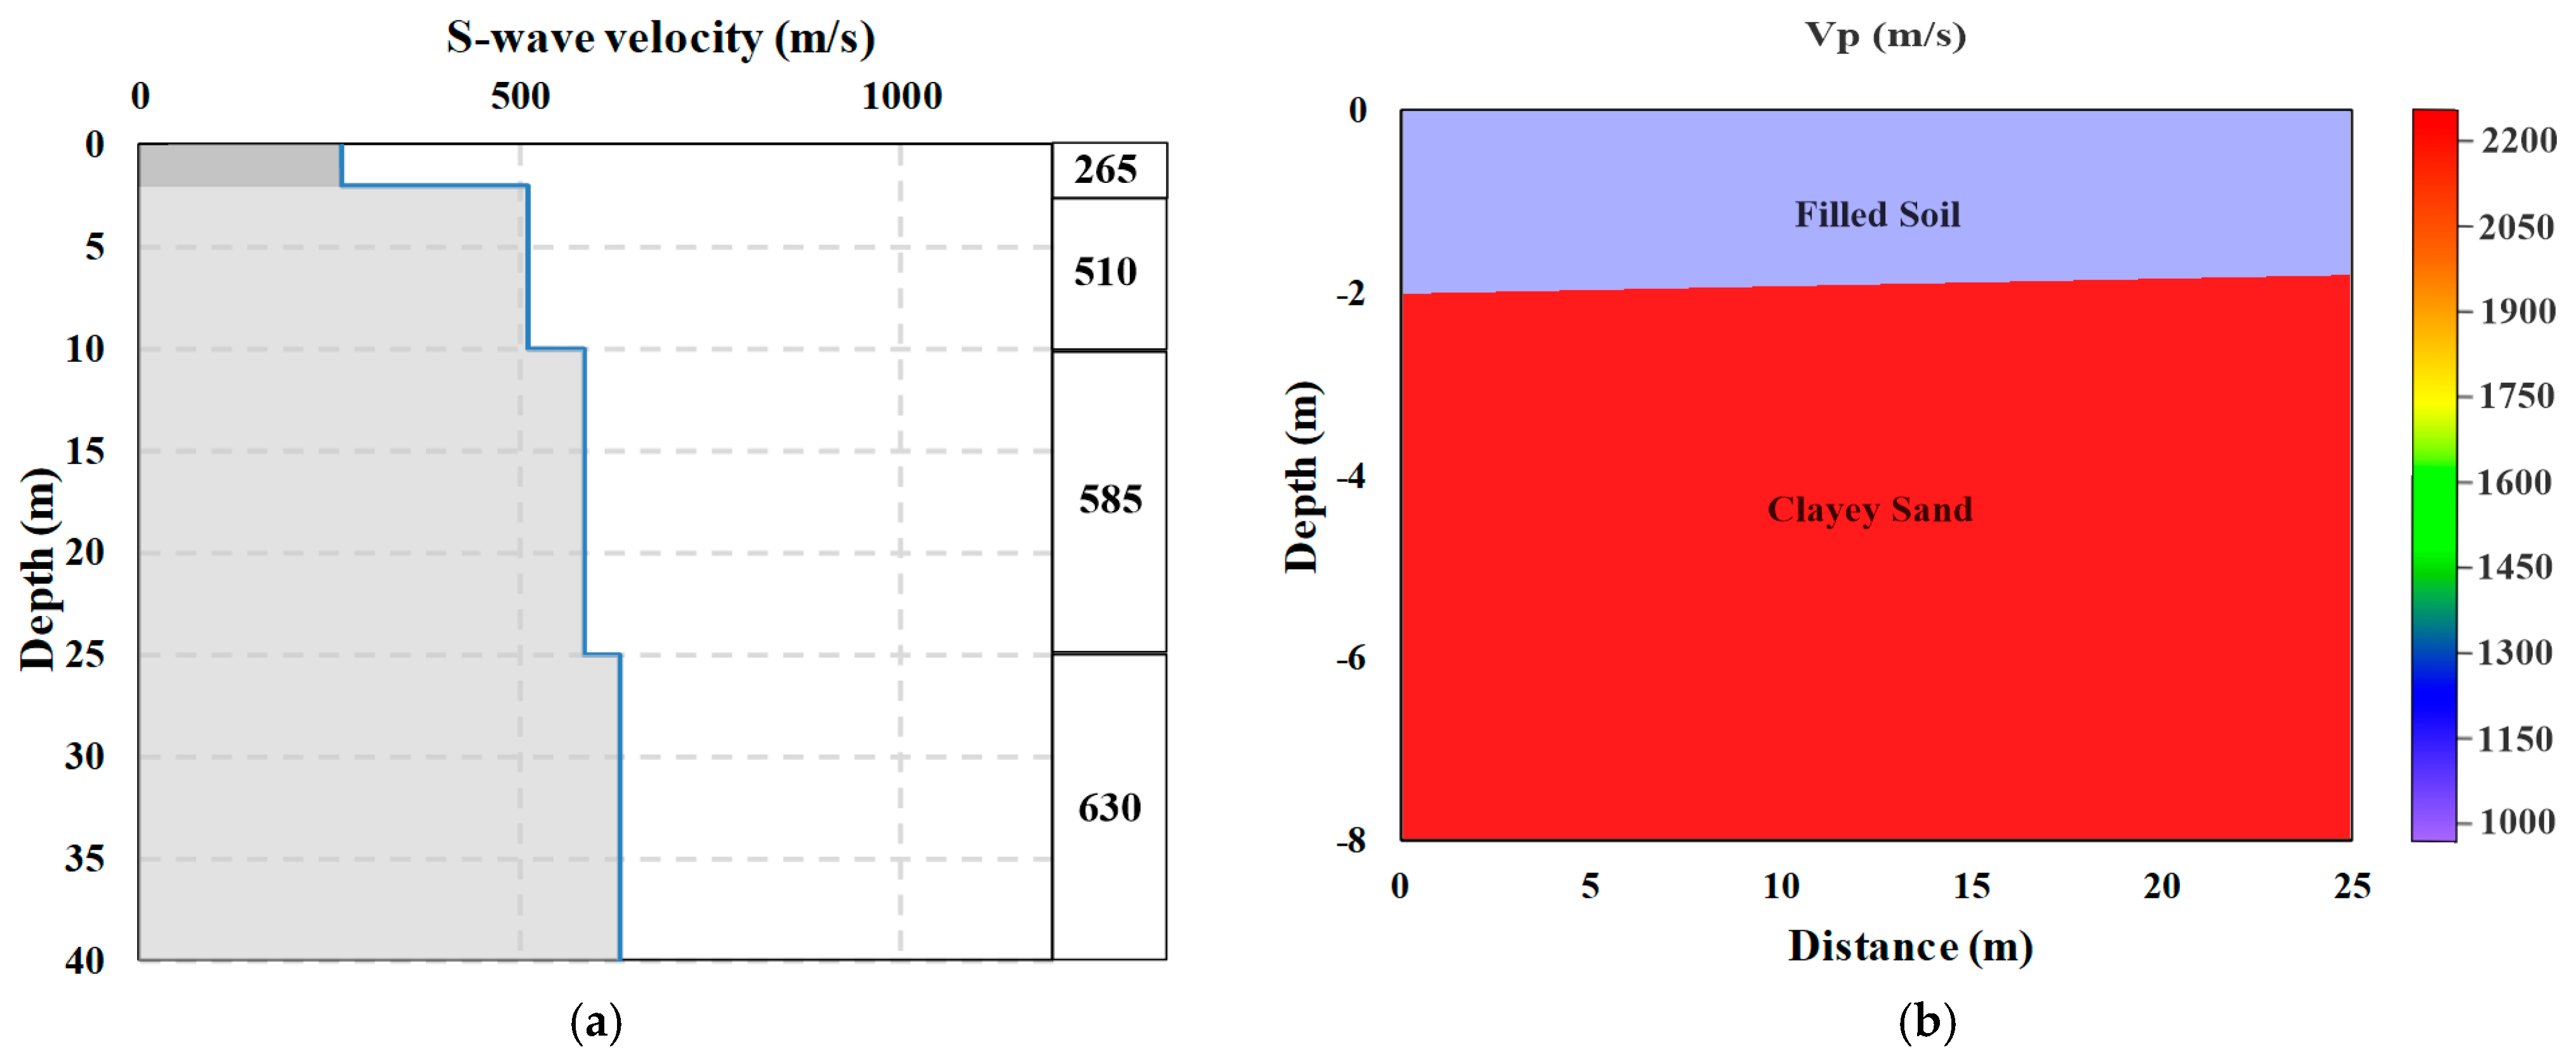
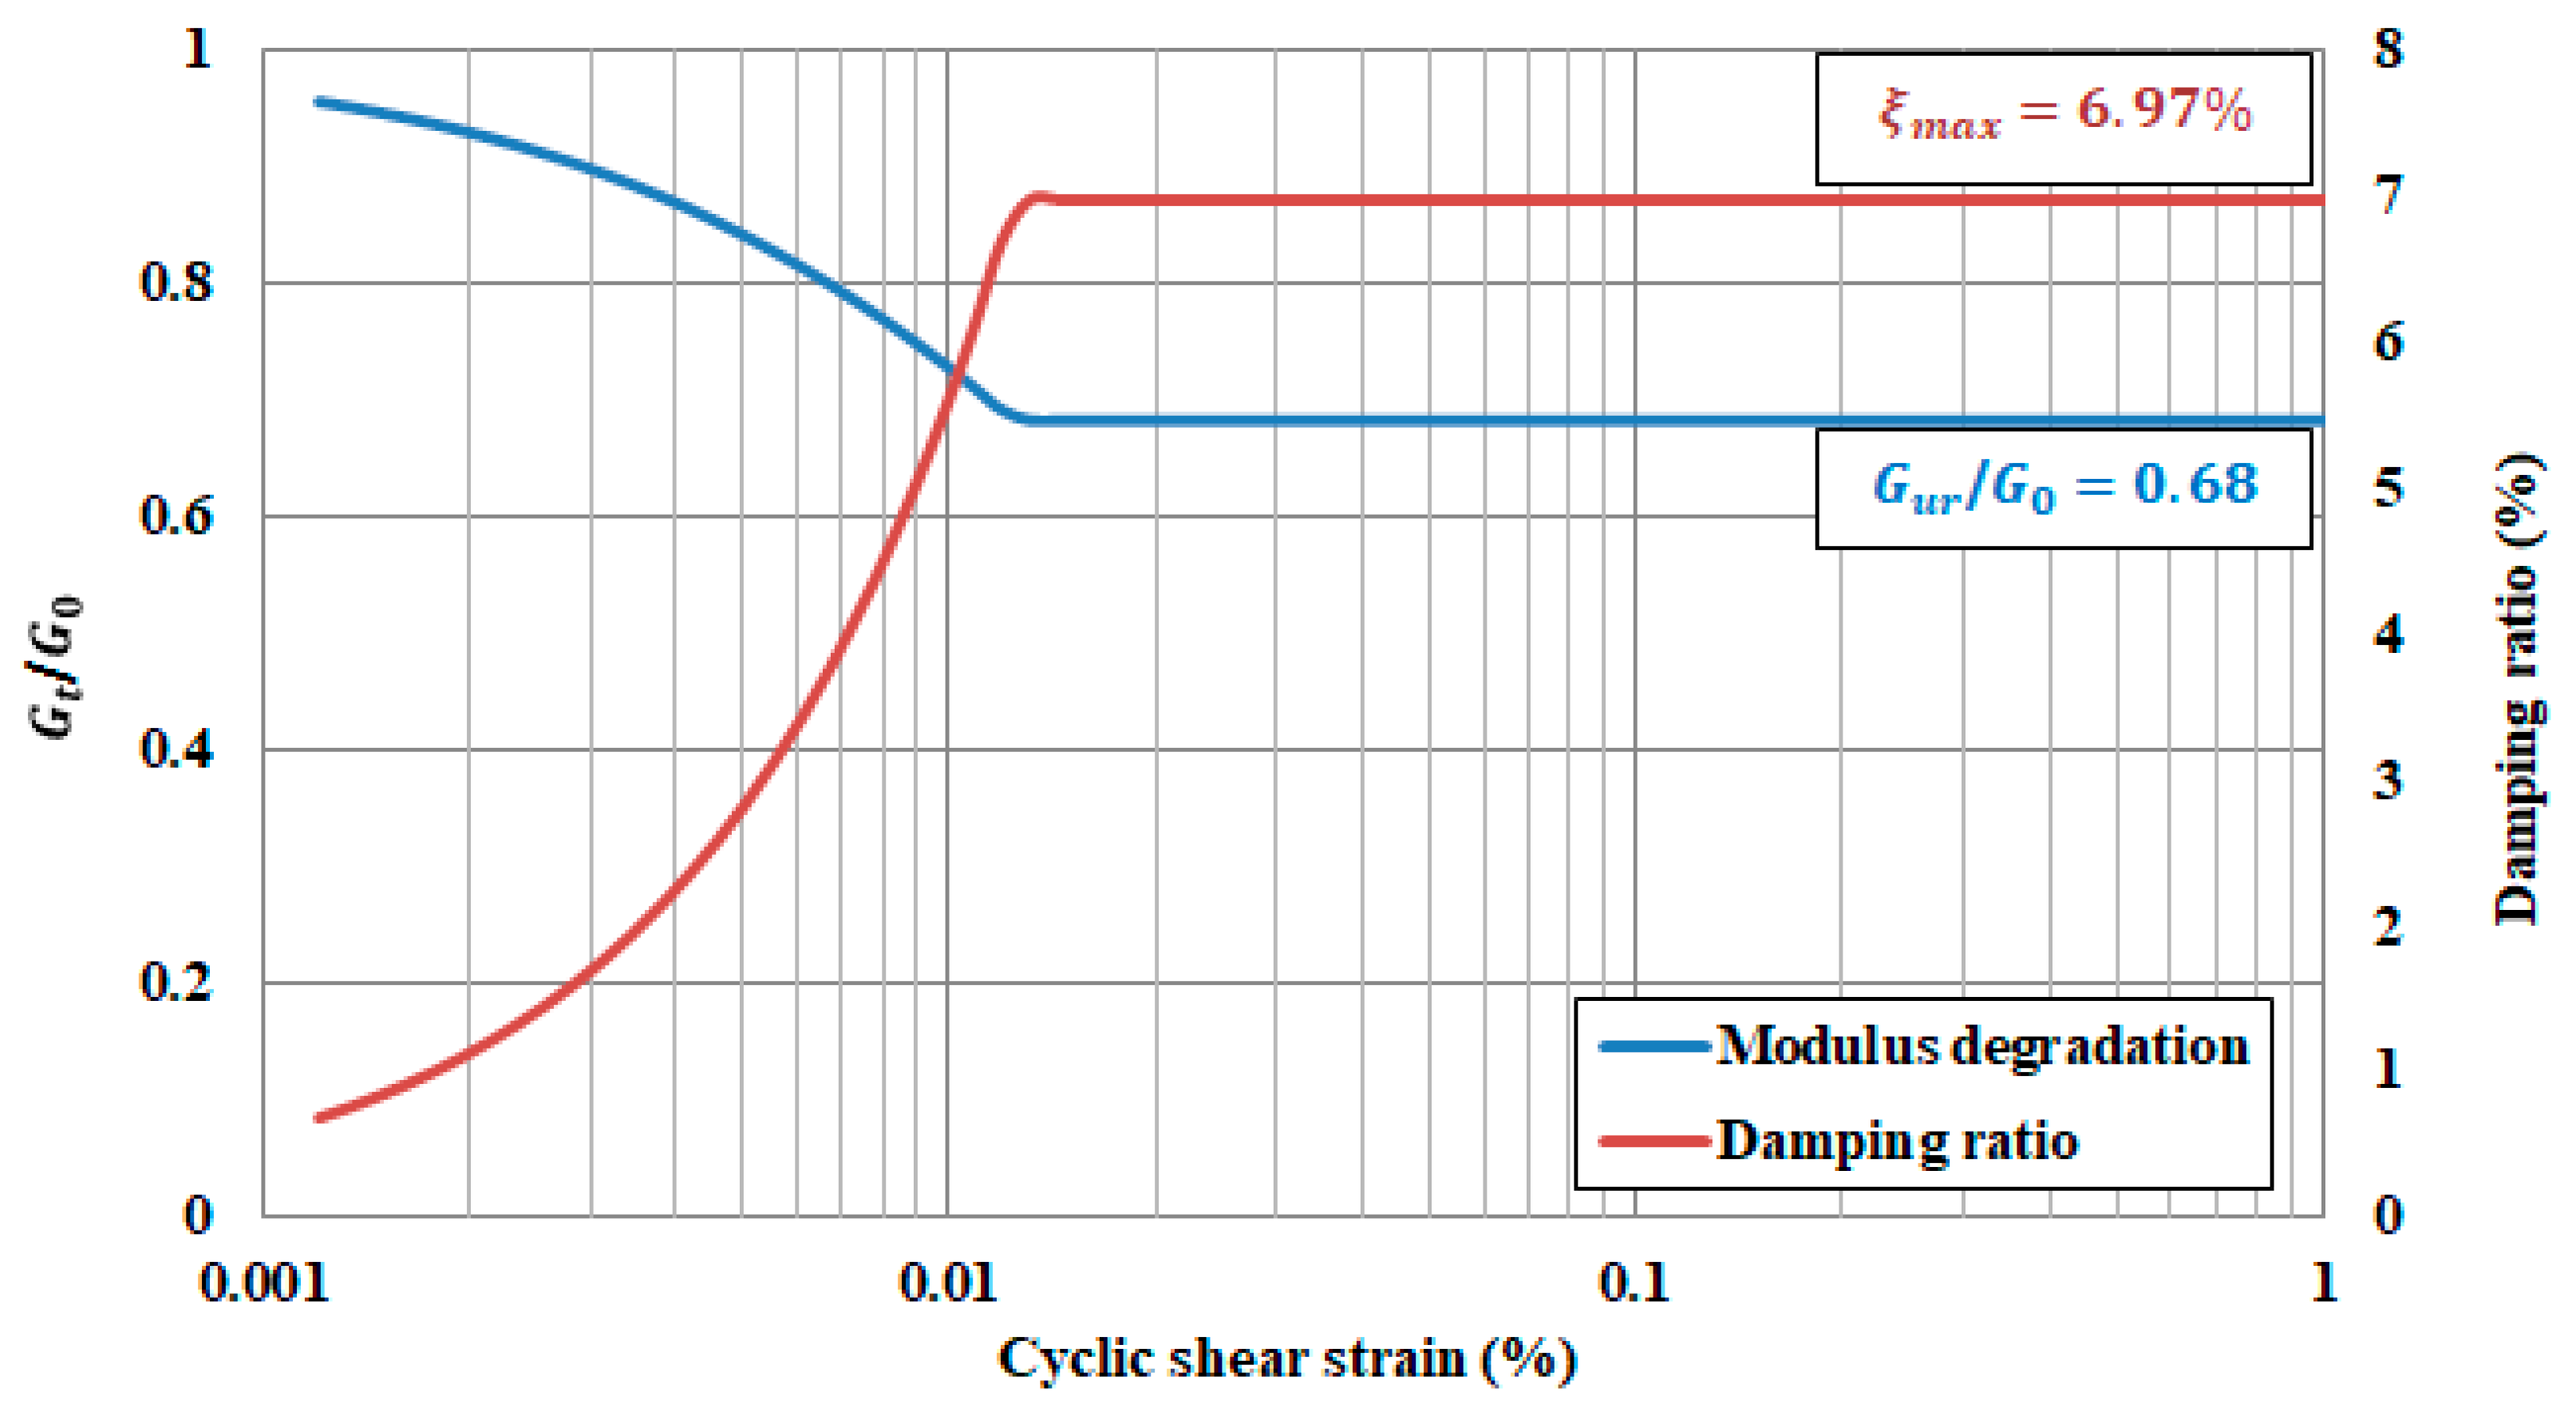
2. Site Investigations and Laboratory Tests
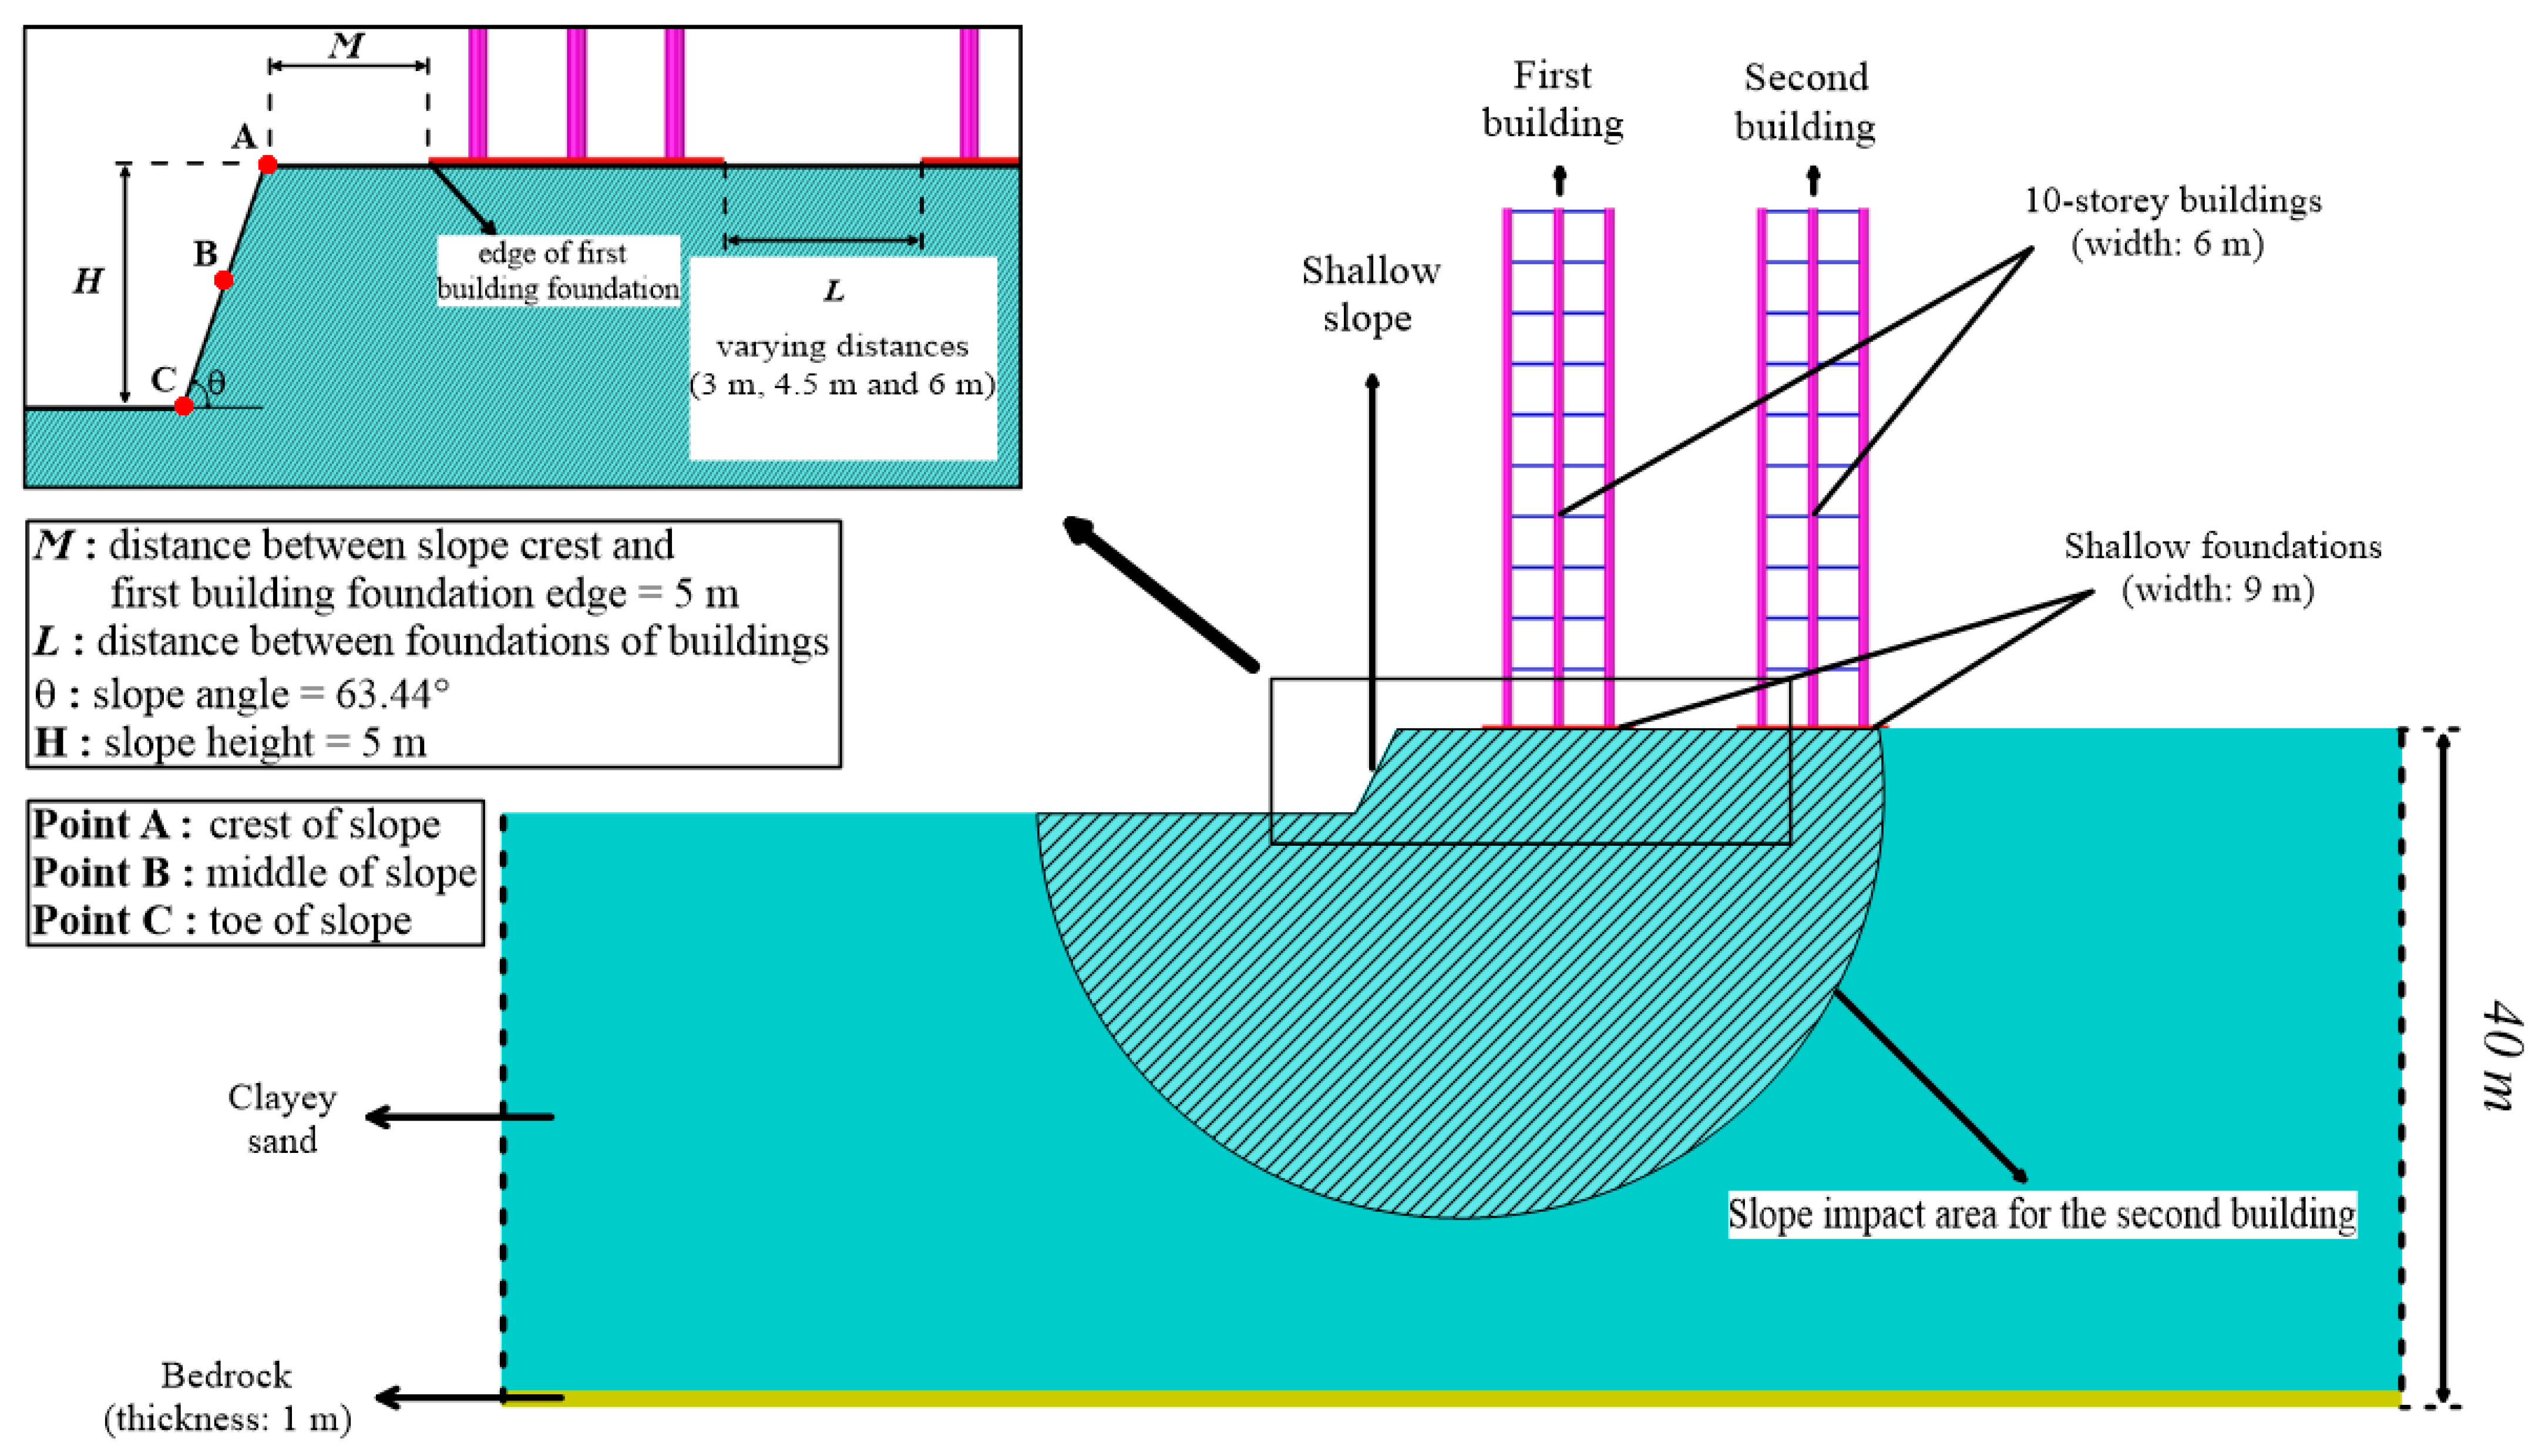
3. Numerical Model
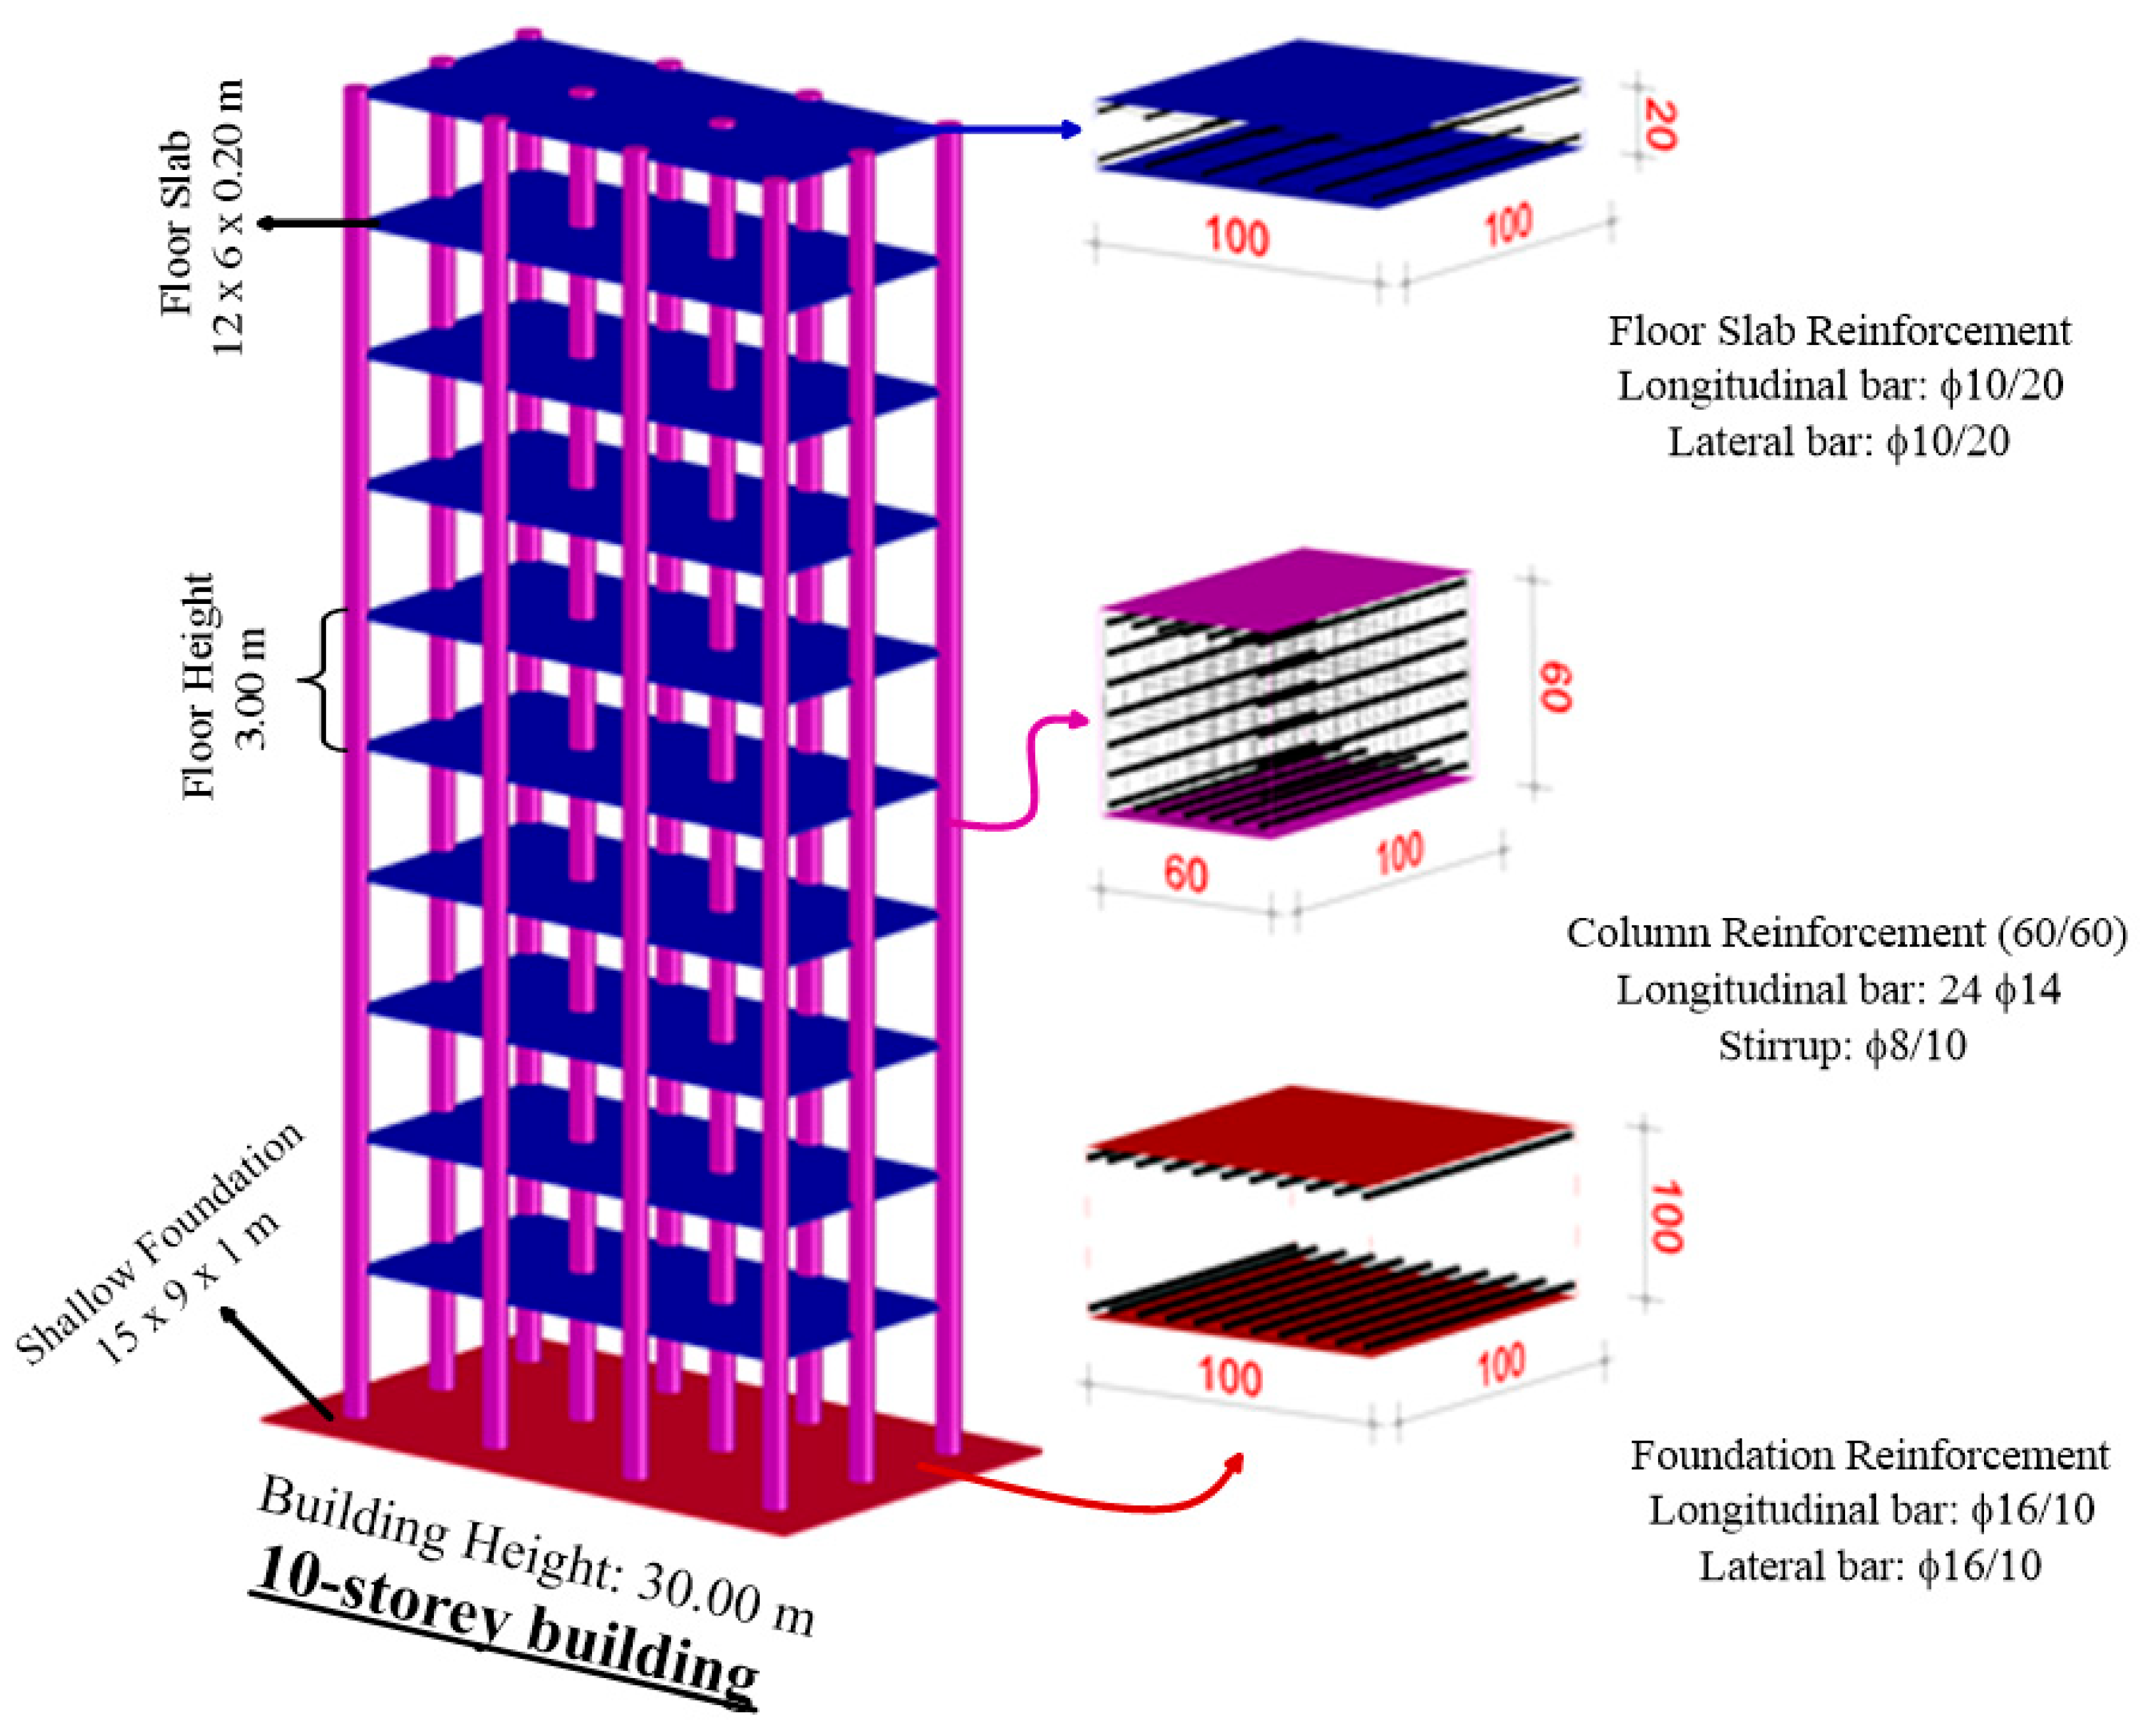
3.1. Superstructure and Foundation
3.2. Substructure Characteristic
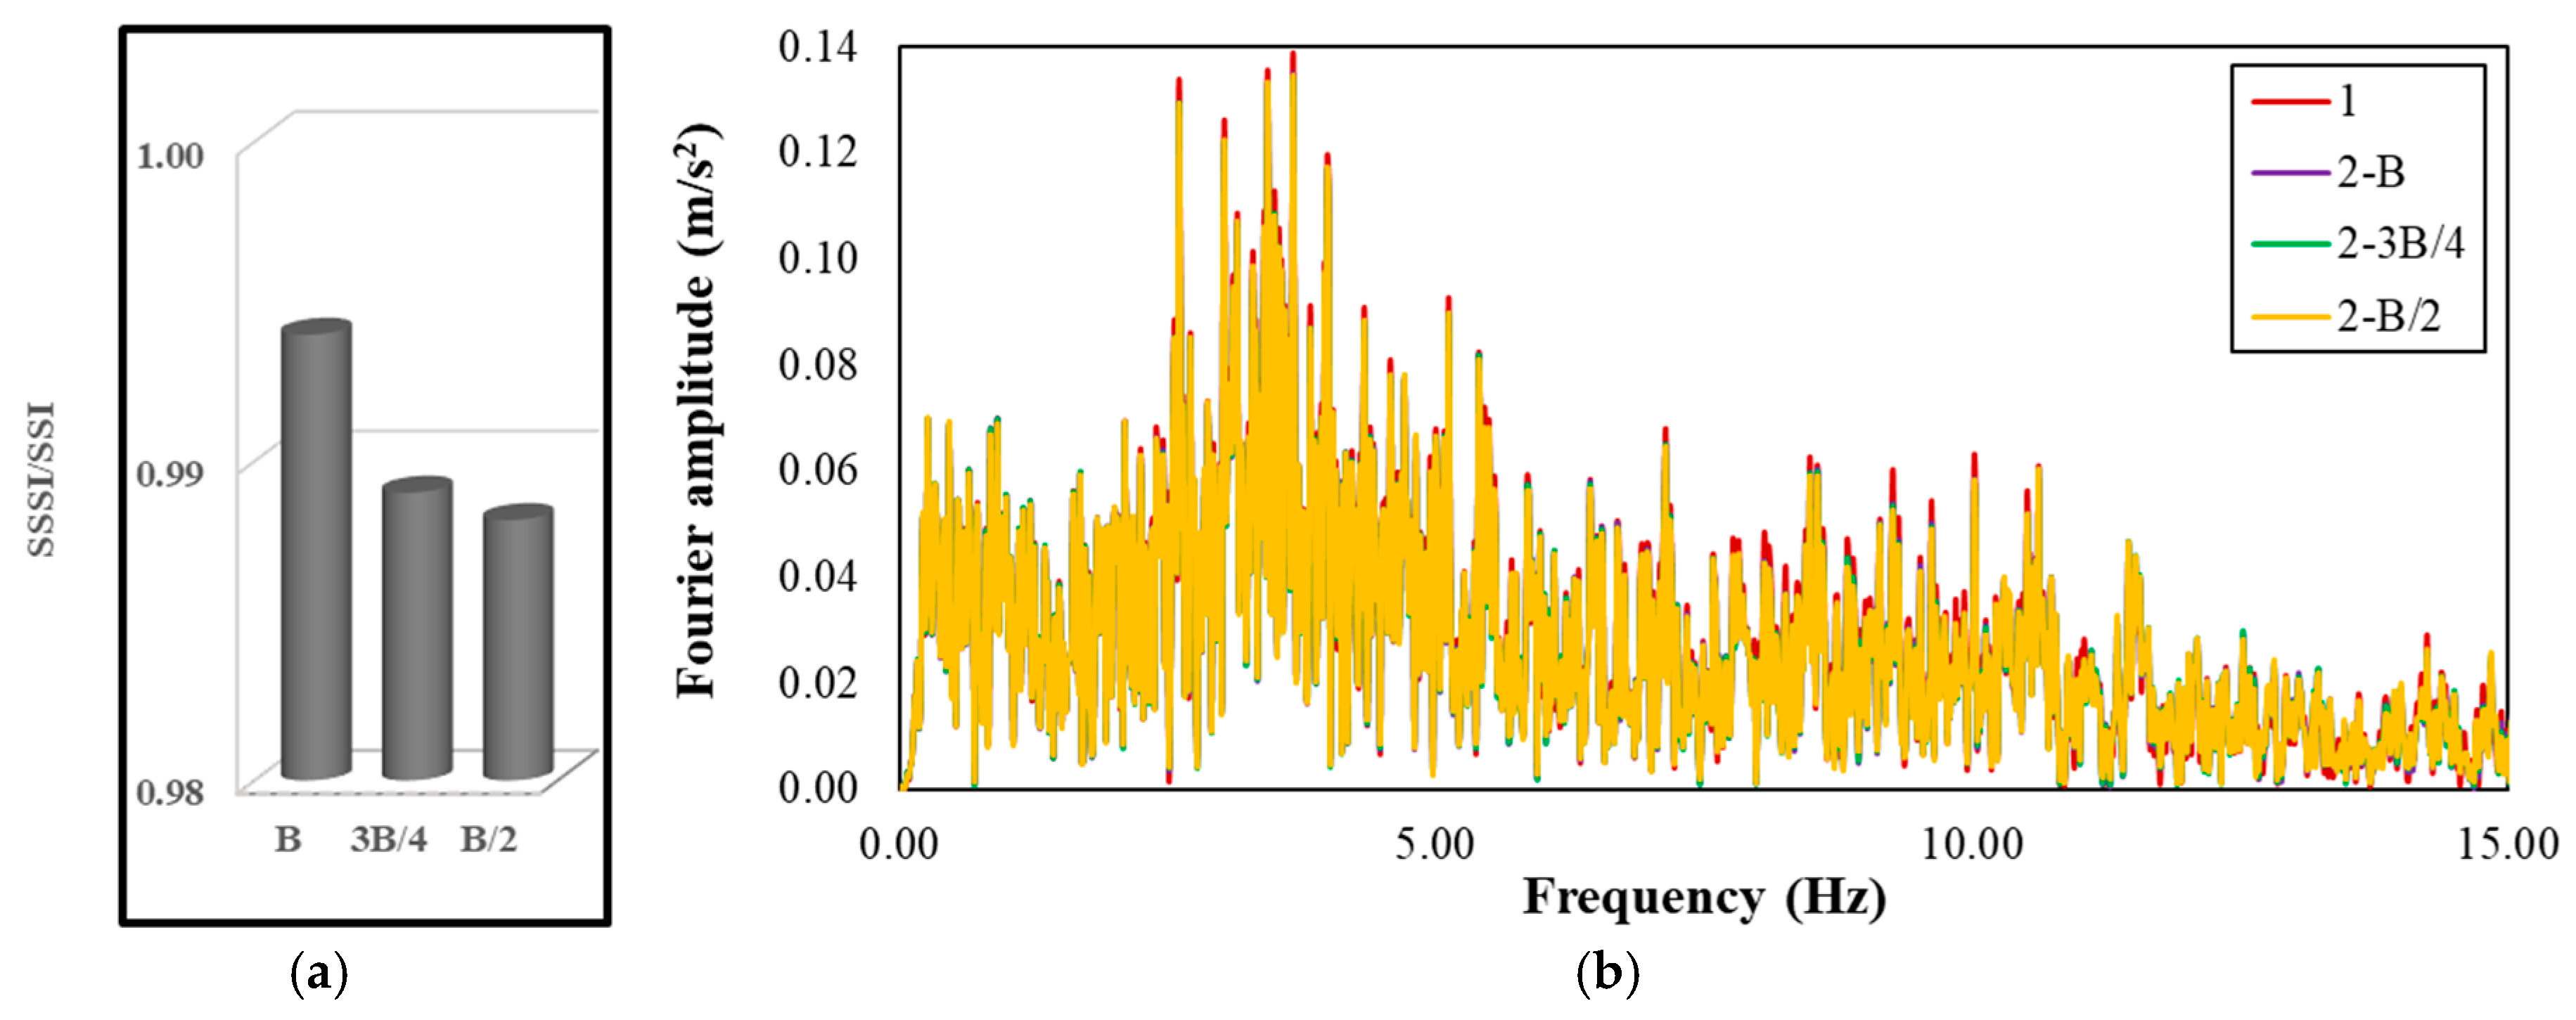
3.3. SSSI Modelling
4. Results and Discussion
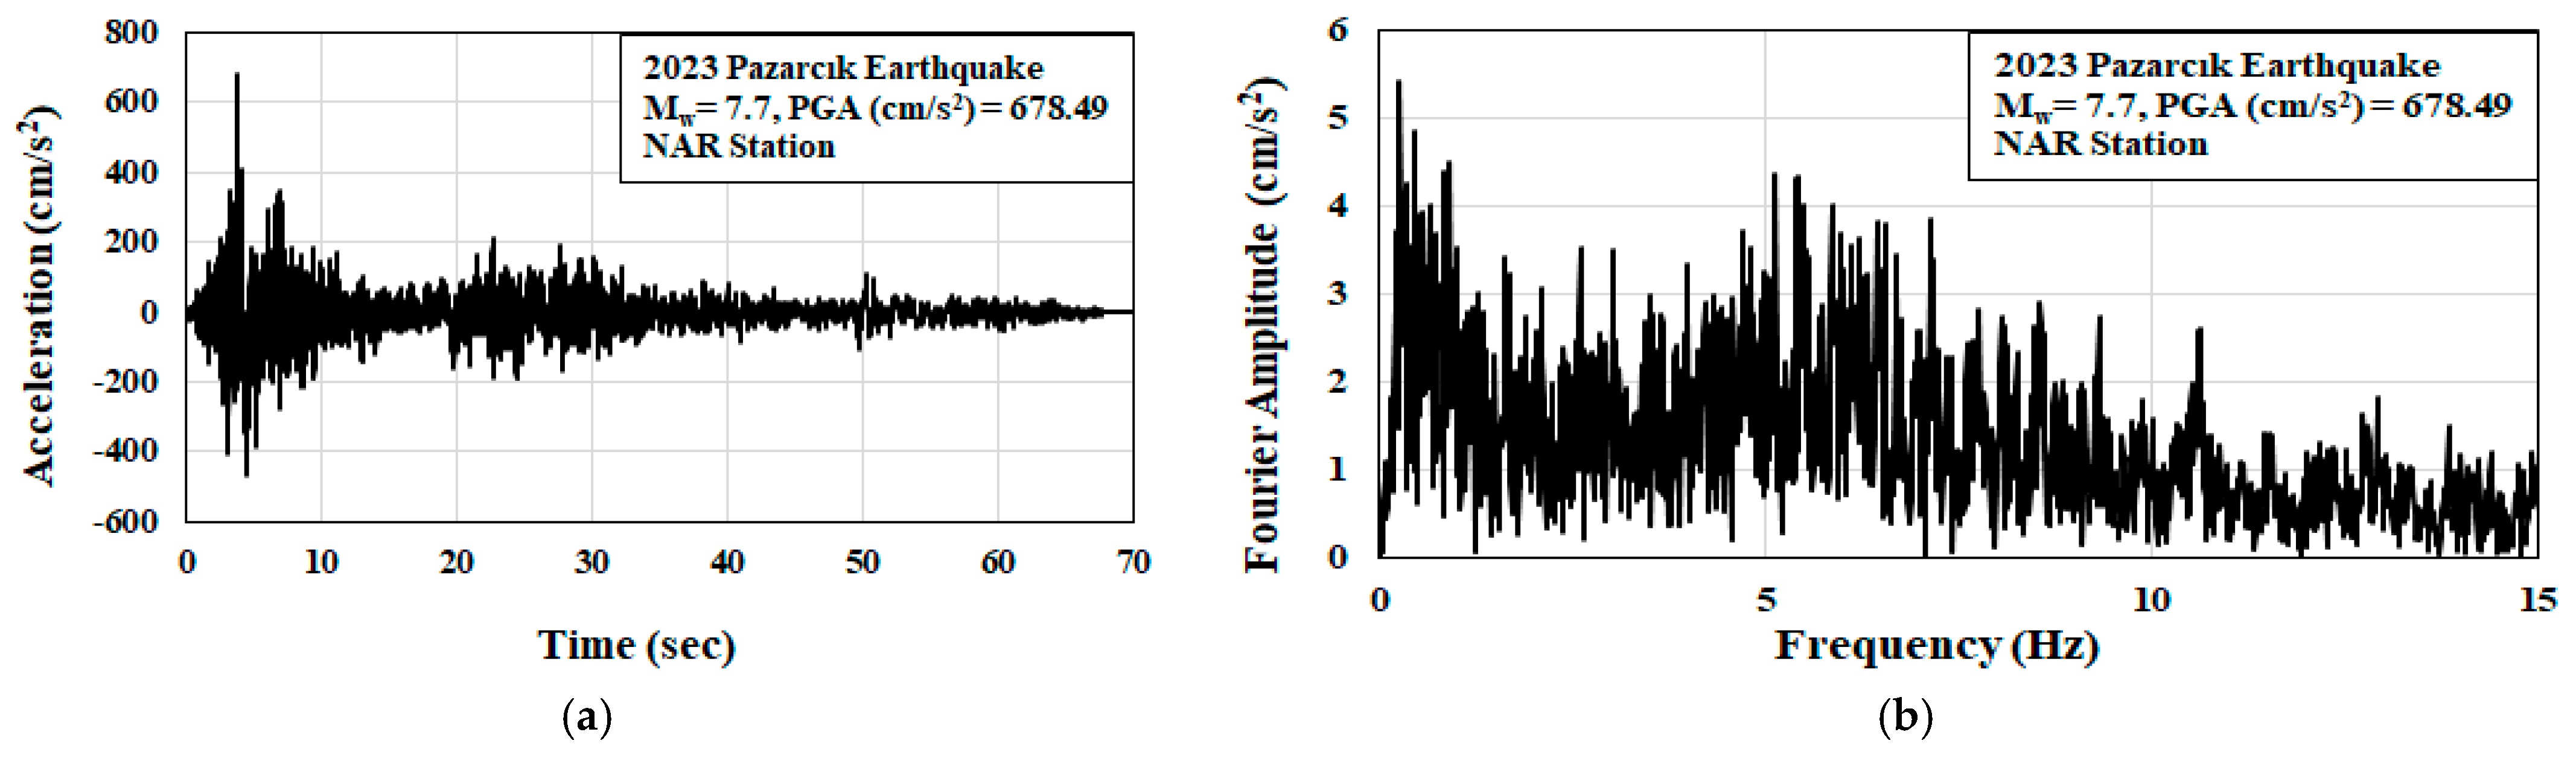
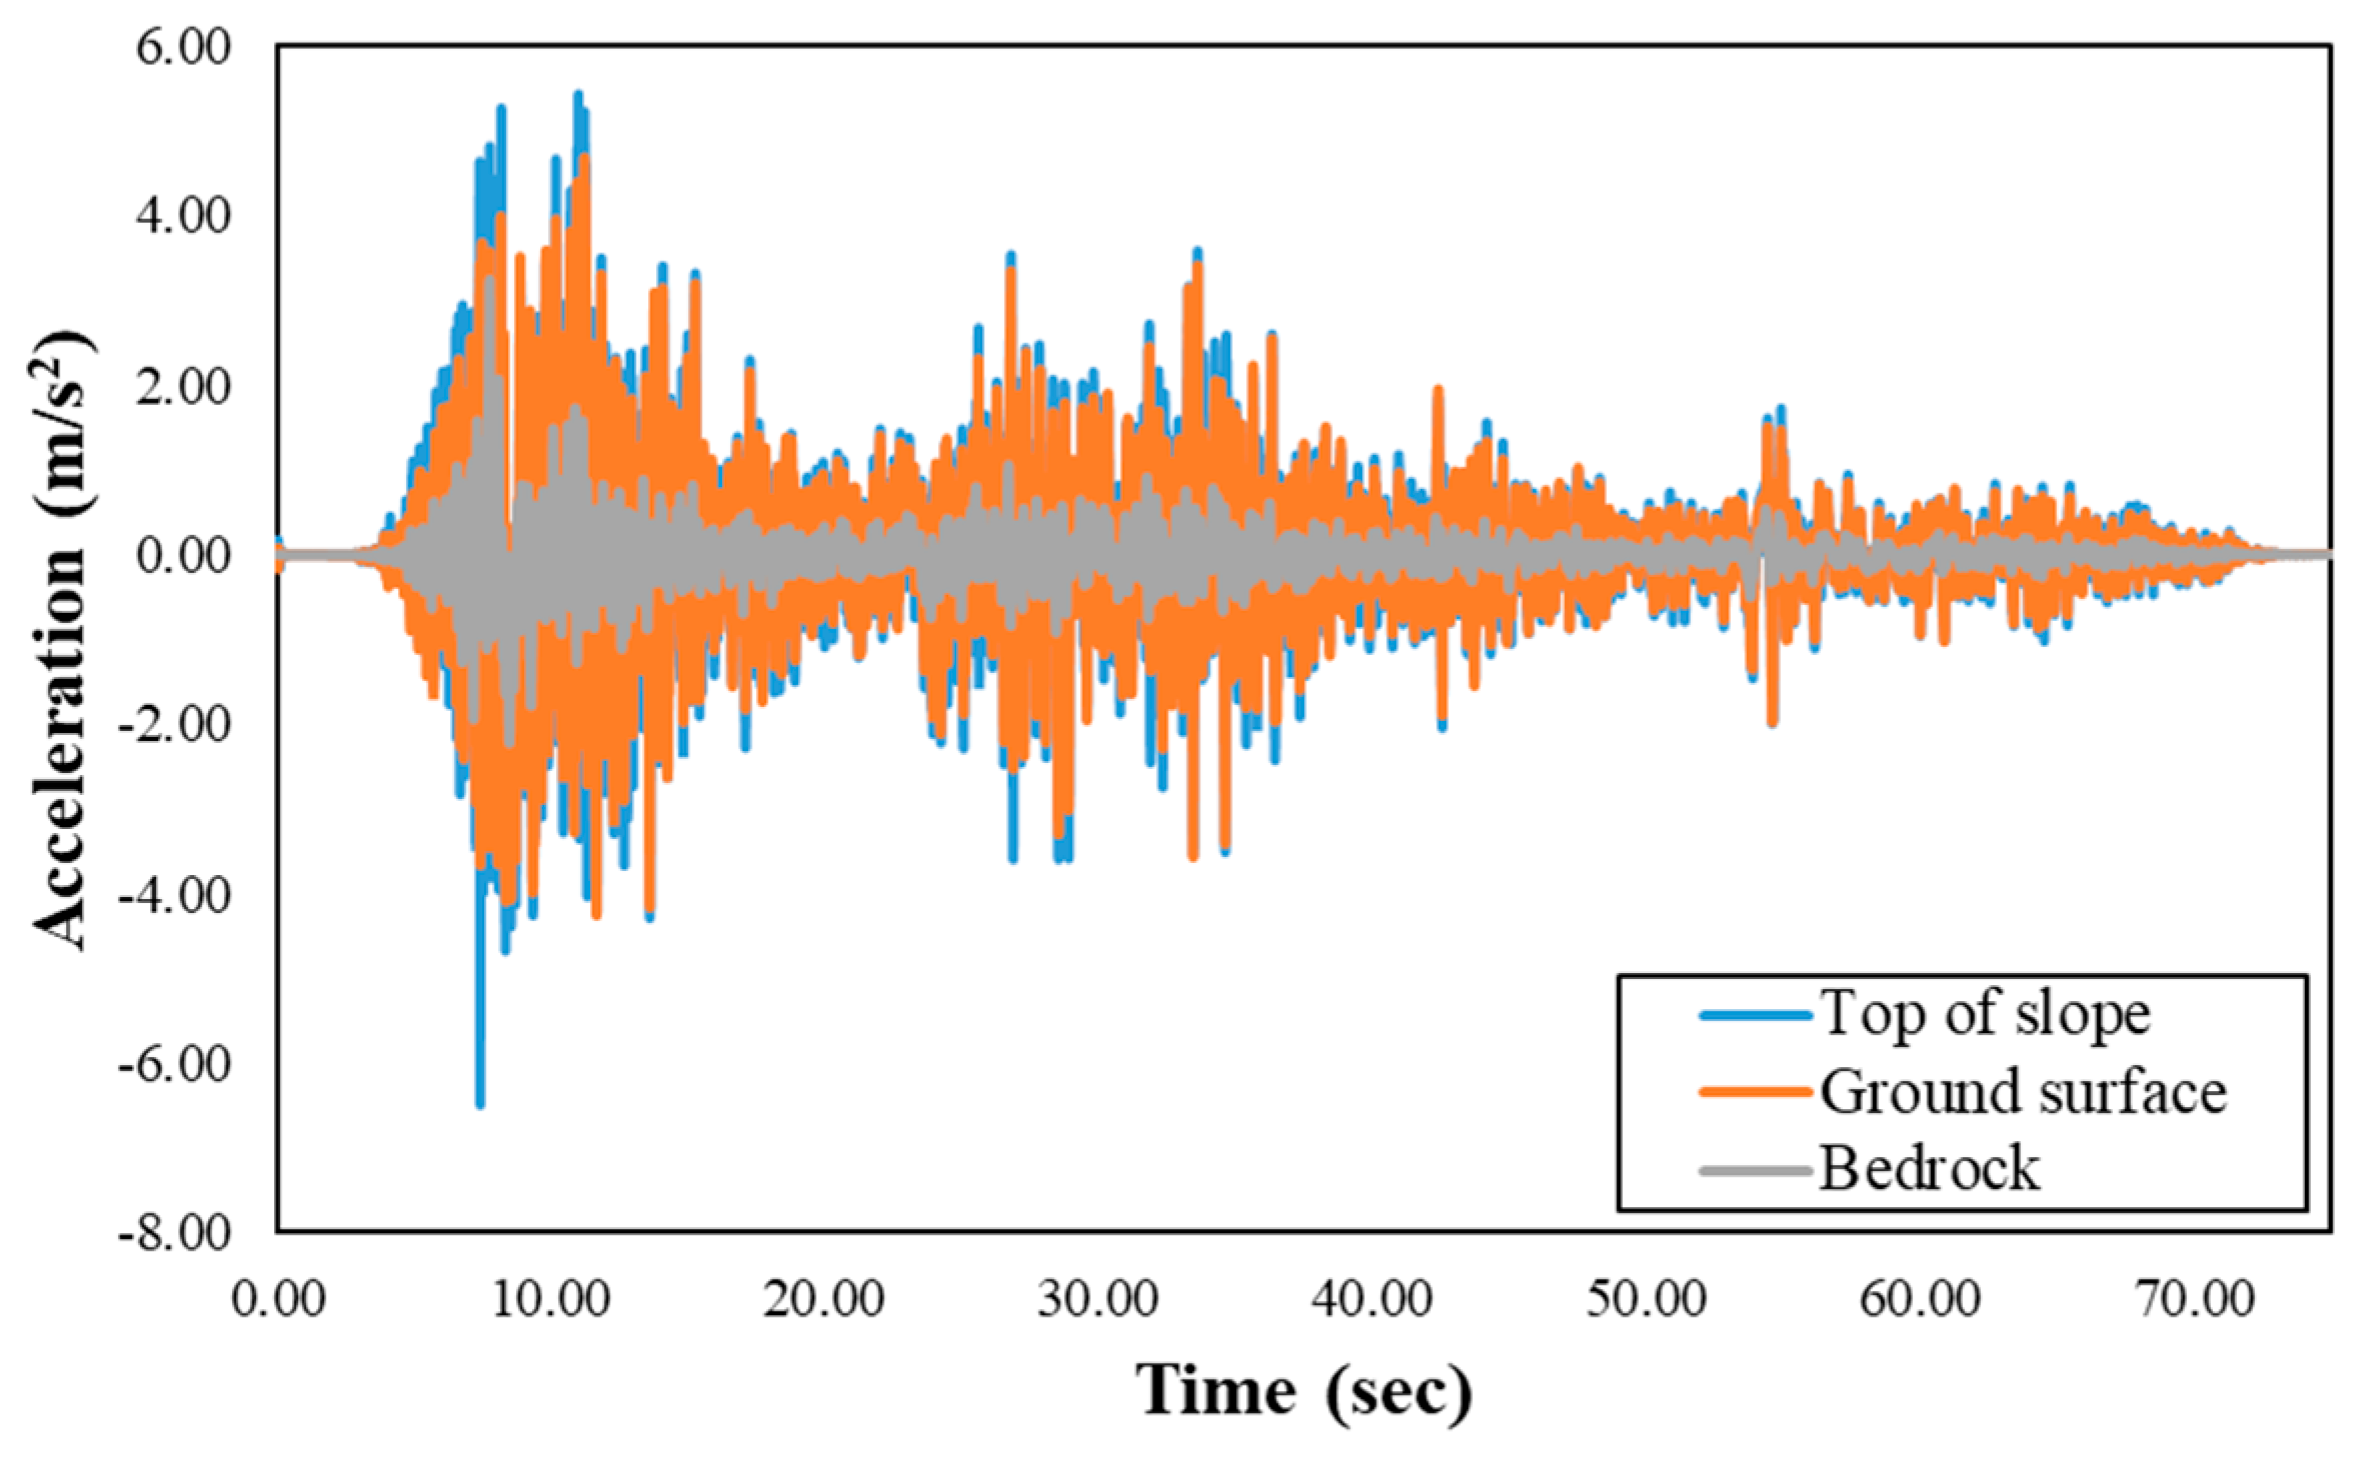
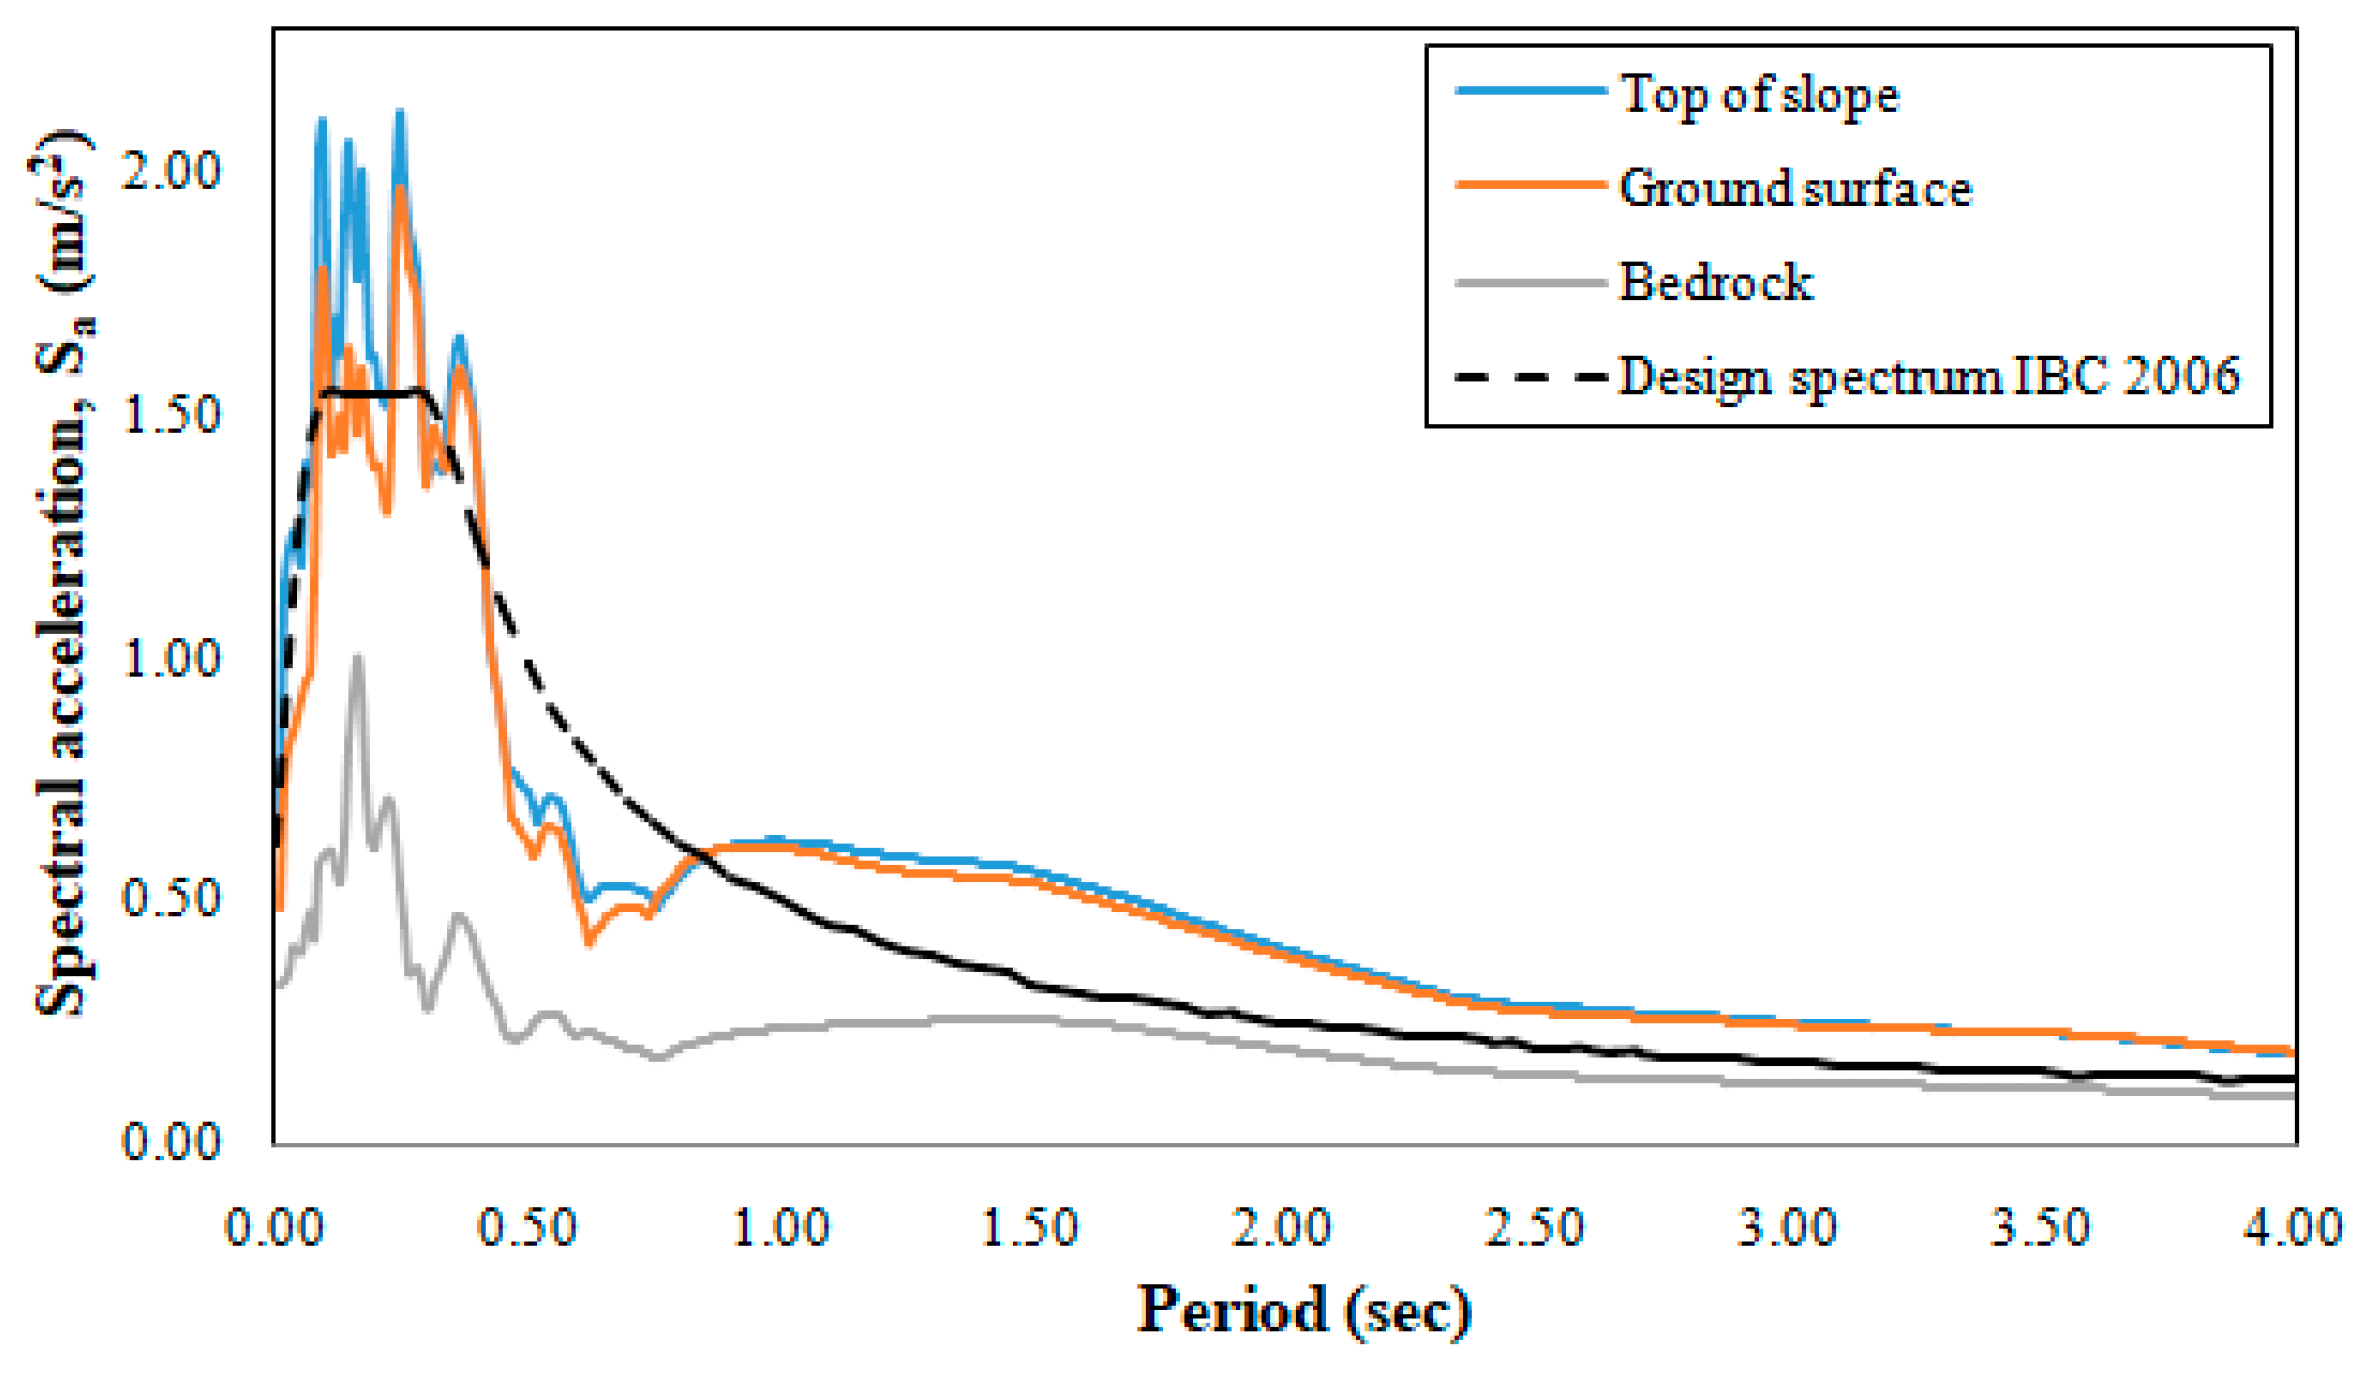
4.1. Site Response
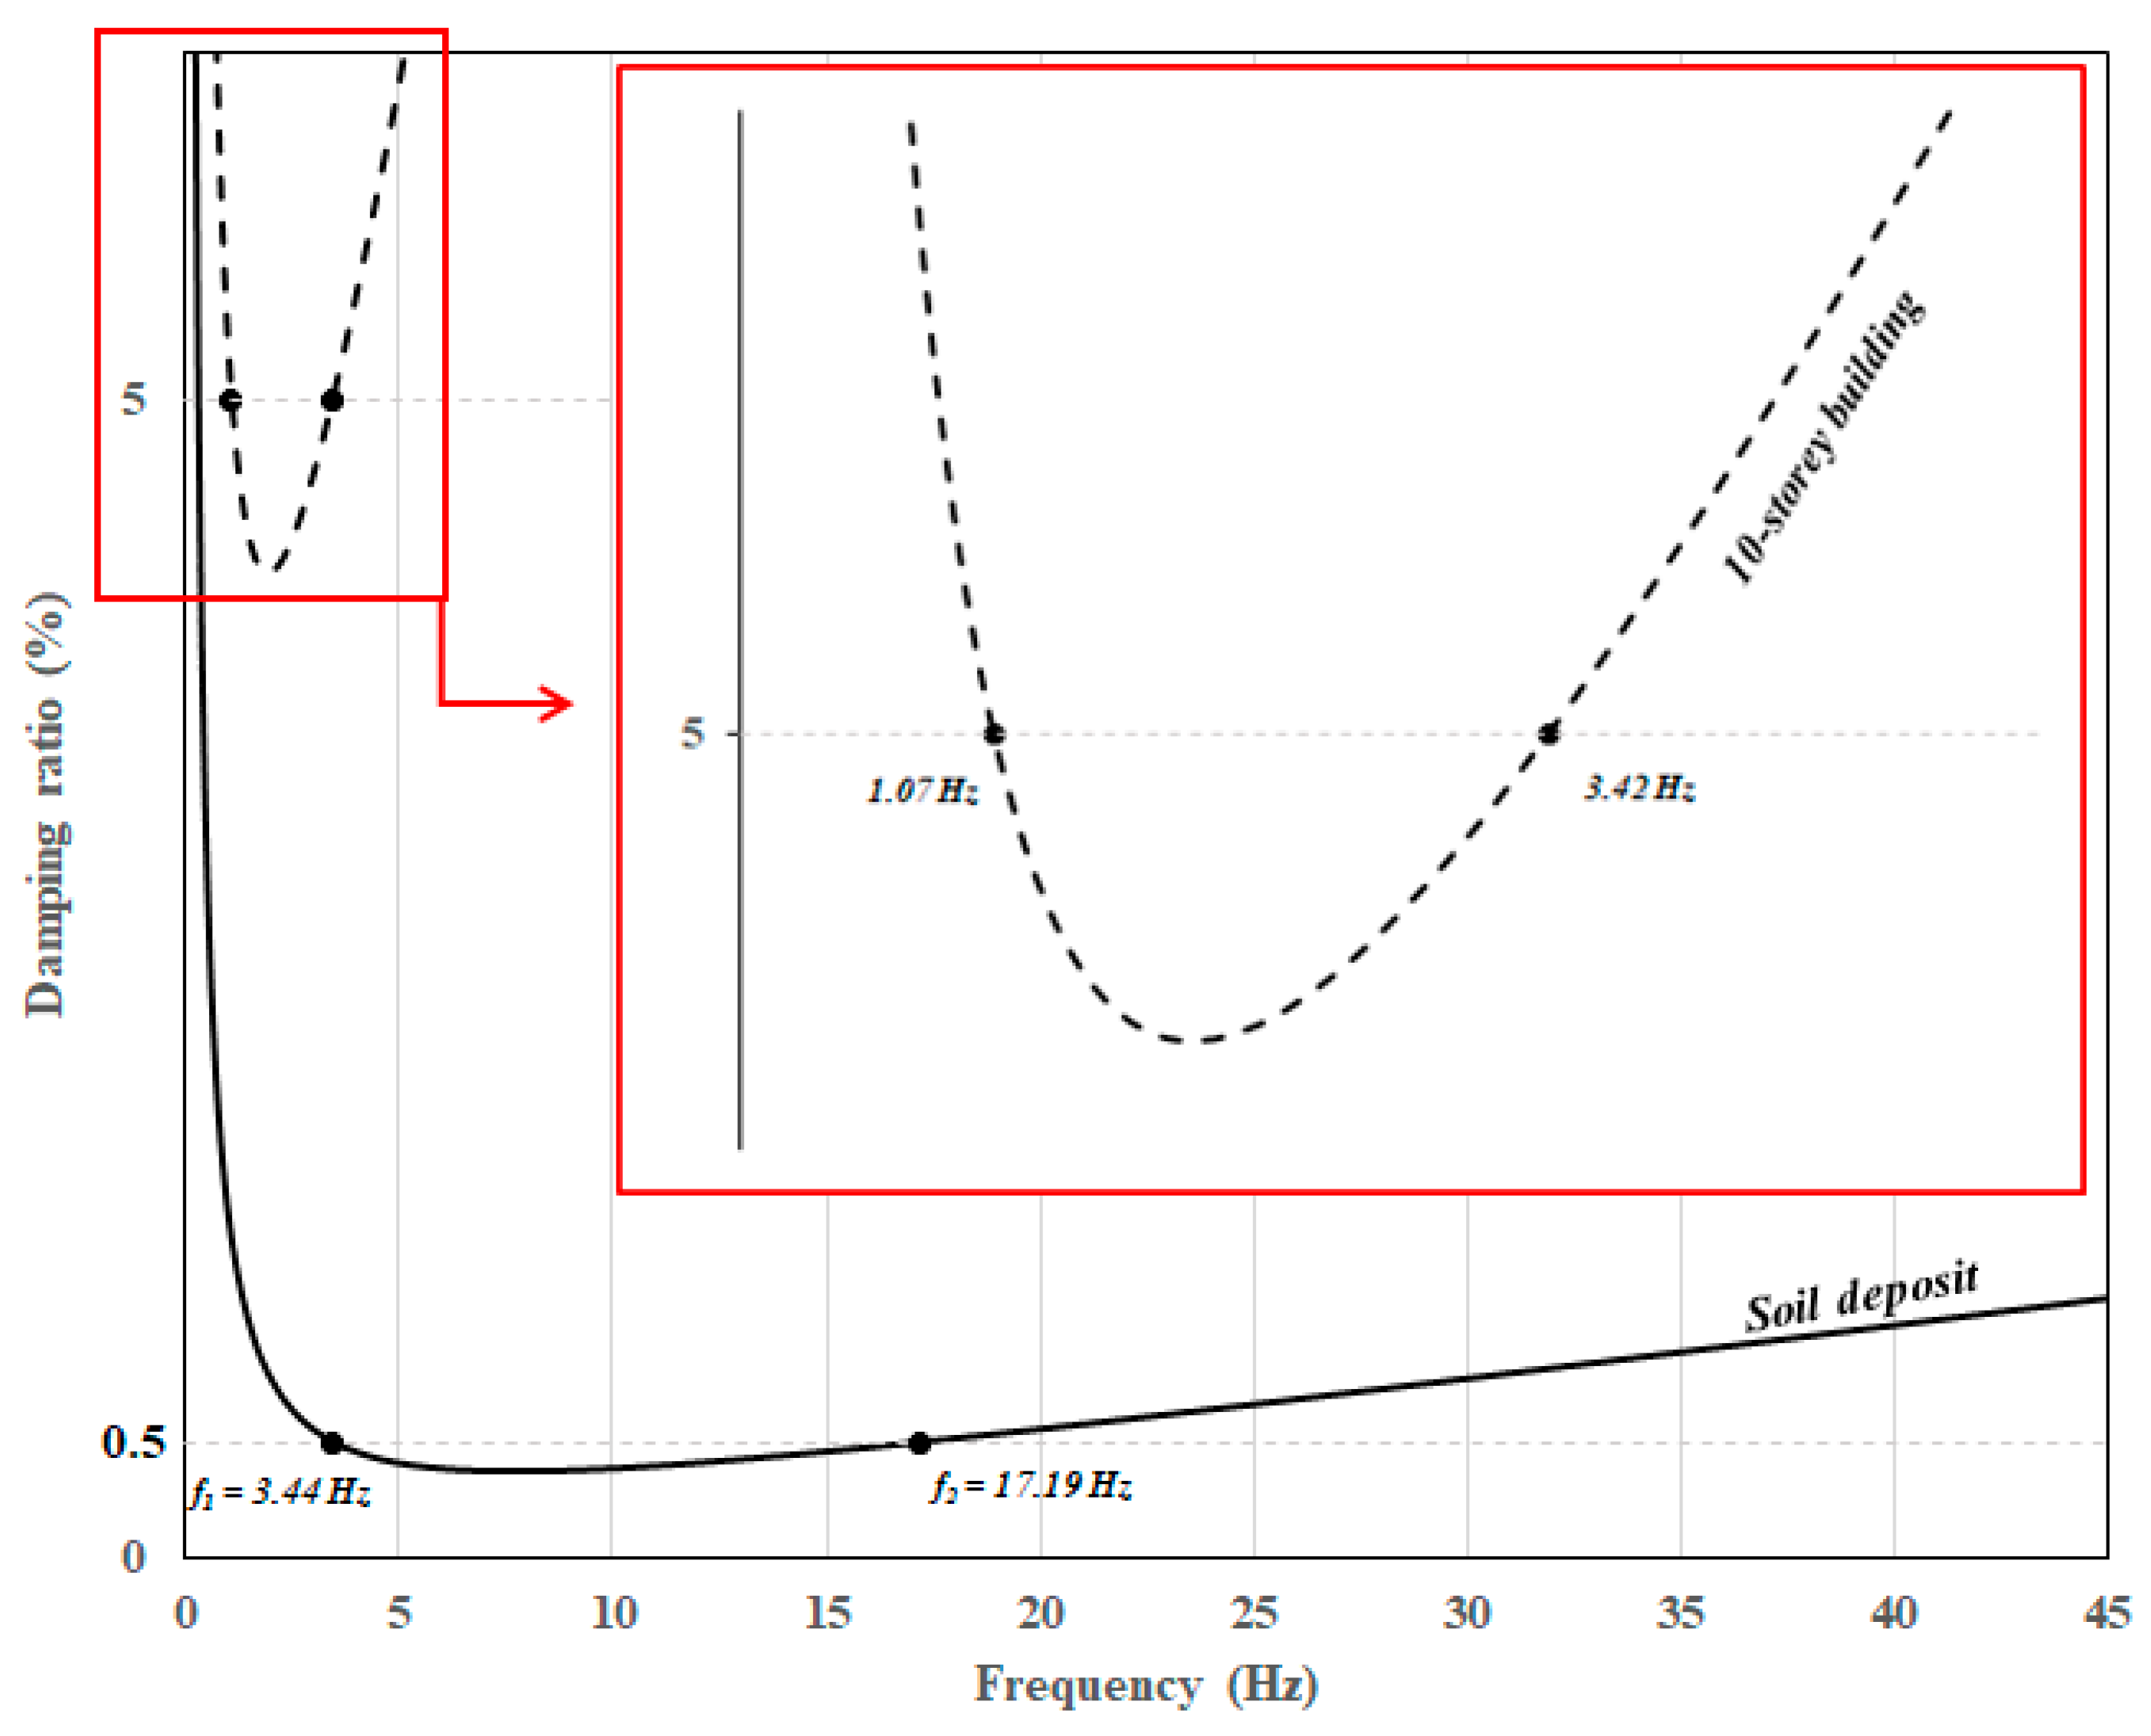
4.2. The Effect of SSSI on the Frequency Response of the Building Nearest to the Slope
4.3. Slope Stability and Deformations
4.4. Foundation Rocking
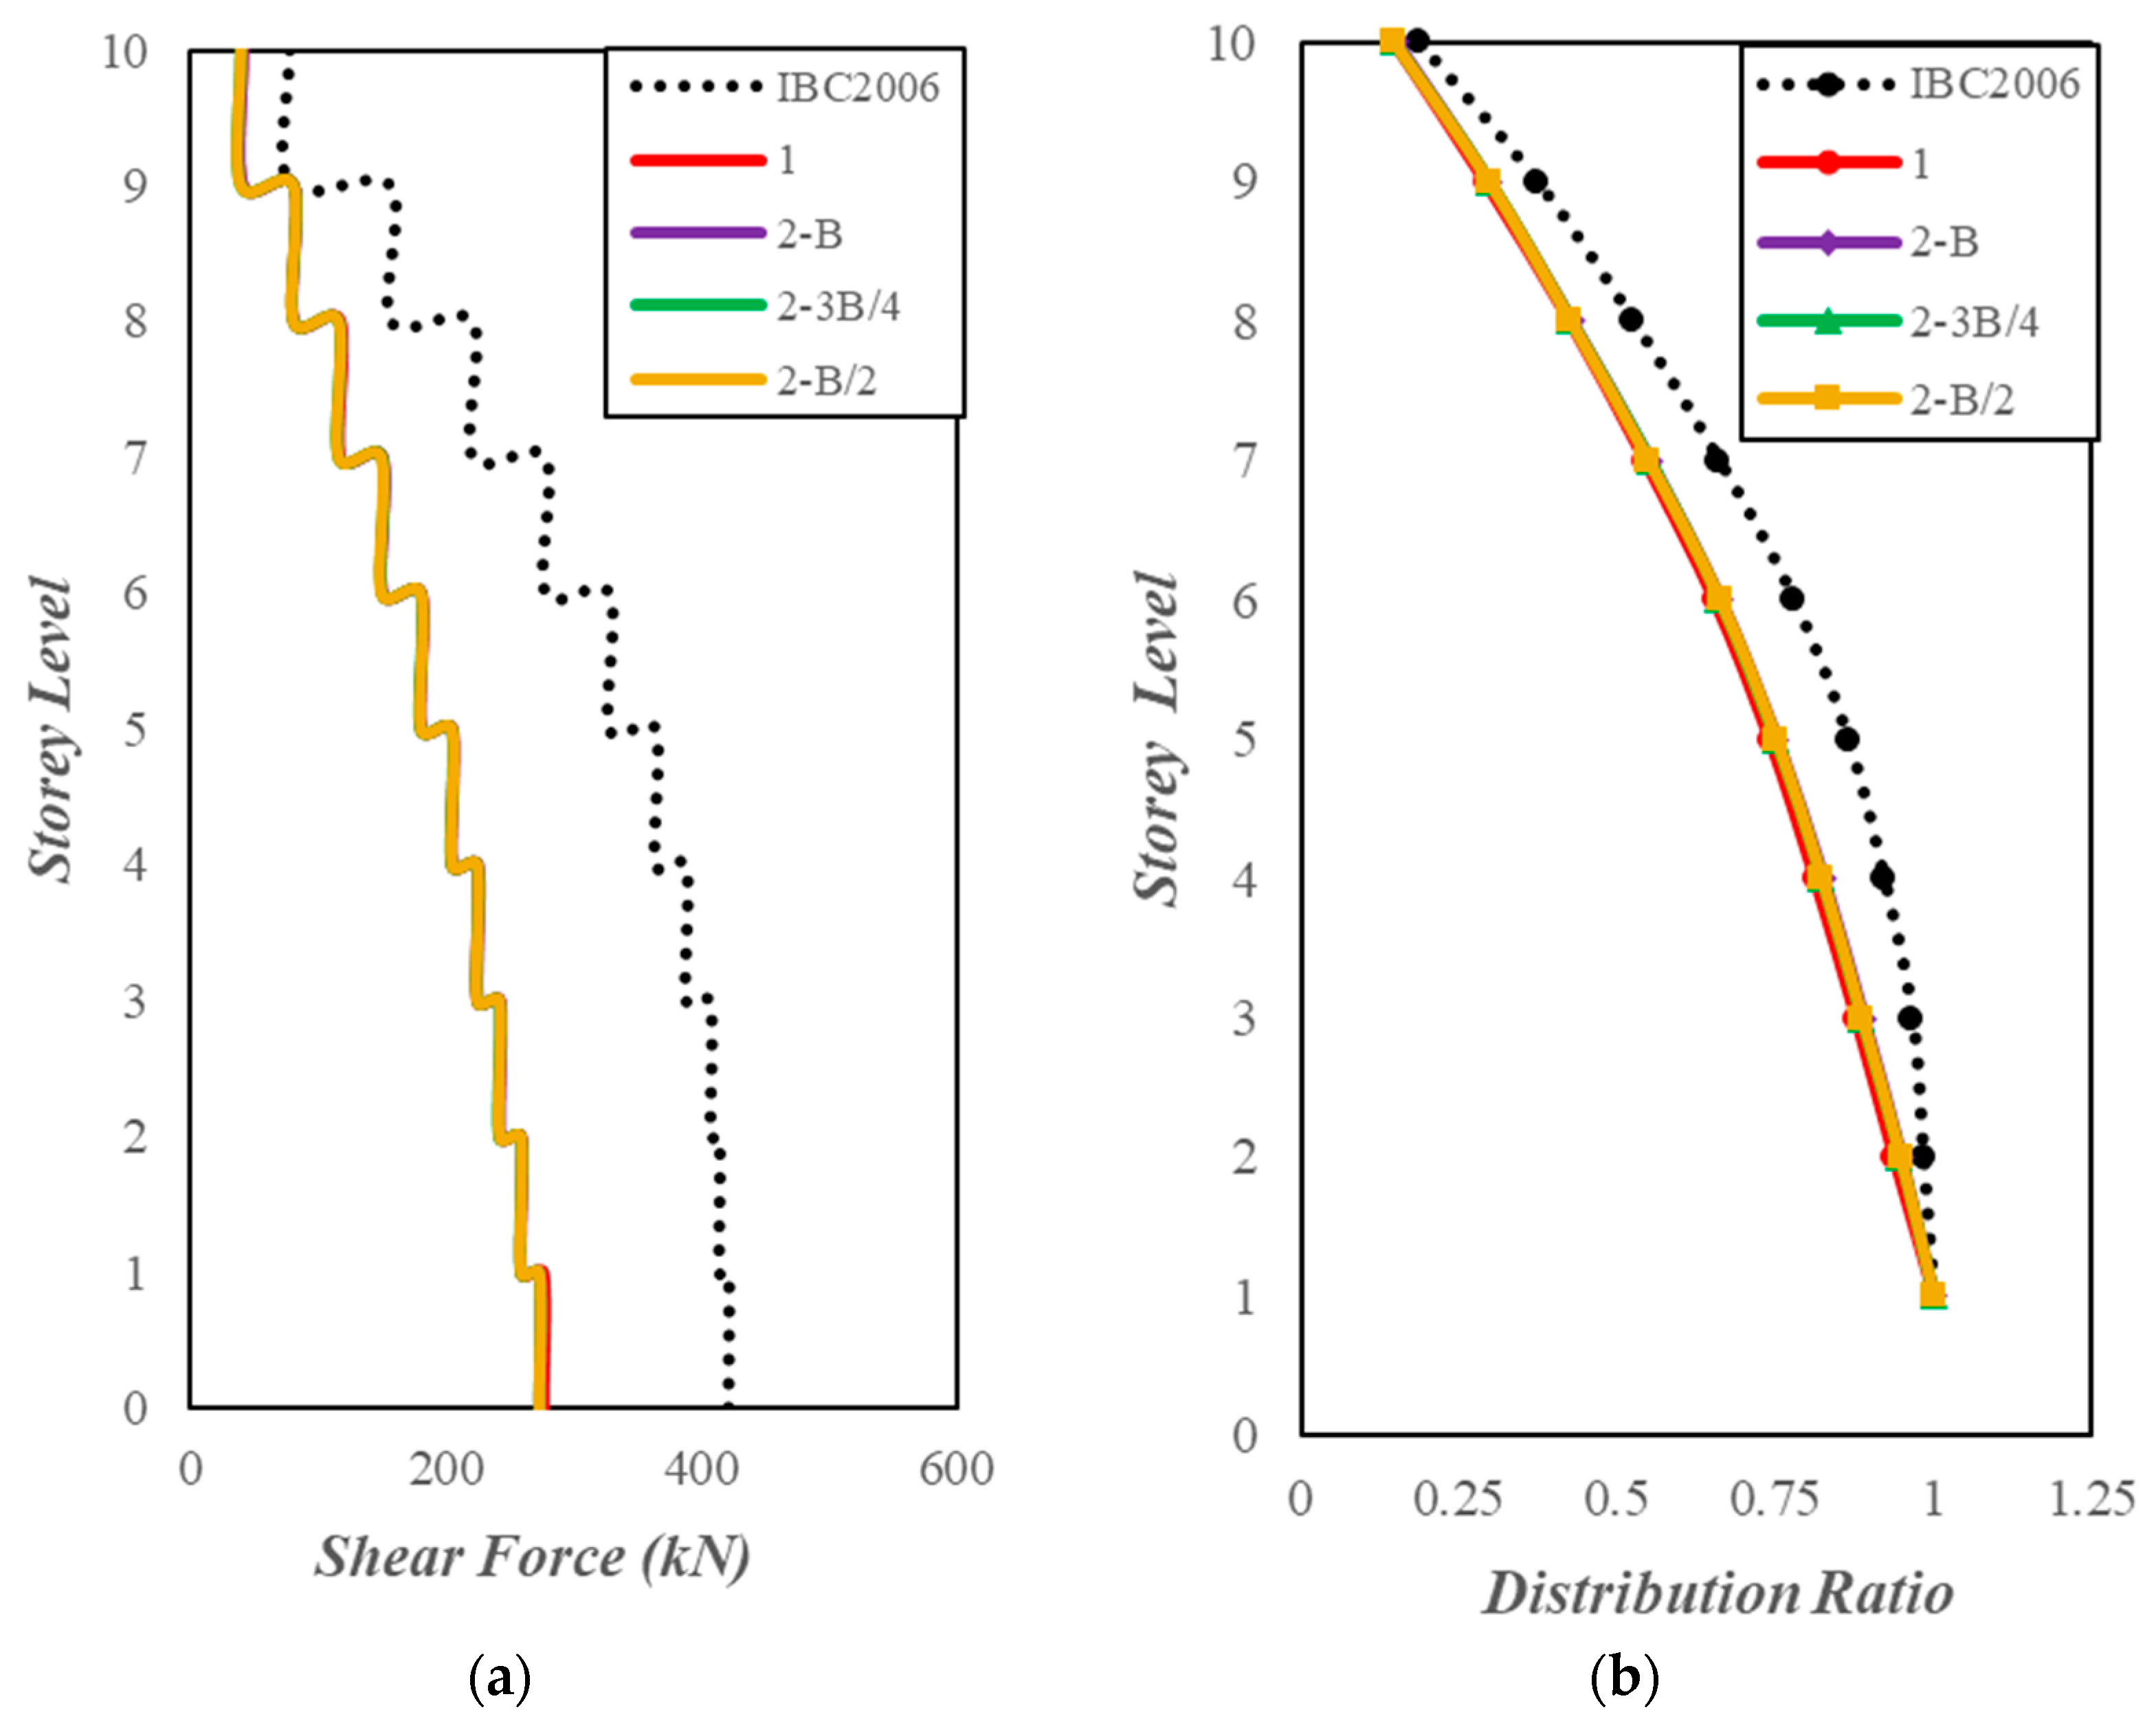
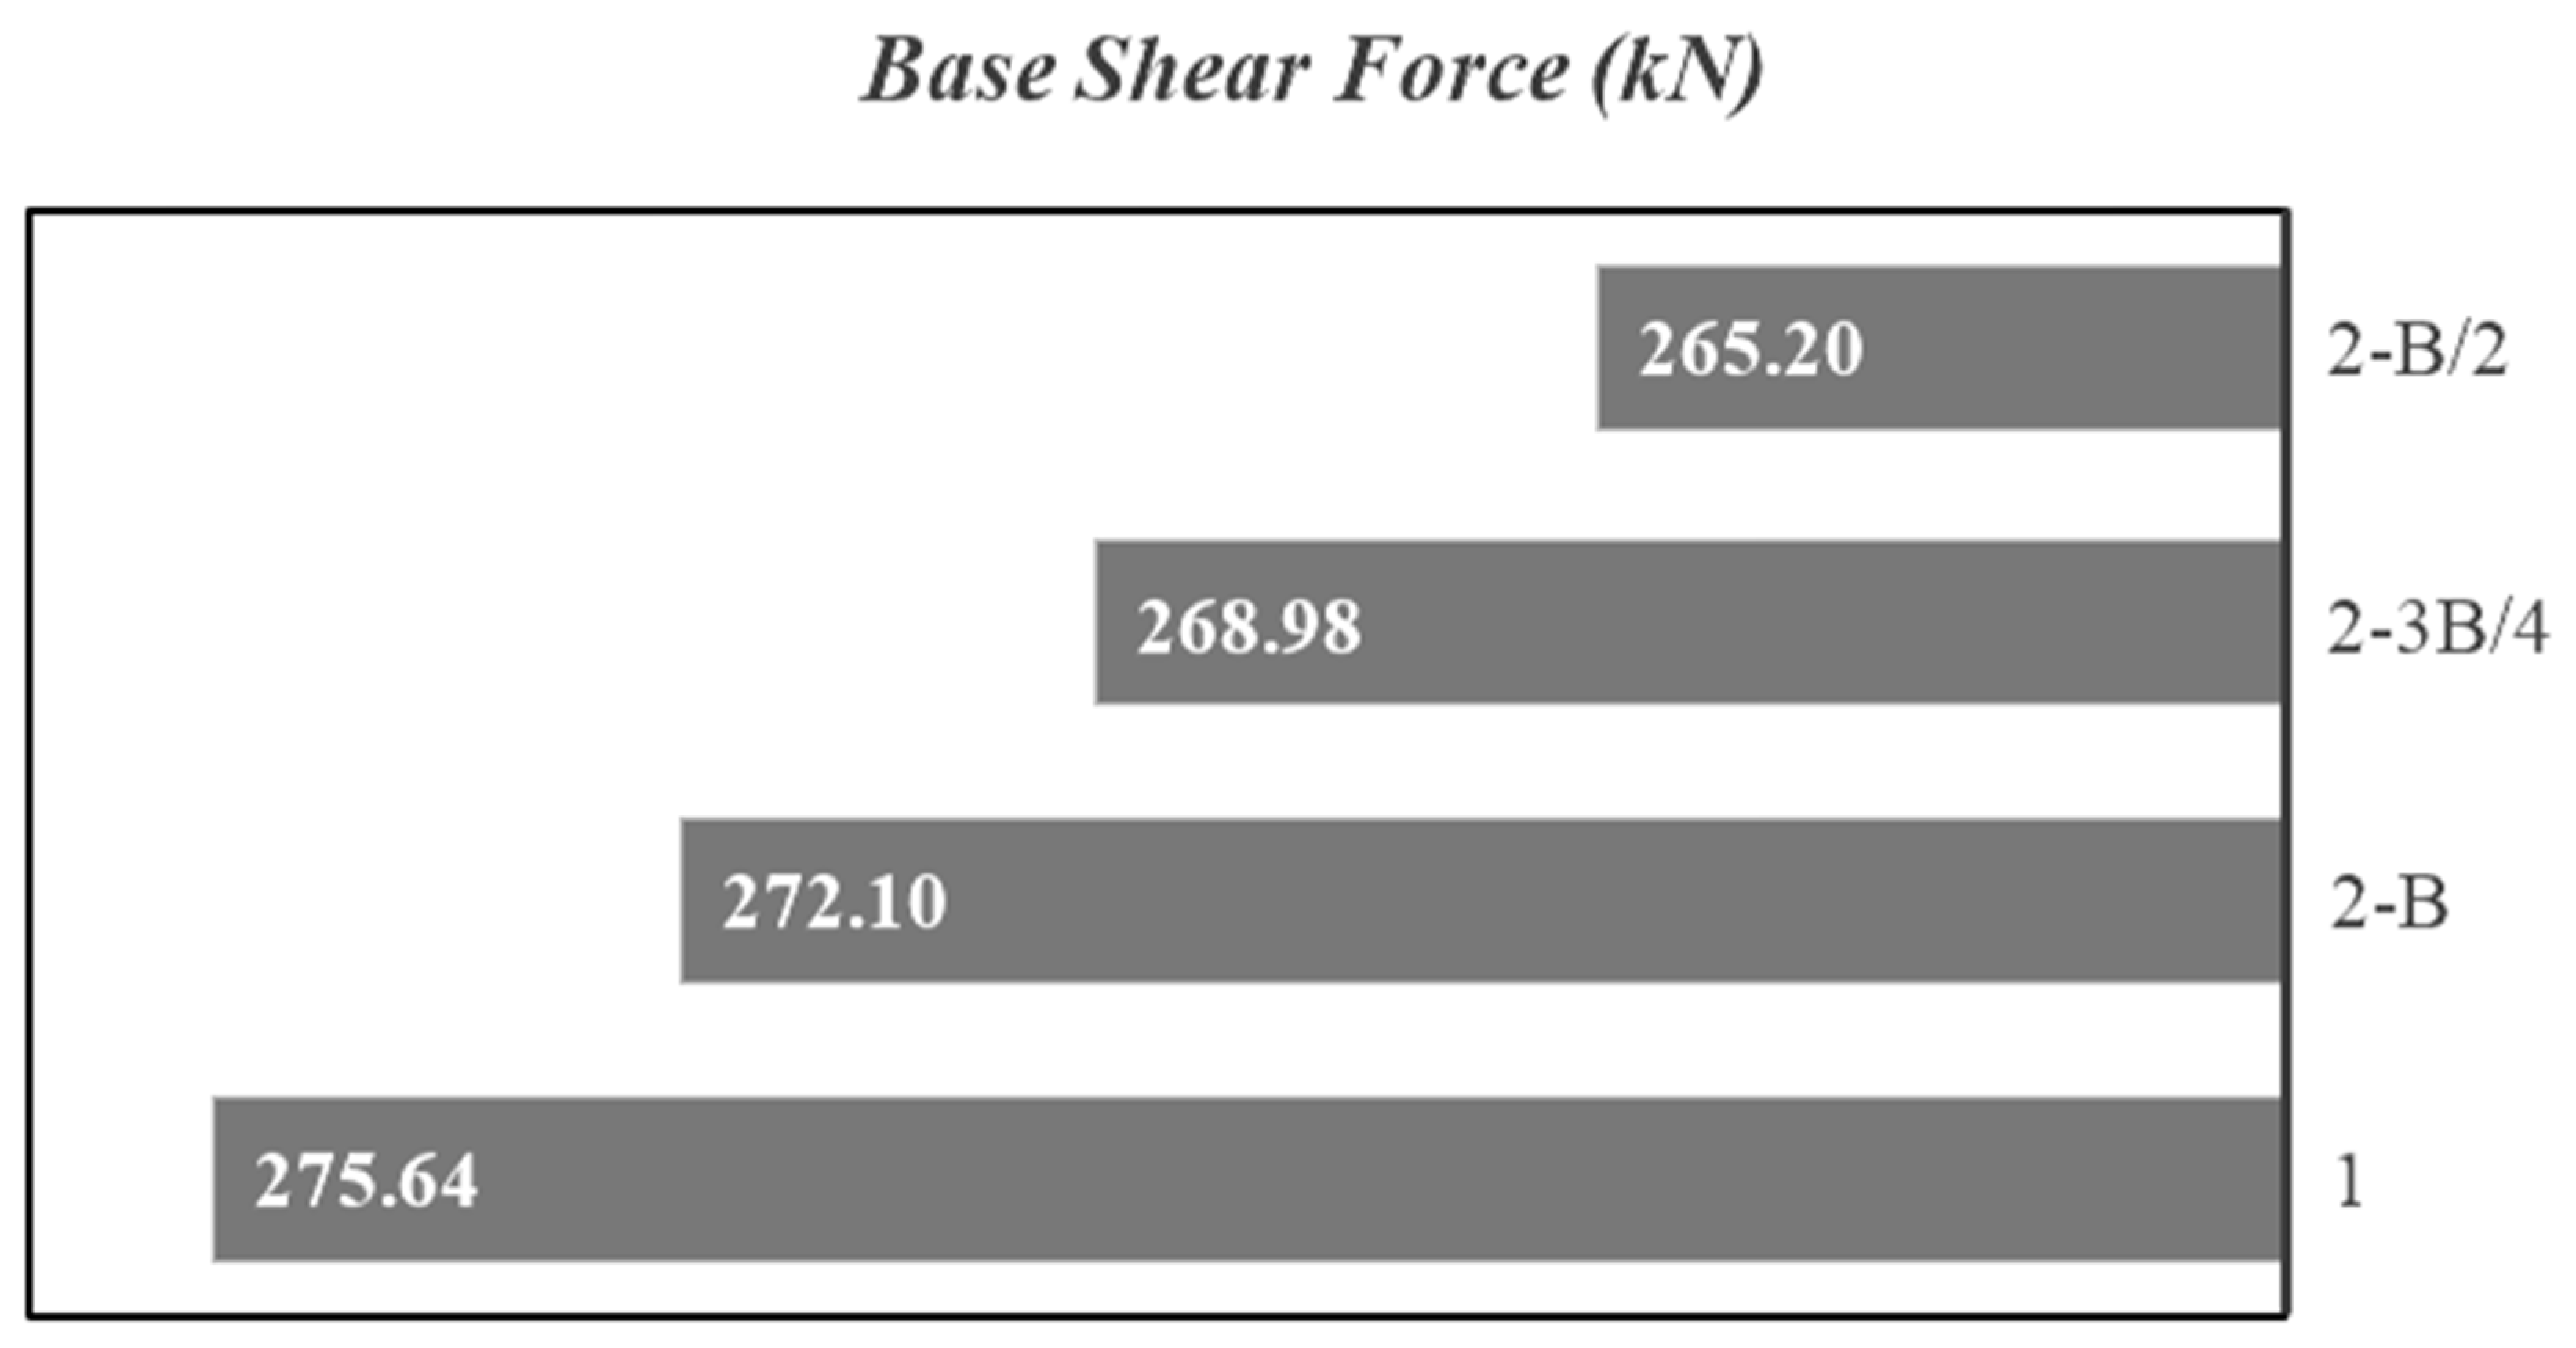
4.5. Shear Forces in Superstructure
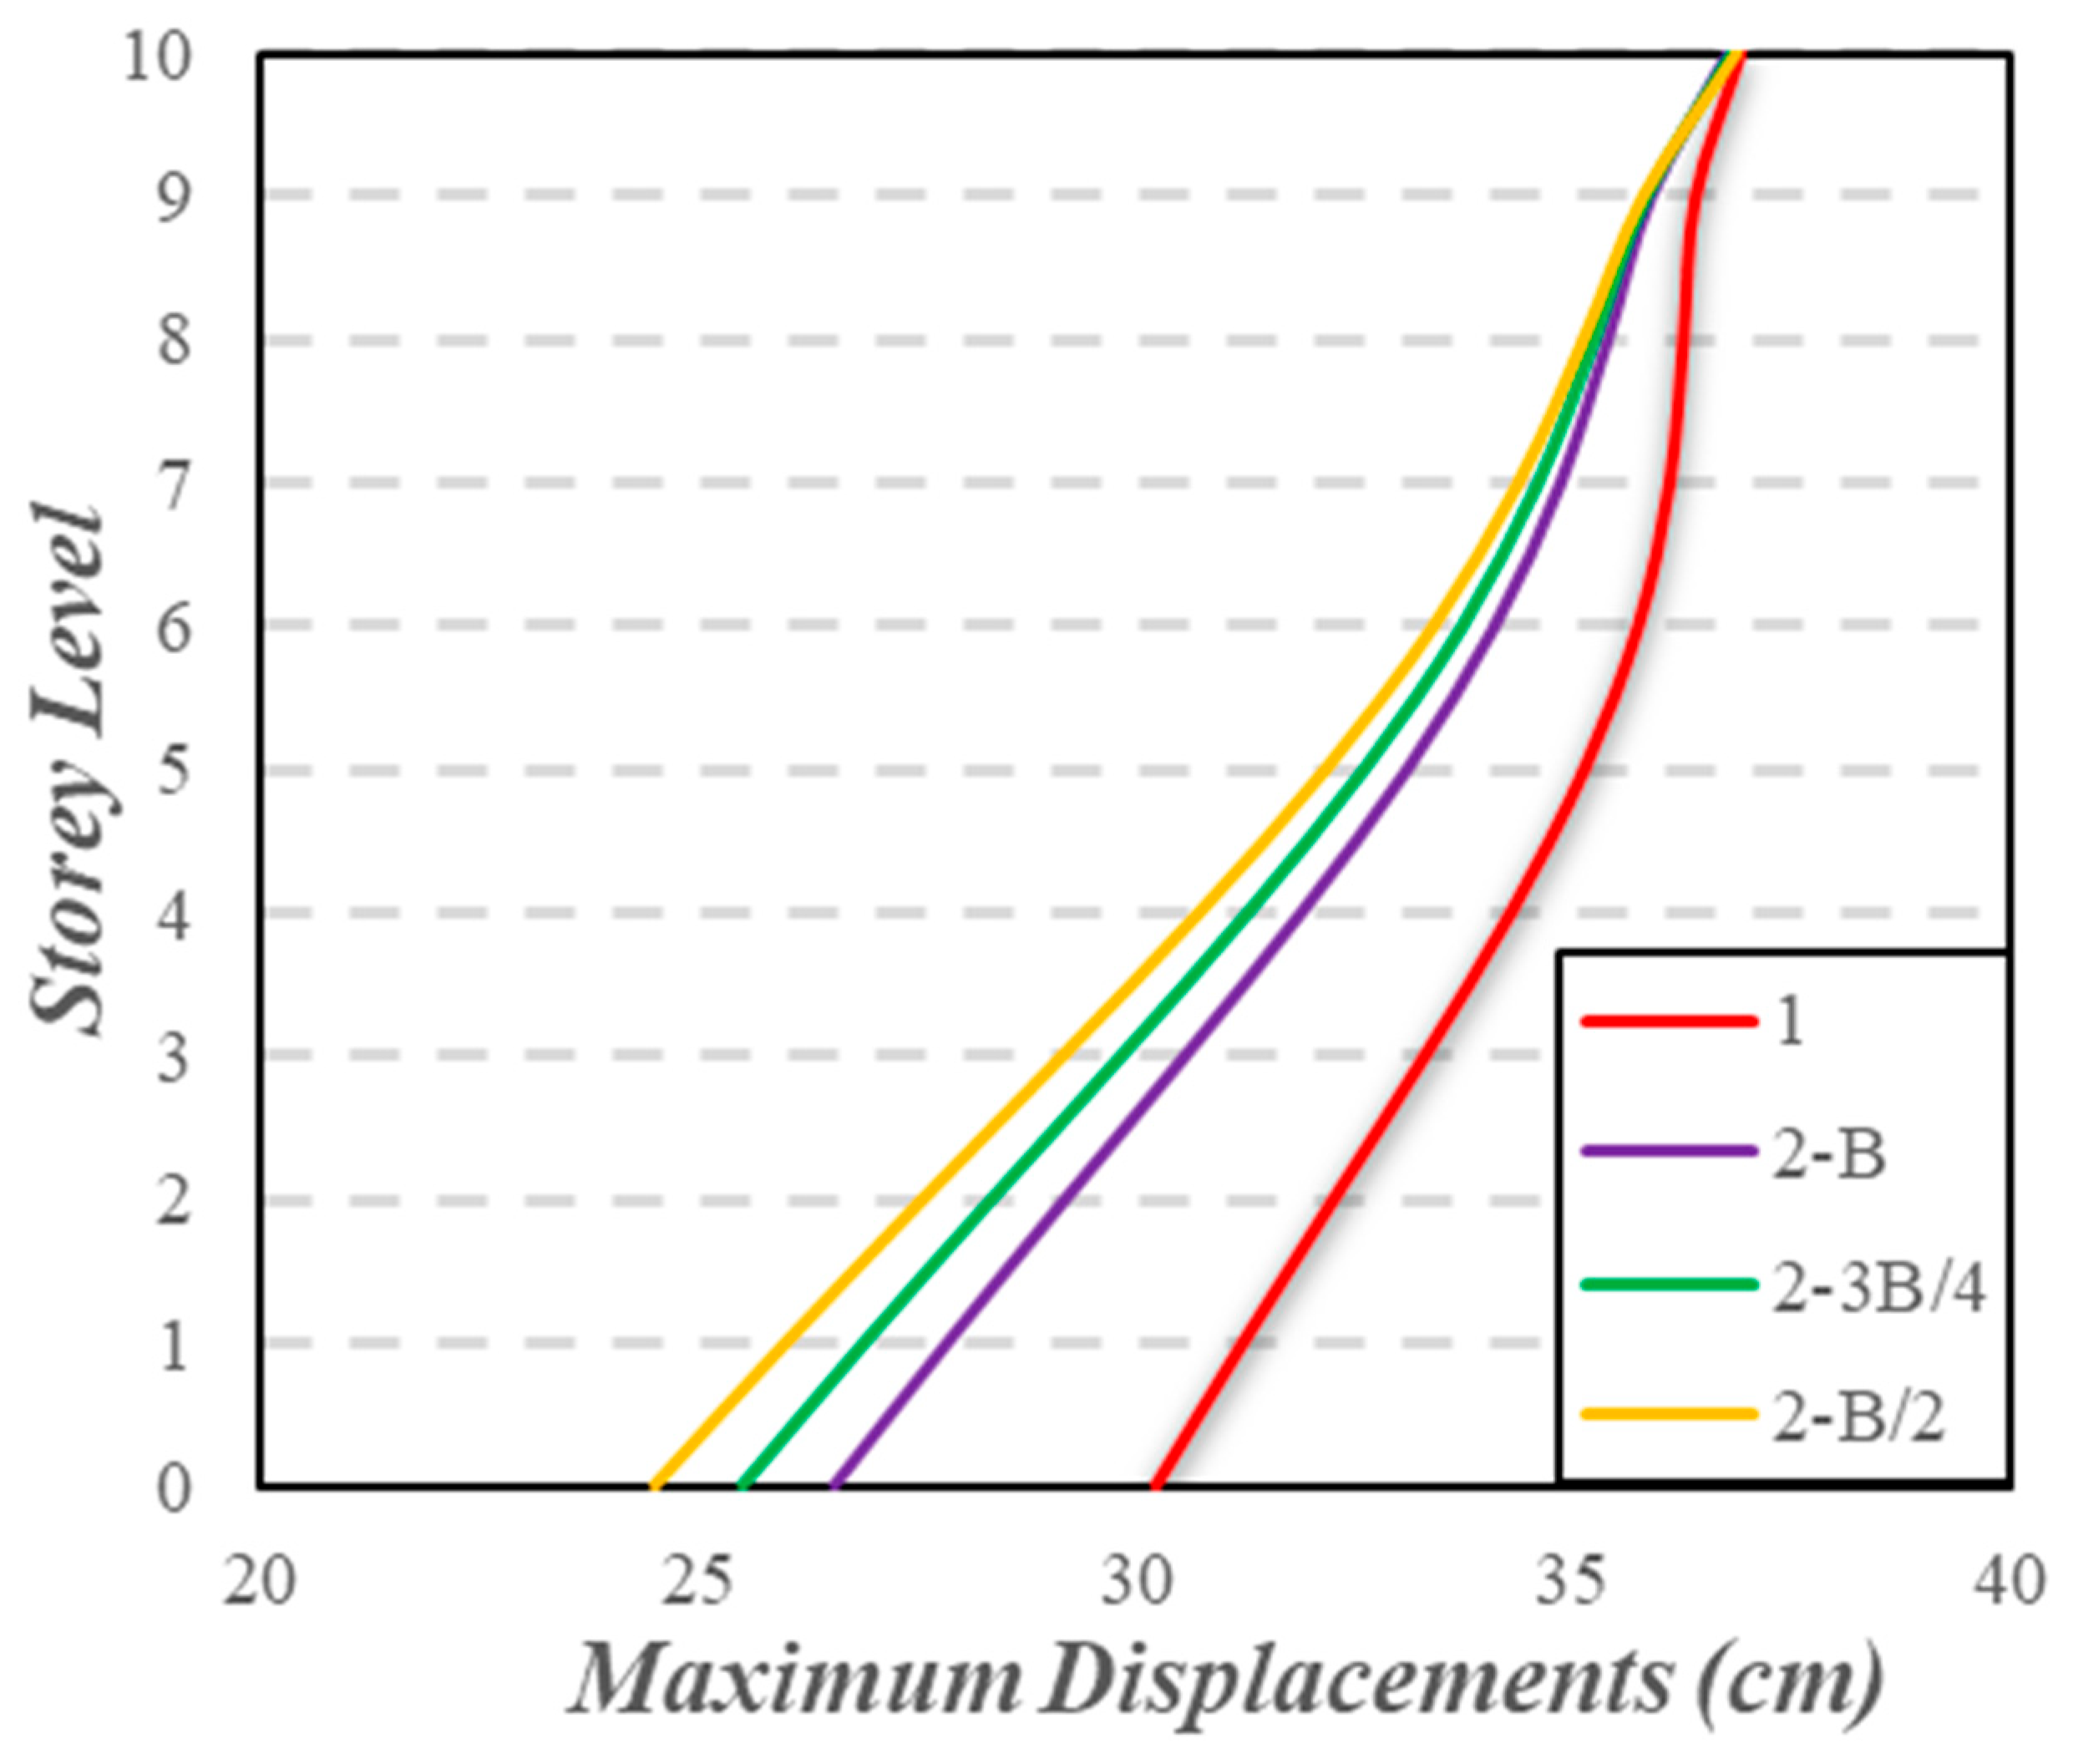
4.6. Maximum Displacements of Superstructure
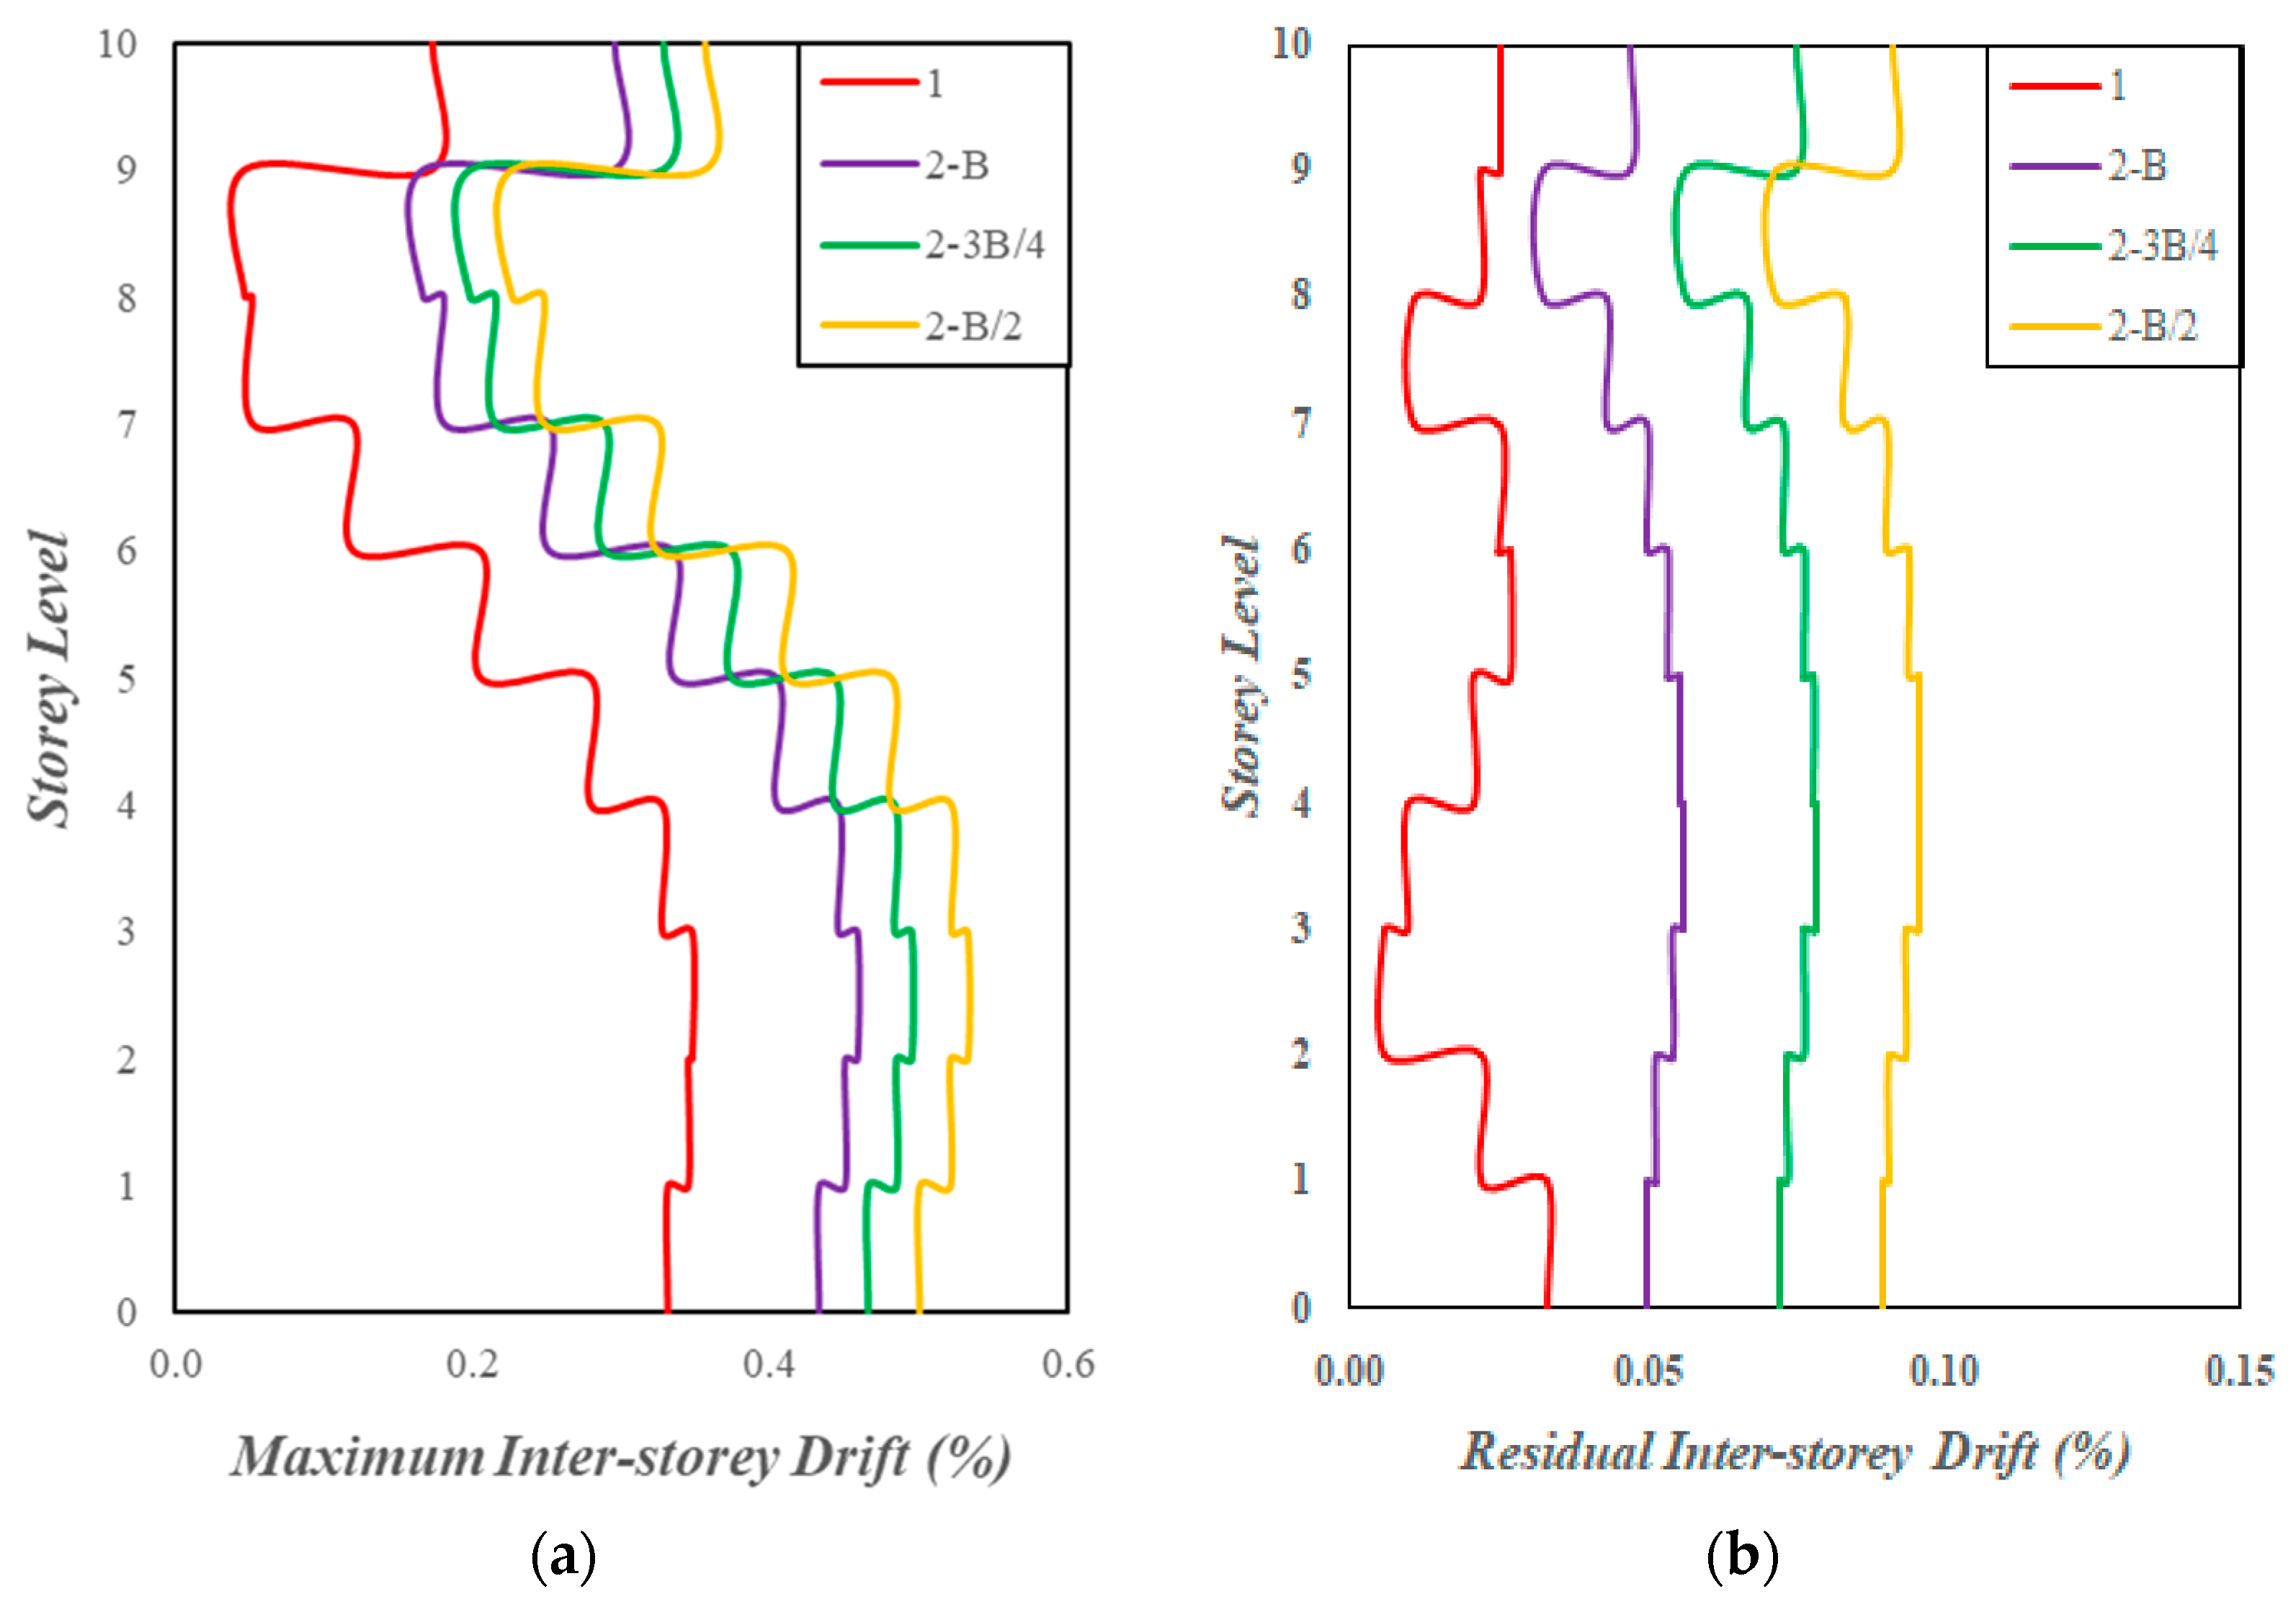
4.7. Inter-Storey Drifts of Superstructure
5. Conclusions
Author Contributions
Funding
Data Availability Statement
Acknowledgments
Conflicts of Interest
References
- Torabi, H.; Rayhani, M.T. Three dimensional finite element modeling of seismic soil–structure interaction in soft soil. Comput. Geotech. 2014, 60, 9–19. [Google Scholar] [CrossRef]
- Gullu, H.; Pala, M. On the resonance effect by dynamic soil–structure interaction: A revelation study. Nat. Hazards 2014, 72, 827–847. [Google Scholar] [CrossRef]
- Luco, J.; Contesse, L. Dynamic structure–soil–structure interaction. Bull. Seismol. Soc. Am. 1973, 63, 1289–1303. [Google Scholar] [CrossRef]
- Lou, M.; Wang, H.; Chen, X.; Zhai, Y. Structure–soil–structure interaction: Literature review. Soil Dyn. Earthq. Eng. 2011, 31, 1724–1731. [Google Scholar] [CrossRef]
- Alitalesh, M.; Shahnazari, H.; Baziar, M.H. Parametric study on seismic topography–soil–structure interaction; topographic effect. Geotech. Geol. Eng. 2018, 36, 2649–2666. [Google Scholar] [CrossRef]
- Mayoral, J.M.; De la Rosa, D.; Tepalcapa, S. Topographic effects during the September 19, 2017 Mexico city earthquake. Soil Dyn. Earthq. Eng. 2019, 125, 105732. [Google Scholar] [CrossRef]
- Pitilakis, D. Topographic irregularities and soil–foundation–structure interaction. In Proceedings of the 3rd Greece–Japan Workshop Seismic Design, Observation, and Retrofit of Foundations, Santorini, Athens, Greece, 22–23 September 2009. [Google Scholar]
- Erfani, A.; Ghanbari, A.; Massumi, A. The Effect of Slope Topography on Base Shear of Mid Rise Structures Adjacent to Slope by Considering Soil-Structure Interaction Effects. Electron. J. Geotech. Eng. 2017, 22, 439–456. [Google Scholar]
- Gazetas, G. Soil-foundation-structure systems beyond conventional seismic failure thresholds. Ishihara Lecture. In Proceedings of the 18th International Conference on Soil Mechanics and Geotechnical Engineering, Paris, France, 2–5 September 2013. [Google Scholar]
- IBC. International Building Code; International Code Council: Bryan, TX, USA, 2006. [Google Scholar]
- Shabani, M.J.; Shamsi, M.; Ghanbari, A. Slope topography effect on the seismic response of mid-rise buildings considering topography-soil-structure interaction. Earthq. Struct. 2021, 20, 187–200. [Google Scholar] [CrossRef]
- Sucasaca, J.; Sáez, E. Topographical and structure-soil-structure interaction effects on dynamic behavior of shear-wall buildings on coastal scarp. Eng. Struct. 2021, 247, 113113. [Google Scholar] [CrossRef]
- Shamsi, M.; Shabani, M.J.; Vakili, A.H. Three-dimensional seismic nonlinear analysis of topography–structure–soil–structure interaction for buildings near slopes. Int. J. Geomech. 2022, 22, 04021295. [Google Scholar] [CrossRef]
- Brinkgreve, R.; Kumarswamy, S.; Swolfs, W.; Foria, F. PLAXIS 3D 2017 User Manual; Plaxis BV: Delft, The Netherlands, 2017. [Google Scholar]
- CSI, Computer and Structure, Inc. SAP2000 V14 Analysis Manual: Inelastic Time History Analysis; SAP2000 V14; CSI: Berkley, CA, USA, 2009. [Google Scholar]
- Eurocode 2; Design of Concrete Structures—Part 1-1: General Rules and Rules for Buildings. British Standard Institution: London, UK, 2005.
- EN206-1; Concrete—Part 1: Specification, Performance, Production and Conformity. CEN: Brussels, Belgium, 2016.
- Eurocode 1; Actions on Structures-Part 1–1: General Actions—Densities, Self-Weight, Imposed Loads for Buildings. British Standard Institution: London, UK, 2002.
- Hansen, J.B. A revised and extended formula for bearing capacity. Dan. Geotech. Institue 1970, 28, 5–11. [Google Scholar]
- IDS. IdeCAD Structural V10 User’s Manual; Ide Construction Ltd.: Istanbul, Turkey, 2022. [Google Scholar]
- Aydemir, M.E.; Ekiz, I. Soil–structure interaction effects on seismic behaviour of multistorey structures. Eur. J. Environ. Civ. Eng. 2013, 17, 635–653. [Google Scholar] [CrossRef]
- Oh, S.H.; Jeon, J. A study on optimum distribution of story shear force coefficient for seismic design of multi-story structure. Int. J. High-Rise Build. 2014, 3, 121–145. [Google Scholar] [CrossRef]
- McNeice, G.M. Elastic-Plastic Bending Analysis of Plates and Slabs by the Finite Element Method. Ph.D. Thesis, University of London, London, UK, 1967. [Google Scholar]
- Maatkamp, T.W.P. The Capabilities of the Plaxis Shotcrete Material Model for Designing Laterally Loaded Reinforced Concrete Structures in the Subsurface. Master’s Thesis, Department of Civil Engineering and Geosciences Section Geo-Engineering, University of Delft, Delft, The Netherlands, 2016. [Google Scholar]
- Bathe, K.J.; Wilson, E.L. Numerical Methods in Finite Element Analysis; Prentice Hall: Upper Saddle River, NJ, USA, 1976. [Google Scholar]
- Eurocode 8; Design of Structures for Earthquake Resistance—Part 1: General Rules, Seismic Actions and Rules for Buildings. CEN: Brussels, Belgium, 2004.
- Fatahi, B.; Basack, S.; Ryan, P.; Zhou, W.H.; Khabbaz, H. Performance of laterally loaded piles considering soil and interface parameters. Geomech. Eng. 2014, 7, 495–524. [Google Scholar]
- Khazaei, J.; Amiri, A.; Khalilpour, M. Seismic evaluation of soil-foundation-structure interaction: Direct and Cone model. Earthq. Struct. 2017, 12, 251–262. [Google Scholar]
- Sharifi, B.; Nouri, G.; Ghanbari, A. Structure-soilstructure interaction in a group of buildings using 3D nonlinear analyses. Earthq. Struct. 2020, 18, 667–675. [Google Scholar]
- Benz, T. Small-Strain Stiffness of Soils and Its Numerical Consequences. Ph.D. Thesis, Department of Civil Engineering, Universität Stuttgart, Delft, The Netherlands, 2007. [Google Scholar]
- Shamsi, M.; Shabani, M.J.; Zakerinejad, M.; Vakili, A.H. Slope topographic effects on the nonlinear seismic behavior of groups of similar buildings. Earthq. Eng. Struct. Dyn. 2022, 51, 2292–2314. [Google Scholar] [CrossRef]
- Pap, Z.B.; Kollár, L.P. Effect of resonance in soil-structure interaction for finite soil layers. Period. Polytech. Civ. Eng. 2018, 62, 676–684. [Google Scholar] [CrossRef]
- Shabani, M.J.; Ghanbari, A. Comparison of seismic behavior of steel building adjacent to slope topography by considering fixed-base, SSI and TSSI. Asian J. Civ. Eng. 2020, 21, 1151–1169. [Google Scholar] [CrossRef]
- Kwok, A.O.; Stewart, J.P.; Hashash, Y.M.; Matasovic, N.; Pyke, R.; Wang, Z.; Yang, Z. Use of exact solutions of wave propagation problems to guide implementation of nonlinear seismic ground response analysis procedures. J. Geotech. Geoenvironmental Eng. 2007, 133, 1385–1398. [Google Scholar] [CrossRef]
- Fatahi, B.; Huang, B.; Yeganeh, N.; Terzaghi, S.; Banerjee, S. Three-dimensional simulation of seismic slope–foundation–structure interaction for buildings near shallow slopes. Int. J. Geomech. 2020, 20, 04019140. [Google Scholar] [CrossRef]
- Syed, N.M.; Maheshwari, B.K. Modeling using coupled FEM-SBFEM for three-dimensional seismic SSI in time domain. Int. J. Geomech. 2014, 14, 118–129. [Google Scholar] [CrossRef]
- TADAS. Republic of Turkey Ministry of Interior, Disaster and Emergency Management Presidency, Earthquake Department Turkey Acceleration Database and Analysis System. Available online: https://tadas.afad.gov.tr/ (accessed on 15 January 2025).
- Isbiliroglu, Y.; Taborda, R.; Bielak, J. Coupled soil-structure interaction effects of building clusters during earthquakes. Earthq. Spectra 2015, 31, 463–500. [Google Scholar] [CrossRef]
- Bybordiani, M.; Arici, Y. Structure-soil-structure interaction of adjacent buildings subjected to seismic loading. Earthq. Eng. Struct. Dyn. 2019, 48, 731–748. [Google Scholar] [CrossRef]
- Jao, M.; Ahmed, F.; Muninarayana, G.; Wang, M.C. Stability of eccentrically loaded footings on slopes. Geomech. Geoengin. Int. J. 2008, 3, 107–111. [Google Scholar] [CrossRef]
- Yang, X.L. Seismic bearing capacity of a strip footing on rock slopes. Can. Geotech. J. 2009, 46, 943–954. [Google Scholar] [CrossRef]
- Alamshahi, S.; Hataf, N. Bearing capacity of strip footings on sand slopes reinforced with geogrid and grid-anchor. Geotext. Geomembr. 2009, 27, 217–226. [Google Scholar] [CrossRef]
- Yamamoto, K. Seismic bearing capacity of shallow foundations near slopes using the upper-bound method. Int. J. Geotech. Eng. 2010, 4, 255–267. [Google Scholar] [CrossRef]
- Castelli, F.; Lentini, V. Evaluation of the bearing capacity of footings on slopes. Int. J. Phys. Model. Geotech. 2012, 12, 112–118. [Google Scholar] [CrossRef]
- Pelekis, I.; Madabhushi, G.S.; DeJong, M.J. Seismic performance of buildings with structural and foundation rocking in centrifuge testing. Earthq. Eng. Struct. Dyn. 2018, 47, 2390–2409. [Google Scholar] [CrossRef]
- Ghandil, M.; Behnamfar, F.; Vafaeian, M.J.S.D. Dynamic responses of structure–soil–structure systems with an extension of the equivalent linear soil modeling. Soil Dyn. Earthq. Eng. 2016, 80, 149–162. [Google Scholar] [CrossRef]


| Sample No | Depth (m) | No 4 Remaining % | No 200 Passing % | Liquid Limit % | Plastic Limit % | Plasticity Index % | Cohesion (c) kPa | Friction Angle (Φ) degree | Classification (USCS) | Unit Weight kN/m3 |
|---|---|---|---|---|---|---|---|---|---|---|
| 1 | 7.5 | 22.4 | 46.2 | 32.6 | 16.5 | 16.1 | 56.6 | 14.37 | SC | 19.17 |
| Compressive Strength of Concrete (fck) (MPa) | Elasticity of Concrete (Ec) (MPa) | Rebar Yield Strength (fyd) (MPa) | Elasticity of Steel (Es) (MPa) |
|---|---|---|---|
| 30 | 17,143 | 435 | 210,000 |
| Specific Points | Parameters | Building Columns | Floor Slabs |
|---|---|---|---|
| Rupture moment | Moment (kN-m) | 143.47 | 53.45 |
| Curvature (1/m) | 0.0004 | 0.0012 | |
| Yielding of rebar | Moment (kN-m) | 2084.50 | 162.82 |
| Curvature (1/m) | 0.0083 | 0.0194 | |
| Concrete yielding | Moment (kN-m) | 2301.20 | 166.27 |
| Curvature (1/m) | 0.0098 | 0.0256 | |
| Failure | Moment (kN-m) | 1992.83 | 171.46 |
| Curvature (1/m) | 0.0131 | 0.0768 |
| Failure Parameters | Basic Parameters | Advanced Parameters | |||
|---|---|---|---|---|---|
| Cohesion (c) (kN/m2) | 56.60 | : Secant stiffness (kN/m2) | 332,000 | : Unloading/reloading stiffness (kN/m2) | 995,000 |
| Friction angle (Φ) (°) | 14.37 | : Tangent stiffness for primary oedometer loading (kN/m2) | 332,000 | vur: Poisson’s ratio for unloading–reloading | 0.30 |
| Dilatancy angle (ω) (°) | - | m: Power for stress-level dependency of stiffness | 0.5 | pref: Reference stress for stiffnesses (kN/m2) | 274 |
| : K0-valuefornormal consolidation | 0.75 | ||||
| Characteristic | Value |
|---|---|
| Earthquake | Kahramanmaraş-Pazarcık |
| Country | Turkey |
| Date | 6 February 2023 |
| Station Name | NAR |
| Peak Ground Acceleration (PGA) (cm/s2) | 678.49 |
| Number of Buildings | Distance | Point A (mm) | Point B (mm) | Point C (mm) |
|---|---|---|---|---|
| 1 | 371 | 379 | 375 | |
| 2 | B | 374 | 382 | 377 |
| 3B/4 | 375 | 387 | 378 | |
| B/2 | 378 | 389 | 381 |
Disclaimer/Publisher’s Note: The statements, opinions and data contained in all publications are solely those of the individual author(s) and contributor(s) and not of MDPI and/or the editor(s). MDPI and/or the editor(s) disclaim responsibility for any injury to people or property resulting from any ideas, methods, instructions or products referred to in the content. |
© 2025 by the authors. Licensee MDPI, Basel, Switzerland. This article is an open access article distributed under the terms and conditions of the Creative Commons Attribution (CC BY) license (https://creativecommons.org/licenses/by/4.0/).
Share and Cite
Güllü, H.; Natur, O. Three-Dimensional Simulation of Seismic Structure–Soil–Structure Interaction for Mid-Rise Buildings near Dense Shallow Sloping Soils Under the Impact of 6 February 2023 Kahramanmaraş-Pazarcık Earthquake. Buildings 2025, 15, 1013. https://doi.org/10.3390/buildings15071013
Güllü H, Natur O. Three-Dimensional Simulation of Seismic Structure–Soil–Structure Interaction for Mid-Rise Buildings near Dense Shallow Sloping Soils Under the Impact of 6 February 2023 Kahramanmaraş-Pazarcık Earthquake. Buildings. 2025; 15(7):1013. https://doi.org/10.3390/buildings15071013
Chicago/Turabian StyleGüllü, Hamza, and Ozan Natur. 2025. "Three-Dimensional Simulation of Seismic Structure–Soil–Structure Interaction for Mid-Rise Buildings near Dense Shallow Sloping Soils Under the Impact of 6 February 2023 Kahramanmaraş-Pazarcık Earthquake" Buildings 15, no. 7: 1013. https://doi.org/10.3390/buildings15071013
APA StyleGüllü, H., & Natur, O. (2025). Three-Dimensional Simulation of Seismic Structure–Soil–Structure Interaction for Mid-Rise Buildings near Dense Shallow Sloping Soils Under the Impact of 6 February 2023 Kahramanmaraş-Pazarcık Earthquake. Buildings, 15(7), 1013. https://doi.org/10.3390/buildings15071013