Article

Hydro-Mechanical Numerical Analysis of a Double-Wall Deep Excavation in a Multi-Aquifer Strata Considering Soil–Structure Interaction

1
Shanghai Key Laboratory for Digital Maintenance of Buildings and Infrastructure, Department of Civil Engineering, Shanghai Jiao Tong University, 800 Dongchuan Rd., Shanghai 200240, China
2
Arcplus Group PLC, Shanghai 200011, China
3
Shanghai Underground Space Engineering Design & Research Institute, Shanghai Engineering Research Center of Safety Control for Facilities Adjacent to Deep Excavations, East China Architectural Design and Research Institute Co., Ltd., Shanghai 200002, China
*
Author to whom correspondence should be addressed.
Buildings 2025, 15(6), 989; https://doi.org/10.3390/buildings15060989
Submission received: 26 February 2025 / Revised: 17 March 2025 / Accepted: 19 March 2025 / Published: 20 March 2025
(This article belongs to the Special Issue Advances in Soil-Structure Interaction for Building Structures)

Abstract

In order to exploit the deep underground space, the construction of ultra-deep excavation in Shanghai is growing rapidly. In multi-aquifer strata, deep excavations typically require dewatering of confined aquifers to ensure engineering safety. However, existing studies have seldom conducted in-depth analysis on the influence of the soil parameters and construction measures on the deformation of retaining structures. In this study, a three-dimensional hydro-mechanical numerical model was developed to evaluate the performances of excavation and dewatering of the foundation pit. The model was validated by comparing the calculated and measured wall deflections and groundwater drawdowns of a 45 m ultra-deep double-wall excavation in Shanghai. According to the characteristics of soil stratification and construction activities, three parameters were selected for subsequent analysis, including the hydraulic conductivity of aquitard below the bottom of the pit, the pumping rate in the second confined aquifer and the construction of TRD wall. The stress distributions on both sides of the diaphragm wall were examined to elucidate the deformation mechanism. The results indicate that the aquitard hydraulic conductivity directly affects the effective stress of the overlying aquifer, which plays a crucial role in resisting wall deflection. An increase in the hydraulic conductivity leads to smaller effective stress, greater wall deflection and larger ground settlement. While an appropriately increased pumping rate enhances effective stress, over-pumping may induce excessive wall deflection at depth and disproportionate ground settlement. The TRD wall is quite useful in terms of waterproofing but the effect on deformation control is limited. The findings of this study provide valuable insights for engineering practices and the optimization of deep excavation construction measures in multi-aquifer strata.

1. Introduction

With the advancement of urbanization and increasing demand for infrastructure construction, deep excavation is becoming more and more important in modern construction, particularly in densely populated cities and key transportation hubs in coastal areas [1,2]. Shanghai is located in the Yangtze River Delta, which is rich in groundwater. The soil profile is characterized by alternating aquifers and aquitards, forming the typical multi-aquifer strata system [3]. In the process of urban construction in Shanghai, the exploitation of underground space is becoming gradually saturated, so deep excavation has grown much more common. However, construction is often complicated by complex geological conditions in this area. To prevent hydraulic uplift at the bottom of deep excavations, dewatering is typically required in confined aquifers during excavation [4]. But this process will change the original stress field, and induce complex soil–structure interaction, which affects the deformation of the retaining structures of the foundation pit and the overall safety of the project. In order to better understand the influence of dewatering in aquifers and its controlling factors, it is necessary to study the excavation and dewatering process of the foundation pit in detail, so as to provide a more reliable research basis for engineering design and offer practical engineering recommendations for deep excavation projects.
When dealing with the problems of foundation pit excavation, a variety of analytical methods are available. To simplify the calculations, undrained and drained analyses are commonly used in engineering practices [5]. However, due to the limited excavation duration in most foundation pits, Ou and Lai [6] suggested that through finite element analysis, considering the dissipation of pore pressure could yield results closer to the actual situation than the complete undrained analysis. Transient analysis can more accurately describe characteristics such as pore pressure, so coupled hydro-mechanical analysis is preferred [7]. At present, many studies have conducted coupled analysis to solve problems related to groundwater, including simulating excavation process of foundation pits [8,9,10], analyzing soil hydraulic parameters [11,12], analyzing leakage through retaining structures [13,14], evaluating dewatering-induced environmental impacts [15,16] and simulating groundwater flow over a large scale [17].
Considering economy and construction difficulty, a partially penetrated waterproof curtain is often used in deep excavation when the thickness of aquifer is quite large. Since it does not completely cut off the hydraulic connection of the aquifer at the toe of the wall, the groundwater outside the pit can flow into the pit by seepage along the wall during dewatering, which inevitably impacts the deflection of the wall and behavior of soils behind the wall. Existing studies have numerically studied the process of dewatering in confined aquifer in Shanghai, as well as the impact of soil parameters on deformation [18,19]. However, there are still few studies focusing on the dewatering activities in soil layers at depth, such as on the second aquitard and confined aquifer in Shanghai.
In this study, a three-dimensional hydro-mechanical numerical model considering soil–structure interaction was established to simulate the whole construction process of an ultra-deep excavation. Based on the verified model, a parametric analysis was carried out, focusing on the hydraulic conductivity of the aquitard below the bottom of the pit, the pumping rate in the second confined aquifer and the effectiveness of the TRD curtain in terms of watertightness serving as the auxiliary waterproof measure. The stress distributions of soil in different construction conditions were discussed, and the main factors affecting the wall deflection were identified.

2. Project Description

2.1. Project Overview

The project of is located in Pudong New District, Shanghai Municipality, China. It is a 5#Shaft pit with the infrastructure of a major scientific device which consists of four sets of deep buried shield tunnels. The foundation pit measures 79.0 m in length and 57.4 m in width, encompassing a total area of 4535 m2 and a perimeter of 273 m. The general excavation depth reaches as deep as 42.1 m, with a locally deepened area in the southern part of the pit extending to 45.45 m. The project is a 45 m ultra-deep excavation, and is by far the deepest rectangular excavation in the Shanghai soft soil area. The plan view of the foundation pit is depicted in Figure 1.

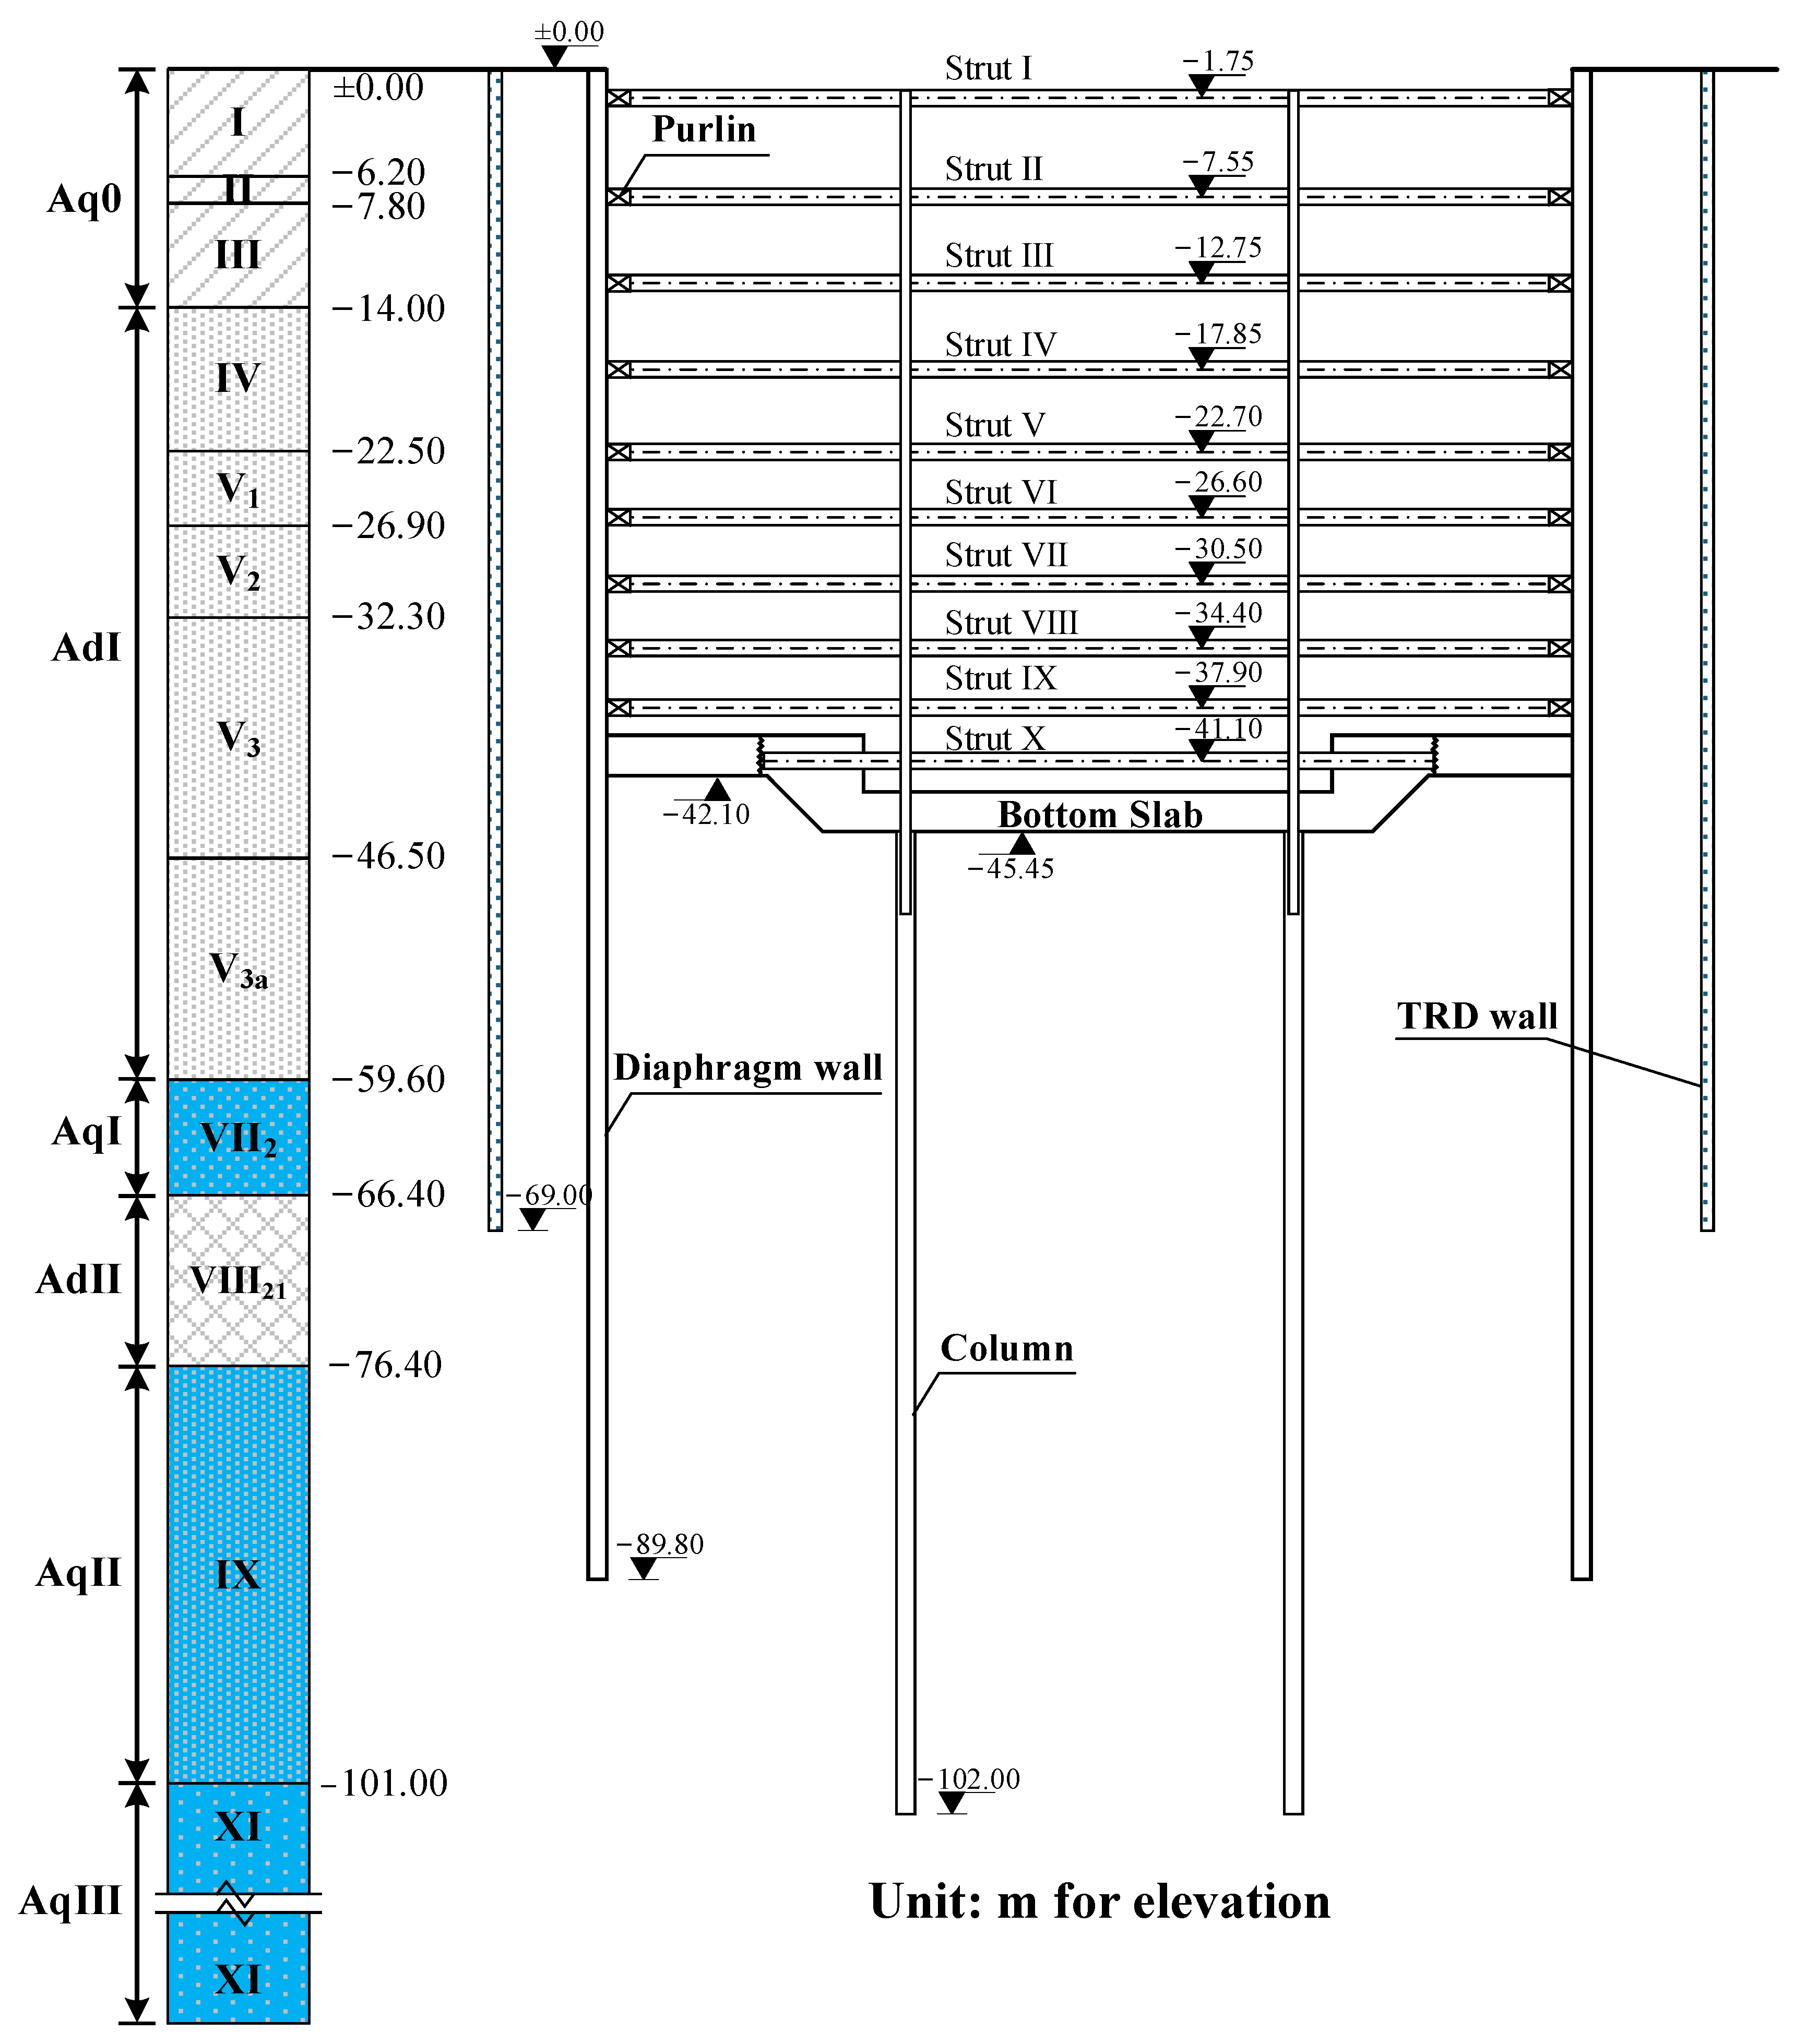
2.2. Ground Condition

The project is located in the Shanghai soft deposit in the Yangtze River Delta alluvial plain. The soil profile up to a depth of 150 m at the project site consists of sediments from the Quaternary Holocene to the Middle Pleistocene epochs. In terms of the geological genesis, soil structure and property, the strata can be divided into 11 geological layers. Specifically, the soil layers encompassing the foundation pit include the following: layer I of artificial backfill, layer II of clayey silt with silty clay, layer III of mucky silty clay with clayey silt, layer IV of mucky clay, layer V1 of clay, layer V2 of clayey silt with silty clay, layer V3 of silty clay, layer V3a of sandy silt with silty clay, layer VII2 of fine sand, layer VIII21 of silty clay with silty sand, layer IX of fine sand and layer XI of fine sand. The physical and mechanical properties of each soil layer, derived from field investigations and laboratory tests, are detailed in Figure 2.
The site features two types of aquifers: phreatic and confined aquifers. The phreatic water is abundant in the backfill, clayey and silty soils at shallow depth. The head of phreatic aquifer (Aq0) is 0.5 m~3.8 m below ground surface (BGS). Layers IV, V1, V2 and V3 constitute the aquitard (AdI). Layers VII2, IX and XI constitute the first, second and third confined aquifer (AqI, AqII and AqIII), respectively. Layer V3a is interconnected with layer VII2 in most areas. Layer VIII21 is located between layer VII2 and layer IX, which acts as an aquitard (AdII). Layer IX and layer XI are in direct contact with each other. The head of AqI is about 6.09 m BGS and the head of AqII and AqIII is about 9.87 m BGS. The alternate layers of aquifers and aquitards are highlighted in the profile of stratigraphy and excavation in Figure 3.

2.3. Design Scheme and Construction Sequence

The project is located in the suburban area of Shanghai, adjacent to some important public infrastructures and facilities such as high-voltage tower, the maglev railway and municipal pipelines. As previously mentioned, the hydrogeological conditions of the site are complex, including soft clays with high water content and compressibility at shallow depths, as well as confined aquifers with high piezometric heads in deeper soil layers. The excavating and dewatering process of the ultra-deep foundation pit can substantially impact the surrounding environment. Consequently, the design of the retaining and supporting systems should meet the demand of controlling deformations and minimizing adverse effects on surroundings.
The excavation is retained by a 1200 mm-thick, 89.8 m-deep diaphragm wall. The excavation surface of the pit is located in layer V3 and the toe of diaphragm wall is located in layer IX (AqII). Outside the diaphragm wall, a 900 mm-thick trench cutting remixing deep wall (TRD wall) is designed as the waterproof curtain which penetrates into layer VIII21 and cuts off the AqI and upper layers. The TRD wall serves as an auxiliary measure to prevent potential leakage in the diaphragm wall. The excavation is supported by nine levels of reinforced concrete (RC) struts, in general, and an extra tenth level of strut in the locally deepened area. Figure 3 illustrates the cross-section of the foundation pit with details of the structures mentioned above.
The excavation was constructed in a bottom-up process. The execution phases consist of sequential excavation of soils inside the foundation pit and subsequent installation of struts or casting of floor slabs. As for the dewatering of aquifers, the water level inside the foundation pit was lowered below each excavation surface, according to the results of anti-hydraulic uplift calculation. The specific construction stages are outlined in Table 1.

3. Numerical Modeling

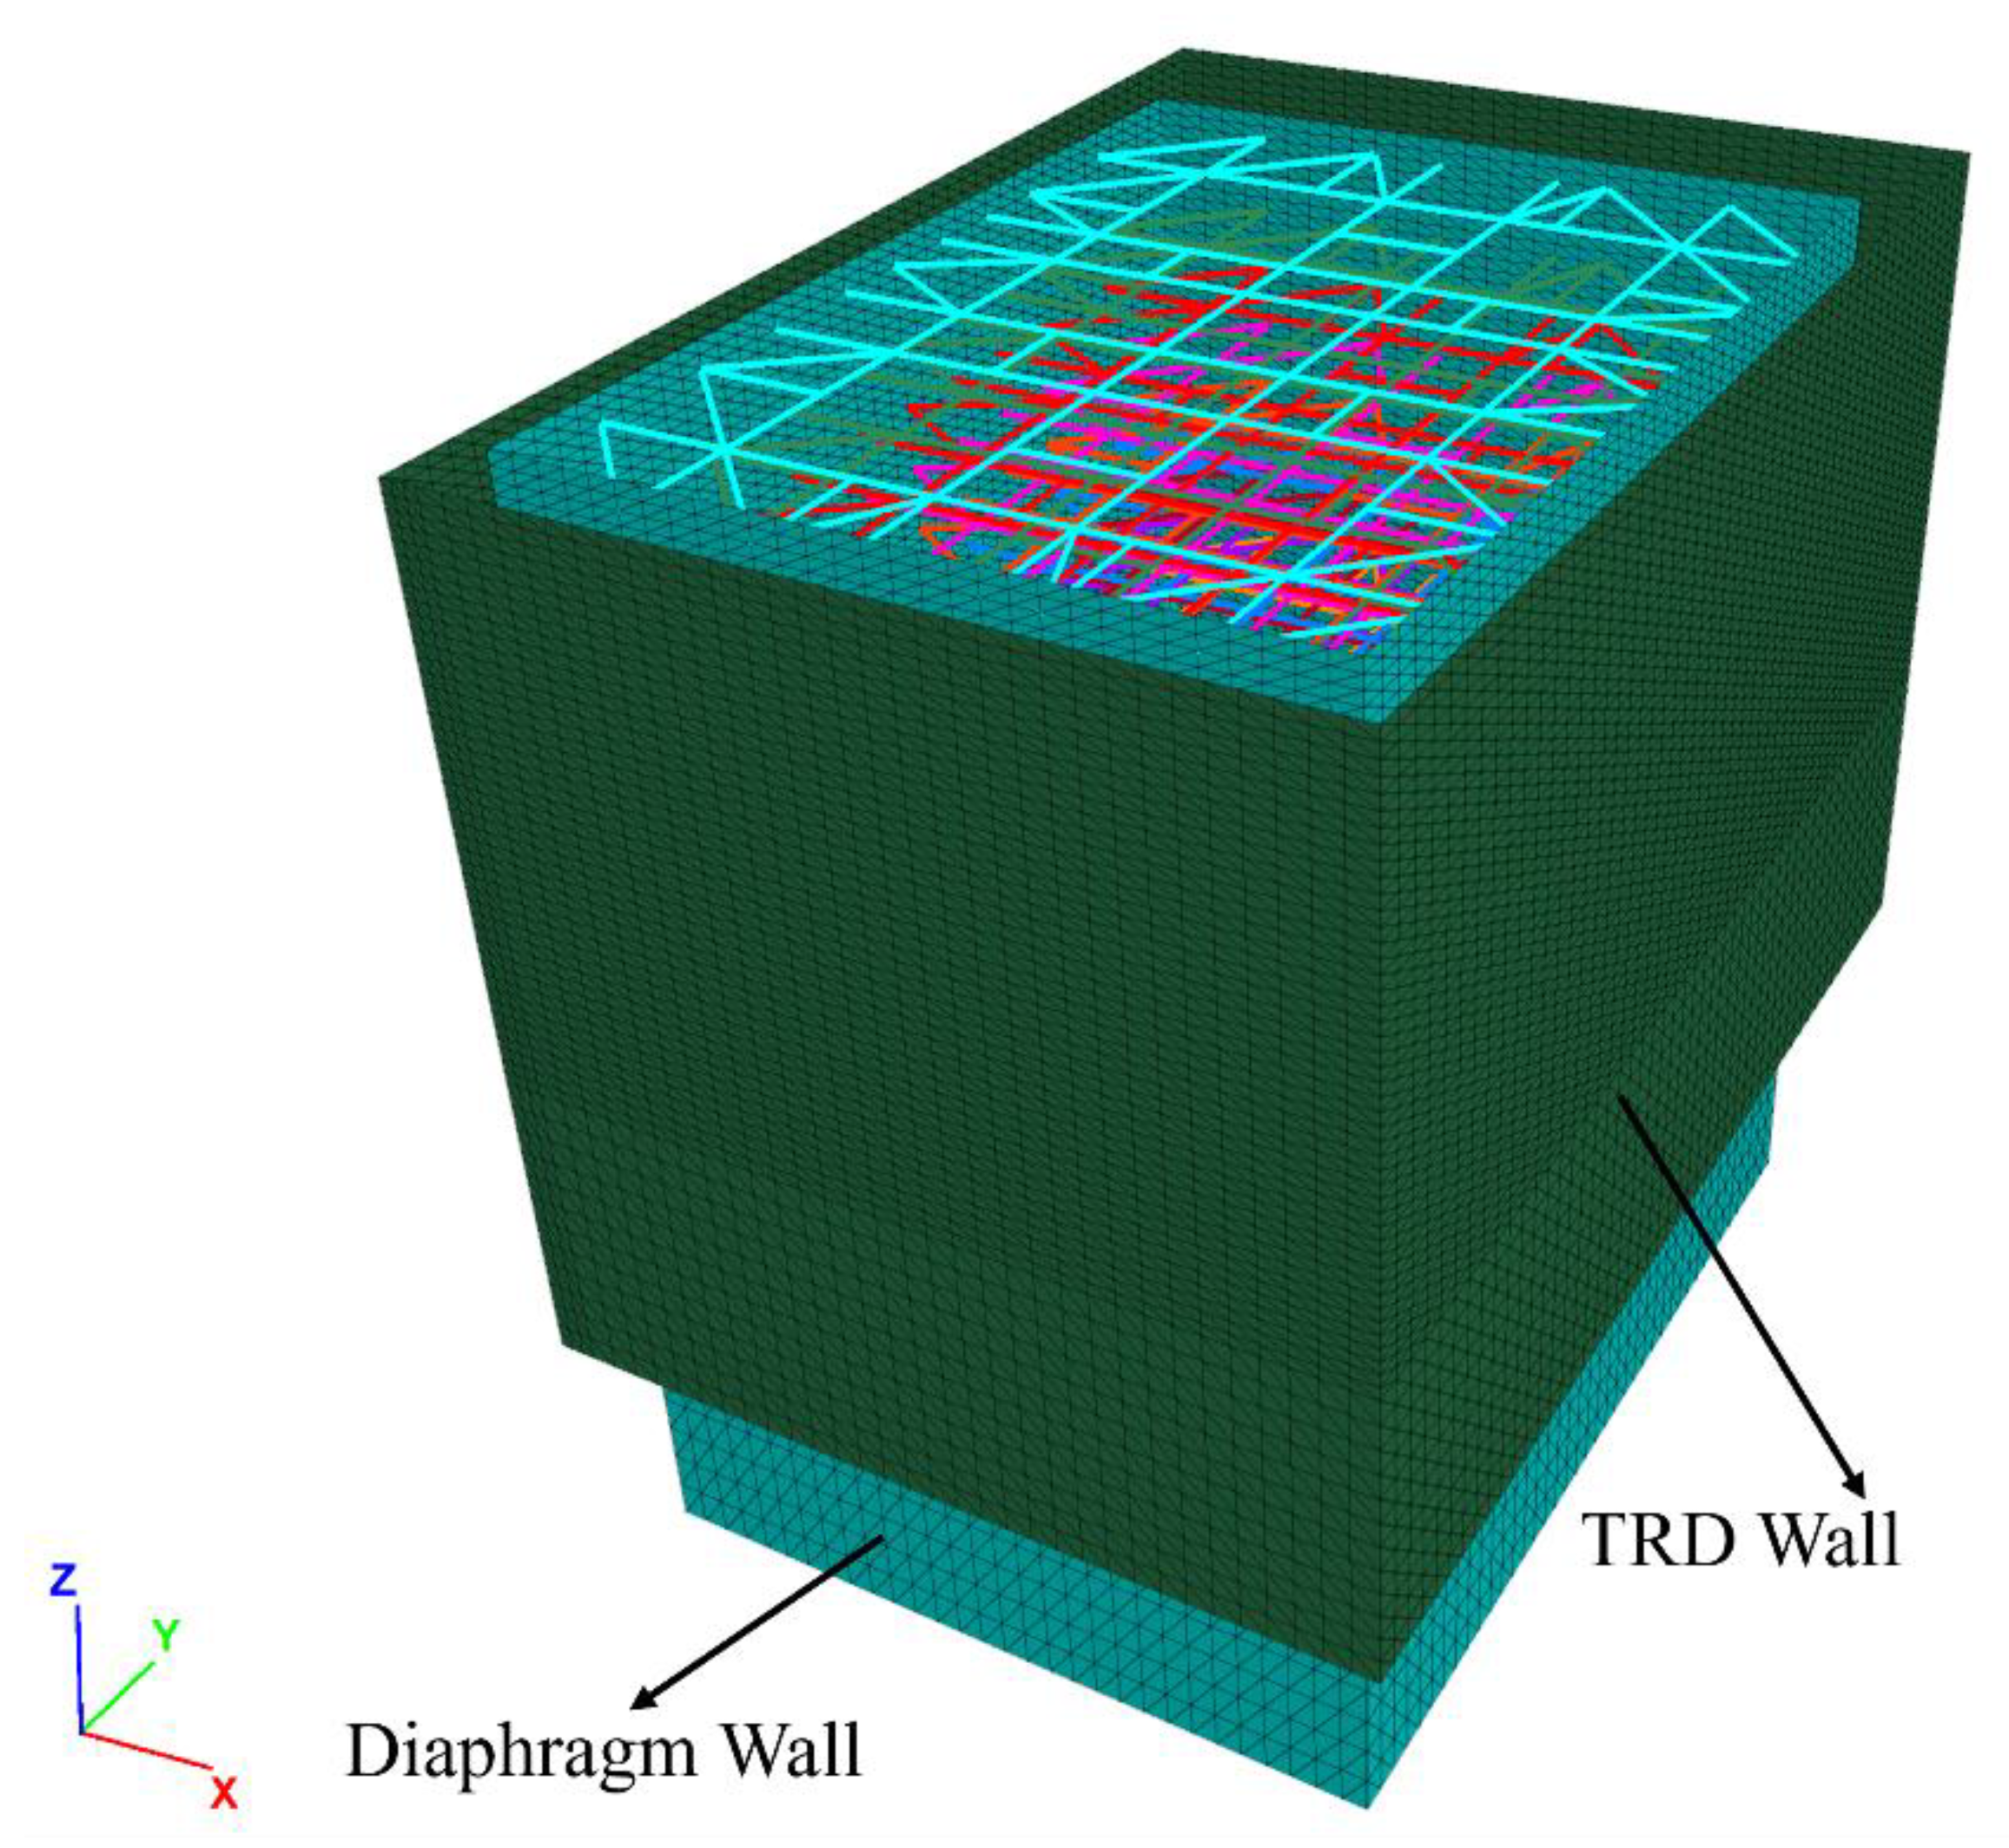
3.1. General Description of the Numerical Model

The numerical simulation was carried out using the finite difference commercial software FLAC3D V7.0. A 3D numerical model considering the interaction between soil and structure was established, which included the soil strata at the site, the diaphragm wall, the TRD wall, the horizontal and vertical support system and the bottom slab. The 3D model of the excavation is shown in Figure 4, and the retaining and supporting systems are shown in Figure 5.
Various structural elements are provided in the software to model different structures [20]. In this study, the diaphragm wall and TRD wall were modeled as LINER elements. The struts were modeled as BEAM elements. The vertical columns were modeled as PILE elements. The bottom slab was modeled as SHELL elements.

3.2. Boundary Conditions

The model was 550 m × 570 m in plane size, which exceeds the excavation depth at each side 5 times to eliminate the boundary effect [21]. There are two types of boundary conditions in this model: mechanical boundary and hydraulic boundary. The movement was free at the top of the model and fixed in all directions at the bottom. The movements were constrained in the normal direction at the four sides of the model. As for the hydraulic boundary, the top and bottom of the model were set to be impervious and the four sides were set equal to the initial water levels measured at the sites.

3.3. Constitutive Models and Parameters

In numerical simulation of excavation, the proper selection of soil constitutive model is extremely important. Xu [22] analyzed the applicability of commonly used constitutive models in numerical analysis, and recommended the HS model, which could consider the softening and hardening characteristics of soils. Burland’s study [23] found that the shear modulus of soils decreases with the increase in shear strain in the range of a small strain. Benz [24] further modified the HS model and proposed the HS-Small model, which can reflect the small-strain characteristics of soils. In analyzing problems concerning deep foundations and excavations, the small-strain stiffness needs to be considered with caution [25]. Thus, the numerical analysis carried out in this paper adopts the HS-Small constitutive model.
The HS-Small constitutive model consists of 11 HS parameters and 2 small-strain parameters, and their physical meanings can be well found in Benz’s work [24]. Specifically, the strength parameters c′ and φ′ can be obtained in the geotechnical investigation report. The dilation angle ψ can be set as φ′-30 for clay and 0 for sand according to Bolton’s research [26]. vur is the Poisson’s ratio and can be set to be 0.2 according to Brinkgreve [27]. The coefficient of earth pressure at rest K0 can be set as (1—sinφ′) according to Gao [28]. The power of stress dependency m can be set as 0.5~1 according to Janbu [29].
The stiffness parameters include the oedometric tangent stiffness Eoed, the triaxial secant stiffness E50 and the unloading–reloading stiffness Eur, as well as the failure ratio Rf, which can be obtained through a triaxial consolidation test under the reference pressure pref. The two small-strain parameters include the initial shear modulus G0 and the threshold shear strain γ0.7. G0 can be obtained through in situ wave velocity tests and lab resonant column tests with bender element. γ0.7 can be obtained in the Gγ curve of resonant column tests. Usually, these advanced parameters are not directly measured in engineering practice. Wang [30] conducted various lab tests to systematically study the relationships between these parameters, and proposed a statistical method to determine these parameters based on the Es1-2 from geotechnical investigation. The results were included and recommended in the Shanghai standard of excavation [31]. The soil parameters used in this paper are obtained in this way and are listed in Table 2.
As for the simulation of other structures, the reinforced concrete structures in this study were C40 in strength and modeled to be isotropic. The Young’s modulus is 32.5 MPa, and the Poisson’s ratio is 0.2. When subjected to large bending moment, cracks will appear on the surface of diaphragm wall and the stiffness of the wall will be reduced. This phenomenon was observed in a well-documented case [32]. In simulations of an excavation, the stiffness of the wall is often partly reduced to consider the performance in the existence of cracks and other factors, and a 20% reduction was taken in previous studies [33,34,35]. Considering the significant depth and difficulties in construction of the 5#Shaft excavation, 60% of the original stiffness was taken for the diaphragm wall in this study.

3.4. Construction Stages in Simulation

In the numerical simulation, the soil was modeled by the ZONE elements, and the removal of the soil was realized by applying the null model to the excavated soil inside the pit.
Dewatering and drainage need to be considered for excavation in strata rich in groundwater. In the numerical simulation of this case, dewatering of phreatic aquifer and aquitards was achieved by assigning a fluid null model. Specifically, before the excavation of the foundation pit, the groundwater level of the phreatic layers and the aquitards at shallow depths was reduced to 1 m below the excavation surface. In other words, the dewatered area was given a fluid-null model. For the dewatering of confined aquifers, the simulation methods are much more complicated. Based on the locations of dewatering well, it is usually simulated by applying a fixed water head or a fixed dewatering rate in the filter screen of the dewatering well. In this case, a fixed pumping rate was applied, corresponding to the average pumping rate of dewatering in the project. The pumping rate in AqI was set to be 30.1 m3/day beginning from Stage 5 to the end, while the pumping rate in AqII was 1041 m3/day at Stage 9 and 4800 m3/day during Stage 10 and Stage 11.
As for the simulation of the structures in the foundation pit, the diaphragm wall, TRD wall and column piles were first activated, prior to soil excavation. The drainage, dewatering and excavation of the foundation pit commenced after the in-situ stress came to an equilibrium, and the installation of struts was realized by activating the corresponding level of struts above the excavation surface, following the excavation of each layer of soil.
The detailed construction stages of the numerical simulation are listed in Table 3, below.

3.5. Model Verification

Throughout the whole construction period of the 5#Shaft foundation pit, the lateral deflections of the diaphragm wall and groundwater drawdowns were monitored, and the layout of the monitoring points is shown in Figure 1. In order to verify the accuracy of the 3D model used in this case, the measured and calculated wall deflections δh were compared, as shown in Figure 6a. Both the measured and the calculated results showed a spindle-shaped deflection pattern. Maximum wall deflection δhm was observed at monitoring point CX4 with the value of 250 mm, while the calculated δhm was 256 mm. Discrepancies were observed in excavations taking place at shallow depths (before Stage 6). This is probably because of the weak strengths and stiffnesses of soft clays and unevenness of the soil stratification. As the construction continued, the calculated deflections showed good agreement with the measured ones. The maximum deflection δhm and the depth of δhm were basically the same. Plus, measured and calculated groundwater drawdowns inside the pit, between the diaphragm wall and TRD wall and outside the pit were compared, as shown in Figure 6b. Generally, the calculated groundwater drawdowns changed in the same trend as the measured ones. Although there were slight differences between the calculated results and the measured results at certain stages, the overall numerical results were in good agreement with the measured ones, which indicates that the established model and input parameters are valid in analyzing the ultra-deep excavation concerning excavation and dewatering. Based on the analyses above, the coupled hydro-mechanical method could reasonably describe the behavior of diaphragm wall in excavation. Subsequently, the coupled hydro-mechanical method was adopted for in-depth parameter analysis.

4. Parametric Analysis

There are studies numerically analyzing the parameters affecting the performance of an excavation, including the insertion ratio of diaphragm wall, the stiffness of the supporting structures, the impact ground improvement, etc. [36,37,38,39]. This paper focuses on the response of deep foundation pits under excavation and dewatering. Based on the characteristics of supporting structures and soil strata of the project, three parameters were selected for in-depth analysis, including the hydraulic conductivity of the aquitard, the pumping rate in the deep confined aquifer and the influence of the TRD wall.

4.1. Aquitard Hydraulic Conductivity

Many existing studies have proven that the soil hydraulic conductivity k has a significant impact on the wall deflections δh caused by excavation and dewatering. In the project, pumping in deep aquifers AqI (soil layer VII2) and AqII (soil layer IX) was carried out. Although the diaphragm wall can cut off the connection of the aquifer AqI, it cannot fully penetrate AqII. Thus, the hydraulic conductivity of the aquitard AdII (layer VIII21) between the two aquifers plays a key role in the hydraulic connection between them. In this section, the aquitard hydraulic conductivity between the aquifers AqI and AqII, kAdII, was analyzed, and the influence of hydraulic conductivity on the wall deflection, ground settlement and groundwater drawdown in the aquifers was examined. The results of parametric analysis are presented in Figure 7 and Figure 8, below. Figure 7 illustrates the relationships between wall deflection and ground settlement and hydraulic conductivity, and Figure 8 illustrates the relationship between groundwater drawdown and hydraulic conductivity.
As shown in Figure 7a, when the ratio of hydraulic conductivity (k/k0) is low (e.g., 0.01~0.5, where k is 1.76 × 10⁻⁸~8.8 × 10⁻⁷ cm/s), the δh of the diaphragm wall is small, and the δhm is about 210 mm. The profiles of δh above the excavation surface are basically identical. With an increase in depth, the profiles of δh exhibit slight differences. Because the confined water in AqI inside the pit is gradually pumped out as the excavation proceeds, unbalanced stress applied on both sides of the wall occur and lead to deflection. With the decrease of kAdII, the confined water in AqII is difficult to recharge into AqI, resulting in larger differences in stress between the inside and outside of the pit and excessive δh below the excavation surface. As for the ground settlement outside the pit, the change is not obvious when the k/k0 ratio is low. The maximum settlement δvm is around 125 mm. When the k/k0 ratio increases (e.g., 0.5~100, where k is 8.8 × 10⁻⁷~1.76 × 10⁻⁴), the δh of the diaphragm wall and the δv of the ground increase as well. The δhm increases by about 80% as the k/k0 ratio increases from 0.5 to 100, while δvm increases by about 82%, indicating that in deep excavation, the hydraulic conductivity of the deep aquitards has a significant impact on the wall deflection and ground settlement caused by excavation and dewatering. During the increase in kAdII, the profile of δh and δv of is basically the same. The δhm appears near the excavation surface and δvm appears at a distance of 0.5 times of the excavation depth.
In Figure 7b, the relationship between δhm and δvm and kAdII is illustrated using a B-spline fitting method. Primarily, the δvm is 0.5~0.7 times of δhm in this simulation, which agrees with the statistical pattern in soft soils [21]. It can be observed that with the increase in the k, both the δhm of diaphragm wall and δvm of ground increase, in general. When kAdII is relatively low (e.g., less than 10−6 cm/s), δhm and δvm remain at a low level and change very subtly. When k falls within the range of 10−6 cm/s~10−5 cm/s, the deformations increase rapidly. And when kAdII is greater than 10−5 cm/s, the increments of δhm and δvm gradually decrease. This is caused by the blocking effect of aquitard (AdII) between AqI and AqII. When the hydraulic conductivity of AdII is small, the hydraulic connection between AqI and AqII is cut off, and the recharge of groundwater in AqI from the underlying aquifer AqII is prevented. On this condition, the result of a further decreasing kAdII on the deformations is minimal. With the increase in the kAdII, δhm of the wall, as well as δvm of the ground, begins to increase rapidly as the groundwater in AqII is able to flow up into AqI and partly offset the dewatering. When kAdII of AdII increases close to that of the aquifers, the recharge efficiency tends to be stable, and the increment of deformations gradually slows down.
Figure 8a shows the development of groundwater drawdowns at several points of the aquifers during excavation under conditions of k/k0 = 0.5, 1 and 5. Figure 8b shows the relationship between final groundwater drawdown and kAdII at each point. Generally, the water level outside the pit is higher than that inside the pit (i.e., smaller drawdown), which resulted from the groundwater seepage caused by pumping inside the pit and the watertightness of the walls. Inside the pit, point A is located in AqI and point D is located in AqII. With the increase in kAdII, the groundwater drawdown at point A decreases significantly, while the drawdown at point D decreases slightly. Although point E is located in AqII outside the wall, its drawdown pattern is basically the same as that at point D because the diaphragm wall is unable to fully penetrate AqII. The difference between values of drawdown at point D and point E is the result of seepage along the wall. Point B is located between the diaphragm wall and the TRD wall. As kAdII grows, the groundwater in AdII can be effectively mobilized in the seepage, so the drawdown of point B is alleviated. Point C is located outside the TRD wall. With the increase of kAdII, seepage in AqI outside the pit is more likely to occur, and the drawdown at point C increases. The increasing k causes a greater drawdown outside the pit, which may count for a larger ground settlement, because it essentially contributes to more consolidation.

4.2. Pumping Rate in Aquifer

In addition to the hydraulic conductivity of soil layers, the pumping rate of the wells is another key parameter during construction. In this project, since the hydraulic conductivity of AdII is three orders of magnitude smaller than that of the adjacent aquifers AqI and AqII, it is reasonable to presume that the influence of pumping activity in AqII on AqI is subtle. Therefore, this section analyzes the pumping behavior in AqII, mainly focusing on the influence of different pumping rates in a partially penetrated aquifer on wall deflection and ground settlement. The results are presented in Figure 9, below.
As can be seen in Figure 9, the deflections of the wall increase significantly as the pumping rate Q increases. At a low pumping rate (e.g., Q/Q0 = 0.1~2), the δh of the diaphragm wall is relatively small and the δhm grows slowly. This is similar to the ground settlement δh pattern outside the pit, which increases even more slightly. However, when the pumping ratio grows higher (e.g., Q/Q0 = 5), both the δh and the δv increase dramatically. The increment of δh is more obvious at a depth of over 60 m, while the increment of δv is more pronounced near the wall. Considering that the wall deflections under different Q at shallow depth are basically the same, soils in deep layers have presumably experienced more consolidation due to over-pumping in the deep confined aquifer.
In general, the pumping rate is an important parameter in dewatering of an excavation, and has a substantial impact on the wall deflection. A reasonable pumping rate in confined aquifer helps to avoid hydraulic uplift in the base of the pit and control the wall deflection. Over-pumping not only increases the maximum wall deflection and ground settlement, but also brings about excessive wall deformation at depths near the dewatered aquifer and more consolidation of soils in deep layers. Therefore, in the design of excavation and groundwater pumping, it is necessary to consider the influence of pumping rate on the stability of the foundation pit wall to prevent unwanted deformations.

4.3. Presence of TRD Wall

In this project, in order to ensure the watertightness of the diaphragm wall and prevent potential leakage accident caused by the poor construction quality of the diaphragm wall, a TRD wall is constructed as an auxiliary waterproof structure within 4~10 m outside the foundation pit. In this section, the effect of TRD wall setting on the deflection of the diaphragm wall, ground settlement and the development of groundwater drawdown was analyzed. The results are displayed in Figure 10.
As shown in Figure 10a, under the same conditions of other construction parameters, the presence of the TRD wall only slightly reduces the deflection of the diaphragm wall and ground settlement outside the pit. This may be because the existence of the TRD wall improves the overall stiffness of the soils outside the pit, which helps to inhibit part of the deflection. However, given the stiffness of the TRD wall itself, the inserting depth and the distance between the TRD wall and diaphragm wall, the effect on deformation controlling is relatively limited. In this case, the maximum deflection and settlement without the TRD wall increase by about 3.9% and 4.3% compared to when the TRD wall is present.
As shown in Figure 10b, the TRD wall mainly affects the groundwater drawdowns at points A and B, while the water levels at points C, D and E are not significantly influenced. Under a specific pumping rate inside the pit, the presence of the TRD wall will also cause seepage between the TRD and diaphragm walls, so the drawdown at point B (in full line) is greater than without TRD, and this additional drawdown partially compensates for the drawdown inside the pit. This explains why the drawdown at point A is smaller when the TRD wall is present. This pattern is similar to the results of Yang’s research [40]. The different drawdowns near the diaphragm wall caused by the TRD wall may account for the different distances of maximum settlements in Figure 10a. As for point C located outside the pit, the diaphragm wall can effectively cut off the hydraulic connection between the inside and outside of the pit in AqI. Moreover, points D and E are located so deep that they have exceeded the insertion depth of the TRD. Therefore, the drawdowns at these points exhibit little differences with or without the TRD wall.
In engineering practices, the TRD wall is sometimes used as an auxiliary measure for groundwater control, especially in ultra-deep excavations where the construction quality of the diaphragm wall may be compromised, leading to potential leakage. Thus, it is no surprise that the TRD wall does not serve as a soil-retaining structure. However, given the time and money in dealing with potential leaking accidents, it is advised to use the TRD wall for deep excavations concerning confined aquifers or sensitive environment [41]. Moreover, the effectiveness and advantages of TRD wall have been proved in a case study [42].

5. Discussion

The deflection of the diaphragm wall is the result of unbalanced stresses, specifically the effective stress, applied on the wall. Construction activities, such as dewatering and excavation, will inevitably disrupt the original stress equilibrium and contribute to changes in the pore pressure and effective stress in the soil. In this section, the effective stress of soil (σ′) and pore pressure (uw) on the diaphragm wall were analyzed. In order to reveal the mechanism of wall deflection, the influence of aforementioned parameters on the stress distribution was examined. The results of k/k0 = 5, Q/Q0 = 0.1 and presence/absence of TRD wall were selected for comparison to ensure that no excessive deep deflections occurred on the wall to complicate the scenario. The results are presented in Figure 11, below.
Generally, Figure 11 demonstrates that the resistance provided by effective stress in the passive zone σp plays a major role in controlling the wall deflection. As seen in Figure 11a, when kAdII is lower, the influence of dewatering in AqI is more pronounced, and σp is significantly increased; that is, the resistance to deflection of wall is greater. Conversely, when kAdII is larger, the groundwater drawdown in AqI is smaller on the same construction conditions (as shown in Figure 8b), leading to a higher uw. Consequently, σp is reduced, resulting in greater wall deflection. From a microscopic point of view, the hydraulic conductivity essentially describes the ability of pore water to flow through the pores of a soil. And this directly affects the dissipation time of pore pressure and further affects the effective stress in the macroscopic perspective. When the aquifer is dewatered, a head difference and groundwater seepage are induced. The larger the permeability of the aquitard, the more easily the groundwater flows through it in to the aquifer, which increases the pore pressure of the aquifer and slows the dissipation of pore pressure. Similar findings can also be found in other studies [10,18]. In Figure 11b, a notable increase in σp in AqII is observed when a reasonable pumping is performed. Additionally, the seepage caused by pumping in AqII indirectly leads to a decrease in uw in AqI, which results in a greater σp in AqI and above soil layers. Figure 11c depicts that the existence of TRD wall has a significant effect on restricting uw directly acting on the diaphragm wall outside the pit, but the difference in σp remains subtle. This explains the minor differences in the wall deflections. Nevertheless, TRD wall is still a highly recommended structure in ultra-deep excavations as a precautionary measure.
The analysis above reveals the mechanism of wall deflection on the basis of stress distribution. These findings highlight that improving the effective stress of the soil in the passive zone of the pit is an important factor in limiting the deflection of the diaphragm wall. The insights from this study can be applied to construction measures aimed at controlling wall deformation, such as ground improvement to decrease the hydraulic conductivity, dewatering in confined aquifers, etc.
However, there are limitations to the findings of this study as well. Firstly, the distribution of the soil layers was simplified regardless of the unevenness of the site. But the profile of the soil in the simulation is typical to the project, and can reflect the characteristics of soil stratification well. This kind of simplification is quite common in numerical analysis to avoid the complexity of the model and an excessive amount of computation [19,43]. Although the applicability of the constitutive model, the HS-Small model, has been verified by theoretical studies [24], experiments [44] and simulation cases [45], the characteristics of soil stratification vary from region to region, and models and parameters are rather specific to this project. The determination of parameters of the model also differs with sites [46]. Furthermore, the optimal pumping rate has not been determined, as it may be influenced by various factors, such as the depth of the wall and the properties of the aquifers. In engineering practices, the pumping rate is often determined by the results of pumping tests before excavation and the demand for groundwater drawdown. Since the purpose of this study is to evaluate the impact of pumping rate on the deformation of an excavation, the optimal pumping rate was not deducted. However, optimization can be achieved in numerical simulations by modeling different scenarios of dewatering schemes, and has been studied by other researchers [47,48].

6. Conclusions

This paper performed a three-dimensional hydro-mechanical simulation considering soil–structure interaction to study the dewatering and excavation process of a 45 m ultra-deep excavation in Shanghai. The validity of the model was verified by comparing the calculated and measured wall deflections. Subsequently, according to the specific soil conditions and construction measure featured in the project, a parametric analysis was conducted focusing on the hydraulic conductivity of the aquitard at the bottom of the pit, the pumping rate in the deep confined aquifer and the effect of TRD wall. The main conclusions of this paper are as follows:
(1)
The calculated deflection pattern of the wall and groundwater drawdown basically matches the measured one, and the calculation error at the final stage is within millimeters at the monitoring point where maximum deflection occurred. It proves that the three-dimensional hydro-mechanical model can effectively simulate the excavation and dewatering process of the foundation pit.
(2)
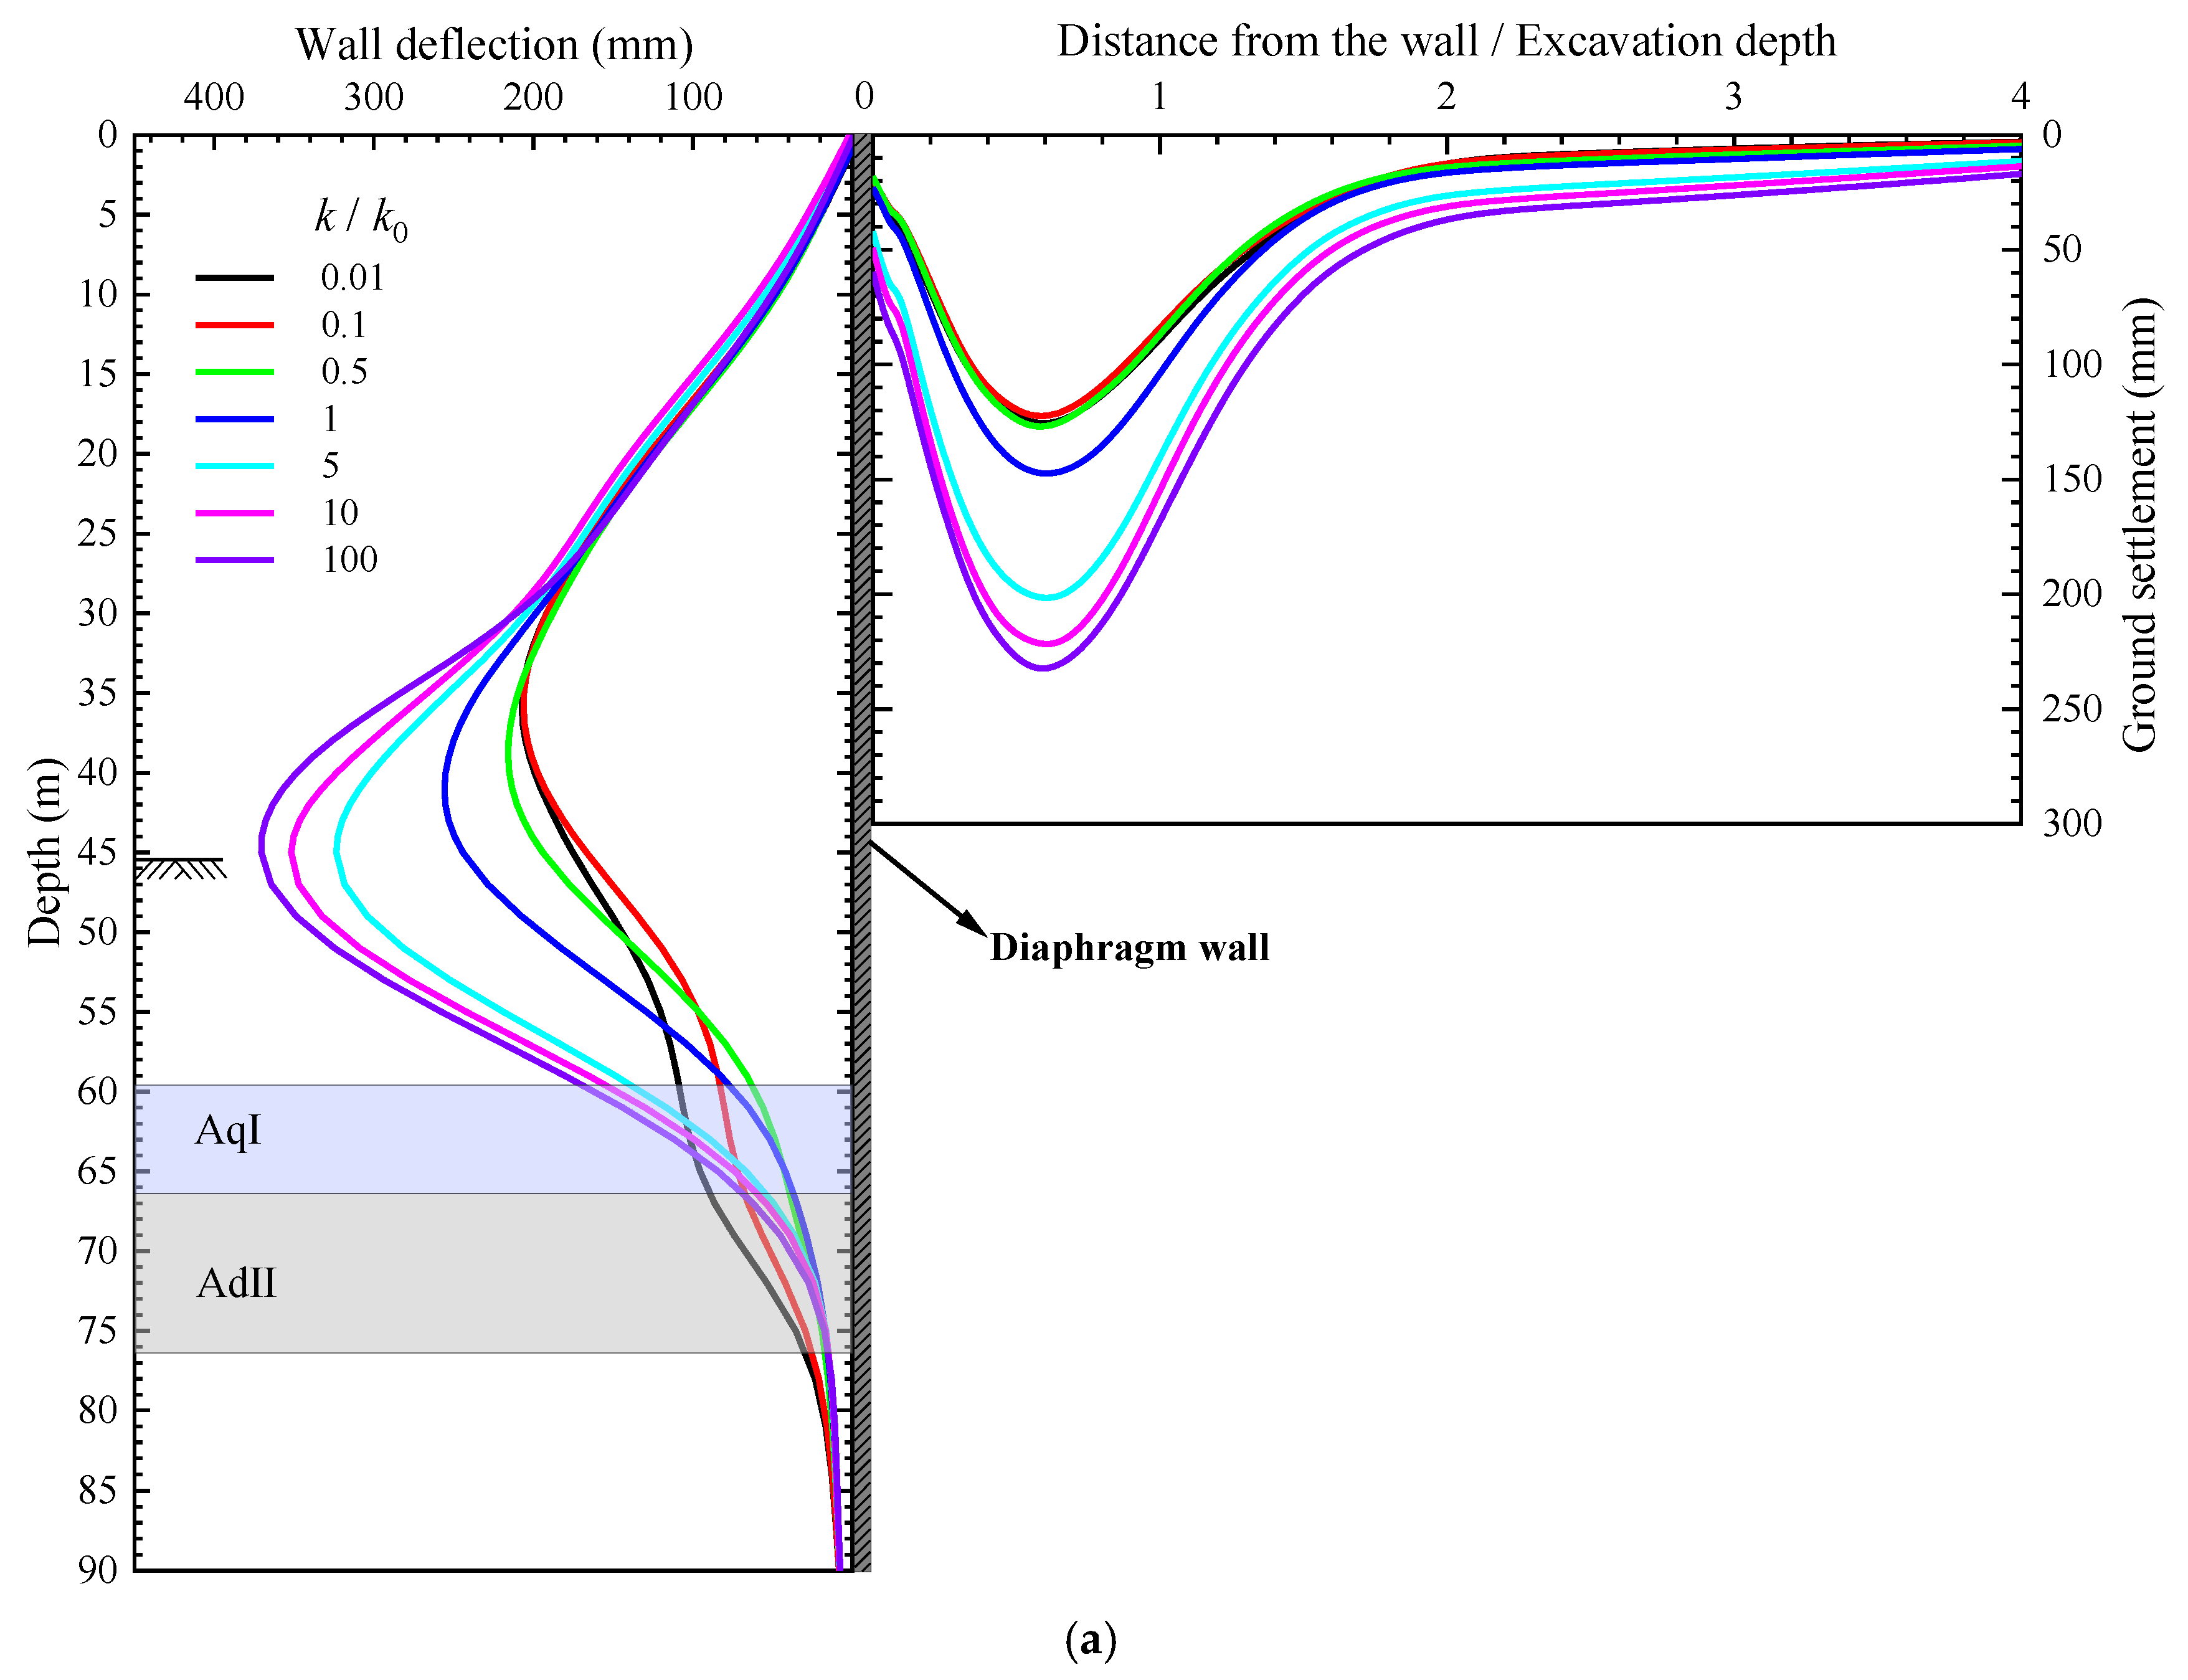
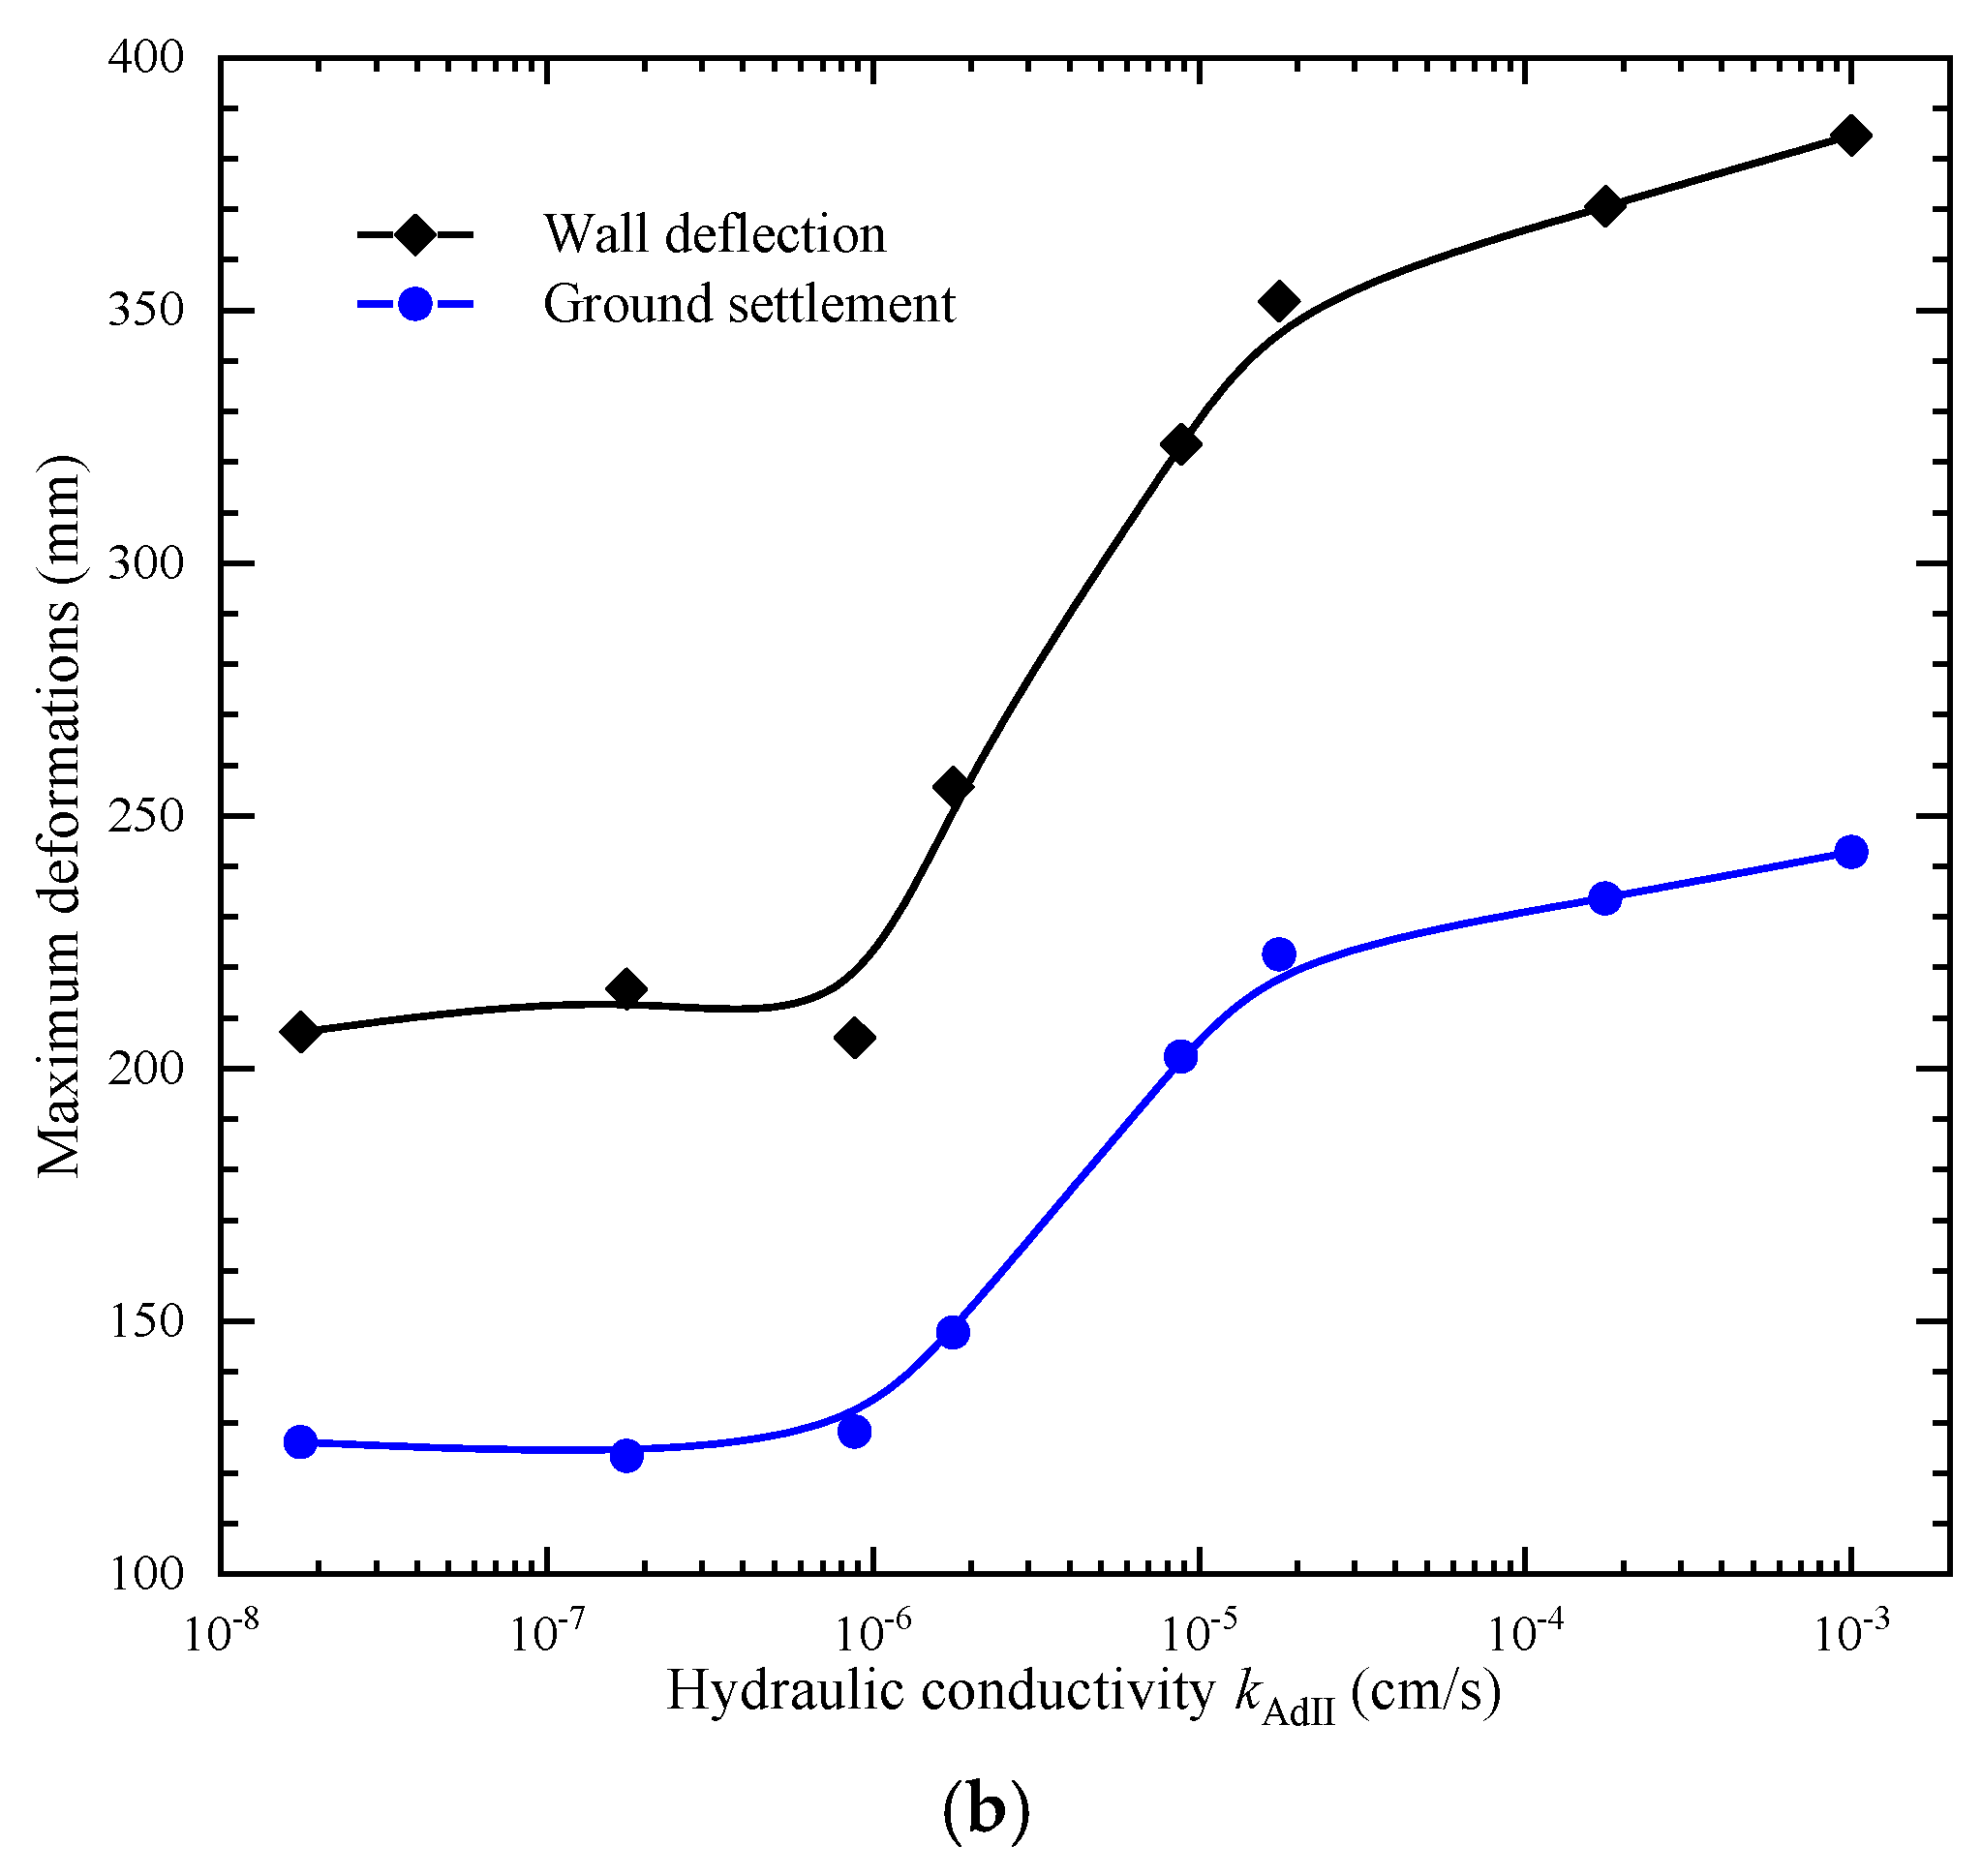
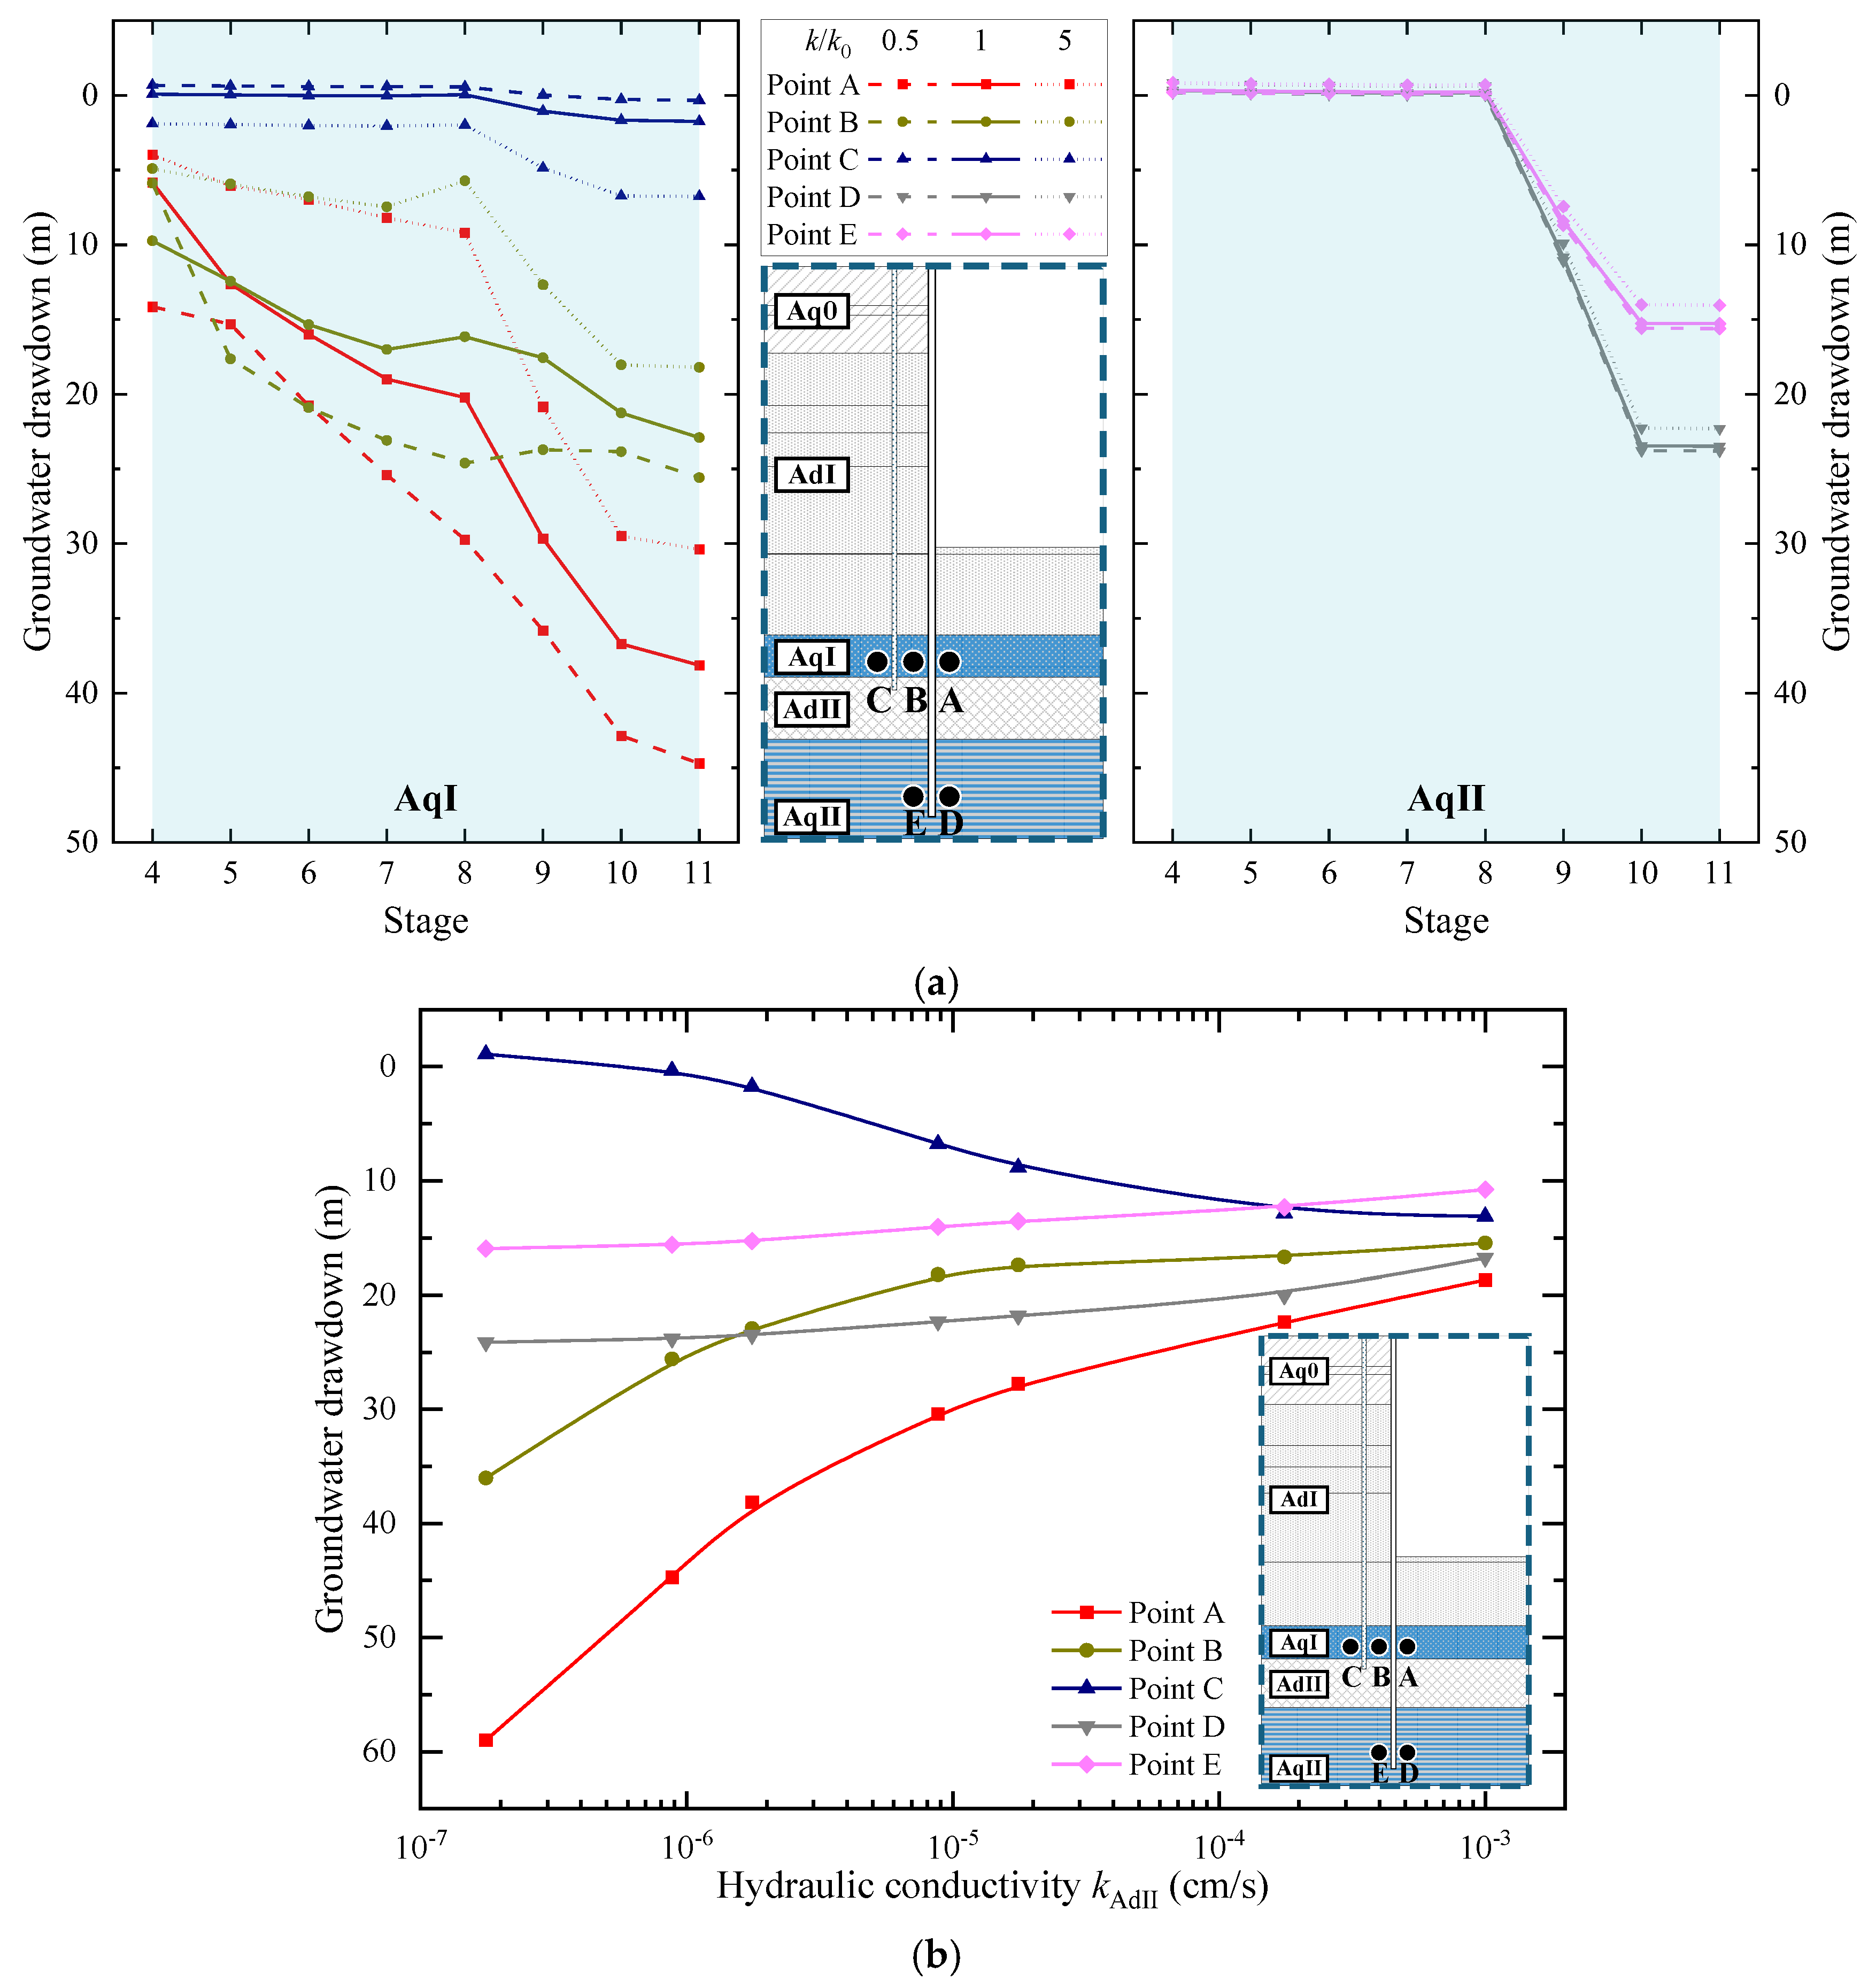
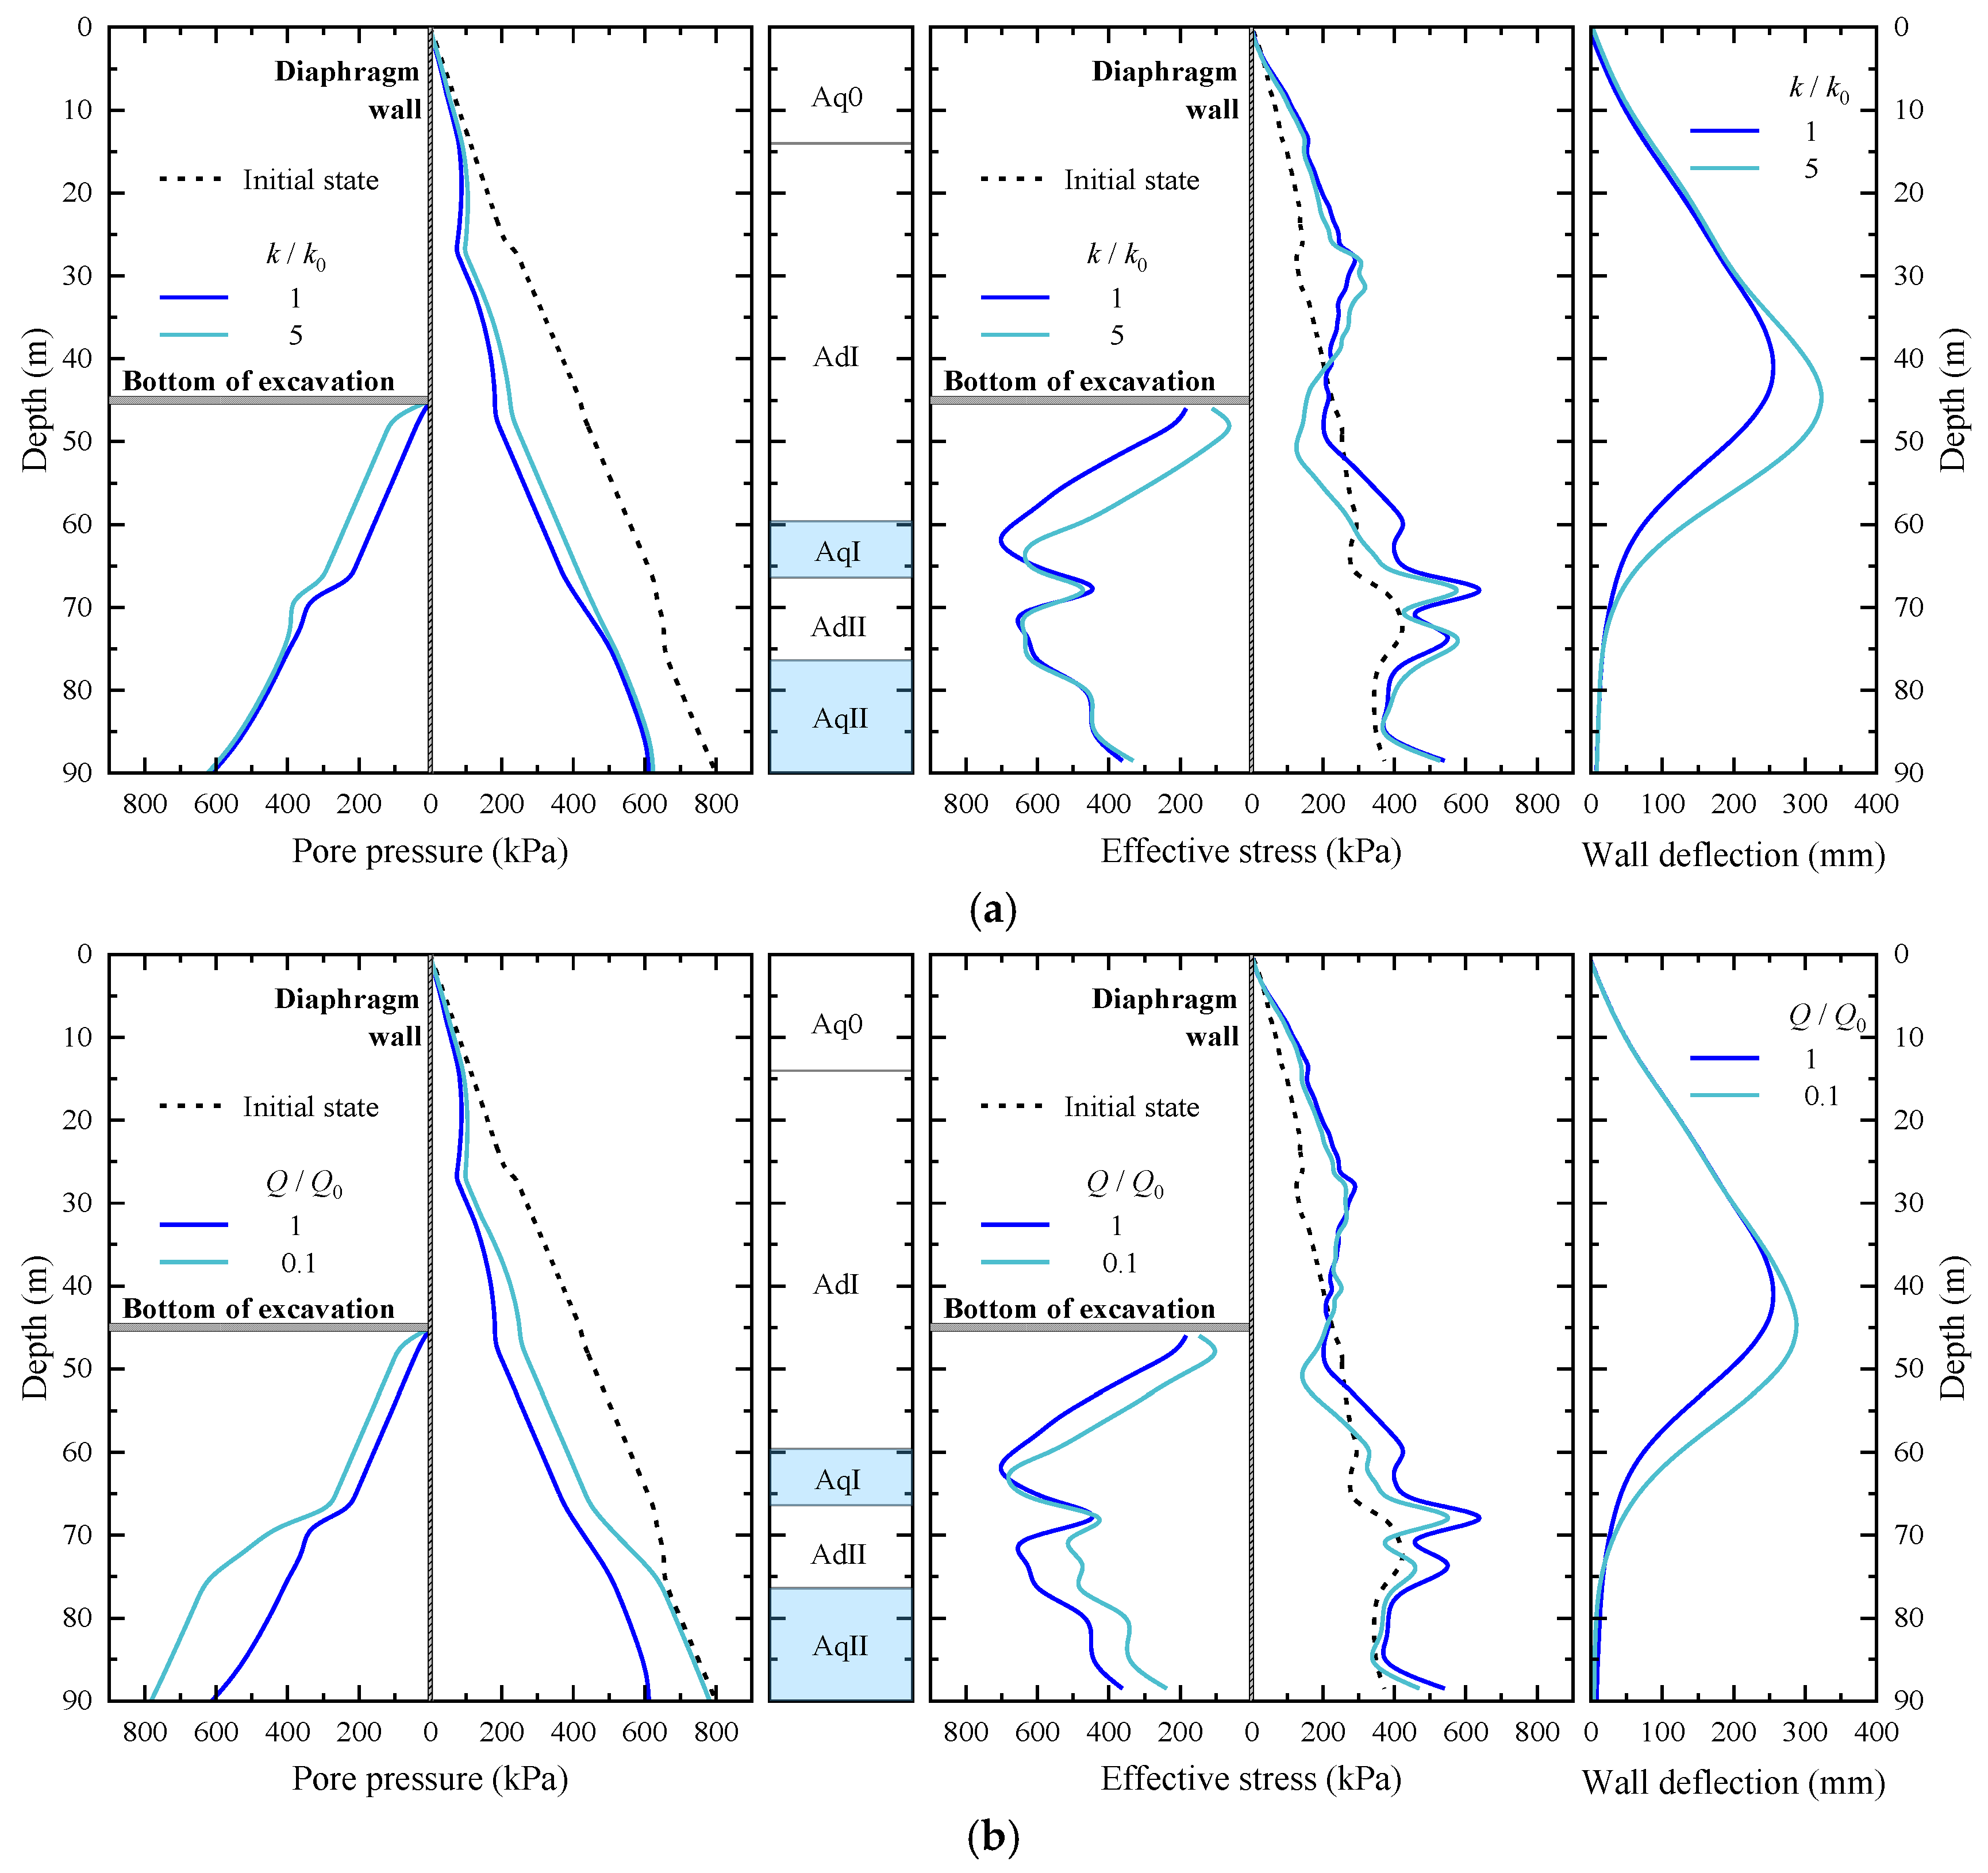
The hydraulic conductivity of the aquitard AdII below the bottom of the pit directly affects the groundwater drawdown in the overlying aquifer AqI during the dewatering process. This, in turn, affects the effective stress in the soil in the passive zone and the consolidation of soils outside the pit, both of which play a crucial role in resisting wall deformation and preventing excessive ground settlement. As the kAdII increases from 10−6 to 10−3 cm/s, the final groundwater drawdown in AqI inside the pit reduces by about 50%, which reduces the effective stress in the passive zone, thereby increasing the wall deformation. Specifically, the wall deflection and ground settlement increase by about 80% under this condition.
(3)
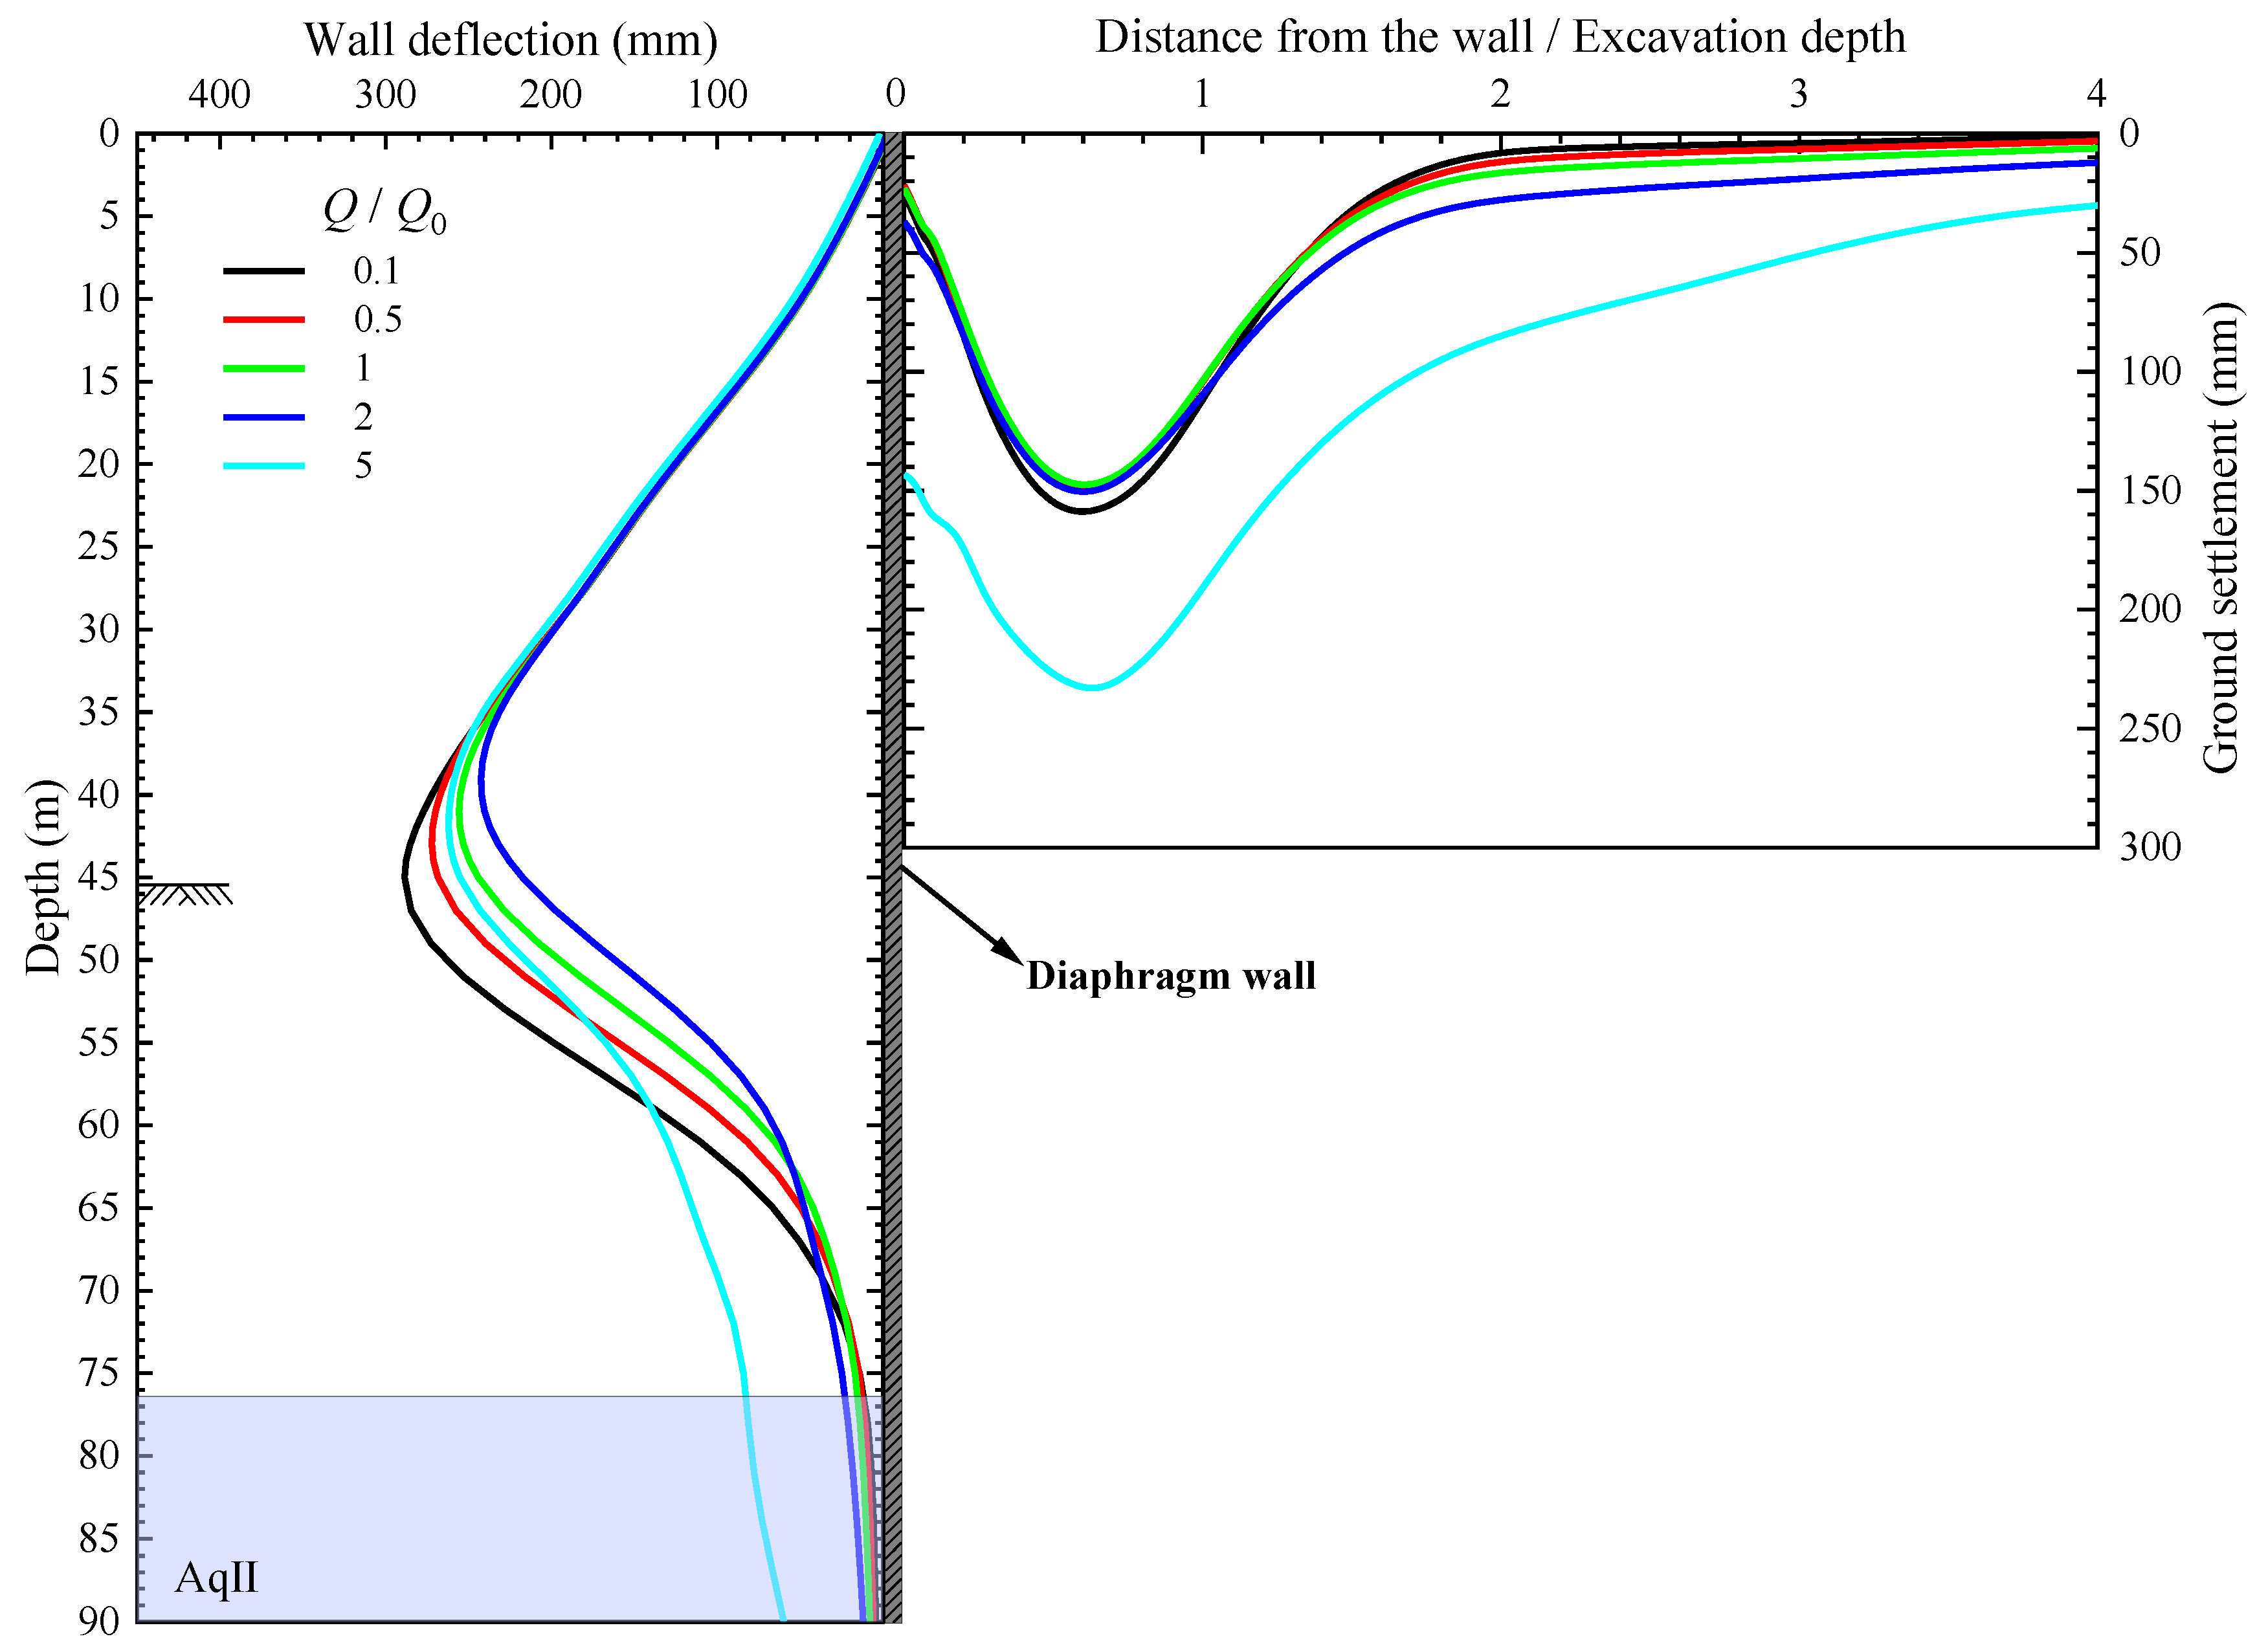
The pumping in the second confined aquifer AqII can help to alleviate the deformation of the wall to some extent, as it is more of a measure to prevent hydraulic uplift at the bottom of the pit. When the ratio of pumping rate increases from 0.1 to 2.0, the maximum deflection decreases by about 16%. However, the pumping rate should not be too high, because it will induce excessive wall deflection and ground settlement. In engineering practices, dewatering tests are usually carried out to help determine the required pumping rate. Although the pumping rate is determined more empirically, numerical simulation can serve as a complimentary method to analyze the influence of different dewatering scenarios.
(4)
The TRD wall plays a good role in watertightness, although it has a limited capability in controlling the deformation of diaphragm wall. Only about 4% of the deformations can be reduced according to the case in this study. But the groundwater drawdown can be alleviated due to additionally induced seepage between the diaphragm wall and the TRD wall. Nonetheless, in ultra-deep excavations with abundant groundwater, the TRD wall is still recommended, because the quality of the diaphragm wall is more difficult to guarantee, and the risk of leakage and failure is greater with an increasing excavation depth.
In conclusion, the findings of this study can provide insights into deformation mechanisms in excavation and dewatering process for ultra-deep excavation. These findings can serve as a suitable reference in similar engineering projects, helping to effectively control deformation and mitigate the side effects of dewatering in confined aquifers.

Author Contributions

Conceptualization, Y.Z. and Z.X.; data curation, Y.Z. and J.Z.; formal analysis, Y.Z.; funding acquisition, W.W., Z.X. and J.C.; investigation, Y.Z.; methodology, Z.X.; project administration, W.W., Z.X. and J.Z.; resources, W.W. and J.Z.; software, J.C.; supervision, W.W., Z.X. and J.C.; visualization, Y.Z.; writing—original draft, Y.Z.; writing—review and editing, Z.X. All authors have read and agreed to the published version of the manuscript.

Funding

This study was funded by the Natural Science Foundation of Shanghai (Grant No. 23ZR1414700) and the Shanghai Municipal Science and Technology Major Project for Social Development (Grant No. 22DZ1202900).

Data Availability Statement

Some of the data, models and code that support the findings of this study are available from the corresponding author upon reasonable request.

Conflicts of Interest

Author Weidong Wang was employed by Arcplus Group PLC. Authors Zhonghua Xu and Ji Zhang were employed by East China Architectural Design and Research Institute Co., Ltd. The remaining authors declare that the research was conducted in the absence of any commercial or financial relationships that could be construed as a potential conflict of interest.

References

  1. Wang, R.; Liu, S.; Xu, L.; Zhao, C.; Ni, P.; Zheng, W. Performance of a 56 m Deep Circular Excavation Supported by Diaphragm and Cut-off Double-Wall System in Shanghai Soft Ground. Can. Geotech. J. 2023, 60, 521–540. [Google Scholar] [CrossRef]
  2. Chu, Y.; Shi, J.; Ye, Z.; Liu, D. Dewatering Characteristics and Drawdown Prediction of Suspended Waterproof Curtain Foundation Pit in Soft Soil Areas. Buildings 2024, 14, 119. [Google Scholar] [CrossRef]
  3. Li, M.-G.; Chen, J.-J.; Xia, X.-H.; Zhang, Y.-Q.; Wang, D.-F. Statistical and Hydro-Mechanical Coupling Analyses on Groundwater Drawdown and Soil Deformation Caused by Dewatering in a Multi-Aquifer-Aquitard System. J. Hydrol. 2020, 589, 125365. [Google Scholar] [CrossRef]
  4. Hong, Y.; Ng, C.W.W. Base Stability of Multi-Propped Excavations in Soft Clay Subjected to Hydraulic Uplift. Can. Geotech. J. 2013, 50, 153–164. [Google Scholar] [CrossRef]
  5. Liu, J.; Hou, X.; Liu, G.; Wang, W. Excavation Engineering Manual; China Architecture & Building Press: Beijing, China, 2009. [Google Scholar]
  6. Ou, C.-Y.; Lai, C.-H. Finite-Element Analysis of Deep Excavation in Layered Sandy and Clayey Soil Deposits. Can. Geotech. J. 1994, 31, 204–214. [Google Scholar] [CrossRef]
  7. Uribe-Henao, A.F.; Arboleda-Monsalve, L.G.; Ballesteros, C.; Zapata-Medina, D.G. Method for Estimating Fully Coupled Response of Deep Excavations in Soft Clays. J. Geotech. Geoenviron. Eng. 2023, 149, 04023026. [Google Scholar] [CrossRef]
  8. Nogueira, C.D.L.; Azevedo, R.F.D.; Zornberg, J.G. Validation of Coupled Simulation of Excavations in Saturated Clay: Camboinhas Case History. Int. J. Geomech. 2011, 11, 202–210. [Google Scholar] [CrossRef]
  9. Liu, N.-W.; Peng, C.-X.; Li, M.-G.; Chen, J.-J. Hydro-Mechanical Behavior of a Deep Excavation with Dewatering and Recharge in Soft Deposits. Eng. Geol. 2022, 307, 106780. [Google Scholar] [CrossRef]
  10. Li, M.-G.; Li, J.-B.; Liu, N.-W.; Peng, C.-X.; Chen, J.-J. Numerical Investigation of the Effect of Stratum Hydraulic Conductivity on Performance of Deep Excavations in an Aquifer–Aquitard System. Int. J. Geomech. 2024, 24, 04024062. [Google Scholar] [CrossRef]
  11. Ha, D.; Zheng, G.; Zhou, H.; Zeng, C.; Zhang, H. Estimation of Hydraulic Parameters from Pumping Tests in a Multiaquifer System. Undergr. Space 2020, 5, 210–222. [Google Scholar] [CrossRef]
  12. Zheng, G.; Ha, D.; Loaiciga, H.; Zhou, H.; Zeng, C.; Zhang, H. Estimation of the Hydraulic Parameters of Leaky Aquifers Based on Pumping Tests and Coupled Simulation/Optimization: Verification Using a Layered Aquifer in Tianjin, China. Hydrol. J. 2019, 27, 3081–3095. [Google Scholar] [CrossRef]
  13. Wu, Y.-X.; Shen, S.-L.; Lyu, H.-M.; Zhou, A. Analyses of Leakage Effect of Waterproof Curtain during Excavation Dewatering. J. Hydrol. 2020, 583, 124582. [Google Scholar] [CrossRef]
  14. Wu, Y.-X.; Lyu, H.-M.; Shen, S.-L.; Zhou, A. A Three-Dimensional Fluid-Solid Coupled Numerical Modeling of the Barrier Leakage below the Excavation Surface Due to Dewatering. Hydrol. J. 2020, 28, 1449–1463. [Google Scholar] [CrossRef]
  15. Zeng, C.-F.; Wang, S.; Xue, X.-L.; Zheng, G.; Mei, G.-X. Evolution of Deep Ground Settlement Subject to Groundwater Drawdown during Dewatering in a Multi-Layered Aquifer-Aquitard System: Insights from Numerical Modelling. J. Hydrol. 2021, 603, 127078. [Google Scholar] [CrossRef]
  16. Zhang, Y.-Q.; Wang, J.-H.; Li, M.-G. Effect of Dewatering in a Confined Aquifer on Ground Settlement in Deep Excavations. Int. J. Geomech. 2018, 18, 04018120. [Google Scholar] [CrossRef]
  17. Zhao, C.; Lei, Q.; Zhang, Z.; Loew, S. Causal Mechanism of Gotthard Base Tunnel-Induced Ground Deformation: Insights from 3D Fully-Coupled Hydro-Mechanical Simulation and Comparison to Field Measurements. Int. J. Rock Mech. Min. Sci. 2023, 170, 105515. [Google Scholar] [CrossRef]
  18. Peng, C.-X.; Liu, N.-W.; Li, M.-G.; Zhen, L.; Chen, J.-J. Hydro-Mechanical Coupled Analyses on Wall Deformations Caused by Deep Excavations and Dewatering in a Confined Aquifer. Acta Geotech. 2022, 17, 2465–2479. [Google Scholar] [CrossRef]
  19. Li, M.-G.; Yan, Y.-H.; Xu, Z.-H.; Chen, H.-B.; Peng, C.-X.; Chen, J.-J. Fully Hydro-Mechanical Coupled Analyses of the Deep Excavation above a Multi-Aquifer-Aquitard System. Tunn. Undergr. Space Technol. 2025, 156, 106259. [Google Scholar] [CrossRef]
  20. Itasca Consulting Group, Inc. Itasca FLAC3D 7.0 Documentation; Itasca Consulting Group, Inc.: Minneapolis, MN, USA, 2019. [Google Scholar]
  21. Wang, J.H.; Xu, Z.H.; Wang, W.D. Wall and Ground Movements Due to Deep Excavations in Shanghai Soft Soils. J. Geotech. Geoenviron. Eng. 2010, 136, 985–994. [Google Scholar] [CrossRef]
  22. Xu, Z.-H.; Wang, W.-D. Selection of soil constitutive models for numerical analysis of deep excavations in close proximity to sensitive properties. Rock Soil Mech. 2010, 31, 258–264+326. [Google Scholar] [CrossRef]
  23. Burland, J.B. Ninth Laurits Bjerrum Memorial Lecture: “Small Is Beautiful”—The Stiffness of Soils at Small Strains. Can. Geotech. J. 1989, 26, 499–516. [Google Scholar] [CrossRef]
  24. Benz, T. Small-Strain Stiffness of Soils and Its Numerical Consequences; Inst. für Geotechnik: Stuttgart, Germany, 2007. [Google Scholar]
  25. Carter, J.P. Constitutive Modelling in Computational Geomechanics—61st Rankine Lecture, British Geotechnical Association, 2023. Géotechnique 2024, 74, 1511–1535. [Google Scholar] [CrossRef]
  26. Bolton, M.D. The Strength and Dilatancy of Sands. Géotechnique 1986, 36, 65–78. [Google Scholar] [CrossRef]
  27. Brinkgreve, R.B.J.; Broere, W. Plaxis Material Models Manual; Delft University of Technology Press: Delft, The Netherlands, 2006. [Google Scholar]
  28. Gao, D.-Z.; Wei, D.-D.; Hu, Z.-X. Geotechnical Properties of Shanghai Soils and Engineering Applications. In Marine Geotechnology and Nearshore/Offshore Structures; Chaney, R., Fang, H., Eds.; ASTM International: West Conshohocken, PA, USA, 1986; pp. 161–177. ISBN 978-0-8031-0490-7. [Google Scholar]
  29. Janbu, N. Soil Compressibility as Determined by Oedometer and Triaxial Test. In Proceedings of the European Conference on Soil Mechanics and Foundation Engineering, Wiesbaden, Germany, 16–20 September 1963. [Google Scholar]
  30. Wang, W.-D.; Wang, H.-R.; Xu, Z.-H. Experimental study of parameters of hardening soil model for numerical analysis of excavations of foundation pits. Rock Soil Mech. 2012, 33, 2283–2290. (In Chinese) [Google Scholar] [CrossRef]
  31. DGJ08-37–2012; Code for Investigation of Geotechnical Engineering. Shanghai Municipal Commission of Housing and Urban-Rural Development: Shanghai, China, 2012.
  32. Ou, C.-Y.; Liao, J.-T.; Lin, H.-D. Performance of Diaphragm Wall Constructed Using Top-Down Method. J. Geotech. Geoenviron. Eng. 1998, 124, 798–808. [Google Scholar] [CrossRef]
  33. Abdi, A.S.; Ou, C.-Y. Evaluation of Cross Wall Performance on Restraining the Wall Displacement and Resisting the Basal Heave in Deep Excavations. Acta Geotech. 2024, 19, 4037–4053. [Google Scholar] [CrossRef]
  34. Lim, A.; Ou, C.-Y.; Hsieh, P.-G. A Novel Strut-Free Retaining Wall System for Deep Excavation in Soft Clay: Numerical Study. Acta Geotech. 2020, 15, 1557–1576. [Google Scholar] [CrossRef]
  35. Kung, G.T.; Juang, C.H.; Hsiao, E.C.; Hashash, Y.M. Simplified Model for Wall Deflection and Ground-Surface Settlement Caused by Braced Excavation in Clays. J. Geotech. Geoenviron. Eng. 2007, 133, 731–747. [Google Scholar] [CrossRef]
  36. Xu, Z.H. Deformation Behavior of Deep Excavations Supported by Permanent Structures in Shanghai Soft Deposit. Ph.D. Thesis, Shanghai Jiao Tong University, Shanghai, China, 2007. [Google Scholar]
  37. Wang, Z.Z.; Whittle, A.J. Effects of Movement Induced by Ground Improvement on the Performance of an Excavation Support System in Underconsolidated Clay. J. Geotech. Geoenviron. Eng. 2024, 150, 05023008. [Google Scholar] [CrossRef]
  38. Lim, A.; Ou, C.-Y.; Hsieh, P.-G. Investigation of the Integrated Retaining System to Limit Deformations Induced by Deep Excavation. Acta Geotech. 2018, 13, 973–995. [Google Scholar] [CrossRef]
  39. Wang, X.-W.; Yang, T.-L.; Xu, Y.-S.; Shen, S.-L. Evaluation of Optimized Depth of Waterproof Curtain to Mitigate Negative Impacts during Dewatering. J. Hydrol. 2019, 577, 123969. [Google Scholar] [CrossRef]
  40. Yang, T.; Tong, L.; Hesham El Naggar, M.; Yan, X. Hydraulic Head Difference at Two Sides of Suspended Waterproof Curtain during Multi-Grade Dewatering of Excavation. Undergr. Space 2023, 10, 137–149. [Google Scholar] [CrossRef]
  41. Xu, X.B.; Hu, Q.; Huang, T.M.; Chen, Y.; Shen, W.M.; Hu, M.Y. Seepage Failure of a Foundation Pit with Confined Aquifer Layers and Its Reconstruction. Eng. Fail. Anal. 2022, 138, 106366. [Google Scholar] [CrossRef]
  42. Tan, Y.; Lu, Y.; Wang, D. Synchronous-Cross Zoned Excavation of the Oversized Basement of Shanghai International Financial Centre by Combination of Bottom-up and Top-down Methods: Structural and Geotechnical Behaviors. Tunn. Undergr. Space Technol. 2024, 153, 106023. [Google Scholar] [CrossRef]
  43. Zheng, G.; Li, Q.H.; Cheng, X.S.; Ha, D.; Shi, J.C.; Shi, X.R.; Lei, Y.W. Diaphragm Wall Deformation and Ground Settlement Caused by Dewatering before Excavation in Strata with Leaky Aquifers. Géotechnique 2022, 74, 1–17. [Google Scholar] [CrossRef]
  44. Zhang, J. Small Strain Stiffness Properties of Shanghai Soft Soils and Application in Deformation Analysis of Deep Excavations. Ph.D. Thesis, Tongji University, Shanghai, China, 2017. [Google Scholar]
  45. Li, M.; Chen, H.; Zhang, Z.; Chen, J.; Yang, Q. Numerical Analysis of a Deep and Oversized Group Excavation: A Case Study. Undergr. Space 2025, 21, 178–197. [Google Scholar] [CrossRef]
  46. Huynh, Q.T.; Lai, V.Q.; Boonyatee, T.; Keawsawasvong, S. Verification of Soil Parameters of Hardening Soil Model with Small-Strain Stiffness for Deep Excavations in Medium Dense Sand in Ho Chi Minh City, Vietnam. Innov. Infrastruct. Solut. 2022, 7, 15. [Google Scholar] [CrossRef]
  47. Chen, Z.; Huang, J.; Zhan, H.; Wang, J.; Dou, Z.; Zhang, C.; Chen, C.; Fu, Y. Optimization Schemes for Deep Foundation Pit Dewatering under Complicated Hydrogeological Conditions Using MODFLOW-USG. Eng. Geol. 2022, 303, 106653. [Google Scholar] [CrossRef]
  48. Sun, Y.; Jiang, Z.; Tong, L.; Sun, J.; Cui, J.; Zhou, X.; Liu, S. Optimization of Confined Aquifer Dewatering for Long-Deep Excavation Using Simulation–Optimization Method. Undergr. Space 2024, 17, 246–266. [Google Scholar] [CrossRef]
Figure 1. Plan view and monitoring points of the excavation.
Buildings 15 00989 g001
Figure 2. Soil parameters of physical and mechanical properties (blue shading highlights the confined aquifers).
Buildings 15 00989 g002
Figure 3. Profile of soil strata, retaining and supporting structures of the excavation. The shadings stand for different kind of aquifers and aquitards, consistent with the marks (e.g., Aq0) on the left.
Buildings 15 00989 g003
Figure 4. Three-dimensional model of the excavation.
Buildings 15 00989 g004
Figure 5. Three-dimensional model of the retaining and supporting systems.
Buildings 15 00989 g005
Figure 6. Comparison of measured and calculated wall deflections and groundwater drawdowns. (a) Wall deflections. (b) Groundwater drawdowns (SWm-n, m stands for the soil layer where the monitoring point is located and n is the serial number).
Buildings 15 00989 g006
Figure 7. Relationships between deformations and hydraulic conductivity of aquitard VIII21. Note: k0 refers to the original value in Table 2. (a) Wall deflection profiles of CX4 at Stage 11. (b) Maximum wall deflections δhm and ground settlements δvm versus kAdII.
Buildings 15 00989 g007aBuildings 15 00989 g007b
Figure 8. Relationships between groundwater drawdown and hydraulic conductivity of aquitard VIII21. (a) Development of groundwater drawdown during excavation. (b) Final drawdown versus kAdII.
Buildings 15 00989 g008
Figure 9. Relationships between deformations and pumping rate in aquifer AqII. Note: Q is the pumping rate in AqII and Q0 refers to the original pumping rate mentioned in Section 3.4.
Buildings 15 00989 g009
Figure 10. Effect of TRD wall on the deformations and drawdowns. (a) Wall deflection and ground settlement profiles at Stage 11. (b) Groundwater drawdown in the aquifers at the end of each stage. Note: P stands for presence and A stands for absence.
Buildings 15 00989 g010aBuildings 15 00989 g010b
Figure 11. Comparison of stress distribution on both sides of the diaphragm wall and wall deflection. (a) Influence of aquitard hydraulic conductivity. (b) Influence of pumping rate in aquifer. (c) Influence of TRD wall.
Buildings 15 00989 g011aBuildings 15 00989 g011b
Table 1. Construction stages of the excavation.
Details of ConstructionDate of Completion
Stage 1Excavation to the depth of about 3.0 m BGS and installation of Strut I19 June 2020
Stage 2Excavation to the depth of about 8.0 m BGS and installation of Strut II3 July 2020
Stage 3Excavation to the depth of about 13.20 m BGS and installation of Strut III26 July 2020
Stage 4Excavation to the depth of about 18.30 m BGS and installation of Strut IV7 August 2020
Stage 5Excavation to the depth of about 23.15 m BGS and installation of Strut V25 August 2020
Stage 6Excavation to the depth of about 27.05 m BGS and installation of Strut VI13 September 2020
Stage 7Excavation to the depth of about 30.95 m BGS and installation of Strut VII2 October 2020
Stage 8Excavation to the depth of about 34.85 m BGS and installation of Strut VIII17 October 2020
Stage 9Excavation to the depth of about 38.35 m BGS and installation of Strut IX1 November 2020
Stage 10Excavation to the depth of 42.10 m BGS, casting the first slab in the general area and installation of Strut X in the locally deepened area1 December 2020
Stage 11Excavation to the depth of 45.45 m BGS locally and casting the second slab in the locally deepened area24 December 2020
Table 2. Soil parameters in the numerical analysis.
Soil Layerγc′φψkE50EoedEurνurmRfγ0.7G0
kN/m3kPa°°cm/sMPaMPaMPa×10−4MPa
II clayey silt with silty clay18.5627.102.74 × 10−75.04.225.10.20.80.92.787.70
III mucky silty clay with clayey silt17.7423.905.89 × 10−73.83.225.40.20.80.62.783.87
IV mucky clay16.8819.603.38 × 10−72.52.116.60.20.80.62.746.37
V1 clay17.61023.103.69 × 10−73.73.118.40.20.80.92.747.88
V2 clayey silt with silty clay18.0529.508.97 × 10−55.74.828.50.20.80.92.774.13
V3 silty clay17.9925.504.17 × 10−74.63.823.10.20.80.92.759.95
V3a sandy silt with silty clay18.4529.505.10 × 10−49.88.248.90.20.80.92.7127.20
VII2 fine sand19.2134.54.51.02 × 10−314.114.156.20.20.50.92.7281.00
VIII21 silty clay with silty sand18.31225.001.76 × 10−65.64.627.80.20.80.92.7138.78
IX fine sand19.7036.061.18 × 10−313.413.453.50.20.50.92.7267.60
XI fine sand19.6035.051.03 × 10−313.313.353.30.20.50.92.7266.60
Table 3. Construction stages of the excavation in numerical analysis.
StagesDetails of ConstructionDuration
Stage 0Activation of initial stress field with installation of walls and piles/
Stage 1Lowering groundwater to 3 m BGS and excavation of soil to 2 m BGS;3 days
installation of Strut I
Stage 2Lowering groundwater to 9 m BGS and excavation of soil to 8 m BGS;14 days
installation of Strut II
Stage 3Lowering groundwater to 14 m BGS and excavation of soil to 13 m BGS;23 days
installation of Strut III
Stage 4Lowering groundwater to 19 m BGS and excavation of soil to 18 m BGS;12 days
installation of Strut IV
Stage 5Lowering groundwater to 24 m BGS, dewatering in AqI and excavation of soil to 23 m BGS;18 days
installation of Strut V
Stage 6Lowering groundwater to 28 m BGS, dewatering in AqI and excavation of soil to 27 m BGS;19 days
installation of Strut VI
Stage 7Lowering groundwater to 32 m BGS, dewatering in AqI and excavation of soil to 31 m BGS;19 days
installation of Strut VII
Stage 8Lowering groundwater to 36 m BGS, dewatering in AqI and excavation of soil to 35 m BGS;15 days
installation of Strut VIII
Stage 9Lowering groundwater to 39.5 m BGS, dewatering in AqI and AqII and excavation of soil to 38.5 m BGS;15 days
installation of Strut IX
Stage 10Lowering groundwater to 43.1 m BGS, dewatering in AqI and AqII and excavation of soil to 42.1 m BGS;30 days
casting of bottom slab and installation of Strut X
Stage 11Lowering groundwater to 46.5 m BGS, dewatering in AqI and AqII and excavation of soil to 45.45 m BGS;23 days
casting of bottom slab in locally deepened area
Disclaimer/Publisher’s Note: The statements, opinions and data contained in all publications are solely those of the individual author(s) and contributor(s) and not of MDPI and/or the editor(s). MDPI and/or the editor(s) disclaim responsibility for any injury to people or property resulting from any ideas, methods, instructions or products referred to in the content.

