Article

Innovation and Cost Influence of Environmental Regulation Policies on Megaprojects

1
International School, Hainan Tropical Ocean University, Sanya 572022, China
2
Department of Construction Management, Dalian University of Technology, Dalian 116024, China
*
Author to whom correspondence should be addressed.
Buildings 2025, 15(7), 1012; https://doi.org/10.3390/buildings15071012
Submission received: 8 February 2025 / Revised: 10 March 2025 / Accepted: 17 March 2025 / Published: 21 March 2025

Abstract

The indispensable significance of megaprojects to a nation’s economy, society, and infrastructure demands ongoing efforts to alleviate the environmental consequences they produce. Nonetheless, the adoption of sustainable practices and legislation is infrequent in developing countries, chiefly due to the substantial expenses linked to sustainable construction methods. The fundamental goal of this quantitative research is to establish a framework for the execution of sustainable practices and regulations. It aims to provide indicators for these rules, examine their relationship with these dimensions, and ultimately explore the moderating influence of cost. Data from the Zambian construction sector were acquired and evaluated using the partial least squares approach. The analysis indicated that the indicators were ideal for implementing rules and sustainable practices to mitigate the environmental impacts of megaprojects, primarily because of their strong correlation with the variables. Secondly, they enhanced the correlation between sustainable construction and the reduction of environmental damage. Third, the adverse impact of elevated expenses in this relationship obstructs the implementation of these policies. The results demonstrate that elevated expenses hinder the execution of certain regulations. A reduced expense for sustainable construction would significantly promote the implementation of these regulations. This study lays out a framework for the construction industry to adopt and follow environmentally friendly rules and practices. These recommendations will lessen the damage that big projects do to the environment and improve the connection between sustainable construction and the environment.

1. Introduction

In the realm of constructed environments and the socio-economic advancement of nations, along with their prestige and wealth, megaprojects have been instrumental [1]. Despite the environmental impacts associated with bringing many of these projects to fruition, the continued relevance of megaprojects is undeniable, demonstrating that the world cannot function without them. The environmental impacts of megaprojects include various forms of pollution, such as noise. The ongoing process of these projects generates significant noise in the surrounding area due to activities such as hitting, cutting, and welding. Additionally, demolitions lead to air pollution. Furthermore, massive land alteration and destruction of a country’s iconic historical infrastructure and heritage can result in its loss for future generations [2,3]. Competing development interests [4,5] could lead to all this, disrupting the smooth flow of traffic and causing long-term inconvenience to road users in a city.
Even in developing countries, the need for megaprojects within the constructed environment is indispensable for advancing society and the economy. Nonetheless, we cannot ignore their undeniable environmental impact [4,5]. Consequently, there is a constant search for solutions to lessen these impacts, resulting in the pursuit of environmentally friendly solutions across various industries. One can observe the rapid evolution of the world, which in turn affects numerous industries, including the car industry. This includes the significant transition from gasoline-powered cars to electrically powered vehicles, the emergence of green innovations aimed at improving the world, and the increasing adoption of policies that promote environmental sustainability.
The construction sector promotes sustainable building practices. Numerous wealthy nations mandate sustainable practices and rigorous compliance with rules [6,7,8]. This holds true in developed countries, but not in countries that are developing; this includes Zambia [9,10]. The gap and challenge is that of implementing sustainable practices [11,12]. The elevated expenses linked to sustainable construction, its methodologies, and the implementation of eco-friendly observations impede advancement. Thus, sustainable practices and compliance with regulations are still innovative ideas and approaches in these countries [13]. The elevated expenses linked to sustainable construction and eco-friendly solutions persist as an obstacle to their adoption.
Therefore, this study seeks to bridge this gap and respond to the need for implementing sustainable practices in the context of Zambia and developing nations by taking into account how sustainable practices and regulations mediate the influence of sustainable construction on the environment and uncover policies and practices ideal for implementing [11]. To explore the possible influence of costs on the relationship between sustainable practices and the environment, as well as the relationship between regulations and the environment, this study poses the following questions for further investigation:
  • What are the optimal and measurable indicators for sustainable practices and regulations that could be adopted?
  • To what extent do these indicators correlate with these constructs?
  • What is the significance of cost in the relationship between sustainable practices and the environment?
  • What is the effect of cost on the link between regulations and the environment?
First, this study employs a new methodical approach in response to Marsh et al., which involves using scientometric/bibliometric and cluster analysis to identify prominent and up-to-date literature and authors from relevant databases. Even though this methodological approach is generally not new and has been applied to many other studies, its application approach to this context is yet to be explored [12]. Additionally, it employs both qualitative and quantitative methods, including partial least squares, to analyze the results. These methodological approaches in research and this context were lacking [14]. Consequently, this work is innovative and represents a substantial addition. Second, this study provides a pool of indicators for the two mediating constructs and further explores their connection to sustainable practices and regulations. Thirdly, this study introduces a framework of ideal indicators for sustainable practices and regulations, which practitioners and environmental regulatory bodies can utilize to reduce environmental impacts and incorporate them into regulations. This study’s innovative ideas and results are novel in their context and constitute a significant contribution.
The subsequent parts of this research cover the review of the literature, followed by the advancement of hypotheses, then methodologies, results, and discussion. Finally, it concludes with a presentation of its constraints.

1.1. Literature Review and Hypothesis Development

1.1.1. Sustainable Practices in Construction and Development

Construction project management must include sustainability planning to foster economic development while preserving environmental quality and ecological integrity [15]. Consequently, governments and nonprofit organizations (NGOs) have promoted the incorporation of ecological values in building procedures, which will facilitate environmental conservation and address the Triple Bottom Line (TBL) issues, among others [16]. The construction sector is progressively adopting sustainable construction methods [5], highlighting a distinct necessity for sustainable practices [17,18]. Notwithstanding the growing execution of environmentally friendly practices in industrialized countries such as China and the surge in megaprojects over the past decade, there exists the possibility for additional advancement. In the past decade, China has experienced an increase in the production of public construction megaprojects, anticipated to attain economic, social, and environmental sustainability. Nonetheless, the social sustainability of such initiatives requires enhancement. Additionally, the United Nations Environmental Program’s sanctioned Agenda 21 promotes sustainable construction to enhance sustainability in developing nations [19]. “To safeguard the environment and ensure the planet’s safety from various ecological threats, sustainability is the paramount solution—essential for achieving a sustainable and healthy existence” [20].

1.1.2. Contributing Factors to Environmental Impact

Overdesign and overspecification cause waste and environmental damage in the building industry [21,22]. It also increases the building industry’s greenhouse gas emissions rating [23]. “Excessive processing of raw materials and the substantial illegal disposal of building debris in open areas have inflicted significant harm on ecosystems such as riverbanks, rivers, and rock outcroppings” [24,25,26,27]. Construction also uses the most natural resources and energy, which has enormous effects on the economy and ecology. In 2010, the building industry represented 32% of the world’s electricity use, 19% of power-related releases of greenhouse gases, and one-third of total worldwide greenhouse gas emissions [28].
Climate change, ozone depletion, environmental degradation, and biodiversity loss have global effects. The best solution is to achieve sustainability through a multidisciplinary approach that improves resource use, recycling, and emissions management. In 2010, the construction sector represented 32% of the world’s electricity use, 19% of power-related releases of greenhouse gases, and one-third of the total worldwide greenhouse gas. Megaproject managers face pressure to incorporate sustainability measures across the undertaking’s lifetime because of escalating consumption of energy, environmental degradation, a shift towards sustainable production and eco-friendly products, and increased citizen knowledge of conservation of the environment and emissions [29,30,31]. Subsequently, the following is hypothesized:
H1. 
Sustainable construction (SC) is closely linked to regulations (R).

1.1.3. Remediation Measures

Sustainable construction involves planning, developing, and recycling. Sustainable development enhances architectural beauty while minimizing ecological impacts [32]. Green building encompasses environmental factors during the entire construction process. This suggests that the design, construction, and operational phases of a property consider waste control, indoor environmental quality, homeowner maintenance, and environmental impact [33]. “Sustainable development enhances architectural beauty while minimizing ecological impacts. To create and sustain an environmentally friendly architecture, resourcefulness and environmentally friendly design are emphasized, underscoring a total of seven essential principles throughout the construction’s life cycle: minimizing resource consumption, reusing materials, employing reusable materials, protecting the natural environment, eliminating toxins, applying life cycle costing, and prioritizing quality” [34]. Mani asserts that environmental sustainability focuses on limiting the consumption of non-renewable resources, advocating for sustainable energy and material sources, decreasing construction waste, and mitigating environmental harm from construction [24,35]. Megaproject sustainability emphasizes the optimization of a project’s value, including economic and social advantages, while mitigating its adverse effects, such as environmental contamination [36].

1.1.4. Sustainable Practices and Regulations

From design through demolition and waste disposal, the construction sector has a major influence on the environment, economy, and society [11,37]. Therefore, we must assess a project’s environmental effects to safeguard human health, enhance environmental quality, preserve species diversity, and sustain the ecosystem’s reproductive capacity as a life source [38], while also adhering to sustainable practices throughout the project’s entire lifecycle and the built environment.
“Sustainable actions and practices can help make a real difference in society” [39]. Sustainable design and construction preserve resources and improve the built environment [34]. Marsh et al.’s poll found that 80.5% of respondents think SC is necessary to lessen the building industry’s environmental impact [11]. Governments assist in sustainable physical infrastructure development, building, and maintenance [40]. Modern development should prioritize sustainability for the planet’s ecology and humans. Proper construction management practices, starting with manufacturing, procurement, placement, and development, can lead to successful completion, performance, and maintenance of the structure, including recycling and dumping after demolition [20]. Conformance also requires meeting the generic element of a safe working environment with minimum environmental impact to prevent accidents, minimize disruption to nearby residents, and prevent long-term harm to participants’ health or the surrounding environment.
Without regulations, sustainable strategies may fail [41]. Laws and regulations are essential for promoting sustainability. Megaprojects stress the local biological and cultural environment. Policymakers and regulators value sustainability [42]. Creating a sustainable culture, sharing best practices, and promoting sustainable construction can help organizations implement sustainable building. Comprehensive databases on sustainable goods and rules and policies to promote sustainable building can assist in attaining these goals [11]. “The government should develop and regulate policies and legislation that govern the adoption and implementation of sustainable construction to emphasize the need to change the current trajectory of the construction industry” [11]. Megaproject management requires rules and sustainability because the government is often the main player [43]. There is a need to tackle megaproject corruption, especially in poor nations [43]. According to the Marsh et al. study, participants agree that construction professionals implement sustainable construction (90.7%) and that an organization’s adoption of sustainable construction shows its commitment to social and environmental responsibilities (89.8%) [11].

1.1.5. The Hindrances of Cost

A significant barrier to the implementation of sustainable designs is their elevated cost, which can serve as a moderating factor, diminishing the correlation across SC, its execution, and its methodologies. Participants assert that the primary hindrance to implementing SC is the anticipated rise in capital costs, cited by 59.3% of respondents [11]. Consequently, concern over the expenses linked to SC is a substantial hindrance to the implementation of environmentally friendly methods in Zambia and other developing nations [44]. The significant upfront costs linked to green building often deter stakeholders from initiating enterprises and employing environmentally friendly substances [45]. Subsequently, based on this, a novel hypothesis is proposed:
H2. 
Cost weakens the link between regulations (R) and environmental impact (EI).
H3. 
Cost weakens the relationship between sustainable practices (SP) and environmental impact (EI).
Figure 1 displays the conceptual model. It illustrates the three dimensions of sustainable construction. The first dimension is environmental, represented by four environmental indicators: EN1, EN2, EN3, and EN4. The second dimension is social, represented by social indicators coded S1, S2, S3, and S4. The third dimension is economical, represented by indicators coded EC1, EC2, EC3, and EC4. The same is true for other constructs: sustainable practices are represented by indicators SP1, SP2, SP3, and SP4; regulations are shown by R1, R2, R3, and R4; and environmental impact is represented by EI1, EI2, EI3, and EI4.

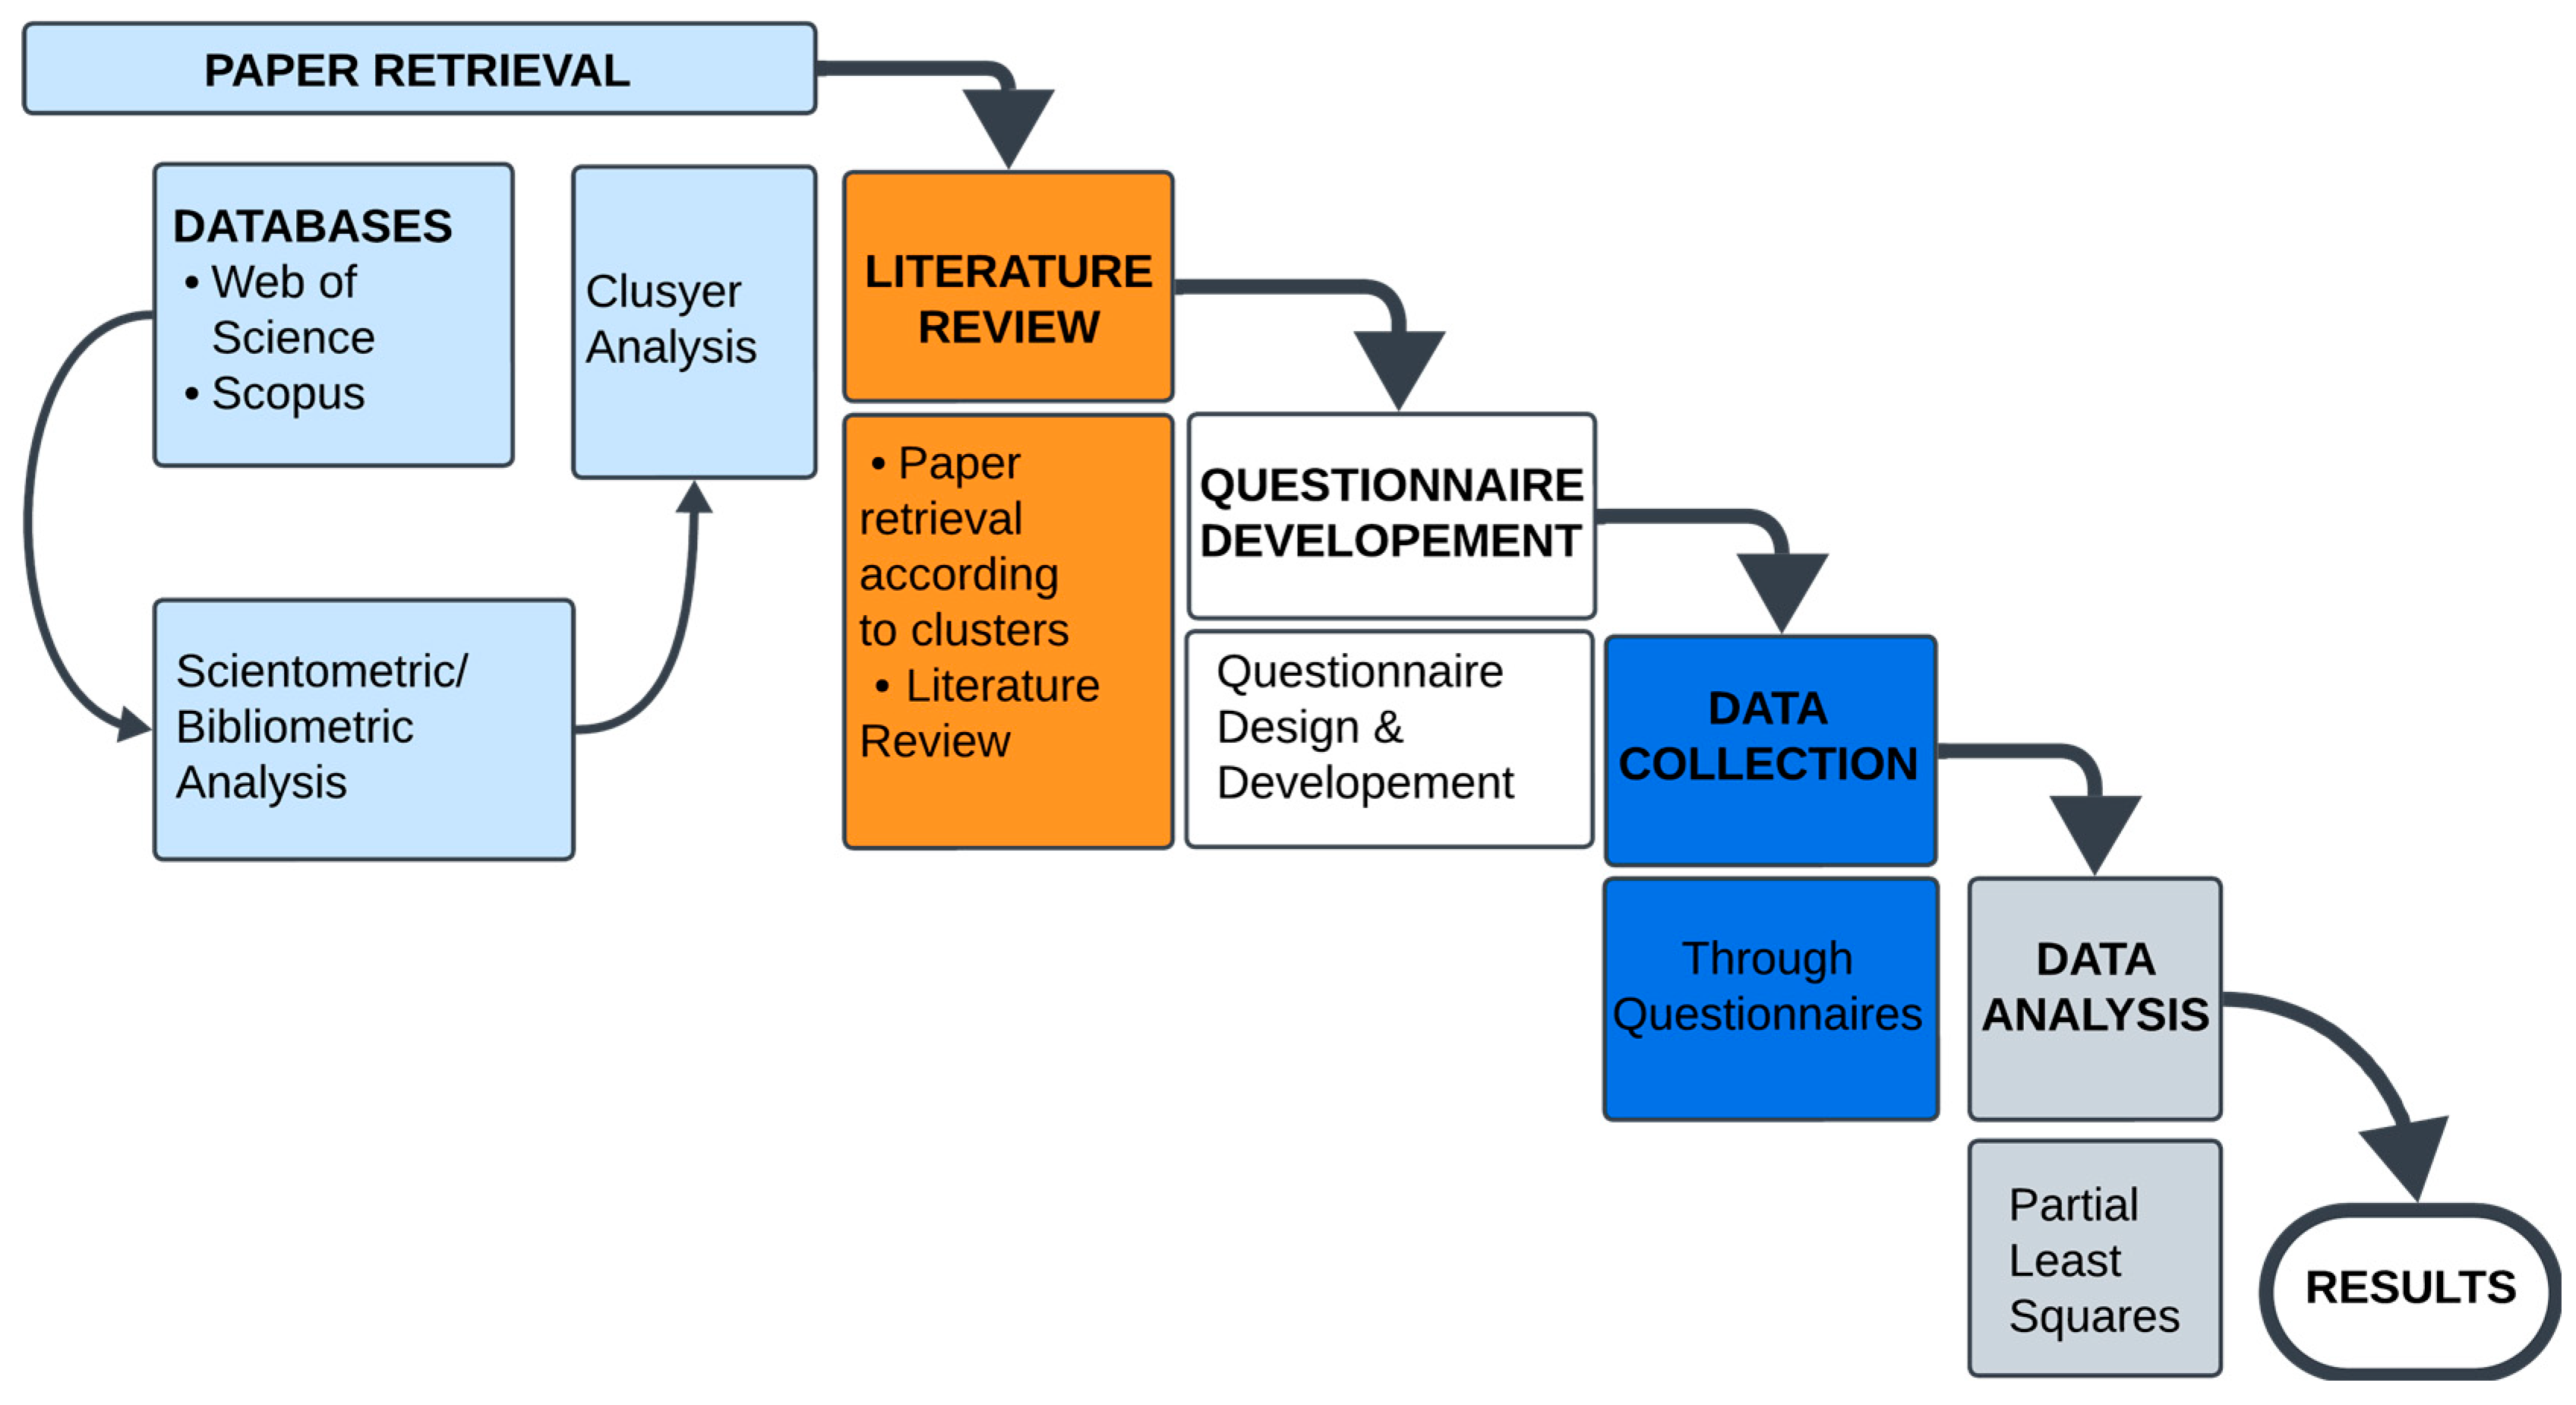
2. Materials and Methods

This study’s methodology involved retrieving papers, conducting a literature review, developing a questionnaire, gathering data, and analyzing them using the partial least squares method. These steps culminated in the acquisition of results, as depicted in Figure 2 of the research flow chart.

2.1. Paper Retrieval

In this study, databases such as the Web of Science (WoS) and Scopus were accessed to identify pertinent literature about this topic. First, a scientometric/bibliometric analysis was performed using the CiteSpace software version 6.1.R2 from the CiteSpace website https://citespace.podia.com/. This analysis ensured the identification of highly relevant literature and authors, based on set parameters such as keywords and publication years [46]. To ensure that the latest findings serve as building blocks for addressing current gaps in this research area, the most current literature on the subject, focusing on the period from 2016 to 2024, was adopted.

2.2. Cluster Analysis

A vast array of literature was categorized into topics represented as clusters through cluster analysis [47,48,49,50]. Each cluster contained a specific topic and a plethora of literature related to it [50,51], as illustrated in Figure 3. Subsequently, papers were gathered from numerous clusters for the literature review.
The study themes were visualized using bibliometric data and cluster analysis. CiteSpace grouped these keywords based on their co-occurrence [52]. CiteSpace automatically labeled derived clusters. It labeled terms from each cluster’s keywords. The top phrases are cluster-representative terms that occur with high frequency. The largest cluster is #0, the next largest is #1, and so on [46]. As a result, papers were retrieved from these clusters for the literature review, as shown in Table 1. Cluster #0 represents promoting sustainable construction; #1 represents large-scale 3D printing; #2 represents worldwide progress; #3 represents waste generation; #4 is for comprehensive assessment; #5 is for the sustainable construction industry; #6 is for emission; #7 is for greenhouse emission; #8 is for building; #9 represents on-site carbon emission assessment; and #10 is for building interior decoration.

2.3. Questionnaire Development

Variables were adopted after conducting a thorough literature review. A template was developed and subjected to specialists’ approval and verification to ensure its suitability for the work environment and the specialists who would participate in the poll. The questionnaire accounted for the gender, age, job title, etc., as indicated in Table 2. The 5-point Likert scale was employed, ranging from 1 (strongly agree) to 5 (strongly disagree), to assess the correlation between these indicators and the variables.
Table 2 shows the demographic details of the respondents. It includes their titles, years of work experience, and number.

2.4. The Collection of Data and Sampling

A questionnaire to collect data was developed based on extensive literature, factors that show sustainable practices, rules, and the different aspects of sustainable construction, along with the moderating factor of cost, which can be seen in Table 3. The questionnaire was foremost evaluated by specialists to confirm the correlation among such variables, the suitability of the design of the survey for the work environment, and the ease of comprehension of the questions for respondents. Thereafter, data were acquired from participants with various educational backgrounds and experience in Zambia’s construction and mining industries. The responses were kept private and were received through Google Forms, emails, other social media platforms, and personal visits.

3. Results

The purpose of this research is to evaluate the degree of correlation between the indicators and their respective constructs. In this case, the components are sustainable construction, sustainable practices, regulations, cost, and environmental impact. The primary intention of the research pertains to the indicators of SP and R. These indicators play a significant role in identifying policies, regulations, and practices that can be implemented in the real world to mitigate the environmental impacts caused by large-scale construction undertakings in developing nations. Ultimately, this research aims to develop a framework. Secondly, it explores the moderating influence of cost on the links between sustainable construction and regulation, regulations and the environment, and finally, between sustainable practices and the environment, as could be observed in the adopted conceptual model.

3.1. Measurement Model

The measurement framework assesses the significance of the variables in this research investigation. The inspection of the quality requirements begins with the evaluation of factor loadings [71,72], followed by the determination of construct dependability and validity.

3.1.1. The Loadings of Factors

The loading of factors denotes the degree to which each element in the matrix of correlations is associated with a specific main component. The loading of factors ranges from −1.0 to +1.0, with bigger percentages indicating a stronger association with the component and the fundamental factor [73]. All items in the investigation exhibited a factor loading of no less than 0.50 [72]. Consequently, no further items were discarded. Table 4 presents the factor’s loads.

3.1.2. Model Assessment

The findings exceeding the critical threshold of 0.5 for Cronbach’s alpha, CR, and AVE confirm dependability and convergence validity [74]. Depending on the HTMT criteria, the discriminant validity for these components could be verified [75]. Lastly, the evaluation of the initial two outcomes tackles the structure of the model. The investigation will evaluate the structural model, including the importance and significance of the pathway values, Q2, and PLS prediction [76].

3.1.3. Indicator Multicollinearity

The Variance Inflation Factor (VIF) has to be employed to assess multicollinearity among the indicators [66]. Hair et al. assert that multicollinearity is not a significant concern if the value of the VIF is under 5 [72]. Table 5 displays the VIF values for the study’s indicators, indicating that every single indicator’s VIF is under the suggested level.

3.1.4. Reliability Analysis

Mark defines dependability as the degree to which measuring equipment consistently produces identical data upon repeated administration [77,78]. The two predominant approaches for assessing reliability are Cronbach’s alpha and composite reliability (CR). Table 6 presents the findings for both Cronbach’s alpha and composite reliability. Cronbach’s alpha varied between 0.758 and 0.905, while the composite reliability statistics ranged from 0.857 to 0.933. Both reliability indicators provide reliability statistics above the requisite level of 0.70 [76]. Therefore, the construct of dependability is demonstrated, as illustrated in Table 6 below.
  • Construct Validity
Convergent validity and discriminant validity in PLS-SEM confirm construct validity.
  • Convergent Validity
Convergent validity refers to the extent to which various measures of an identical construct yield consistent results. Multiple measurements of the exact same construct should yield high values if they can be considered excellent indicators of the concept [79]. Fornell and Larcker (1981) confirm item coverage for assessing the underlying construct and establishing convergent validity when the AVE value meets or exceeds the suggested threshold of 0.50 [69]. The convergent validity outcomes, as indicated by the AVE statistics in this study, demonstrate that all constructs possess an AVE value exceeding 0.50. Therefore, convergent validity is confirmed. Table 7 presents the AVE values for every construct.
  • Discriminant Validity
Discriminant validity refers to the extent to which the measures of disparate ideas are distinctive. The premise suggests that when two or more concepts are distinct, the appropriate measures for each should show a low correlation [79]. The values are presented in Table 8.
  • Fornell and Larker Criteria
Fornell and Larcker’s criterion confirms discriminant validity when the square root of the Average Variance Extracted (AVE) for a construct surpasses its correlations with all other constructs [75]. This research determined that the square root of AVE (in bold italics) for a construct exceeds its connection with other constructs. Therefore, it offers robust evidence for the establishment of discriminant validity.

3.2. Cross Loadings

Cross-loadings evaluate whether an item associated with a certain construct predominantly loads onto its own construct rather than onto other constructs in the study. The results (Table 9) indicate that the factor loading of all items is more robust on their respective underpinning constructs than on any other constructs in the study [80]. Consequently, the assessment of cross-loadings confirms the achievement of discriminant validity.

Heterotrait–Monotrait Ratio (HTMT)

HTMT relies on the assessment of the relationship among the constructs. The HTMT ratio determines discriminant validity [81,82]. Table 10 clearly shows that the HTMT value falls below the acceptable threshold value of 0.90.

4. Discussion

The findings of this investigation are analyzed and elucidated, and the mechanisms underlying the hypotheses are outlined. The results, together with their ramifications and future directions, are presented thereafter.

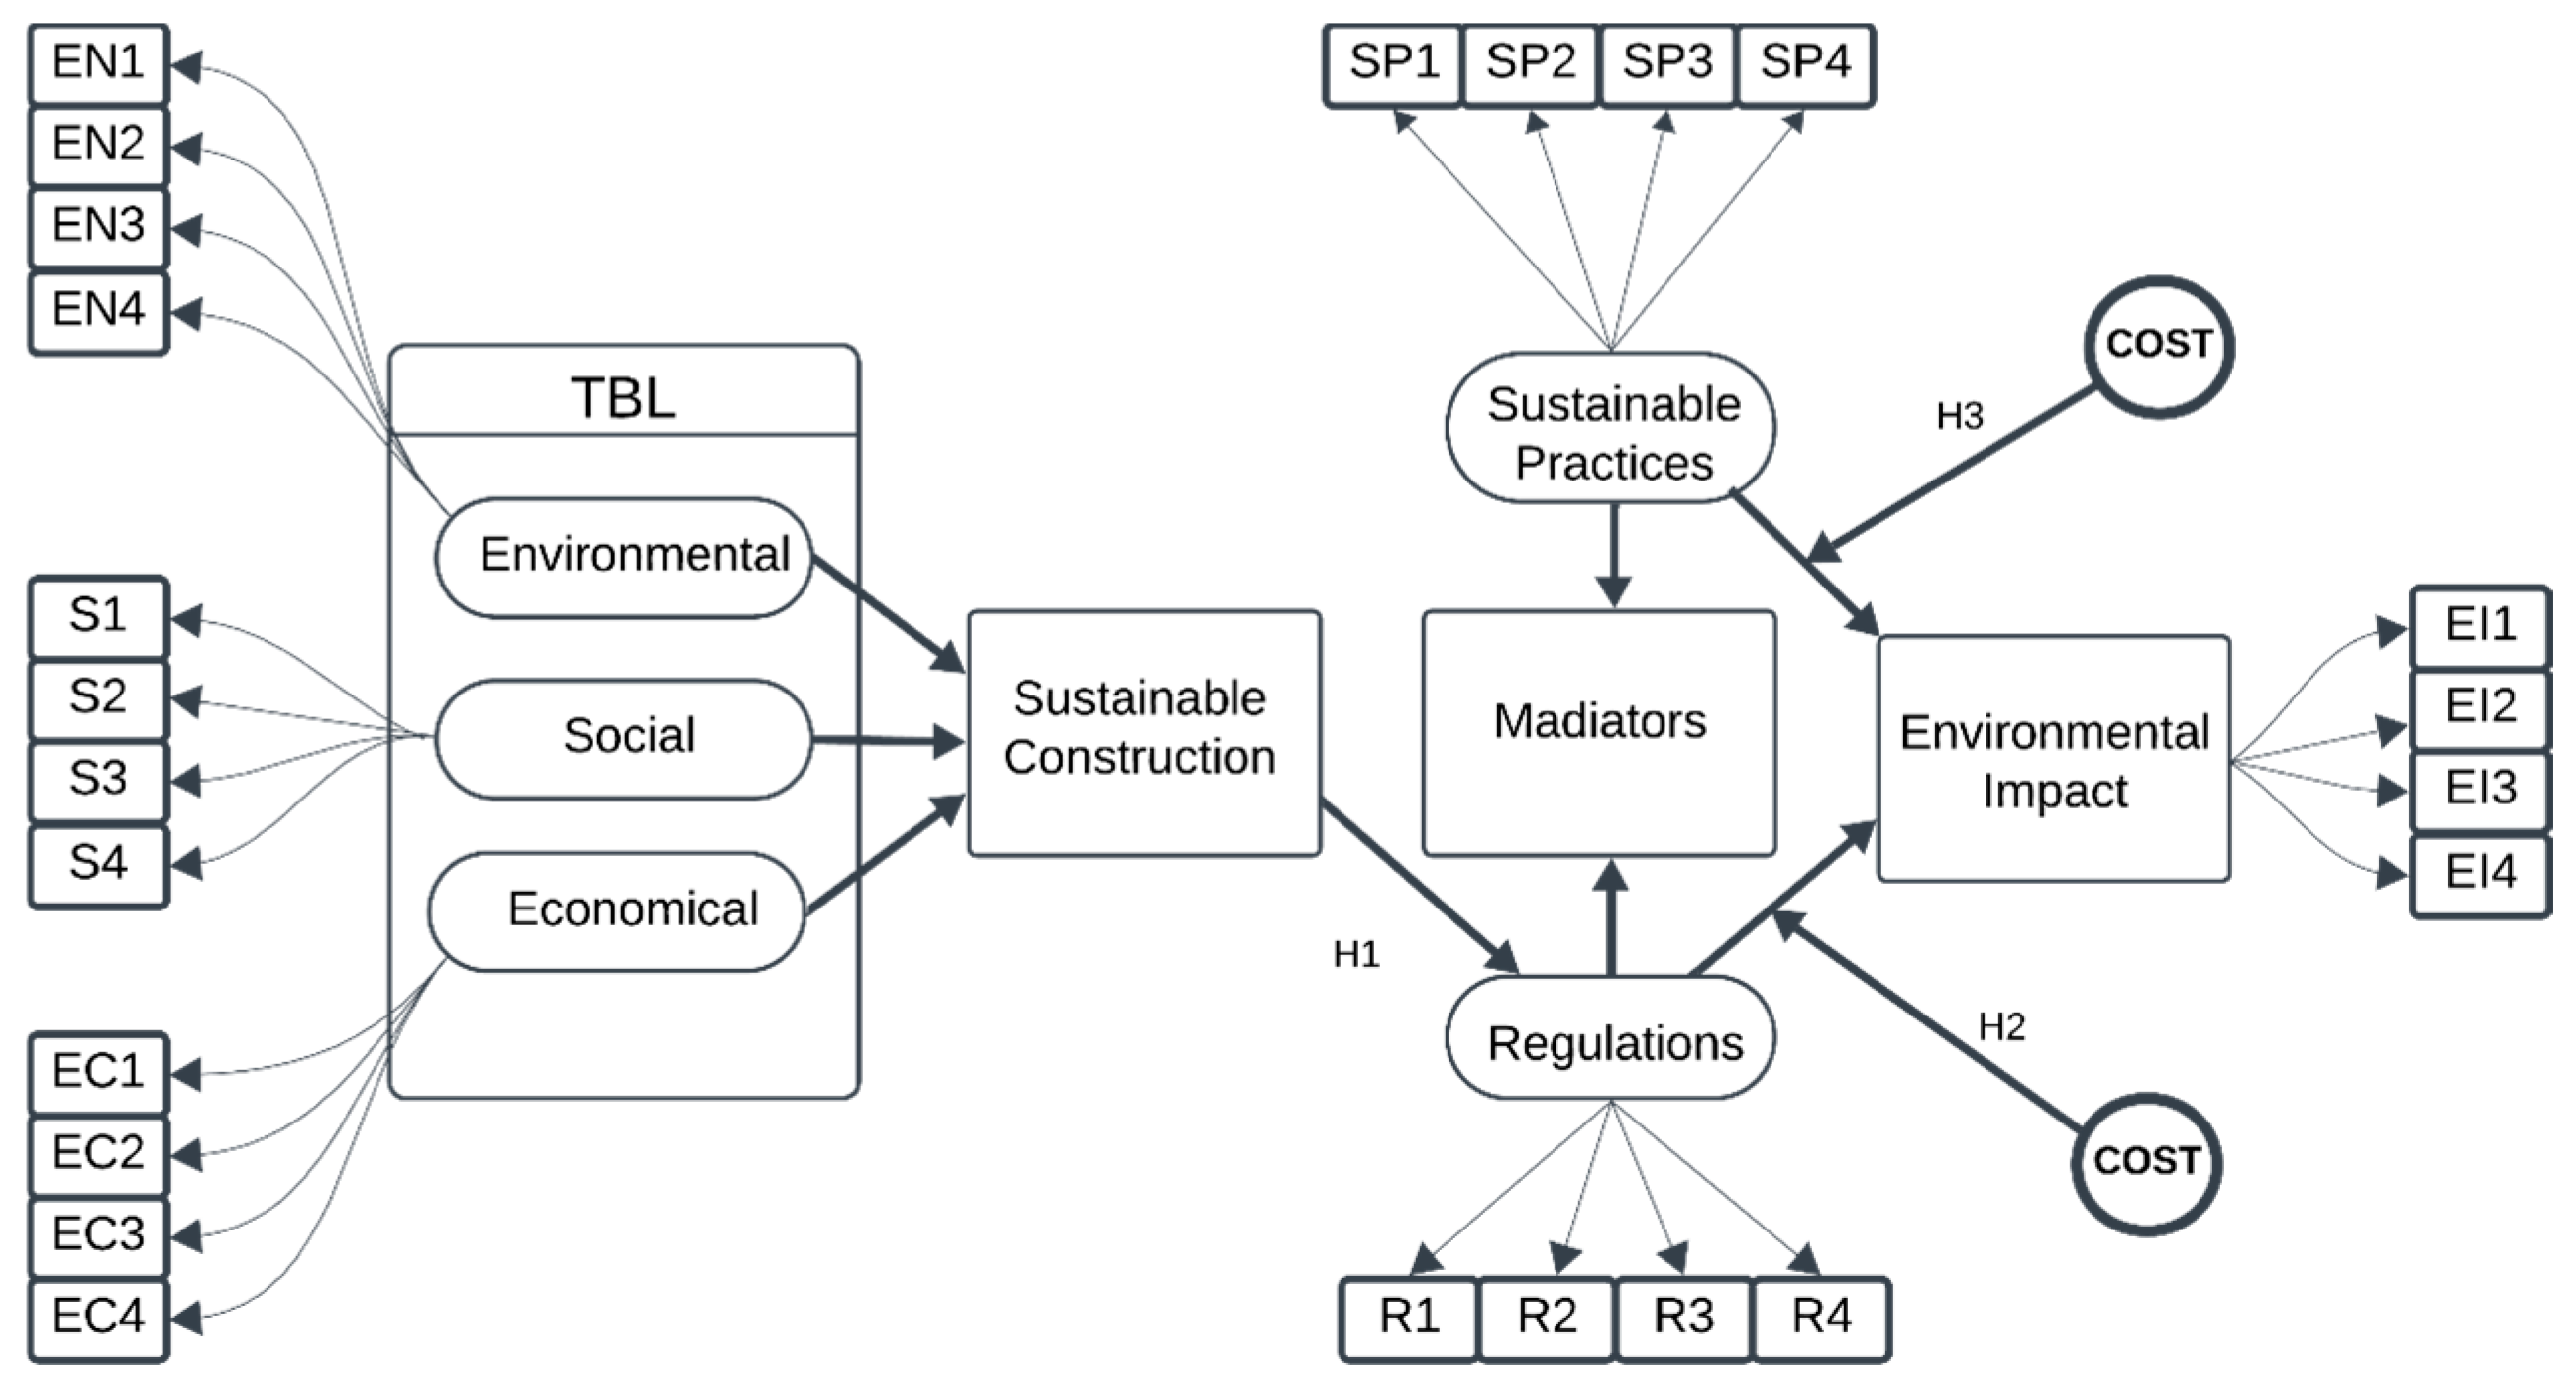
4.1. Direct Relationship Results of Hypothesis H1

As can be seen in Table 11, the result reveals a direct significant influence of Sustainable Construction (S_C) on Regulations (R) with (β = 0.324, t = 4.279, p < 0.001). Following this, hypothesis H1 has been proven to be correct that sustainable construction is strongly linked to regulations.

4.2. Moderation Analysis Result of Cost-Hypothesis Test H2

COST x R -> EI

Cost adversely tempered the positive correlation between regulations (R) and environmental and ecological balance (EI), with heightened costs diminishing the link between R and EI.
Without the moderating impact (COST*R), the R-squared value for EI was 0.555. This indicates that R accounts for 55.5% of the variation in EI. The incorporation of the interaction term elevated the R-squared to 67.4%. The dependent variable (EI) explains an increase of 11.9% in variation.
The moderating effect analysis showed that COST had a strong and negative effect on the relationship between R and EI (b = −0.486, t = 10.522, p < 0.000), as shown in Table 11. This indicates that an increase in cost diminished the link between R and EI. Table 12 displays the summary of the moderation analysis.
Figure 4 illustrates the characteristics of the moderating effects through slope analysis. The slope is significantly steeper for low cost (blue slope), indicating that, at inexpensive prices, the impact of R on EI is considerably greater than at high expenses (orange slope). At elevated costs, the rise in R does not correspondingly affect the EI. In summary, elevated costs diminish the correlation between R and EI.
The F-square effect size was 0.318. Cohen’s (1988) framework posits that effect sizes of 0.02, 0.15, and 0.35 represent minor, medium-sized, and high moderation effects, respectively [83,84]. Consequently, the model establishes a significant negative moderating effect, indicating that COST diminishes the link between regulations (R) and EI. This conclusion substantiates hypothesis H2, which suggests that cost significantly weakens the relationship between regulation (R) and environmental impact (EI).

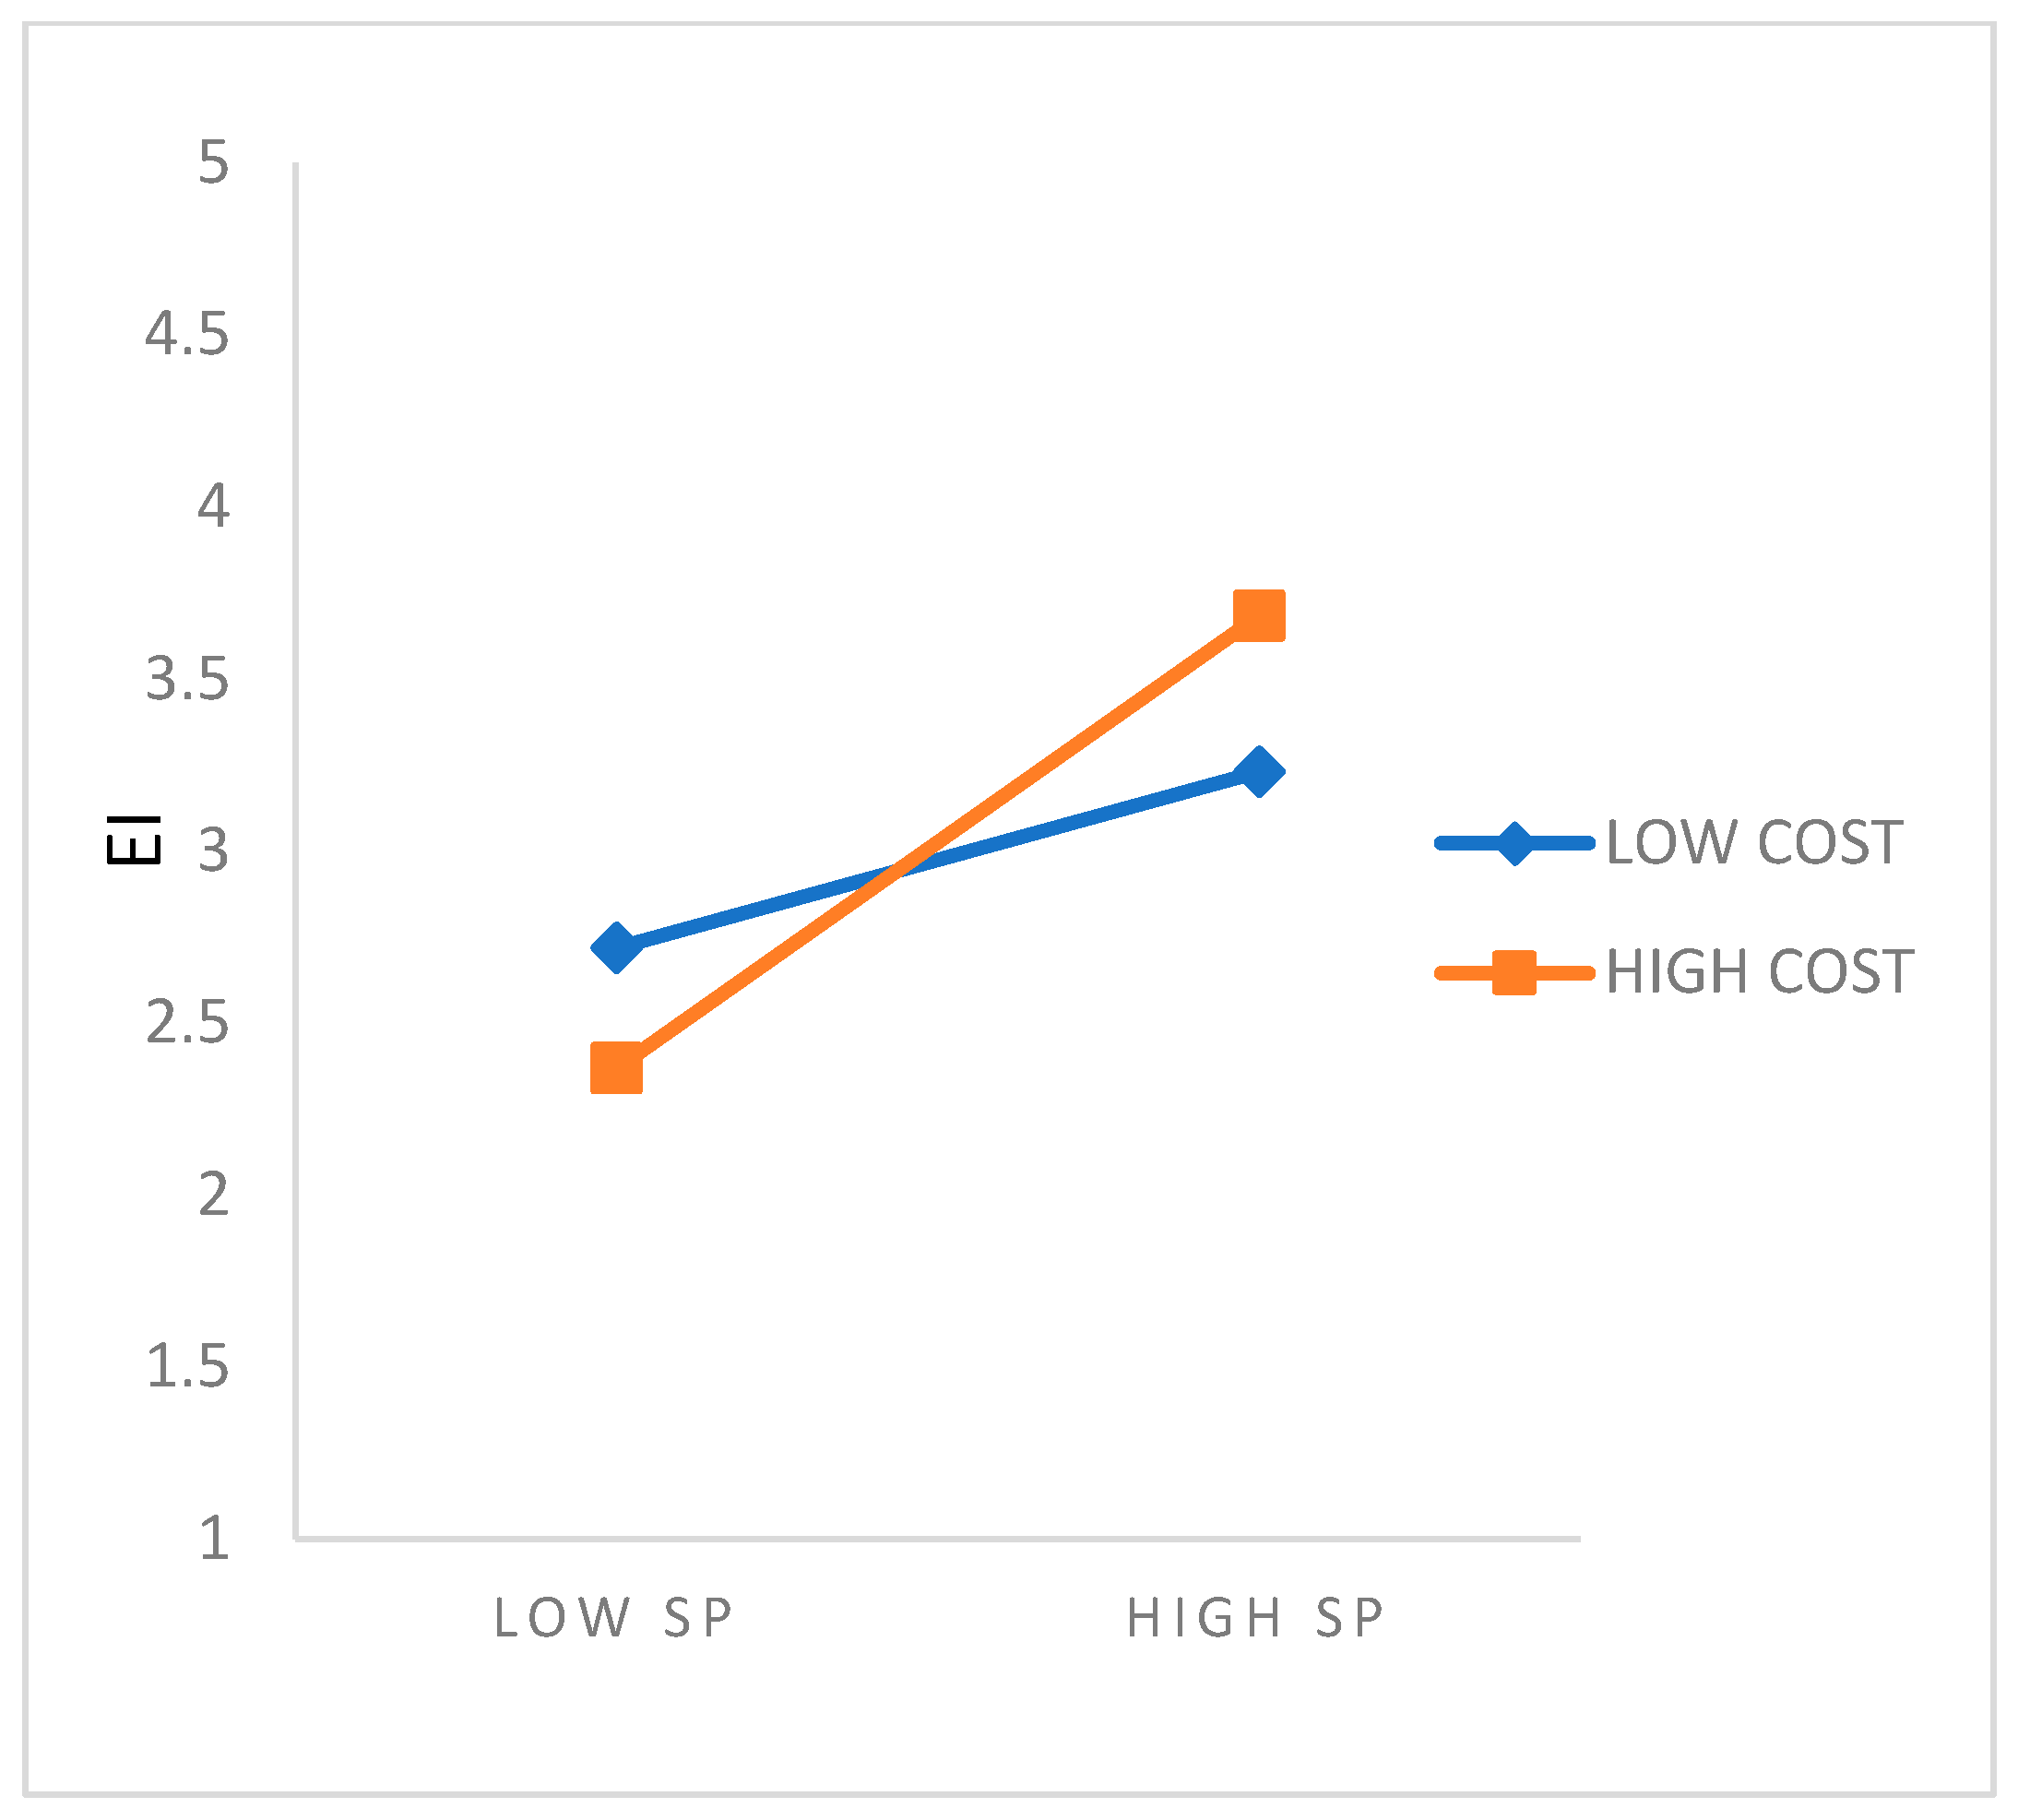
4.3. Moderation Analysis Result of Cost-Hypothesis Test H3

COST x SP -> EI

Cost improved the connection between SP and EI. The rise in cost reinforced the connection between SP and EI.
The analysis of the moderator’s impact indicated a positive and significant influence of COST on the association between SP and EI (b = 0.201, t = 5.341, p < 0.000). This indicates that when costs rise, the correlation between SP and EI intensifies. Table 13 displays the summary of the moderation analysis.
Figure 5 illustrates the slope assessment to shed light on the moderating effects’ characteristics. The slope is nearly linear at low cost (blue slope), suggesting that the impact of SP on EI is less than at high cost (orange slope). At elevated costs, the rise in SP results in a corresponding alteration in the EI due to the more acute slope. In summary, elevated expenses reinforce the correlation between SP and EI.
The F-Square effect size measured 0.059. Cohen’s (1988) framework designates 0.02, 0.15, and 0.35 as the low, medium, and high effect sizes of moderation, respectively [83,84,85]. This indicates that the moderating effect is minimal. Thus, the model establishes a minor positive moderation effect, indicating that COST enhances the link between SP and EI, but the effect magnitude is minimal. Consequently, hypothesis H3 is incorrect.
The rise in expenses did not diminish the correlation between sustainable practices and environmental impact. The rise in cost reinforced this link.
This research evaluates how COST moderates the relationship between sustainable practices and the environment, as well as between regulations and the environment. It also identifies indicators of sustainable practices and regulations and quantifies the strength of their relationships with these constructs. Additionally, it offers a framework of norms and laws for prospective implementation. The subsequent practices and restrictions are outlined below:

4.4. Sustainable Practices (SP)

The mediating variables’ indicators have significant factors of influence, as can be observed in Table 4. This means they are strongly recommended for adoption in observing sustainable practices. The contribution is novel in the context of this study. The sustainable practices revealed in this study are as follows:
  • Establishing both strategic and tactical sustainability objectives (SP1)
This indicator possesses a substantial influencing effect of 0.857 on sustainable practices. Establishing both strategic and tactical goals for sustainability as a sustainable practice will significantly influence the mediating role of sustainable practices in mitigating the ecological impact; therefore, there is a need to devote considerable attention to this indicator as a practice.
2.
Designing projects with a focus on sustainability (SP2)
Designing projects with a focus on sustainability plays a significant role, as this indicator has a significant factor of 0.902, indicating its effect on mediation as a practice in attaining environmental impact mitigation.
3.
Establishing sustainable policies (by project hosts) (SP3)
This indicator had an influence factor of 0.724, which means that having project hosts establish policies of sustainability would significantly play a mediating role in enhancing the impact and relationship between sustainable construction and environmental impact.
4.
Project behaviors that affect sustainability (SP4)
This indicator had a very significant influence factor of 0.749, which means that attention should be given to project behaviors that affect sustainability, as this would significantly play a mediating role in enhancing the impact and the link across sustainable construction and environmental/ecological balance.

4.5. Regulations (R)

The same for the regulations construct, R indicators have significant factors of influence in relation to it as a mediating variable. The following have been revealed as effective regulations in achieving impact mitigation:
  • Setting a standard for future design and construction (R1)
This indicator has a significant factor of 0.777; this implies that setting a standard for future design and construction as one of the strategies for mediation of sustainable construction on environmental impact could be ideal.
2.
Building regulations (R2)
This indicator has a significant influence factor of 0.883, implying that building regulations have a significant role as one of the industry regulations.
3.
Government policies and regulations (R3).
Government policies and regulations significantly factored at 0.894, implying that having government policies and regulations further enhances the mediation role of industry regulations.
4.
Increased education and training (R4)
Increased education and training factored at 0.864, implying its level of influence in playing the role of mediation as a component of industrial regulations to enhance the ultimate relationship and influence of sustainable construction and environmental impact.
The investigation’s results provide novel and significant discoveries, as well as a framework for mitigating environmental impact in megaproject sustainability initiatives. Most importantly, it provides a template of potential regulations and sustainable practices for adoption.
The utilization of the research outcomes and the standardized conceptual model will aid in mitigating the environmental consequences associated with megaprojects. Additionally, these outcomes will contribute to the knowledge base of professionals, offer guidance to policymakers, and inform environmental regulatory authorities in developing nations. Ultimately, this will facilitate the implementation of sustainable and environmentally friendly practices in these nations.
This study further utilizes megaprojects with project impact for research that degrades natural resources and presents a novel methodological approach to this subject, using scientometric/bibliometric techniques and cluster analysis. Previous studies in this field had deficiencies in their methodological techniques. Despite using the scientific metric approach, other megaproject studies have different contexts and goals [86]. In contrast to other studies, this study considers cost as a barrier as it acts as a moderator, whereas other studies on innovation in megaprojects see the complexity of projects as a barrier [87]. Therefore, this work is novel and constitutes a significant enhancement. It contributes a construct of cost as a moderator, alongside the mediating constructs of sustainable practices and regulations. There is also a list of indicators for the two mediating constructs, and this study looks at how they relate to each other and what happens when cost plays a role in the relationship between these two mediating constructs and environmental impact. The outcomes in this context are novel too. This paper gives a framework of the best indicators for sustainable practices (SP), which are SP1, SP2, SP3, and SP4, and the regulations, which are R1, R2, R3, and R4. Consequently, practitioners and environmental regulatory agencies can use this framework to reduce the negative effects on the environment and include them in rules. This study’s new concepts and findings are unprecedented in the setting they inhabit and represent a substantial contribution.
However, it is vital to note that this study has limitations due to its exclusive focus on Zambia and other underdeveloped nations. Hence, it is plausible that the results might vary across different nations and that further studies could be conducted in these nations, developing nations included. For future directions, researchers may consider increasing the sample size, as well as taking more megaprojects into account, targeting particular megaprojects as study cases, finding more mediating and moderating constructs, and testing the influence of cost on other links.

5. Conclusions

The current study makes a scholarly investment in the domain of megaproject sustainability, an innovation of regulations and policies to mitigate environmental impacts in developing countries. The present research introduces a pool of comprehensive indicators for assessing the sustainability of megaprojects based on the triple bottom line (TBL), for sustainable practices (SP), regulations (R), cost (C), and environmental impact (EI). Most importantly, this study focuses on the indicators of sustainable practices and regulations and evaluates the influence of cost on the links between sustainable practice (SP) and environmental impact (EI), and that of regulations (R) and environmental impact (EI). Consequently, this study employs a model to quantify the strength of megaproject sustainability indicators, sustainable practices (SP), regulations (R), cost (C), and environmental impact (EI). This research provides the first quantification of the impact of these indicators on their respective variables in playing the mediating role between sustainable construction and environmental impact.

Author Contributions

L.M.: providing research ideas, project funding, validation, approval, project overseeing; J.M.: Project overseeing and administration, conceptualization, methodology, visualization, resources, data acquiring and curation, writing, and editing; A.A.: software, resources, methodology. All authors have read and agreed to the published version of the manuscript.

Funding

This research was funded by the Hainan Province Social Science Planning Research funding Project (NO.HNSK(YB)24-14) and the 2025 Hainan Provincial Key Discipline Construction Project—Business Administration.

Institutional Review Board Statement

This study was conducted in accordance with the Declaration of Helsinki and approved by the Ethics Committee of Dalian University of Technology (protocol code 2025011 and approval number: DUTSIE250211-01).

Informed Consent Statement

Informed consent was obtained from all subjects involved in this study.

Data Availability Statement

Data utilized in this research are not considered confidential and can be available upon request.

Conflicts of Interest

The authors declare no conflicts of interest.

Abbreviations

The following abbreviations are used in this manuscript:
TBLTripple Bottom Line
EIEnvironmental Impact
SPSustainable Practices
RRegulations
CCost
SCSustainable Construction
ENEnvironmental
SSocial
ECEconomical

References

  1. Zhang, X.; Wu, Y.; Shen, L.; Skitmore, M. A prototype system dynamic model for assessing the sustainability of construction projects. Int. J. Proj. Manag. 2014, 32, 66–76. [Google Scholar] [CrossRef]
  2. Ofori, G. Challenges of construction industries in developing countries: Lessons from various countries. In Proceedings of the 2nd International Conference on Construction in Developing Countries: Challenges Facing the Construction Industry in Developing Countries, Gaborone, Botswana, 15–17 November 2000; pp. 15–17. [Google Scholar]
  3. Ofori, G. Greening the construction supply chain in Singapore. Eur. J. Purch. Supply Manag. 2000, 6, 195–206. [Google Scholar] [CrossRef]
  4. Ofori, G. Nature of the construction industry, its needs and its development: A review of four decades of research. J. Constr. Dev. Ctries. 2015, 20, 115. [Google Scholar]
  5. Sfakianaki, E. Critical success factors for sustainable construction: A literature review. Manag. Environ. Qual. Int. J. Int. J. 2018, 30, 176–196. [Google Scholar]
  6. James, P.; Matipa, W.M. Sustainable construction in a developing country: An assessment of how the professional’s practice impact the environment. In Proceedings of the 20th Annual ARCOM Conference, Heriot Watt University, Edinburgh, UK, 1–3 September 2004; pp. 1–3. [Google Scholar]
  7. Chin, W.W. The Partial Least Squares Approach for Structural Equation Modelin. In Modern Methods for Business Research; Psychology Press: Melbourne, Australia, 1998. [Google Scholar]
  8. United Nations Development Programme. Assessment of Development Results: Evaluation of UNDP Contribution; United Nations Publications: Georgetown, Guyana, 2010. [Google Scholar]
  9. Üllenberg, A.; Minah, M.; Rauch, T.; Richter, D. Zambia: Towards Inclusive and Sustainable Rural Transformation; Albrecht Daniel Thaer-Institut für Agrar-und Gartenbauwissenschaften: Berlin, Germany, 2017. [Google Scholar]
  10. Oke, A.; Aghimien, D.; Aigbavboa, C.; Musenga, C. Drivers of sustainable construction practices in the Zambian construction industry. Energy Procedia 2019, 158, 3246–3252. [Google Scholar] [CrossRef]
  11. Marsh, R.J.; Brent, A.C.; de Kock, I.H. Understanding the barriers and drivers of sustainable construction adoption and implementation in South Africa: A quantitative study using the Theoretical Domains Framework and COM-B Model. J. S. Afr. Inst. Civ. Eng. 2021, 63, 11–23. [Google Scholar] [CrossRef]
  12. Goel, A.; Ganesh, L.S.; Kaur, A. Deductive content analysis of research on sustainable construction in India: Current progress and future directions. J. Clean. Prod. 2019, 226, 142–158. [Google Scholar] [CrossRef]
  13. Boons, F.; Lüdeke-Freund, F. Business models for sustainable innovation: State-of-the-art and steps towards a research agenda. J. Clean. Prod. 2013, 45, 9–19. [Google Scholar]
  14. Thounaojam, N.; Laishram, B. Issues in promoting sustainability in mega infrastructure projects: A systematic review. J. Environ. Plan. Manag. 2021, 65, 1349–1372. [Google Scholar] [CrossRef]
  15. Chawla, V.; Chanda, A.; Angra, S.; Chawla, G. The sustainable project management: A review and future possibilities. J. Proj. Manag. 2018, 3, 157–170. [Google Scholar] [CrossRef]
  16. Gan, X.; Zuo, J.; Ye, K.; Skitmore, M.; Xiong, B. Why sustainable construction? Why not? An owner’s perspective. Habitat Int. 2015, 47, 61–68. [Google Scholar] [CrossRef]
  17. Chang, R.D.; Soebarto, V.; Zhao, Z.Y.; Zillante, G. Facilitating the transition to sustainable construction: China’s policies. J. Clean. Prod. 2016, 131, 534–544. [Google Scholar] [CrossRef]
  18. Iqbal, M.; Ma, J.; Ahmad, N.; Hussain, K.; Usmani, M.S. Promoting sustainable construction through energy-efficient technologies: An analysis of promotional strategies using interpretive structural modeling. Int. J. Environ. Sci. Technol. 2021, 18, 3479–3502. [Google Scholar] [CrossRef]
  19. Du, C. Plessis and others. Agenda 21 for sustainable construction in developing countries. CSIR Rep. BOU E 2002, 204, 2–5. [Google Scholar]
  20. Kumar, B.S.C.; Gupta, S.K. Sustainable Construction Management. Int. J. Appl. Eng. Res. 2014, 9, 17115–17126. [Google Scholar] [CrossRef]
  21. Bardhan, S. Assessment of water resource consumption in building construction in India. WIT Trans. Ecol. Environ. 2011, 144, 93–101. [Google Scholar] [CrossRef]
  22. Arif, M.; Bendi, D.; Toma-Sabbagh, T.; Sutrisna, M. Construction waste management in India: An exploratory study. Constr. Innov. 2012, 12, 133–155. [Google Scholar] [CrossRef]
  23. Francis, A.; Mahalingam, A. The impact of the lean technique of value stream mapping in Indian construction sites on reducing carbon emissions. Procedia-Soc. Behav. Sci. 2012, 27, 6–19. [Google Scholar]
  24. Mani, M.; Reddy, B.V.V. Sustainability in human settlements: Imminent material and energy challenges for buildings in India. J. Indian Inst. Sci. 2012, 92, 145–162. [Google Scholar]
  25. Antony, J.; Nair, D.G. Potential of construction and demolished wastes as pozzolana. Procedia Technol. 2016, 25, 194–200. [Google Scholar] [CrossRef]
  26. Dakwale, V.A.; Ralegaonkar, R.V. Development of sustainable construction material using construction and demolition waste. Indian J. Eng. Mater. Sci. 2014, 21, 451–457. [Google Scholar]
  27. Kumar, D.; Katoch, S.S. Environmental sustainability of run of the river hydropower projects: A study from western Himalayan region of India. Renew. Energy 2016, 93, 599–607. [Google Scholar]
  28. Darko, A.; Chan, A.P.C.; Gyamfi, S.; Olanipekun, A.O.; He, B.-J.; Yu, Y. Driving forces for green building technologies adoption in the construction industry: Ghanaian perspective. Build. Environ. 2017, 125, 206–215. [Google Scholar]
  29. Malik, S.; Fatima, F.; Imran, A.; Chuah, L.F.; Klemeš, J.J.; Khaliq, I.H.; Asif, S.; Aslam, M.; Jamil, F.; Durrani, A.K.; et al. Improved project control for sustainable development of construction sector to reduce environment risks. J. Clean. Prod. 2019, 240, 118214. [Google Scholar]
  30. Maji, I.K. Impact of clean energy and inclusive development on CO2 emissions in sub-Saharan Africa. J. Clean. Prod. 2019, 240, 118186. [Google Scholar] [CrossRef]
  31. Wang, N.; Chen, X.; Wu, G.; Chang, Y.-C.; Yao, S. A short-term based analysis on the critical low carbon technologies for the main energy-intensive industries in China. J. Clean. Prod. 2018, 171, 98–106. [Google Scholar] [CrossRef]
  32. McLennan, J.F. The Philosophy of Sustainable Design: The Future of Architecture; Ecotone Publishing: West Sacramento, CA, USA, 2004. [Google Scholar]
  33. Robichaud, L.B.; Anantatmula, V.S. Greening project management practices for sustainable construction. J. Manag. Eng. 2011, 27, 48–57. [Google Scholar]
  34. Kibert, C.J. Sustainable Construction: Green Building Design and Deliver; John Wiley & Sons: Hoboken, NJ, USA, 2016. [Google Scholar]
  35. Yılmaz, M.; Bakış, A. Sustainability in construction sector. Procedia-Soc. Behav. Sci. 2015, 195, 2253–2262. [Google Scholar] [CrossRef]
  36. Wang, G.; Wu, P.; Wu, X.; Zhang, H.; Guo, Q.; Cai, Y. Mapping global research on sustainability of megaproject management: A scientometric review. J. Clean. Prod. 2020, 259, 120831. [Google Scholar]
  37. Kibert, C.J. The Next Generation of Sustainable Construction; Taylor & Francis: Abingdon, UK, 2007. [Google Scholar]
  38. Winch, G.M. Managing Construction Projects; John Wiley & Sons: Hoboken, NJ, USA, 2009. [Google Scholar]
  39. Shinde, D.S.; Wadke, Y.; Wani, A. A Study on Sustainable Construction Practices and Management. In Proceedings of the Conference: IOP Conference, Coimbatore, India, 11–12 February 2022. [Google Scholar]
  40. Zhang, X.; Platten, A.; Shen, L. Green property development practice in China: Costs and barriers. Build. Environ. 2011, 46, 2153–2160. [Google Scholar]
  41. Rogers, P.P.; Jalal, K.F.; Boyd, J.A. An Introduction to Sustainable Development; Routledge: London, UK, 2012. [Google Scholar]
  42. Nilashi, M.; Rupani, P.F.; Rupani, M.M.; Kamyab, H.; Shao, W.; Ahmadi, H.; Rashid, T.A.; Aljojo, N. Measuring sustainability through ecological sustainability and human sustainability: A machine learning approach. J. Clean. Prod. 2019, 240, 118162. [Google Scholar] [CrossRef]
  43. Locatelli, G.; Mariani, G.; Sainati, T.; Greco, M. Corruption in public projects and megaprojects: There is an elephant in the room! Int. J. Proj. Manag. 2017, 35, 252–268. [Google Scholar]
  44. Osuizugbo, I.C.; Oyeyipo, O.; Lahanmi, A.; Morakinyo, A.; Olaniyi, O. Barriers to the adoption of sustainable construction. Eur. J. Sustain. Dev. 2020, 9, 150. [Google Scholar]
  45. Khalfan, M.; Noor, M.A.; Maqsood, T.; Alshanbri, N.; Sagoo, A. Perceptions towards sustainable construction amongst construction contractors in state of Victoria, Australia. J. Econ. Bus. Manag. 2015, 3, 940–947. [Google Scholar]
  46. Yu, L.; Wang, G.; Marcouiller, D.W. A scientometric review of pro-poor tourism research: Visualization and analysis. Tour. Manag. Perspect. 2019, 30, 75–88. [Google Scholar]
  47. Chen, C. CiteSpace II: Detecting and visualizing emerging trends and transient patterns in scientific literature. J. Am. Soc. Inf. Sci. Technol. 2006, 57, 359–377. [Google Scholar]
  48. Aria, M.; Cuccurullo, C. Bibliometrix: An R-tool for comprehensive science mapping analysis. J. Informetr. 2017, 11, 959–975. [Google Scholar]
  49. Van Eck, N.; Waltman, L. Software survey: VOSviewer, a computer program for bibliometric mapping. Scientometrics 2010, 84, 523–538. [Google Scholar]
  50. He, Q.; Wang, G.; Luo, L.; Shi, Q.; Xie, J.; Meng, X. Mapping the managerial areas of Building Information Modeling (BIM) using scientometric analysis. Int. J. Proj. Manag. 2017, 35, 670–685. [Google Scholar]
  51. Li, X.; Wu, P.; Shen, G.Q.; Wang, X.; Teng, Y. Mapping the knowledge domains of Building Information Modeling (BIM): A bibliometric approach. Autom. Constr. 2017, 84, 195–206. [Google Scholar]
  52. Synnestvedt, M.B.; Chen, C.; Holmes, J.H. CiteSpace II, visualization and knowledge discovery in bibliographic databases. AMIA Annu. Symp. Proc. 2005, 2005, 724–728. Available online: https://www.ncbi.nlm.nih.gov/pmc/articles/PMC1560567/ (accessed on 23 June 2023). [PubMed]
  53. Ohiomah, I.; Aigbavboa, C.; Thwala, W.D. An assessment on the drivers and obstacles of sustainable project management in South Africa: A case study of Johannesburg. IOP Conf. Ser. Mater. Sci. Eng. 2019, 640, 12022. [Google Scholar]
  54. Akadiri, P.O. Understanding barriers affecting the selection of sustainable materials in building projects. J. Build. Eng. 2015, 4, 86–93. [Google Scholar]
  55. Serdar, D.; Zavadskas, E.K.; Derek, T.; Audrius, B.; Ali, I. Sustainable Construction Industry in Cambodia: Awareness, Drivers and Barriers. Sustainability 2018, 10, 392. [Google Scholar] [CrossRef]
  56. Durdyev, S.; Ismail, S.; Bakar, N.F.S.A.; Darko, A. A partial least squares structural equation modeling (PLS-SEM) of barriers to sustainable construction in Malaysia. J. Clean. Prod. 2018, 204, 564–572. [Google Scholar]
  57. Munyasya, B.M.; Chileshe, N. Towards Sustainable Infrastructure Development: Drivers, Barriers, Strategies, and Coping Mechanisms. Sustainability 2018, 10, 4341. [Google Scholar] [CrossRef]
  58. Jaillon, L.; Poon, C.S. Sustainable construction aspects of using prefabrication in dense urban environment: A Hong Kong case study. Constr. Manag. Econ. 2008, 26, 953–966. [Google Scholar]
  59. Chen, J.J.; Chambers, D. Sustainability and the impact of Chinese policy initiatives upon construction. Constr. Manag. Econ. 2010, 17, 679–687. [Google Scholar]
  60. Aarseth, W.; Ahola, T.; Aaltonen, K.; Økland, A.; Andersen, B. Project sustainability strategies: A systematic literature review. Int. J. Proj. Manag. 2017, 35, 1071–1083. [Google Scholar] [CrossRef]
  61. Opoku, J.D.-G.; Agyekum, K.; Ayarkwa, J. Drivers of environmental sustainability of construction projects: A thematic analysis of verbatim comments from built environment consultants. Int. J. Constr. Manag. 2019, 22, 1033–1041. [Google Scholar]
  62. Serpell, A.; Kort, J.; Vera, S. Awareness, actions, drivers and barriers of sustainable construction in Chile. Technol. Econ. Dev. Econ. 2013, 19, 272–288. [Google Scholar]
  63. Valdes-Vasquez, R.; Klotz, L.E. Social sustainability considerations during planning and design: Framework of processes for construction projects. J. Constr. Eng. Manag. 2013, 139, 80–89. [Google Scholar]
  64. Berardi, U. Clarifying the new interpretations of the concept of sustainable building. Sustain. Cities Soc. 2013, 8, 72–78. [Google Scholar] [CrossRef]
  65. Tiwari, P.; Parikh, J. Housing paradoxes in India: Is there a solution? Build. Environ. 2000, 35, 59–75. [Google Scholar]
  66. Korytárová, J.; Hromádka, V. The economic evaluation of megaprojects—Social and economic impacts. Procedia-Soc. Behav. Sci. 2014, 119, 495–502. [Google Scholar]
  67. Varun; Sharma, A.; Shree, V.; Nautiyal, H. Life cycle environmental assessment of an educational building in Northern India: A case study. Sustain. Cities Soc. 2024, 4, 22–28. [Google Scholar] [CrossRef]
  68. Angermeier, P.L.; Karr, J.R. Ecological health indicators. Encycl. Ecol. 2018, 1, 391–401. [Google Scholar] [CrossRef]
  69. Velásquez, E.; Fonte, S.J.; Barot, S.; Grimaldi, M.; Desjardins, T.; Lavelle, P. Soil macrofauna-mediated impacts of plant species composition on soil functioning in Amazonian pastures. Appl. Soil Ecol. 2012, 56, 43–50. [Google Scholar]
  70. Scheffers, B.R.; De Meester, L.; Bridge, T.C.L.; Hoffmann, A.A.; Pandolfi, J.M.; Corlett, R.T.; Butchart, S.H.M.; Pearce-Kelly, P.; Kovacs, K.M.; Dudgeon, D.; et al. The broad footprint of climate change from genes to biomes to people. Science 2016, 354, aaf7671-11. [Google Scholar]
  71. Henseler, J.; Ringle, C.M.; Sarstedt, M. Using partial least squares path modeling in advertising research: Basic concepts and recent issues. In Handbook of Research on International Advertising; Edward Elgar Publishing: Cheltenham, UK, 2012. [Google Scholar] [CrossRef]
  72. Hair, J.J.F.; Sarstedt, M., Jr.; Matthews, L.M.; Ringle, C.M. Identifying and treating unobserved heterogeneity with FIMIX-PLS, part I–method. Eur. Bus. Rev. 2016, 28, 63–76. [Google Scholar] [CrossRef]
  73. Pett, M.A.; Lackey, N.R.; Sullivan, J.J. Making Sense of Factor Analysis an Overview of Factor Analysis. 2003. Available online: https://www.scirp.org/(S(i43dyn45teexjx455qlt3d2q))/reference/ReferencesPapers.aspx?ReferenceID=1866190 (accessed on 23 June 2023).
  74. Sarstedt, M.; Hair, J.J.F.; Ringle, C.M.; Cheah, J.-H.; Becker, J.-M. How to Specify, Estimate, and Validate Higher-Order Constructs in PLS-SEM. Aust. Mark. J. 2019, 27, 197–211. [Google Scholar] [CrossRef]
  75. Fornell, C.; Larcker, D.F. Evaluating structural equation models with unobservable variables and measurement error. J. Mark. Res. 1981, 18, 39–50. [Google Scholar] [CrossRef]
  76. Hair, J.F.; Ringle, C.M.; Sarstedt, M. PLS-SEM: Indeed a silver bullet. J. Mark. Theory Pract. 2011, 19, 139–152. [Google Scholar] [CrossRef]
  77. Fornell, C.; Bookstein, F.L. Two structural equation models, LISREL and PLS applied to consumer exit-voice theory. J. Mark. Res. 1982, 19, 440–452. [Google Scholar] [CrossRef]
  78. Marks, R.; Karkouti, E. Evaluation of the reliability of reflective marker placements. Physiother. Res. Int. 1996, 1, 50–61. [Google Scholar] [CrossRef]
  79. Bagozzi, R.P.; Yi, Y.; Phillips, L.W. Assessing construct validity in organizational research. Adm. Sci. Q. 1991, 36, 421–458. [Google Scholar] [CrossRef]
  80. Wasko, M.M.; Faraj, S. Why should I share, Examining social capital and knowledge contribution in electronic networks of practice. MIS Q. 2005, 29, 35–57. [Google Scholar] [CrossRef]
  81. Teo, T.S.H.; Srivastava, S.C.; Jiang, L. Trust and Electronic Government Success: An Empirical Study. J. Manag. Inf. Syst. 2008, 25, 99–132. [Google Scholar] [CrossRef]
  82. Kline, R.B. Principles and Practice of Structural Equation Modeling, 3rd ed.; Guilford Press: New York, NY, USA, 2023. [Google Scholar]
  83. Gignac, G.E.; Szodorai, E.T. Effect size guidelines for individual differences researchers. Personal. Individ. Differ. 2016, 102, 74–78. [Google Scholar] [CrossRef]
  84. Sawilowsky, S.S. New Effect Size Rules of Thumb. J. Mod. Appl. Stat. Methods 2009, 8, 597–599. [Google Scholar] [CrossRef]
  85. Liu, H.-Y.; Chang, C.-C. Effectiveness of 4Ps Creativity Teaching for College Students: A Systematic Review and Meta-Analysis. Creat. Educ. 2017, 8, 857. [Google Scholar] [CrossRef]
  86. Shawky, K.A.; Abdelalim, A.M.; Sherif, A.G. Standardization of BIM Execution Plans (BEP’s) for Mega Construction Projects; A Comparative and Scientometric Study. Trans. Eng. Comput. Sci. 2024, 12, 103–129. [Google Scholar] [CrossRef]
  87. Cantarelli, C.C. Innovation in megaprojects and the role of project complexity. Prod. Plan. Control 2022, 33, 943–956. [Google Scholar] [CrossRef]
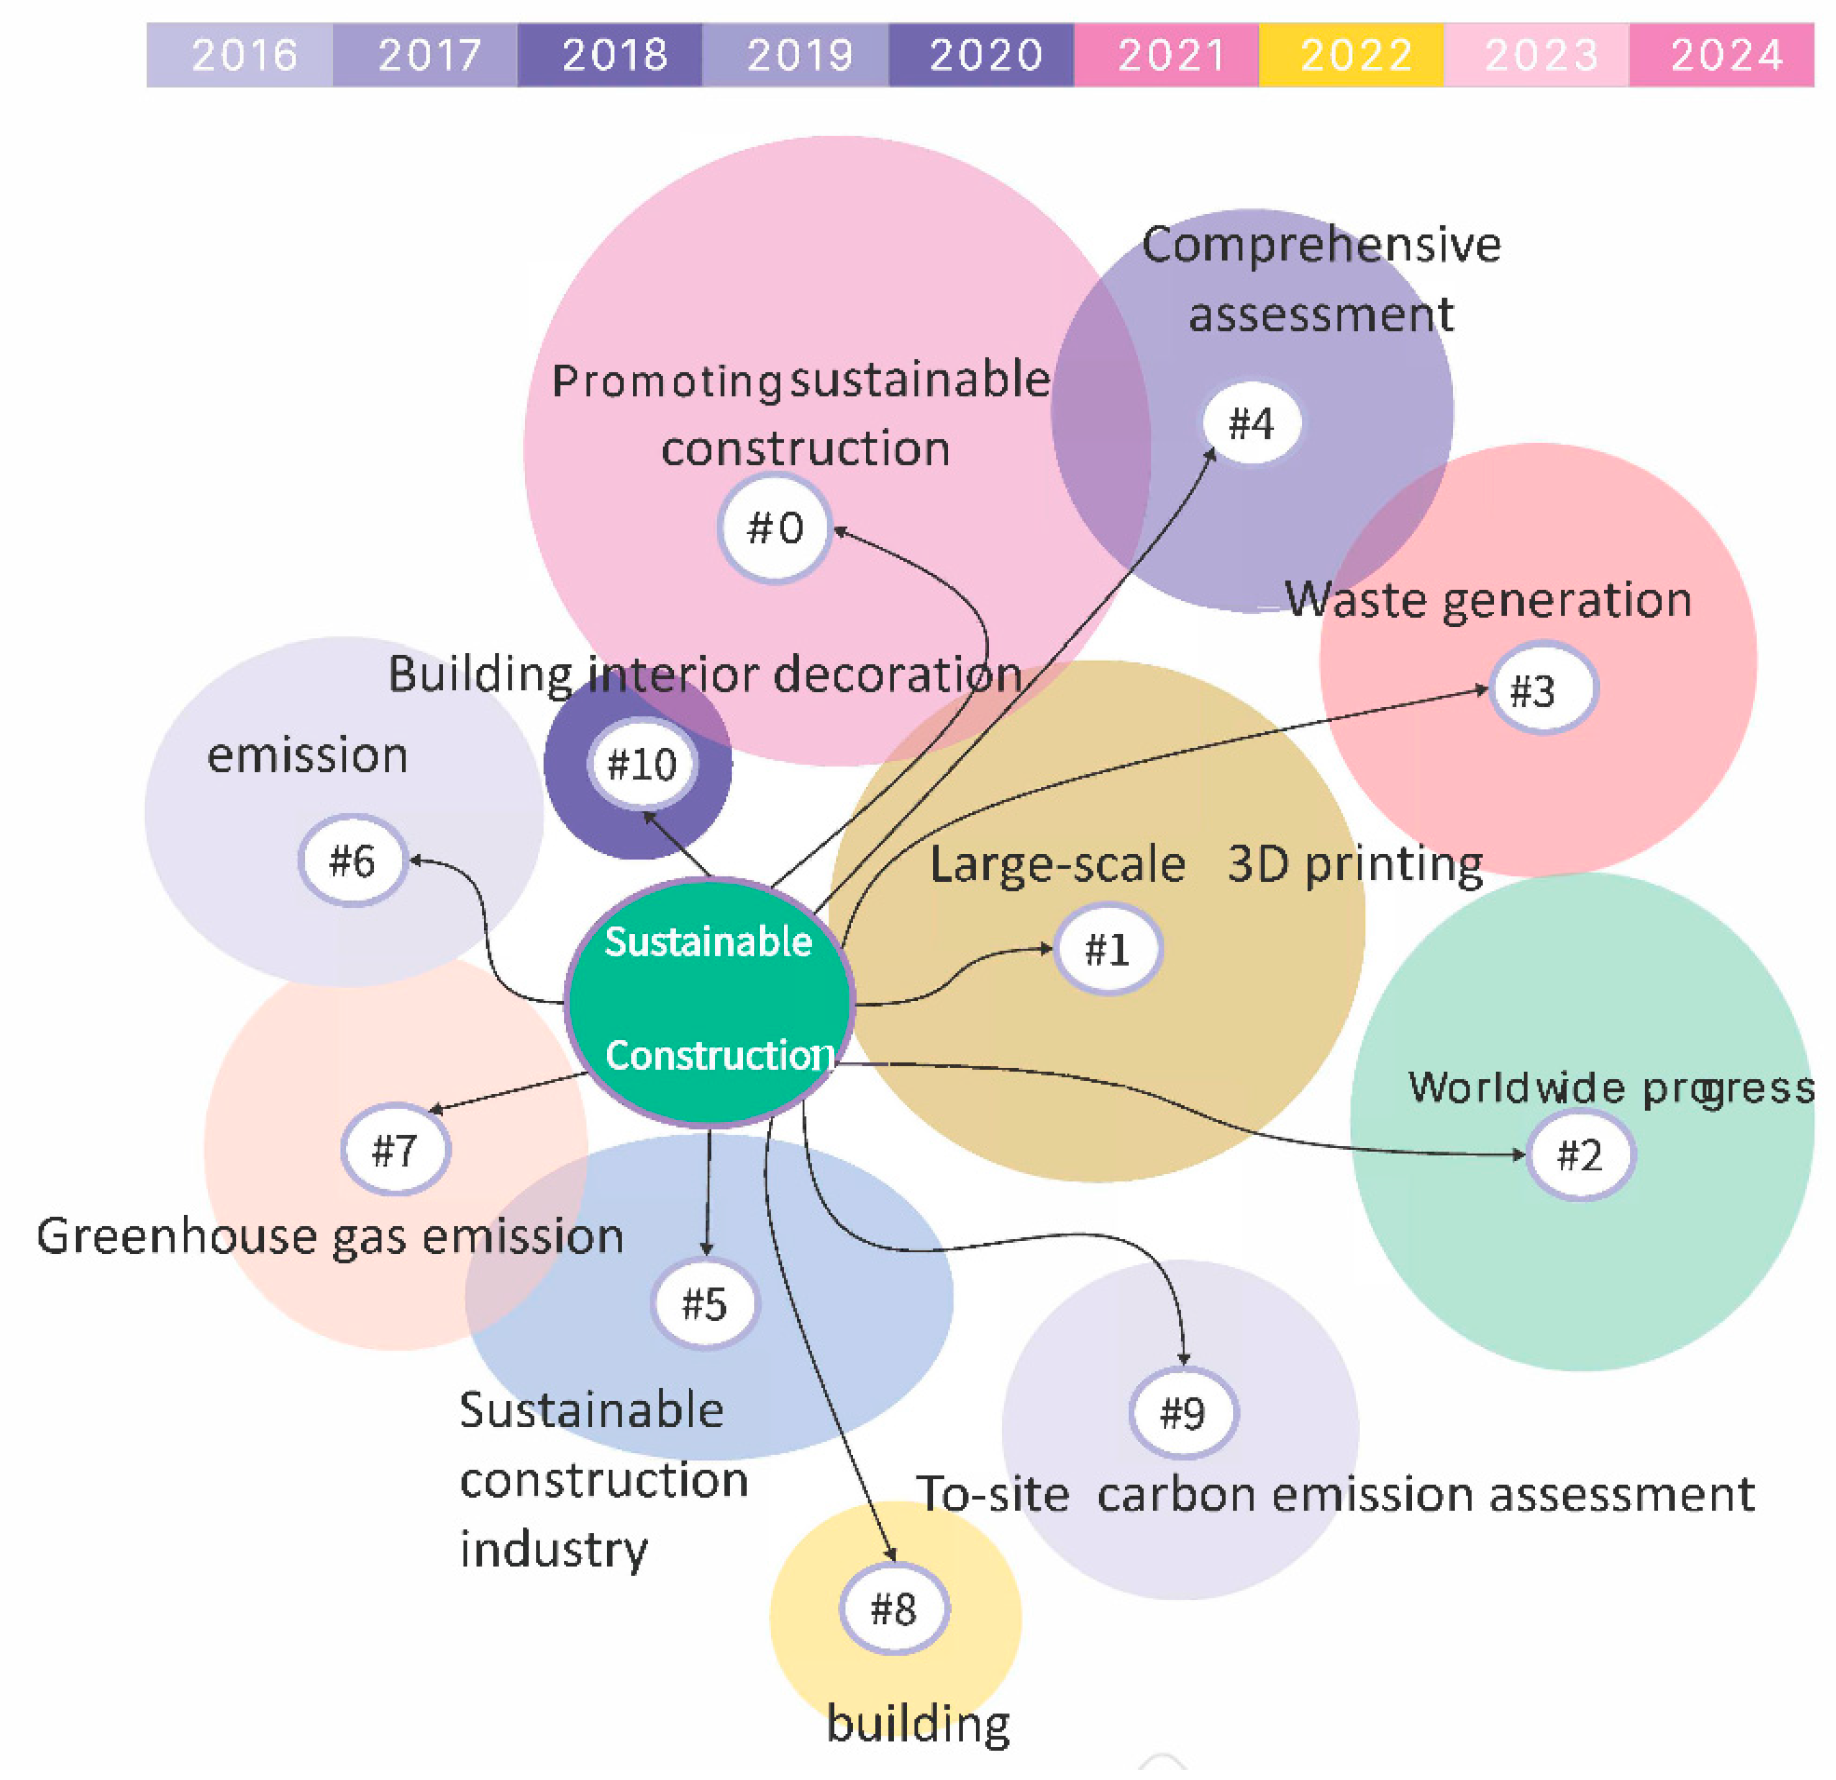
Figure 1. Conceptual model.
Buildings 15 01012 g001
Figure 2. Research flow chart.
Buildings 15 01012 g002
Figure 3. Cluster analysis.
Buildings 15 01012 g003
Figure 4. COST x R -> EI simple slope moderation analysis.
Buildings 15 01012 g004
Figure 5. COST x SP->EI Moderation Slope Analysis.
Buildings 15 01012 g005
Table 1. Definition of keyword cluster analysis.
Cluster-IDCluster Label
#0Promoting sustainable construction
#1Large-scale 3D printing
#2Worldwide progress
#3Waste generation
#4Comprehensive assessment
#5Sustainable construction industry
#6Emission
#7Greenhouse gas emission
#8Building
#9To-site carbon emission assessment
#10Building interior decoration
Table 2. The demographic details for respondents.
TitleAttributeNumberPercentage
ExperienceFrom 0 to 5 years17961.5%
From 6 to 10 years9432.3%
Over 10 years186.2%
EducationCertificate level258.6%
Technician level82.8%
Diploma level165.5%
Bachelor’s5117.5%
Masters14148.5%
Ph.D.5017.1%
Table 3. Indicators of variables used in this study.
No.FactorsCodeReferences
[53,54,55,56,57][58,59,60][61,62][28,55,56][63,64][65,66,67][68,69,70]
Social (S)
1 Social justice and equity for those who are less fortunate in society S1
2 An improvement in the standard of living, particularly for disadvantaged groups S2
3 Alleviating poverty and creating jobs S3
4 Minimizing the negative effects of construction on nearby residents and users S4
Environmental (EN)
1. Material extraction at a rate that is lower than the rate of deposit EN1
2. Life cycle analysis to reduce energy, water, land, and material consumption EN2
3. Reducing construction-related emissions EN3
4. Using environmentally safe and nontoxic materials EN4
Economical (EC)
1. Financial viability of the facility for the intended users (such as social or cheap housing) EC1
2. Enhanced profitability and competitiveness through increased output, productivity, and input reduction (resources) EC2
3. Choosing vendors and contractors who practice environmental responsibility EC3
4. Ethically sourced goods and services EC4
Sustainable Practices (SC)
1. Establishing both strategic and tactical sustainability objectives SP1
2. Designing projects with a focus on sustainability SP2
3. Establishing sustainable policies (by project hosts) SP3
4. Project behaviors that affect sustainability SP4
Ecological Balance (EI)
1. Good soil EI1
2. Good water EI2
3. Unaltered biogeochemical cycles EI3
4. Habitat preservation EI4
Industry Regulatory-Related Factors (R)
1. Setting a standard for future design and construction R1
2. Building regulations R2
3. Government policies and regulations R3
4. Increased education and training R4
COST as a Barrier to Sustainable Construction (C)
1. Traditional methods of construction are more expensive than sustainable ones C1
2. High cost is associated with sustainable buildings C2
3. Due to the perceived scarcity of sustainable materials, sustainable choices are more expensive than alternative options C3
Table 4. Factor loadings.
CECEIENRSSP
C10.803
C20.758
C30.884
EC1 * 0.697
EC2 0.832
EC3 0.858
EC4 0.886
E.I.1 0.880
E.I.2 0.897
E.I.3 0.908
E.I.4 0.841
E.N.1 * 0.573
E.N.2 0.854
E.N.3 0.822
E.N.4 0.808
R.1 0.777
R.2 0.883
R.3 0.894
R.4 0.864
S.1 0.831
S.2 0.747
S.3 0.906
S.4 0.864
SP1 0.857
SP2 0.902
SP3 0.724
* The loadings for EN1 and EC1 were slightly low. However, before considering deleting them, a rule states that if the average variance extracted (AVE) is significant, i.e., higher than 0.5, then the loading is acceptable and can be kept [74]. Hence, EN1 and EC1 loadings, regardless of being slightly low, were not deleted because the AVE values were checked and were very significant, greater than 0.5.
Table 5. Multicollinearity statistics (VIF) for indicators.
VIF
C11.682
C21.427
C31.563
EC11.645
EC21.720
EC32.237
EC42.581
EI13.049
EI23.323
EI33.600
EI42.680
EN11.319
EN21.878
EN31.742
EN41.538
R.11.843
R.22.710
R.32.812
R.42.388
S11.870
S21.906
S32.954
S42.225
SP12.367
SP23.332
SP31.424
SP41.896
Table 6. Construct reliability analysis (Cronbach alpha and composite reliability).
αCR
C0.7580.857
EC0.8430.892
EI0.9050.933
EN0.7770.853
R0.8780.916
S0.8610.904
SP0.8260.884
Table 7. Construct convergent validity (AVE).
Average Variance Extracted (AVE)
C0.667
EC0.675
EI0.778
EN0.597
R0.733
S0.704
SP0.658
Table 8. Discriminant validity: Fornell and Larcker criterion.
CECEIENRSSP
C0.817
EC0.5840.821
EI0.5670.4910.882
EN0.5710.6110.5780.772
R0.5560.5640.7090.4300.856
S0.4690.7220.4080.5960.4200.839
SP0.5550.6250.4560.3600.5520.6160.811
Note: Bold and italics represent the square root of AVE.
Table 9. Discriminant validity: cross loading values.
CECEIENRSSP
C10.8030.2870.3410.2990.3700.2710.339
C20.7580.4580.3830.3860.3320.3770.386
C30.8840.6100.5970.6260.5930.4620.573
EC10.3450.6970.1360.4490.1390.5030.363
EC20.3900.8320.3750.3610.5850.6520.618
EC30.5530.8580.4800.6630.4750.5530.464
EC40.5950.8860.5040.5580.4950.6470.548
EI10.5130.5800.8800.4970.6800.4820.472
EI20.4910.4020.8970.4660.6870.4240.453
EI30.5180.4210.9080.4950.6480.2250.340
EI40.4790.3180.8410.5900.4710.3010.337
EN10.2800.3840.1550.5730.1670.2710.186
EN20.5480.5470.4450.8540.4200.4330.381
EN30.3770.4590.4510.8220.3440.5490.264
EN40.5000.4930.6040.8080.3350.5320.253
R10.5200.4520.5150.3880.7770.2940.302
R20.4060.5530.5860.2650.8830.3050.418
R30.5560.4830.6830.3920.8940.3600.546
R40.4280.4470.6260.4270.8640.4670.589
S10.2550.6210.3370.4190.4440.8310.493
S20.3950.4380.1930.5570.0800.7470.410
S30.4630.6350.3360.5440.3430.9060.677
S40.4700.6810.4530.5210.4430.8640.450
S.P.10.6960.5920.5950.3720.5280.5420.857
S.P.20.4710.4620.4240.3190.4250.5000.902
S.P.30.2240.6380.1290.2100.3220.5680.724
S.P.40.3060.2960.2320.2340.5050.3720.749
Table 10. Discriminant validity (HTMT).
CECEIENRSSP
C
EC0.672
EI0.6480.516
EN0.6640.7610.641
R0.6470.6030.7860.497
S0.5610.8220.4430.7200.447
SP0.6280.7090.4910.4280.6320.710
Table 11. Path coefficients.
Original Sample (O)Standard Deviation (STDEV)T Statistics (|O/STDEV|)p Values
S_C -> R0.3240.0764.2790.000
COST x R -> EI−0.4860.04610.5220.000
COST x SP -> EI0.2010.0385.3410.000
Table 12. Moderation analysis (COST x R -> EI).
BetaSET—Valuesp Values
COST x R -> EI−0.4860.04610.5220.000
Table 13. Moderation analysis (COST x SP -> EI).
BetaSET—Valuesp values
COST x SP -> EI0.2010.0385.3410.000
Disclaimer/Publisher’s Note: The statements, opinions and data contained in all publications are solely those of the individual author(s) and contributor(s) and not of MDPI and/or the editor(s). MDPI and/or the editor(s) disclaim responsibility for any injury to people or property resulting from any ideas, methods, instructions or products referred to in the content.

