Article

Effect of Density and Number of Layers of Fiber Sheets and End Anchors on the Flexural Capacity of SRG-Strengthened RC Beams

by
Andrea Incerti
1,*,
Valentina Rinaldini
1,
Mattia Santandrea
2,
Christian Carloni
3 and
Claudio Mazzotti
2
1
CIRI Buildings & Construction, University of Bologna, Via del Lazzaretto 15/5, 40131 Bologna, Italy
2
Department of Civil, Chemical, Environmental, and Materials Engineering, University of Bologna, Viale Risorgimento 2, 40136 Bologna, Italy
3
Department of Civil and Environmental Engineering, Case Western Reserve University, 10900 Euclid Ave., Cleveland, OH 44107, USA
*
Author to whom correspondence should be addressed.
Buildings 2025, 15(7), 1005; https://doi.org/10.3390/buildings15071005
Submission received: 4 February 2025 / Revised: 4 March 2025 / Accepted: 17 March 2025 / Published: 21 March 2025

Abstract

:
Steel-reinforced grout (SRG) composites are a newly developed retrofitting technique, which is considered an alternative to other fiber-reinforced composites to increase the load-carrying capacity of existing structures. This work presents an experimental campaign aimed at investigating the response of reinforced concrete (RC) beams strengthened with SRG externally applied to the tension side of the member to improve flexural capacity. The number of fiber sheet layers and fiber sheet density have been varied to evaluate the effectiveness of the retrofitting system. For some beams, different solutions of anchors at the ends of the beams have been considered to delay the premature debonding of the SRG. Moreover, single-lap direct shear tests have been carried out on concrete prisms strengthened with the same SRG composite to evaluate the bond behavior of the system. Failure modes, load responses, and corresponding flexural capacity (beam tests) and debonding loads (shear tests) are reported. The moment–curvature curves derived from cross-sectional analysis are compared with the corresponding experimental curves. The strain when the loss of composite action occurs is obtained from the curvature measured experimentally and compared with the values from formulas for the strain available in the literature and the strain at debonding in single-lap shear tests.

1. Introduction

During the last few decades, newly developed composite materials have been used for the strengthening and rehabilitation of existing reinforced concrete (RC) and masonry structures. The recent seismic events that hit several European countries (e.g., Italy, Greece, and Turkey) proved the inability of most of the structures built in the previous century to withstand significant horizontal loads. At the same time, RC infrastructures, like bridges or viaducts, experienced remarkable material deterioration in the last few decades, which is coupled with a substantial load increment, mainly due to the introduction of larger and heavier trucks and vehicles in the market. As a consequence, an increasing number of structures, especially RC structures, need to be strengthened to withstand horizontal and vertical loads. Since the early 1990s, fiber-reinforced polymer (FRP) composites have been successfully used for flexural and shear strengthening of RC beams [1,2,3,4,5,6] and the confinement of columns (RC and masonry) [7,8,9,10,11] and to retrofit masonry walls subjected to horizontal actions [12,13]. Nevertheless, due to the high cost of the fibers (typically carbon, glass, or aramid) in FRPs, new composite materials have been recently developed. For example, steel-reinforced polymer (SRP) composites are a particular type of FRP that feature low-cost steel cords embedded within an organic matrix (epoxy). Both FRP and SRP systems feature ease of installation, a high strength-to-weight ratio, and durability in aggressive environments. On the other hand, their low vapor permeability and their poor behavior at high temperatures pushed researchers to seek alternative solutions, like fiber-reinforced cementitious matrix (FRCM) composites [4,14,15,16,17,18,19,20,21,22,23,24,25,26,27,28,29,30,31,32,33,34], which use an inorganic mortar as a matrix. Steel-reinforced grout (SRG) composites, which could be considered a type of FRCM, have been developed to overcome some of these drawbacks. SRG composites consist of high-strength steel cords embedded in a cementitious matrix. Early applications of steel fiber composites for strengthening RC structural members date back to about 15–20 years ago [1,2,3,4,15,16]. Only recently, further studies focused on some specific aspects of the FRCM technology, such as (1) the effect of the type of matrix and fiber on the failure mode (fiber rupture, interlaminar failure, or debonding from substrate [5,20,31,35,36]; (2) the effect of the number of layers on the capacity of the strengthened element [21,22]; and (3) different analytical approaches to investigate the relationship between the strain corresponding to debonding failure in small-scale single-lap tests specimens and the strain corresponding to the flexural capacity obtained from full-scale tests of RC beams [37,38]. In this paper, the results of an experimental campaign will be presented. It is aimed at investigating the flexural performance of RC beams strengthened with SRG characterized by different densities, the number of layers of the fiber sheet, and the types of mechanical anchors at the ends of the beam. Experimental moment–curvature curves will be compared with cross-sectional analysis predictions. Maximum fiber strain in the beam, when the loss of composite action occurs, will be determined using formulas available in the literature and compared with the results from direct shear tests. In addition, a fictitious strain at debonding will be determined from the experimentally measured curvature at failure in an attempt to consider the actual deformation of the fibers and their slip with respect to the matrix.

2. Experimental Campaign

In order to evaluate the performance of SRG-strengthened RC beams, flexural tests were carried out on RC beams externally strengthened with one or two layers of low-density fiber sheet SRG strips or one layer of a medium-density fiber sheet SRG strip without mechanical anchors (representative of most applications in Southern Europe); this set of tests was named group A in the remainder of the paper. Another set (group B in this paper) of RC beams, externally strengthened with one layer of medium-density fiber sheet SRG and different types of mechanical anchors placed at the ends (near the beam supports) of the reinforcement, was also tested. In addition, single-lap direct shear (DS) tests on SRG–concrete joints were carried out to compare the bond behavior at the small scale with the results of the beam tests.

2.1. Material Characterization

Normal-weight concrete was cast using 42.5R Portland cement CEM II [39], aggregates with a maximum size of 15 mm, and a water-to-cement ratio equal to 0.596. The average 28-day cubic compressive strength [40] was equal to 27.5 MPa with a coefficient of variation (CoV) equal to 0.12. The average splitting tensile strength at 28 days obtained from three 150 mm (diameter) × 300 mm (length) cylinders was equal to 3.3 MPa (CoV = 0.05). Five concrete cylinders were also tested according to [41] in order to evaluate the elastic modulus of concrete that was equal to 27.3 GPa (CoV = 0.06). Three-point bending tests on three 150 mm (height) × 150 mm (depth) × 600 mm (length) notched concrete prisms were performed to evaluate the Mode-I fracture energy of concrete. The net span was 450 mm. The fracture mechanics setup reported in [42,43] was used. The average value of the fracture energy was equal to 125 N/m (CoV 0.09), and it was evaluated using the work-of-fracture method [44,45,46]. All specimens in this experimental campaign, including cubes, cylinders, and prisms used for material characterization, were cast from the same batch of concrete used to cast the RC beams. Steel bar diameters used for the internal reinforcement of the beams were Ø16, Ø10, and Ø8 for longitudinal, bottom, and top bars and stirrups. Tensile tests were performed on the steel bars according to [47]. The average values of the yield strength (fy,s), tensile strength (ft,s), and ultimate strain (εu,s) are reported in Table 1 for each steel heat considered (CoV is reported within parentheses).
The SRG material consisted of steel fibers embedded in a cementitious matrix. The fibers (or cords) were arranged in the form of a unidirectional sheet made of ultra-high-strength galvanized steel cords (each cord comprised three straight filaments and two twisted filaments) fixed to a fiberglass micromesh to facilitate installation. The cross-sectional area of each cord, Acord, and the elastic modulus, Ecord, as reported by the manufacturer [48], were, respectively, 0.538 mm2 and 190 GPa. Fiber sheets with two different densities were investigated and are referred to as low-density (LD) and medium-density (MD) fiber sheets, respectively, in this paper. The LD steel fiber sheet had 0.157 cords/mm (equivalent thickness tf = 0.084 mm) and the MD steel fiber sheet had 0.314 cords/mm (equivalent thickness tf = 0.169 mm). Tensile tests were carried out on SRG coupons [27,49]. The average tensile strength and corresponding average strain were ft,SRG = 3060 MPa (CoV = 0.01) and εu,SRG = 2.15% (CoV = 0.05), respectively. SRG matrix prisms with dimensions of 40 mm (height) × 40 mm (depth) × 160 mm (length) were tested according to [50]. The average compressive strength fc,m, tensile strength ft,m, and Young’s modulus Em were equal to 40.7 MPa (CoV = 0.13), 7.6 MPa (CoV = 0.23), and 16.5 GPa (CoV = 0.02).

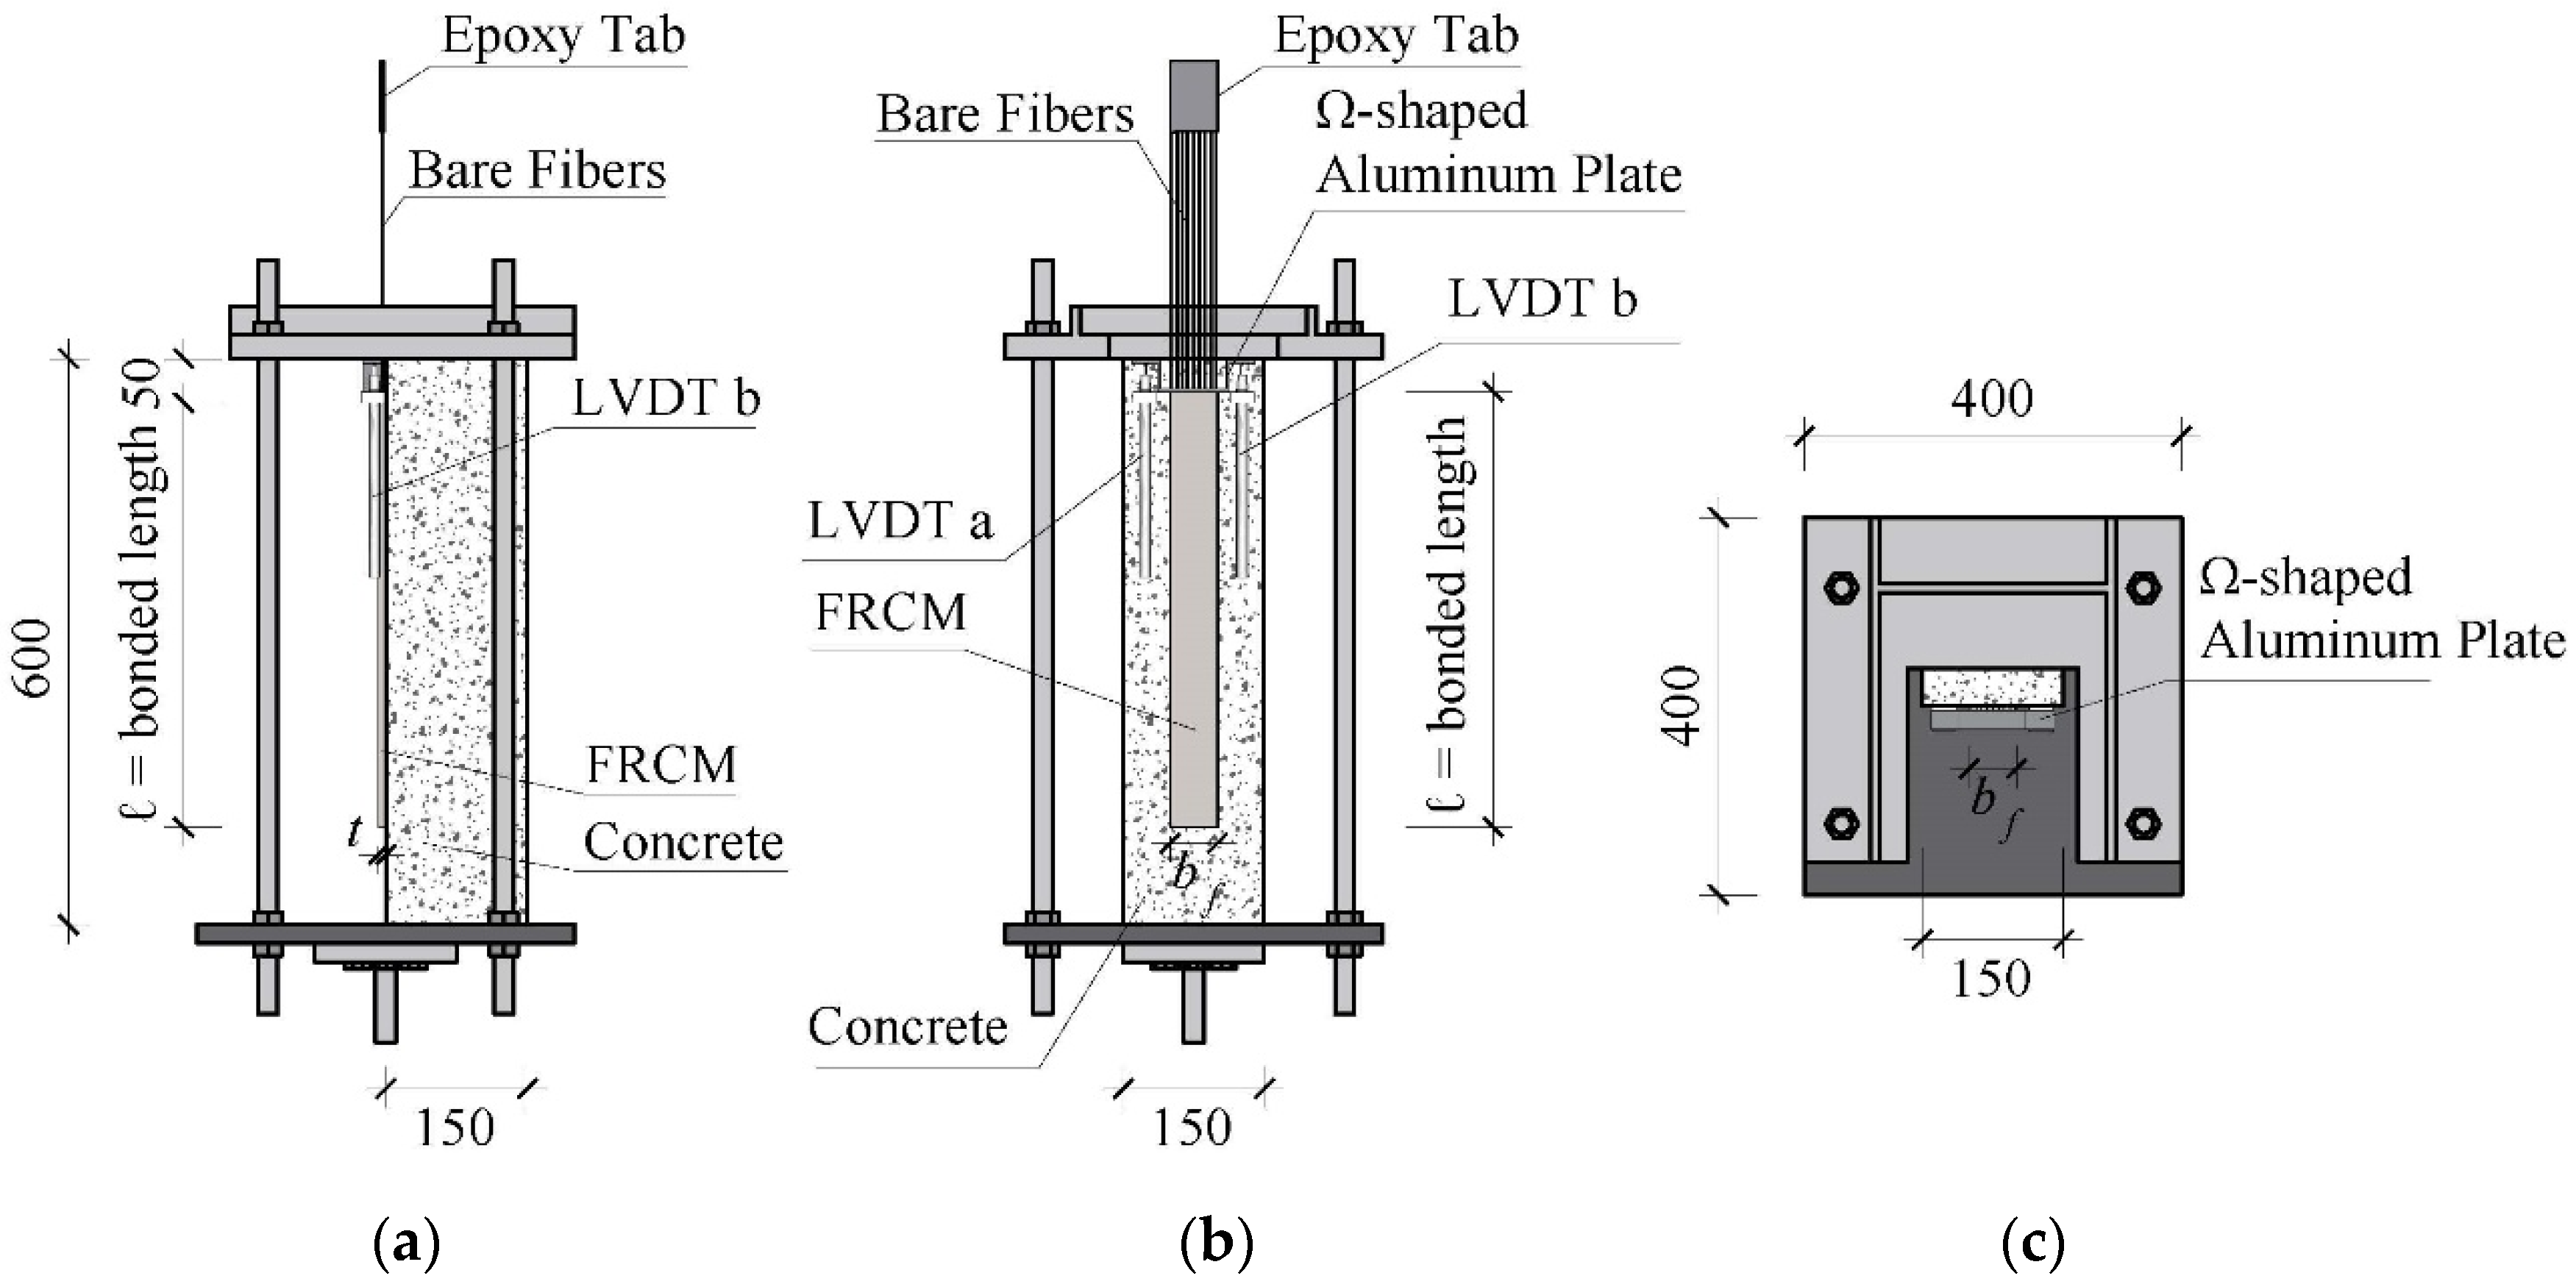
2.2. Direct Shear Tests
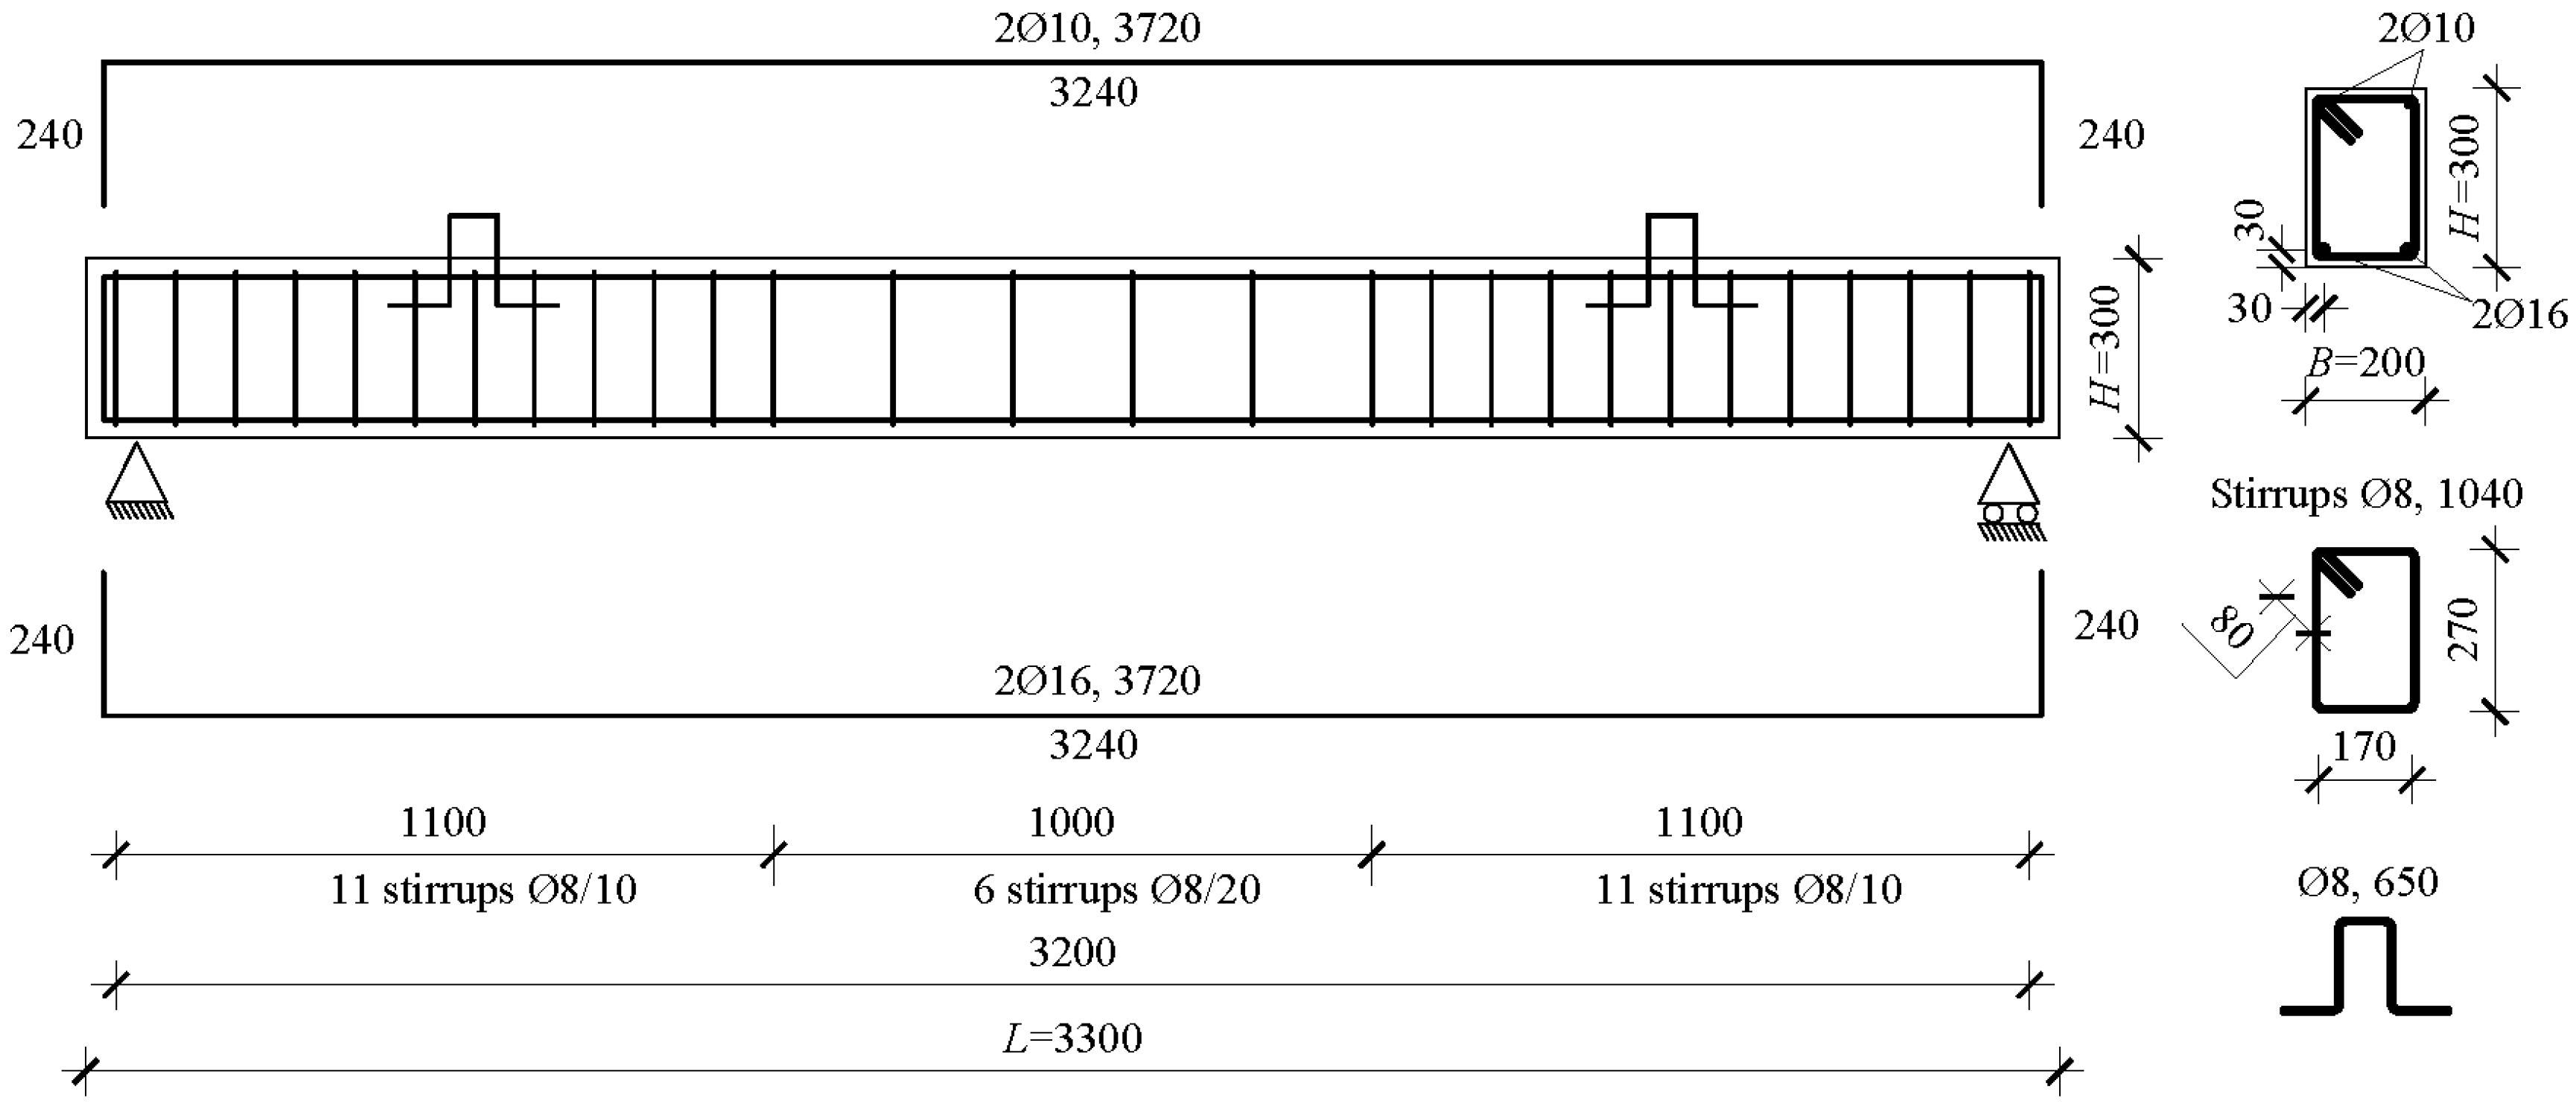
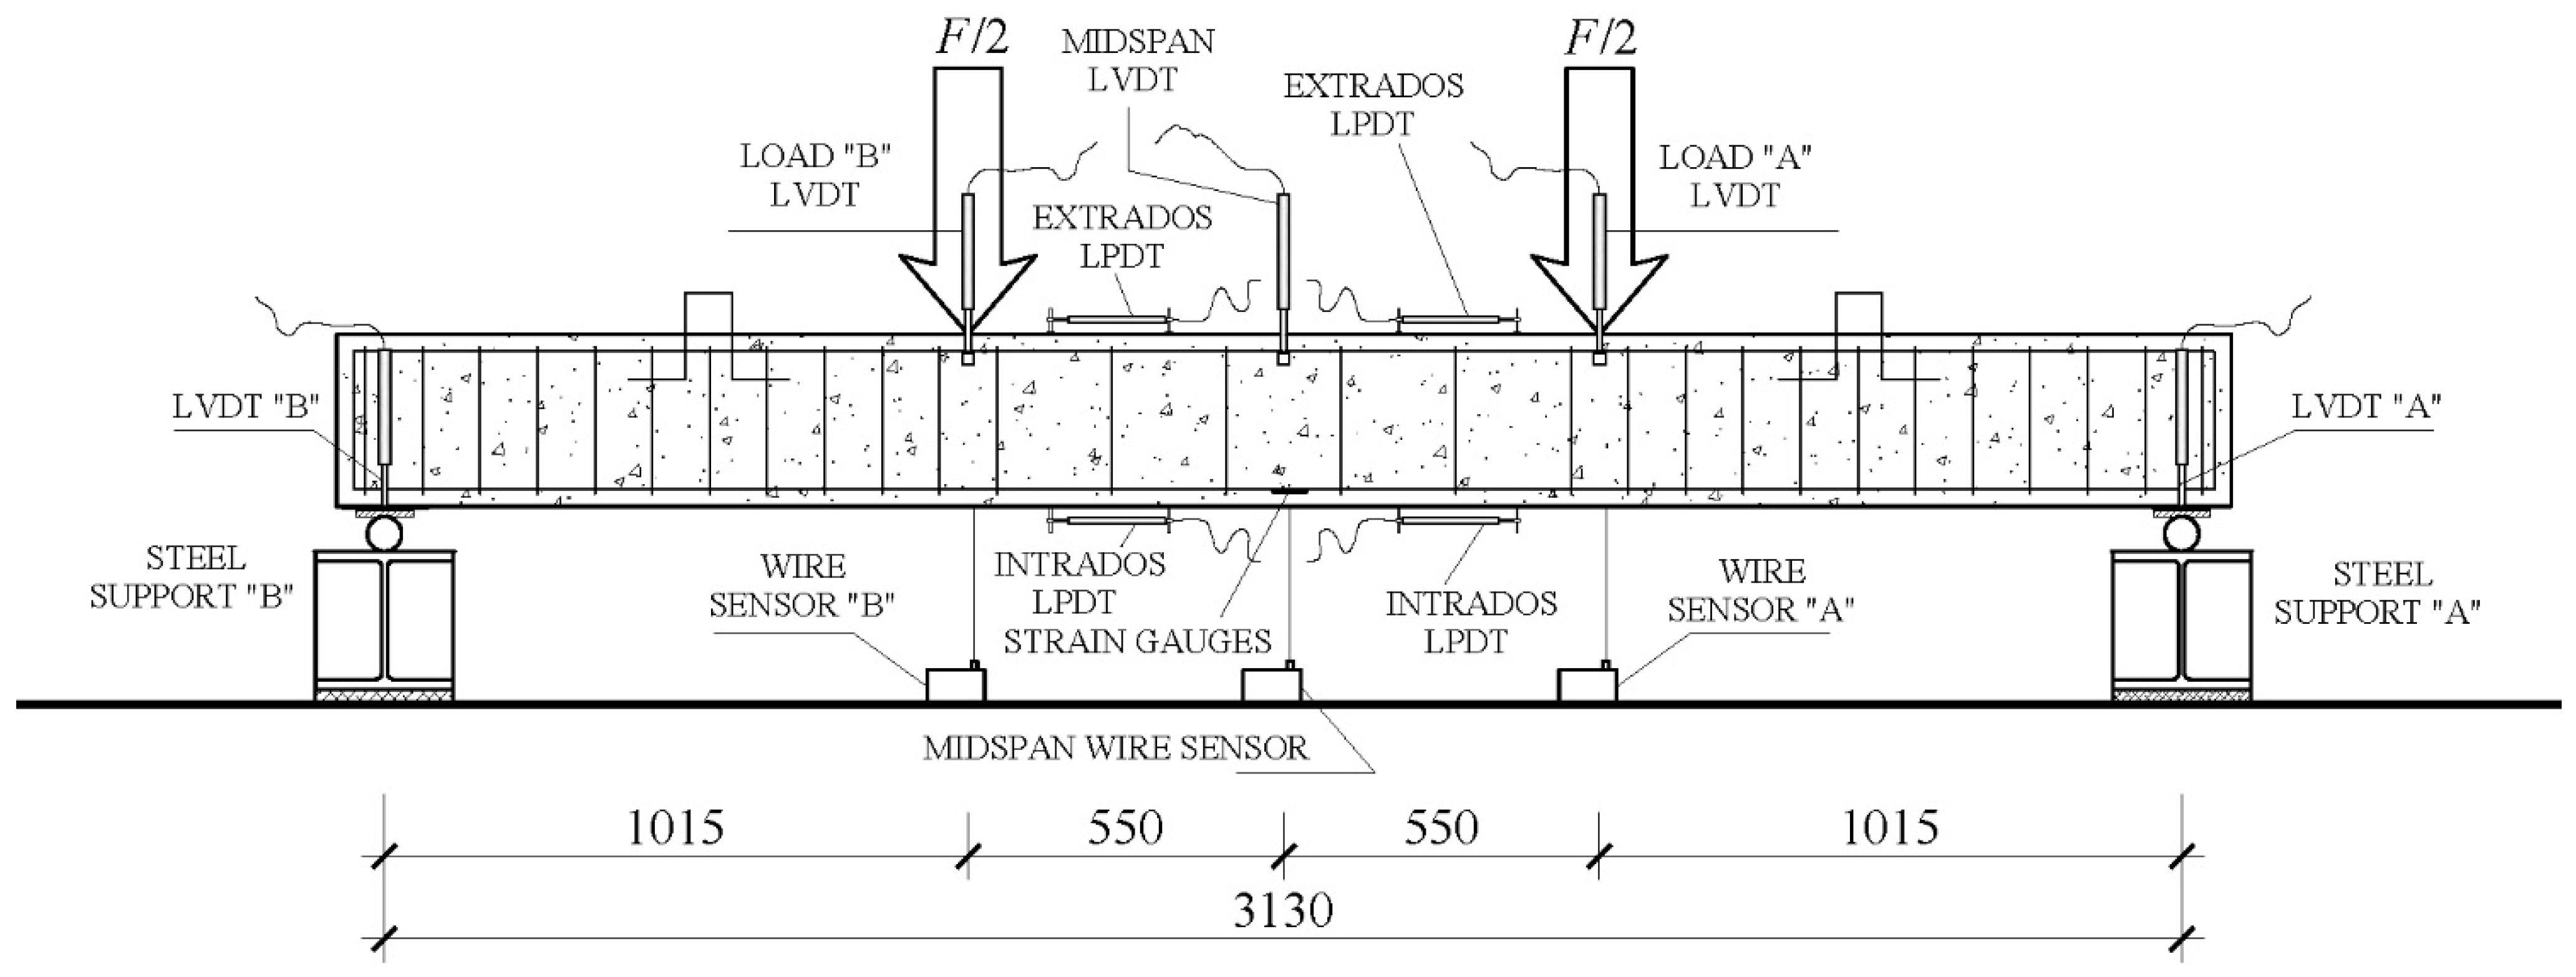
Eight single-lap direct shear (DS) tests were performed on SRG–concrete joints, which consisted of an SRG strip bonded to one face of a concrete prism, to evaluate the bond behavior. Out of the eight concrete prisms, three prisms were strengthened using one layer of an LD steel fiber sheet, while five were strengthened using one layer of an MD steel fiber sheet. The dimensions of all concrete prisms were 150 mm (height) × 150 mm (depth) × 600 mm (length) (Figure 1). Prior to applying the composite strip, the concrete surface was sandblasted with silica sand to obtain a 5 mm roughness, as per the manufacturer’s recommendation. The face of the concrete prisms to which the composite was bonded was damped prior to the application of the SRG to avoid absorption of the water of the matrix mortar by the concrete prism. For all SRG–concrete joints, the bonded length, l, was equal to 450 mm, and the bonded width, bf, was equal to 50 mm. The thickness of each layer of the matrix was 4 mm; thus, the total thickness of the composite strip, t, was equal to 8 mm. The beginning of the bonded region started at 50 mm from the top edge of the concrete prism.
Fibers were left bare outside the bonded region. A total of 75 mm long epoxy tabs were constructed at the end of the bare steel fiber sheet to facilitate gripping by the jaws of the testing machine. The composite strip was cured under wet cloths for 28 days. Specimens were left to cure in the laboratory at a temperature and humidity equal to 20 ± 3 °C and 60 ± 5%, respectively. Single-lap direct shear tests were performed in displacement control using a universal servo-hydraulic testing machine. The classical “push-pull” configuration was adopted. The concrete prism was restrained, while the fibers were pulled. Two linear variable differential transformers (LVDT), named “LVDT a” and “LVDT b” (Figure 1b), were mounted onto the concrete surface close to the beginning of the bonded region and reacted off of a thin aluminum Ω-shaped plate that was glued directly to the bare fibers adjacent to the beginning of the bonded area (Figure 1). The average value of the LVDT measurements is referred to as global slip g in this paper and was used to control the tests at a constant rate equal to 0.00084 mm/s. Further details on the setup can be found in [42,51]. DS test specimens were named following the notation DS_X_Y_A_Z, where DS indicates that SRG–concrete joints were tested using a direct shear test setup, X = bonded length (l) in mm, Y = bonded width (bf) in mm, A indicates the fiber sheet density (LD = low density, MD = medium density), and Z = specimen number to distinguish replicates.

2.3. Beam Tests

RC beams strengthened with SRG strips were tested in a four-point bending (FPB) configuration to investigate the effectiveness of the strengthening system, which included different anchor solutions for some beams. Nine concrete beams with dimensions of 200 mm (width, B) × 300 mm (depth, H) × 3300 mm (length, L) were cast from one concrete batch used also for SRG–concrete joint prisms and material characterization. Details of the internal steel reinforcement of the beams are provided in Figure 2.
One beam was left unstrengthened and considered as the control. The bottom face of all remaining beams was sandblasted prior to applying the SRG. The target roughness was 5 mm for the prisms described above. The purpose of the experimental campaign was two-fold, including (1) to investigate the effectiveness of the SRG composite. The parameters were the fiber sheet density (LD, MD) or the number of layers (one or two layers of LD fiber sheets). The second purpose was (2) to study the effectiveness of different mechanical anchors located at the beam ends.
The SRG was applied using the same procedure adopted for single-lap DS test specimens. For those beams with one layer of fiber sheet, the total thickness of the composite was 8 mm. If the beam was strengthened with two layers of fiber sheets, the total thickness was 10 mm, i.e., the intermediate and external layers of the matrix were 3 mm thick. The total thickness of the SRG for the beam specimens is named s (Figure 3). The anchors were an extension of the fiber sheet inside the beam and were used to delay the detachment of the strengthening system and, therefore, increase the flexural capacity of the element by extending the composite action. Mechanical anchors were realized by drilling 45 inclined holes from the tension side (intrados) of the beam. The fiber sheet was bundled at the two ends and placed inside the holes. Different mortars were used to fill the holes in order to determine the best anchor solution. The holes were filled prior to bonding the entire fiber sheet along the length of the beam. The RC beams were lifted during the applications of the SRG so that the technicians could apply the composite working under the beam to simulate the real on-site conditions, where air bubbles, dust, and concrete particles could be present inside the holes and gravity acts against the pressure exerted by the operator when applying the composite. Only MD fiber sheets were employed with anchors. Figure 3 shows the two strengthening arrangements without (Figure 3a) and with (Figure 3b) the mechanical anchors.
Table 2 shows beam characteristics in terms of the density of the fiber sheet, number of layers, material used for the mechanical anchors, and length (La) of the anchors. Full-scale beam specimens were named following the notation B_X_Y_A_W_KZ, where FB stands for beam, X = length of the SRG applied to the beam surface (Ls) in mm (Figure 3a,b), Y = composite width in mm (see Figure 3a,b), A indicates the fiber sheet density (LD = low density, MD = medium density), W = number of fiber sheet layers, K = type of material used to fill the holes (CM = cementitious mortar, B = inorganic mortar, or ER = epoxy resin), and Z = length of the anchors (La) in mm.
The layout of the transducers used in the FPB tests is reported in Figure 4. Two free-to-roll cylinders were used to support the beams. Two-point loads were applied approximately at one-third and two-thirds of the beam length. Eight linear variable displacement transformers (LVDTs) were used to measure the vertical displacements at key locations (one at each support, two at each point load, and two at midspan). Three wire displacement transformers (WDTs) were placed at each point load and at midspan, and they were used to measure large deflections, as the stroke of the LVDTs was deemed to be insufficient. Two strain gauges were mounted onto the tension side longitudinal steel bars in the constant moment region, prior to casting the beams, to monitor the strain in the bars. In addition, four linear potentiometric displacement transducers (LPDTs)—two at the intrados and two at the extrados—were used to measure the elongation of the outermost fibers of the RC beams in tension and compression between two cross-sections that were spaced apart as the spacing of the stirrups in the constant moment region of the beam. The average elongation from each side of the beam was used to obtain the curvature of a representative portion of the constant moment region. Tests were performed in displacement control using the vertical displacement (stroke) of the hydraulic actuator at a rate of 0.03 mm/s.

3. Experimental Results

3.1. Direct Shear Test of SRG–Concrete Joints

The stress (σ)–global slip (g) responses of LD and MD fiber sheet specimens are shown in Figure 5a,b, respectively. The stress σ was evaluated as the ratio between the applied load (P) and the nominal cross-sectional area of the steel fiber sheet, i.e., σ = P / ( t f b f ) . The response of the LD fiber sheet SRG–concrete joints (Figure 5a) is characterized by an always-increasing stress–global slip response, with an initial linear portion followed by a non-linear branch, until the peak stress, σ*, is reached. At the peak stress, which is the stress corresponding to the peak load P*, specimens failed due to the rupture of the bare steel fibers just outside the bonded area. Figure 6a shows the typical failure mode of SRG–concrete joints with LD fiber sheets. The σ-g response of the MD fiber sheet SRG–concrete joints (Figure 5b) is characterized by an initial linear behavior, followed by a non-linear branch until the onset of debonding, which occurred at the fiber–matrix interface. The propagation of the interfacial crack corresponds to a nominally constant load (plateau) until complete detachment of the strip. A relative peak load and a drop characterize the beginning of the plateau. Additional peaks and drops of variable magnitudes are observed in the nominally constant load portion of the response. For some specimens, the absolute maximum load does not correspond to the peak load at the beginning of the plateau. As the fibers debonded from the matrix, the matrix itself in between the cords was damaged, which resulted in an interlaminar failure, i.e., the fiber sheet and the external layer of the matrix detached from the internal layer of the matrix that was still attached to the concrete prism [52], as shown in Figure 6b.

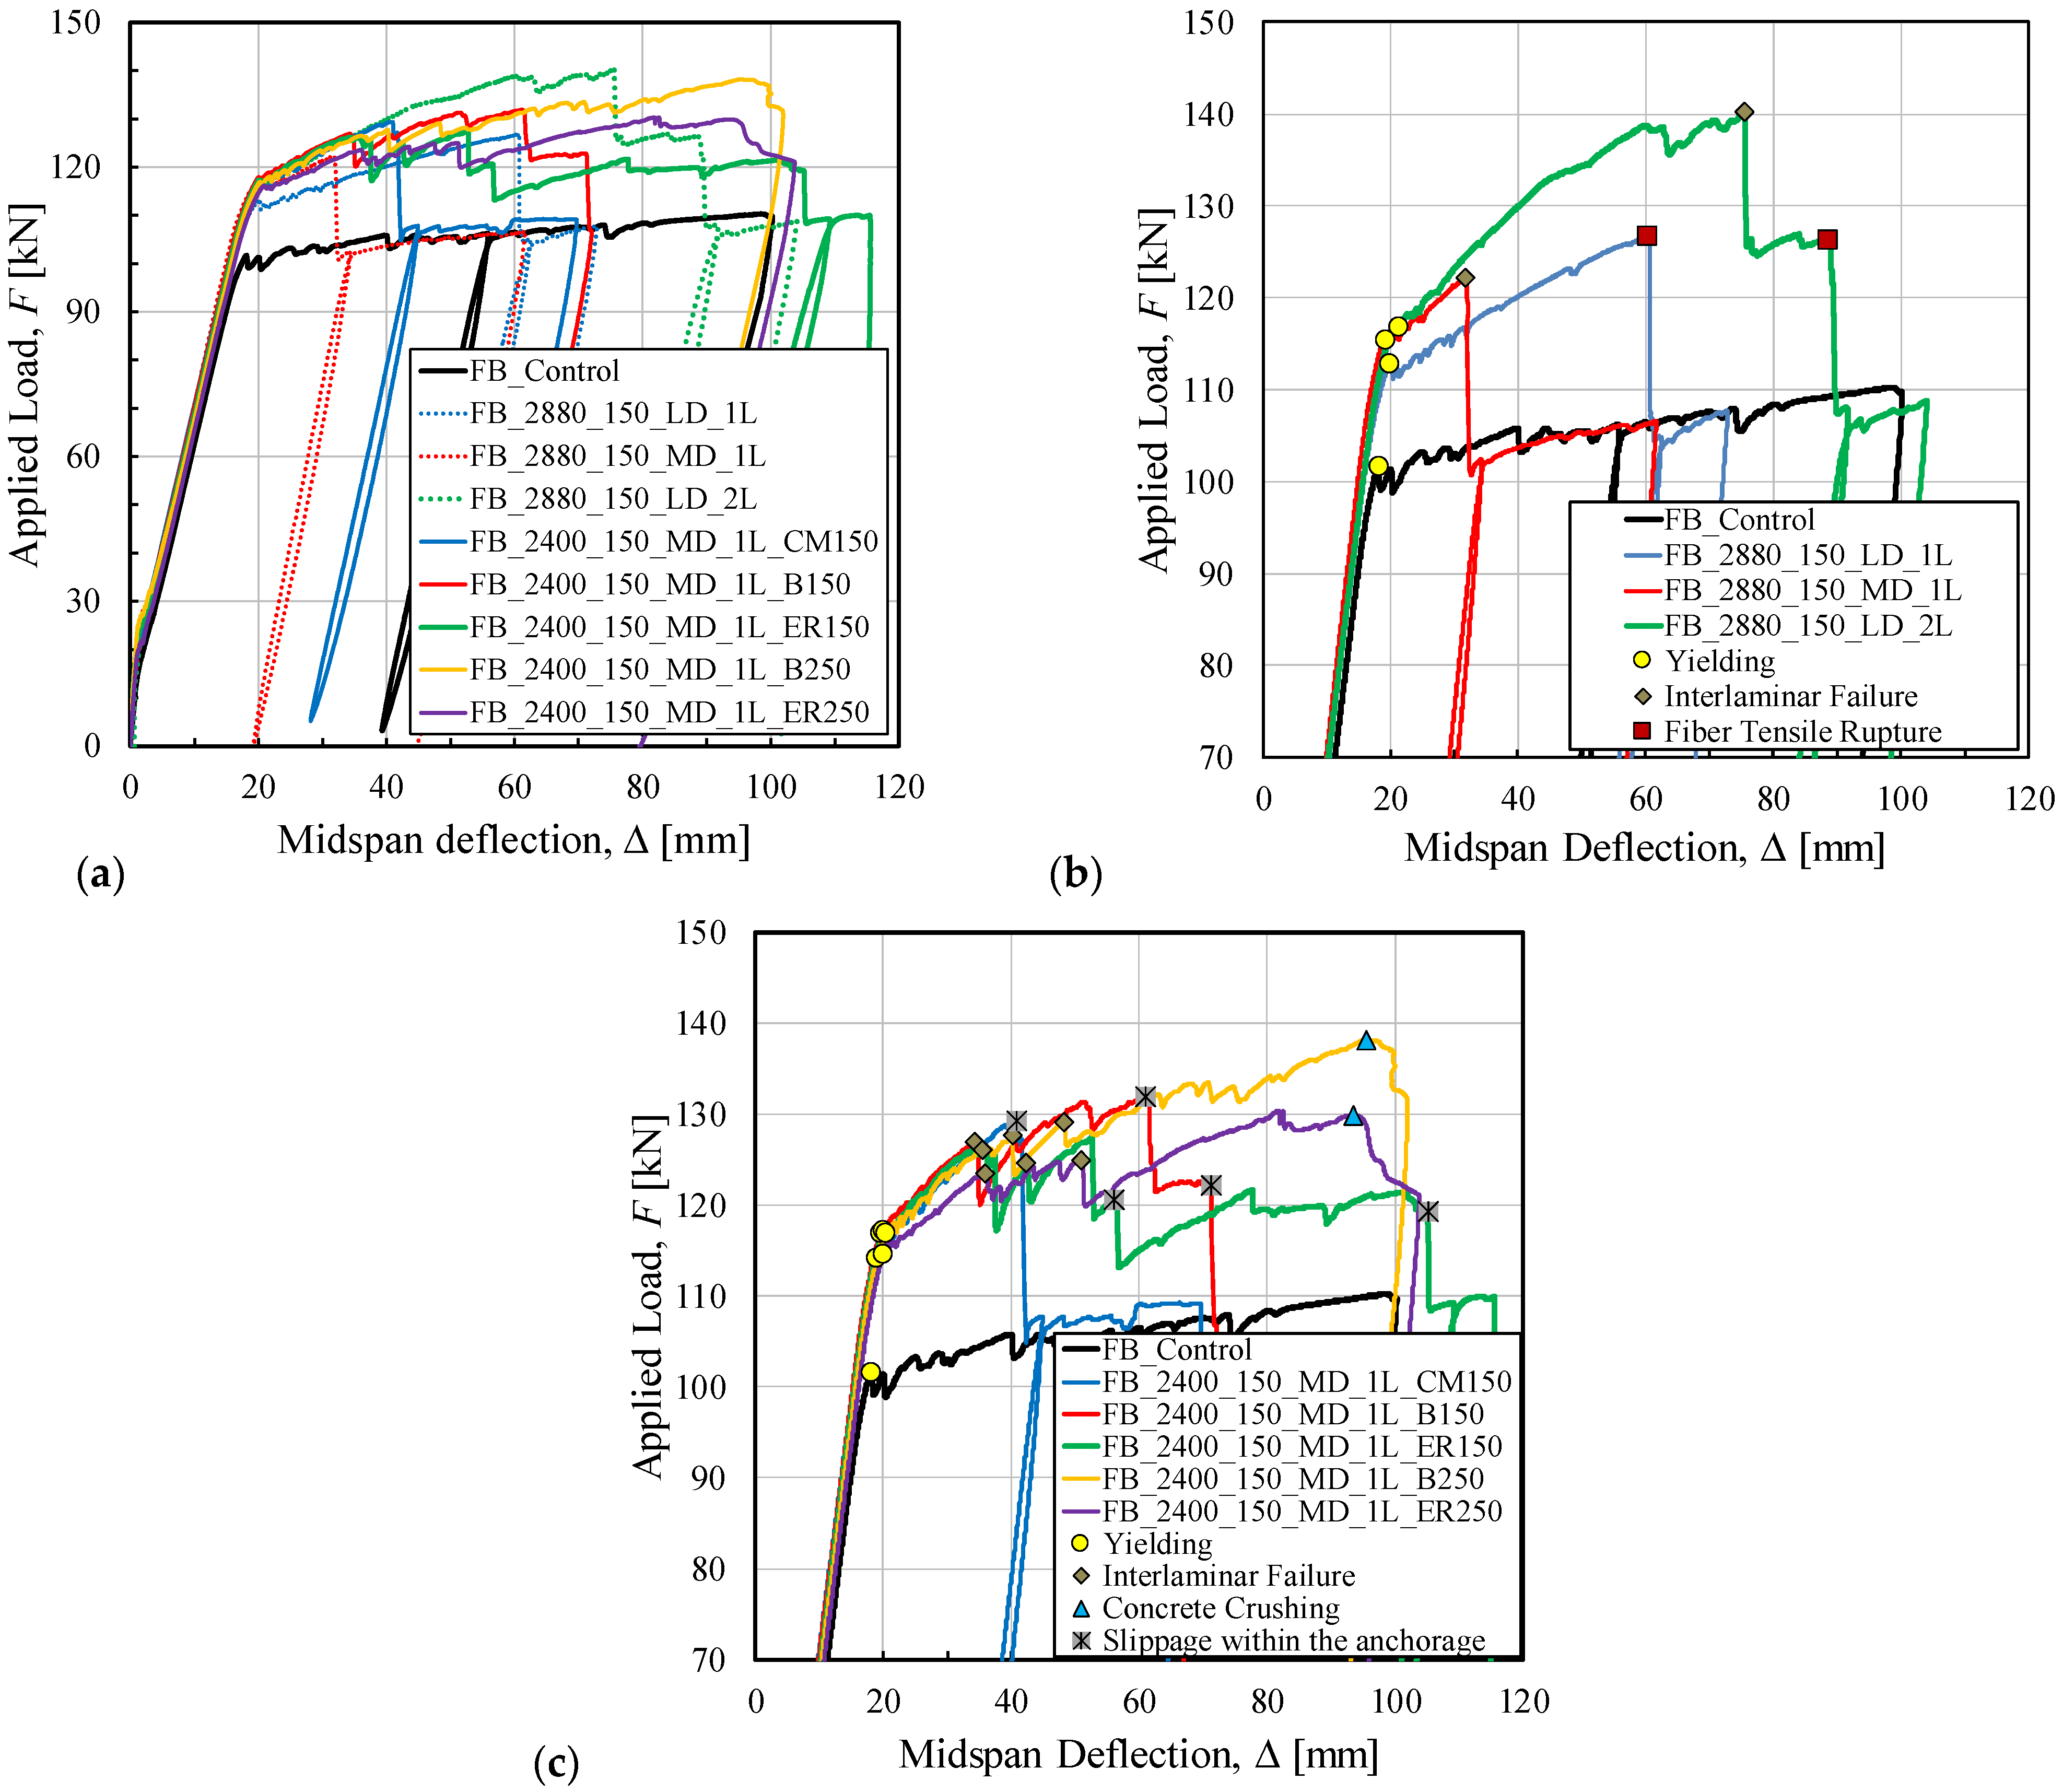
3.2. Four-Point Bending Tests on RC Beams

3.2.1. Control Beam

The control beam exhibited the typical crack pattern of RC beams, which is characterized by vertical cracks in the constant moment region of the beam and inclined cracks in the shear region. After the yielding of the longitudinal bars in tension occurred when the applied load (F) was equal to Fy,control, the increase in the deflection was associated with the substantial opening of the flexural cracks until concrete crushing occurred (beam failure). The applied load (F) versus midspan deflection (Δ) response of all RC beams tested is reported in Figure 7a. In Section 3.2.2 and Section 3.2.3, respectively, the flexural behavior of the beams strengthened without (group A) and with (group B) mechanical anchors are described.

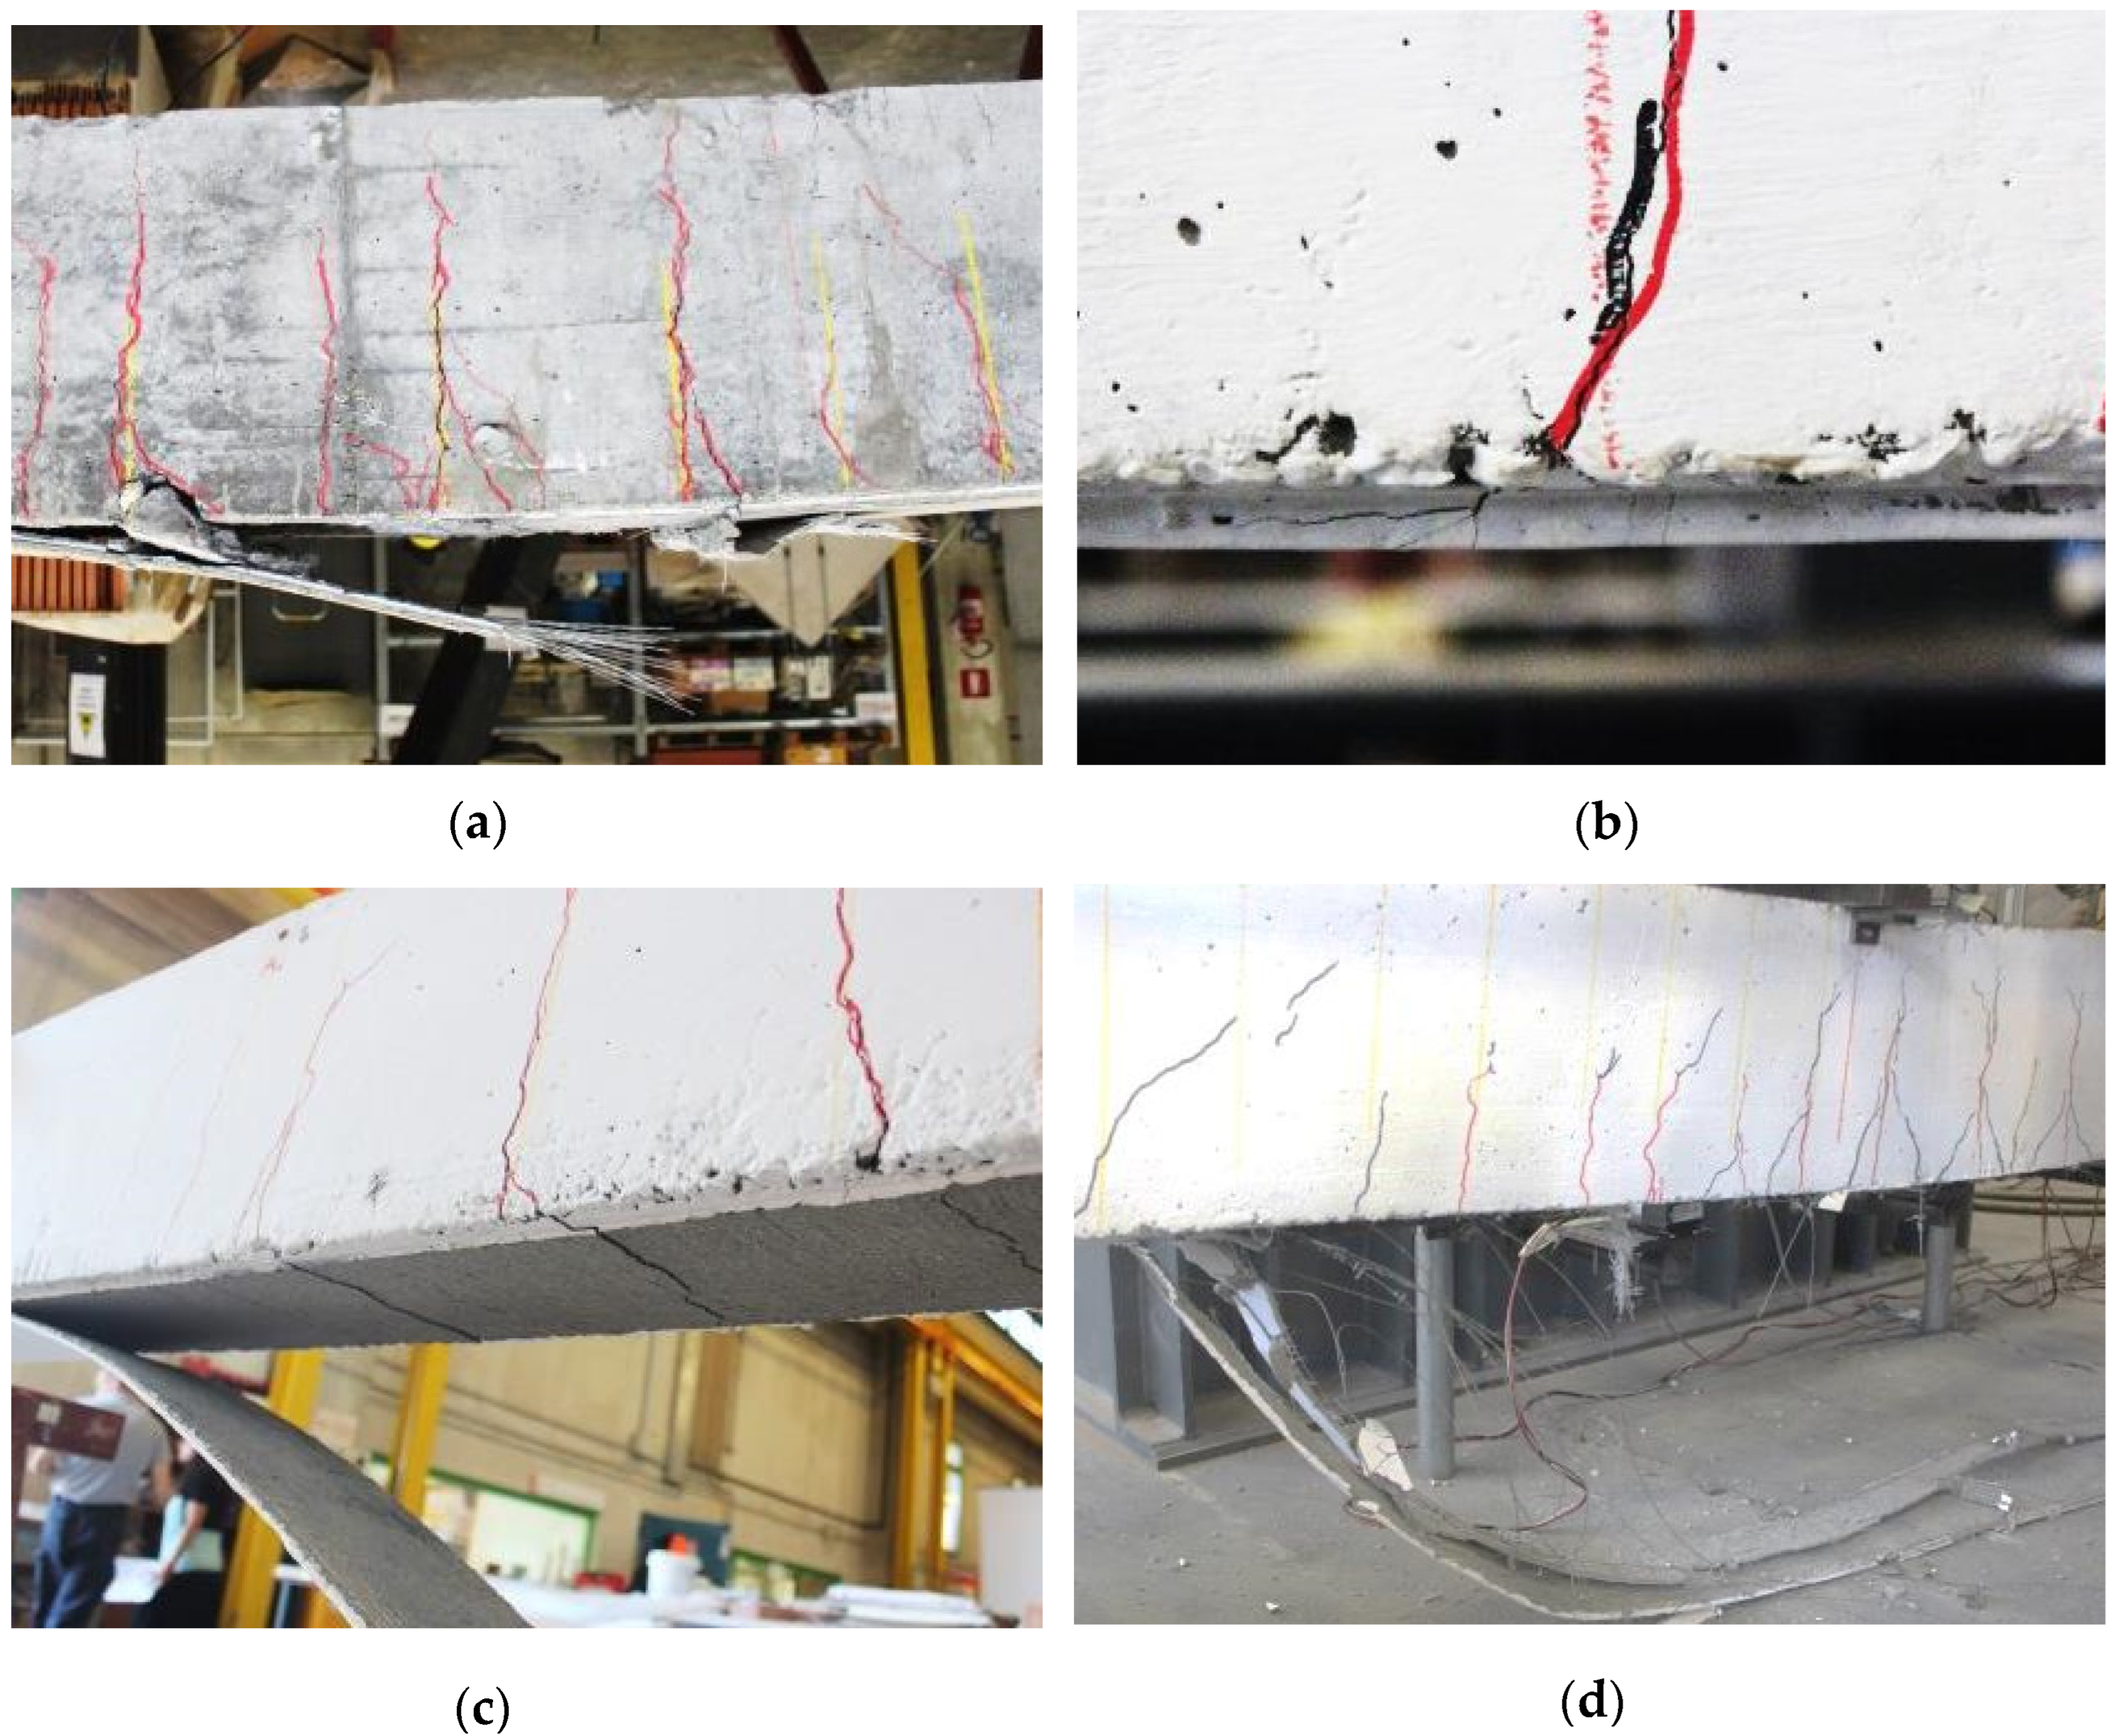
3.2.2. Specimens Strengthened Without Mechanical Anchors (Group A)

For the beams strengthened without mechanical anchors, the initial behavior in terms of load (F) versus midspan deflection (Δ) response was similar to (and almost overlapping with) that of the control beam. The yielding load values for the beams of group A were 10–15% higher than the corresponding load (Fy,control) for the control beam. After yielding, the F-Δ response was steeper than that of the control beam due to the contribution of the composite. Figure 7b shows the top portion of the responses corresponding to the peak values of the applied load for beams of group A (no anchors). Table 3 summarizes the following key values of the load and deflection for the specimens described above: Fy = load corresponding to the yielding of steel bars in tension (Fy,control for the control beam), Fi = load corresponding to a substantial drop in the F-Δ response, Δy = midspan deflection corresponding to Fy, and Δi = midspan deflection corresponding to Fi. In addition, for the ratio of the yielding load of the strengthened beam to that of the control beam (Fy/Fy,control), the ratios Fi/Fy and μi = Δiy are also reported. The value of μi corresponding to the loss of composite action or concrete crushing (failure of the beam) is marked as μc.
As for the failure modes (Figure 8), two main types of failure were observed for the FRCM-strengthened beams without anchors, both belonging to the broad definition of loss of composite action. (a) Similar to what was observed for the single-lap direct shear tests, tensile rupture of the steel fiber sheet occurred for the RC beam was strengthened with one layer of the LD fiber sheet (FB_2880_150_LD_1L, Figure 8a). (b) Interlaminar failure within the composite occurred for the RC beam was strengthened with one layer of the MD fiber sheet (FB_2880_150_MD_1L, Figure 8c). Interlaminar failure was observed for the external fiber sheet layer of FB_2880_150_LD_2L, followed by rupture of the fibers in the internal (bonded to concrete) layer of the fiber sheet. In Figure 7b, markers have been used to identify the yielding of the steel bars (circular marker ○), interlaminar failure (diamond marker ◊), and fiber tensile failure (square marker □).
In Figure 9 and Figure 12, the values of Fi are reported with a superscript (′, ″, etc.) to differentiate the different values of Fi for each beam.
For specimen FB_2880_150_LD_1L, after the yielding of the bars occurred (Fy = 112.9 kN), Δ increased to Δi = 60.2 mm, when a sudden drop in the load was observed due to fiber rupture (Figure 7b). After the failure of the external reinforcement, associated with the load drop, the response of the RC beam overlapped with the response of the control beam (FB_Control). This type of reinforcement failure proved that the fiber–matrix bond and matrix–concrete bond were able to fully exploit the tensile capacity of the fibers. After the yielding of the bars in tension occurred (Fy = 115.5 kN), the deflection of specimen FB_2880_150_MD_1L increased up to Δi = 31.7 mm (Figure 7b), after which a sudden load drop was observed due to the detachment of the steel cords together with the external layer of the matrix from the internal layer of the matrix (interlaminar failure).
The maximum deflection reached by specimen FB_2880_150_MD_1L prior to the loss of composite action was much smaller than the maximum deflection of specimen FB_2880_150_LD_1L. The onset of interlaminar cracks started after the formation of the flexural cracks in the RC beam (i.e., prior to the yielding of the bars), but they became more visible after the yielding load was attained (Figure 8b). In the post-yielding portion of the response, these interlaminar cracks rapidly coalesced and propagated towards the ends of the beam, triggering the detachment of the steel cords (Figure 8c) and leading to the loss of composite action and, therefore, to a load drop in the F-Δ curve.
The interlaminar failure observed for the MD fiber sheet can be potentially explained by the limited space between the steel cords. As the cords slipped with respect to the matrix, the surrounding mortar was damaged. The regions of damaged mortar around two adjacent cords overlapped so that a weak plane in the matrix formed at the location of the fibers. In turn, the two layers of the matrix were connected by a thin layer of mortar damaged by the slippage of the fibers, which prevented the SRG composite strip from behaving as a single system rather than two separate layers. After the steel fibers detached, the internal matrix layer was still bonded to the substrate.
Specimen FB_2880_150_LD_2L featured the same total cross-sectional area of steel fibers as specimen FB_2880_150_MD_1L, but the area was obtained using two layers of LD fiber sheets rather than one layer of the MD fiber sheet. As noted above, specimen FB_2880_150_LD_2L had a mix of two failure mechanisms. (i) After reaching the yielding of the tension steel reinforcement at Fy = 116.9 kN (Figure 7b), the load increased with a similar stiffness as that of specimen FB_2880_150_MD_1L, which suggests that as long as the cross-sectional area was the same, the behavior of the beam was not affected by the composite arrangement. SRG interlaminar cracks, observed prior to the yielding of internal reinforcement, propagated from the constant moment region of the beam towards its ends (the portion of the beam with constant shear force), while the internal steel bars in tension were yielded. At a value of Δ approximately equal to 62 mm, load drops in the load response occurred, while damage to concrete in the compression zone was observed near the midspan. When Δ reached the value of Δi = 75.5 mm, corresponding to a load Fi = 140.2 kN, the external layer of the matrix together with the external steel fiber sheet detached from the intermediate mortar layer (interlaminar failure), which caused a load drop of about 15 kN. (ii) After the load drop, the beam F-Δ curve kept increasing with a stiffness similar to that of the post-yielding branch of specimen FB_2880_150_LD_1L, which suggested that the beam behaved as a strengthened beam with one layer of the LD fiber sheet (i.e., as specimen FB_2880_150_LD_1L) after the load drop occurred. When Fi = 126.4 kN (Δi = 88.6 mm), the steel cords of the internal layer ruptured (Figure 8d). The load at which the fibers ruptured is consistent with the load at which the fibers ruptured in specimen FB_2880_150_LD_1L.
It can be noted that the increment of the yielding load with respect to the control specimen does not increase proportionally to the amount of steel fibers. The coefficient of ductility μc for strengthened RC beams for which the rupture of the fibers controlled the loss of composite action is approximately between 3 and 4 and ranges between 55 and 75% of μc for the control beam. For FB_2880_150_MD_1L, μc = 1.65. The value of μi for beam FB_2880_150_LD_2L, corresponding to the first drop in the F-Δ curve (Δi = 75.5 mm), was equal to 3.56.
For the strengthened RC beams without anchors, Figure 9 shows the deflection profile v(x), where x is the coordinate along the beam, obtained from the LVDT readings for different load levels, which corresponds to the yielding of the steel bars and the drops of the applied load (Fi in Table 3).

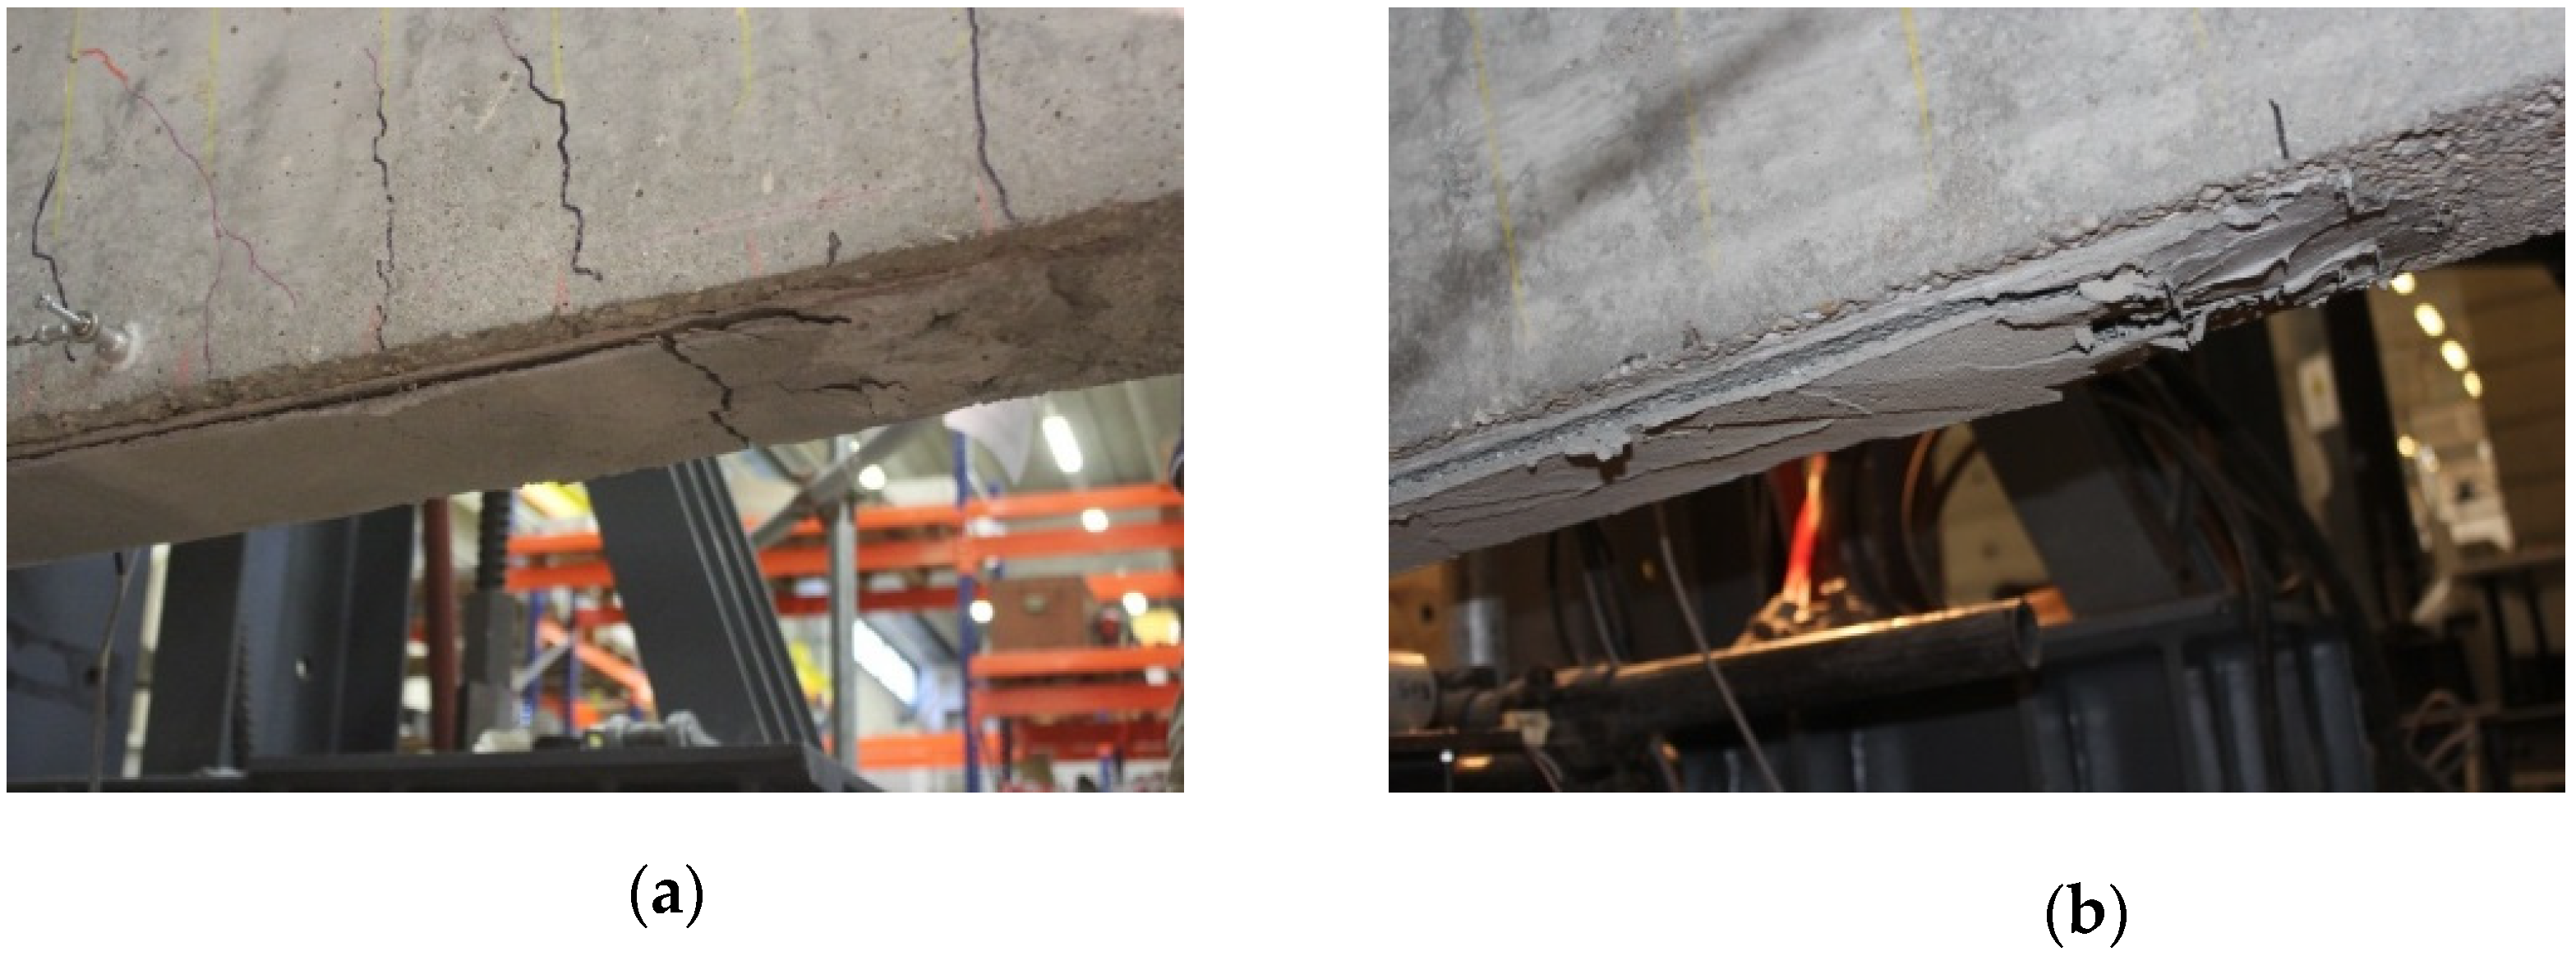
3.2.3. Specimens Strengthened with Mechanical Anchors (Group B)

In an attempt to allow for the full exploitation of the MD steel fiber sheet and thus avoid premature interlaminar failure (see the results of specimen FB_2880_150_MD_1L), the effectiveness of some mechanical anchors was evaluated for the remaining beams. As reported in Table 2, five beams strengthened with MD fiber sheets that featured mechanical anchors at both ends of the composite strip were tested. Anchoring was obtained by increasing the length of the fiber sheet beyond the bonded length Ls and inserting the ends into holes drilled at 45° into the bulk of the beam (Figure 3b). Two different lengths (La) of the holes and, therefore, of the anchors were considered. Three different types of materials were used to fill the holes and create the anchors with fibers: (1) the same cementitious mortar used for the SRG matrix (CM); (2) an inorganic mortar provided by the manufactured of the SRG composite (B); and (3) an epoxy resin (ER). Figure 7c shows the top portion of the F-Δ responses corresponding to the peak values of the load for the beams with anchors (group B). Markers are used in Figure 7c to identify specific points of the curve, i.e., yielding of the steel bars (circular marker ○), interlaminar failure (diamond marker ◊), concrete crushing (triangular marker ∆), and slippage of the fibers within the anchor (cross marker ×).
Specimen FB_2400_150_MD_1L_CM150 exhibited (Figure 7c) a flexural behavior similar to that of FB_2800_150_MD_1L. Interlaminar cracks formed in the central region of the beam and propagated towards the ends of the beam after the steel bars yielded. When the interfacial cracks reached the end of the fiber sheet, the strengthening system was only attached to the beam through the mechanical anchors. The anchors were unable to withstand the pulling action, corresponding to the tension load applied to the composite, and the fibers within the hole slipped until they were completely pulled out (Figure 10a) prior to reaching a value of tension force in the fibers close to that corresponding to the tensile strength. Slippage of the fibers within the anchors was associated with a load drop (Figure 7c), after which the F-Δ response overlapped with that of the control beam. Using the same mortar of the SRG composite inside the holes led to an increase in the midspan deflection when the loss of composite action occurred with respect to FB_2800_150_MD_1L (from approximately 34 to 40 mm).
When the inorganic mortar was used for the anchors (FB_2400_150_MD_1L_B150), the interlaminar failure along the entire length of the beam occurred at a similar value of Δ (Δi = 34.2 mm) as beam FB_2400_150_MD_1L_CM150, and it was followed by a smaller load drop. However, at that point, the fibers did not fully slip within the anchor, and after the drop, the load started to increase again. When Fi = 131.3 kN and Δi = 51.5 mm, another load drop occurred due to partial cracking of concrete in the compression zone of the central part of the beam. Failure within the anchors, i.e., large slips of the fibers, was observed after two additional drops in the F-Δ response (Figure 10b). The second of those drops occurred when Fi = 122.1 kN and Δi = 71.3 mm. After that drop, the response of beam FB_2400_150_MD_1L_B150 overlapped with that of the control beam (Figure 7c).
For the beam with anchors made with epoxy (FB_2400_150_MD_1L_ER150), a complex response was observed. Interlaminar cracks near the ends of the beam of the SRG strip became visible at a value of Δ similar to the previous cases (Δi = 35.5 mm) and were marked by a first load drop followed by a number of other load drops due to the partial slippage of the anchors that ended with their complete pull out. It should be noted that the entire anchor system (fiber plus epoxy matrix) slipped with respect to the surrounding concrete within the hole, as can be observed in Figure 10c. Even though slippage within the anchor occurred in all three cases, the use of epoxy resin allowed for the attainment of Δi = 105.2 mm prior to reaching the final failure of the anchors. Independently of the type of material used to fill the anchor holes, slippage within the anchor always occurred when La = 150 mm. To improve the effectiveness of the anchors, La was increased to 250 mm, and the portions of the steel fiber sheet that was inserted into the holes were pre-impregnated with epoxy to facilitate load sharing among the cords and make them work as a group of cords rather than independently. For this second attempt, the holes were filled either with inorganic mortar or epoxy resin. Specimen FB_2400_150_MD_1L_B250 featured anchors that were made with inorganic mortar. When interlaminar cracking was observed near the ends of the beam (Δi = 40.2 mm), the F-Δ response (Figure 7c) exhibited a load drop, followed by additional load drops with limited amplitude, until it reached the highest flexural capacity among the beams. This behavior can be associated with a limited slippage within the anchors obtained by increasing its length. The failure mode (Fi = 138.2 kN and Δi = 95.6 mm) was concrete crushing, as a complete pull out of the fibers from the anchor holes did not occur. Figure 11a shows the anchor region at the end of the test for beam FB_2400_150_MD_1L_B250.
Specimen FB_2400_150_MD_1L_ER250 featured anchors made with epoxy resin. It reached a similar value (with respect to FB_2400_150_MD_1L_B250) of the maximum midspan deflection, but the post-yielding branch of the response was below that of FB_2400_150_MD_1L_B250. A first drop in the load response was observed at Δi =36 mm. This drop, as in the previous specimens, was most likely the result of the engagement of the anchors, as the composite strip was almost fully detached along the length of the beam. A series of subsequent load drops (with a similar magnitude as that observed in the other beams) followed after the first drop. During this phase, the composite effectively transferred the tensile force to the mechanical anchors since the applied load kept increasing after each drop. The failure mode of FB_2400_150_MD_1L_ER250 was concrete crushing (Fi = 129.9 kN and Δi = 93.4 mm), while the steel cords were completely detached from the first layer of matrix, although they were still effectively anchored at the beam ends (Figure 11b). It can be noted that for the same material used for the anchors, increasing La from 150 to 250 mm allowed us to increase the ductility of the beam and shift the failure mode from slippage within the anchor (Figure 10c) to the crushing of concrete. Figure 12 shows the deflection profiles measured along the beam for all the specimens with mechanical anchors (group B). The use of the anchors increased the performance of the beams in terms of maximum deflection, but only when anchors with La = 250 mm were used was the loss of composite action avoided, which led to a failure mode controlled by concrete crushing.
Figure 12. Beam deflection profiles at different values of the applied load Fi for specimens of group B: (a) specimen FB_2400_150_MD_1L_CM150, (b) specimen FB_2400_150_MD_1L_B150, (c) specimen FB_2400_150_MD_1L_ER150, (d) specimen FB_2400_150_MD_1L_B250, and (e) specimen FB_2400_150_MD_1L_ER250.
Buildings 15 01005 g012

4. Discussion of the Results

4.1. Direct Shear Tests

Single-lap direct shear tests performed on the LD steel fiber sheet SRG–concrete joints failed due to rupture of the fibers. The average value of the maximum stress in the fibers was σ ¯ L D = 3 030   MPa (CoV = 0.008). The average maximum stress was computed as σ ¯ L D = P ¯ * / ( 0.084 b f ) , where P ¯ * is the average of the maximum loads P * for the three specimens, 0.084 is the equivalent thickness, tf, and bf is the width of the composite expressed in mm. MD steel fiber sheet single-lap specimens exhibited interlaminar failure, with an average value of the stress at failure σ ¯ M D = 948.9   MPa (CoV 0.13), which is 31% of the average maximum stress ( σ ¯ L D ) observed when a rupture of the fibers occurred. The stress corresponding to the interlaminar failure of the MD fiber sheet specimen was defined as σ ¯ M D = P ¯ d e b / ( 0.169 b f ) . P ¯ d e b is the average of the debonding loads ( P d e b ) for the set of specimens and 0.169 is the equivalent thickness, tf, for the MD fiber sheets. Each debonding load, P d e b , was determined by averaging the values of the applied load, P, of the single-lap shear test within the range of g, corresponding to the first peak of the load and the end of the P-g response [53]. It can be noted that the density of the steel fibers played a key role in the response of direct shear tests conducted on SRG–concrete joints. In fact, the different failure modes and the lower stress corresponding to the failure mode for the MD fiber sheet are mainly due to the reduced amount of mortar in between the fiber cords of the MD fiber sheet. The dependency of the failure mode on the density of the fiber sheet is a unique feature of composites that feature inorganic matrices (cementitious or lime-based mortars), which can be characterized by a maximum grain size that is similar in size to the spacing between the fiber bundles or cords.

4.2. Four-Point Bending Flexural Tests of RC Beams

Load responses, failure modes, and effectiveness of the strengthening systems were previously examined for specimens without and with mechanical anchors. Table 3 summarizes the key results obtained from the flexural tests. The stiffness of all beams, after concrete cracking in the outermost fibers in tension occurred, was very similar, which suggests that different layouts of the SRG did not substantially modify the flexural response of the beam until the steel bars yielded (Figure 7a). Referring to the beams strengthened without mechanical anchors, a rupture of steel cords occurred for beam FB_2880_150_LD_1L and for the internal layer of beam FB_2880_150_LD_2L. The applied load corresponding to the rupture of the fibers was approximately the same for the two beams, i.e., Fi was approximately 126 kN (red square markers in Figure 7b), with a midspan deflection of 60.2 and 88.6 mm for FB_2880_150_LD_1L and FB_2880_150_LD_2L, respectively. This difference is most likely due to the fact that in beam FB_2880_150_LD_2L, the steel cord tensile failure occurred after the detachment of the external (second) layer of the fiber sheet. The post-yielding stiffness of beam FB_2880_150_MD_1L and of beam FB_2880_150_LD_2L, prior to the detachment of the external layer of fibers, were similar. The former beam was strengthened with one layer of a fiber sheet with a density equal to 1200 g/m2. The latter was strengthened with two layers of fiber sheet, each with a density equal to 600 g/m2. Considering all beams strengthened with an MD steel fiber sheet and mechanically anchored at their ends, it can be observed that independently of the type of anchor, the initial post-yielding stiffness of the beams was quite similar to that of the beam with the same reinforcement but without the anchors (FB_2880_150_MD_1L). Thus, anchors appeared to be fully engaged only after the post-yielding initial non-linear phase, i.e., when the composite was almost fully detached for the entire length of the beam, which was the result of the coalescence of the interlaminar cracks triggered by the flexural cracks. For all beams with anchors, the engagement of the anchors was typically associated with a load drop in the post-peak branch that occurred at a value of Δ ranging between 32 and 42 mm and at a value of the applied load ranging between 123.6 and 130.3 kN (Figure 7c). The use of 150 mm long mechanical anchors led to substantial slippage within or partial loss of capacity of the anchors themselves, depending on the type of material used to fill the holes. Increasing the anchor length from 150 mm to 250 mm allowed us to effectively use the anchors and increase the flexural capacity and ductility of the beam.
Considering all RC beams, in terms of capacity gain related to the FRCM, an increment of the yielding load between 10% and 15% was obtained with respect to the control beam. The ultimate capacity increased between 10 and 25% (depending on the type of anchor) with respect to the control beam. The SRG composite allowed us to obtain a satisfactory level of ductility μc. For beam FB_2880_150_LD_1L (a beam with one layer of the LD steel fiber sheet), μc = 3.03. For beam FB_2880_150_MD_1L (one layer of the MD steel fiber sheet without anchors), μc = 1.65, which is almost half of the value observed for FB_2880_150_LD_1L. The addition of mechanical anchors improved the post-yielding behavior of beams strengthened with one layer of the MD steel fiber sheet. For those beams, the values of μc ranged from 2.16 to 5.27, which depended on the anchor length and the material used to fill the holes. A large value of μc (5.53) could be obtained also for the control beam. The load at failure for the control beam was lower than that of the strengthened beam with similar values of μc, which indicates that the flexural capacity of an existing beam can be improved without a critical reduction in its ductility.

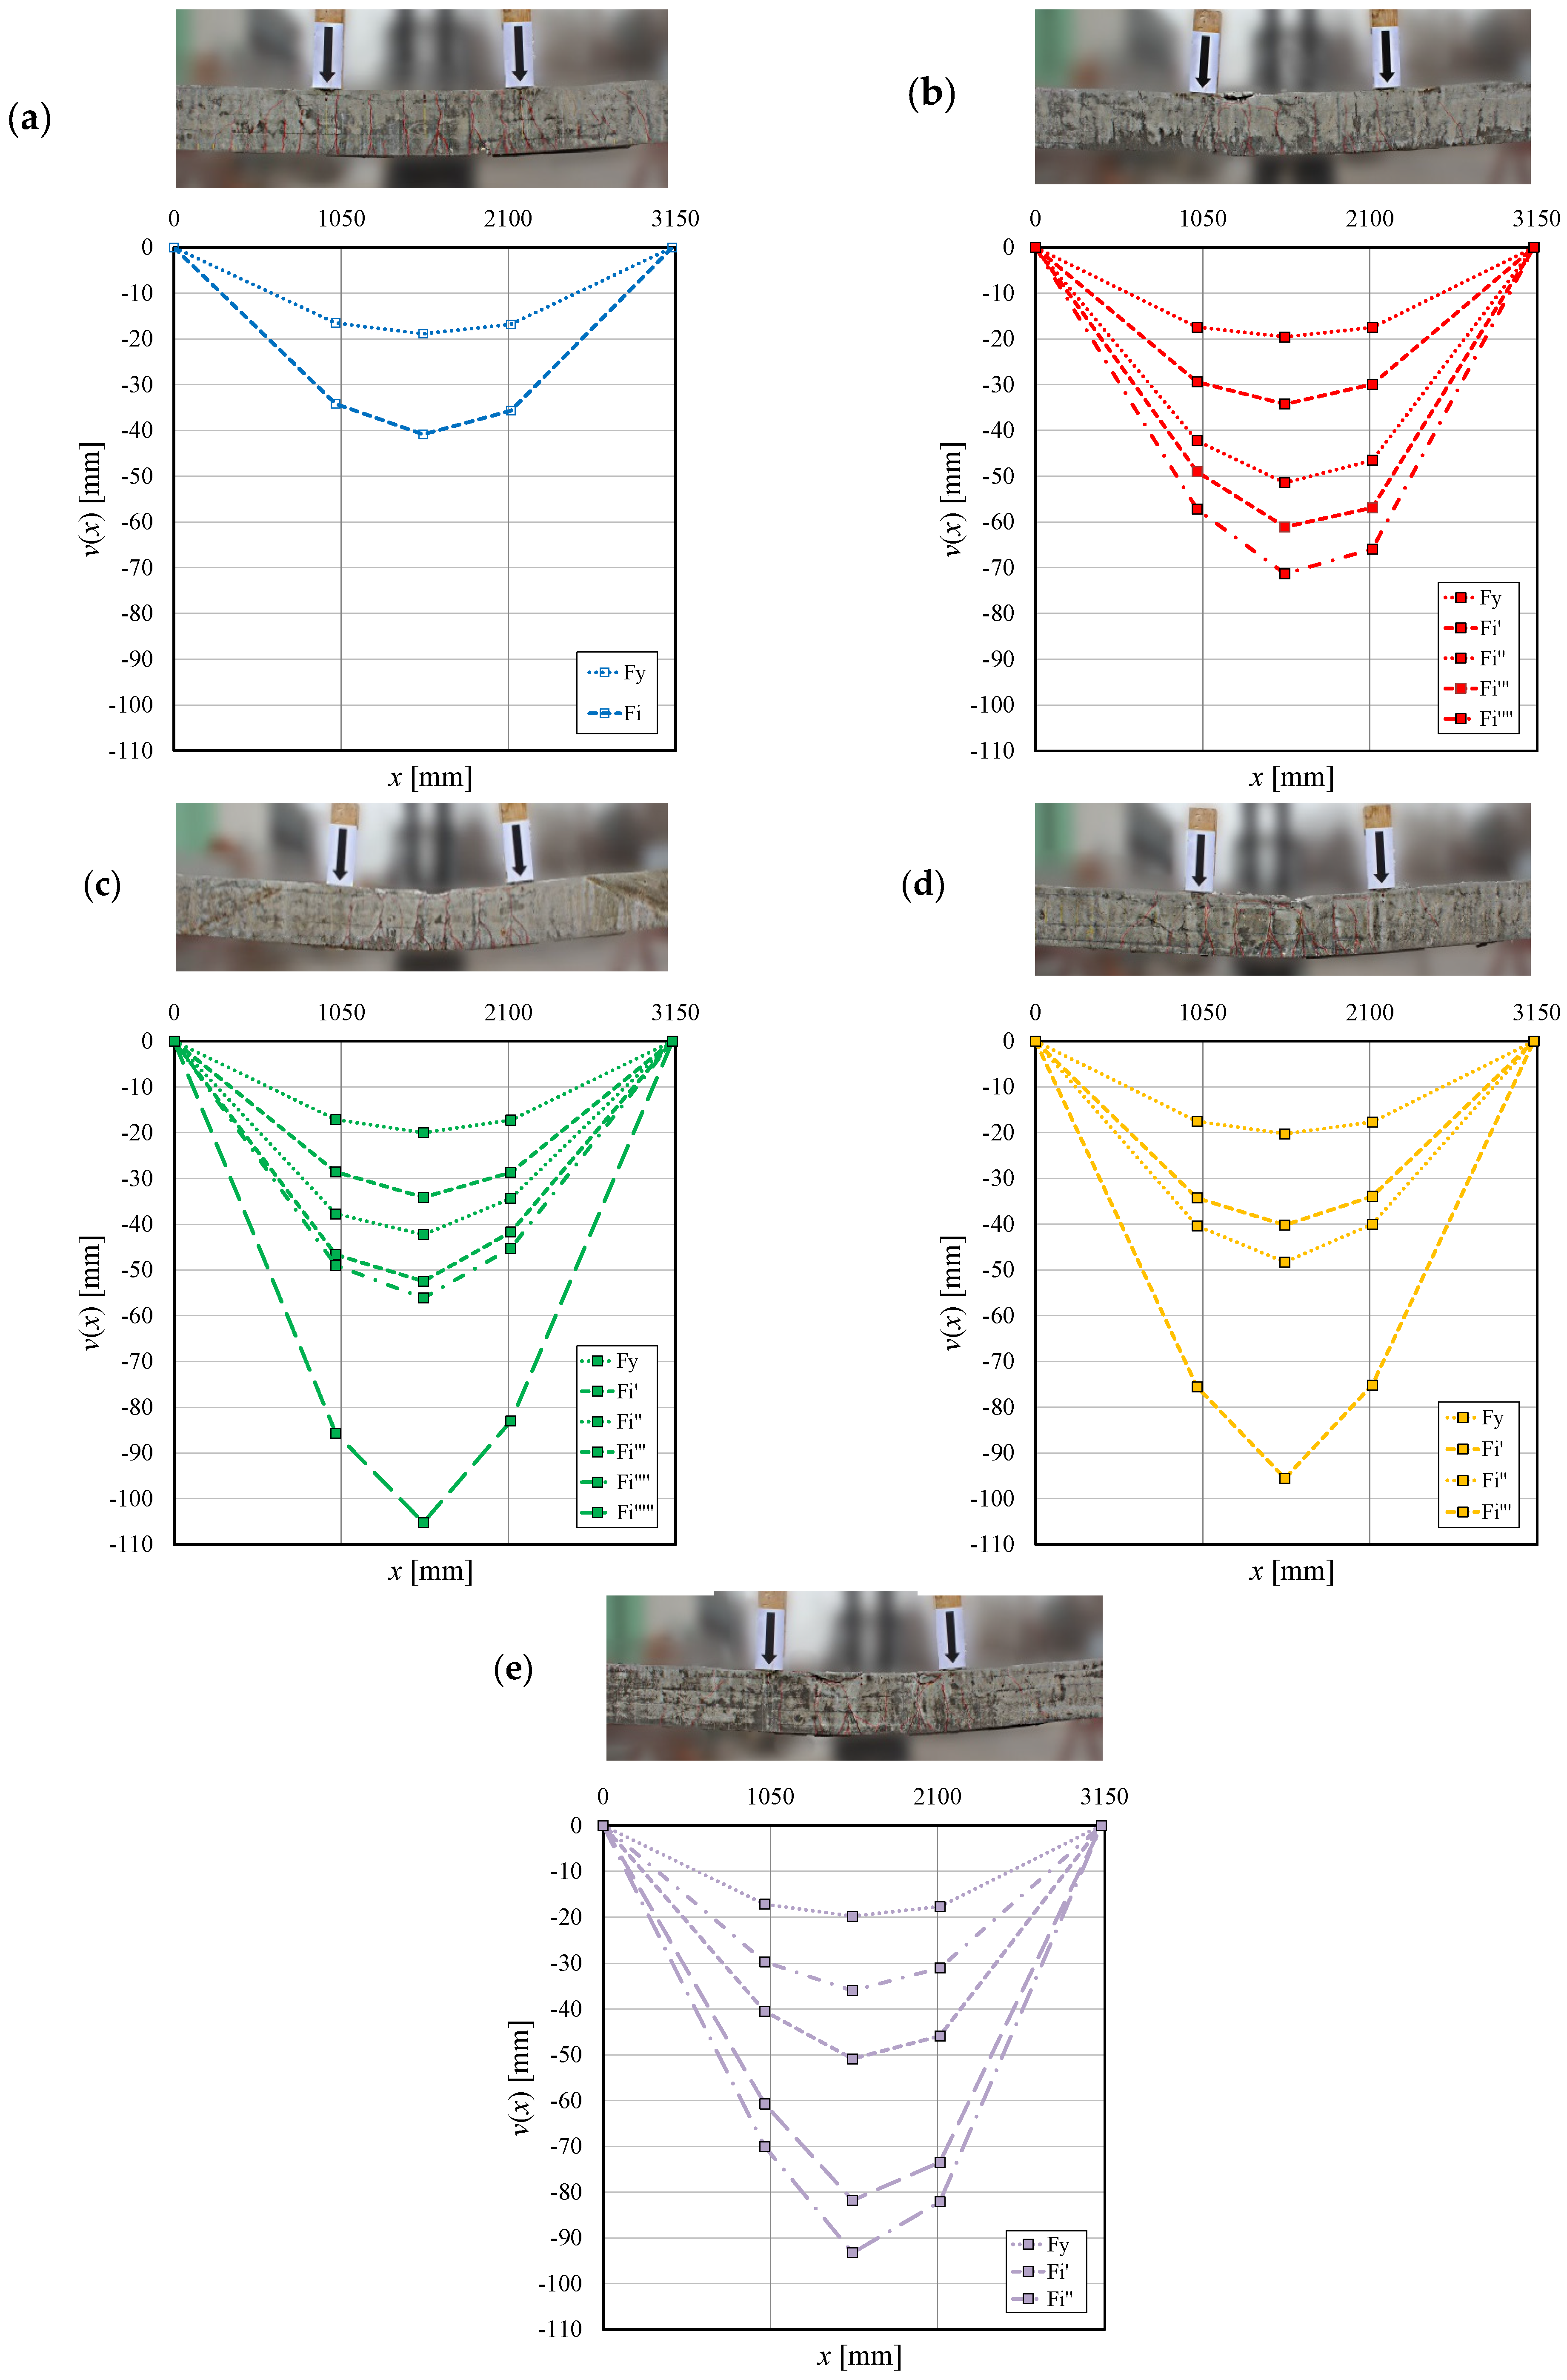
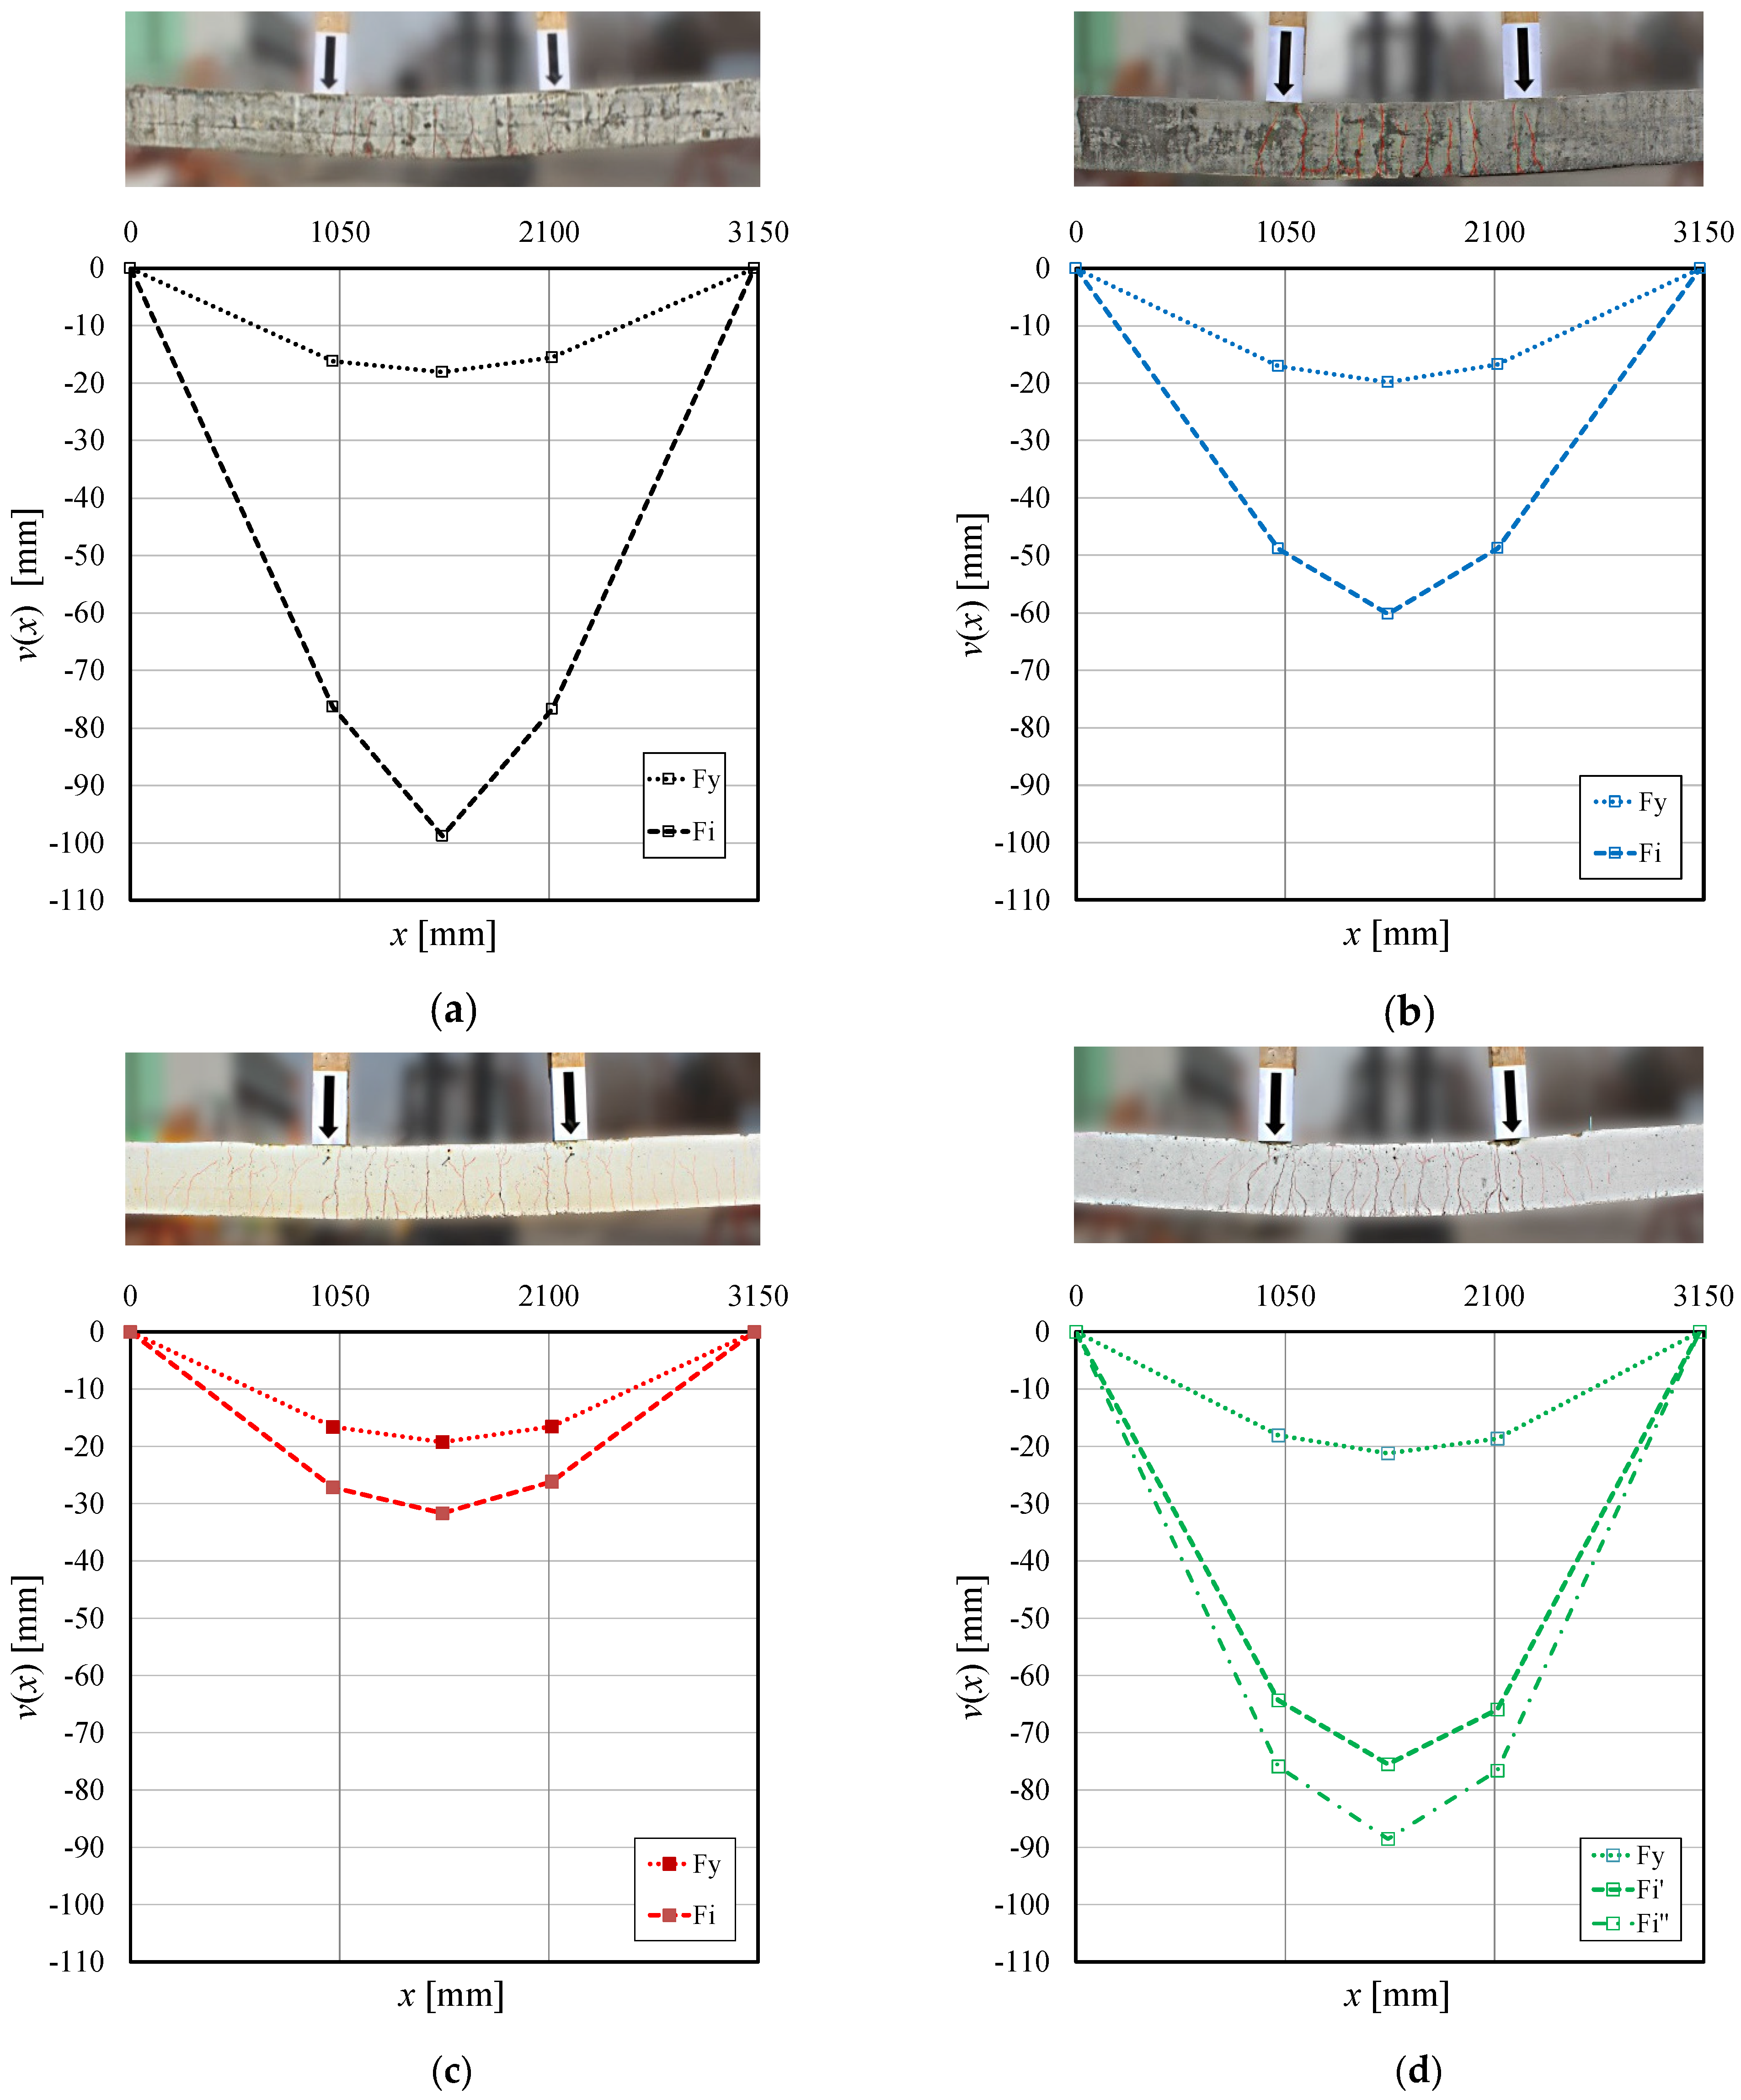
5. Analysis of Strain in the Fibers at Failure and Deformability of the Beams

In order to understand whether the strain corresponding to fiber rupture or interlaminar failure in DS tests (Section 3.1) was comparable with the strain in the fibers of the SRG in the strengthened beams when fiber rupture or interlaminar failure was observed, a simplified approach (described in this Section) was used.
On one hand, the bending moment (M)–curvature (χ) curve associated with a generic cross-section of the FRCM-strengthened RC beam was obtained by defining its three key points: (i) concrete cracking in tension (later on denoted by subscript crack,Th); (ii) steel bar yielding (denoted by subscript y,Th); and (iii) composite or concrete failure (denoted by subscript u,Th). The pairs (M, χ) corresponding to these key points are reported in Table 4, together with the neutral axis location expressed as its distance to the outermost fibers in compression (zu,Th), which was calculated at failure by solving the equilibrium equations (translation and rotation).
The pairs (M, χ) were calculated by assuming that cross-sections remained plane after deformation, and the following constitutive laws were adopted: the behavior of concrete in compression was described by a parabolic–constant branch curve [54] and the steel bars in tension were assumed to be linear elastic up to yielding, followed by a perfectly plastic response (the elastic modulus of steel Es was assumed equal to 206 GPa), and the yield strength can be found in Table 1. The contribution to the bending moment provided by concrete in tension was deemed negligible. Additionally, the perfect bond between concrete and internal steel reinforcement as well as between concrete and SRG was postulated. Steel fibers in the SRG were assumed to behave as linear elastic up to rupture with a strain at failure ε u , D S , E x p obtained from the results of single-lap direct shear (DS) tests herein presented as follows:
ε u , D S , E x p = P ^ t f b f E c o r d
where P ^ is equal to P ¯ * and P ¯ d e b for LD and MD fiber sheet specimens, respectively. The values of ε u , D S , E x p are reported in Table 5.
On the other hand, the experimental curvature χ E x p associated with any experimental bending moment, up to the maximum value (Mmax,Exp) attained during the bending tests, was obtained by considering the longitudinal strains at the intrados and at the extrados of the beam in the constant bending moment region. Both strains were derived as the ratio of the horizontal LPDT readings (their location is shown in Figure 4) divided by the corresponding gauge length. Experimental curvature χ E x p was then calculated as the ratio between the sum of the absolute values of the strain to the transducer vertical distance. Thus, the experimental bending moment–curvature curves (M-χ) obtained from the readings of the LPDTs (dashed lines and ending “_Exp” in the legend of Figure 13) are plotted together with the trilinear curves obtained from the cross-sectional analysis described before (continuous lines denoted by “_Th”) for specimens FB_Control, FB_2880_150_LD_1L (fiber rupture), and FB_2880_150_MD_1L (interlaminar failure) in Figure 13.
The agreement between the analytical and experimental M-χ curves until the yielding of the longitudinal steel reinforcing bars indicates that in the first part of the response, the assumption of a perfect bond between the constituent materials is acceptable. After the yielding of the longitudinal internal bars, the (M-χ)_Th curve from the cross-sectional analysis satisfactorily predicts the slope of the (M-χ)_Exp curve for beam FB_2880_150_LD_1L. For the same beam, the ultimate experimental curvature is overestimated (+12%) and is probably due to a possible failure of the composite at a lower stress level with respect to the DS tests. Instead, for beam FB_2880_150_MD_1L (interlaminar failure), the perfect bond and plane cross-section assumptions led to an overestimate of the post-yielding stiffness and an underestimate (−31%) of the ultimate curvature (solid red line in Figure 13). The cross-sectional analysis was able to predict the flexural capacity (3% difference between the experimental and analytical moments).
These results suggest that the role of the fiber–matrix interfacial bond behavior cannot be neglected if the deformability of the beam up to failure must be fully captured. For this purpose, it could be worth determining a fictitious experimental strain of the steel cords when loss of composite action occurred. This fictitious strain is named εu,FB,Exp and takes into account the bond behavior at the matrix–fiber interface. The authors herein propose to evaluate εu,FB,Exp as a function of the experimental value of the curvature at the loss of composite action, χ M max , E x p , and of the corresponding neutral axis position, zu,Exp (Table 5), according to the following expression:
ε u , F B , E x p = χ M max , E x p H + s 2 z u , E x p
The values of the strain corresponding to interlaminar failure were also estimated according to the following expression:
ε u = 2.57 t f E c o r d 0.53
which was proposed by Bencardino et al. [37] and is reported in Table 5 for the MD fiber sheet.
Finally, the steel fiber strain at the loss of composite action could be estimated according to another simplified approach, called the ΔM approach [17,31,37]. The strain based on the ΔM approach is termed ε u Δ M and evaluated according to the following expression:
ε u Δ M = Δ M A f E f β H
where ΔM is the difference between the bending moment of the strengthened beam at the loss of composite action (maximum bending moment) and that of the unstrengthened beam at the same midspan deflection. β’H is the moment arm of the composite with respect to the resultant of the compressive stresses in concrete (β′ can be assumed to be equal to 0.9 according to [37]). In this study, the location of the neutral axis at the loss of composite action (zu,Th) was evaluated through the cross-sectional analysis performed. β′ was equal to 0.92 and 0.87 for the FB_2880_150_LD_1L and FB_2880_150_MD_1L beams, respectively. In Table 5, the values of ε u Δ M are reported for beams FB_2880_150_LD_1L and FB_2880_150_MD_1L, together with the experimental values obtained from DS tests ( ε u , D S , E x p ) and using Equation (2) to compute εu,FB,Exp.
The results in Table 5 show that when the loss of composite action is caused by the rupture of the steel cords (FB_2880_150_LD_1L), the fictitious value of the strain in the steel fiber ( ε u , F B , E x p ) is slightly lower than the strain obtained from the DS tests ( ε u , D S , E x p ). However, for beam FB_2880_150_LD_1L, the value of the strain corresponding to the loss of composite action and determined with the ΔM approach is aligned with the value of ε u , D S , E x p . It should be noted that Equation (2) requires that the location of the neutral axis is known. Overall, the results for beam FB_2880_150_LD_1L, presented in Table 5, indicate that a small-scale test that focused on the local bond behavior could be sufficient to represent the actual flexural behavior of a beam (with one layer of fiber sheet) if a rupture of the fibers occurred.
The remainder of this Section is dedicated to beam FB_2880_150_MD_1L. When the loss of composite action is caused by interlaminar failure at the matrix–fiber interface (FB_2880_150_MD_1L), the fictitious value of the strain ε u , F B , E x p is greater (+40%) than that obtained from direct shear tests. If the value of ε u , F B , E x p is used in the cross-sectional analysis previously described, the corresponding flexural capacity becomes too large with respect to the corresponding experimental value. This can be observed from the M-χ curve labeled FB_2880_150_MD_1L_Th,Eq.(2) in Figure 14a (Figure 14b is a call out of Figure 14a), which is obtained using ε u , F B , E x p as the ultimate strain in the steel cords. Since the strain ε u , F B , E x p is obtained by considering the relative displacement (measured by the LPDTs) between two cross-sections, this relative displacement accounts for the slip at the matrix–fiber interface within the composite in addition to the deformation of the fibers, leading to an overestimate of the flexural capacity. To avoid this, an additional M-χ curve (green dashed line, labeled FB_2880_150_MD_1L_Th,Mod2 in Figure 14) was considered to capture the behavior of beam FB_2880_150_MD_1L. For this M-χ curve, the last key point was obtained by performing two separate cross-sectional analyses for the evaluation of the flexural capacity (M) and the curvature (χ). To determine the moment, the strain value ε u , D S , E x p was used, whereas to determine the curvature, the fictitious strain ε u , F B , E x p was used. The satisfactory matching between the FB_2880_150_MD_1L_Th,Mod2 curve and the experimental curve indicates that when interlaminar failure occurs, the maximum strain from the direct shear test, and the assumption of perfect bond can be used to predict the flexural capacity via cross-sectional analysis, but the deformability of the beam requires a different approach.
The values of ε u proposed by Bencardino et al. [37] and ε u Δ M for beam FB_2880_150_MD_1L are greater than and similar to, respectively, the value of ε u , F B , E x p (Table 5). Consequently, if these two values of the strain were used to determine the last key point of the M-χ curve in the cross-sectional analysis, an overestimate of the corresponding experimental value would be observed for beam FB_2880_150_MD_1L. The M-χ curves from the cross-sectional analysis that feature as the last key point both the moment and the curvature determined from the strains provided in Equations (3) and (4) overestimate the corresponding flexural capacity of the beam. These curves are named FB_2880_150_MD_1L_Th,E(3) and FB_2880_150_MD_1L_Th,Eq(4), respectively, in Figure 14.

6. Conclusions

The objective of the experimental campaign was to investigate the effectiveness of steel-reinforced grout (SRG) composites as strengthening systems for reinforced concrete (RC) beams. To this end, RC beams strengthened with one or two layers of SRG composites were tested. The SRG composite featured fiber sheets with two different densities, i.e., low (LD) and medium density (MD).
For the beam strengthened with one layer of LD fiber sheet SRG, the cementitious matrix adhered to the concrete substrate until steel cord failure was reached. On the other hand, for the beam strengthened with one layer of MD fiber sheet SRG, interlaminar failure occurred. It was observed that the limited spacing between steel cords in the MD sheet SRG prevented the mortar from properly penetrating in between the cords, which led to the fracture of the mortar matrix at the level of the fibers as they slipped with respect to the matrix (i.e., interlaminar failure).
Single-lap direct shear tests were conducted on SRG–concrete joints that feature one layer of an LD and MD fiber sheet. The failure modes were consistent with the observation reported above for the beams. For the SRG–concrete joints with the LD fiber sheet, a rupture of the fibers occurred; whereas, for the MD fiber sheet, interlaminar failure was observed in the single-lap test specimens. An additional RC beam was strengthened with two layers of LD SRG strips. In terms of failure mode and flexural capacity, the strengthening arrangement with two layers of LD SRG proved to be more effective than the application of one single layer of MD SRG (same strengthening cross-section). In fact, with two layers of LD fiber sheet SRG, the RC beam first experienced interlaminar failure at the level of the external layer of fibers. Consequently, the beam was left with one layer of LD fiber sheet SRG, which attained the tensile failure of the fibers.
The flexural behavior of RC beams strengthened with one layer of MD SRG was further investigated by introducing 150 or 250 mm long end anchors with different types of mortars to embed the fibers within the hole of the anchor. In total, five additional beams were tested. The experimental results showed that an anchor length of 150 mm was not sufficient to significantly increase the efficiency of the composite system, leading to a progressive slippage of the fibers at the ends of the SRG strip within the anchors. Increasing the anchor length from 150 mm to 250 mm improved the flexural behavior of the beam although slippage within the anchor was observed. Only when epoxy resin was used to fill the anchor holes with an anchor length of 250 mm, a failure mode characterized by crushing of concrete was observed without premature slippage within the anchor. However, it should be noted that the use of an inorganic mortar for the anchors with a length of 250 mm provided the highest flexural capacity, even though some slippage within the anchors was observed.
The addition of the anchors avoided or delayed the premature loss of composite action for the majority of the beams. Interlaminar failure within the SRG was still observed in the RC beams with anchors. However, when the interlaminar failure reached the end of the SRG, the presence of the anchors delayed or prevented the complete loss of composite action.
In terms of ductility, measured as the ratio of the midspan deflection corresponding to the loss of composite action (including slippage within the anchors), or concrete crushing to the deflection corresponding to the yielding of the internal reinforcement, the values ranged between 1.65 (MD fiber sheet SRG) and 4.17 (two layers of LD fiber sheets). Adding the anchors for the RC beams strengthened with MD SRG increased the ductility ratio to 5.27.
Finally, the estimate of the moment and curvature of the beam at loss of composite action using cross-sectional analysis and the strain at failure obtained from single-lap shear tests highlighted that in the case of the beam with one layer of LD fiber sheet SRG, the moment and curvature were very consistent with the corresponding experimental values. For the beam with one layer of MD SRG and no anchors, for which interlaminar failure occurred, the moment from the cross-sectional analysis was consistent with the experimental value corresponding to the loss of composite action. The curvature, on the other hand, was underestimated. In an attempt to determine a suitable value of the strain to capture the deformability of the beam, the author put forward a fictitious strain to determine via cross-sectional analysis the curvature at loss of composite action. This fictitious strain was determined from the readings of LPDTs mounted at the intrados and extrados of the beam. This approach allowed us to capture the curvature at the loss of composite action and indicated that slippage of the fibers in a beam might not be captured by the strain obtained in direct shear tests. Two additional values of the strain obtained from the literature were used to determine the curvature at loss of composite action. One of them, obtained from the so-called ΔM approach, was similar to the fictitious strain proposed by the authors. In terms of practical design consideration, this aspect is not critical since the static capacity of the system is always properly captured while the deformation capacity is not commonly used since the loss of composite action is not a ductile mechanism.

Author Contributions

Data curation, V.R. and M.S.; Writing—original draft, A.I.; Writing—review & editing, C.C.; Supervision, C.M. All authors have read and agreed to the published version of the manuscript.

Funding

The support of Kerakoll S.p.A. for materials supply and of the (Italian) Department of Civil Protection (DPC ReLUIS 2024-2026 Grant—WP14) are gratefully acknowledged.

Data Availability Statement

The original contributions presented in the study are included in the article, further inquiries can be directed to the corresponding author.

Acknowledgments

Diterihs Erra and Michele Esposito (CIRIEC technical staff) are gratefully acknowledged for collaboration on test preparation.

Conflicts of Interest

The authors declare no conflict of interest.

References

  1. Prota, A.; Manfredi, G.; Nanni, A.; Cosenza, E.; Pecce, M. Flexural strengthening of R/C beams using emerging materials: Ultimate behavior. In Proceedings of the CICE, Adelaide, Australia, 8–10 December 2004; pp. 163–170. [Google Scholar]
  2. Kim, J.Y.; Fam, A.; Kong, A.; El-Hacha, R. Flexural strengthening of RC beams using steel reinforced polymer (SRP) composites. In Proceedings of the 7th International Symposium FRP Reinforcement for Concrete Structures; ACI SP-230, 1, Paper #93; American Concrete Institute: Farmington Hills, MI, USA, 2005; pp. 1647–1664. [Google Scholar]
  3. Barton, B.; Wobbe, E.; Dharani, L.R.; Silva, P.; Birman, V.; Nanni, A.; Alkhrdaji, T.; Thomas, J.; Tunis, G. Characterization of reinforced concrete beams strengthened by steel reinforced polymer and grout (SRP and SRG) composites. Mater. Sci. Eng. A 2005, 412, 129–136. [Google Scholar]
  4. Prota, A.; Tan, K.Y.; Nanni, A.; Pecce, M.; Manfredi, G. Performance of shallow R/C beams with externally bonded steel-reinforced polymer. ACI Struct. J. 2006, 103, 163–170. [Google Scholar]
  5. Balsamo, A.; Nardone, F.; Iovinella, I.; Ceroni, F.; Pecce, M. Flexural strengthening of concrete beams with EB-FRP, SRP and SRCM: Experimental investigation. Compos. Part B 2013, 46, 91–101. [Google Scholar]
  6. Kalfat, R.; Al-Mahaidi, R.; Smith, S. Anchorage Devices Used to Improve the Performance of Reinforced Concrete Beams Retrofitted with FRP Composites: State-of-the-Art Review. J. Compos. Constr. 2013, 17, 14–33. [Google Scholar]
  7. Krevaikas, T.D.; Triantafillou, T.C. Masonry confinement with fibre-reinforced polymers. J. Compos. Constr. 2005, 9, 128–135. [Google Scholar]
  8. Corradi, M.; Grazini, A.; Borri, A. Confinement of brick masonry columns with CFRP materials. Compos. Sci. Technol. 2007, 67, 1772–1783. [Google Scholar]
  9. Aiello, M.A.; Micelli, F.; Valente, L. FRP confinement of square masonry columns. J. Compos. Constr. 2009, 13, 148–158. [Google Scholar]
  10. Di Ludovico, M.; D’Ambra, C.; Prota, A.; Manfredi, G. FRP Confinement of tuff and clay brick columns: Experimental study and assessment of analytical models. J. Compos. Constr. 2010, 14, 583–596. [Google Scholar]
  11. Incerti, A.; Vasiliu, A.; Ferracuti, B.; Mazzotti, C. Uni-Axial compressive tests on masonry columns confined by FRP and FRCM. In Proceedings of the 12th FRPRCS and 5th APFIS Conference, Nanjing, China, 14–16 December 2015. [Google Scholar]
  12. Mazzotti, C.; Sassoni, E.; Bellini, A.; Ferracuti, B.; Franzoni, E. Strengthening of masonry elements by FRP: Influence of brick mechanical and microstructural properties. Key Eng. Mater. 2015, 624, 330–337. [Google Scholar]
  13. Ferretti, F.; Incerti, A.; Ferracuti, B.; Mazzotti, C. Diagonal compression tests on masonry panels strengthened by FRP and FRCM. In Proceedings of the 10th SAHC Conference; Van Balen, K., Verstrynge, E., Eds.; Taylor & Francis Group: London, UK, 2016. [Google Scholar]
  14. Bencardino, F.; Spadea, G.; Swamy, R.N. Strength and ductility of reinforced concrete beams externally reinforced with carbon fiber fabric. ACI Struct. J. 2002, 99, 163–171. [Google Scholar]
  15. Wobbe, E.; Silva, P.; Barton, B.L.; Dharani, L.R.; Birman, V.; Nanni, A.; Alkhrdaji, T.; Thomas, J.; Tunis, T. Flexural capacity of R/C beams externally bonded with SRP and SRG. In Proceedings of the Society for the Advancement of Material and Process Engineering Symposium, Long Beach, CA, USA, 16–20 May 2004; pp. 20–27. [Google Scholar]
  16. Casadei, P.; Nanni, A.; Alkhrdaji, T.; Thomas, J. Performance of double-t prestressed concrete beams strengthened with steel reinforced polymer. Adv. Struct. Eng. 2005, 8, 427–442. [Google Scholar] [CrossRef]
  17. Babaeidarabad, S.; De Caso, F.; Nanni, A. URM walls strengthened with fabric-reinforced cementitious matrix composite subjected to diagonal compression. J. Compos. Constr. 2014, 18, 04013045. [Google Scholar] [CrossRef]
  18. De Felice, G.; De Santis, S.; Garmendia, L.; Ghiassi, B.; Larrinaga, P.; Lourenço, P.B.; Oliveira, D.V.; Paolacci, F.; Papanicolaou, C.G. Mortar-based systems for externally bonded strengthening of masonry. Mater. Struct. 2014, 47, 2021–2037. [Google Scholar] [CrossRef]
  19. D’Antino, T.; Carloni, C.; Sneed, L.H.; Pellegrino, C. Matrix-fiber bond behavior in PBO FRCM composites: A Fracture Mechanics Approach. Eng. Fract. Mech. 2014, 117, 94–111. [Google Scholar] [CrossRef]
  20. Hawileh, R.; Abdalla, J.; Nawaz, W.; Alzeer, A.; Muwafi, R.; Faridi, A. Strengthening reinforced concrete beams in flexure using hardwire steel fiber sheets. In Proceedings of the CICE, Vancouver, BC, Canada, 20–22 August 2014; p. 22. [Google Scholar]
  21. Napoli, A.; Realfonzo, R. Reinforced concrete beams strengthened with SRP/SRG systems: Experimental investigation. Constr. Build. Mater. 2015, 93, 654–677. [Google Scholar] [CrossRef]
  22. Sneed, L.H.; Verre, S.; Carloni, C.; Ombres, L. Flexural Behavior of RC Beams Strengthened with Steel-FRCM Composites. Eng. Struct. 2016, 127, 686–699. [Google Scholar] [CrossRef]
  23. Ferretti, F.; Incerti, A.; Ferracuti, B.; Mazzotti, C. FRCM strengthened masonry panels: The role of mechanical anchorages and symmetric layouts. Key Eng. Mater. 2017, 747, 334–341. [Google Scholar] [CrossRef]
  24. Incerti, A.; Ferretti, F.; Mazzotti, C. FRCM strengthening systems efficiency on the shear behavior of pre-damaged masonry panels: An experimental study. J. Build. Pathol. Rehabil. 2019, 4, 14. [Google Scholar] [CrossRef]
  25. Incerti, A.; Tilocca, A.R.; Ferretti, F.; Mazzotti, C. Influence of Masonry Texture on the Shear Strength of FRCM Reinforced Panels; RILEM Bookseries; Springer: Cham, Switzerland, 2019; Volume 18, pp. 1623–1631. [Google Scholar]
  26. Cascardi, A.; Longo, F.; Micelli, F.; Aiello, M.A. Compressive strength of confined column with Fiber Reinforced Mortar (FRM): New design-oriented-models. Constr. Build. Mater. 2017, 156, 387–401. [Google Scholar] [CrossRef]
  27. Carozzi, F.G.; Bellini, A.; D’Antino, T.; De Felice, G.; Focacci, F.; Hojdys, L.; Laghi, L.; Lanoye, E.; Micelli, F.; Panizza, M.; et al. Experimental investigation of tensile and bond properties of Carbon-FRCM composites for strengthening masonry elements. Compos. Part B 2017, 128, 100–119. [Google Scholar] [CrossRef]
  28. Incerti, A.; Santandrea, M.; Carloni, C.; Mazzotti, C. Destructive in situ tests on masonry arches strengthened with FRCM composite materials. Key Eng. Mater. 2017, 747, 567–573. [Google Scholar] [CrossRef]
  29. Bellini, A.; Incerti, A.; Bovo, M.; Mazzotti, C. Effectiveness of FRCM Reinforcement Applied to Masonry Walls Subject to Axial Force and Out-Of-Plane Loads Evaluated by Experimental and Numerical Studies. Int. J. Archit. Herit. 2018, 12, 376–394. [Google Scholar] [CrossRef]
  30. Kouris, L.A.S.; Triantafillou, T.C. State-of-the-art on strengthening of masonry structures with textile reinforced mortar (TRM). Constr. Build. Mater. 2018, 188, 1221–1233. [Google Scholar] [CrossRef]
  31. Bencardino, F.; Condello, A. Structural behaviour of RC beams externally strengthened in flexure with SRG and SRP systems. Int. J. Struct. Eng. 2014, 5, 346–368. [Google Scholar]
  32. Micelli, F.; Di Ludovico, M.; Balsamo, A.; Manfredi, G. Mechanical behaviour of FRP-confined masonry by testing of full-scalle columns. Mater. Struct. 2014, 47, 2081–2100. [Google Scholar] [CrossRef]
  33. Ebead, U.; El-Sherif, H. Near surface embedded-FRCM for flexural strengthening of reinforced concrete beams. Constr. Build. Mater. 2019, 204, 166–176. [Google Scholar]
  34. Aljazaeri, Z.R.; Janke, M.A.; Myers, J.J. A novel and effective anchorage system for enhancing the flexural capacity of RC beams strengthened with FRCM composite. Compos. Struct. 2019, 210, 20–28. [Google Scholar] [CrossRef]
  35. Spadea, G.; Bencardino, F.; Sorrenti, F.; Swamy, R.N. Structural effectiveness of FRP materials in strengthening RC beams. Eng. Struct. 2015, 99, 631–641. [Google Scholar]
  36. Raoof, S.M.; Koutas, L.N.; Bournas, D.A. Textile-reinforced mortar (TRM) versus fibre-reinforced polimer (FRP) in flexural strengthening of RC beams. Constr. Build. Mater. 2017, 151, 279–291. [Google Scholar]
  37. Bencardino, F.; Carloni, C.; Condello, A.; Focacci, F.; Napoli, A.; Realfonzo, R. Flexural behaviour of RC members strenghtened with FRCM: State-of-the-art and predictive formulas. Compos. Part B Eng. 2018, 148, 132–148. [Google Scholar]
  38. D’Antino, T.; Focacci, F.; Sneed, L.H.; Carloni, C. Relationship between the Effective Strain of PBO FRCM-Strengthened RC Beams and the Debonding Strain of Direct Shear Tests. Eng. Struct. 2020, 214, 110631. [Google Scholar] [CrossRef]
  39. BS EN 197-1:2019; Cement—Part 1: Composition, Specifications and Conformity Criteria for Common Cements. BSI Group: London, UK, 2019.
  40. BS EN 12390-3:2019; Testing Hardened Concrete—Compressive Strength of Test Specimens. BSI Group: London, UK, 2019.
  41. BS EN 12390-13:2013; Testing Hardened Concrete—Determination of Secant Modulus of Elasticity in Compression. BSI Group: London, UK, 2013.
  42. Carloni, C.; Santandrea, M.; Imohamed, A.O. Determination of the interfacial properties of SRP strips bonded to concrete and comparison between single-lap and notched beam tests. Eng. Fract. Mech. 2017, 186, 80–104. [Google Scholar]
  43. Carloni, C.; Santandrea, M.; Wendner, R. An investigation on the “width and size effect in the evaluation of the fracture energy of concrete”. Procedia Struct. Integr. 2017, 3, 450–458. [Google Scholar]
  44. Hillerborg, A. The theoretical basis of a method to determine the fracture energy GF of concrete. Mater. Struct. 1985, 18, 291–296. [Google Scholar] [CrossRef]
  45. Elices, M.; Guinea, V.G.; Planas, J. Measurement of the fracture energy using three-point bend tests: Part 3—Influence of cutting the P-δ tail. Mater. Struct. 1992, 25, 327–334. [Google Scholar]
  46. Hoover, C.G.; Bažant, Z.P. Comprehensive concrete fracture tests: Size effects of types 1 & 2, crack length effect and postpeak. Eng. Fract. Mech. 2013, 110, 281–289. [Google Scholar]
  47. ISO 15630-1:2010; Steel for the Reinforcement and Prestressing of Concrete—Test Methods–Part 1: Reinforcing Bars, Wire Rod and Wire. ISO: Geneva, Switzerland, 2010.
  48. Kerakoll Spa Website. Available online: https://products.kerakoll.com/en/c/repair-and-structural-strengthening-anti-seismic (accessed on 17 March 2025).
  49. De Santis, S.; Carozzi, F.G.; De Felice, G.; Poggi, C. Test methods for Textile Reinforced Mortar systems. Compos. Part B Eng. 2017, 127, 121–132. [Google Scholar]
  50. BS EN 1015-11:2019; Methods of Test for Mortar For Masonry Determination of Flexural and Compressive Strength of Hardened Mortar. BSI Group: London, UK, 2019.
  51. D’Antino, T.; Sneed, L.H.; Carloni, C.; Pellegrino, C. Effect of the Inherent Eccentricity in Single-Lap Direct Shear Tests of FRCM-Concrete Joints. Compos. Struct. 2016, 142, 117–129. [Google Scholar]
  52. Ascione, L.; Carozzi, F.G.; D’Antino, T.; Poggi, C. New Italian guidelines for design of externally bonded Fabric-Reinforced Cementitious Matrix (FRCM) systems for repair and strengthening of masonry and concrete structures. Procedia Struct. Integr. 2018, 11, 202–209. [Google Scholar]
  53. ASTM D8337; Standard Test Method for Evaluation of Bond Properties of FRP Composite Applied to Concrete Substrate Using Single-Lap Shear Test. ASTM: West Conshohocken, PA, USA, 2021.
  54. EN 1992-1-1; Eurocode 2—Design of Concrete Structures. European Committee for Standardization: Brussels, Belgium, 2004.
Figure 1. Direct shear test setup: (a) side view; (b) front view; and (c) top view. [Dimensions in mm].
Buildings 15 01005 g001
Figure 2. Steel reinforcement layout of RC beams. [Dimensions in mm].
Buildings 15 01005 g002
Figure 3. Dimensions and layout of the SRG composite for specimens strengthened (a) without and (b) with mechanical anchors. [Dimensions in mm].
Buildings 15 01005 g003
Figure 4. The layout of the flexural test setup with the location of the transducers used to measure the deformation of the beam. [Dimensions in mm].
Buildings 15 01005 g004
Figure 5. σ-g responses for SRG–concrete joints that featured (a) LD fiber sheets and (b) MD fiber sheets.
Buildings 15 01005 g005
Figure 6. Failure modes of the single-lap shear tests: (a) fiber tensile failure and (b) interlaminar failure.
Buildings 15 01005 g006
Figure 7. Load (F) midspan deflection (Δ) curves for (a) all specimens; (b) specimens of group A 305 (zoom); and (c) specimens of group B (zoom).
Buildings 15 01005 g007
Figure 8. Failure modes for the beams of group A: (a) fiber rupture for FB_2880_150_LD_1L; (b) formation of the interlaminar crack for specimen FB_2880_150_MD_1L; (c) loss of composite action due to the propagation of the interlaminar crack for specimen FB_2880_150_MD_1L; and (d) fiber rupture for specimen FB_2880_150_LD_2L.
Buildings 15 01005 g008
Figure 9. Beam deflection profile v(x) at different values of the applied load Fi for specimens of group A: (a) specimen FB_Control; (b) specimen FB_2880_150_LD_1L; (c) specimen FB_2880_150_MD_1L; and (d) specimen FB_2880_150_LD_2L.
Buildings 15 01005 g009
Figure 10. Photos of the anchors at the end of the test for specimens: (a) FB_2400_150_MD_1L_CM150, (b) FB_2400_150_MD_1L_B150, and (c) FB_2400_150_MD_1L_ER150.
Buildings 15 01005 g010
Figure 11. Photos of the anchors at the end of the test for specimens (a) FB_2400_150_MD_1L_B250 and (b) FB_2400_150_MD_1L_ER250.
Buildings 15 01005 g011
Figure 13. M-χ curves: experimental curve versus analytical curves obtained from cross-sectional analysis.
Buildings 15 01005 g013
Figure 14. M-χ curves: (a) comparison between experimental and analytical curves; (b) call out.
Buildings 15 01005 g014
Table 1. Experimental results of tensile tests on the steel bars used for internal reinforcement.
fy,s (MPa)
(CoV)
ft,s (MPa)
(CoV)
εu,s (%)
(CoV)
Ø16512.4
(0.01)
636.1
(0.01)
17.9
(0.06)
Ø10584.1
(0.01)
624.1
(0.02)
6.7
(0.17)
Ø8607.8
(0.02)
637.2
(0.01)
4.7
(0.08)
Table 2. Experimental campaign of full-scale RC beams: characteristics of the specimens.
SpecimenFiber Sheet DensityNumber of LayerAnchor MaterialLa
(mm)
FB_Control----
FB_2880_150_LD_1LLD1--
FB_2880_150_MD_1LMD1--
FB_2880_150_LD_2LLD2--
FB_2400_150_MD_1L_CM150MD1Cementitious mortar150
FB_2400_150_MD_1L_B150MD1Inorganic mortar150
FB_2400_150_MD_1L_ER150MD1Epoxy resin150
FB_2400_150_MD_1L_B250MD1Inorganic mortar250
FB_2400_150_MD_1L_ER250MD1Epoxy resin250
Table 3. Experimental results of the FPB tests of the RC beams (groups A and B).
SpecimenFy or Fy,control
[kN]
F y F y , c o n t r o l Fi
[kN]
F i F y Δy [mm]Δi [mm] μ i = Δ i Δ y Failure Mode
FB_Control101.7---18.1100.15.53 (µc)C
FB_2880_150_LD_1L112.91.11126.71.1219.960.23.03 (µc)T
FB_2880_150_MD_1L115.51.14122.21.0619.231.71.65 (µc)I
FB_2880_150_LD_2L116.91.15140.2
126.4
1.20
1.08
21.275.5
88.6
3.56
4.17 (µc)
I
T
FB_2400_150_MD_1L_CM150114.31.12129.41.1318.940.92.16 (µc)I/S
FB_2400_150_MD_1L_B150117.01.15126.9
131.3
131.9
122.1
1.08
1.12
1.13
1.04
19.634.2
51.5
61.1
71.3
1.75
2.63
3.12
3.64 (µc)
I
C
S
S
FB_2400_150_MD_1L_ER150117.31.15126.1
124.7
127.5
120.7
119.2
1.08
1.06
1.09
1.03
1.02
20.035.5
42.3
52.4
56.1
105.2
1.71
2.12
2.62
2.81
5.27 (µc)
I
I
C
S
S
FB_2400_150_MD_1L_B250116.91.15127.7
129.1
138.2
1.09
1.10
1.18
20.340.2
48.3
95.6
1.99
2.38
4.72 (µc)
I
I
C
FB_2400_150_MD_1L_ER250114.61.13123.6
125.0
130.3
129.9
1.08
1.09
1.14
1.13
20.036.0
50.9
81.8
93.4
1.80
2.54
4.10
4.68 (µc)
I
I
C
C
C = concrete crushing; I = interlaminar; S = slippage of the anchor; T = fiber tensile failure.
Table 4. Key points of the M-χ curves obtained from cross-sectional analysis.
SpecimenMcrack,Th
(kNm)
χcrack,Th
(1/m)
My,Th
(kNm)
χy,Th
(1/m)
Mu,Th
(kNm)
χu,Th
(1/m)
zu,Th
(mm)
FB_Control7.30.0005353.40.0153255.80.08147-
FB_2880_150_LD_1L9.30.0006556.70.0157866.30.0593954
FB_2880_150_MD_1L9.30.0006557.80.0161861.20.0214071
Table 5. Maximum experimental bending moment and corresponding curvature and fiber strain for strengthened beams without anchors using different approaches.
SpecimenMmax,Exp
(kN-m)
χ M max , E x p
(1/m)
zu,Exp
(mm)
εu,FB,Exp
(%)
ε u (%) ε u Δ M
(%)
εu,DS,Exp (%)
FB_2880_150_LD_1L64.30.053671.257-1.6561.594
FB_2880_150_MD_1L62.00.031710.7221.0500.7920.499
Disclaimer/Publisher’s Note: The statements, opinions and data contained in all publications are solely those of the individual author(s) and contributor(s) and not of MDPI and/or the editor(s). MDPI and/or the editor(s) disclaim responsibility for any injury to people or property resulting from any ideas, methods, instructions or products referred to in the content.

