
The Impact Characteristics of Common Low-Carbon Design Methods on Reducing Carbon Emissions in Industrial Plant Buildings in Architectural Design


Abstract
1. Introduction
1.1. Background
1.2. Literature Review
1.2.1. Evaluation Methods for Building Carbon Emissions
1.2.2. Research Boundaries for Building Carbon Emissions
1.2.3. Relevant Carbon Emission Quantitative Analysis Software and Low-Carbon Design Tools
1.2.4. Low-Carbon Design Strategies and Technical Measures for Buildings in Cold/Severely Cold Regions
1.2.5. Research on Low-Carbon Design of Industrial Buildings
1.2.6. Summary of Current Research Status
2. Method
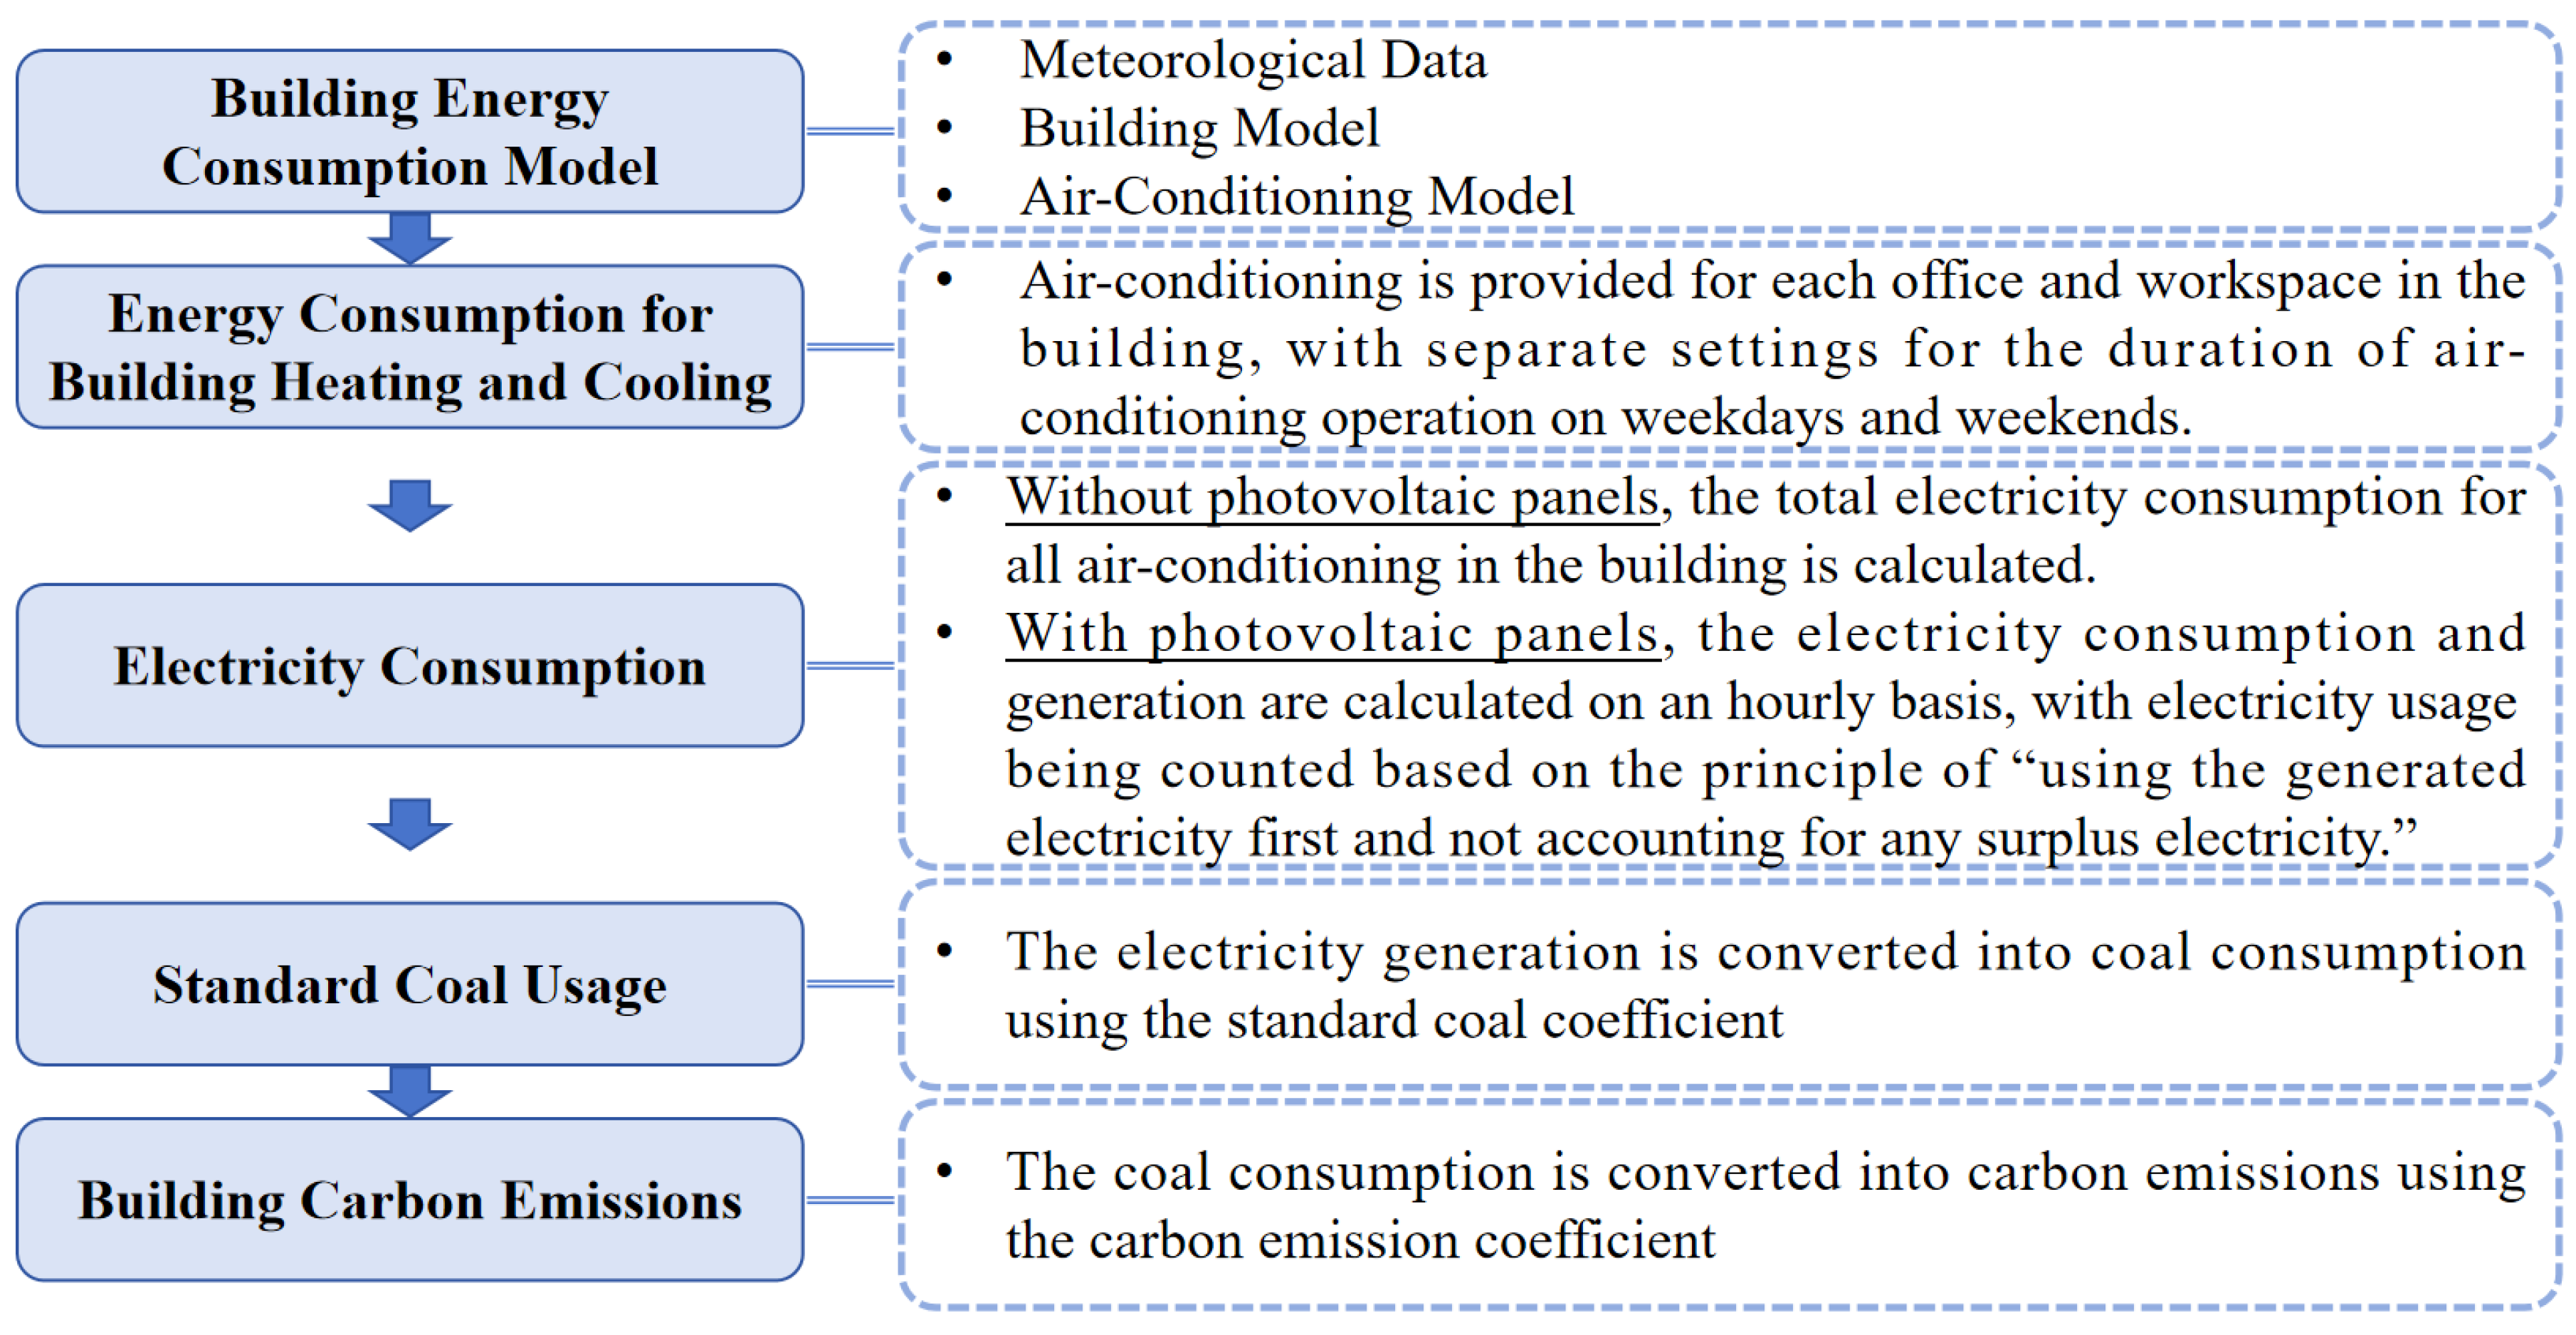
2.1. Method for Calculating Building Carbon Emissions
2.2. Model Initialization
2.2.1. Calculation Model
2.2.2. General Model Settings
2.2.3. Hierarchical Approach to Low-Carbon Design
- (1)
- Architectural Layout Level
- (2)
- Building Material Level
- (3)
- Technical Measures Level
2.3. Meteorological Data
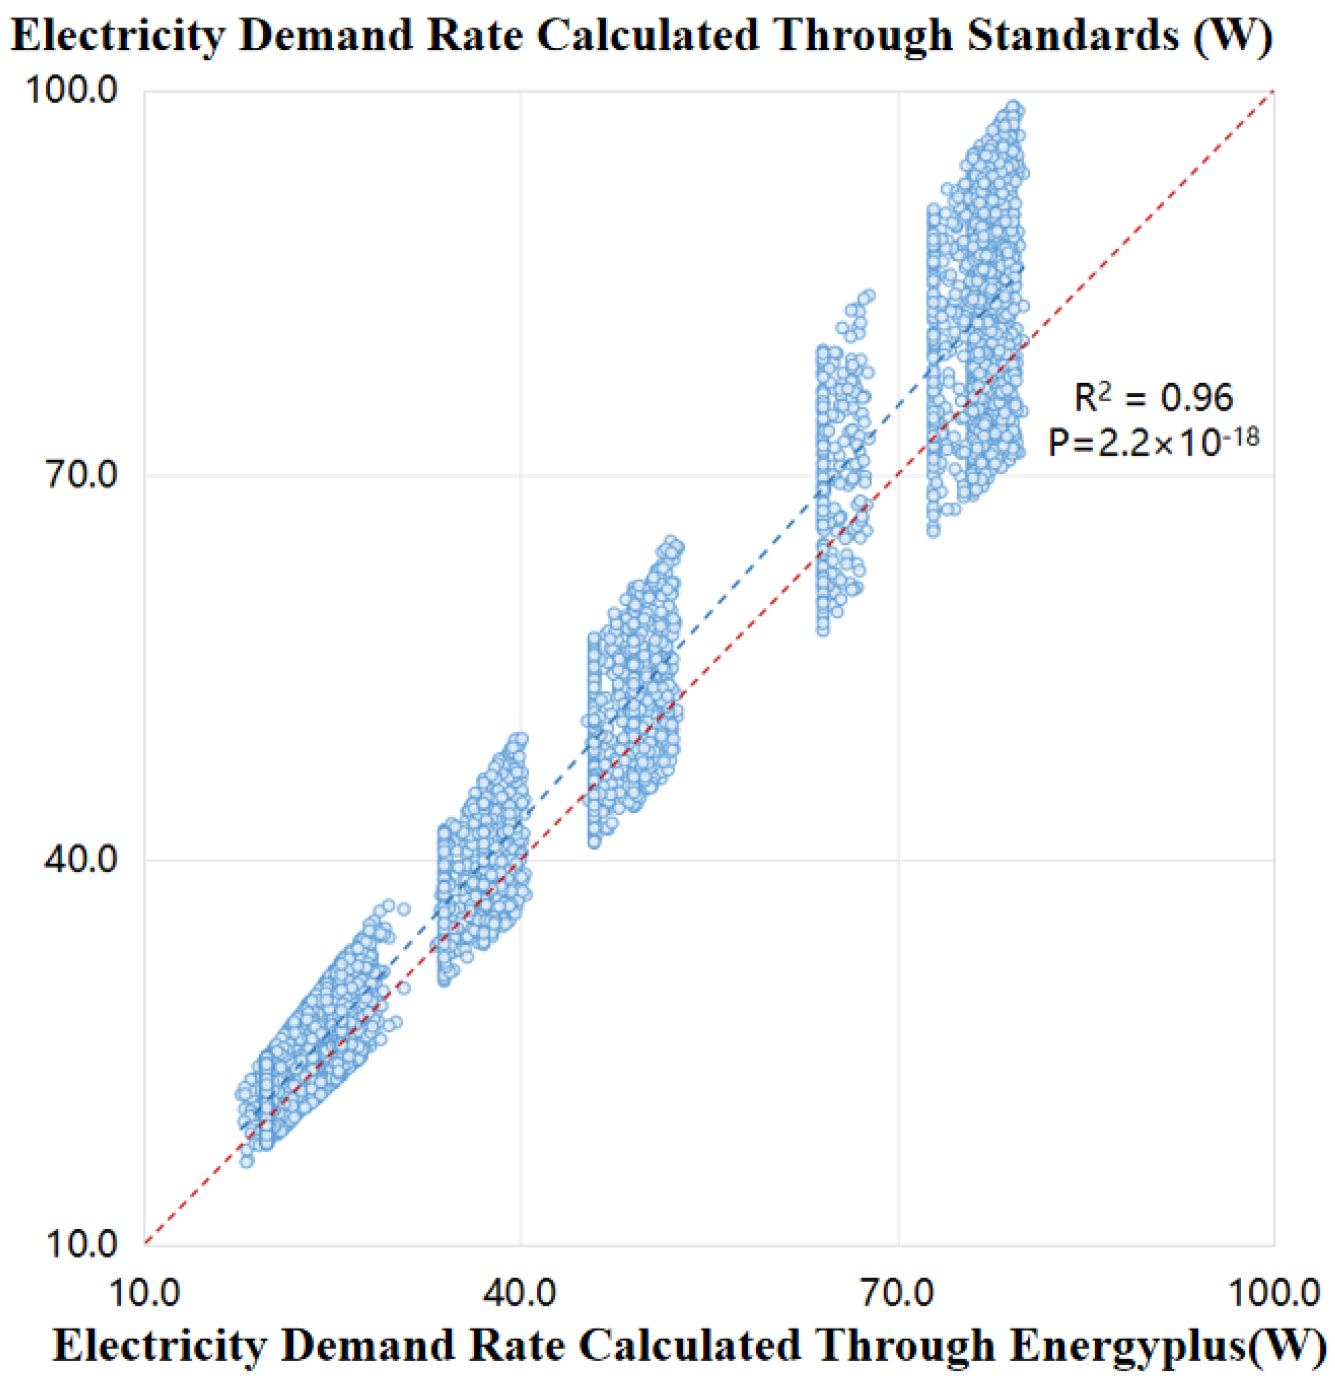
2.4. Accuracy of the Calculation Results
3. Results
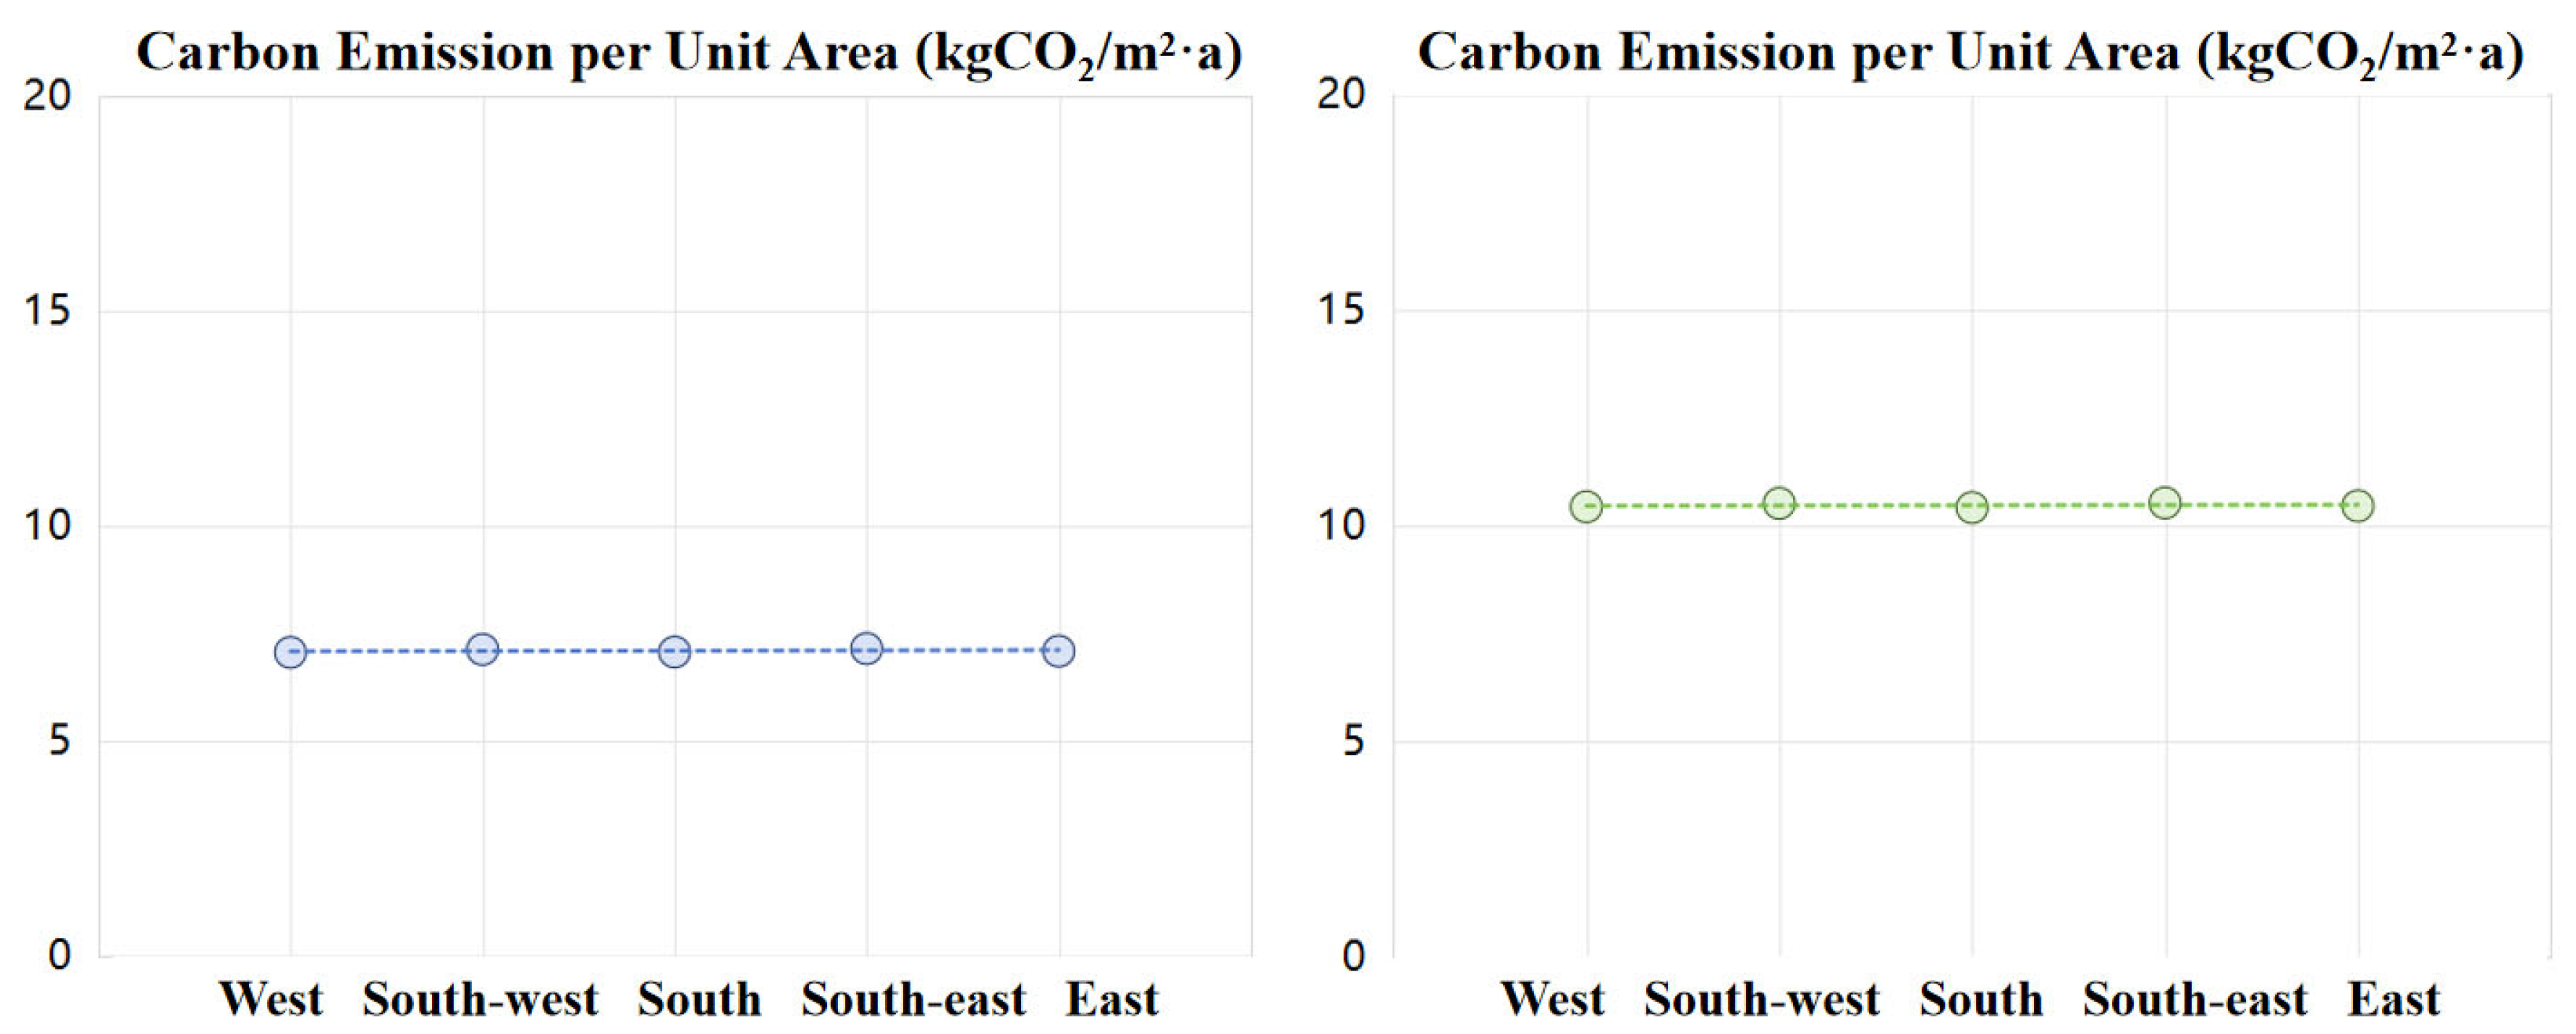
3.1. Architectural Layout Level
- (1)
- Building Orientation
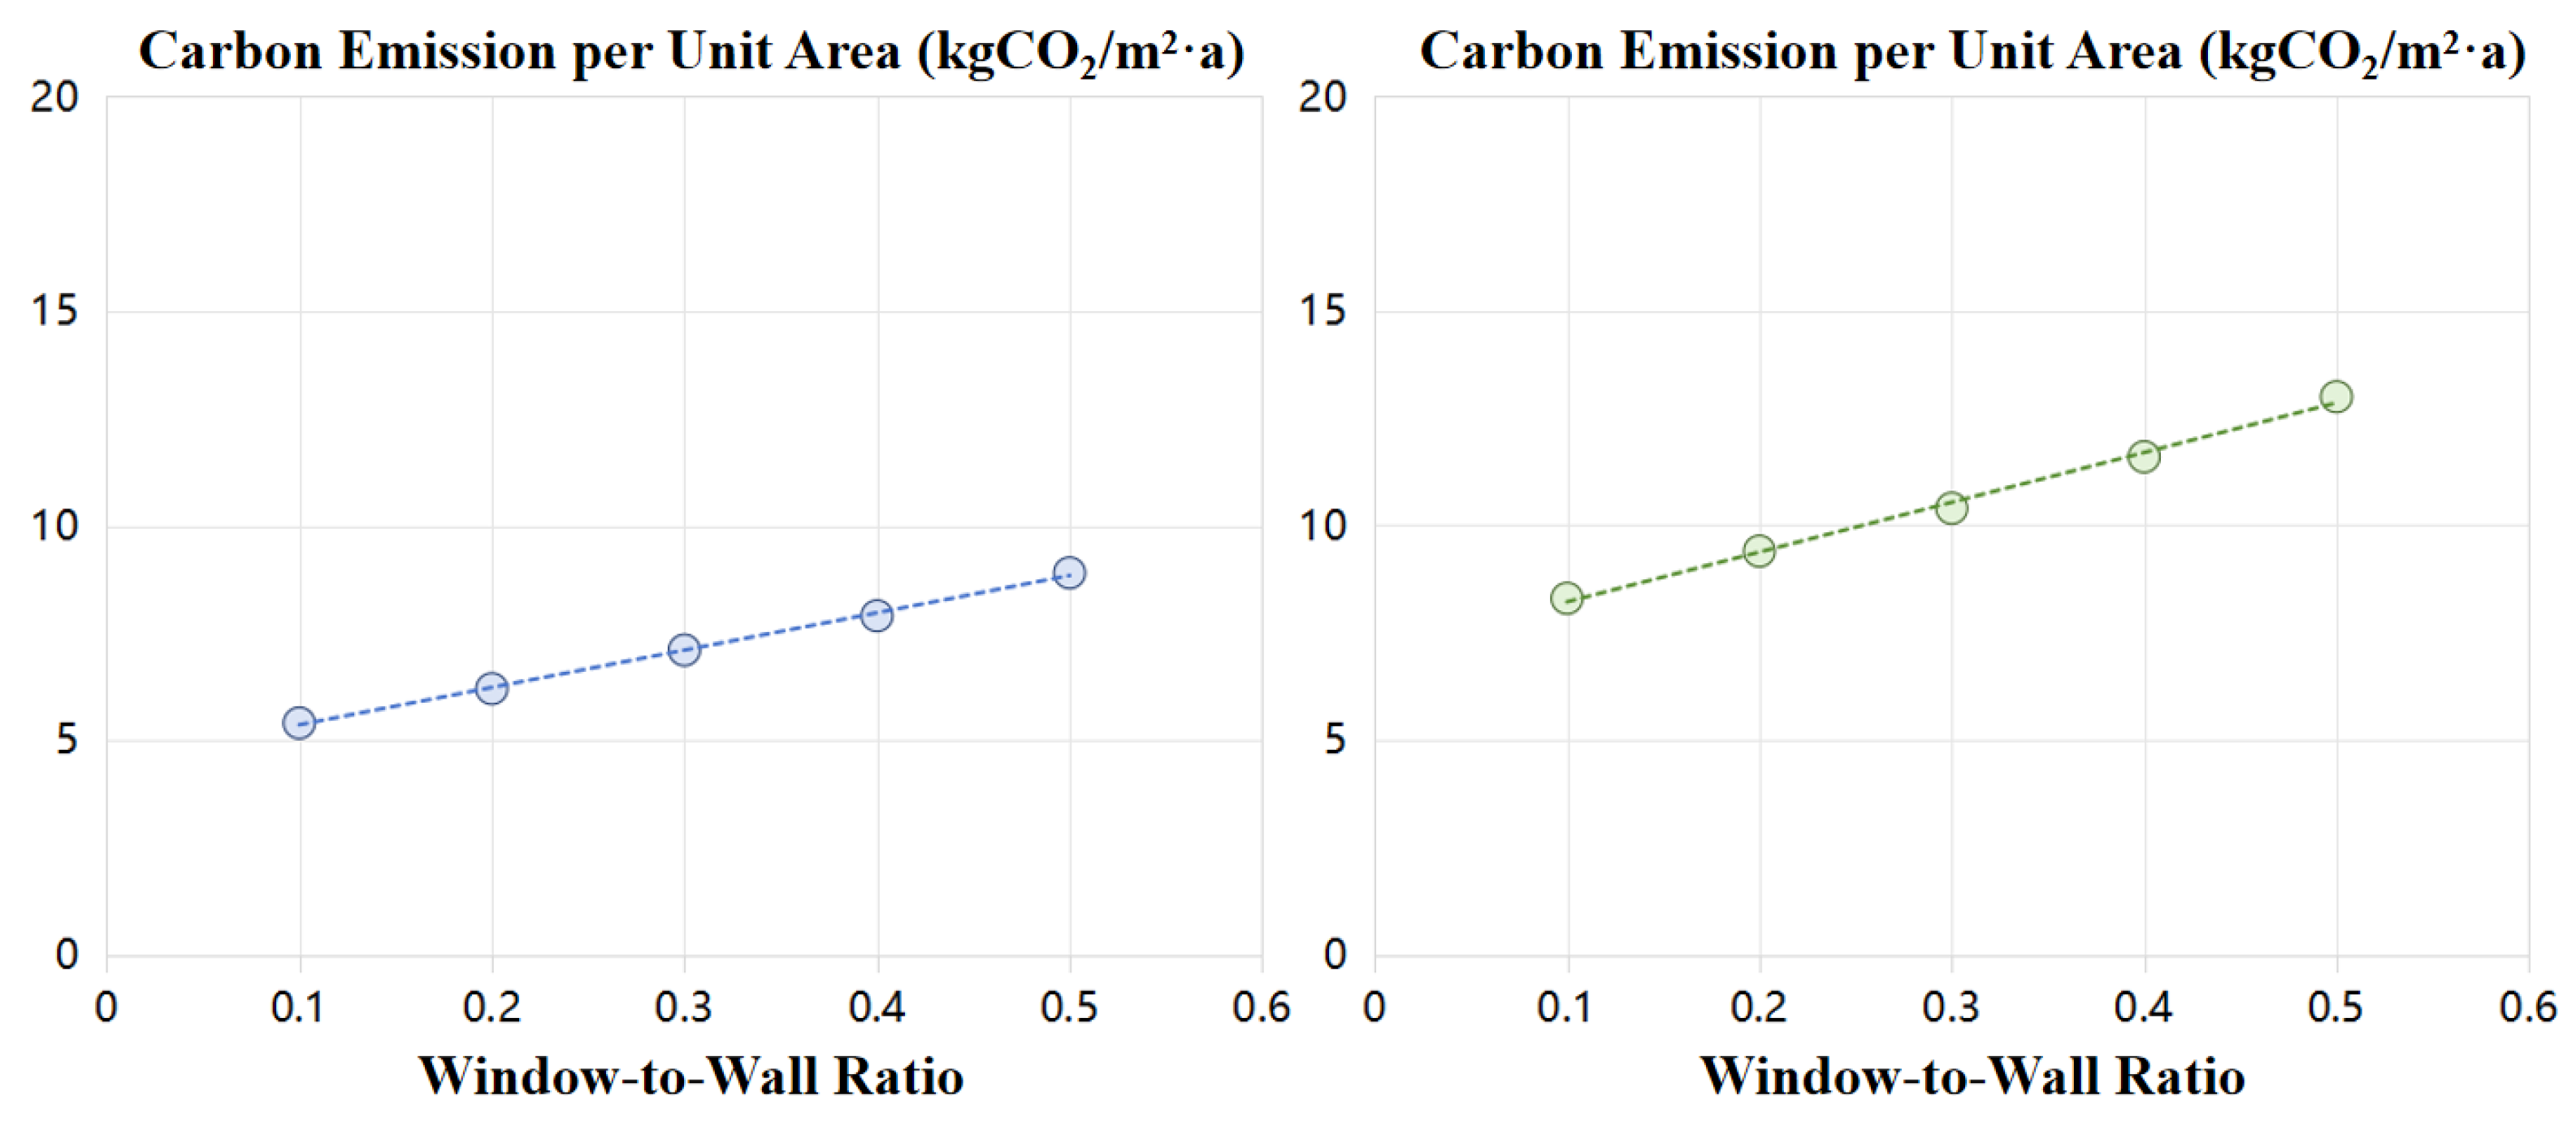
- (2)
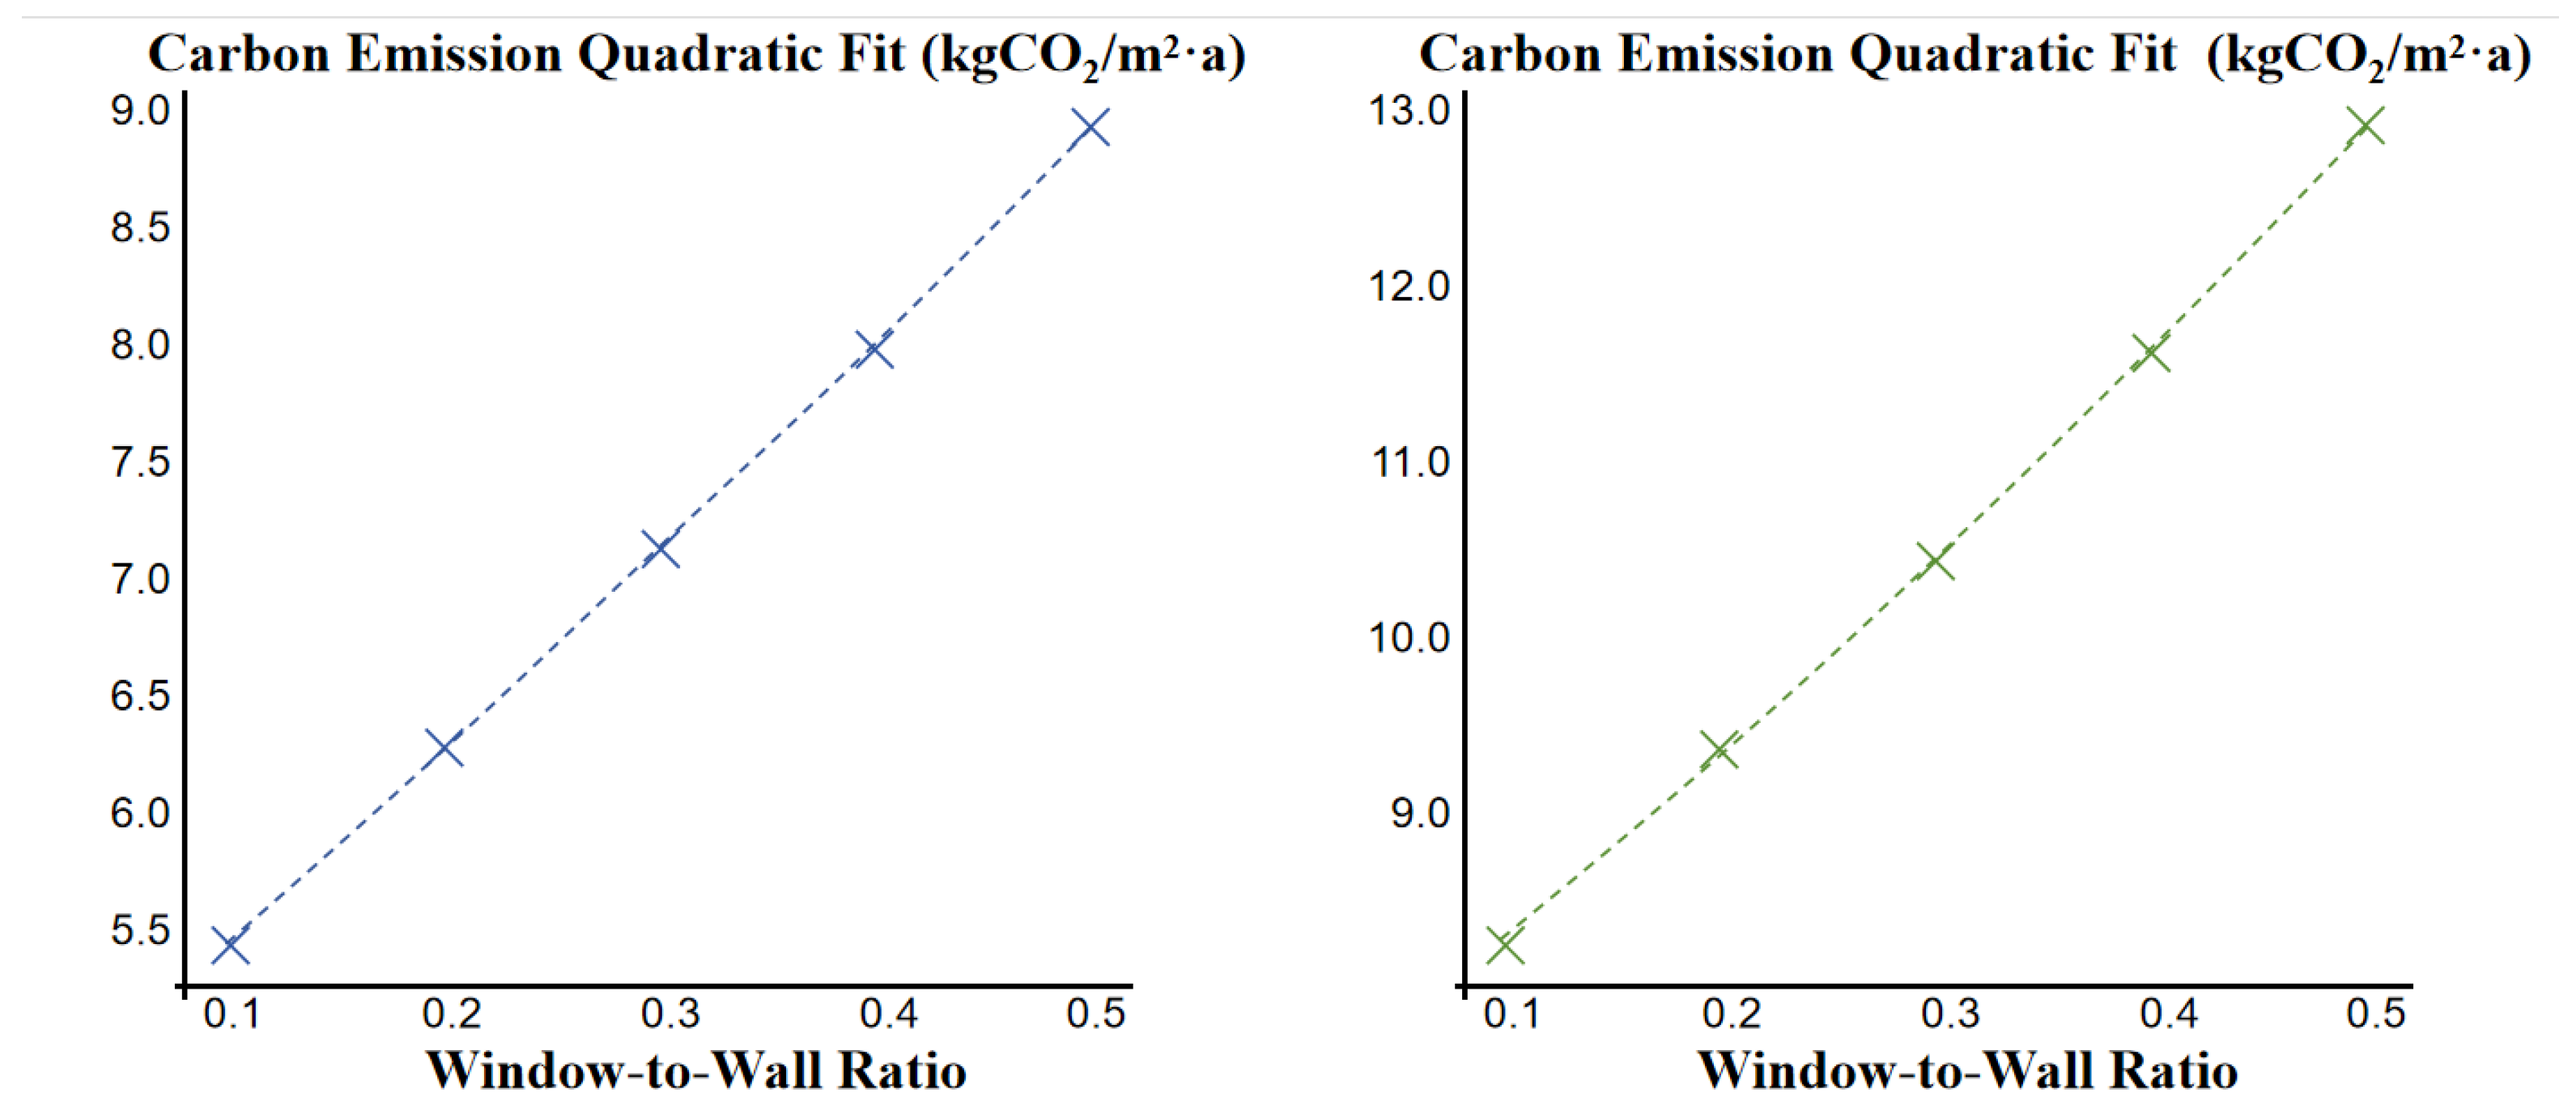
- Window-to-Wall Ratio
3.2. Building Material Level
- (1)
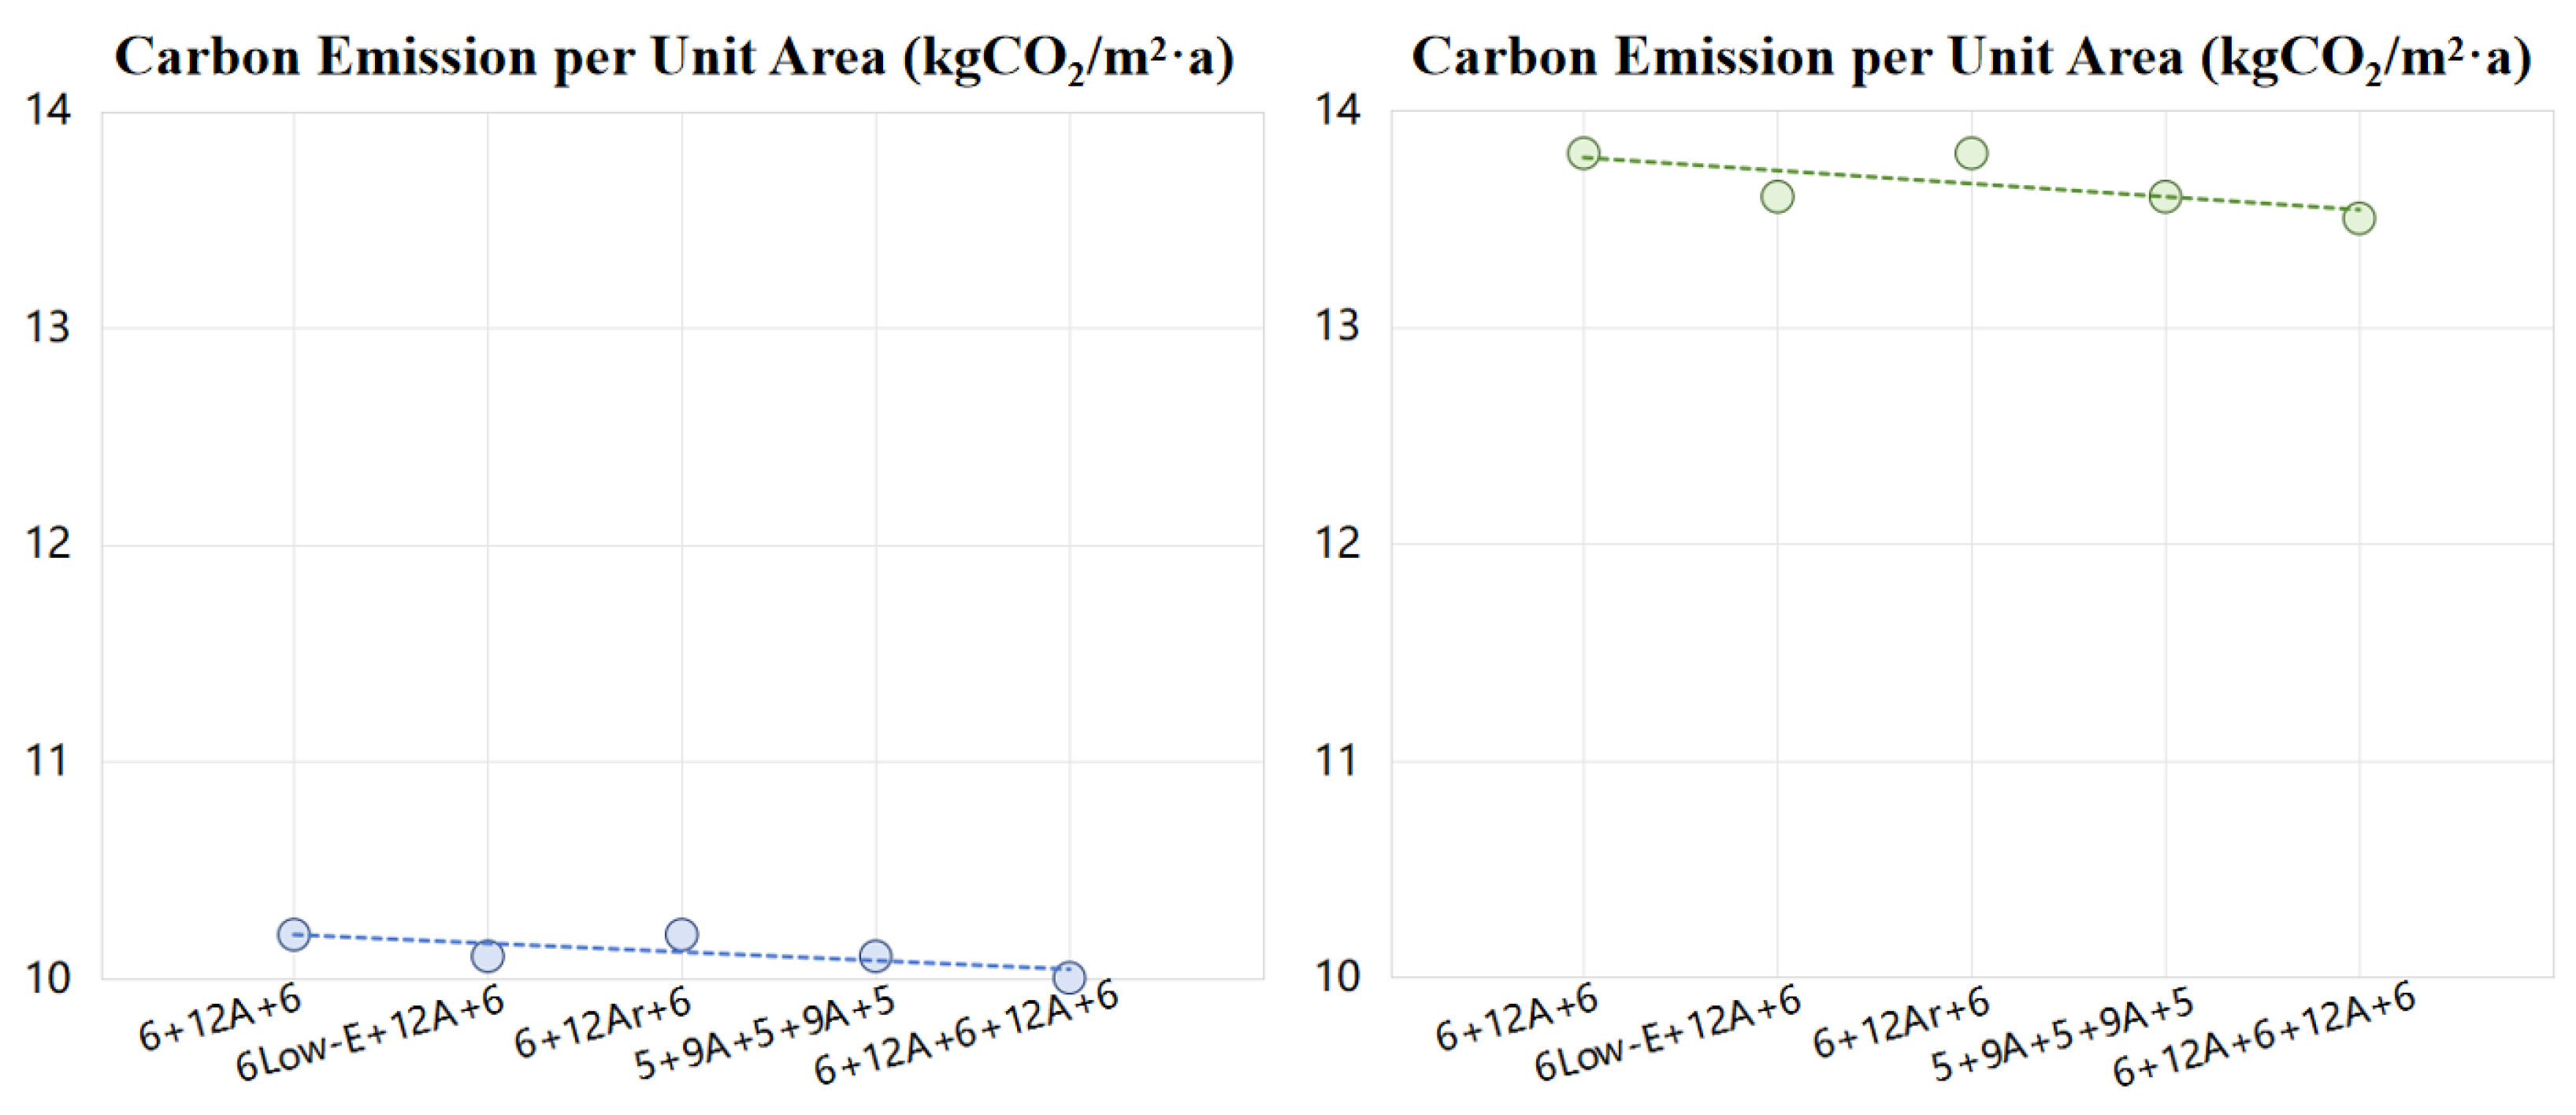
- Window Glass Forms
- (2)
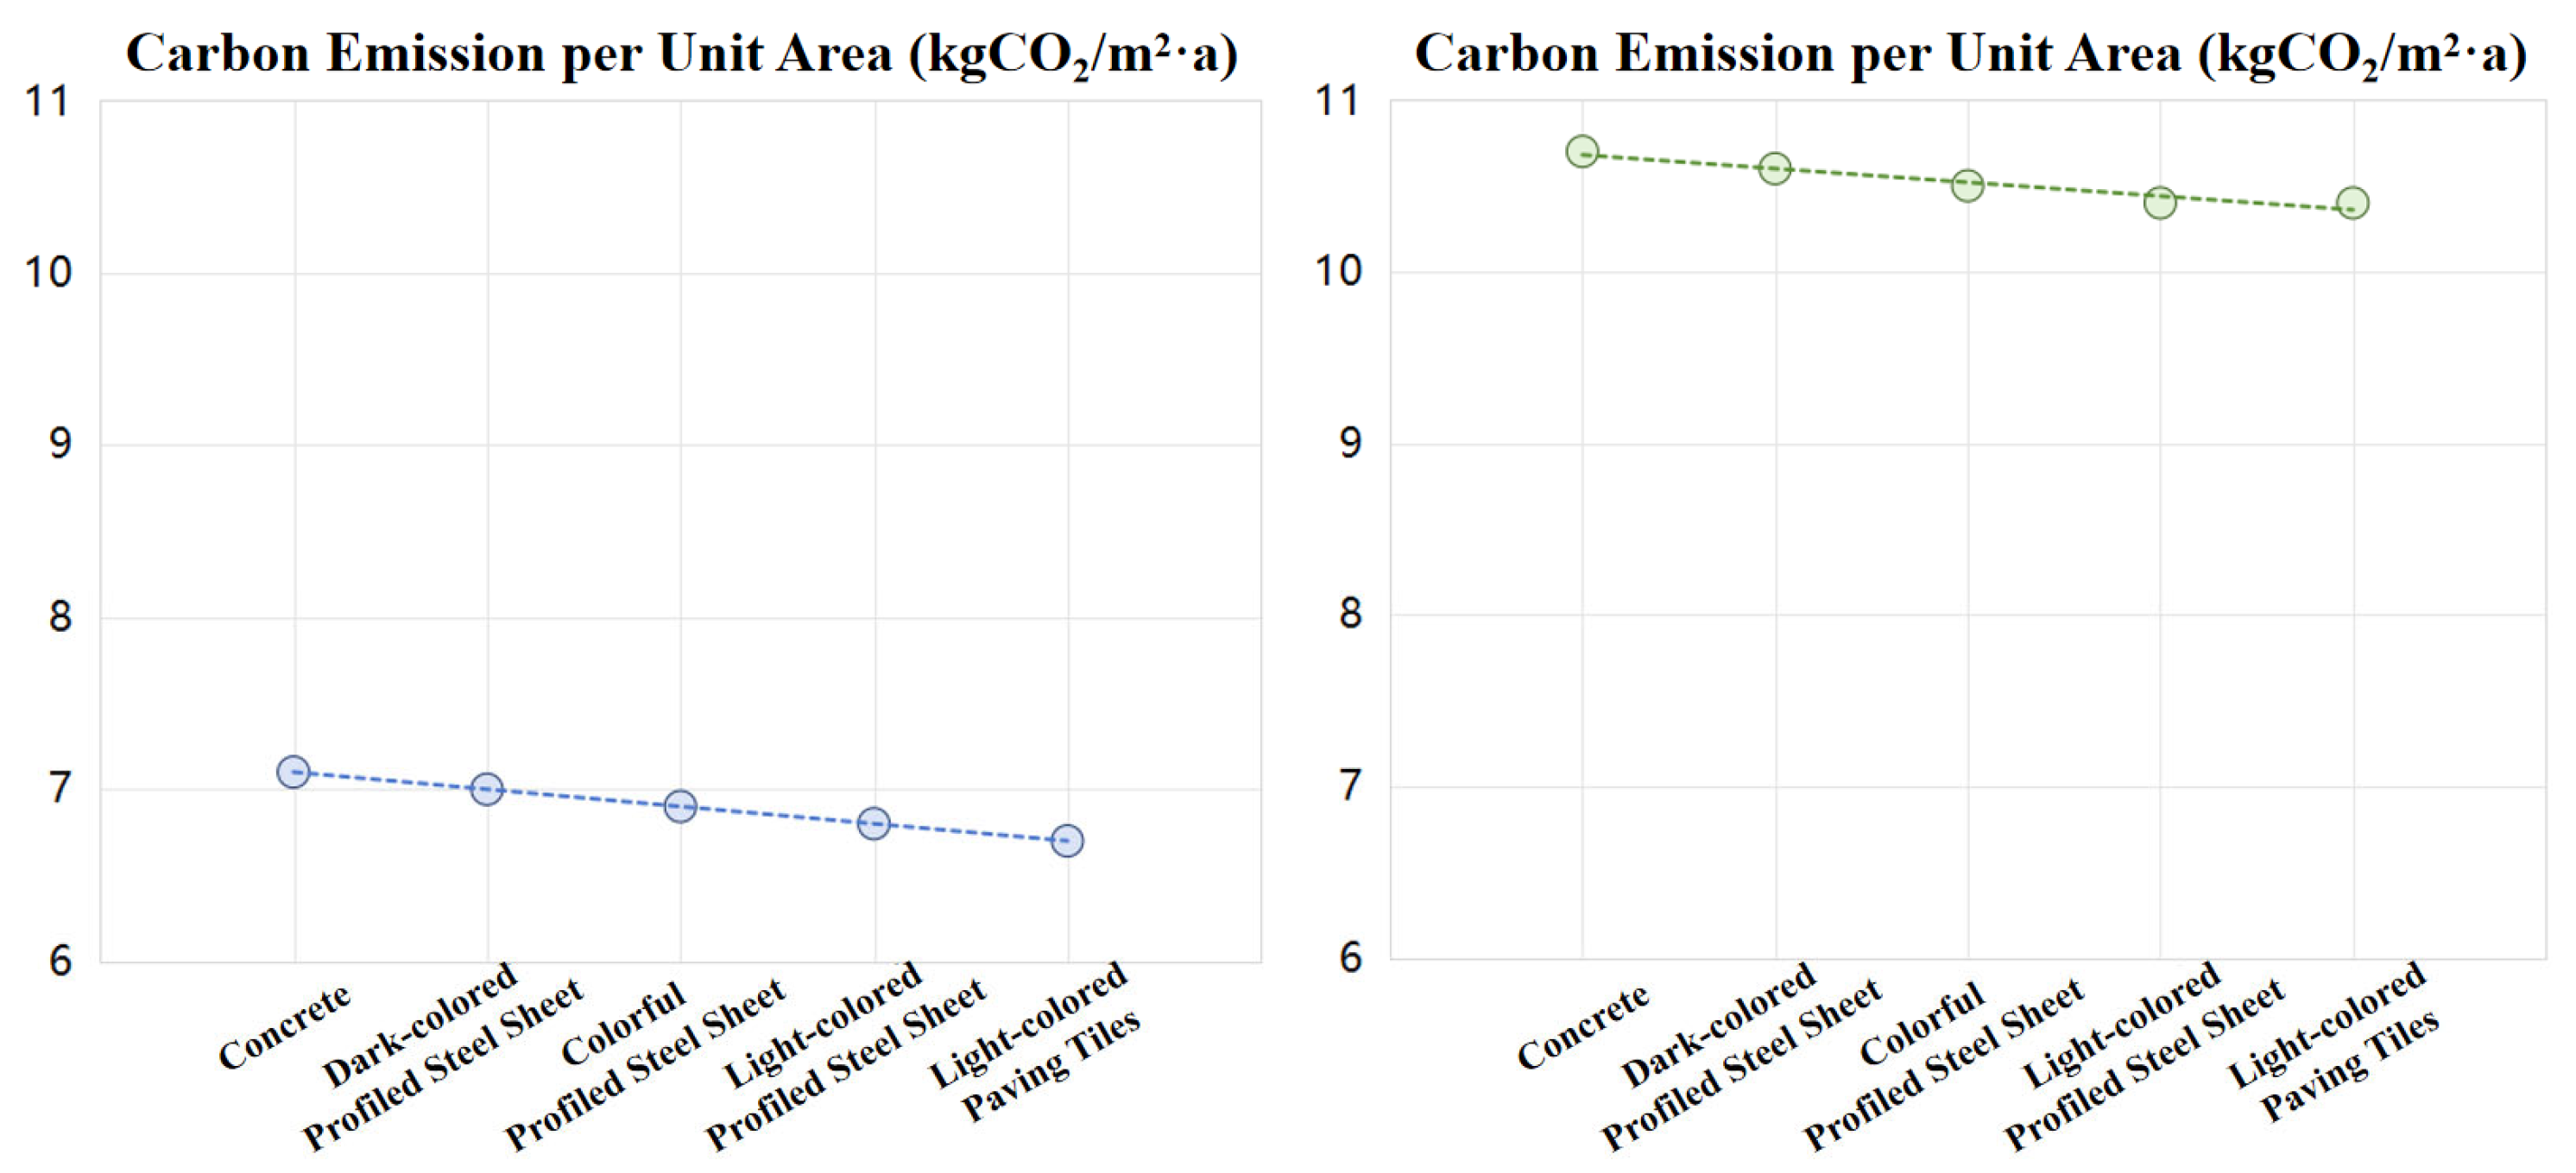
- Roof Reflectance
- (3)
- Wall Reflectance
- (4)
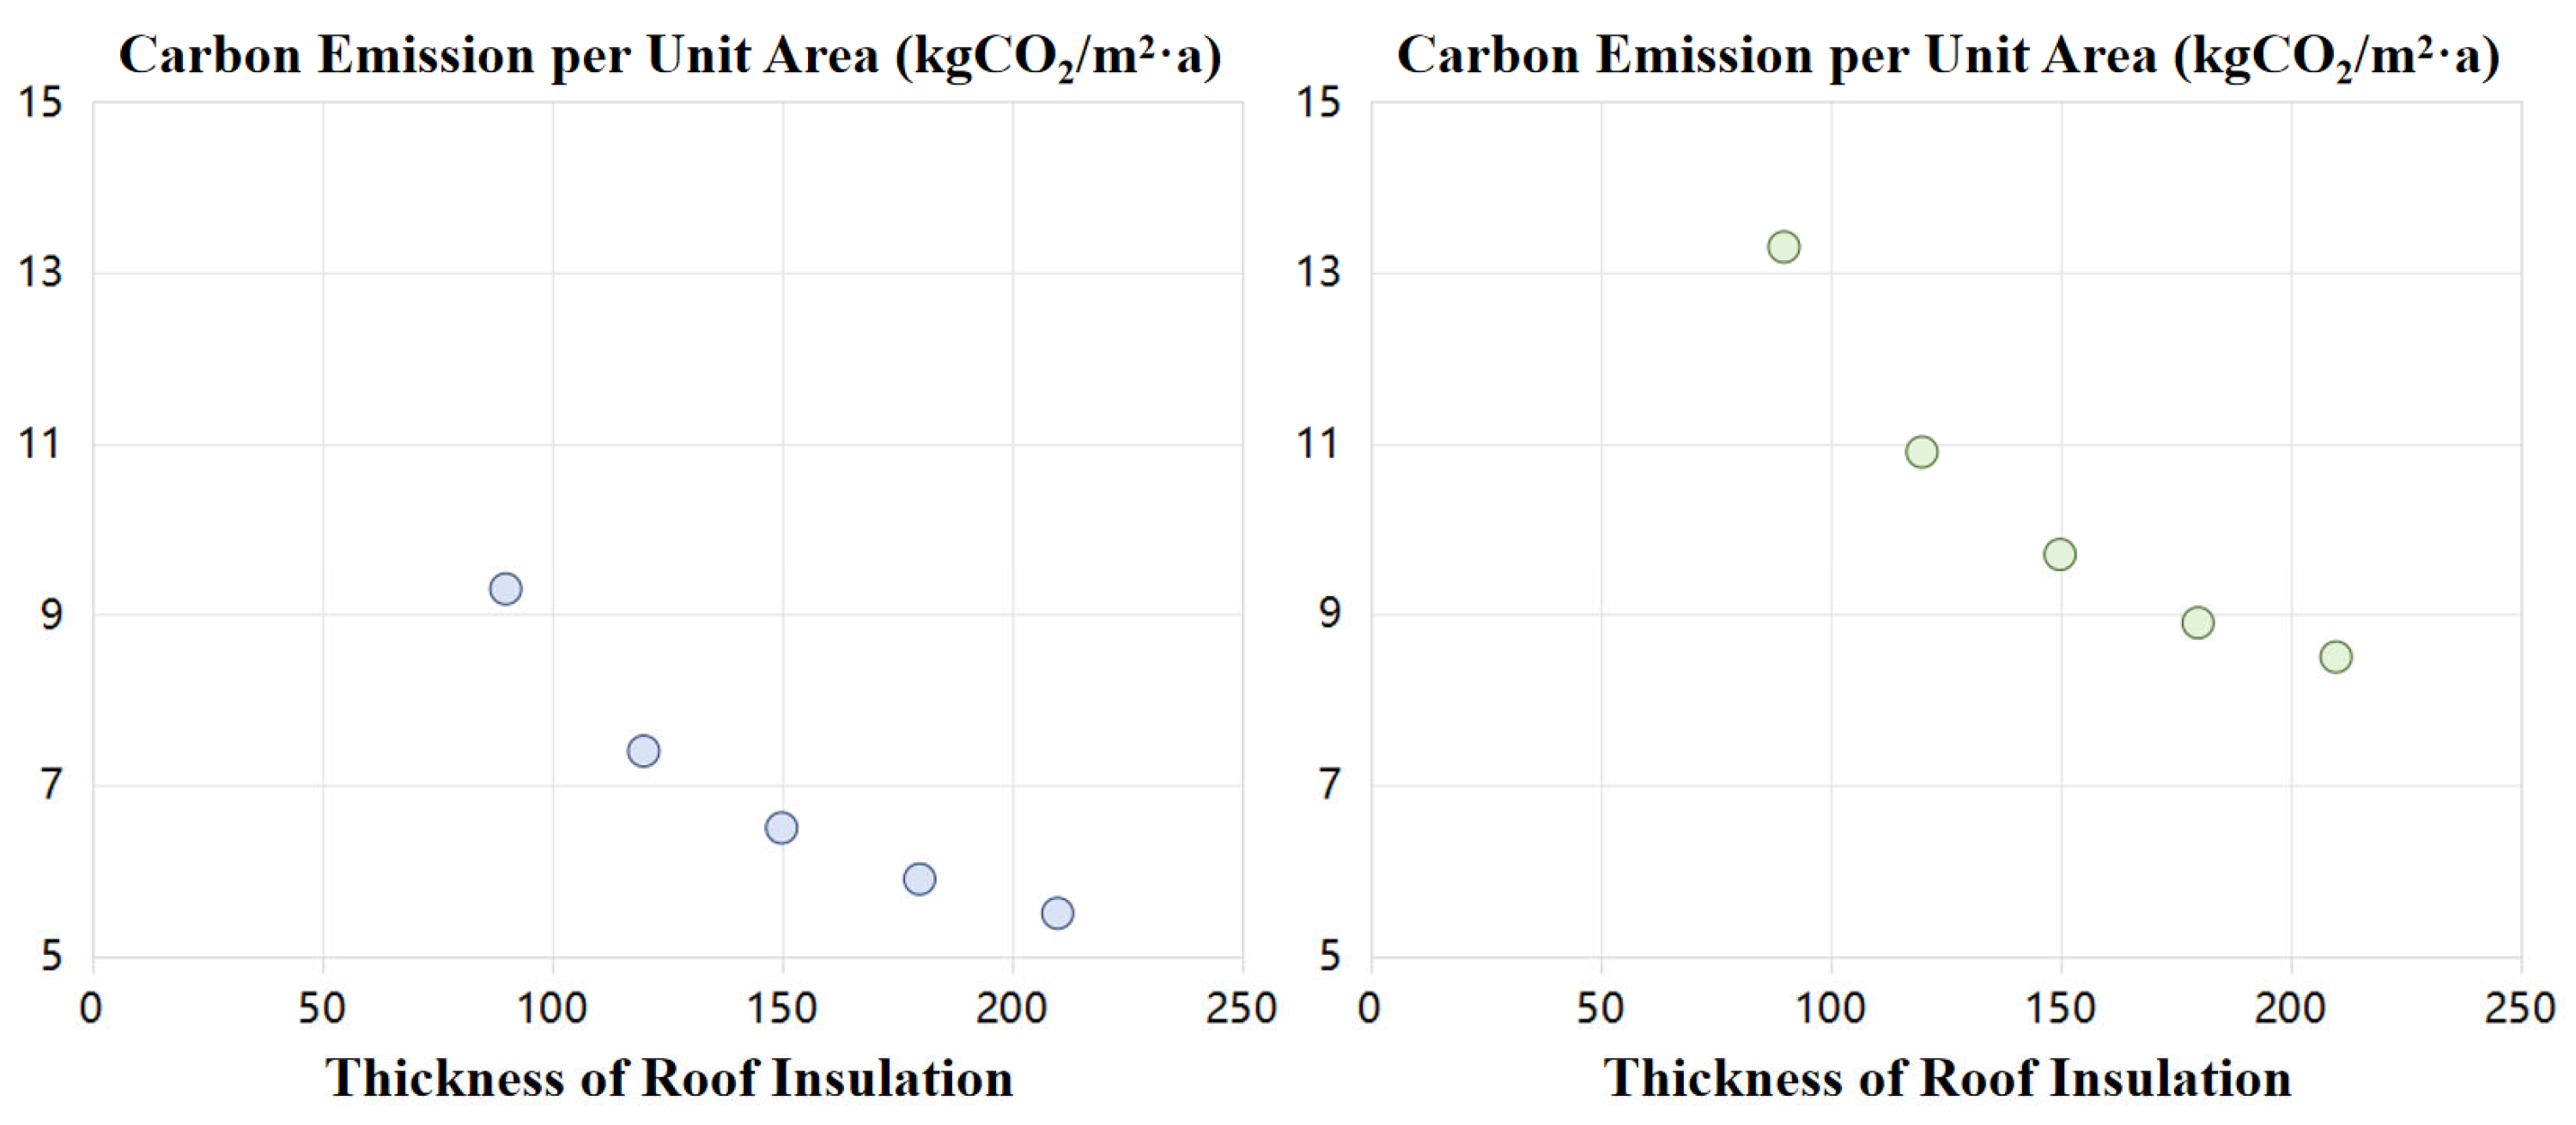
- Thickness of Roof Insulation
- (5)
- Wall Insulation Thickness
3.3. Technical Measures Level: BIPV Roof
4. Discussion
4.1. Integrated Multi-Factor Simulation and Optimal Scheme Design
4.2. Sensitivity of the Impact of Various Factors
4.3. Limitation
4.4. Future Research Prospects
5. Conclusions
Author Contributions
Funding
Data Availability Statement
Conflicts of Interest
References
- United Nations Framework Convention on Climate Change. Kyoto Protocol Reference Manual. Available online: https://unfccc.int/process-and-meetings/the-kyoto-protocol/what-is-the-kyoto-protocol/kyoto-protocol-targets-for-the-first-commitment-period (accessed on 3 November 2024).
- Chaturvedi, K.; Singhwane, A.; Dhangar, M.; Mili, M.; Gorhae, N.; Naik, A.; Prashant, N.; Srivastava, A.K.; Verma, S. Bamboo for producing charcoal and biochar for versatile applications. Biomass Convers. Biorefin. 2023, 13, 15159–15185. [Google Scholar] [CrossRef] [PubMed]
- Wei, X.; Zhang, M.; Wang, G.Y.; Liu, G.L.; Chi, Z.M.; Chi, Z. The ornithine-urea cycle involves fumaric acid biosynthesis in Aureobasidium pullulans var. aubasidani, a green and eco-friendly process for fumaric acid production. Synth. Syst. Biotechnol. 2022, 8, 33–45. [Google Scholar] [CrossRef] [PubMed]
- Fu, L.; Wang, Q. Spatial and Temporal Distribution and the Driving Factors of Carbon Emissions from Urban Production Energy Consumption. Int. J. Environ. Res. Public Health 2022, 19, 12441. [Google Scholar] [CrossRef] [PubMed]
- Lal, R.M.; Tibrewal, K.; Venkataraman, C.; Tong, K.; Fang, A.; Ma, Q.; Wang, S.; Kaiser, J.; Ramaswami, A.; Russell, A.G. Impact of Circular, Waste-Heat Reuse Pathways on PM2.5-Air Quality, CO2 Emissions, and Human Health in India: Comparison with Material Exchange Potential. Environ. Sci. Technol. 2022, 56, 9773–9783. [Google Scholar] [CrossRef]
- Jiang, H.; Fan, G.; Zhang, D.; Zhang, S.; Fan, Y. Evaluation of eco-environmental quality for the coal-mining region using multi-source data. Sci. Rep. 2022, 12, 6623. [Google Scholar] [CrossRef]
- Kong, Y.; Feng, C.; Guo, L. Peaking Global and G20 Countries’ CO2 Emissions under the Shared Socio-Economic Pathways. Int. J. Environ. Res. Public Health 2022, 19, 11076. [Google Scholar] [CrossRef]
- He, Y.; Liu, G. Coupling coordination analysis of low-carbon development, technology innovation, and new urbanization: Data from 30 provinces and cities in China. Front. Public Health 2022, 10, 1047691. [Google Scholar] [CrossRef]
- Li, H.; Lin, T. Do Land Use Structure Changes Impact Regional Carbon Emissions? A Spatial Econometric Study in Sichuan Basin, China. Int. J. Environ. Res. Public Health 2022, 19, 13329. [Google Scholar] [CrossRef]
- National Development and Reform Commission of China. National Strategy for Climate Change Adaptation 2035. Available online: https://www.gov.cn/zhengce/zhengceku/2022-06/14/content_5695555.htm (accessed on 3 November 2024).
- National Development and Reform Commission of China. Action Plan for Carbon Dioxide Peaking Before 2030. Available online: https://www.gov.cn/zhengce/content/2021-10/26/content_5644984.htm (accessed on 3 November 2024).
- Qin, H.; Yu, Z.; Li, T.; Liu, X.; Li, L. Heating Control Strategy Based on Dynamic Programming for Building Energy Saving and Emission Reduction. Int. J. Environ. Res. Public Health 2022, 19, 14137. [Google Scholar] [CrossRef]
- Miguel, G.S.; Bañales, B.M.; Ruiz, D.; Álvarez, S.; Pérez, J.; Arredondo, M.T. Carbon footprint and employment generation produced by ICT networks for Internet deployment: A multi-regional input-output analysis, Science of The Total Environment. Sci. Total Environ. 2024, 914, 169776. [Google Scholar] [CrossRef]
- Mavromatidis, G.; Orehounig, K.; Richner, P.; Carmeliet, J. A strategy for reducing CO2 emissions from buildings with the Kaya identity—A Swiss energy system analysis and a case study. Energy Policy 2016, 88, 343–354. [Google Scholar] [CrossRef]
- Li, M.; Zhang, X. Calculation of Industrial Carbon Emissions and Analysis of Influencing Factors in Gansu Province. Environ. Sci. Manag. 2016, 41, 6. [Google Scholar]
- Chau, C.K.; Leung, T.M.; Ng, W.Y. A review on Life Cycle Assessment, Life Cycle Energy Assessment and Life Cycle Carbon Emissions Assessment on buildings. Appl. Energy 2015, 143, 395–413. [Google Scholar] [CrossRef]
- Yu, Y.; You, K.; Cai, W.; Feng, W.; Li, R.; Liu, Q.; Chen, L.; Liu, Y. City-level building operation and end-use carbon emissions dataset from China for 2015–2020. Sci. Data 2024, 11, 138. [Google Scholar] [CrossRef]
- Guo, D.; Chen, H.; Long, R.; Ni, Y. An integrated measurement of household carbon emissions from a trading-oriented perspective: A case study of urban families in Xuzhou, China. J. Clean. Prod. 2018, 188, 613–624. [Google Scholar] [CrossRef]
- Liu, J.; Yang, Q.; Ou, S.; Liu, J. Factor decomposition and the decoupling effect of carbon emissions in China’s manufacturing high-emission subsectors. Energy 2022, 248, 123568. [Google Scholar] [CrossRef]
- Nie, S.; Zhou, J.; Yang, F.; Lan, M.; Li, J.; Zhang, Z.; Chen, Z.; Xu, M.; Li, H.; Sanjayan, J.G. Analysis of theoretical carbon dioxide emissions from cement production: Methodology and application. J. Clean. Prod. 2022, 334, 130270. [Google Scholar] [CrossRef]
- Yao, S.; Liu, Z.; Lu, Z.; Guo, S.; Xie, Z.; Li, Z.; Huang, Y.; Li, L.; Lu, W.; Chen, X. Research progress of soft measurement technology optimizing carbon emission measurement of coal-fired power plants. Clean Coal Technol. 2024, 30, 18–31. [Google Scholar]
- Ren, H.; Ou, X.; Zhu, H. Spatial characteristics and coupling coordination between carbon emission efficiency and industrial structure in three metropolitan areas of Jiangsu Province, China. Sci. Prog. 2023, 106, 368504231176146. [Google Scholar] [CrossRef]
- Chen, J.; Zhu, Y.; Yang, C.; Wang, H.; Wang, K. Evaluation and prediction of carbon emission from logistics at city scale for low-carbon development strategy. PLoS ONE 2024, 19, e0298206. [Google Scholar] [CrossRef]
- Bayer, C.; Gamble, M.; Gentry, R.; Joshi, S. Guide to building life cycle assessment in practice. Am. Inst. Archit. 2010, 1–193. [Google Scholar]
- Cole, R.J. Energy and greenhouse gas emissions associated with the construction of alternative structural systems. Build. Environ. 1999, 34, 335–348. [Google Scholar] [CrossRef]
- Gustavsson, L.; Joelsson, A.; Sathre, R. Life cycle primary energy use and carbon emission of an eight-story wood framed apartment building. Energy Build. 2010, 42, 230–242. [Google Scholar] [CrossRef]
- Ramesh, T.; Prakash, R.; Shukla, K.K. Life cycle energy analysis of buildings: An overview. Energy Build. 2010, 42, 1592–1600. [Google Scholar] [CrossRef]
- Yu, P.; Chen, X.; Ma, L. A Review of Carbon Emissions in the Life Cycle of Residential Buildings. Build. Sci. 2011, 27, 35. (In Chinese) [Google Scholar]
- Lin, B.; Liu, N.; Peng, B.; Zhu, Y. Comparative Study on International Building Life Cycle Energy Consumption and CO2 Emissions. Build. Sci. 2013, 8, 22–27. (In Chinese) [Google Scholar]
- Mousa, M.; Luo, X.; McCabe, B. Utilizing BIM and Carbon Estimating Methods for Meaningful Data Representation. Procedia Eng. 2016, 145, 1242–1249. [Google Scholar] [CrossRef]
- Peng, C. Calculation of a building’s life cycle carbon emissions based on Ecotect and building information modeling. J. Clean. Prod. 2016, 112, 453–465. [Google Scholar] [CrossRef]
- Yang, Q.; Huo, R.; Tong, H. Research on Design Trend of Solar Photocoltaic High-Rise Residential Buildings Based on Future Climate from the Perspective of Carbon Neutrality. Ind. Constr. 2022, 52, 8–16. (In Chinese) [Google Scholar]
- Cao, H.; Liu, X.; Feng, G.; Wang, C.; Huang, K.; Hou, X.; Chen, J. Research on the evaluation of the renovation effect of existing energy-inefficient residential buildings in a severe cold region of China. Energy Build. 2024, 312, 114184. [Google Scholar] [CrossRef]
- Chen, L.; Msigwa, G.; Yang, M.; Osman, A.I.; Fawzy, S.; Rooney, D.W.; Yap, P.-S. Strategies to achieve a carbon neutral society: A review. Environ. Chem. Lett. 2022, 20, 2277–2310. [Google Scholar] [CrossRef] [PubMed]
- Wang, L.; Chen, T.; Yu, Y.; Wang, L.; Zang, H.; Cang, Y.; Zhang, Y.; Ma, X. Impacts of Vegetation Ratio, Street Orientation, and Aspect Ratio on Thermal Comfort and Building Carbon Emissions in Cold Zones: A Case Study of Tianjin. Land 2024, 13, 1275. [Google Scholar] [CrossRef]
- Gao, Z.; Liu, H.; Xu, X.; Xiahou, X.; Cui, P.; Mao, P. Research Progress on Carbon Emissions of Public Buildings: A Visual Analysis and Review. Buildings 2023, 13, 677. [Google Scholar] [CrossRef]
- Wang, Y.; Mauree, D.; Sun, Q.; Lin, H.; Scartezzini, J.L.; Wennersten, R. A review of approaches to low-carbon transition of high-rise residential buildings in China. Renew. Sustain. Energy Rev. 2020, 131, 109990. [Google Scholar] [CrossRef]
- Liu, Y.S.; Yigitcanlar, T.; Guaralda, M.; Degirmenci, K.; Liu, A.; Kane, M. Leveraging the Opportunities of Wind for Cities through Urban Planning and Design: A PRISMA Review. Sustainability 2022, 14, 11665. [Google Scholar] [CrossRef]
- Wuyun, Q.; Li, B.; Bian, M.; Wang, C.; Huang, Z.; Wang, B.; Cai, W.; Wang, M.; Zhang, X.; He, T.; et al. Demonstration and data analysis of a Zero Emission Building (ZEB) in Beijing, China. Solar Energy 2024, 272, 112488. [Google Scholar] [CrossRef]
- Chen, Y.; Wang, Z.; Peng, Z. A Study on Carbon Emission Reduction in the Entire Process of Retrofitting High-Rise Office Buildings Based on the Extraction of Typical Models. Sustainability 2024, 16, 8506. [Google Scholar] [CrossRef]
- Wang, J.; Liu, W.; Du, X.; Zhang, W. Low-carbon-oriented commercial district urban form optimization and impact assessment analysis. Build. Environ. 2024, 254, 111377. [Google Scholar] [CrossRef]
- Chen, Y.; Luo, L. Energy consumption behaviors and the potential of natural ventilation emission reduction in residential building. J. Asian Archit. Build. Eng. 2024, 23, 2029–2040. [Google Scholar] [CrossRef]
- Hałacz, J.; Skotnicka-Siepsiak, A.; Neugebauer, M. Assessment of Reducing Pollutant Emissions in Selected Heating and Ventilation Systems in Single-Family Houses. Energies 2020, 13, 1224. [Google Scholar] [CrossRef]
- Elaouzy, Y.; El Fadar, A. Energy, economic and environmental benefits of integrating passive design strategies into buildings: A review. Renew. Sustain. Energy Rev. 2022, 167, 112828. [Google Scholar] [CrossRef]
- Zhong, H.-Y.; Sun, Y.; Shang, J.; Qian, F.-P.; Zhao, F.-Y.; Kikumoto, H.; Jimenez-Bescos, C.; Liu, X. Single-sided natural ventilation in buildings: A critical literature review. Build. Environ. 2022, 212, 108797. [Google Scholar] [CrossRef]
- Lestinen, S.; Kilpeläinen, S.; Kosonen, R.; Valkonen, M.; Jokisalo, J.; Pasanen, P. Effects of Night Ventilation on Indoor Air Quality in Educational Buildings—A Field Study. Appl. Sci. 2021, 11, 4056. [Google Scholar] [CrossRef]
- Echenagucia, T.M.; Moroseos, T.; Meek, C. On the tradeoffs between embodied and operational carbon in building envelope design: The impact of local climates and energy grids. Energy Build. 2023, 278, 112589. [Google Scholar] [CrossRef]
- Shah, I.; Soh, B.; Lim, C.; Lau, S.-K.; Ghahramani, A. Thermal transfer and temperature reductions from shading systems on opaque facades: Quantifying the impacts of influential factors. Energy Build. 2023, 278, 112604. [Google Scholar] [CrossRef]
- Fan, J.; Wang, H.; Zhou, D. Policy approaches to optimize the layout of ecological construction and enhance carbon sequestration capacity. J. Chin. Acad. Sci. 2022, 37, 459–468. [Google Scholar] [CrossRef]
- Besir, A.B.; Cuce, E. Green roofs and facades: A comprehensive review. Renew. Sustain. Energy Rev. 2018, 82, 915–939. [Google Scholar] [CrossRef]
- China News Service. State Council Meeting: By 2020, Non-Fossil Energy Will Account for 15% of Primary Energy. Available online: https://www.chinanews.com.cn/cj/cj-hbht/news/2009/11-26/1986477.shtml (accessed on 3 November 2024).
- Finnegan, S.; Jones, C.; Sharples, S. The embodied CO2e of sustainable energy technologies used in buildings: A review article. Energy Build. 2018, 181, 50–61. [Google Scholar] [CrossRef]
- Liu, Z.; Zhang, L.; Gong, G.; Li, H.; Tang, G. Review of solar thermoelectric cooling technologies for use in zero energy buildings. Energy Build. 2015, 102, 207–216. [Google Scholar] [CrossRef]
- Ozkan, O.; Coban, M.N.; Destek, M.A. Navigating the winds of change: Assessing the impact of wind energy innovations and fossil energy efficiency on carbon emissions in China. Renew. Energy 2024, 228, 120623. [Google Scholar] [CrossRef]
- Dong, S.; Zhao, H.; Zheng, Y.; Ni, L. Carbon reduction analysis of electric heat pumps in carbon neutrality in China. Sustain. Cities Soc. 2023, 97, 104758. [Google Scholar] [CrossRef]
- Kaizer, T.H. Green Garment Factories in Bangladesh: Motivation and Challenges. 2020. Available online: https://api.semanticscholar.org/CorpusID:245536680 (accessed on 3 November 2024).
- Zhu, T.; Li, R.; Li, C. The Analysis of Natural Lighting Simulation and Study on Energy Saving in Cigarette Factory. Procedia Eng. 2017, 205, 896–901. [Google Scholar] [CrossRef]
- Rana, B.; Patel, A. Application of Green Building Concepts to Enhancement of Environment & Health of workers of Paper Mill. Int. J. Sci. Res. Dev. 2017, 3, 467–470. Available online: https://ijsrd.com/articles/IJSRDV5I30380.pdf (accessed on 3 November 2024).
- Lee, B.; Trcka, M.; Hensen, J.L.M. Embodied energy of building materials and green building rating systems—A case study for industrial halls. Sustain. Cities Soc. 2011, 1, 67–71. [Google Scholar] [CrossRef]
- Patil, M.; Boraste, S.; Minde, P. A comprehensive review on emerging trends in smart green building technologies and sustainable materials. Mater. Today Proc. 2022, 65, 1813–1822. [Google Scholar] [CrossRef]
- Wang, H.; Chiang, P.-C.; Cai, Y.; Li, C.; Wang, X.; Chen, T.-L.; Wei, S.; Huang, Q. Application of Wall and Insulation Materials on Green Building: A Review. Sustainability 2018, 10, 3331. [Google Scholar] [CrossRef]
- Golroudbary, S.R.; Makarava, I.; Kraslawski, A.; Repo, E. Global environmental cost of using rare earth elements in green energy technologies. Sci. Total Environ. 2022, 832, 155022. [Google Scholar] [CrossRef]
- Shi, J.; Yu, Y. To Advance Industrial Green Technology via Environmental Governance—Evidence from China’s Industrial Sector. Processes 2021, 9, 1797. [Google Scholar] [CrossRef]
- GB/T 51366-2019; Standard for Calculation of Building Carbon Emissions. Ministry of Housing and Urban-Rural Development of the People’s Republic of China: Beijing, China, 2019.
- GB 51245-2017; Unified Standard for Energy-efficient Design of Industrial Buildings. Ministry of Housing and Urban-Rural Development of the People’s Republic of China: Beijing, China, 2017.
- UK Green Building Council, Building the Case for Net Zero: A Feasibility Study into the Design, Delivery and Cost of New Net Zero Carbon Buildings. Available online: https://ukgbc.org/resources/building-the-case-for-net-zero/ (accessed on 3 November 2024).
- Nilimaa, J.; Zhaka, V. Material and Environmental Aspects of Concrete Flooring in Cold Climate. Constr. Mater. 2023, 3, 180–201. [Google Scholar] [CrossRef]
- Huang, Z.; Zhou, H.; Miao, Z.; Tang, H.; Lin, B.; Zhuang, W. Life-Cycle Carbon Emissions (LCCE) of Buildings: Implications, Calculations, and Reductions. Engineering 2024, 35, 115–139. [Google Scholar] [CrossRef]


| Material Name | Thermal Conductivity (λ) | Heat Storage Coefficient (S) | Thermal Resistance (R) | Thermal Inertiaindex | |
|---|---|---|---|---|---|
| W/(m·K) | W/(m2·K) | (m2·K)/W | D = R * S | ||
| Aggregate concrete | Roof | 1.510 | 15.360 | 0.026 | 0.407 |
| Squeeze polystyrene board | 0.032 | 0.365 | 2.604 | 1.141 | |
| Cement mortar | 0.930 | 11.370 | 0.022 | 0.245 | |
| Aerated concrete, foamed concrete | 0.180 | 3.100 | 0.444 | 1.378 | |
| Steel reinforced concrete | 1.740 | 17.200 | 0.069 | 1.186 | |
| Lime mortar | 0.810 | 10.070 | 0.025 | 0.249 | |
| Cement mortar | Wall | 0.930 | 11.370 | 0.022 | 0.245 |
| Rock wool board | 0.040 | 0.750 | 1.563 | 1.406 | |
| Cement mortar | 0.930 | 11.370 | 0.022 | 0.245 | |
| Sand filling products | 0.200 | 3.190 | 1.500 | 4.785 | |
| Lime mortar | 0.810 | 10.070 | 0.025 | 0.249 |
| 1 | 2 | 3 | 4 | 5 | 6 | 7 | 8 | 9 | 10 | 11 | 12 | 13 | 14 | 15 | 16 | 17 | 18 | 19 | 20 | 21 | 22 | 23 | 24 | ||
|---|---|---|---|---|---|---|---|---|---|---|---|---|---|---|---|---|---|---|---|---|---|---|---|---|---|
| People | Workday | 0 | 0 | 0 | 0 | 0 | 10 | 10 | 50 | 100 | 100 | 100 | 30 | 100 | 100 | 100 | 100 | 50 | 20 | 10 | 0 | 0 | 0 | 0 | 0 |
| Holiday | 0 | 0 | 0 | 0 | 0 | 10 | 10 | 20 | 45 | 45 | 45 | 10 | 45 | 45 | 45 | 45 | 45 | 10 | 10 | 0 | 0 | 0 | 0 | 0 | |
| Lighting | Workday | 10 | 10 | 10 | 10 | 10 | 10 | 10 | 36 | 62 | 56 | 54 | 43 | 53 | 55 | 58 | 67 | 40 | 18 | 10 | 10 | 10 | 10 | 10 | 10 |
| Holiday | 10 | 10 | 10 | 10 | 10 | 10 | 10 | 10 | 10 | 10 | 10 | 10 | 10 | 10 | 10 | 10 | 10 | 10 | 10 | 10 | 10 | 10 | 10 | 10 | |
| Equipment | Workday | 0 | 0 | 0 | 0 | 0 | 10 | 10 | 50 | 100 | 100 | 100 | 100 | 100 | 100 | 100 | 100 | 50 | 20 | 10 | 0 | 0 | 0 | 0 | 0 |
| Holiday | 0 | 0 | 0 | 0 | 0 | 10 | 10 | 20 | 45 | 45 | 45 | 45 | 45 | 45 | 45 | 45 | 45 | 10 | 10 | 0 | 0 | 0 | 0 | 0 |
| Hierarchy Level | Simulation Factors | Form |
|---|---|---|
| Architectural Layout | Orientation | East (E) |
| South-East (SE) | ||
| South (S) | ||
| South-West (SW) | ||
| West (W) | ||
| Window-to-Wall Ratio | 0.5 | |
| 0.4 | ||
| 0.3 | ||
| 0.2 | ||
| 0.1 | ||
| Building Material | Window Glass | 6 mm glass + 12 mm air cavity + 6 mm glass (6+12A+6) |
| 6 mm Low-e glass + 12 mm air cavity + 6 mm glass (6Low E+12A+6) | ||
| 6 mm glass + 12 mm argon cavity + 6 mm glass (6+12Ar+6) | ||
| 5 mm Low-e glass + 9 mm air cavity + 5 mm glass + 9 mm air cavity + 5 mm glass (5+9A+5+9A+5) | ||
| 6 mm Low-e glass + 12 mm air cavity + 6 mm glass + 912 mm air cavity + 6 mm glass (6+12A+6+12A+6) | ||
| Roof Reflectance | Concrete (reflectivity = 0.23) | |
| Dark-Colored Profiled Steel Plate (reflectivity = 0.35) | ||
| Color-Coated Profiled Steel Plate (reflectivity = 0.50) | ||
| Light-Colored Profiled Steel Plate (reflectivity = 0.60) | ||
| Light-Colored Floor Tiles (reflectivity = 0.70) | ||
| Wall Reflectance | Dark Gray Profiled Steel Plate (reflectivity = 0.35) | |
| Light Gray Profiled Steel Plate (reflectivity = 0.50) | ||
| White Profiled Steel Plate (reflectivity = 0.70) | ||
| Thickness of XPS Roof Insulation (mm) | 90 | |
| 120 | ||
| 150 | ||
| 180 | ||
| 210 | ||
| Thickness of XPS Wall Insulation (mm) | 60 | |
| 80 | ||
| 100 | ||
| 120 | ||
| Technical Measures | Building-Attached Photovoltaic (BAPV) Roof | Without PV |
| 0° | ||
| 11° | ||
| 22° | ||
| 33° |
| Hierarchy Level | Simulation Factors | Form | Carbon Emission of Current Design | Carbon Emission of Low-Carbon Design |
|---|---|---|---|---|
| Architectural Layout | Orientation | West | 2.6 tCO2 | 2.0 tCO2 |
| Window-to-Wall Ratio | 0.1 | |||
| Building Material | Window Glass | 6+12A+6+12A+6 | ||
| Roof Reflectance | Light-Colored Floor Tiles | |||
| Wall Reflectance | White Profiled Steel Plate | |||
| Thickness of XPS Roof Insulation (mm) | 180 | |||
| Thickness of XPS Wall Insulation (mm) | 120 | |||
| Technical Measures | PV Roof | 33° |
| Hierarchy Level | Simulation Factors | Form | Carbon Emission of Current Design | Carbon Emission of Low-Carbon Design |
|---|---|---|---|---|
| Architectural Layout | Orientation | South | 3.8 tCO2 | 3.0 tCO2 |
| Window-to-Wall Ratio | 0.1 | |||
| Building Material | Window Glass | 6+12A+6+12A+6 | ||
| Roof Reflectance | Dark-Colored Floor Tiles | |||
| Wall Reflectance | White Profiled Steel Plate | |||
| Thickness of XPS Roof Insulation (mm) | 180 | |||
| Thickness of XPS Wall Insulation (mm) | 120 | |||
| Technical Measures | PV Roof | 33° |
| Factors | Region | Most Economic Solution | Carbon Emission Reduction per 10,000 Yuan (KgCO2/10,000 Yuan) |
| Window Glass | Xi’an | 6LowE+12A+6 | −333.9 |
| Yulin | 6LowE+12A+6 | −555.8 | |
| Roof Material | Xi’an | Light-Colored Floor Tiles | −45.5 |
| Yulin | Light-Colored Floor Tiles | −27.3 | |
| Wall Material | Xi’an | White Profiled Steel Plate | −253.4 |
| Yulin | Dark-colored Profiled Steel Plate | Common Design | |
| Roof Insulation | Xi’an | 90 mm XPS | −873.8 |
| Yulin | 90 mm XPS | −1114.0 | |
| Wall Insulation | Xi’an | 80 mm XPS | −1889.8 |
| Yulin | 80 mm XPS | −2676.3 | |
| PV Roof Angle | Xi’an | 0° | −17.4 |
| Yulin | 11° | −29.0 |
Disclaimer/Publisher’s Note: The statements, opinions and data contained in all publications are solely those of the individual author(s) and contributor(s) and not of MDPI and/or the editor(s). MDPI and/or the editor(s) disclaim responsibility for any injury to people or property resulting from any ideas, methods, instructions or products referred to in the content. |
© 2025 by the authors. Licensee MDPI, Basel, Switzerland. This article is an open access article distributed under the terms and conditions of the Creative Commons Attribution (CC BY) license (https://creativecommons.org/licenses/by/4.0/).
Share and Cite
Shi, L.; Xu, D.; Li, X.; Huang, L.; Li, Y.; Huang, T.; Yang, Y. The Impact Characteristics of Common Low-Carbon Design Methods on Reducing Carbon Emissions in Industrial Plant Buildings in Architectural Design. Buildings 2025, 15, 974. https://doi.org/10.3390/buildings15060974
Shi L, Xu D, Li X, Huang L, Li Y, Huang T, Yang Y. The Impact Characteristics of Common Low-Carbon Design Methods on Reducing Carbon Emissions in Industrial Plant Buildings in Architectural Design. Buildings. 2025; 15(6):974. https://doi.org/10.3390/buildings15060974
Chicago/Turabian StyleShi, Long, Duo Xu, Xin Li, Lei Huang, Yafeng Li, Tingru Huang, and Yujun Yang. 2025. "The Impact Characteristics of Common Low-Carbon Design Methods on Reducing Carbon Emissions in Industrial Plant Buildings in Architectural Design" Buildings 15, no. 6: 974. https://doi.org/10.3390/buildings15060974
APA StyleShi, L., Xu, D., Li, X., Huang, L., Li, Y., Huang, T., & Yang, Y. (2025). The Impact Characteristics of Common Low-Carbon Design Methods on Reducing Carbon Emissions in Industrial Plant Buildings in Architectural Design. Buildings, 15(6), 974. https://doi.org/10.3390/buildings15060974