1. Introduction
Approximately 40 million people in the U.S., 12.7 percent of the population, experience a disability [
1]; similar numbers exist around the world. Disability affects self-sufficiency, self-determination, and full participation in life and can be experienced by individuals of every age and in every community. Despite advances resulting from the Rehabilitation Act of 1973 and Americans with Disabilities Act (ADA) (and similar efforts around the world), people with disabilities remain part of the underserved population with regard to employment, income, and healthcare [
2]. A large part of this challenge is the lack of or limited options for access to information and or built environments.
Assistive technologies (ATs) can serve to ameliorate the detrimental impacts of disability on body function or structure, environmental obstructions, and societal barriers. Well-known assistive technologies include wheelchairs, vision-correcting lenses, and hearing aids, all of which address a problem in body function or structure and help the user to navigate environmental obstructions and, through increased inclusion, overcome societal barriers.
While the success of some of ATs requires effort or investments only from the end-user (e.g., [
3,
4,
5,
6,
7]), those that improve accessibility (called accessible and assistive technologies or AATs) often require adequate investments from the enablers or managing entities (e.g., [
8,
9,
10,
11,
12,
13]). For AATs where any form of investment is needed, the enablers and managing entities need to carefully consider the benefits and costs and determine the economic feasibility of offering such products or services. Beyond legal and ethical considerations, eventually, firms need business success to be sustainable. This requires adequate tools to be available to make such decisions, especially for cases where a firm is contemplating increasing accessibility beyond the minimum legal requirements to a level that is more meaningful or convenient. The assessment of investments in the adoption of AATs within built environments can be useful not only for persons with disabilities but also for other populations, such as older adults and individuals with chronic conditions.
From an enabler or managing entity perspective, the provision of such an AAT is contingent upon the costs that they incur and the benefits that they accrue in the form of increased revenue. In essence, the benefits must overweigh the costs of investments. The benefits for an enabler or managing entity are driven by the user’s satisfaction, utility, or experience in using the accessible space provided to them with the investments in AATs. While costs are an important factor to consider and can be easily quantified, benefits and user experience are not necessarily tangible or easy to measure.
While laws such as the Americans with Disabilities Act (ADA) and Section 508 [
2,
14] and their equivalents have led to investments to modify physical spaces for accessibility (ramps to access buildings or vehicles) or create accessible technology, they have not yet led to similar investments to support AATs (such as smartphone-based wayfinding for built environments), which often fall beyond the current legal requirements as “convenience technologies”. Currently, such investments are either federally supported for some public spaces or limited to a few private efforts. For the most part, technology exists to make many environments sufficiently or conveniently accessible, limited only by the inability to prepare the environment to deploy such AATs. The primary challenge is often to elicit private entities’ willingness to invest in making spaces accessible using AATs.
Given that market forces often determine the feasibility of adopting accessibility options beyond the requirements of the law, this paper explores the theoretical underpinnings regarding what may motivate entities or firms to invest in the support of AATs and in general AT infrastructure. In this paper, we propose a game-theoretic model that will help to analyze the importance of various parameters and the incentives that firms may need to provide better accessibility.
The major contributions of this work are in answering the following questions:
If a firm decides to invest an amount in making their facilities more accessible, how much improvement in the average user experience would they need to recoup their costs through an increase in profit?
How can one predict the improvement in user experience after making facilities more accessible?
What impact can incentives in terms of financial support have in encouraging entities to make investments in accessibility?
This paper is organized as follows. A section on related work is provided next, followed by a description of the economic framework and inferences from numerical evaluations. Subsequently, a section with a discussion of case studies is presented, followed by a final section concluding the paper.
2. Related Work
Entities responsible for the creation, operation, and maintenance of accessible environments (digital or physical) play a vital role in determining the level of accessibility in their environments. Progress in making environments “conveniently or meaningfully accessible” depends largely on clear, quantifiable, tangible, and intangible economic benefits available to not just the industry stakeholders but also the government, who may wish to invest in making progress in accessibility. The availability of such benefit assessments will incentivize industries to incorporate designs and invest in resources beyond complying with the minimum design standards, and it will enable governments to determine strategies to increase the number of meaningfully accessible buildings and public spaces in a community [
15]. The three entities of interest in terms of measuring the scope of increased “convenient accessibility” are the end-users (consumers), enablers (producers), and policymakers. The current literature [
16,
17,
18,
19,
20,
21,
22,
23] provides three main approaches to conceptualizing economic benefits: (1) as the economic potential of accessible sites and services (for example, in tourism); (2) as cost savings from the presence of accessible infrastructure (for example, in transportation); and (3) as the hypothetical return on investment in creating accessible spaces (for example, in retail, transportation, housing, and urban design) based on the willingness-to-pay of users. There is a need to implement such an economic framework to empirically measure and calibrate the benefits and costs of “conveniently accessible” spaces for enablers and to consider the sustainability of such efforts. This work takes the third approach and is a logical step before robust empirical studies are carried out to measure the benefits and costs of convenient accessibility. Prior work at the intersection of economics and disability has mostly focused on health measures or indicators such as Quality Adjusted Life Years [
24,
25]; there exist no frameworks or tools for firms to better understand how investments in accessibility can impact their competitiveness compared to other players in the market.
In this work, we utilize an economic framework consisting of vertically differentiated firms competing in an oligopolistic market with different “qualities”, i.e., one of the firms decides to make the necessary investments in accessibility, leading to a unique user experience. Applying economic frameworks [
26,
27,
28,
29,
30,
31,
32,
33] to the domain of ATs and AATs will help to analyze the feasibility of investments in accessibility. This work generates parametric values that can be subsequently calibrated with empirical study estimates. As will be shown later, the results of this work will enable firms to consider the benefits of potential improvements in user experience and learn how these can often offset the investments made in accessibility.
The economic viability of accessible environments depends on clear, quantifiable benefits for industry stakeholders and governments, incentivizing investment beyond compliance. Existing frameworks conceptualize economic benefits through the potential revenue, cost savings, and return on investment. This work applies an economic model of market competition to assess the feasibility of accessibility investments, providing parametric insights that can inform empirical studies and encourage firms to view accessibility as a competitive advantage.
3. Economic Framework
The economic framework of firms competing in a vertically differentiated market [
26,
27,
28,
29,
30,
31,
32,
33] considers two scenarios: one firm that adopts (supports and invests in) AATs specifically geared towards improving the quality of life of people with disabilities (called Firm 1) and another firm (Firm 2) that does not make specific investments to cater to the subset of the population with disabilities. By comparing the demand for Firm 1 in a Cournot competition [
26] with that of Firm 2 (as a simultaneous game), a better understanding of the feasibility and challenges in consumers adopting the accessible choice (offered by Firm 1) can be gained. There are several studies exploring the feasibility of the choice of models (Cournot versus Bertrand) for firms competing in an oligopolistic market, such as [
29]. Ref. [
29] states, “The issue of why and when firms choose to be quantity- or price-setting agents has been lively discussed in the theory of industrial organization, pointing out that price (respectively, quantity) competition fits best industries where firms’ capacity constraints are absent or loose (resp., tight)”. In this study, the decision variable of investments in accessible technologies renders the Cournot model an appropriate choice because the capacity constraints are tight. In a Cournot model, capacity constraints exist because the model assumes that firms have limited production capabilities, meaning that they can only produce a certain amount of goods within a given time period, which restricts their ability to respond to market changes or competitors’ actions, thus influencing their optimal output decision and creating a “capacity constraint” within the competitive framework. Thus, firms compete by making decisions on whether to invest in accessibility or not, rather than focusing on prices.
3.1. Overview of Modeling Methodology
For simplicity and intuitive results, we will assume a market characterized by two firms (a two-player market). We will model firms that can be considered to operate in an oligopoly market structure. For example, the grocery market is concentrated by a few major players, so the modeling of two firms (duopoly) is expected to capture most of the market dynamic. We assume that Firm 1 has adopted an AAT system, which is enabled through investments. For Firm 1 to offer the accessibility option, it has to make significant investments in accessibility infrastructure. Firm 2 does not make such investments and hence can be characterized as the “accessibility-unfriendly” option.
3.2. Consumer Preferences
Consumer preference for the two firms is characterized based on the model of vertical product differentiation by Mussa and Rosen [
26]. In a vertically differentiated product space, all consumers agree over the most preferred mix of characteristics and, more generally, over the preference ordering. Vertical differentiation explicitly accounts for differences in consumer attitudes for services that are accessible. As in [
26], we write the indirect utility function of a consumer type patronizing firm
i (
) as
where
are positive real numbers that describe the average consumer/user experience (we assume that the consumer buys the product/service that provides the highest surplus or buys nothing if
for both products) of patronizing a firm with or without adopting AATs, and
due to our assumption that Firm 1 offers a more accessible experience without compromising on the needs of those customers who do not care about accessibility. A continuum of potential consumers is differentiated by the non-negative, one-dimensional taste parameter
. Consumers can be characterized as those who directly benefit from accessibility options (people with disabilities) and those who may indirectly benefit in case of a temporary situational disability such as an emergency, those who altruistically support firms making such accommodations, and those who are indifferent to the provision of such options. All consumers would prefer more accessibility options at a given price; a consumer with high
is more willing to pay for an accessible shopping experience.
can be modeled as a distribution of tastes in the economy according to some density
with a cumulative distribution function
. We assume a uniform distribution in the interval
for the taste parameter
, as characterized in [
30,
34,
35,
36]. Thus,
relates to both the consumers’ average taste for accessibility and to the consumers’ heterogeneity with respect to this attribute. Let
and
be the prices paid by the consumer for the option of patronizing Firm 1 and 2, respectively. There is evidence that firms that provide AATs charge more for their products—for example, GoodMaps offering accessible maps for indoor navigation. Depending on the type of AT and what it enables, the costs of providing an AT can be negligible or large enough.
Under this model, consumers with a taste preference
choose to favor the firm with accessibility options, since
. Thus, the demand for an accessible experience at Firm 1 for a single consumer can be expressed as
Consumers with a taste parameter lower than
but greater than
will prefer the firm that does not offer accessibility options. The demand facing Firm 2 will then be
Finally, consumers who do not favor either of these firms will have a demand expressed as
3.3. Equilibrium Conditions
Given the demand functions computed above, to determine the equilibrium quantity and prices of the services desired, we first solve the profit maximization problem for Firm 1 and Firm 2. We will assume a uniform distribution in the interval
for the taste parameter
. This is the most commonly used distribution in the literature, but any other distribution could be applied here as well. The profit maximization function of Firm 1 when both firms are competing in capacity/output is
where
is the amount purchased at Firm 1 and
is the cost per unit to the firm to provide products and services including accessibility options.
Similarly, Firm 2’s profit maximization can be shown as
where
is the inverse demand facing Firm 2.
because Firm 1 incurs additional costs to improve accessibility—for example, installing hardware and developing software in the case of AATs. The first-order conditions give the quantity demanded and the price for each firm’s service at equilibrium. Firm 1’s demand can be expressed as
and the price that it charges a consumer can be expressed as
Similarly, Firm 2’s demand can be expressed as
and the price that it charges a consumer can be expressed as
Finally, the profits for both firms can be expressed as
and
The impacts of the underlying costs to the two firms
and
are of particular interest in determining the feasibility of Firm 1 offering accessibility options. We model the cost functions as follows. Firm 2 is assumed to incur a “base” cost of
, which is assumed to be the cost of offering a unit quantity of the product without any additional costs incurred to provide accessibility. Firm 1 incurs an additional percentage cost
per unit of product for providing accessibility.
The intuition here is that the accessibility costs are likely to scale with the overall costs of a firm. A larger firm with larger operational costs will have to spend more on accessibility. Economies of scale in accessibility investments can, of course, reduce those costs, in which case our cost function for Firm 1 will overestimate the costs and likely underestimate the competitiveness of Firm 1.
Given that firms will always produce non-negative quantities of products, we can arrive at the following bounds for the costs after setting
in Equations (
6) and (
8).
The impact of any incentives that governments are willing to offer, such as a subsidy, or that resulting from consumers who are willing to pay for greater accessibility, can be factored into our cost model by using the adjusted cost
, defining a new term
s, where, typically,
. This can offset some of the costs associated with research and development, deployment, and maintenance incurred with the adoption of AATs specifically catering to people with disabilities. The impact of such subsidies on Firm 1’s accessibility costs will be discussed later in
Section 5.
4. Numerical Evaluations
We perform numerical evaluations to demonstrate the model and its use in interpreting the impacts of important parameters. Since real-world data cannot justifiably be used to cover the entire breadth of analysis that this study sought to cover, numerical simulations were considered a helpful starting point in understanding the scope of the firms with and without accessibility and its impacts. Moreover, numerical evaluations are useful in offering a visual means to comprehend the relations between variables and parameters. Once the scope is established with numerical evaluations, case studies with real data are used to validate important parameters that help to justify the impacts of accessibility adoption.
4.1. Metrics
4.1.1. Market Share
It is interesting to study the evolution of market share for both firms as the costs of accessibility investments increase. One would expect Firm 1 to experience a decrease market share as its underlying costs increase, while Firm 2 is likely to benefit from this. It will also be interesting to consider the scenarios in which both firms experience a decline in market share.
4.1.2. Profit
While it is interesting to study the impact on the market shares of both firms, profits are likely to be the primary determinant of the actions that firms take. The impact of both accessibility investments and the unit costs of products on profits will help to illustrate the scenarios in which firms will be competitive.
4.1.3. User Experience Improvements
One can assert that the use of AAT can improve the user experience via an improvement in the quality of life of an individual. It is clear that increased user experience will benefit Firm 1. However, it is not clear how large this increase must be before the profit of Firm 1 is greater than zero or more than that of Firm 2. Determining this minimum user experience value would allow Firm 1 to assess the likelihood of gaining an advantage due to its investments in accessibility. If this value is deemed too high for a firm given the specific product/goods in question and the potential user base, then it should not consider accessibility investments as leading to a competitive advantage.
4.2. Results
To obtain the results shown, we set = 100 and varied to achieve the desired ratio. All other cost values were either fixed or varied and are specified for each case.
4.2.1. Impact on Market Share
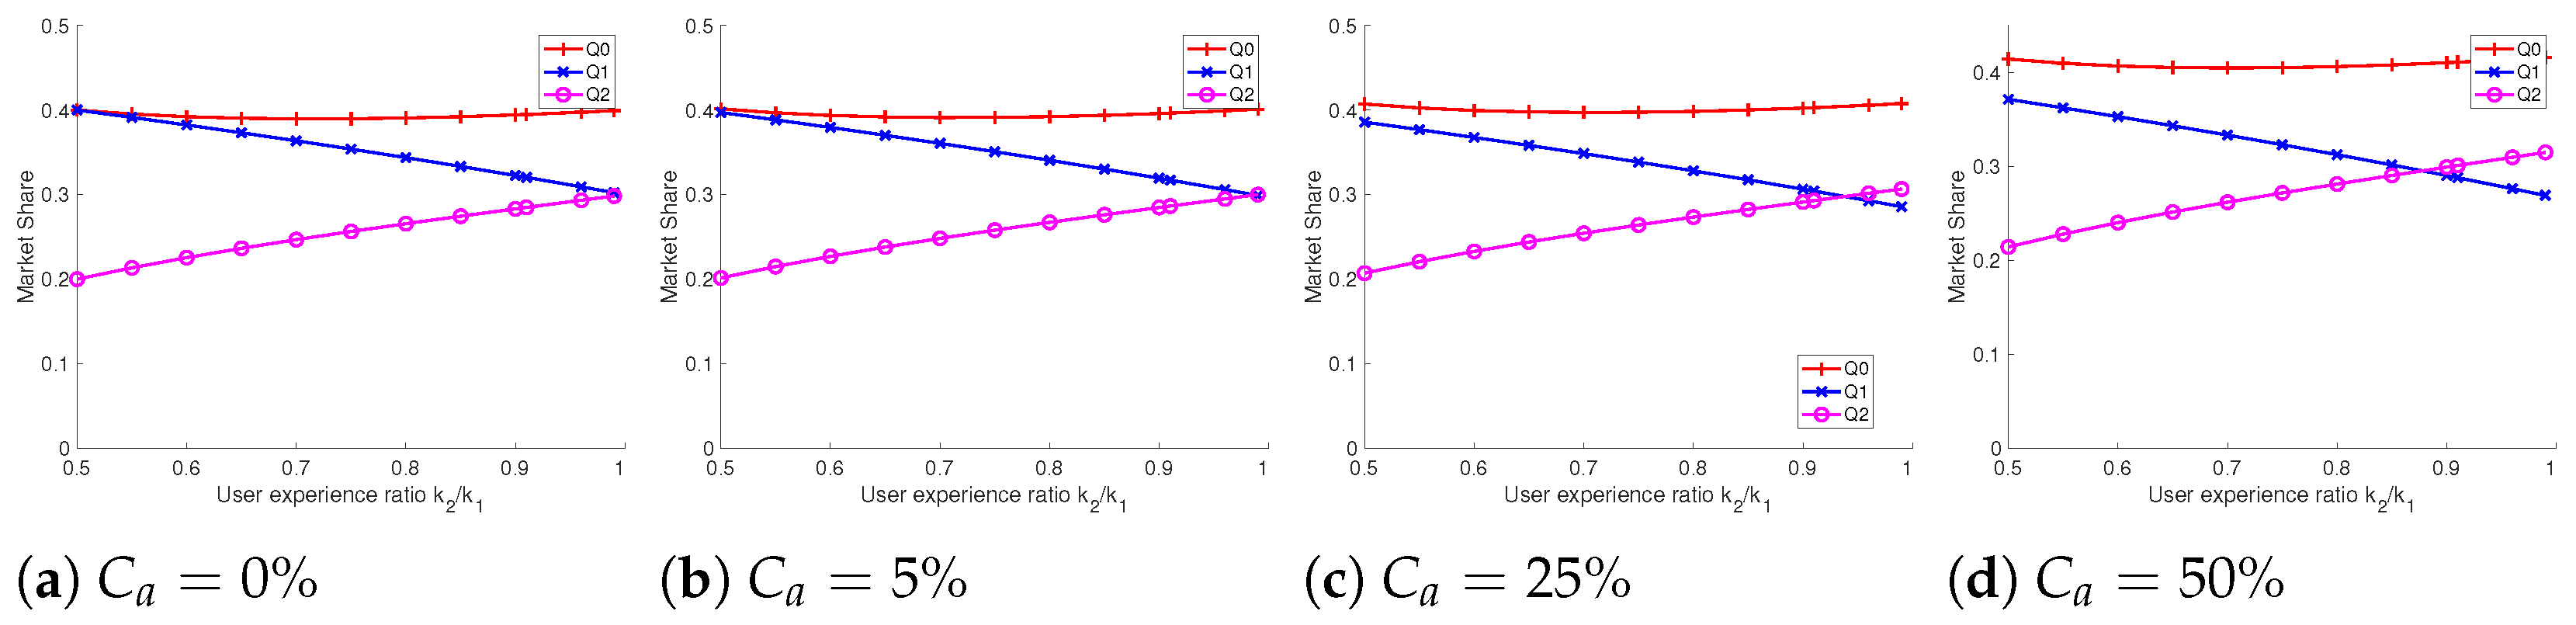
Figure 1 shows how the market share of both firms (
and
) varies as the ratio of user experience
increases. As expected, the market share for Firm 2 increases and even crosses that of Firm 1 as the user experience ratio moves closer to 1, with the point of crossover depending on the accessibility costs
incurred by Firm 1. Higher accessibility costs without a significant advantage in user experience allow Firm 2 to increase its market share over Firm 1.
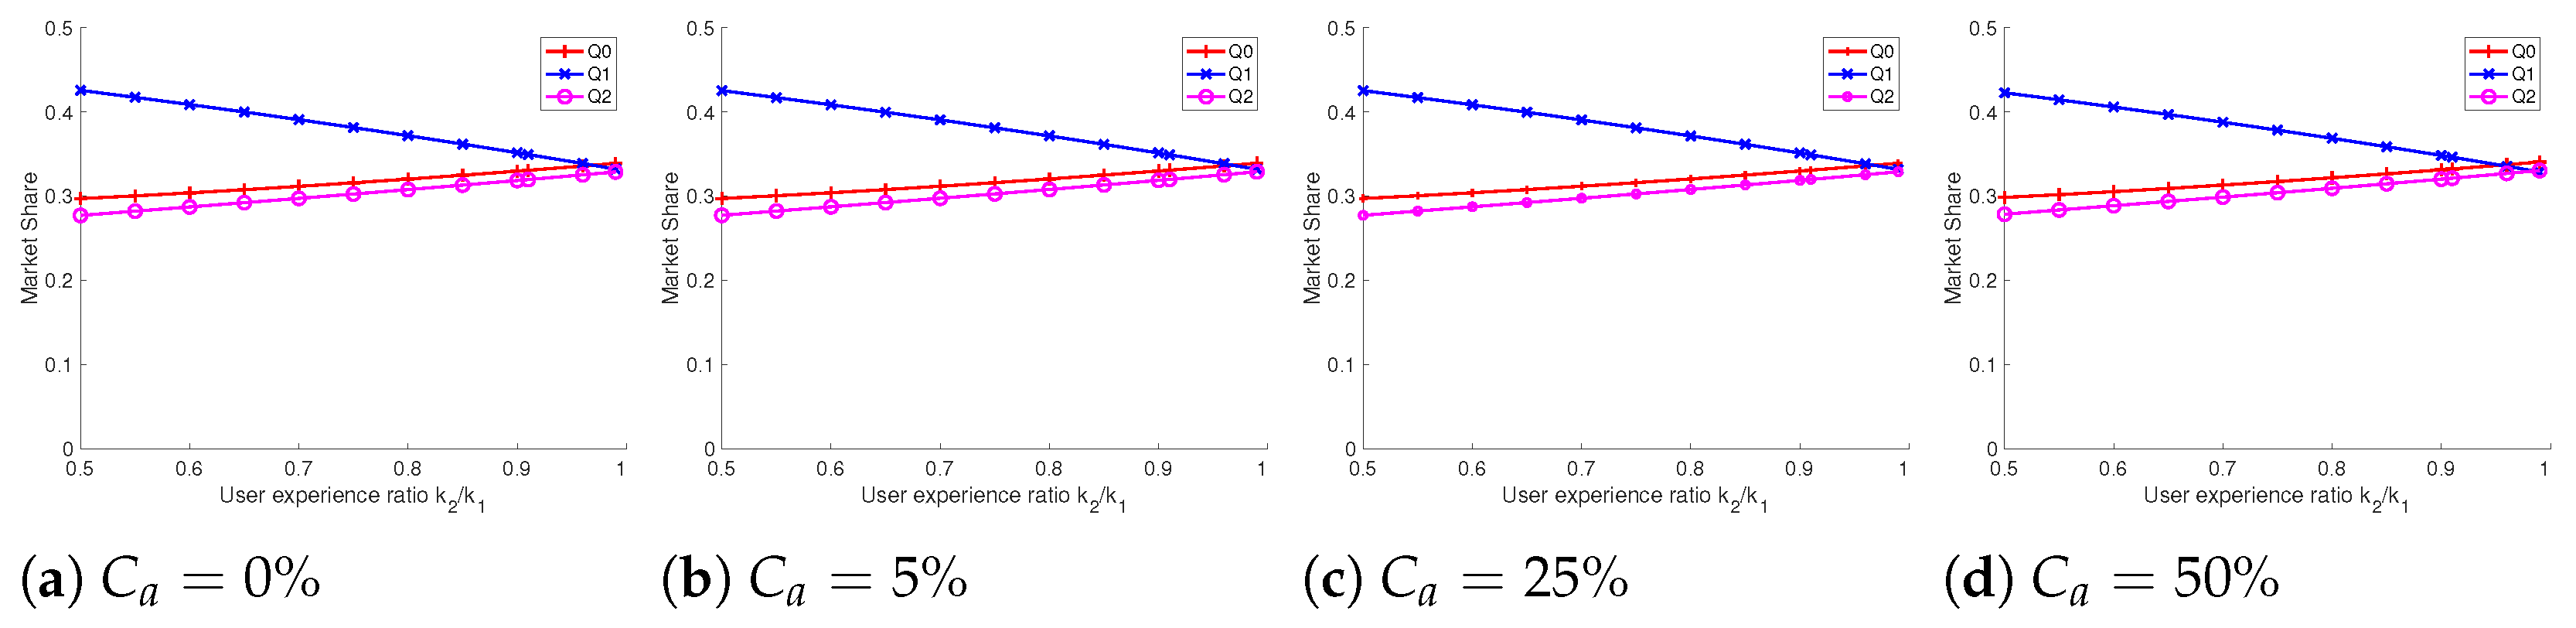
A similar trend is seen for a different (lower) value of the unit cost of a product, i.e.,
in
Figure 2. The main difference is that, now, a lower unit cost increases the product adoption likelihood (reducing
), thus increasing the market shares of both firms. As
increases, Q2 increases as expected. Interestingly,
also increases, suggesting that the loss of market share for Firm 1 is distributed between Firm 2 and the no-adoption choices. It is also seen that the sensitivity of
in impacting the market share is reduced. An overarching conclusion from these plots is that, unless the unit costs of products are close to the minimum allowable costs (based on non-zero quantities sold), Firm 1’s user experience advantage must overcome its investments in accessibility for it to gain a market share advantage over Firm 2.
4.2.2. Impact on Profits
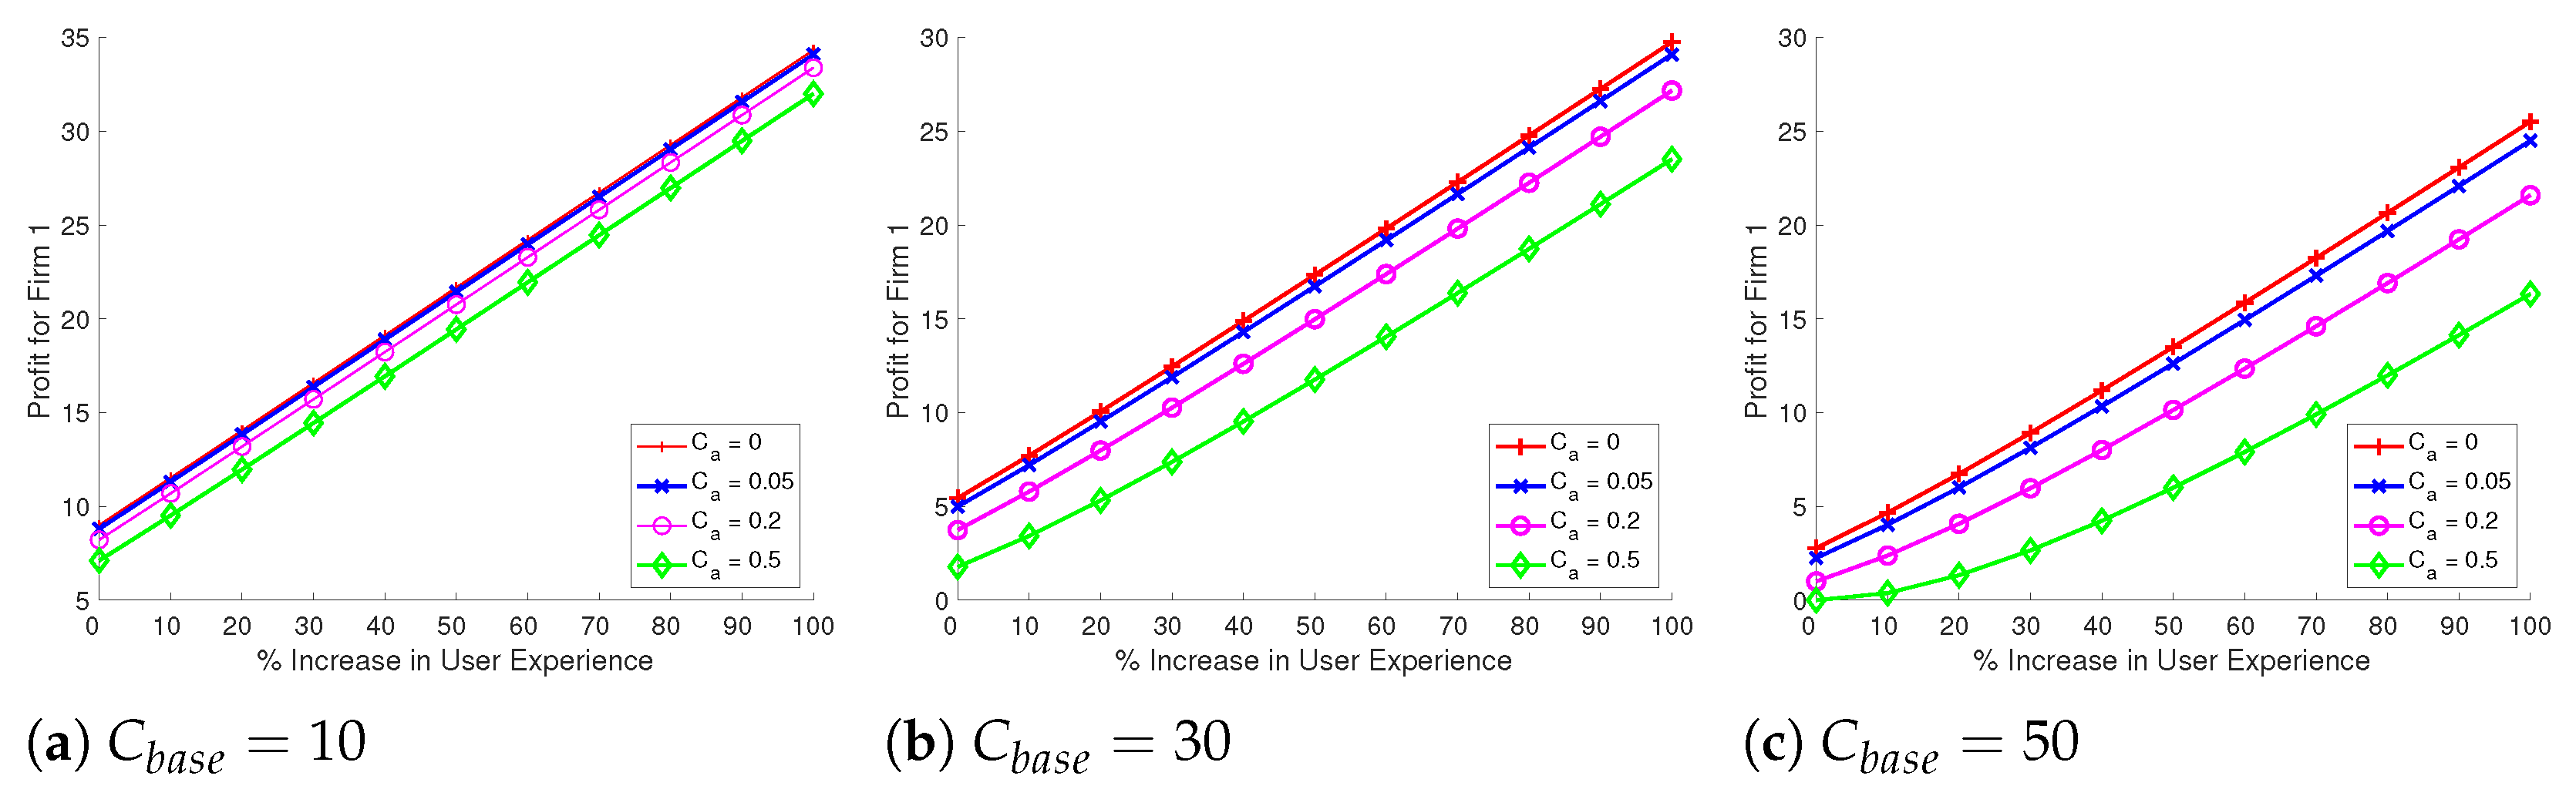
As expected, the profit for Firm 1 increases as the user experience advantage over Firm 2 increases. For larger-unit-cost products, (
), it can be seen that the profits are reduced due to the loss of market share when the consumer decides not to choose either firm’s services, as seen in
Figure 3. The major result here is that, even with large accessibility costs, Firm 1 is still able to make a profit.
4.2.3. Impact of User Experience Improvements
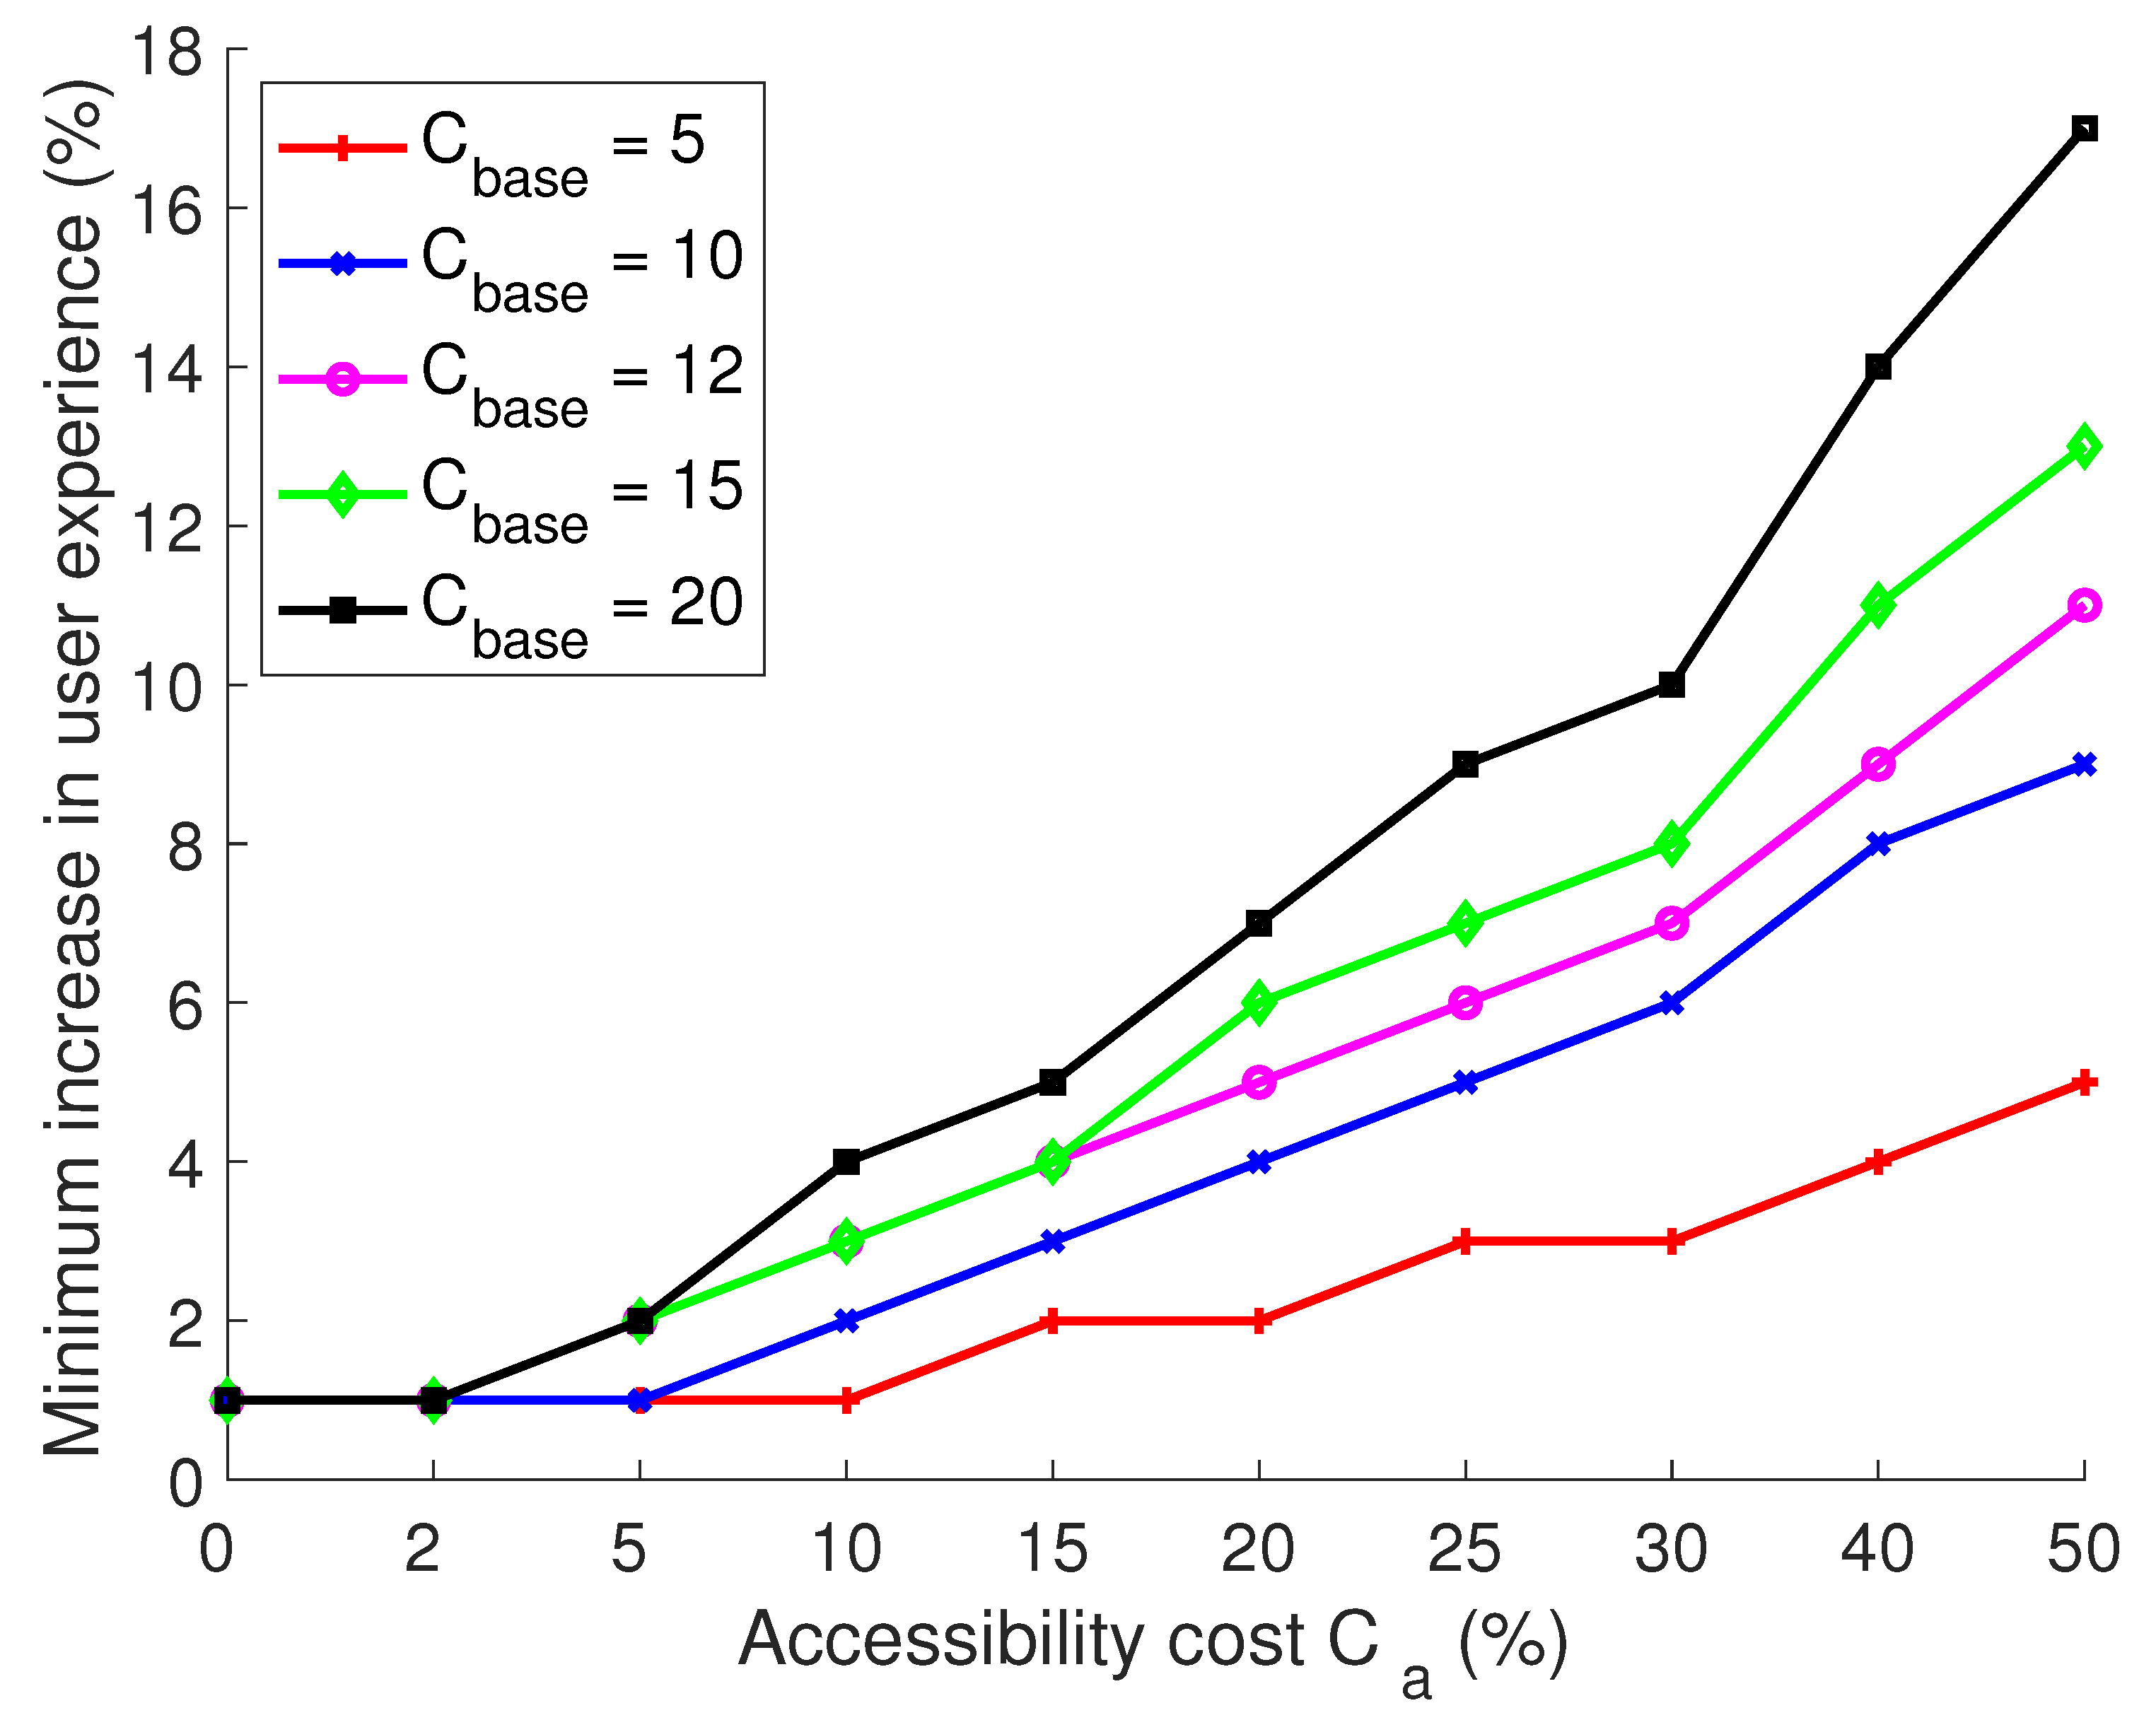
Figure 4 shows the minimum user experience needed for Firm 1 to have a profit advantage over Firm 2. If the accessibility costs are small, Firm 1 is more competitive, with only small improvements in the user experience required over Firm 2. Thus, only small investments in accessibility are needed and they will almost always be worthwhile for such firms. As
increases, Firm 1 needs a greater advantage in its user experience to overcome its investments in accessibility.
A major finding is that, with only a 10% increase in the user experience, Firm 1 can have a competitive advantage over Firm 2 across a wide range of unit costs, even for relatively large accessibility investments in the order of 20–30%. This leads to the following important question: how much of an increase in user experience can be expected with accessibility investments? This is addressed in the following section.
5. Discussion
The results presented in the previous sections indicate that any firm considering making accessibility investments can expect to generate profits and also gain an advantage over its competitors if the expected increase in the average user experience is significant (quantified as 20% or more for the parameters considered in this work) across all potential users. This reinforces the fact that firms should focus more on quantifying and improving the average user experience and that accessibility investments need not be a barrier.
There are many scenarios where there is additional help from governments or other non-profits in the form of tax incentives or other financial support to improve accessibility (e.g., [
37]). Moreover, in some scenarios, end-users may be willing to share some of the costs through, for example, a subscription model, a flat fee, or a pay-per-use model. Such a reduction in accessibility costs naturally makes it more likely that firms offering accessible services or products will be competitive. For example, from
Figure 4, it can be seen that, for a product with
, if the accessibility costs are 25%, the minimum user experience advantage needed for Firm 1 is 9%. If there were a 10% reduction in this accessibility cost due to grants or other support, the minimum user experience increase needed is only about 5%. Thus, with more (federal or otherwise) financial support, such firms will become significantly more competitive. While this is to be expected, the framework created in this work will allow firms to plan exactly how much support may be needed after calculating the accessibility investment costs.
So far, we have analyzed, from an enabler/managing entity perspective, the benefits of potential improvements in user experience and shown how these can often offset the investments made in accessibility and allow them to remain competitive in the market. One can assert that the use of AATs can improve the user experience via an improvement in the quality of life of the individual. What is not clear is the following: how much of an increase in user experience can be expected with accessibility investments? The next section seeks to answer this question through a focus group study with persons with disabilities and those directly serving them, as well as some general case studies including the broader population to assess the expected benefits for everyone.
5.1. Focus Group Study
To understand the user perception of an increase in user experience via a change in accessibility, we conducted a focus group study with twelve individuals with an emerging AAT: indoor wayfinding services. Details of these individuals are provided in
Table 1. These individuals had life experiences with disability personally or through others whom they worked with or cared for. Thus, we believe that this group of individuals was able to provide responses that gave a good approximation of the perceived increase in user experience for specific accessibility investments.
User responses were collected for the following question: What would be the increase in quality of life if every indoor space had AAT (wayfinding services in this case) to guide persons with disabilities? The choices given were 100% or more, 50%, 25%, 10%, and 0%. Three of the respondents felt that it would increase their user experience by 50%. Four felt that it would increase by 100% or more in unfamiliar environments but only 10% or so in familiar environments. Another three felt that it would improve their quality of life by 100% or more. Finally, two users felt that their quality of life would improve only by about 25%. None of the respondents chose the lower options of 10% and 0%. This result suggests that, when a task is challenging without an AAT, its introduction can improve the user experience well above an average of 50% for most users. This result should hold for any AAT, because the role of any AAT is to make access possible or more convenient, and, by definition, a significant unmet need drives the offering of AATs.
5.2. Case Studies for Expected User Experience
Next, we examine some common AATs and estimate the expected value of the increase in user experience across the entire population, not limited to only persons with disabilities. This is important because many AATs can benefit everyone and they are not limited to persons with disabilities. By accounting for all potential users, a more accurate picture of the balance between the benefits and costs can be created.
5.2.1. Case Study 1: Improved Accessibility to a Website
Typical improvements [
38] needed in the design of web pages for increased accessibility include the following: missing alternative text for images, poor color contrast, keyboard accessibility oversights, ignoring heading tags, and missing video captions and transcripts. These impact persons with a wide range of disabilities, including those who are visually impaired, hearing-impaired, and motor-impaired. An estimated 12.5% of the worldwide population can benefit from investments in web content accessibility [
38]. Within this population, if we assume that the improvement in user experience is 50% (some users will not benefit much, while, for others, it will make a marked difference), then the overall population’s increase in user experience will be 6.25%. If we consider that some of these accessibility features will also benefit the (remaining) general population (for example, captions and keyboard shortcuts), an overall improvement of 15% is a reasonable estimate.
5.2.2. Case Study 2: Improved Physical Accessibility to a Building
Physical accessibility to enter or exit buildings is typically made easier by the addition of one or more ramps with an appropriate incline, curb cuts, accessible parking stalls, sufficiently wide walking/mobility paths, appropriate heights for handles or automated door entry buttons, and access to elevators, among others. The U.S. Centers for Disease Control (CDC) statistics indicate that 13.7% of the U.S. population has a mobility impairment and would likely benefit [
39]. In addition, physical accessibility features benefit the general population in significant ways. Beneficiaries include parents pushing strollers, travelers with rolling suitcases, bicyclists, workers with hand trucks, and shoppers with carts. If we assume 20% of the (remaining) general population to be such beneficiaries and assume that everyone in this category (33.7% beneficiaries) derives a benefit of at least 50%, the overall average user improvements reach about 17%. If we assume the mobility impaired population benefits more than 50% then average user experience improvements are even higher.
5.2.3. Case Study 3: Improved Information Accessibility Within Built Environments
Information accessibility in built environments (such as malls, hospitals, stadiums, airports, and convention centers) is linked to the ease of finding wayfinding information, either physical or digital—for example, appropriately posted and accessible signs or maps regarding where to find certain sites within the space, accessible formats for information about news and announcements, and information about how to independently explore the space. Such information will be useful to those with hearing, visual, mobility, and cognitive impairments, in addition to the general population. CDC data indicate that more than one in four adults in the United States reported having a disability in 2022 [
40]. These 25% of people with disabilities can be considered direct beneficiaries of improved accessibility in built environments, with say 50% improvement. The remaining 75% of the general population can be estimated to benefit as well given the ubiquity of wayfinding needs, with say 10% improvement. The benefits for some may be very significant, while, for some others, they may be very small. Thus, an overall 20% increase in the average user experience can be expected.
6. Conclusions
This paper presented an economic framework to compare a firm that invests in providing accessibility with another firm that does not. The model and its evaluation help us to understand which parameters are relatively significant and how economic incentives can further motivate accessibility infrastructure deployment. This framework can be used to answer questions such as the following: given a firm’s operating costs and revenue, how will an additional investment in accessible spaces or technology improve or harm their market share and profits?
The analysis presented indicates that any enabler or managing entity considering accessibility investments can maintain their profitability and market competitiveness, provided that the user experience improvements are significant enough to offset the associated costs. The results show that, even with accessibility-related investment costs of 20–30%, a user experience improvement of approximately 10–20% can help firms to break even or gain a competitive edge. Additionally, financial incentives, such as subsidies or cost-sharing models, can further enhance the feasibility of accessibility investments. Our results indicate that even a modest reduction in accessibility costs (e.g., through grants) significantly lowers the required user experience improvement threshold for profitability, making accessibility investments more attractive to firms.
The framework presented in this work can be easily built into a software tool where firms can enter details about their products (e.g., fixed and variable operating costs of competitors and themselves), the potential accessibility investments that they are considering, and the expected increase in user experience from market research, enabling them to gather insights that could help in planning and forecasting. Additional work needs to be performed to relax the assumption of only two players and consider additional distributions of user tastes.
Author Contributions
Conceptualization, S.J.; Methodology, S.J.; Software, V.N.; Validation, V.N.; Formal analysis, S.J.; Writing—original draft, S.J.; Writing—review & editing, V.N.; Funding acquisition, V.N. All authors have read and agreed to the published version of the manuscript.
Funding
This work was funded in part by the U.S. National Science Foundation award #2345057.
Data Availability Statement
The original contributions presented in the study are included in the article, further inquiries can be directed to the corresponding authors.
Acknowledgments
Both authors made equal contributions to the writing of this manuscript. Siny Joseph took the lead in economic modeling and reviewing the background literature, while Vinod Namboodiri led the numerical evaluation and discussion aspects. Both authors have no conflicts of interest regarding this work.
Conflicts of Interest
The authors declare no conflicts of interest. The funders had no role in the design of the study; in the collection, analyses, or interpretation of data; in the writing of the manuscript; or in the decision to publish the results.
References
- WHO Facts. Available online: http://www.iapb.org/vision-2020/global-facts (accessed on 15 January 2025).
- The Americans with Disabilities Act of 1990 and Revised ADA Regulations Implementing Title II and Title III. Available online: https://www.ada.gov/2010_regs.htm (accessed on 15 January 2025).
- CamFind. Available online: https://camfindapp.com/ (accessed on 15 January 2025).
- KNFB Reader. Available online: https://knfbreader.com/ (accessed on 15 January 2025).
- AFB. Available online: https://www.afb.org/aw/17/7/15313/ (accessed on 15 January 2025).
- SeeingAI. Available online: https://www.microsoft.com/en-us/seeing-ai (accessed on 15 January 2025).
- WheelMap. Available online: https://wheelmap.org (accessed on 15 January 2025).
- Kim, J.E.; Bessho, M.; Kobayashi, S.; Koshizuka, N.; Sakamura, K. Navigating Visually Impaired Travelers in a Large Train Station Using Smartphone and Bluetooth Low Energy. In Proceedings of the 31st Annual ACM Symposium on Applied Computing, Pisa, Italy, 4–8 April 2016; pp. 604–611. [Google Scholar]
- Chang, Y.J.; Peng, S.M.; Wang, T.Y.; Chen, S.F.; Chen, Y.R.; Chen, H.C. Autonomous indoor wayfinding for individuals with cognitive impairments. J. Neuroeng. Rehabil. 2010, 7, 1–13. [Google Scholar] [CrossRef] [PubMed]
- Wayfindr Open Standard. Available online: https://www.wayfindr.net/ (accessed on 15 January 2025).
- Cheraghi, S.A.; Namboodiri, V.; Walker, L. GuideBeacon: Beacon-Based Indoor Wayfinding for the Blind, Visually Impaired, and Disoriented. In Proceedings of the IEEE International Conference on Pervasive Computing and Communications, Kona, HI, USA, 13–17 March 2017. [Google Scholar]
- Ahmetovic, D.; Gleason, C.; Ruan, C.; Kitani, K.; Takagi, H.; Asakawa, C. NavCog: A Navigational Cognitive Assistant for the Blind. In Proceedings of the International Conference on Human Computer Interaction with Mobile Devices and Services, Florence, Italy, 6–9 September 2016. [Google Scholar]
- Ahmetovic, D.; Murata, M.; Gleason, C.; Brady, E.; Takagi, H.; Kitani, K.; Asakawa, C. Achieving Practical and Accurate Indoor Navigation for People with Visual Impairments. In Proceedings of the W4A ’17: Proceedings of the 14th International Web for All Conference, Perth, Australia, 2–4 April 2017. [Google Scholar]
- Section 508. Available online: https://www.section508.gov (accessed on 15 January 2025).
- Meaningful Accessibility Should Not Be an Option; Rather a Fundamental Requirement Regardless of Possible Economic Return (United Nations). United Nations Convention on the Rights of Persons with Disabilities. Available online: https://www.un.org/development/desa/disabilities/convention-on-the-rights-of-persons-with-disabilities.html (accessed on 15 January 2025).
- Andersson, J.E.; Skehan, T. Accessibility in Public Buildings: Efficiency of Checklist Protocols. Stud. Health Technol. Inform. 2016, 229, 101–110. [Google Scholar] [PubMed]
- Burdett, B.R.; Locke, S.M.; Scrimgeour, F. The Economics of Enhancing Accessibility: Estimating the Benefits and Costs of Participation. In International Transport Forum Discussion Papers, No. 2017/01; OECD Publishing: Paris, France, 2017. [Google Scholar] [CrossRef]
- Chang, I. Policy-feasibility study of vertical/horizontal moving-assistant systems for the mobility-disabled using a contingent valuation method. Int. J. Sustain. Transp. 2019, 13, 170–179. [Google Scholar] [CrossRef]
- Fearnley, N.; Flügel, S.; Ramjerdi, F. Passengers’ valuations of universal design measures in public transport. Res. Transp. Bus. Manag. 2011, 2, 83–91. [Google Scholar] [CrossRef]
- Federing, D.; Lewis, D. Towards a Framework for Identifying and Measuring the Benefits of Accessibility. In International Transport Forum Discussion Papers, No. 2017/03; OECD Publishing: Paris, France, 2017. [Google Scholar] [CrossRef]
- Gassiot, M.A.; Prats, L.; Coromina, L. The perceived value of accessibility in religious sites: Do disabled and non-disabled travellers behave differently? Tour. Rev. 2016, 71, 105–117. [Google Scholar] [CrossRef]
- Odeck, J.; Hagen, T.; Fearnley, N. Economic appraisal of universal design in transport: Experiences from Norway. Res. Transp. Econ. 2010, 29, 304–311. [Google Scholar] [CrossRef]
- Terashima, M.; Clark, K. Measuring economic benefits of accessible spaces to achieve meaningful access in the built environment: A review of recent literature. J. Access. Des. All 2021, 11, 195–231. [Google Scholar]
- Quah, S.R. (Ed.) Quality Adjusted Life Years. In International Encyclopedia of Public Health, 2nd ed.; Academic Press: Oxford, UK, 2017; pp. 224–228. [Google Scholar]
- Joseph, S.; Namboodiri, V. Assessment of Economic Value of Assistive Technologies Through Quality-Adjusted Work-Life Years (QAWLY). In Proceedings of the Computers Helping People with Special Needs-17th International Conference, ICCHP 2020, Lecco, Italy, 9–11 September 2020; Proceedings, Part II; Lecture Notes in Computer Science. Miesenberger, K., Manduchi, R., Rodriguez, M.C., Penáz, P., Eds.; Springer: Berlin/Heidelberg, Germany, 2020; Volume 12377, pp. 480–488. [Google Scholar]
- Tirole, J. The Theory of Industrial Organization; MIT Press Books: Cambridge, MA, USA, 1988; Volume 1. [Google Scholar]
- Choi, C.J.; Shin, H.S. A Comment on a Model of Vertical Differentiation. J. Ind. Econ. 1992, 60, 229–231. [Google Scholar] [CrossRef]
- Moorthy, K.S. Product and Price Competition in a Duopoly. Mark. Sci. 1988, 7, 141–168. [Google Scholar] [CrossRef]
- Shaked, A.; Sutton, J. Relaxing Price Competition Through Product Differentiation. Rev. Econ. Stud. 1982, 49, 3–13. [Google Scholar] [CrossRef]
- Yayla-Küllü, H.M.; Parlaktürk, A.K.; Swaminathan, J.M. Multi-Product Quality Competition: Impact of Resource Constraints. Prod. Oper. Manag. 2013, 22, 603–614. [Google Scholar] [CrossRef]
- Wauthy, X. Quality Choice in Models of Vertical Differentiation. J. Ind. Econ. 1996, 44, 345–353. [Google Scholar] [CrossRef]
- Mussa, M.; Rosen, S. Monopoly and product quality. J. Econ. Theory 1978, 18, 301–317. [Google Scholar] [CrossRef]
- Gabszewicz, J.; Thisse, J.F. Price Competition, Quality and Disparities. J. Econ. Theory 1979, 20, 310–359. [Google Scholar]
- Joseph, S.; Lavoie, N.; Caswell, J. Implementing COOL: Comparative welfare effects of different labeling schemes. Food Policy 2014, 44, 14–25. [Google Scholar] [CrossRef]
- Zeithammer, R.; Thomadsen, R. Vertical Differentiation with Variety-Seeking Consumers. Manag. Sci. 2013, 59, 390–401. [Google Scholar] [CrossRef]
- Noh, Y.H.; Moschini, G. Vertical Product Differentiation, Entry-Deterrence Strategies, and Entry Qualities. Rev. Ind. Organ. 2006, 29, 227–252. [Google Scholar] [CrossRef]
- Small Business Funding for ADA Accessibility Compliance. Available online: https://www.businessgrants.org/2021/11/how-small-businesses-can-fund-ada.html (accessed on 15 January 2025).
- 6 Common Web Accessibility Compliance Mistakes to Avoid in 2022. Available online: https://www.boia.org/blog/6-common-web-accessibility-compliance-mistakes-to-avoid-in-2022 (accessed on 15 January 2025).
- CDC Data Shows Over 70 Million U.S. Adults Reported Having a Disability. Available online: https://www.cdc.gov/media/releases/2024/s0716-Adult-disability.html#:~:text=The%20latest%20data%2C%20from%20the,having%20a%20disability%20in%202022 (accessed on 15 January 2025).
- Disability Impacts All of Us. Available online: https://www.cdc.gov/ncbddd/disabilityandhealth/infographic-disability-impacts-all.html (accessed on 15 January 2025).
| Disclaimer/Publisher’s Note: The statements, opinions and data contained in all publications are solely those of the individual author(s) and contributor(s) and not of MDPI and/or the editor(s). MDPI and/or the editor(s) disclaim responsibility for any injury to people or property resulting from any ideas, methods, instructions or products referred to in the content. |
© 2025 by the authors. Licensee MDPI, Basel, Switzerland. This article is an open access article distributed under the terms and conditions of the Creative Commons Attribution (CC BY) license (https://creativecommons.org/licenses/by/4.0/).


