Article

Evaluation and Optimization of Outdoor Thermal Comfort of Block-Style Commercial Complex in Hot Summer and Cold Winter Regions of China

1
College of Architecture and Urban Planning, Tongji University, Shanghai 200092, China
2
Zhengzhou Zhengdong High Tech Industrial Development Co., Ltd., No. 136 Zhengkai Avenue, Zhengzhou 450016, China
3
Department of Architecture, School of Architecture, South China University of Technology, Guangzhou 510641, China
*
Author to whom correspondence should be addressed.
Buildings 2025, 15(6), 929; https://doi.org/10.3390/buildings15060929
Submission received: 8 February 2025 / Revised: 8 March 2025 / Accepted: 12 March 2025 / Published: 15 March 2025

Abstract

In recent years, block-style commercial complexes have become a prominent form of commercial architecture in many Chinese cities. The thermal comfort of their outdoor spaces significantly influences people’s activities and the overall quality of these areas. This study explores the relationship between the morphological elements of outdoor spaces in such complexes and thermal comfort, using quantifiable methods to identify key control indicators. Enhancing thermal comfort is crucial for improving spatial quality, increasing dwell time, and boosting commercial vibrancy. Focusing on the hot summer and cold winter climate of Shanghai, this research analyzed two representative block-style commercial complexes. It employed computer simulations and sensory comfort surveys to demonstrate that block morphology significantly impacts outdoor thermal comfort. Three control variables—street density, number of street intersections, and street orientation—were selected to study their effects. Spatial prototypes were categorized, and their thermal comfort performance was evaluated using numerical simulations. Based on these findings, spatial morphology was iteratively optimized. This study concluded by proposing evaluation indicators for spatial morphology control elements to enhance outdoor thermal comfort. It also provided external spatial layout strategies for block-style commercial complexes in similar climates, offering architects and urban designers decision-making criteria to improve thermal comfort in outdoor spaces. This research contributes to creating more comfortable and vibrant urban environments.

1. Introduction

1.1. Problems Existing in the External Space of Block-Style Commercial Complexes in High-Density Urban Environments

The expansion of urban areas, rapid population growth, increased urban traffic, and industrial production contribute to the “heat island effect”, where urban temperatures are notably higher than those in surrounding suburban areas during the same season. This effect is particularly severe in cities with populations exceeding 5 million, or even 10 million. Meteorological data from the past 50 years indicate a steady intensification of the urban heat island effect in Shanghai over the last three decades: from 0.09/10 in the period of 1961 to 1970, to 0.12/10 from 1971 to 1980, and further to 0.22/10 from 1991 to 2006 [1]. The exacerbation of the urban heat island effect diminishes the overall outdoor thermal comfort of the city. Moreover, buildings and numerous artificially constructed environments disrupt wind and gas circulation, resulting in either stagnant air or localized extreme wind conditions within the city. This exacerbates air pollution and other issues, indirectly impacting solar radiation, heat dissipation, and exacerbating already compromised outdoor thermal comfort.
In fact, ensuring good thermal comfort is crucial for creating an excellent external space. It directly impacts people’s willingness to stay and engage in activities within it, thereby influencing the overall quality of the external space. During the author’s visits and investigations, it was observed that in winter, the outer space of a block-style commercial complex in Beijing experiences extremely high wind speeds, leading to considerable discomfort (Figure 1). Conversely, the outer space of another nearby block-style commercial complex offers noticeably more comfort, attracting more guests for shopping, leisure, and sightseeing compared to the former. Similarly, in Shanghai during the summer, even on days with equally high temperatures, the number and behavior of users in the external spaces of different block-style commercial complexes vary significantly.
The external space of a block-style commercial complex serves a crucial role in fostering the vibrancy of commercial areas and is an integral component of urban public spaces, facilitating communication and leisure activities among urban residents. Poor thermal comfort in these spaces not only diminishes the commercial vitality of the complex but also reduces it to a mere thoroughfare.

1.2. Necessity of Research on Human Thermal Comfort in Outer Space

The severe urban heat island effect diminishes the overall thermal comfort of the city, impacting the microclimate of the outer spaces within block-style commercial complexes. This poor thermal environment directly influences the local microclimate, leaving the external spaces of these complexes vulnerable. Typically, these spaces feature hard pavement surfaces, which possess high heat absorption capabilities and readily heat up under solar radiation. Additionally, factors such as building enclosure design, street density, direction, and accessibility indirectly affect the solar radiation levels experienced within the external spaces of block-style commercial complexes. Furthermore, the wind environment plays a significant role in determining their thermal comfort.
At present, many scholars have conducted research on the microclimate of public space, and it is generally believed that the physical environment of external space has a significant impact on the use of public space and people’s stay [2,3]. In high-density urban environments, the thermal comfort of external spaces affects the physiological and psychological well-being of users, influencing their decision to stay and engage. Research on the thermal comfort of outer spaces within block-style commercial complexes can enhance their spatial quality and user experience, leading to increased foot traffic and heightened commercial vitality.

2. Preview the Literature on the Topic

2.1. Research on Human Thermal Comfort

Research on human thermal comfort began in the 1920s. With the widespread adoption of air conditioning, the American Society of Heating, Refrigerating, and Air-Conditioning Engineers (ASHRAE) introduced the effective temperature index after conducting numerous investigations and experiments. Subsequently, in the 1960s, a wealth of fundamental data related to thermal comfort were collected through extensive experimentation, laying the groundwork for Professor Fanger of the Technical University of Denmark to develop the thermal comfort equation for the human body. Professor Fanger integrated these data with considerations such as metabolic heat production, heat dissipation processes of the human body, and clothing insulation, employing physical equations to formulate the human thermal comfort equation. The Predicted Mean Vote (PMV) and the Predicted Percentage of Dissatisfied (PPD) were proposed as evaluation indices for human thermal comfort. Following extensive experimental validation, these indices have become essential tools for assessing human thermal comfort today [4]. To study human thermal comfort, four main parameters must be considered: air temperature, relative humidity, wind speed, and mean radiant temperature [4]. Additionally, factors such as clothing insulation and physical activity level in outdoor environments should also be considered [4]. Recent advancements have focused on integrating artificial intelligence with real-time environmental sensing to dynamically optimize thermal comfort models under climate change scenarios [5].

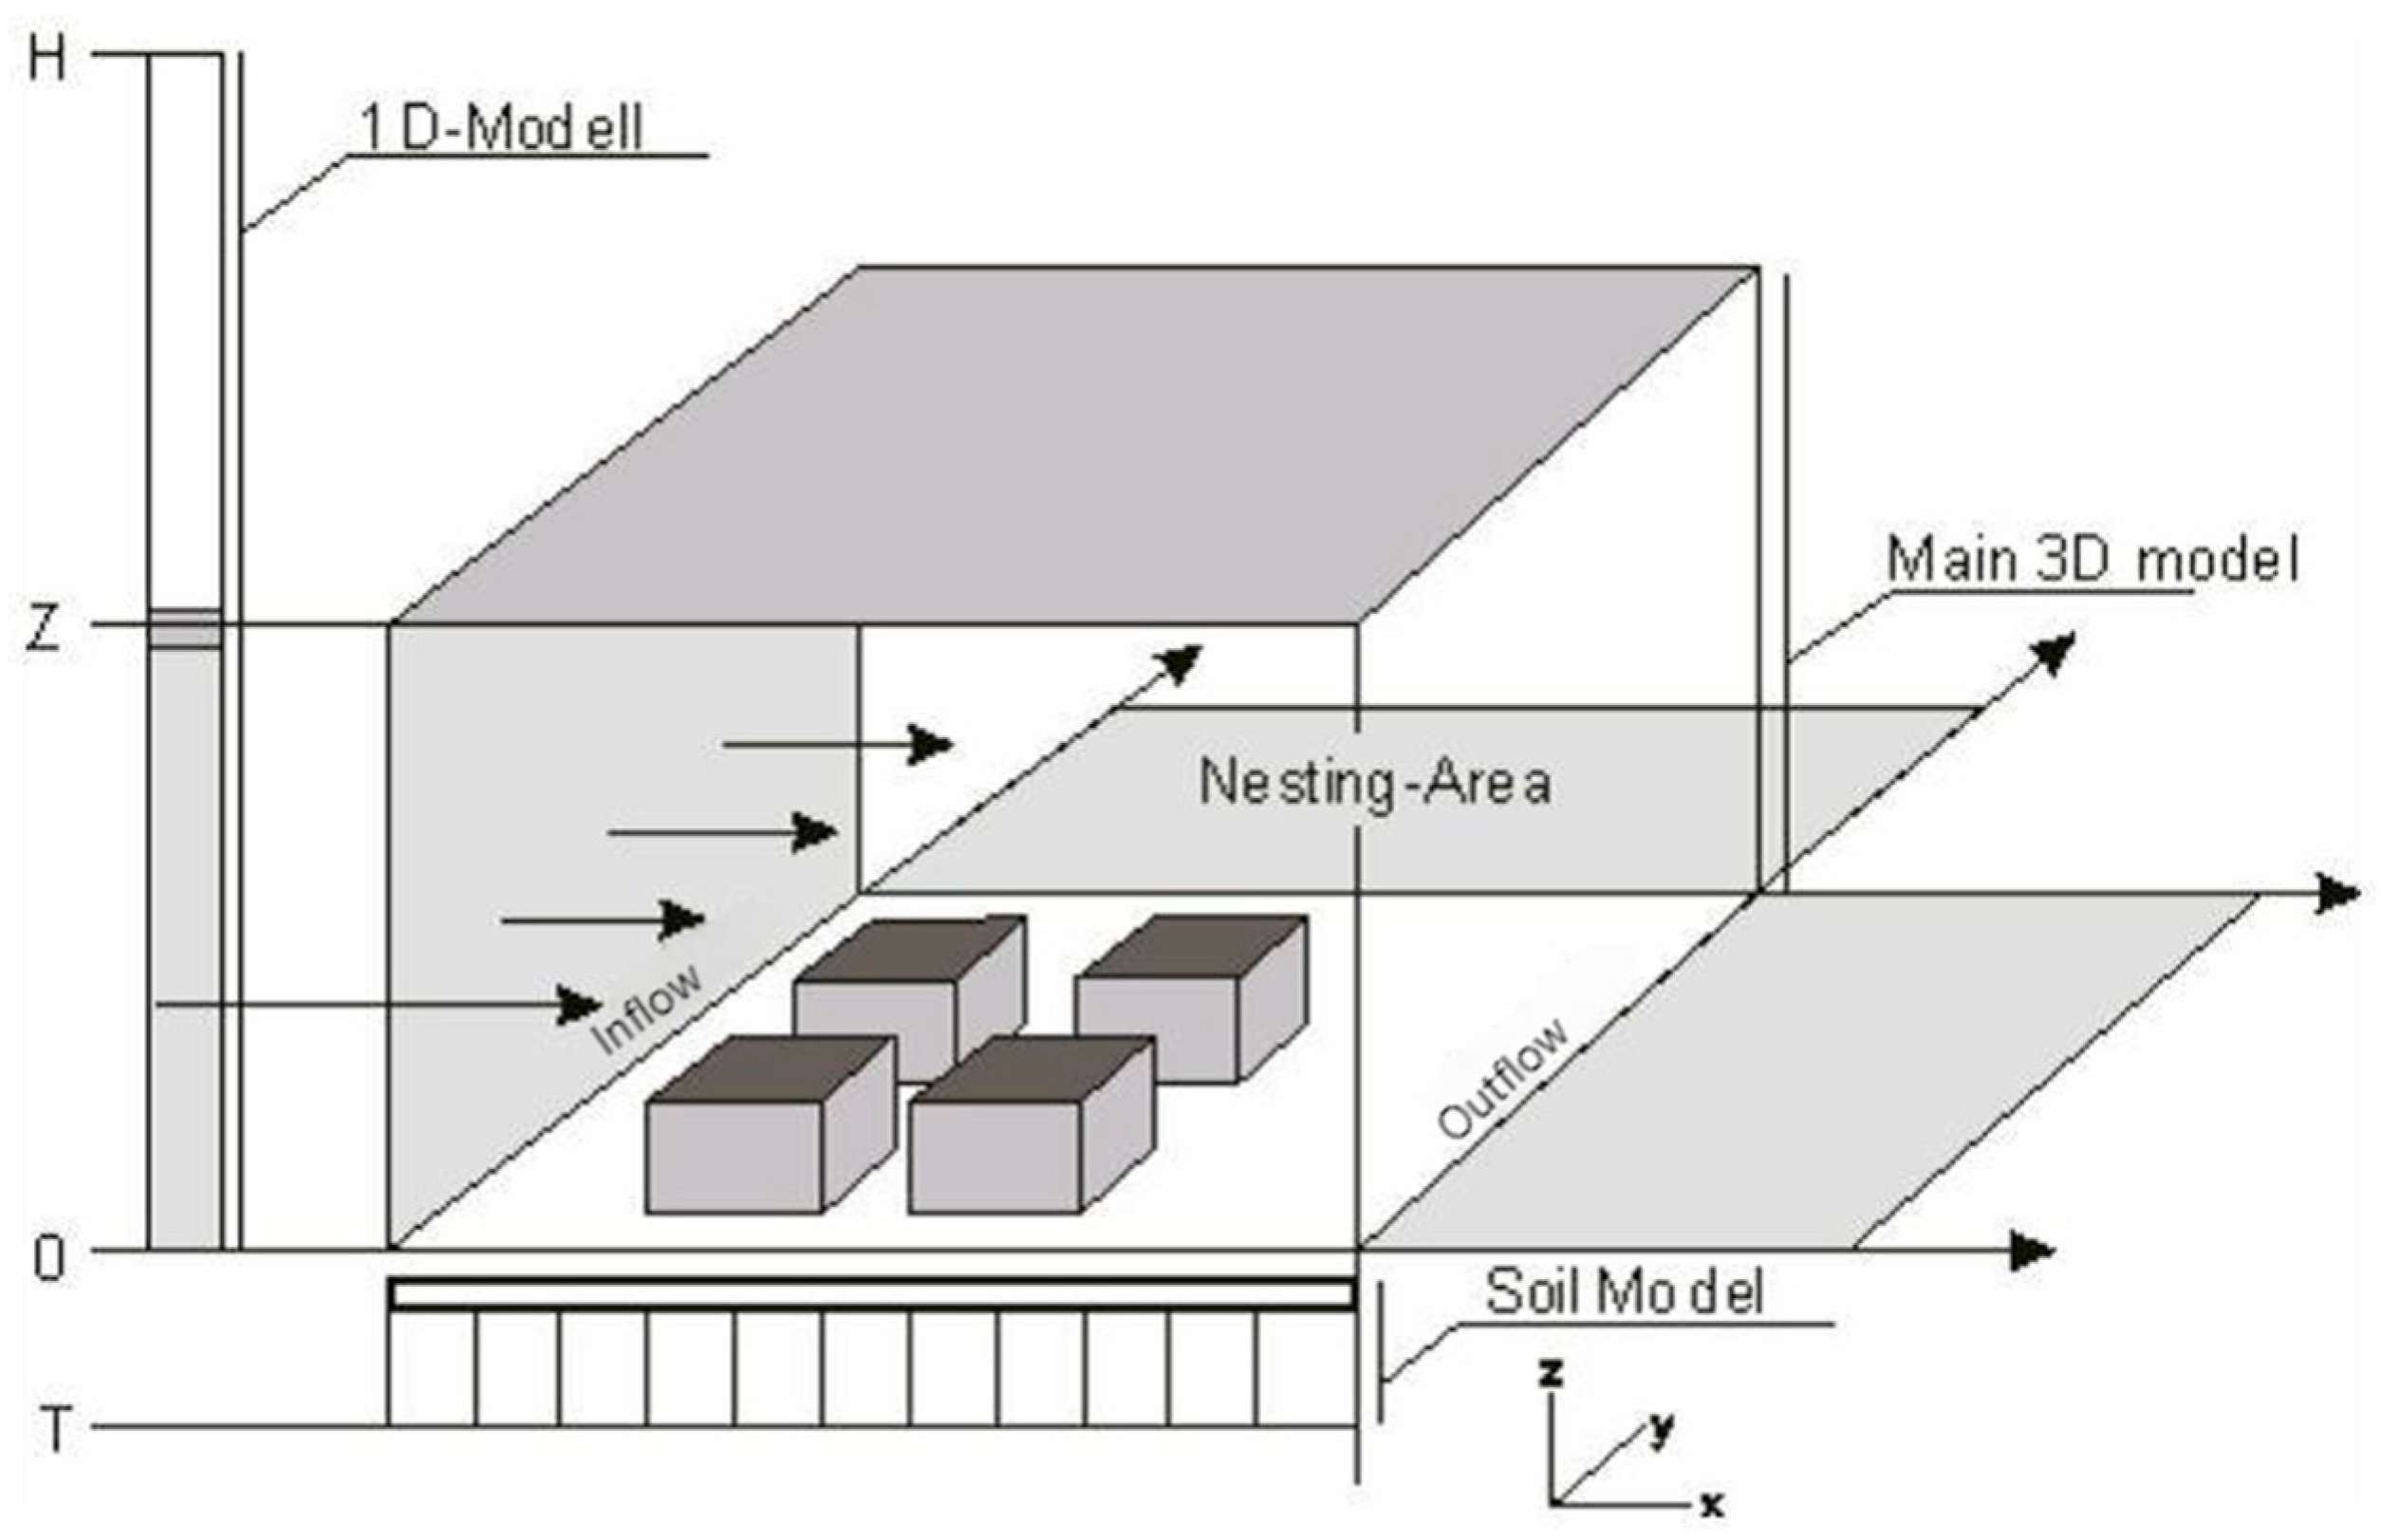
2.2. Relevant Research on Numerical Simulation of Microclimate

With the advancement of computer science and technology, research utilizing computer-based numerical simulation has been ongoing for a considerable period and has yielded fruitful results. Particularly noteworthy is the ENVI-met software (ENVI-met 4.4, ENVI-met, Düsseldorf, Germany), developed by Professor Bruce M. and his team at the University of Bochum in Germany, which enables comprehensive microclimate simulations of entire outdoor environments. Utilizing principles from basic fluid mechanics and thermodynamics, this software can accurately calculate microclimate variations over one or two diurnal cycles [6].
In addition, Dr. Wang Zhen from Huazhong University of Science and Technology analyzed the wind and thermal environment of Wuhan city, characterized by hot summers and cold winters, by combining field measurements with numerical computer simulations. The study investigated the factors influencing thermal comfort within urban streets and gorges [7]. Shi Yuan, Ren Chao, and Wu Enrong from the Chinese University of Hong Kong selected Xidan Commercial Street in Beijing as their research subject. They conducted numerical computer simulations to analyze the wind and thermal environment of the pedestrian street district, evaluated its wind and thermal comfort, and proposed corresponding urban design strategies for improvement. Subsequently, through numerical computer simulation verification post-transformation, they put forward a universal urban design strategy to enhance the wind and thermal environment of urban commercial pedestrian streets [8]. Recent advancements emphasize the integration of machine learning with multi-scale microclimate modeling to improve prediction accuracy and optimize urban design interventions in real-time scenarios [9].

2.3. Research on Urban Climatology

Classification and Characteristics of the Urban Climate

In Man, Climate, Architecture, Barry categorizes climate into global wind zone climate, regional atmospheric climate, local topographic climate, and microclimate based on the scale of climate characteristics, considering both horizontal and vertical ranges (Table 1).
Microclimate is defined as the near-surface climate that occurs within a horizontal range of 1 km and is limited to a height of less than 100 m. It is determined by the structural characteristics of the underlying surface and is most significantly influenced by human activities [10].
By summarizing urban design cases from 1996 to 2006, scholar Matthias Roth explored the common problems in large and medium-sized cities in tropical and subtropical regions:
(1)
The higher temperature in the city decreases the thermal comfort of the human body and brings the problem of increased mortality.
(2)
Due to the decrease in wind speed caused by the man-made environment, the pollutants cannot be effectively discharged in time, which brings up the problem of air pollution retention.
(3)
The energy exchange brought about by human production and life intensifies the change in urban microclimate [11].
Emerging studies now prioritize nature-based solutions, such as integrating permeable pavements and vertical greenery systems, to simultaneously mitigate urban heat islands and enhance pollutant dispersion in dense urban areas [12].
The study area of this paper is Shanghai. As a city in a hot summer and cold winter area, outdoor high temperatures and high humidity in summer reduce the thermal comfort of outdoor activities, which has an impact on people’s outdoor space activities [13].
The external space of a block-style commercial complex is also a component of the city’s external public space. Similar to urban outdoor spaces, its thermal comfort is closely related to factors such as its shape, spatial distribution, and enclosing interface. Additionally, the block-style commercial complex building exhibits characteristics typical of urban blocks, with specific form index factors for control [14]. Consequently, the microclimate environment of the external space of a block-style commercial complex can be influenced by human activities.

3. Study Area and Methods

3.1. Selection of Numerical Simulation Software

In this study, the author selected Envi-met, developed by German scientist Professor Michael Bruse and his team, to simulate the physical environment of outdoor spaces and directly derive relevant thermal comfort evaluation index data. The following section will describe the software selection process in more detail.
Envi-met (ENVI-met 4.4, ENVI-met, Düsseldorf, Germany), is a 3D non-static microclimate modeling software that can calculate and simulate the microclimate environment of urban areas. In this software, the urban environment can be represented through grid modeling, with each grid’s accuracy adjustable from 0.5 m to 10 m. The simulation interval is set at 10 s. Utilizing the fundamental principles of fluid mechanics and thermodynamics, the software computes the microclimate dynamics over a complete daily cycle. The key variables affecting the software’s calculations include wind speed and direction, air temperature and humidity, fluctuations, radiation coefficient, bioclimatology, and gas and particle diffusion. The basic working principle is illustrated in the figure below (Figure 2):
The Envi-met model comprises a three-dimensional core model encompassing the atmosphere, vegetation, soil, and buildings, alongside a one-dimensional boundary layer model (Figure 2). The three-dimensional core model simulates all microclimate processes in the relevant urban environment, while the one-dimensional model converts the initial values into the boundary values of the three-dimensional core model. The one-dimensional model extends to 2500 m in the vertical direction and can simulate microclimate changes in the actual environment more accurately.
The numerical calculation of the Envi-met software involves many physical formulas related to thermodynamics, fluid mechanics, and other aspects. These have been discussed in the paper by the software development team, and relevant research and expressions can be referred to in the associated papers.

3.2. Thermal Comfort Data Index

In terms of evaluating human thermal comfort, this paper adopts a rational index developed based on the energy balance equation, combined with existing empirical data and formulas. This approach enables the calculation of a large amount of data in an unsteady thermal environment and fulfills the evaluation requirements for outdoor human thermal comfort more effectively.
Physiological Equivalent Temperature (PET) and Mean Radiant Temperature (MRT)
Physiological equivalent temperature (PET) is defined as the environmental conditions indoors (with an air temperature of 20 °C, wind speed of 0.1 m/s, humidity of 50%, air pressure of 12 hPa, and average radiation temperature equal to the air temperature), which maintain the core temperature and skin layer temperature of a typical human object at the same level as the air temperature in the indoor or outdoor environment being evaluated. PET is calculated based on the Munich Energy Model (MEMI) and is specifically used for the thermal comfort evaluation of outdoor environments [15] (Table 2).
Since the evaluation software used by the author cannot directly obtain PET data at present, the author will substitute it with another parameter that reflects outdoor thermal comfort: mean radiant temperature (MRT). By leveraging computer simulation software, the MRT value of the external space can be directly measured, enabling the evaluation of outdoor thermal comfort.
Dr. Wang Zhen from Huazhong University of Science and Technology, China, investigated the measurement of thermal comfort and conducted numerical computer simulations of urban street gap spaces. Dr. Wang found a linear relationship between physiological equivalent temperature and MRT by statistically analyzing a large dataset. This finding serves as the theoretical basis for the author’s decision to use MRT as a substitute for the PET index. The equation is expressed as follows:
y = 0.7133 x − 2.2744
where R2 (coefficient of determination) = 0.998.
R2 is a coefficient used to measure linear correlation and reflects the relationship between two variables. The closer R2 is to 1, the stronger the correlation between the variables, while R2 closer to 0 indicates a weaker linear relationship.
In Dr. Wang Zhen’s simulation study, a high correlation was observed between physiological equivalent temperature and average radiation temperature. This is attributed to the significant influence of direct sunlight on both external and internal heat radiation in the human body. Therefore, average radiation temperature holds greater practical significance than air temperature in comfort evaluation.

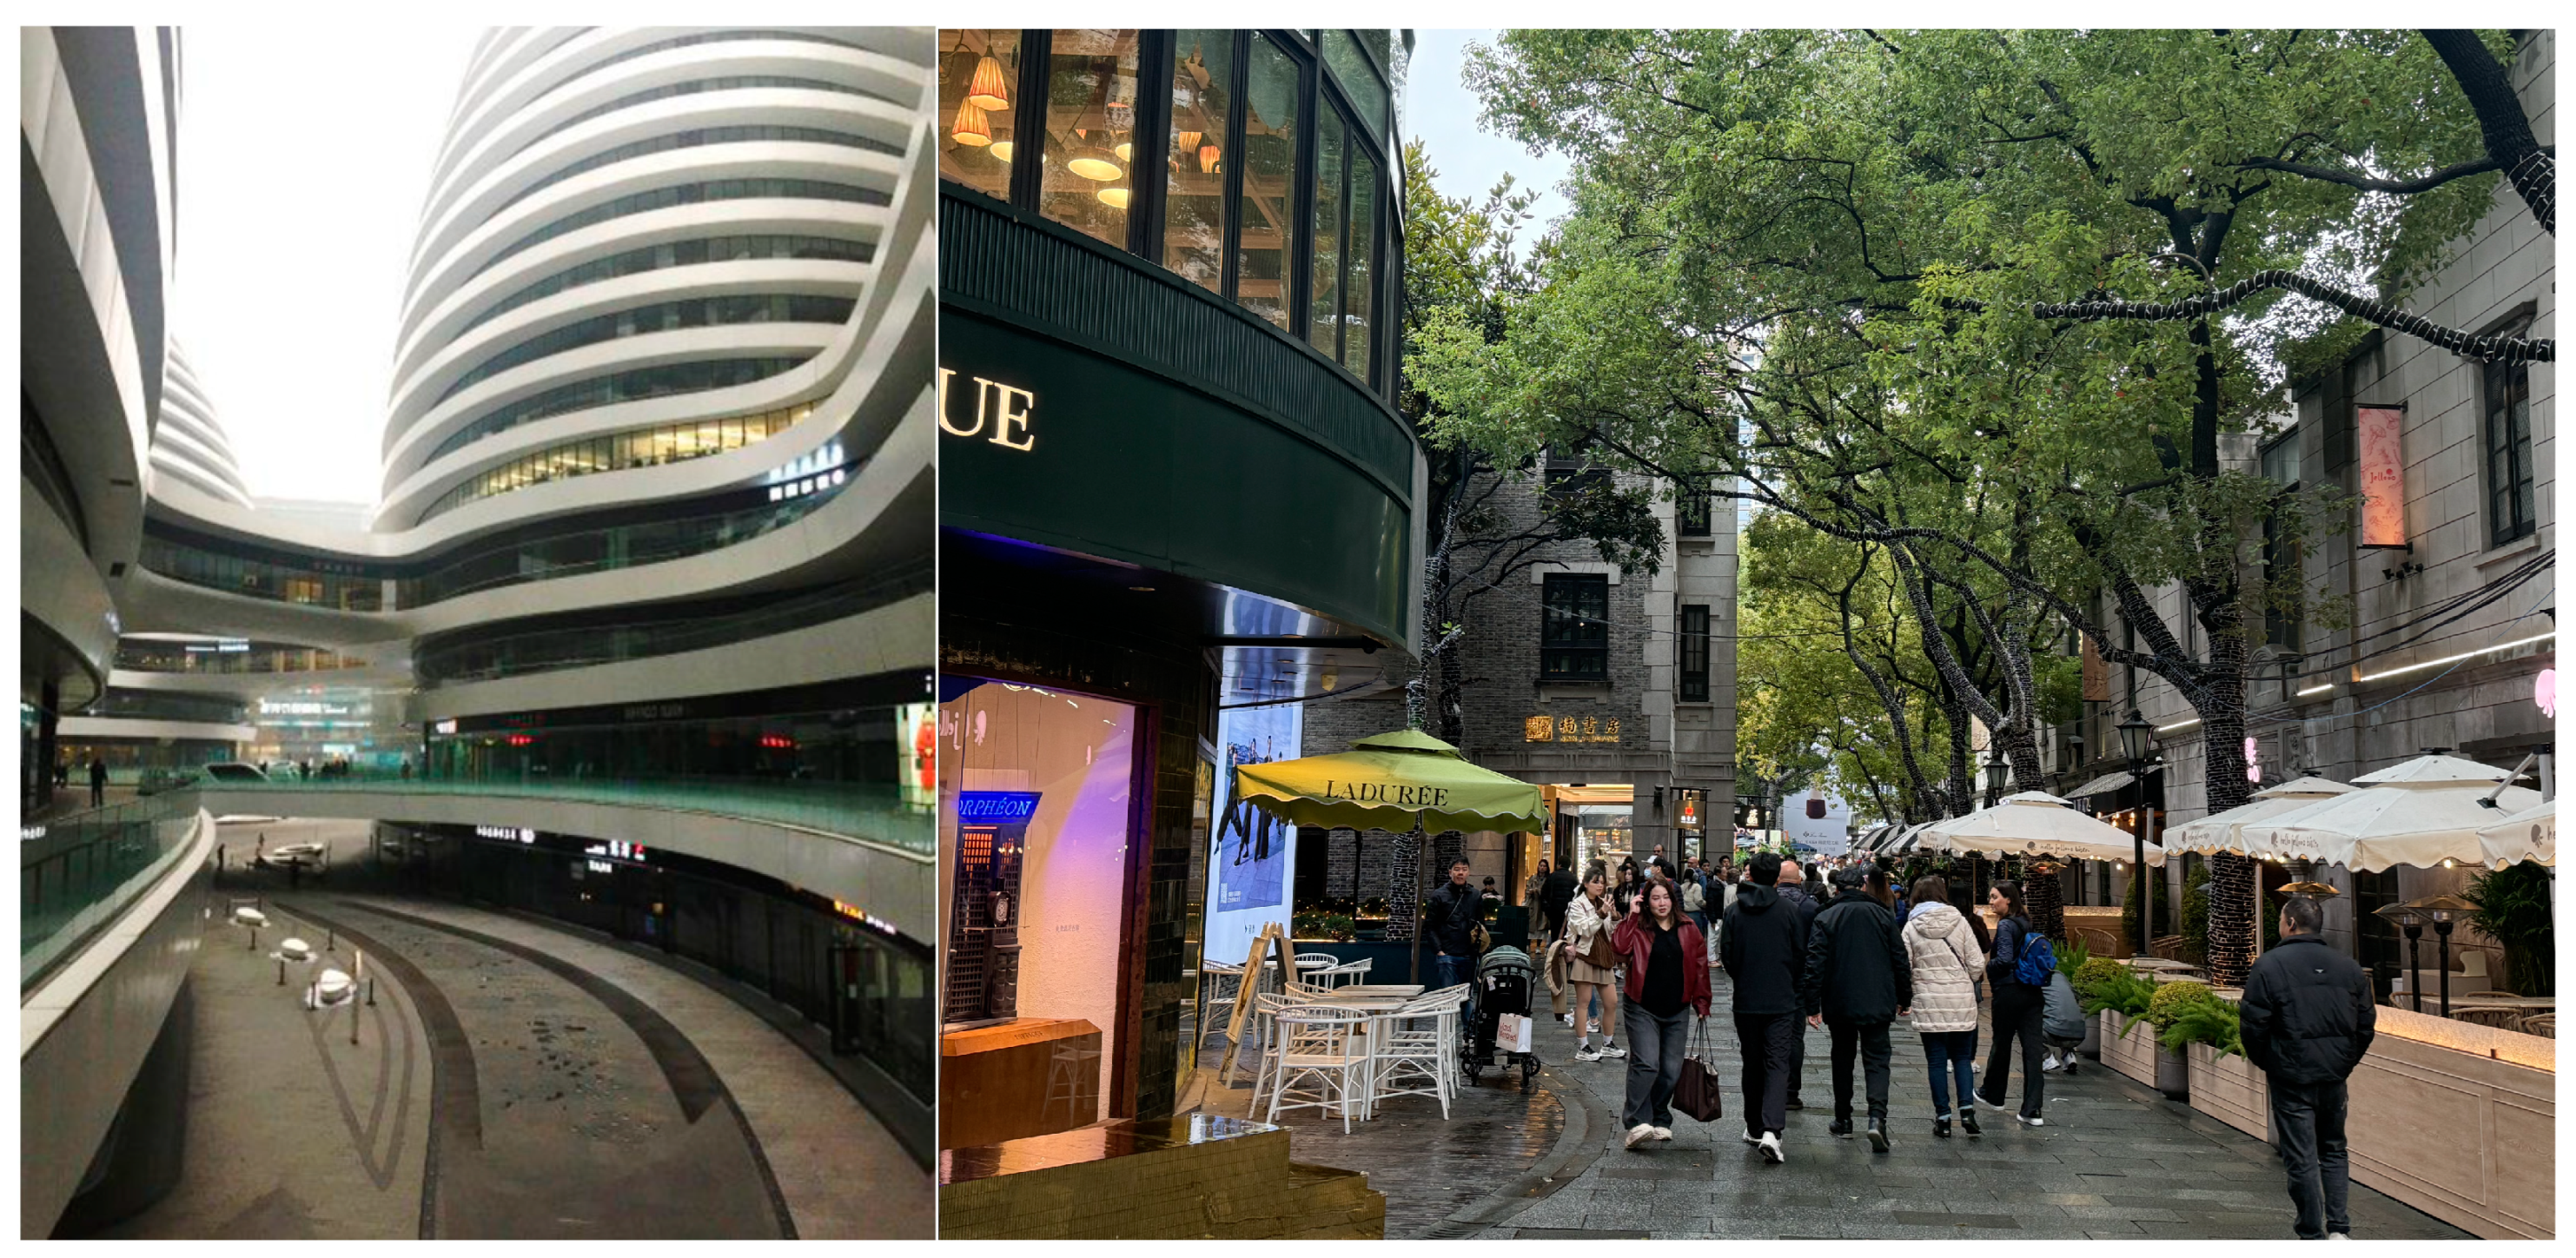
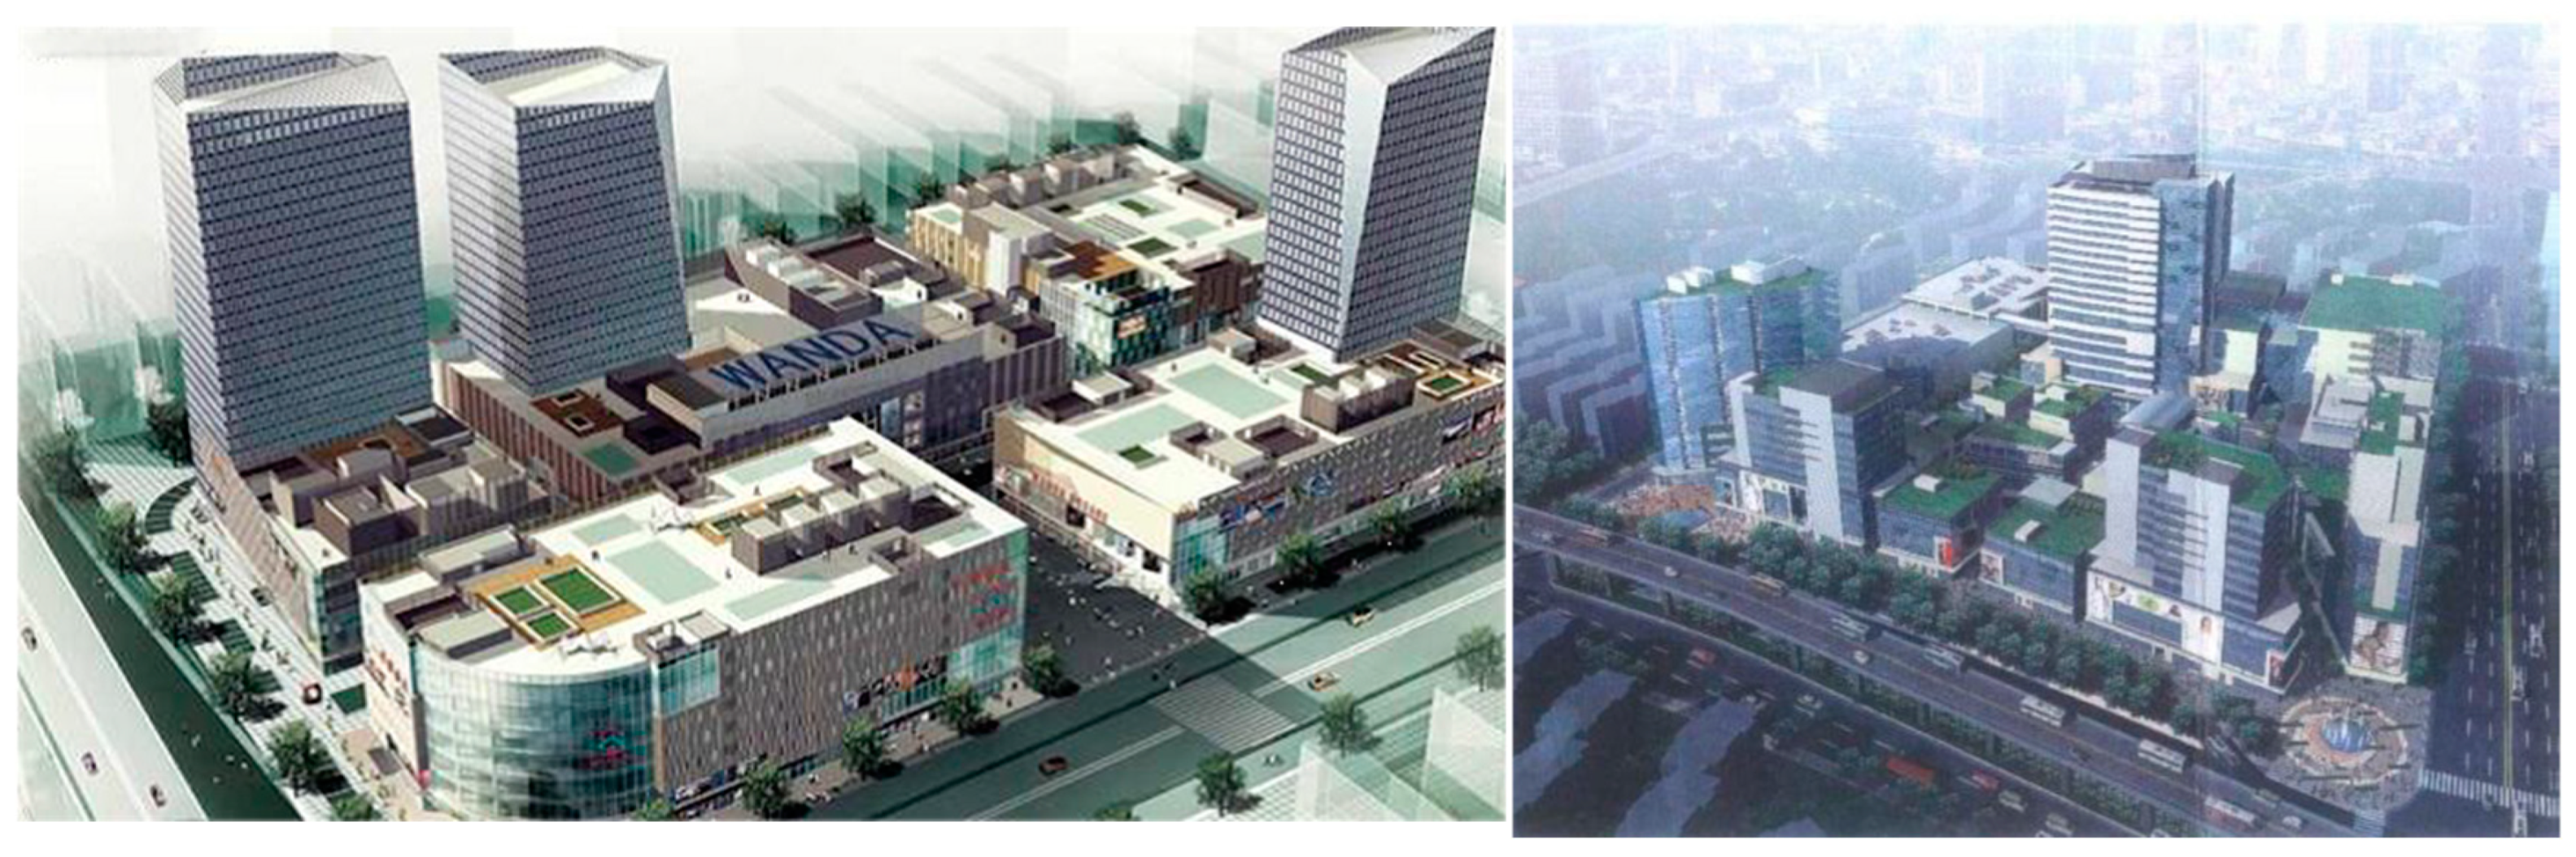
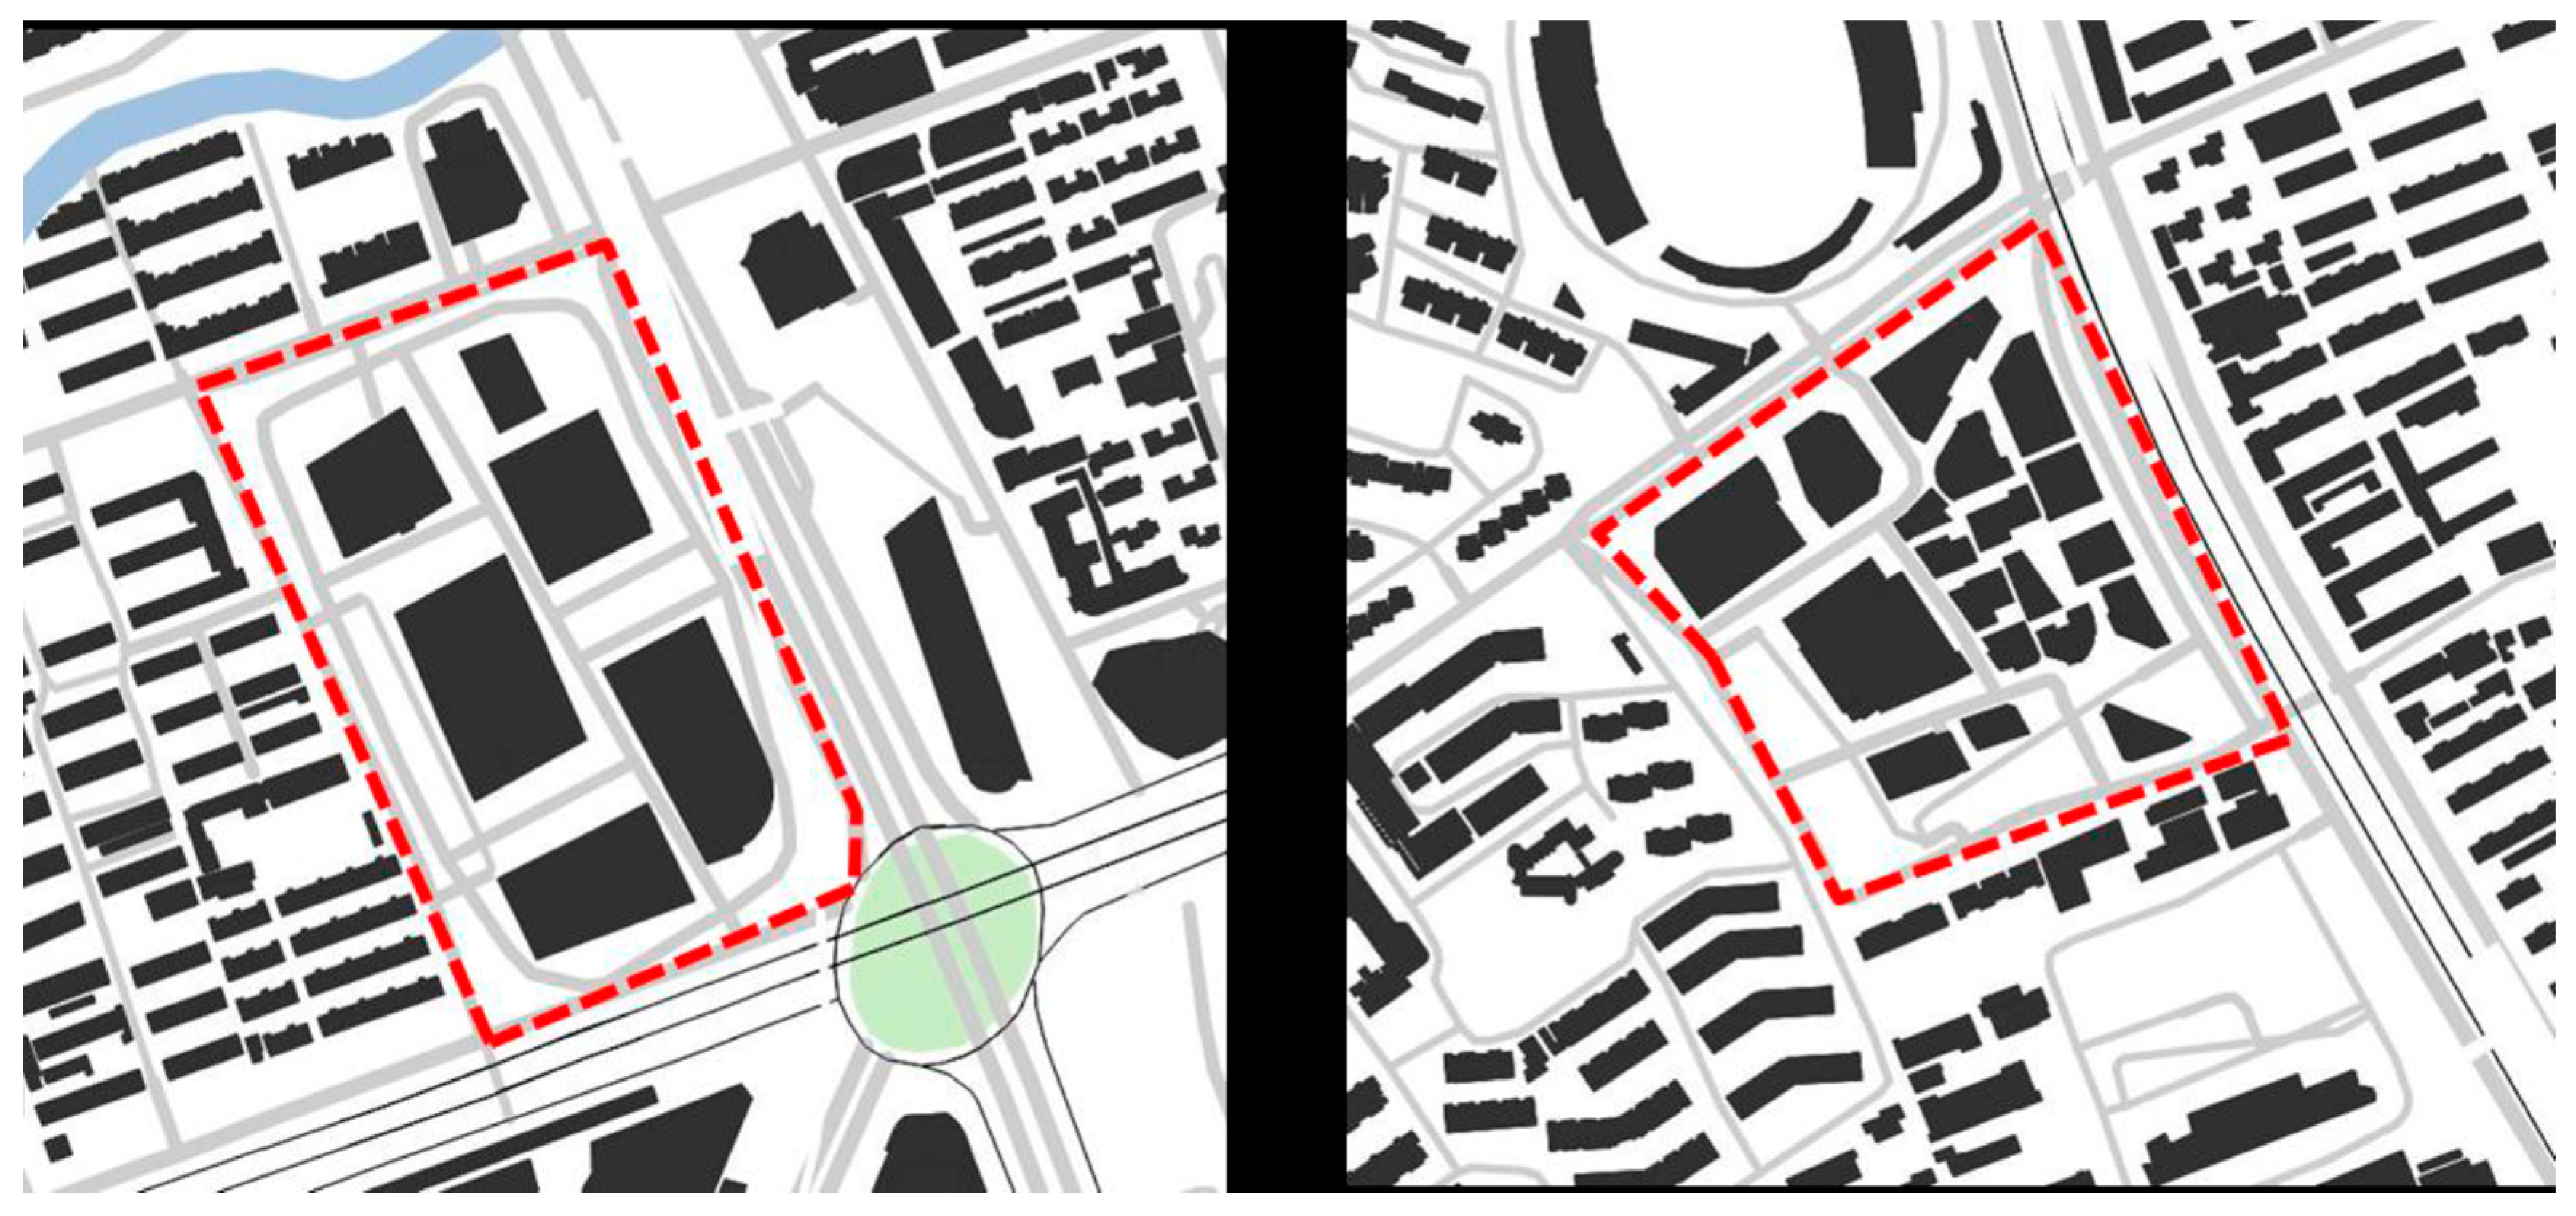
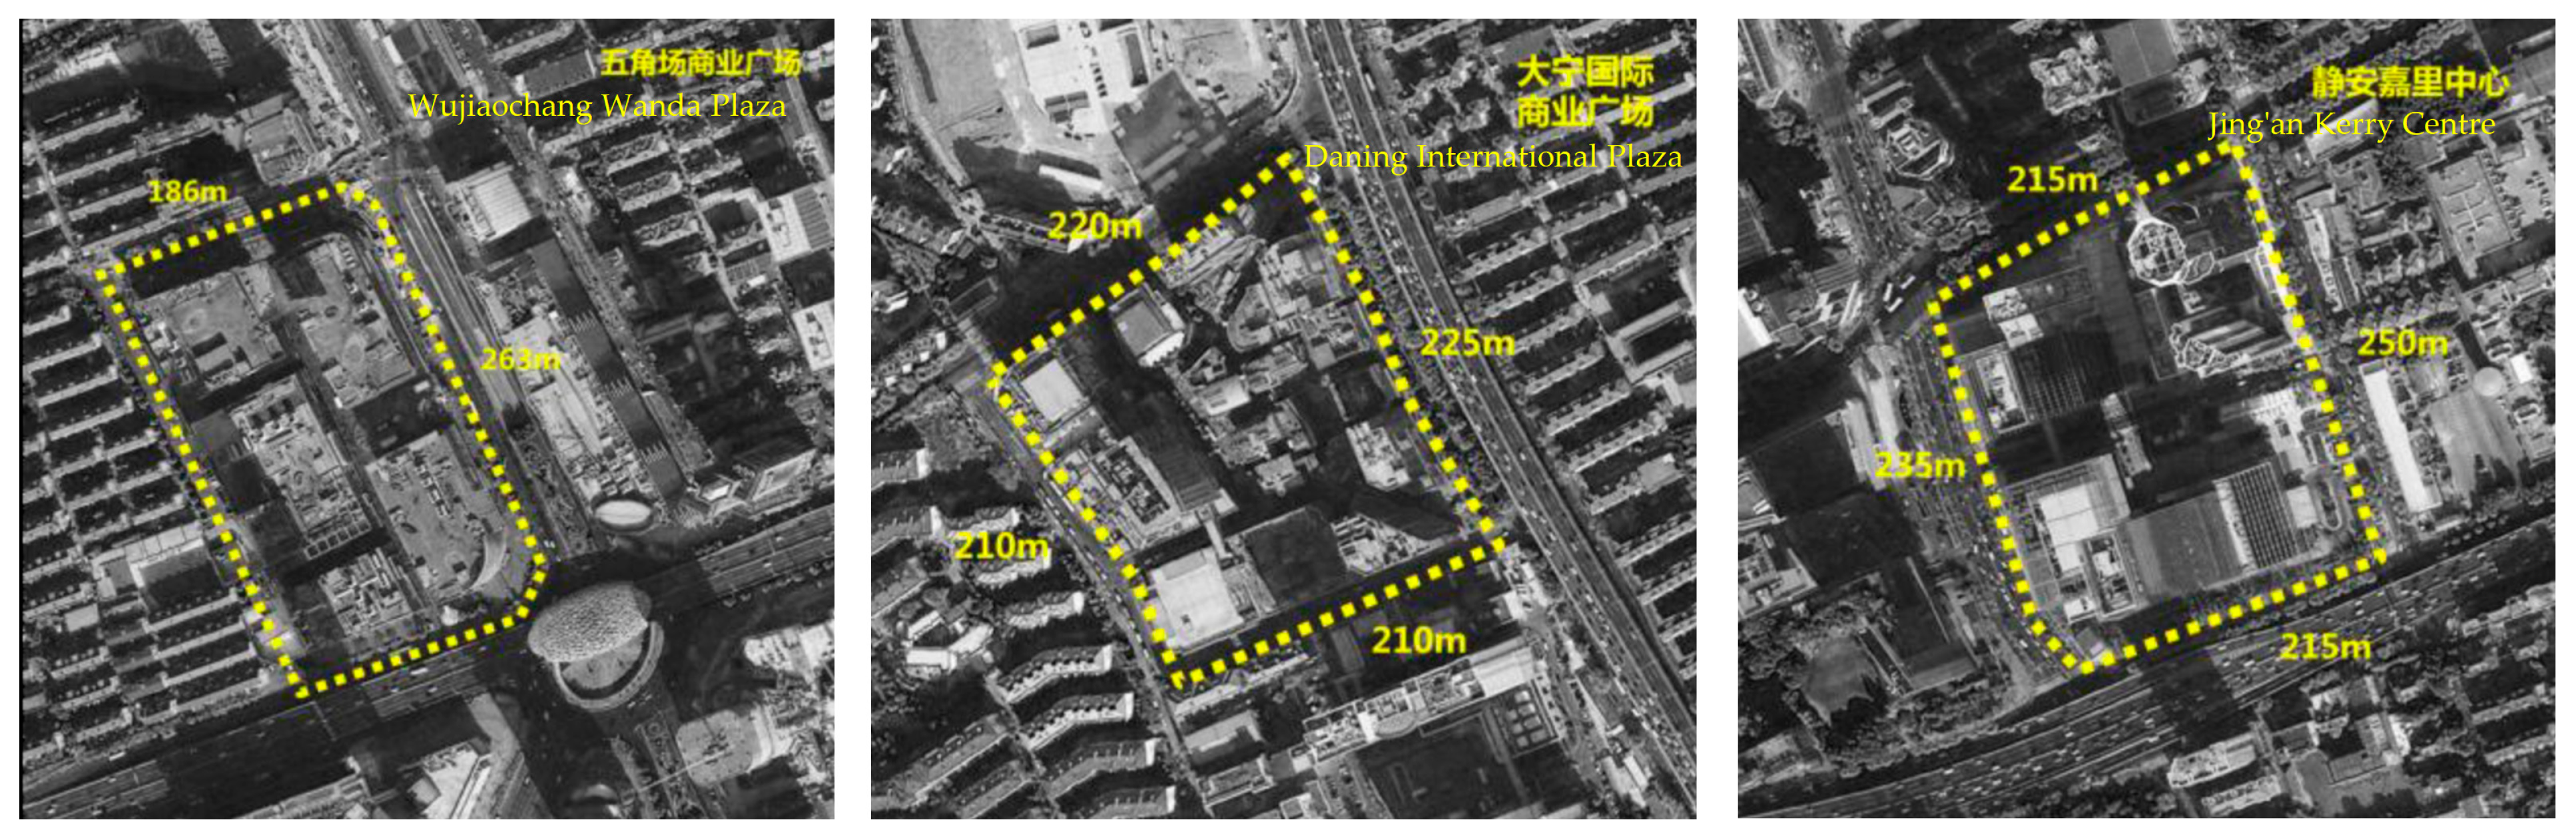
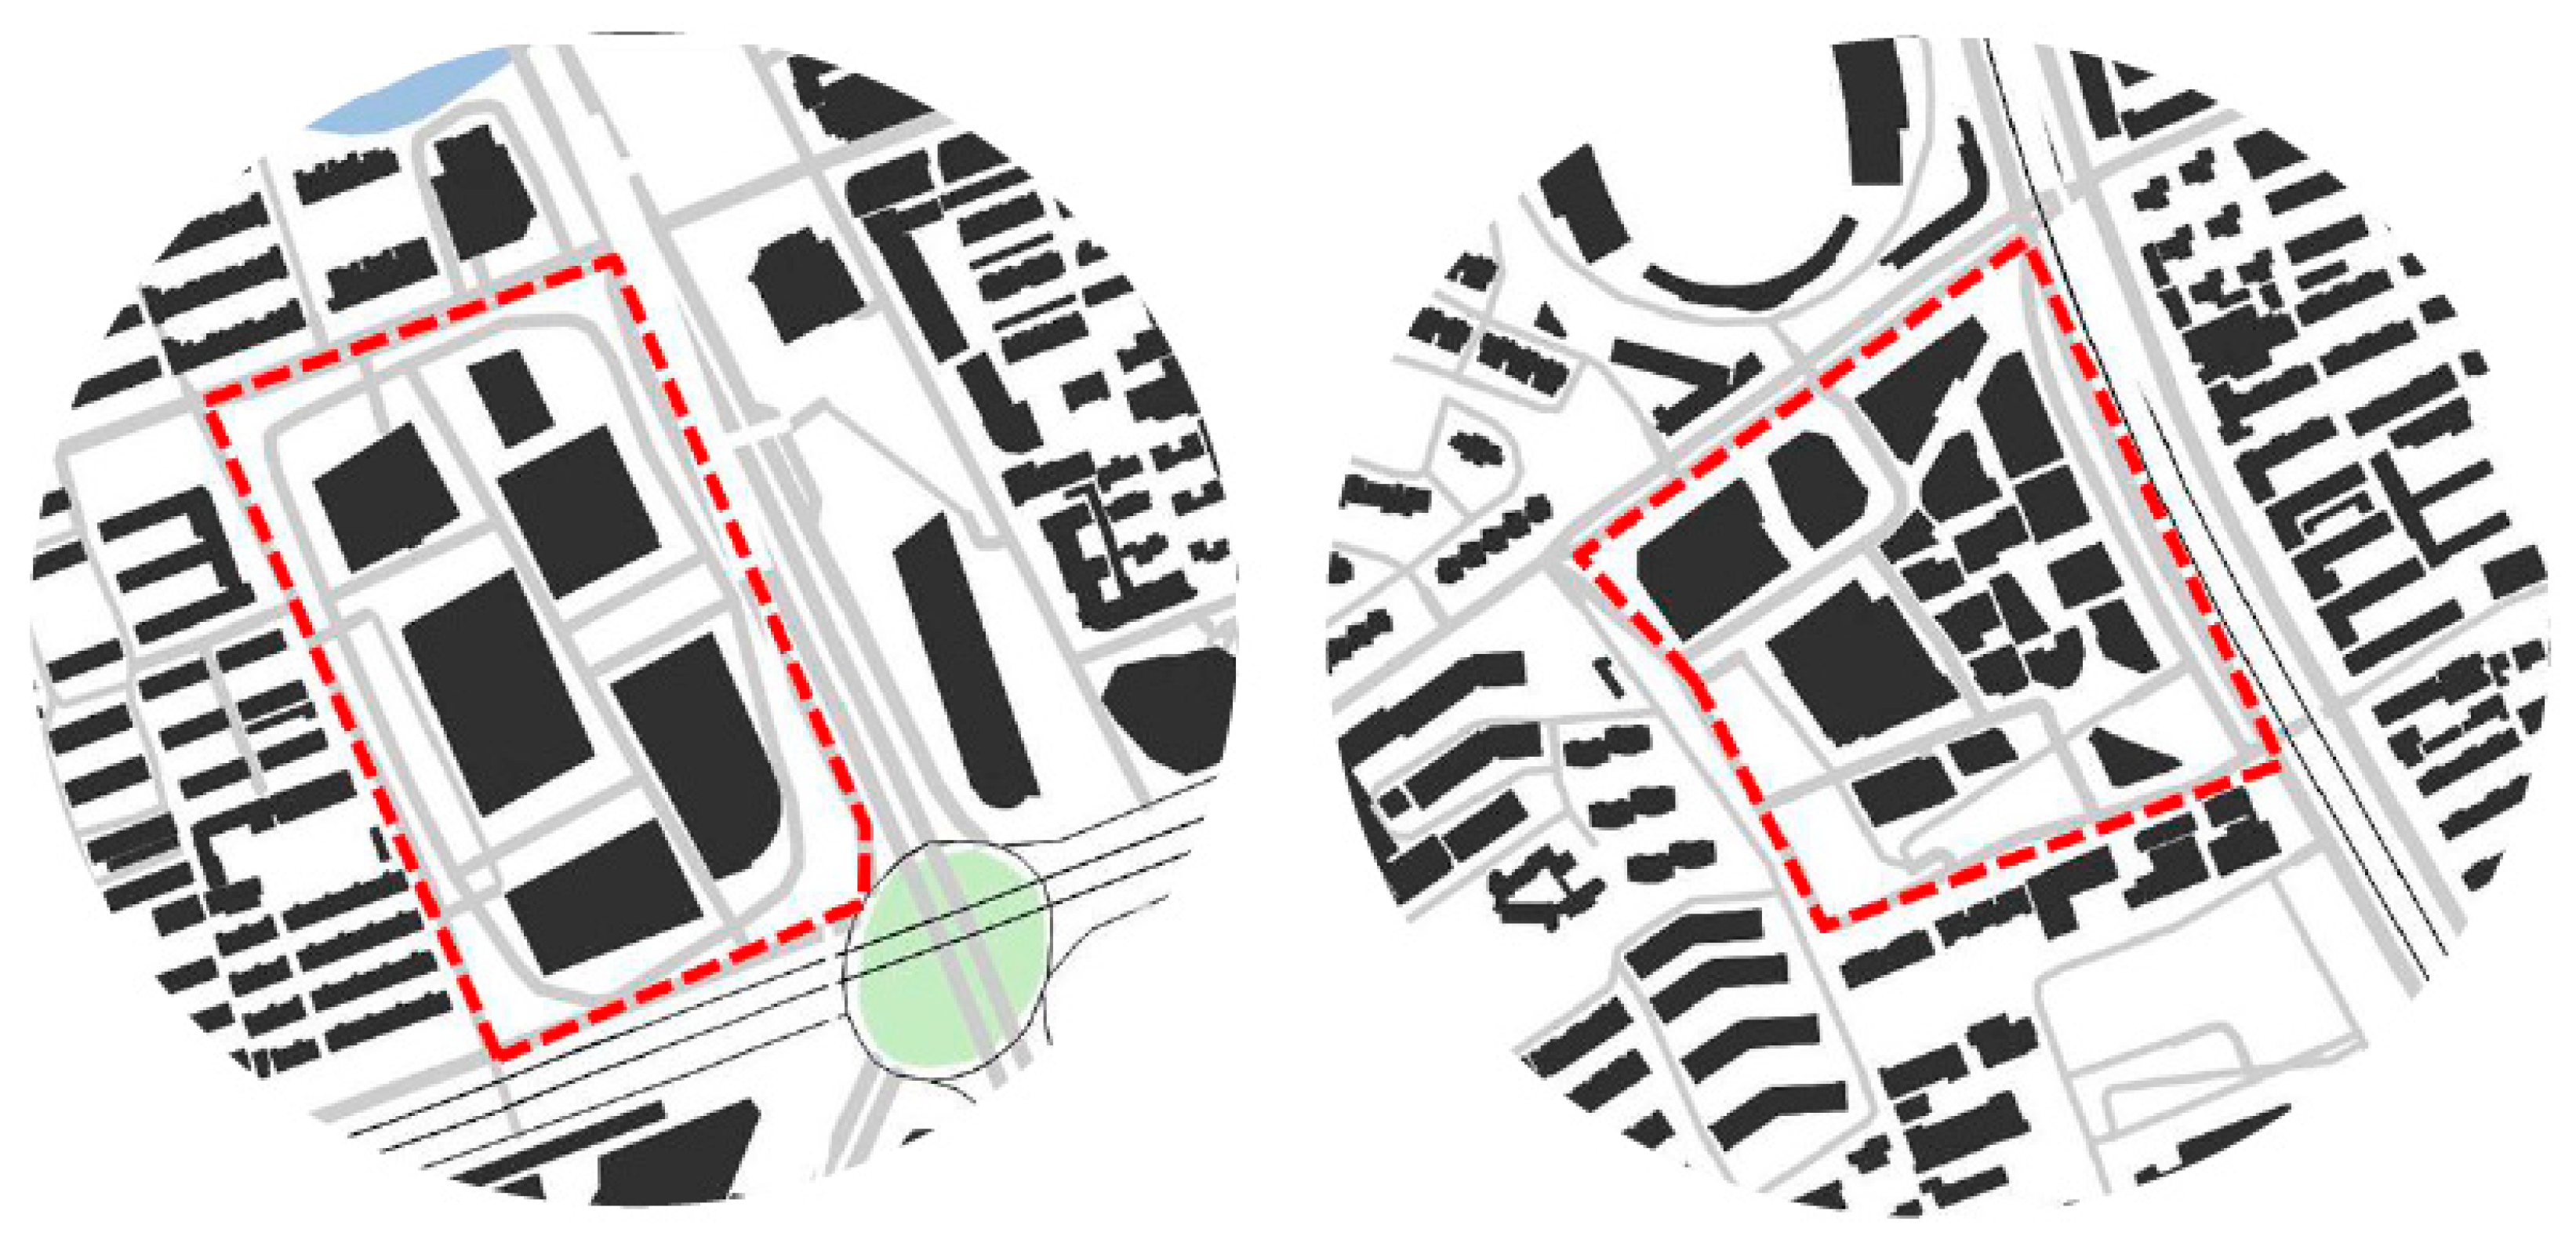
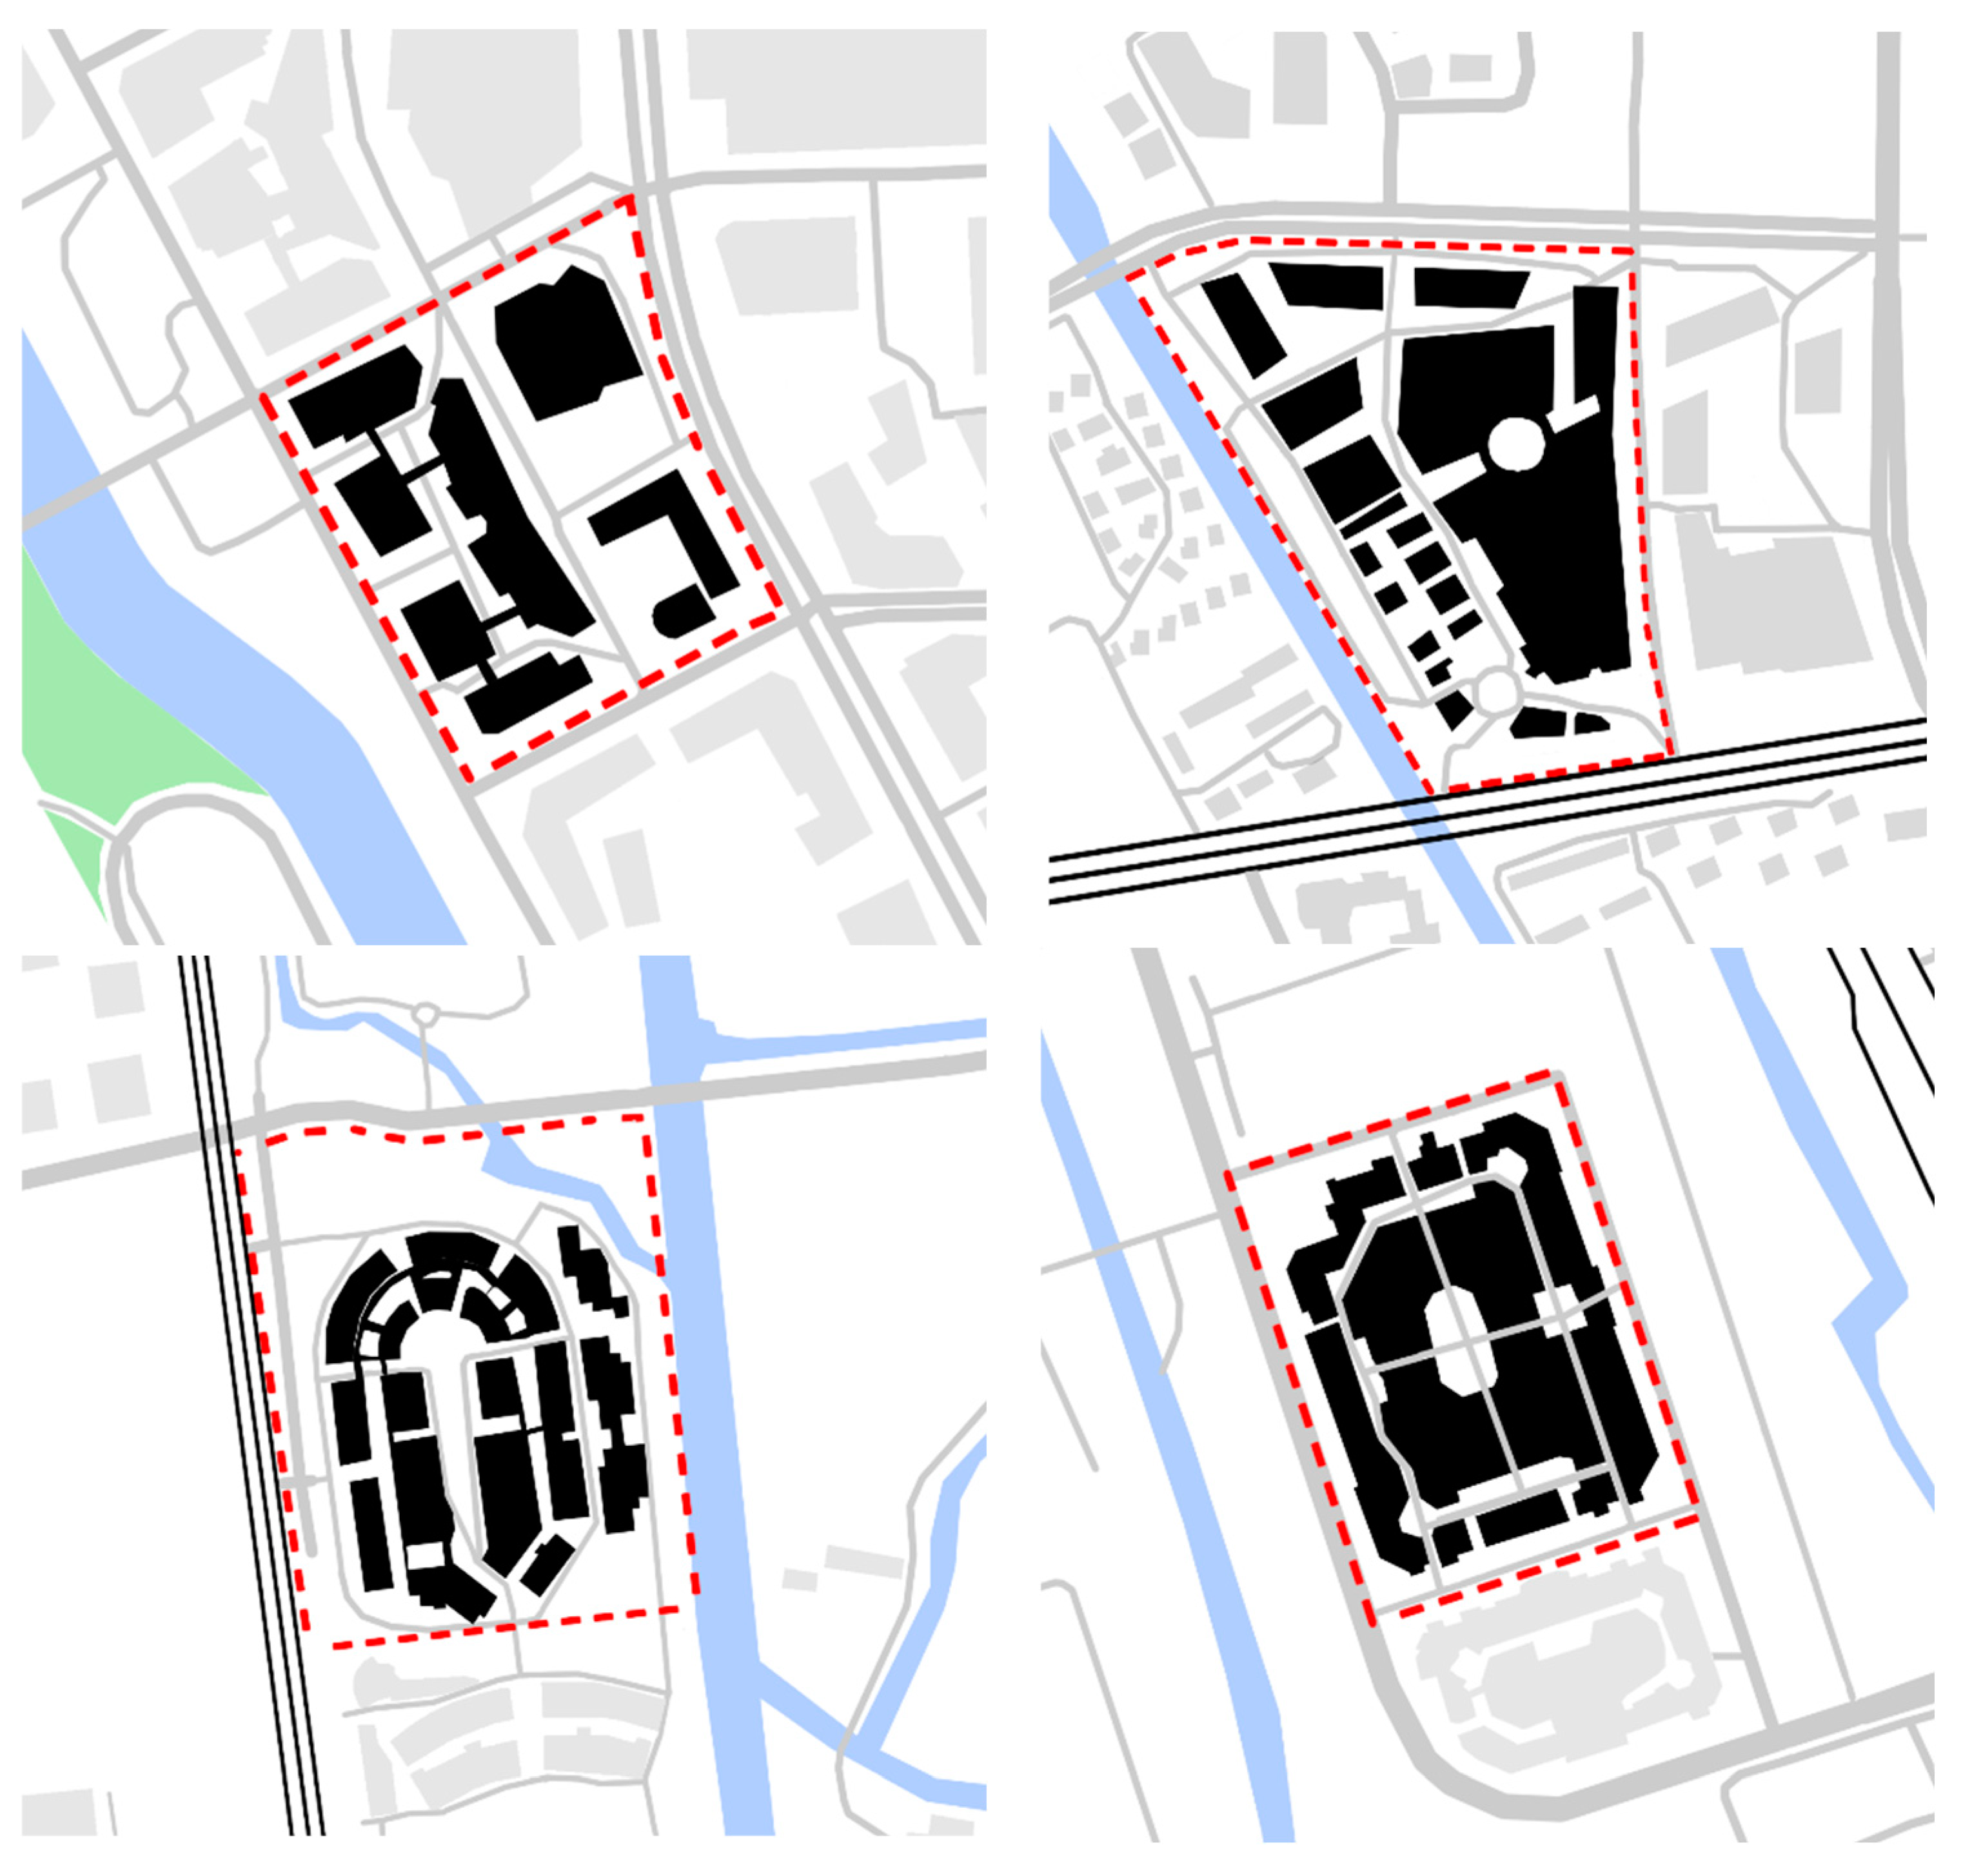
3.3. Research Site Selection and Examples (Data Collection of Two Commercial Complexes in Shanghai)

3.3.1. Climate Overview of Shanghai and Selection of Simulation Time

Shanghai, situated on the west coast of the Pacific Ocean, experiences high solar radiation, elevated air temperatures, and increased humidity during the summer months. These climatic conditions have a more pronounced impact on outdoor thermal comfort compared to winter, posing the primary challenge in the study of outdoor thermal comfort in Shanghai. Consequently, this paper concentrates on evaluating the thermal comfort of outdoor spaces during the summer season. August was selected as the simulation month, aligning with recent meteorological data from Shanghai.

3.3.2. Selection of Numerical Simulation Cases

The author initially selected two cases of block-style commercial complexes with similar development intensity but differing external space density to conduct a comparative study. This was done to explore potential factors influencing thermal comfort and to prepare for the establishment of an analysis model. The following outlines the basic characteristics of the two block-style commercial complexes (Table 3):
In Figure 3, the left side depicts Wujiaochang Wanda Plaza, while the right side shows Daning International Commercial Plaza. Both are block-style commercial complexes situated in the core urban area of Shanghai. (Figure 3) They share a similar land size, development intensity, and thermal environment. However, significant differences exist in street density and the number of street intersections between them. Additionally, the outer spaces of both complexes are predominantly hard-paved, with relatively similar underlying surfaces.

3.3.3. Setting of Initial Conditions for Numerical Simulation

Setting of Instance Modeling Conditions
Firstly, spaces were used to adjust the model parameters, which were obtained according to the on-site investigation of the building and its surrounding environment. The established model is shown in the figure below (Table 4):
Setting the Initial Climate Condition of the Instance
For ConfigWizard, you can obtain related parameters by referring to the meteorological data and the software’s built-in database. Related parameters are set as follows (Table 5):
In this study, using measured meteorological data as computer simulation data is deemed appropriate. Due to technological and equipment limitations, relevant parameters provided by the Shanghai Meteorological Bureau were selected as the initial conditions.

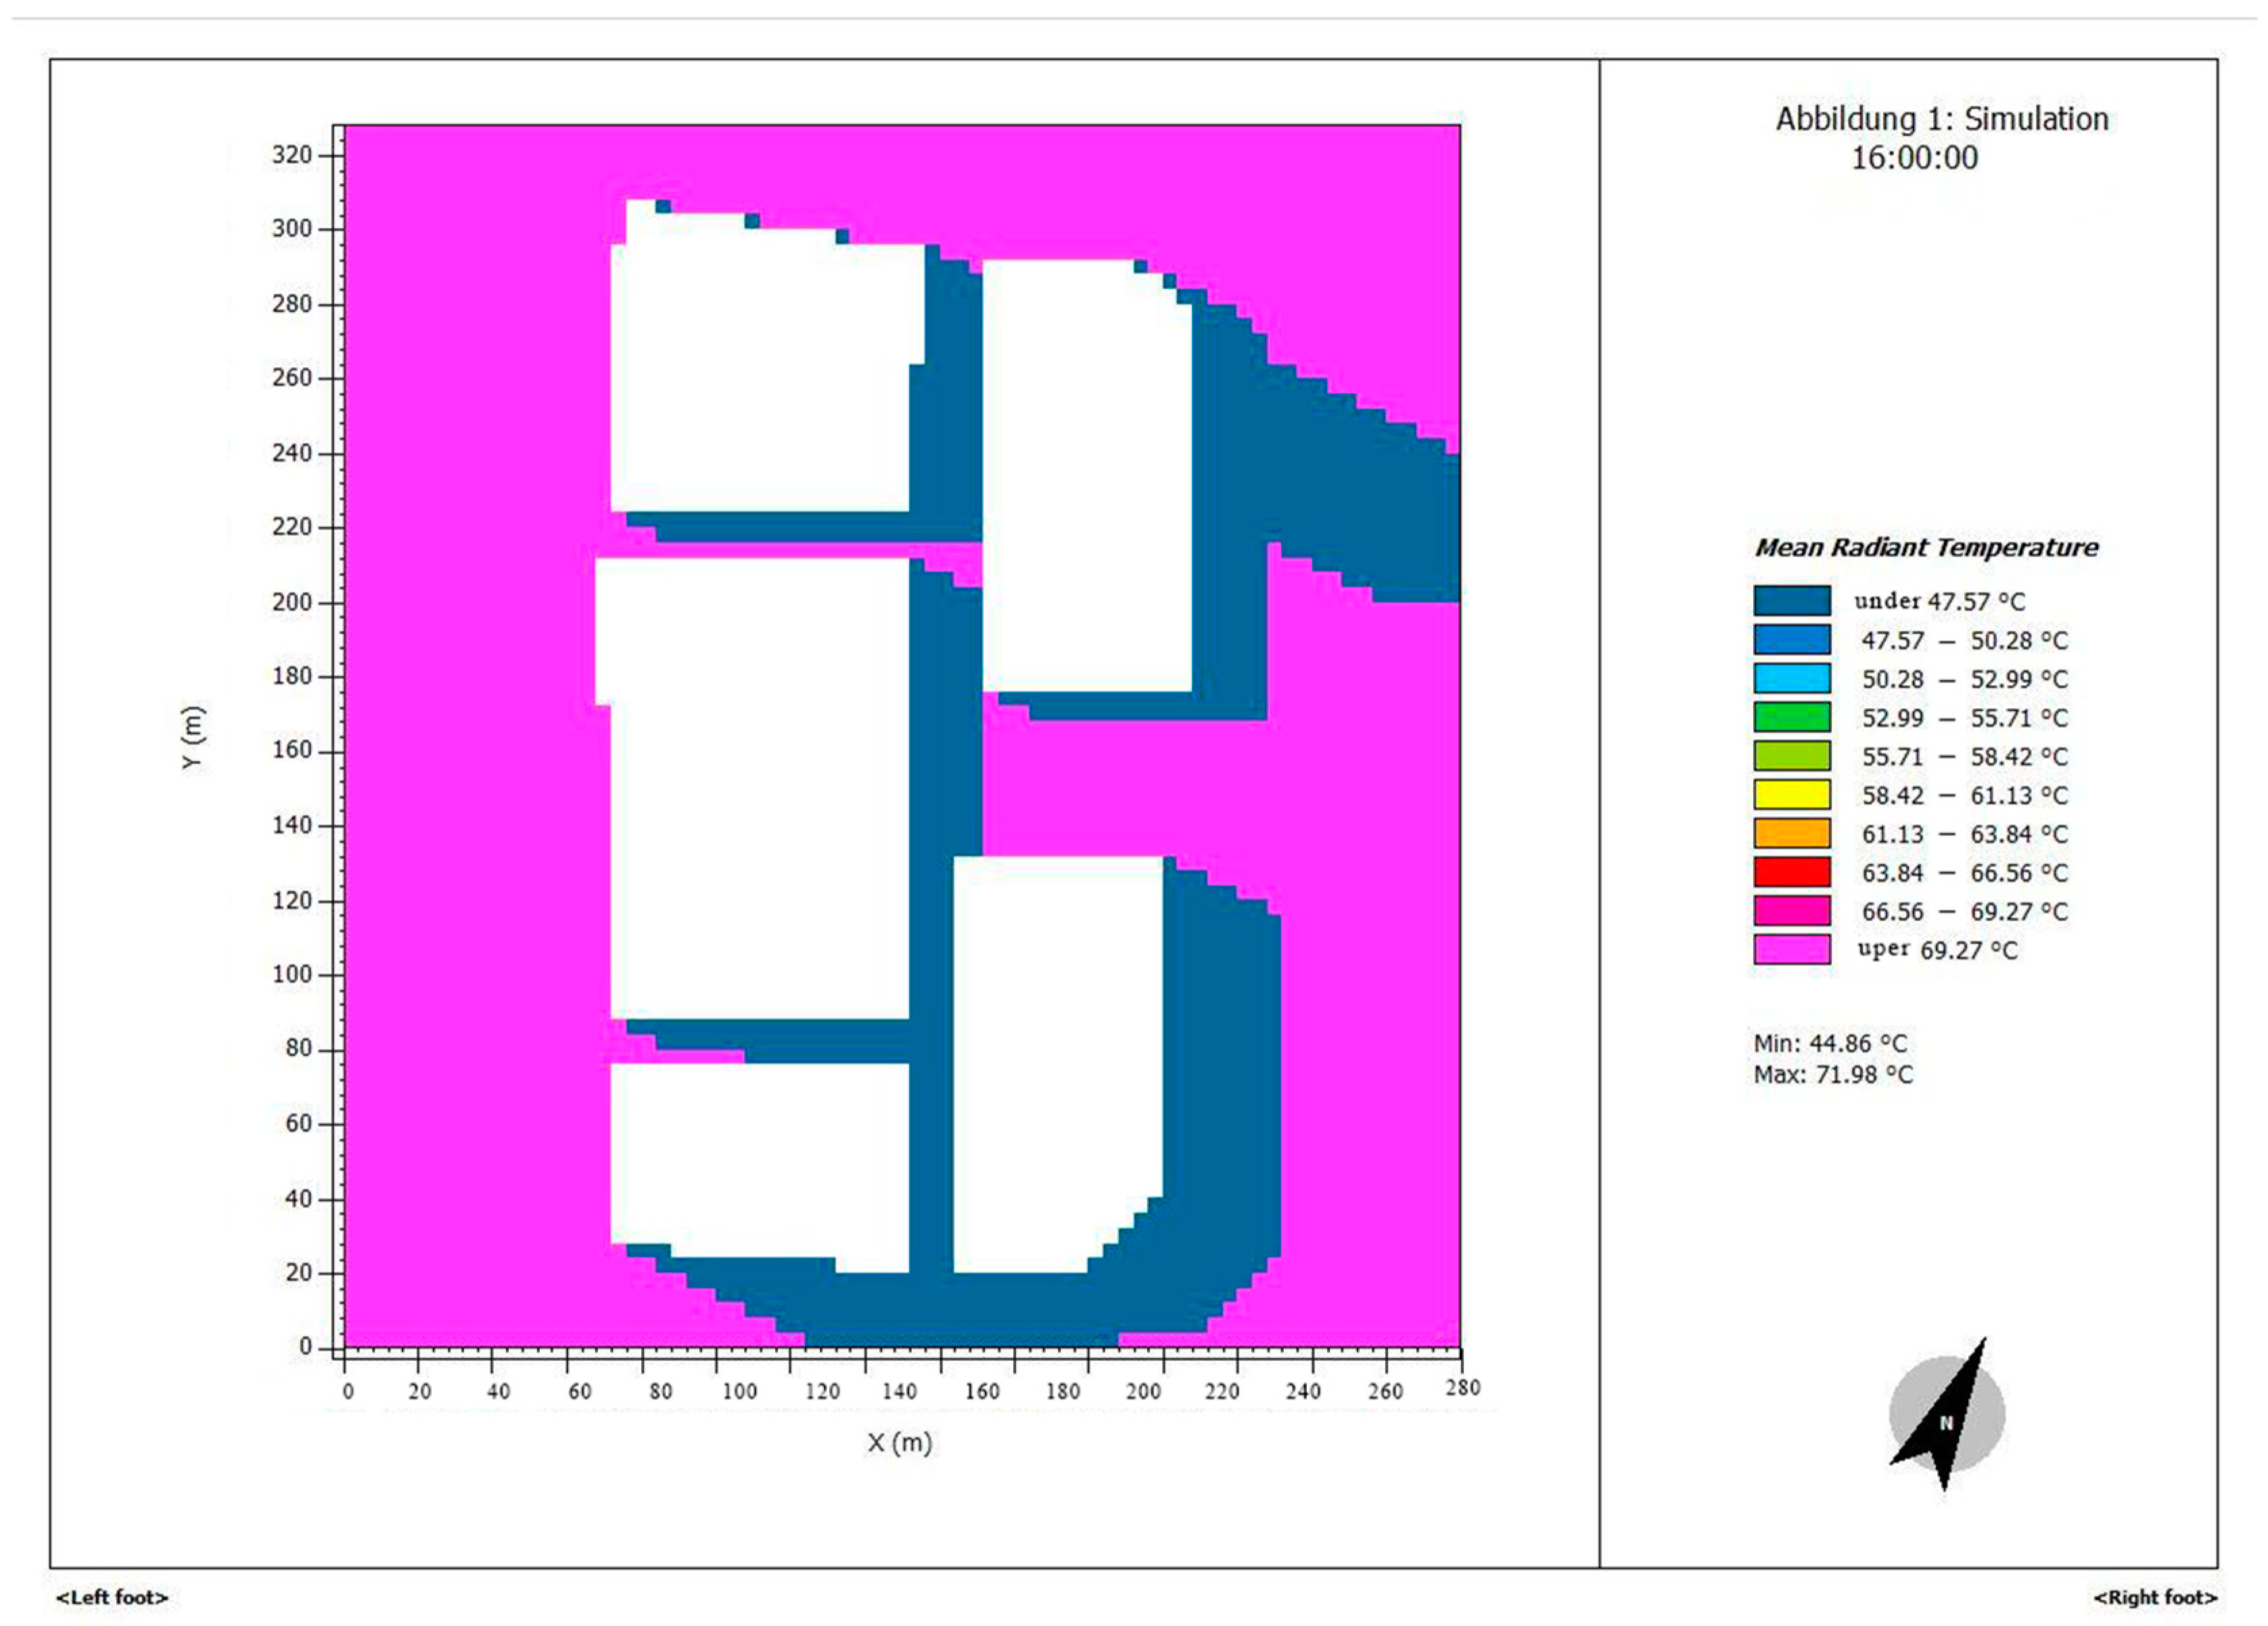
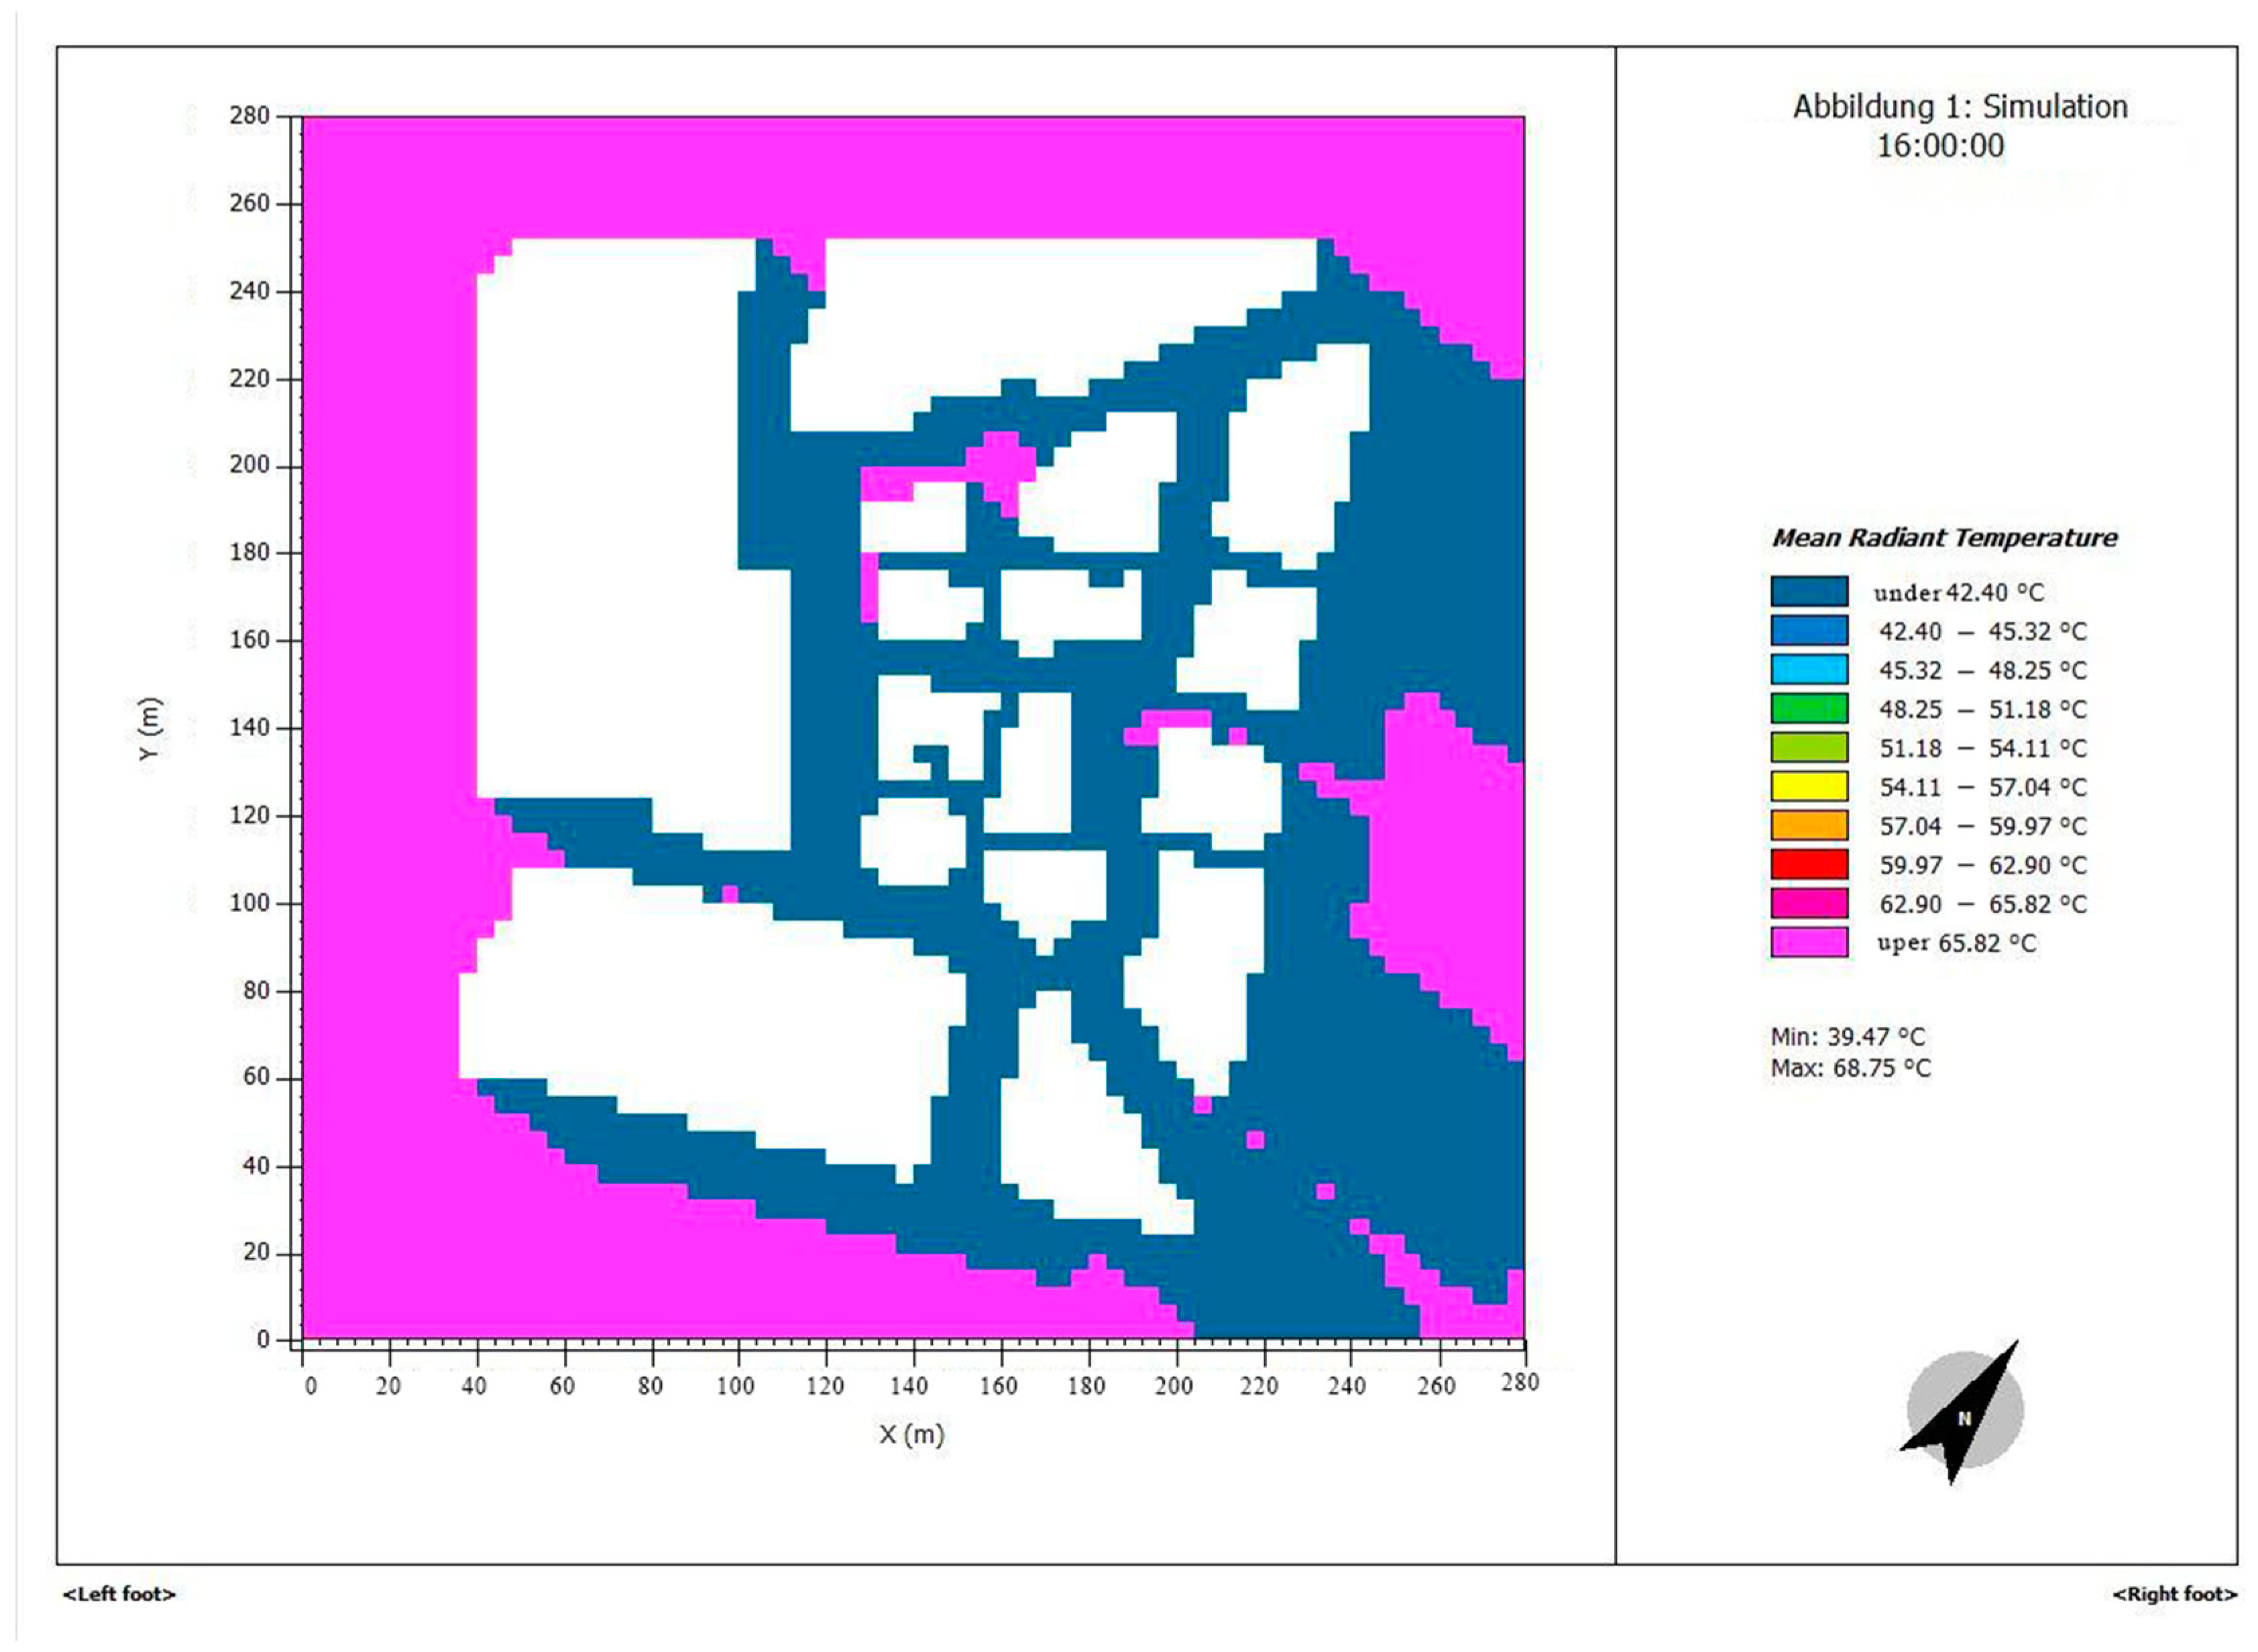
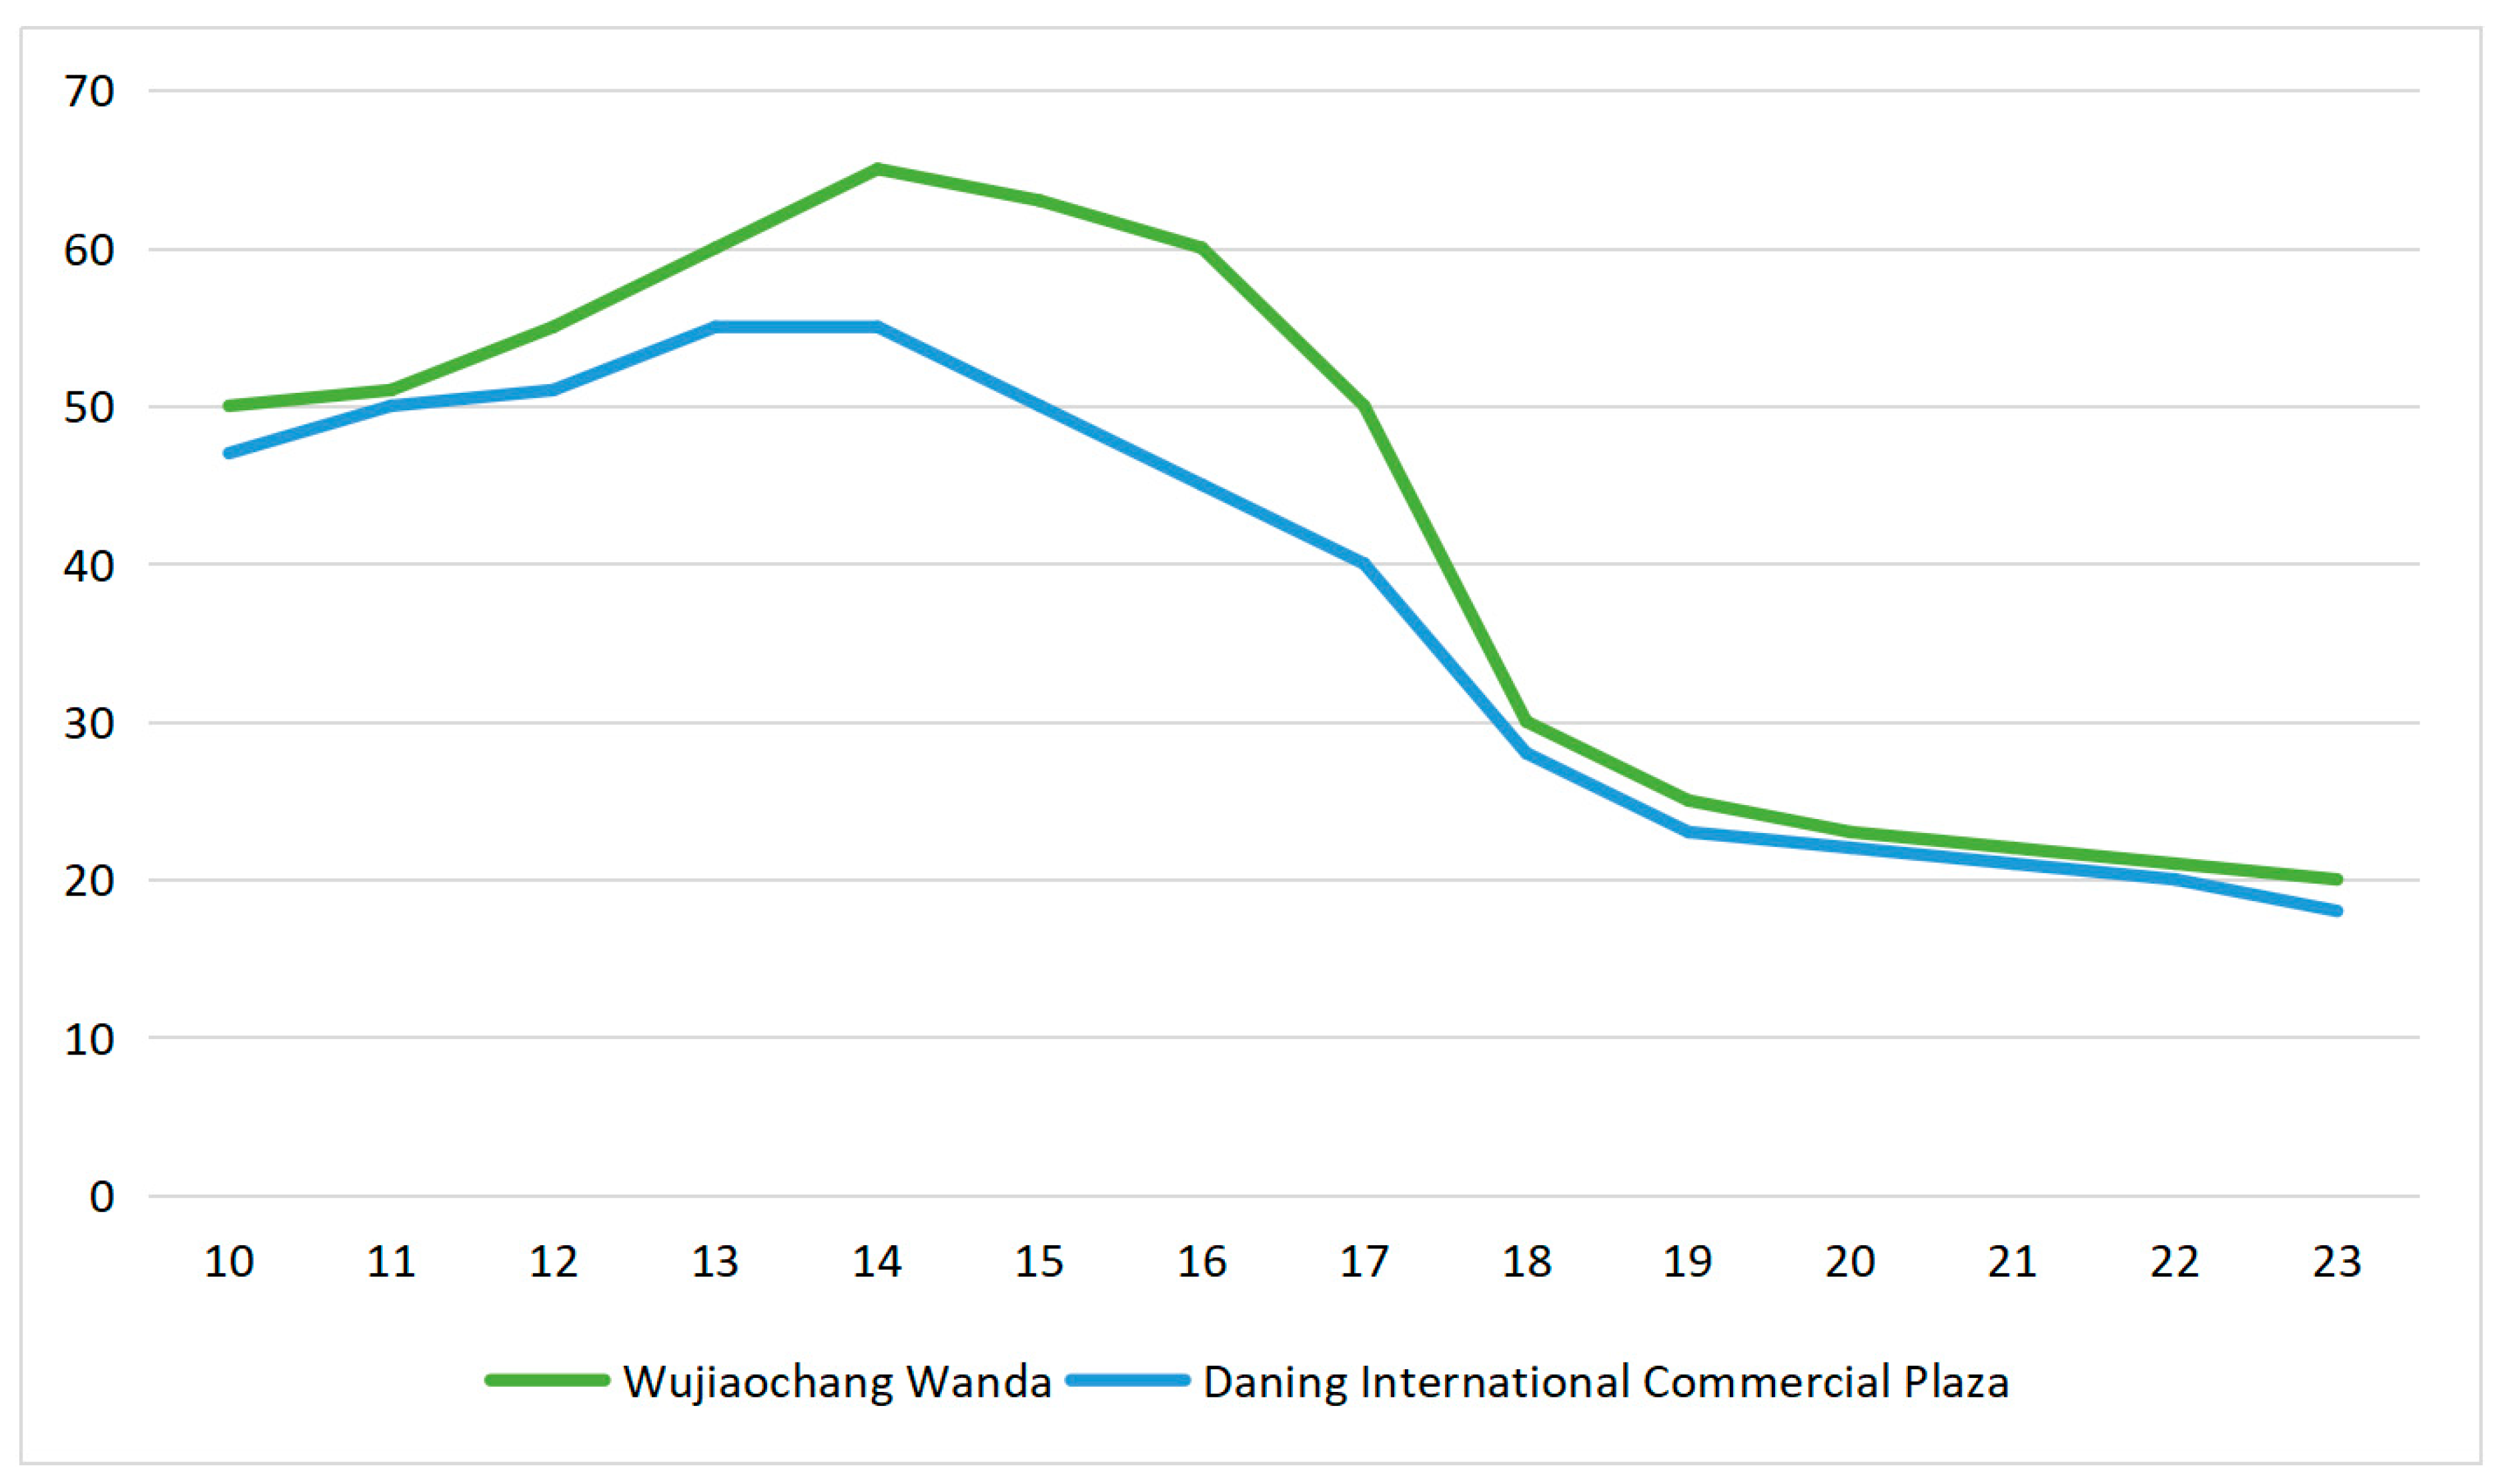
3.3.4. Numerical Simulation Analysis of Examples

In fact, there are many factors that influence the thermal comfort of the exterior space of block-style commercial complexes. This paper primarily focuses on the block form, with the simulation study limited to the examination of buildings.
Overall Comparative Analysis of Two Examples
The utilization of external space in block-style commercial complexes is subject to certain temporal constraints. During an investigation of block-style commercial complexes in Shanghai, the author observed that on working days, most shops or restaurants adjacent to the outdoor spaces of these complexes open at 10:00 and remain open until 22:00 Some stores typically open at 10:00 on non-working days, with the possibility of extending their hours until 22:30 or 23:00 Based on actual investigation and observation, combined with an urban heat map derived from mobile signaling data, the author found that pedestrian flow within block-style commercial complexes peaks during noon (12–13), afternoon (14–17), and evening (19–21).
Based on the meteorological data of a sunny and high-temperature day on 5 August 2015, in Shanghai, this study conducted a microclimate simulation for the block commercial complex. It selected 16:00 as the simulation period for air temperature, wind speed, humidity, mean radiation temperature (MRT), and PMV spatial layout in the outside space of the block commercial complex. Through a comparative study, relevant data were obtained. Finally, the MRT index was taken as the evaluation result. We used two completed commercial buildings in Shanghai as model prototypes (Figure 4).
By comparison, we can find that the mean radiant temperature (MRT) value of the external space of Daning International Commercial Plaza is lower than that of Wujiaochang Wanda Plaza, with the maximum difference occurring between 14:00 and 15:00 (Figure 7).
From the above practical cases, it can be seen that commercial blocks with varying street densities, intersection numbers, and street directions have different impacts on the thermal comfort of the external space. Therefore, it is necessary to analyze the effects of different factors on thermal comfort through spatial prototype simulation.

3.3.5. Questionnaire Survey on Physical Comfort of Examples

To verify the authenticity of the simulation examples mentioned above, the author conducted a random questionnaire survey on 30 groups of customers at two project sites. The survey was conducted from 14:00 to 17:00 on 20 August at Daning International Business Plaza and on 23 August at Wujiaochang Wanda Plaza during the same time frame.
The questionnaire consisted of a hierarchical survey on three general perceived comfort indexes of customers outside the commercial street, namely, temperature, humidity, wind speed, and comprehensive physical comfort. The results are as follows:
After calculating the weighted average, the comfort index of Daning Commercial Plaza is 3.33, while that of Wujiaochang Wanda Plaza is 3.02 (Table 6). According to the questionnaire survey, the physical comfort of outdoor blocks in Daning International Commercial Plaza is better than that of Wujiaochang Wanda Plaza to some extent, verifying the effectiveness of the computational model.

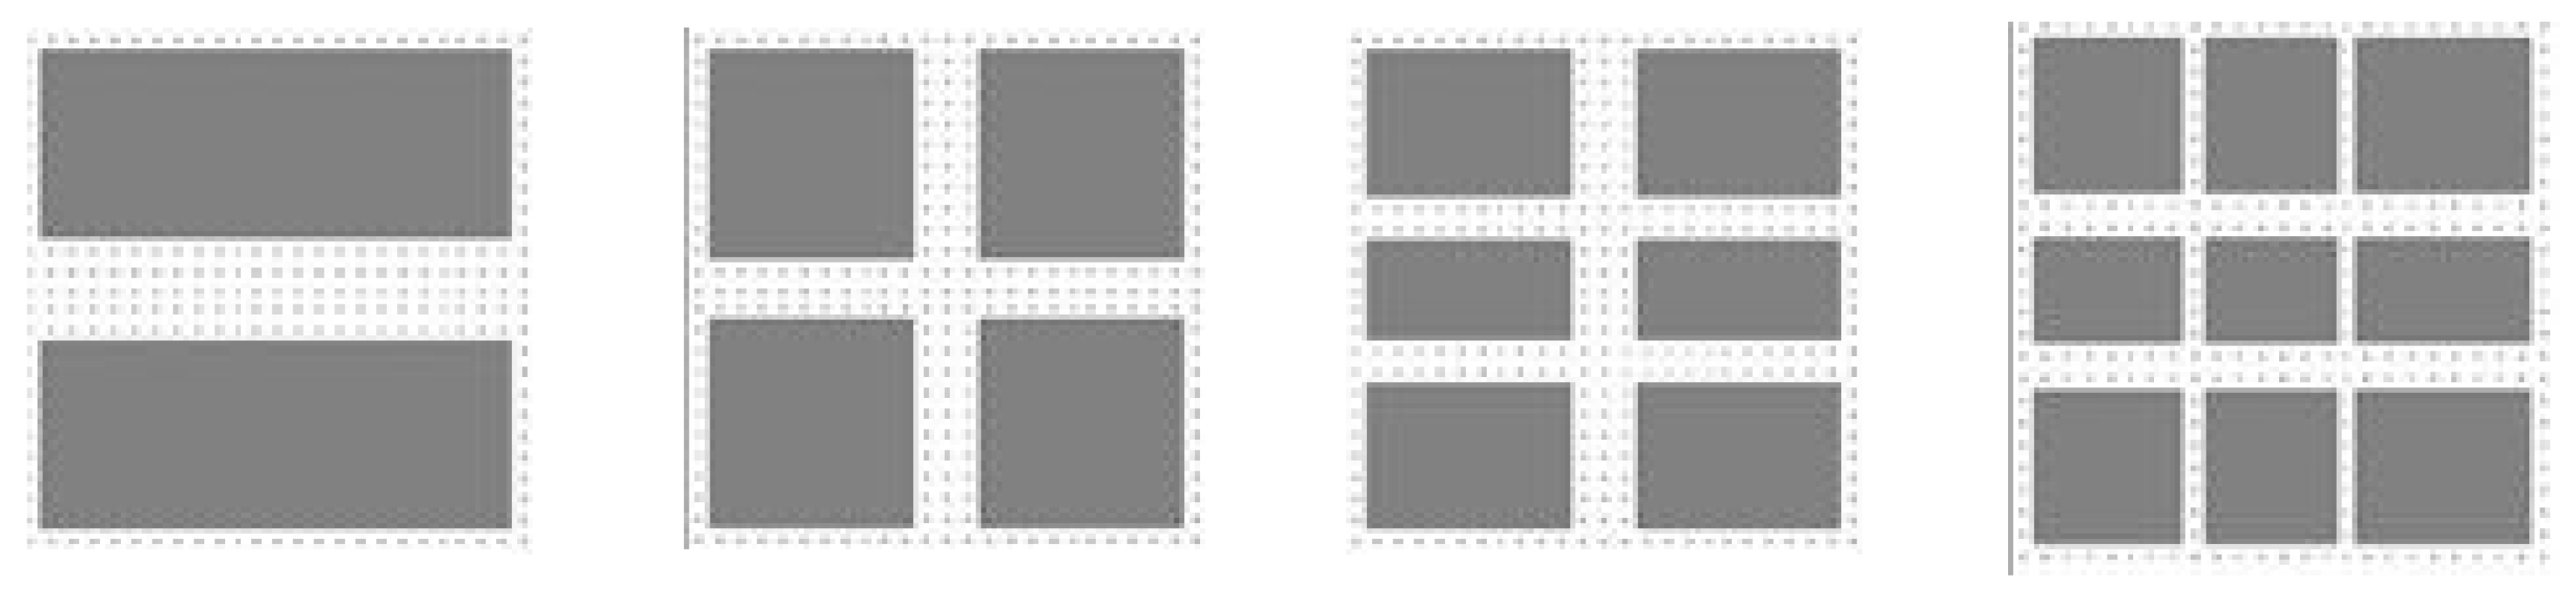
3.4. Space Prototype Design

3.4.1. Design Consideration

The outer space of a block-style commercial complex is similar to the street space, but it differs in scale and spatial attributes. This research establishes a relatively perfect and representative spatial prototype and mainly uses the following indicators as the basis for the design of spatial prototypes:
(1)
Block-Scale Size
At present, as an important type of commercial building in urban areas, block-style commercial complexes are mostly located in the central areas of cities due to their higher development intensity and human flow attraction. They are often combined with urban public transportation hub nodes or laid out along urban trunk roads and secondary trunk roads. Therefore, their land size should typically range between 100 and 300 m. According to the author’s actual investigation of block-style commercial complexes in Shanghai, the size of most commercial complex building plots is concentrated between 180 and 280 m (Figure 8).
In this study, the author combined traffic planning and design norms with the historical conditions of Shanghai and selected a 250 × 250 m plot as the size of the space prototype.
(2)
Street Density (Line Density)
In the study of block-style commercial complexes, their external spaces are taken as the research object. Therefore, this concept is used to represent the “street” (linear external space) density of the external spaces of block-style commercial complexes.
Street density refers to the length of streets per unit area, measured in km/km2.
According to the actual investigation, the author found significant differences in street density among block-style commercial complexes. The block-style commercial complex represented by Shanghai Wujiaochang Wanda Shopping Center features a large external space scale, with fewer interruptions caused by buildings throughout the plot. Conversely, the block-style commercial complex represented by Shanghai Daning International Plaza has a smaller external space scale, with more interruptions caused by buildings throughout the plot. The street density of the outer space of the two block-style commercial complexes is 10 km/km2 and 20 km/km2, respectively, indicating a considerable difference. However, the development intensity of the two complexes is similar.
During the actual visit, the author observed that these two spatial layout patterns are related to commercial formats. Wujiaochang Wanda Plaza primarily features department stores, entertainment venues, cinemas, and other major stores, requiring a sizable construction area. Conversely, Daning International Plaza is predominantly composed of small shops, such as retail and dining establishments. A higher street density is advantageous for creating a longer street interface and accommodating more shops. It also fosters stronger movement along the external commercial dynamic line space, which contributes to the emergence of additional commercial interfaces and value (Figure 9).
This study primarily examines the thermal comfort of the commercial exterior space layout density in these two typical blocks. It combines a block size setting of 250 × 250 m and modifies the exterior space by cutting it 1–4 times. Four street densities of 4 km/km2, 8 km/km2, 12 km/km2, and 16 km/km2 were chosen as variables (corresponding to street spaces with lengths of 250 m, 500 m, 750 m, and 1000 m, respectively) to represent the street density of the spatial prototype.
(3)
Street Area Ratio (Area Density)
The street area ratio refers to the proportion of street or road area within a given unit area. Within the context of block-style commercial complexes’ external spaces, the author regards it as the coverage of these areas. This value is intricately linked to both street density and the development intensity of the plot. Since it involves unified development within a plot, building density directly impacts the size of external spaces in block-style commercial complexes. For this study, the author selected a 25% street coverage rate as the street area ratio for the spatial prototype model.
(4)
Building Height
Building height has an impact on urban microclimate, primarily influencing the wind environment and the shielding of thermal radiation. Considering the principle of commercial value, high-rise commercial blocks with a height exceeding 24 m are rarely encountered. Therefore, this study will adopt 24 m as the building height for the space prototype design.
(5)
Number of Street Crossings
In view of the sample analysis of several typical commercial districts in Shanghai, there are mostly 3–8 street intersections (Figure 10). Therefore, in this study, the author will select 3–8 street intersections with the same street density to design spatial prototype models with a different number of intersections.
(6)
Street Direction
Dr. Wang Zhen from Huazhong University of Science and Technology discusses the thermal comfort and orientation of two spatial prototypes (long street short street and long lane short street). In this study, based on the investigation of street density and the number of intersections, the author will examine their orientations and compare the overall thermal comfort of three street layout directions: 0°, 45°, and 90°.

3.4.2. Model Construction

Combining the design basis of the original model mentioned above, the author presents the following spatial prototype model (Figure 11).

4. Analysis and Results

The discussion regarding the business hours of the block-style commercial complex in Shanghai has been mentioned earlier. Therefore, in this section, the selected prototype model was simulated using meteorological data from a sunny and hot day in Shanghai on 5 August 2022. The simulation period for air temperature, wind speed, humidity, mean radiant temperature (MRT), and Predicted Mean Vote (PMV) in the outer space of the prototype model was set at 16:00. Through comparative studies, relevant data were obtained.
To facilitate data statistics and readers’ comprehension, these prototype models are labeled with numbers. The first digit represents the simulation from different perspectives. For instance, the study on the correlation between street density and thermal comfort is labeled as 1, the study on the number of street intersections and thermal comfort is labeled as 2, and the study on the correlation between street direction and thermal comfort is labeled as 3. The second digit is 0 for division purposes. The third number represents different prototype models, starting at 1 and gradually increasing with the rise in street density and the number of street entrances. In the study of street direction, three or four digits represent the angle between the original model and the east–west direction (clockwise is positive, counterclockwise is negative, and the model with a street density of 4 km/km2 is defined as the original model 3000).

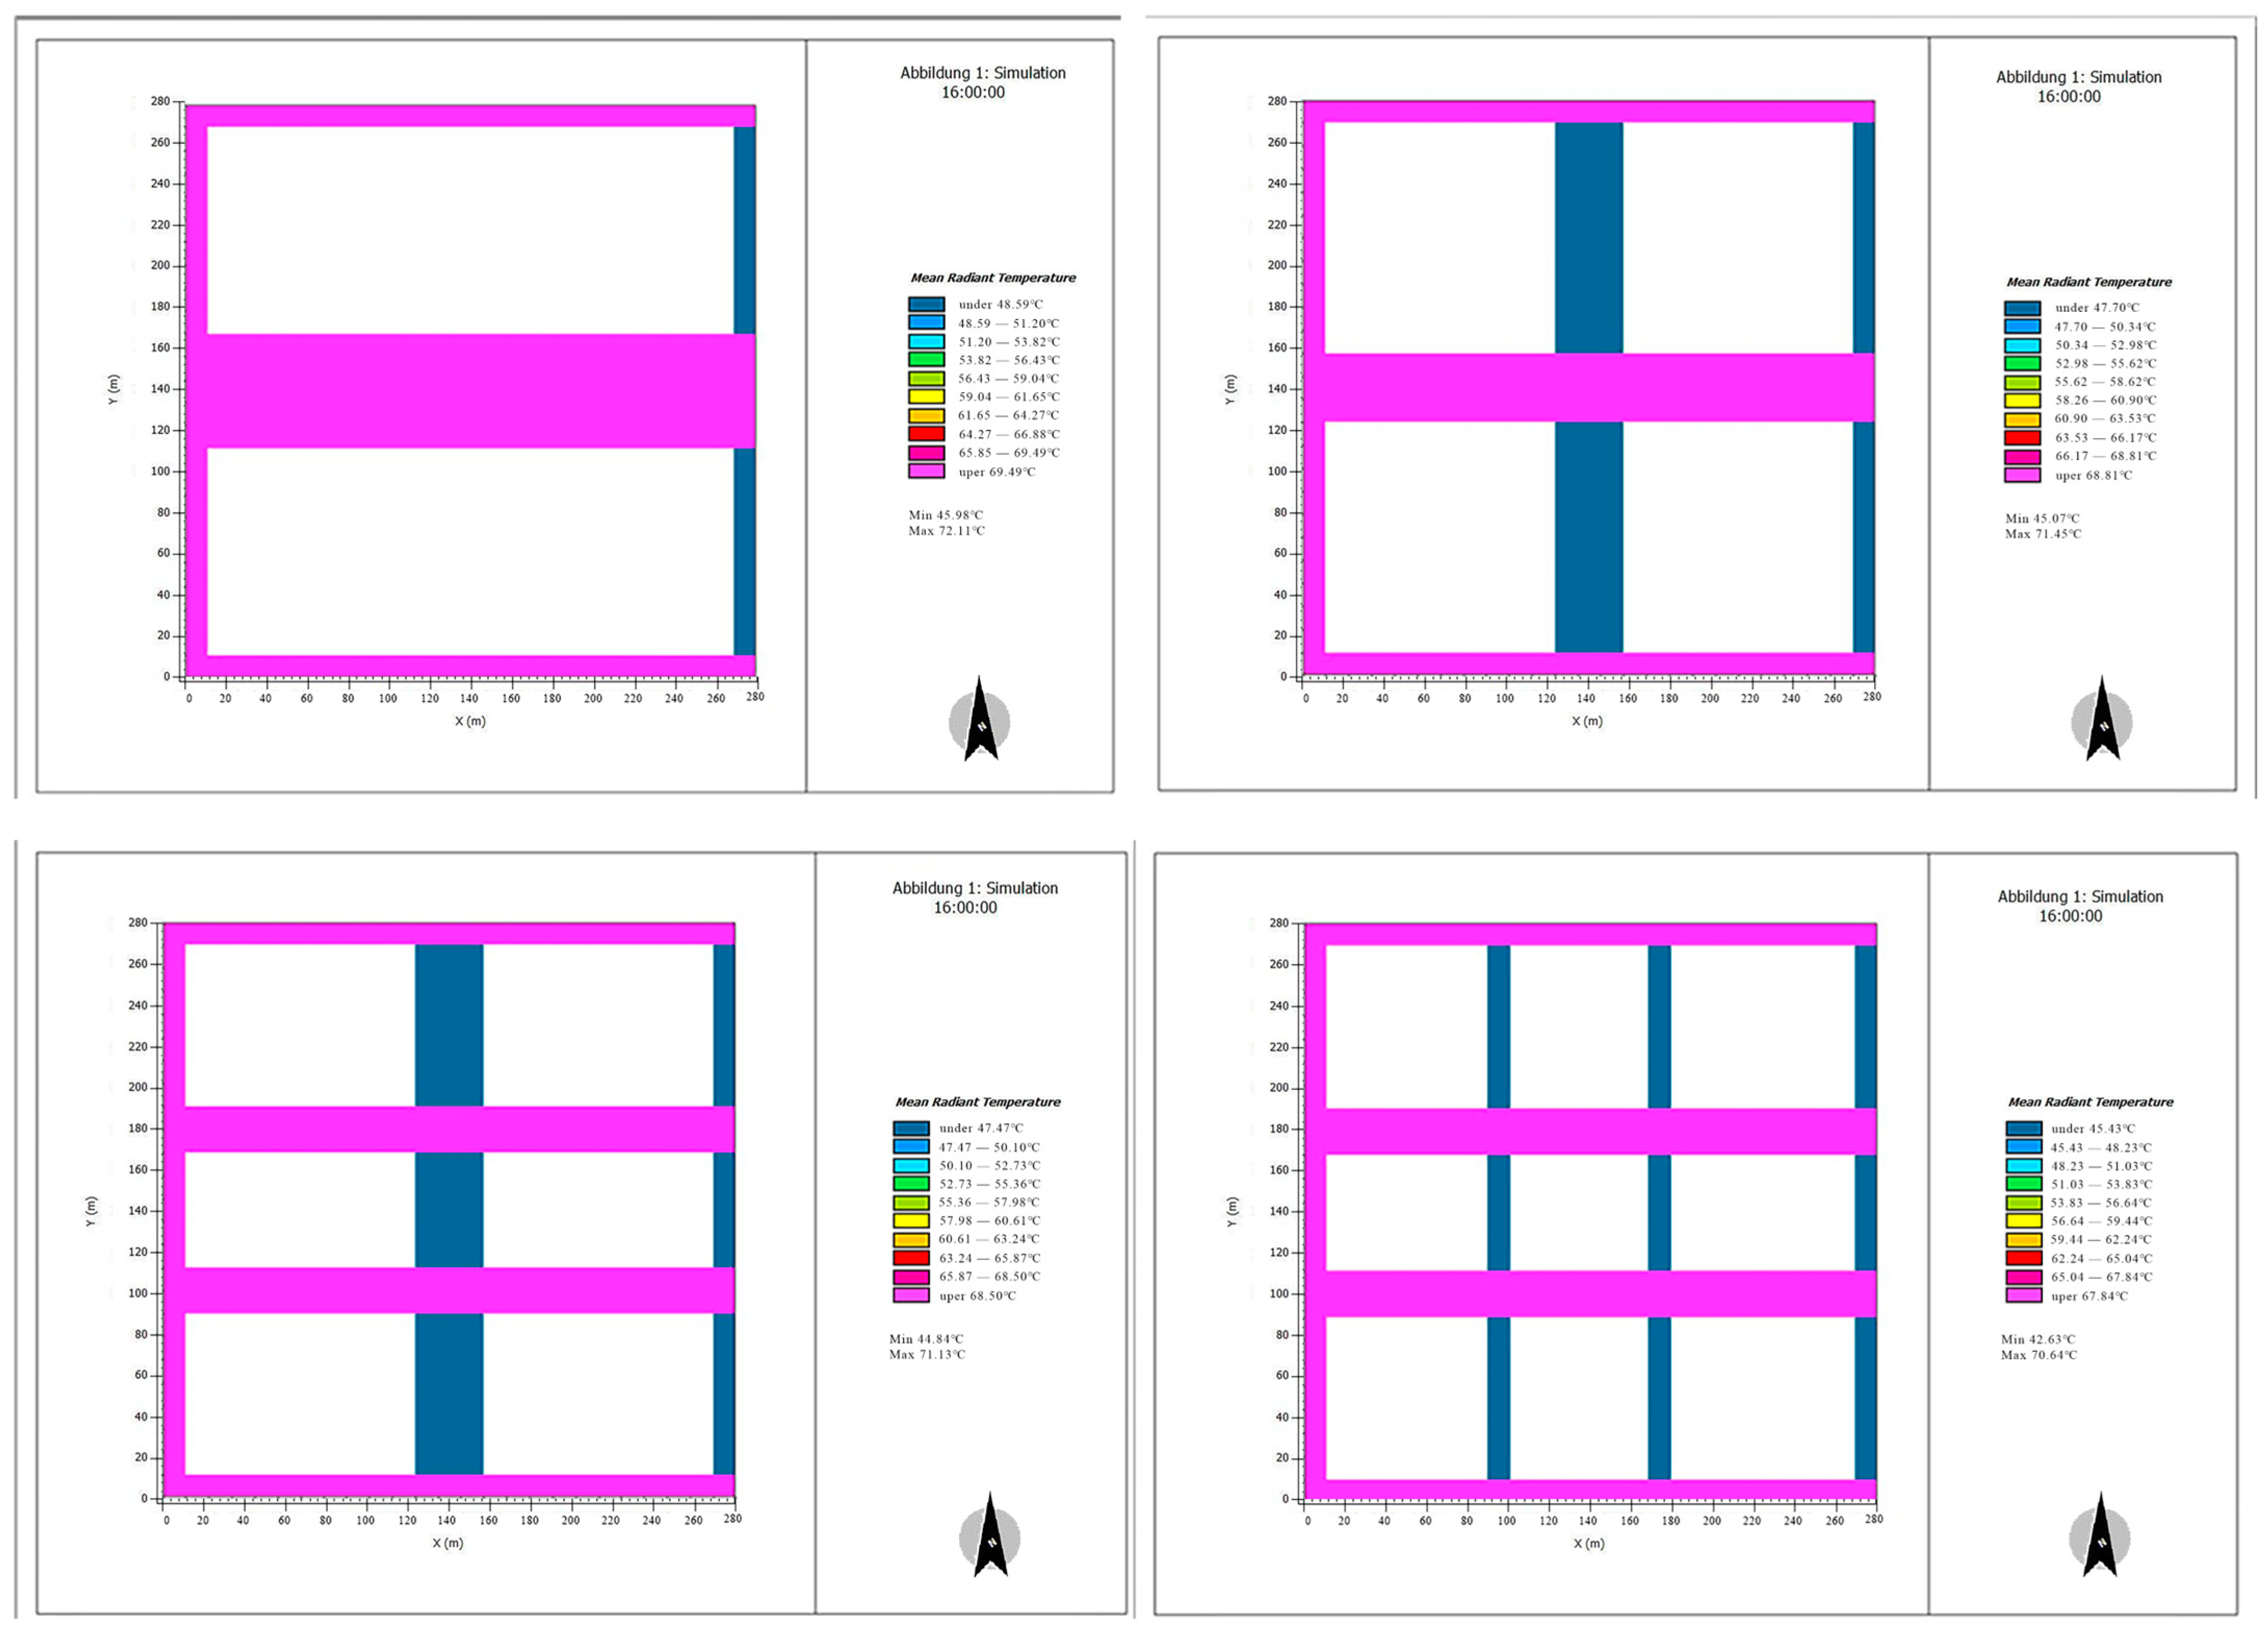
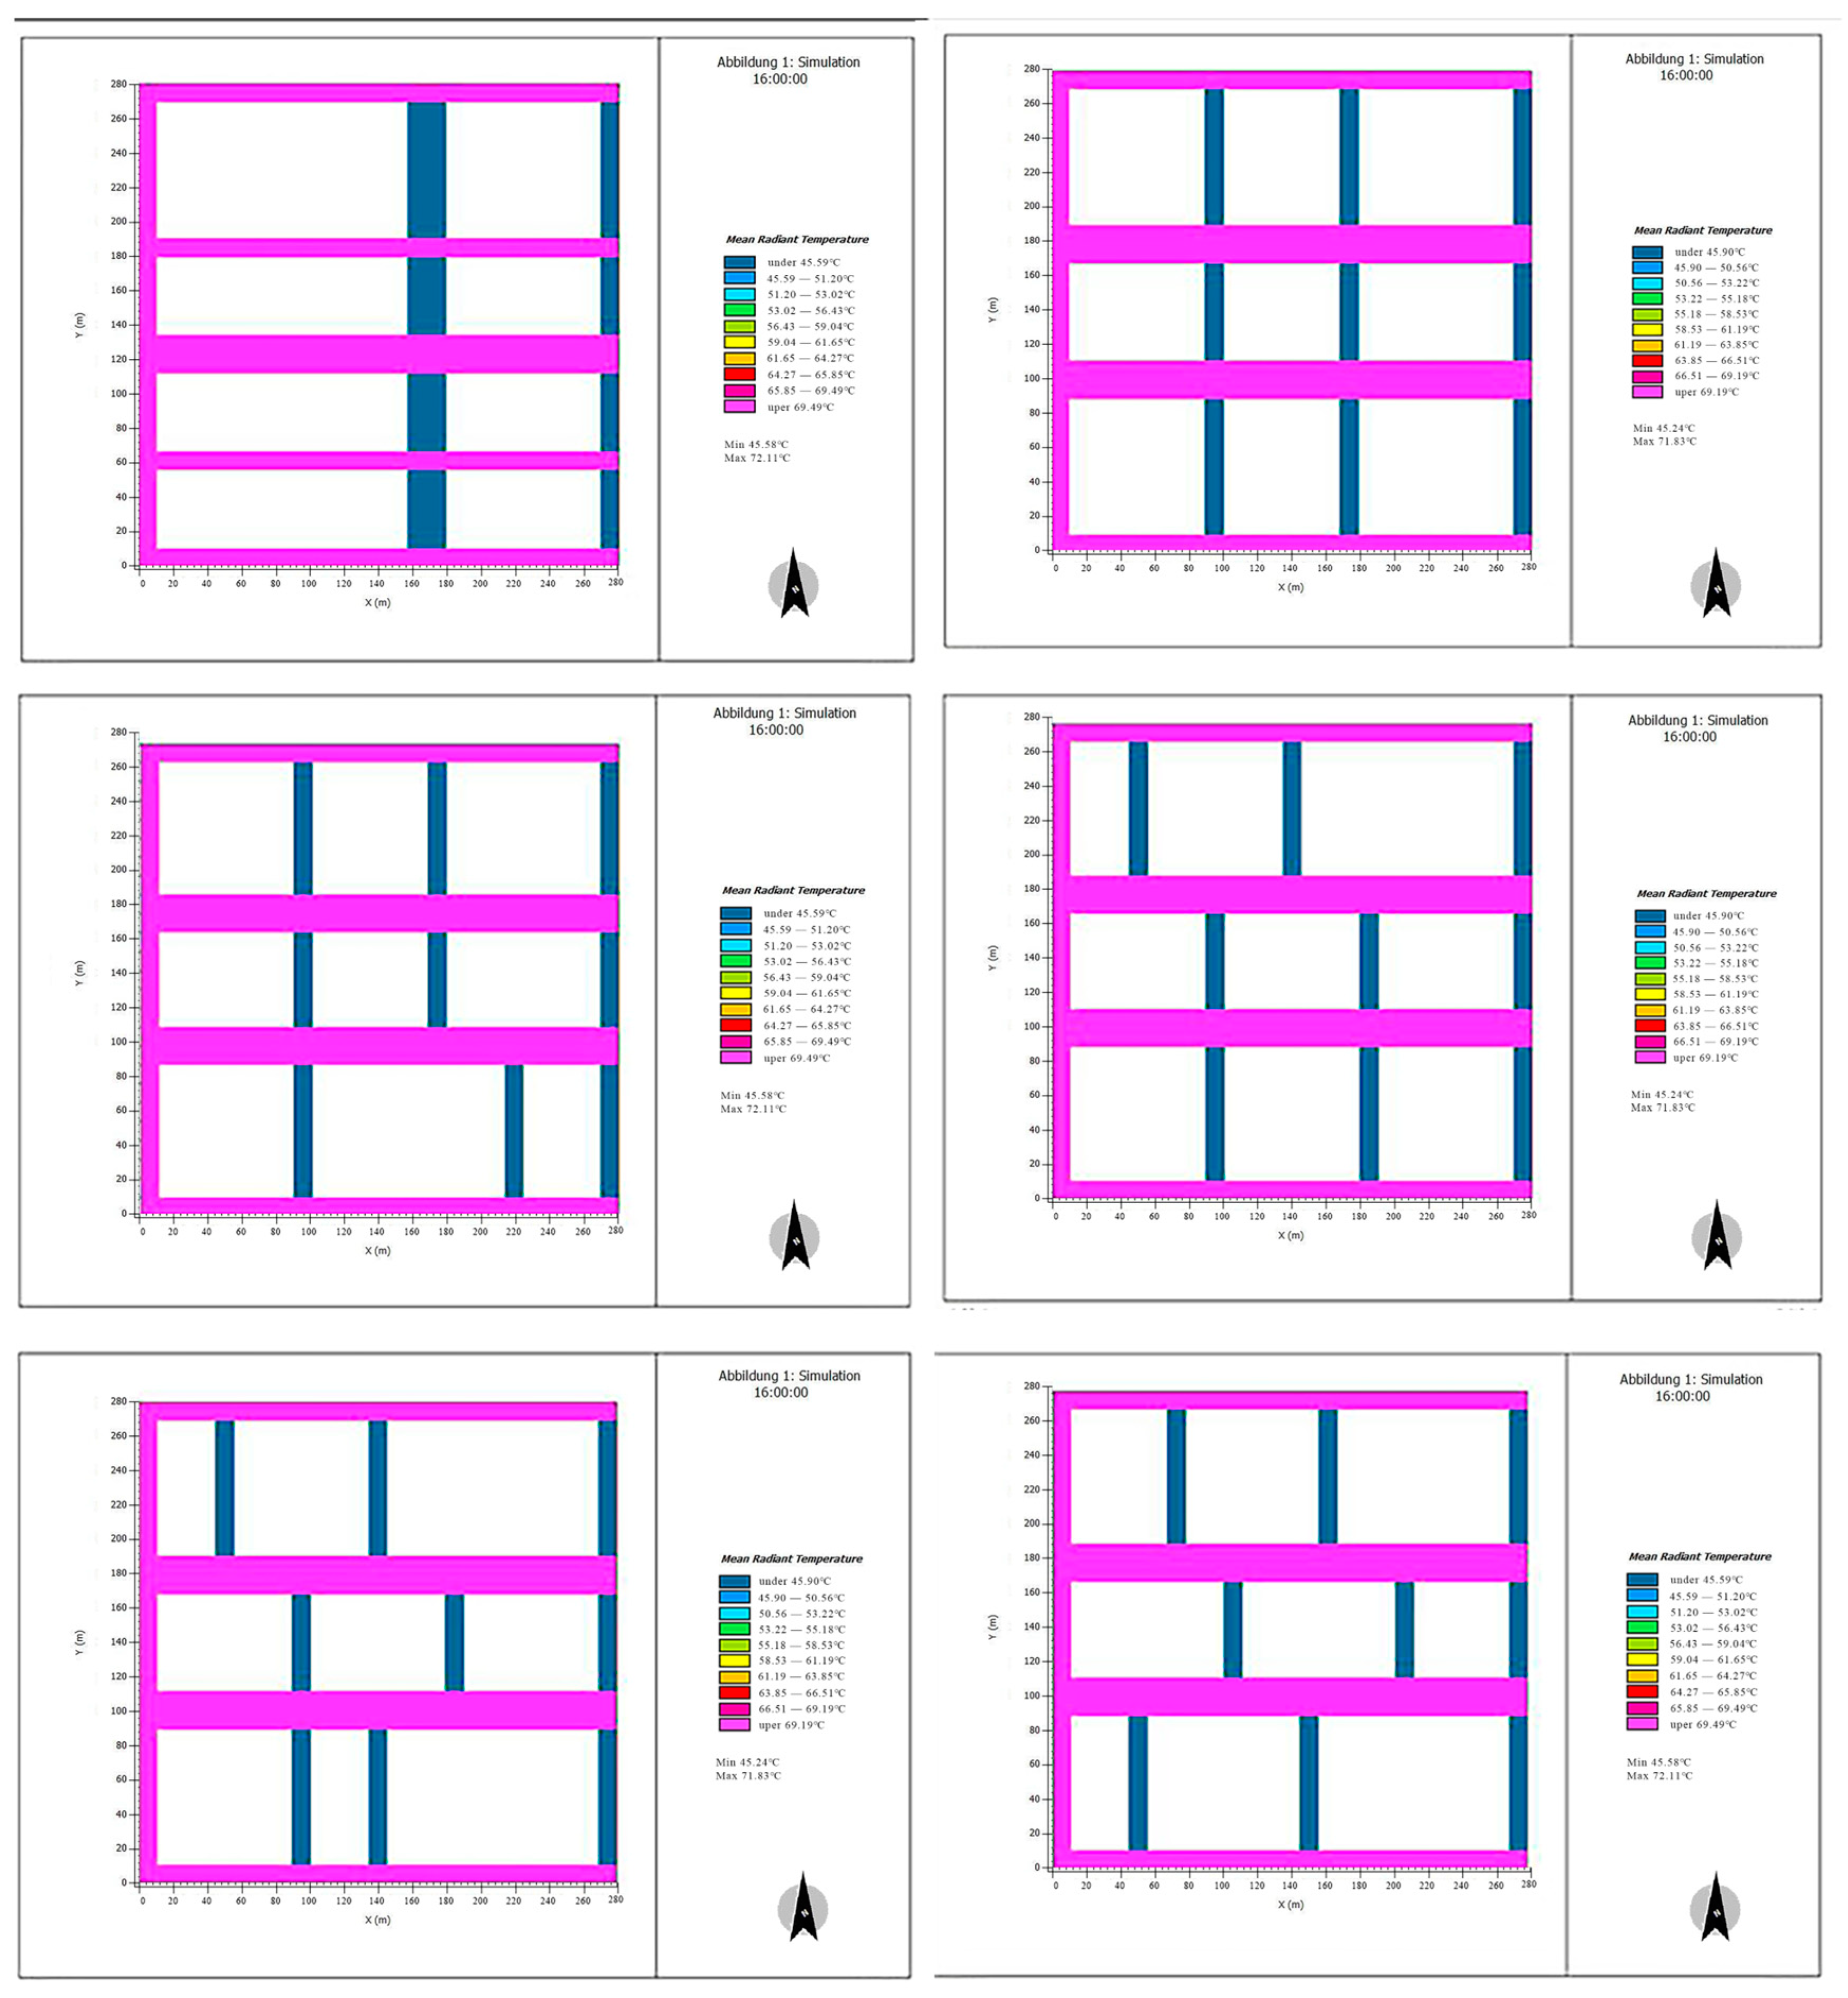
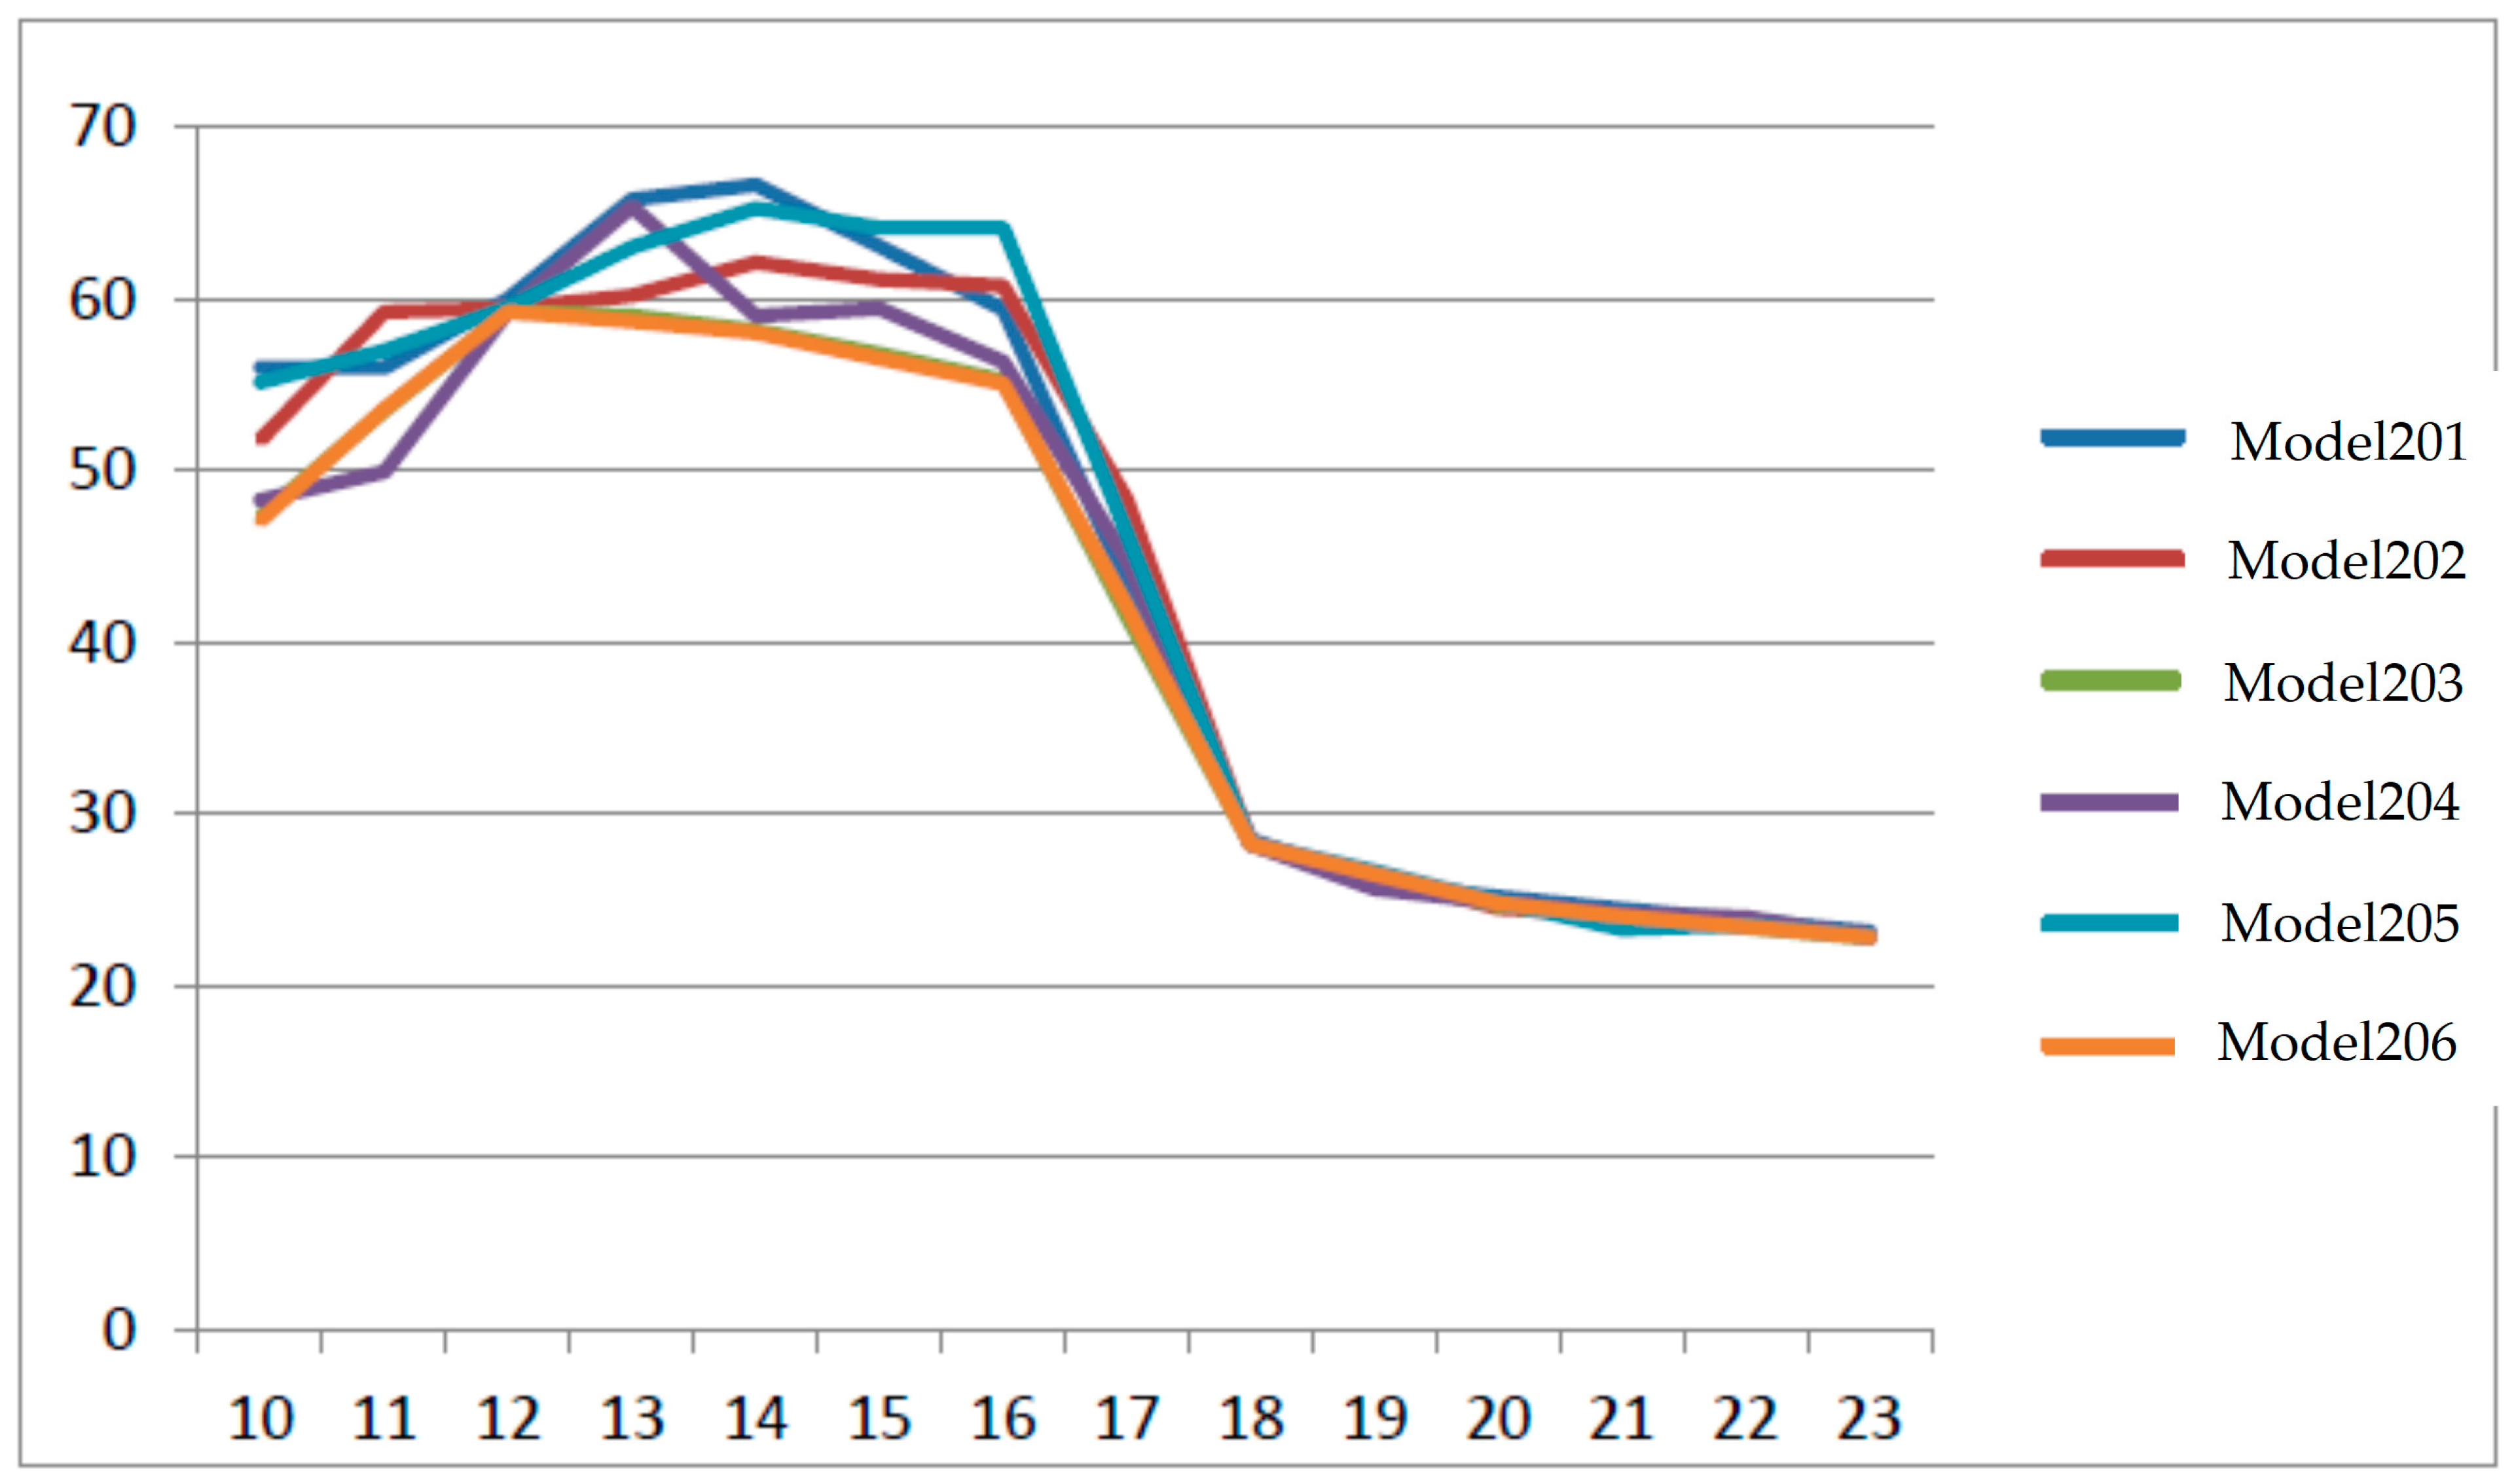
4.1. Thermal Comfort Analysis of Different Commercial Street Densities

4.1.1. Overall Comparative Analysis of Thermal Comfort in the External Space of the Model

Figure 12 shows the modeling of prototype models with street densities of 4 km/km2, 8 km/km2, 12 km/km2, and 16 km/km2 in Envi-met.
With the increase in street density, the lower MRT area of the outer space of models 102, 103, and 104 will increase, primarily distributed within their street space.
The overall MRT trend among the four models is basically the same. The maximum MRT difference in the outer space of the four models also occurred between 14:00 and 15:00, starting to decrease at 18:00, with the MRT difference becoming less apparent by 23:00. By comparing the charts of air temperature, wind speed, and humidity, it can be seen that MRT has a greater relationship with solar radiation and a higher correlation with air temperature. With the increase in street density, MRT decreases during daytime hours, while during the night, MRT values tend to be uniform (Figure 13 and Figure 14).
In general, the correlation between the change in MRT and street scale was significant during the daytime, with a low correlation observed between MRT and street scale at night. In other words, the higher the street density, the lower the MRT during the daytime. However, compared to model 103, there is no significant decrease in MRT in model 104. Thus, within a certain range of street density increase, the MRT value of its external space decreases significantly. When this range is exceeded, the MRT value does not decrease significantly with the increases in street density.

4.1.2. Thermal Comfort Analysis Conclusion of Street Density in Different External Spaces

According to the simulation data statistics, street density is correlated with the temperature, wind speed, humidity, and MRT of the outer space. The temperature, wind speed, MRT, and PMV show an inverse correlation, meaning that an increase in street density will decrease the air temperature, wind speed, MRT, and PMV. The influence of street density on humidity was not obvious during the day but showed a certain inverse correlation at night. That is, with the increase in street density, the relative humidity would decrease slowly, resulting in higher values.

4.2. Thermal Comfort Analysis of Different Commercial Street Intersections

4.2.1. Overall Comparative Analysis of Thermal Comfort in the External Space of the Model

Figure 15 shows the modeling of prototype models with different street intersections.
In general, the correlation between MRT changes and street intersections is significant during the day but low at night. In other words, MRT decreases with the increase in the number of street intersections during the daytime. However, in model 205, MRT does not decrease significantly; it may even increase. This suggests that within a certain range, the MRT value of the external space decreases noticeably with the increase in the number of street intersections, but this is not absolute. The reason, combined with wind speed and humidity, can be speculated as low wind speed hindering thermal comfort (Model 205 has the lowest average wind speed throughout the day). When this range is exceeded, the MRT value does not decrease significantly with the increase in street density (Figure 16 and Figure 17).

4.2.2. Conclusion of Thermal Comfort Analysis on the Number of Intersections in Different External Spaces

Through data statistics, we know that the number of street intersections has a certain correlation with the wind speed, humidity, and MRT of the external space, with a general trend inversely correlated with temperature. However, there are local differences in the data, and the possible causes need to be further verified.

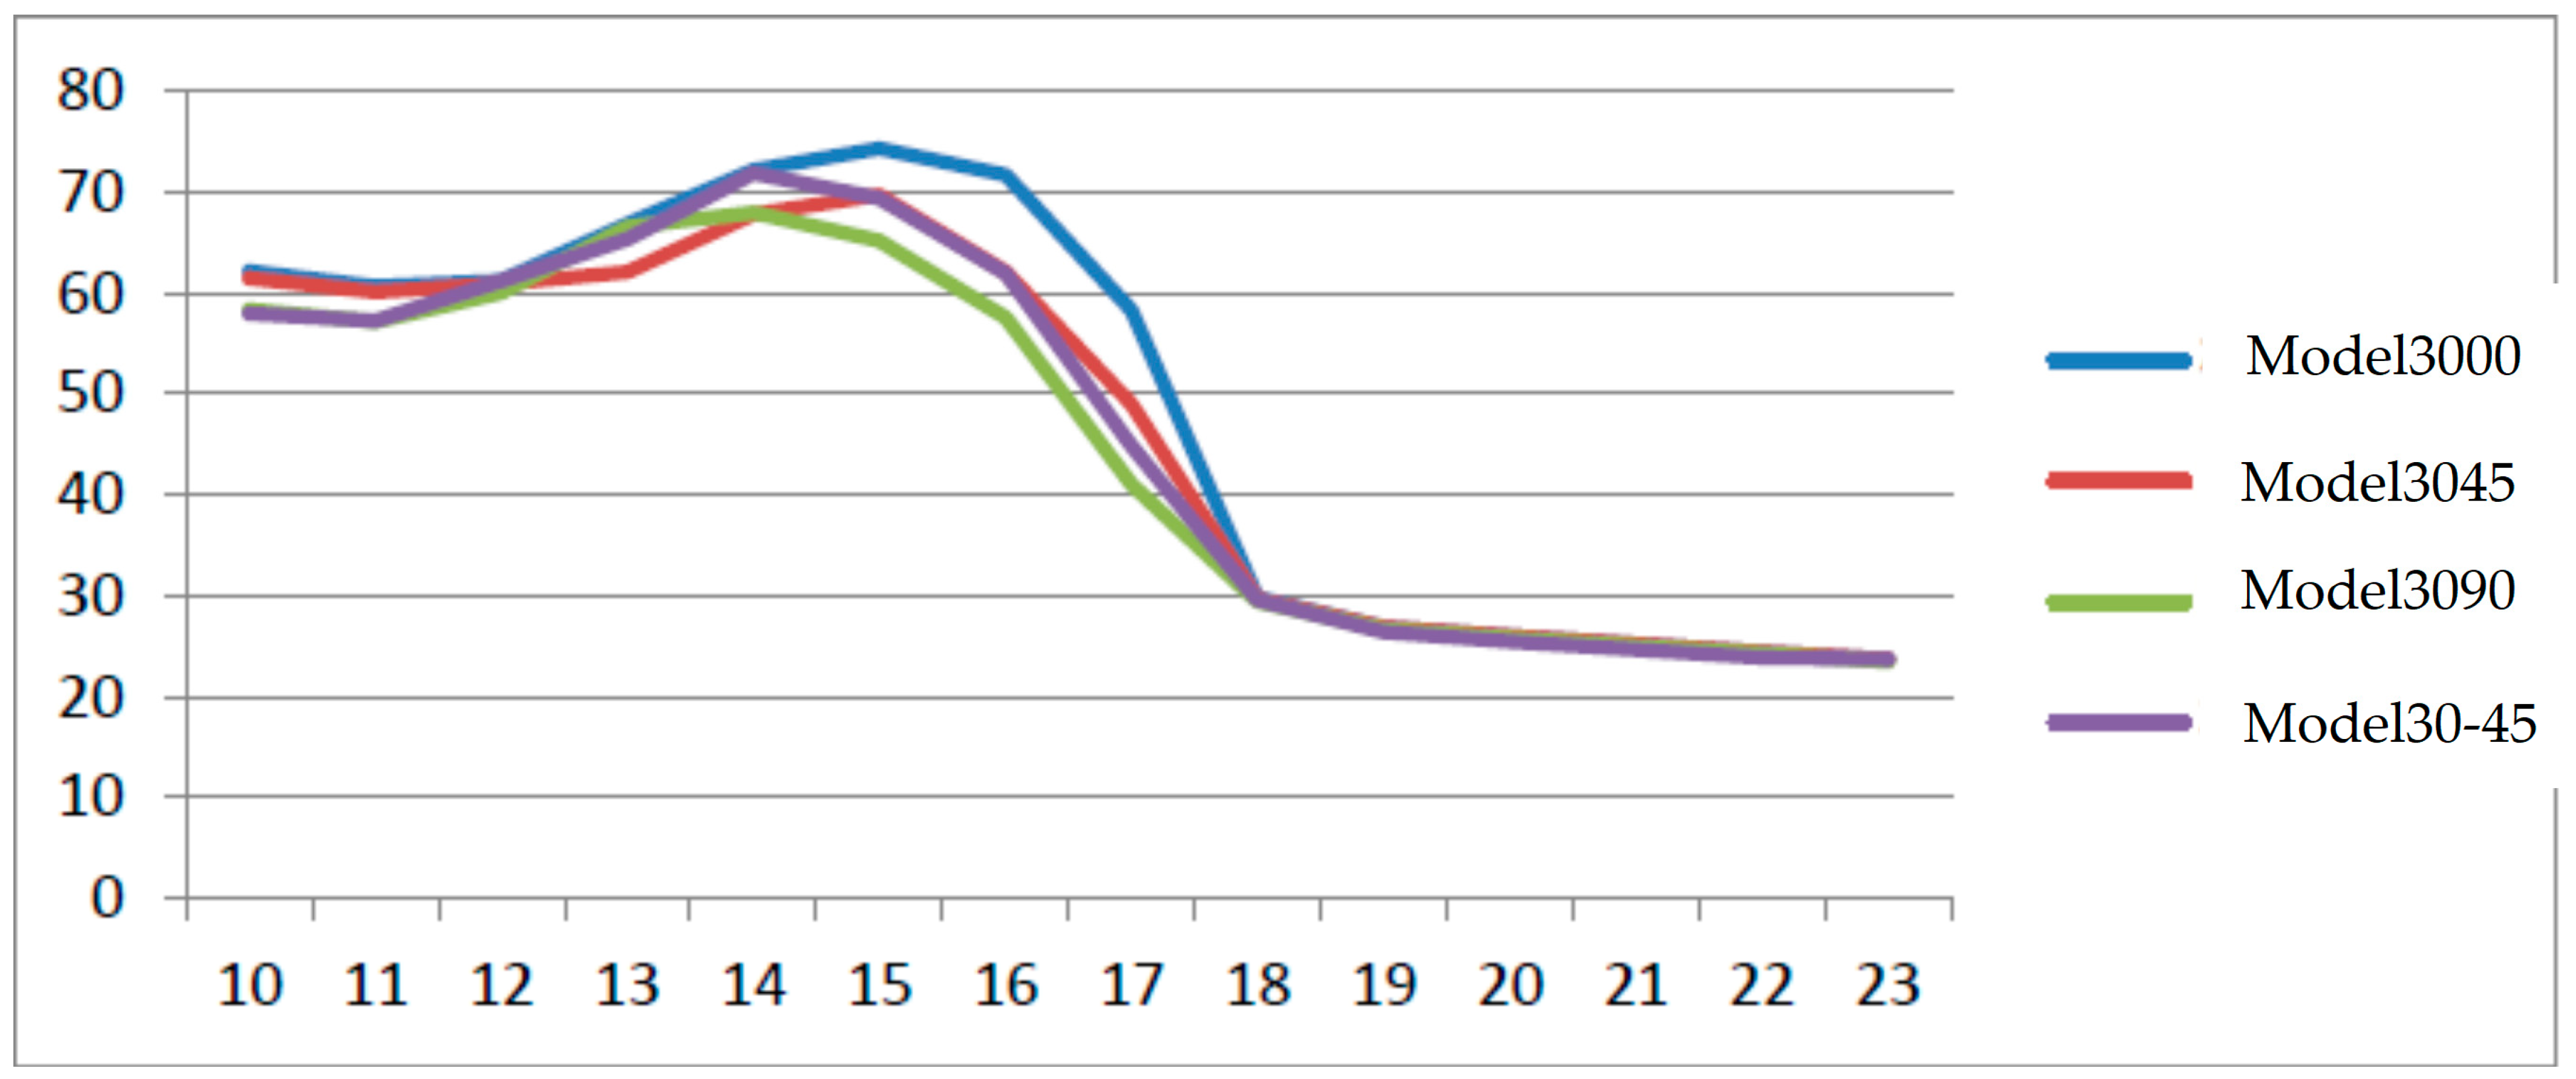
4.3. Thermal Comfort Analysis of Different Commercial Street Directions

4.3.1. Overall Comparative Analysis of Thermal Comfort in the External Space of the Model

It can be clearly seen from the figure that prototype model 30–45, which deviates from the dominant summer wind direction, exhibits a large area of lower MRT in the outer space, primarily distributed within the street space (Figure 18).
In general, there was a significant correlation between MRT changes and street direction during the day. At night, the correlation between MRT and street orientation is low. That is, the MRT value is low when the street direction aligns with the dominant summer wind direction during the daytime (Figure 19).

4.3.2. Thermal Comfort Analysis Conclusions of Street Directions in Different External Spaces

According to the statistics of the model data, we can conclude that the outer space of the prototype model conforming to the dominant summer wind direction is related to wind speed, humidity, MRT, and PMV, but it has no significant correlation with temperature. In other words, in the outer space of the prototype model conforming to the dominant summer wind direction, humidity and wind speed increase, and MRT will decrease relatively. In general, different street directions will affect the amount of solar radiation, meaning that north–south streets experience greater thermal comfort improvements due to the increased shading from the podium in the afternoon.

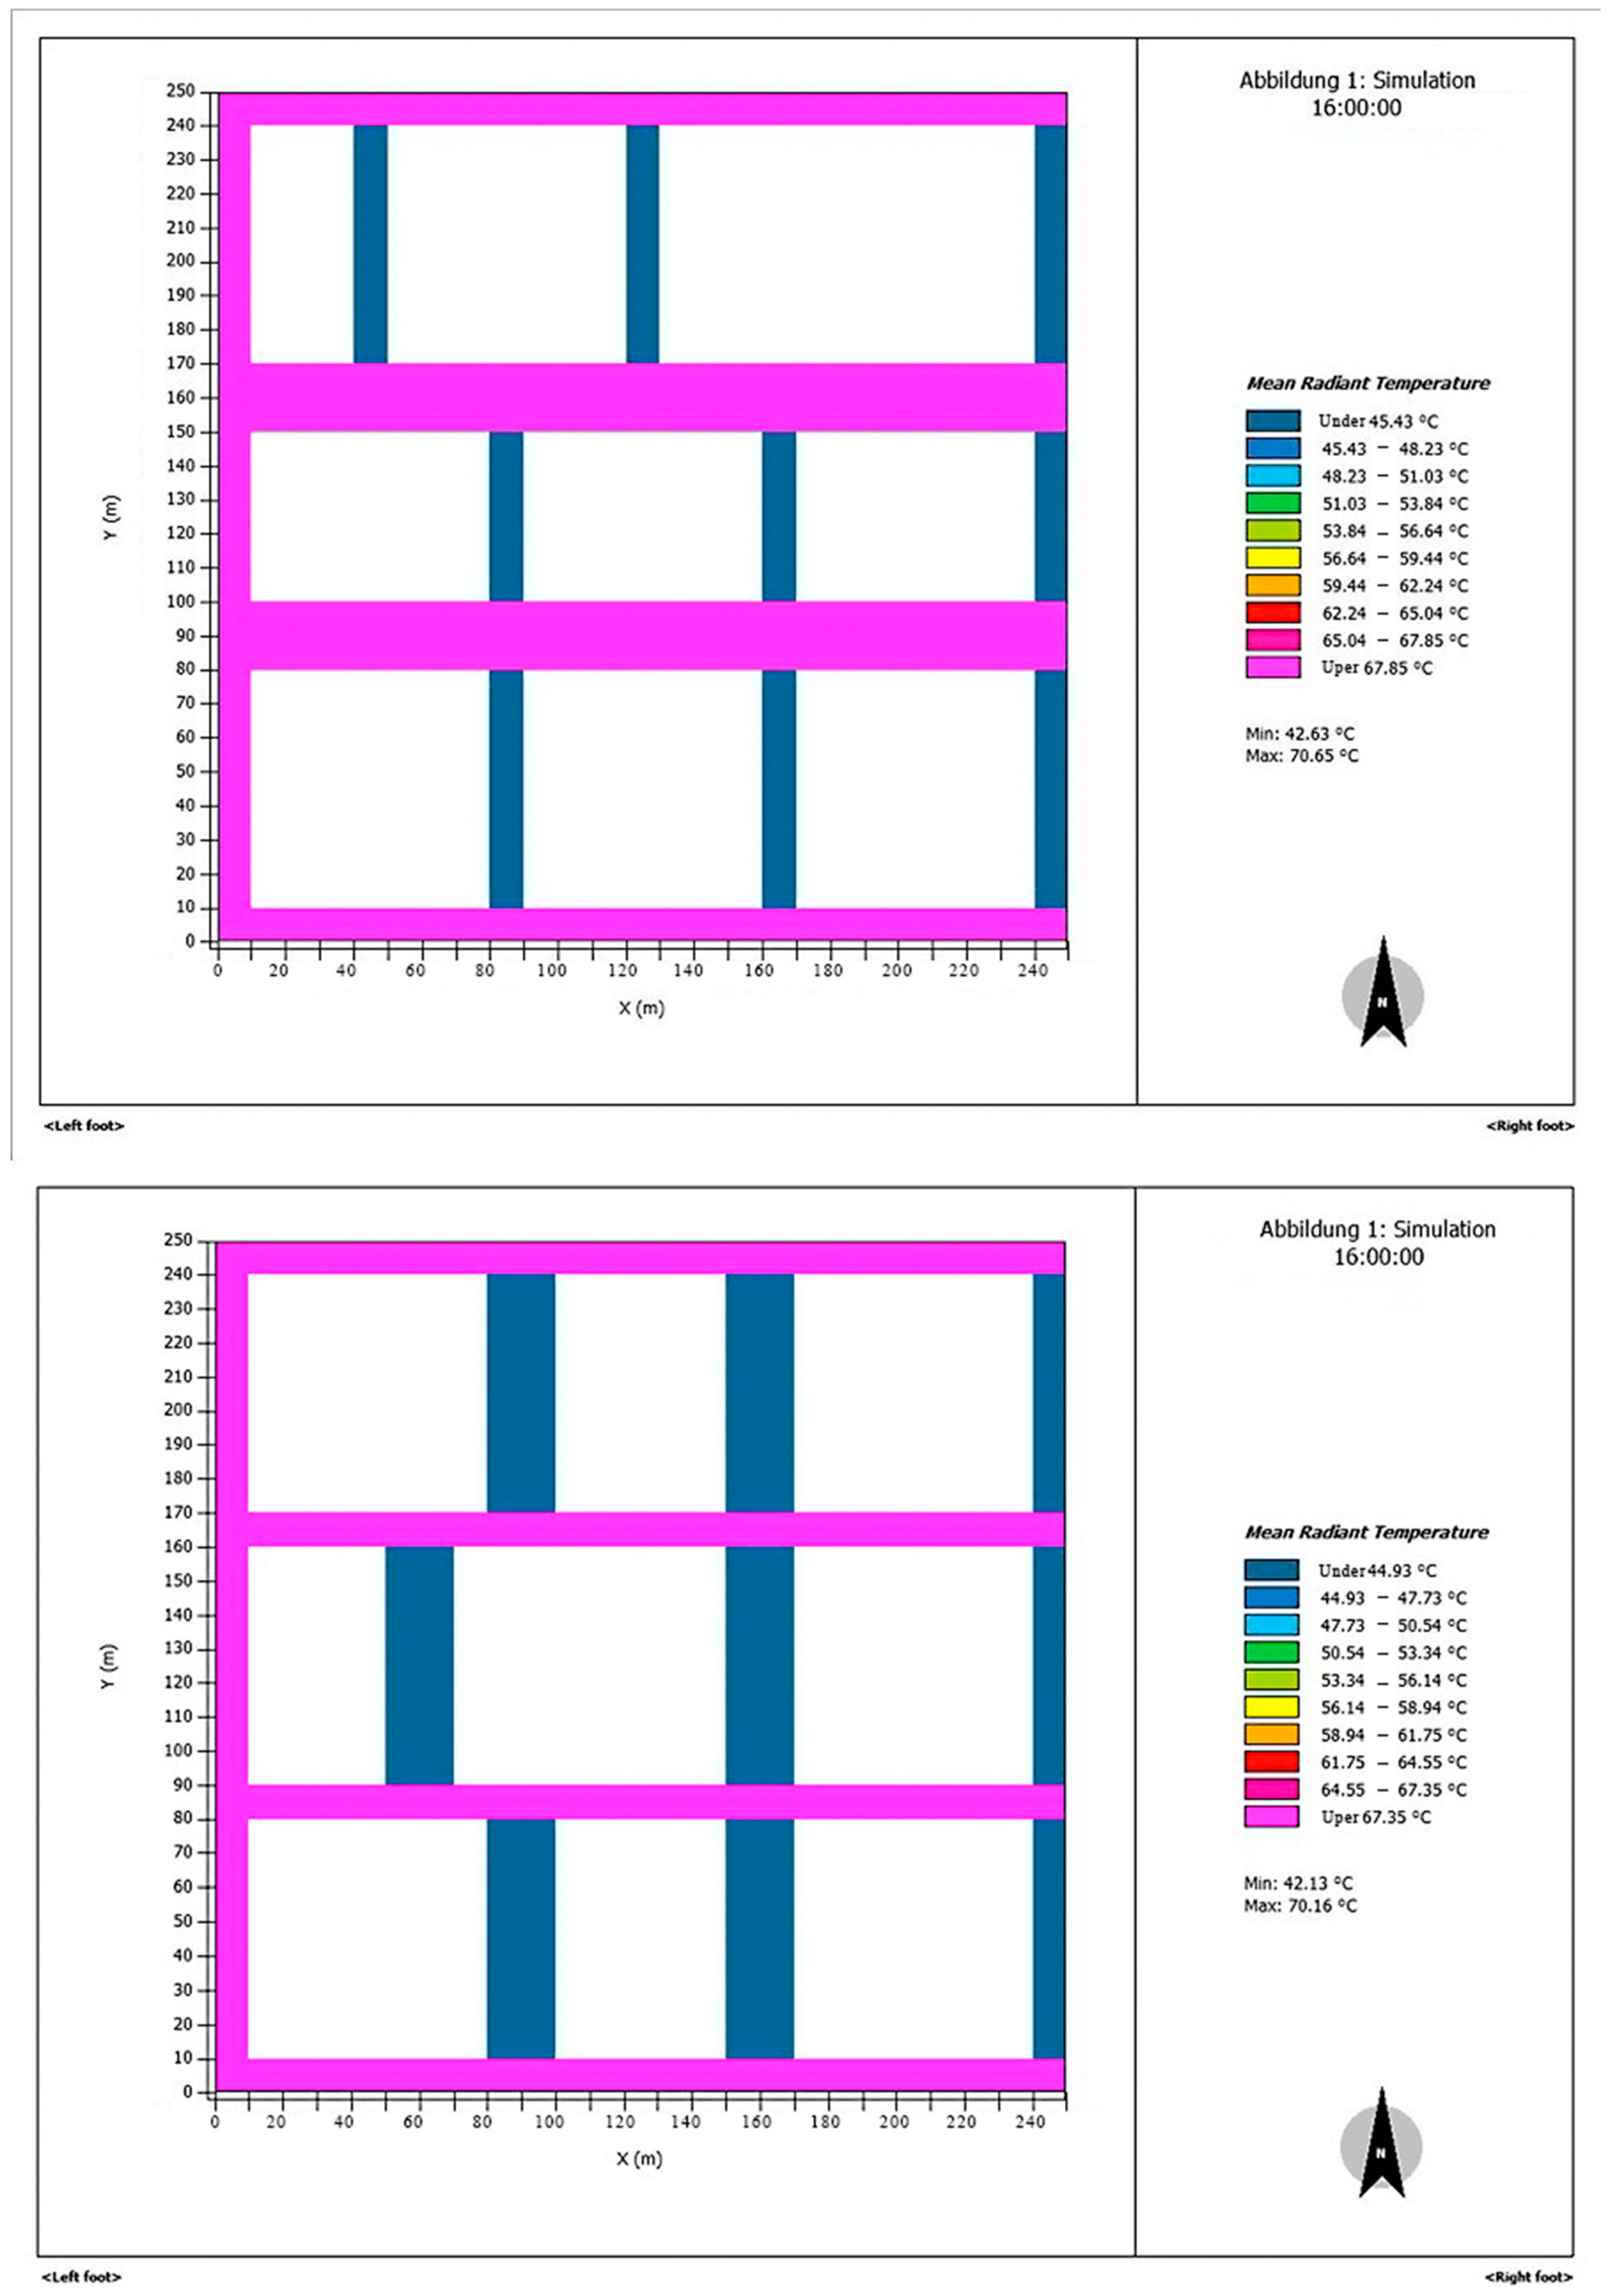
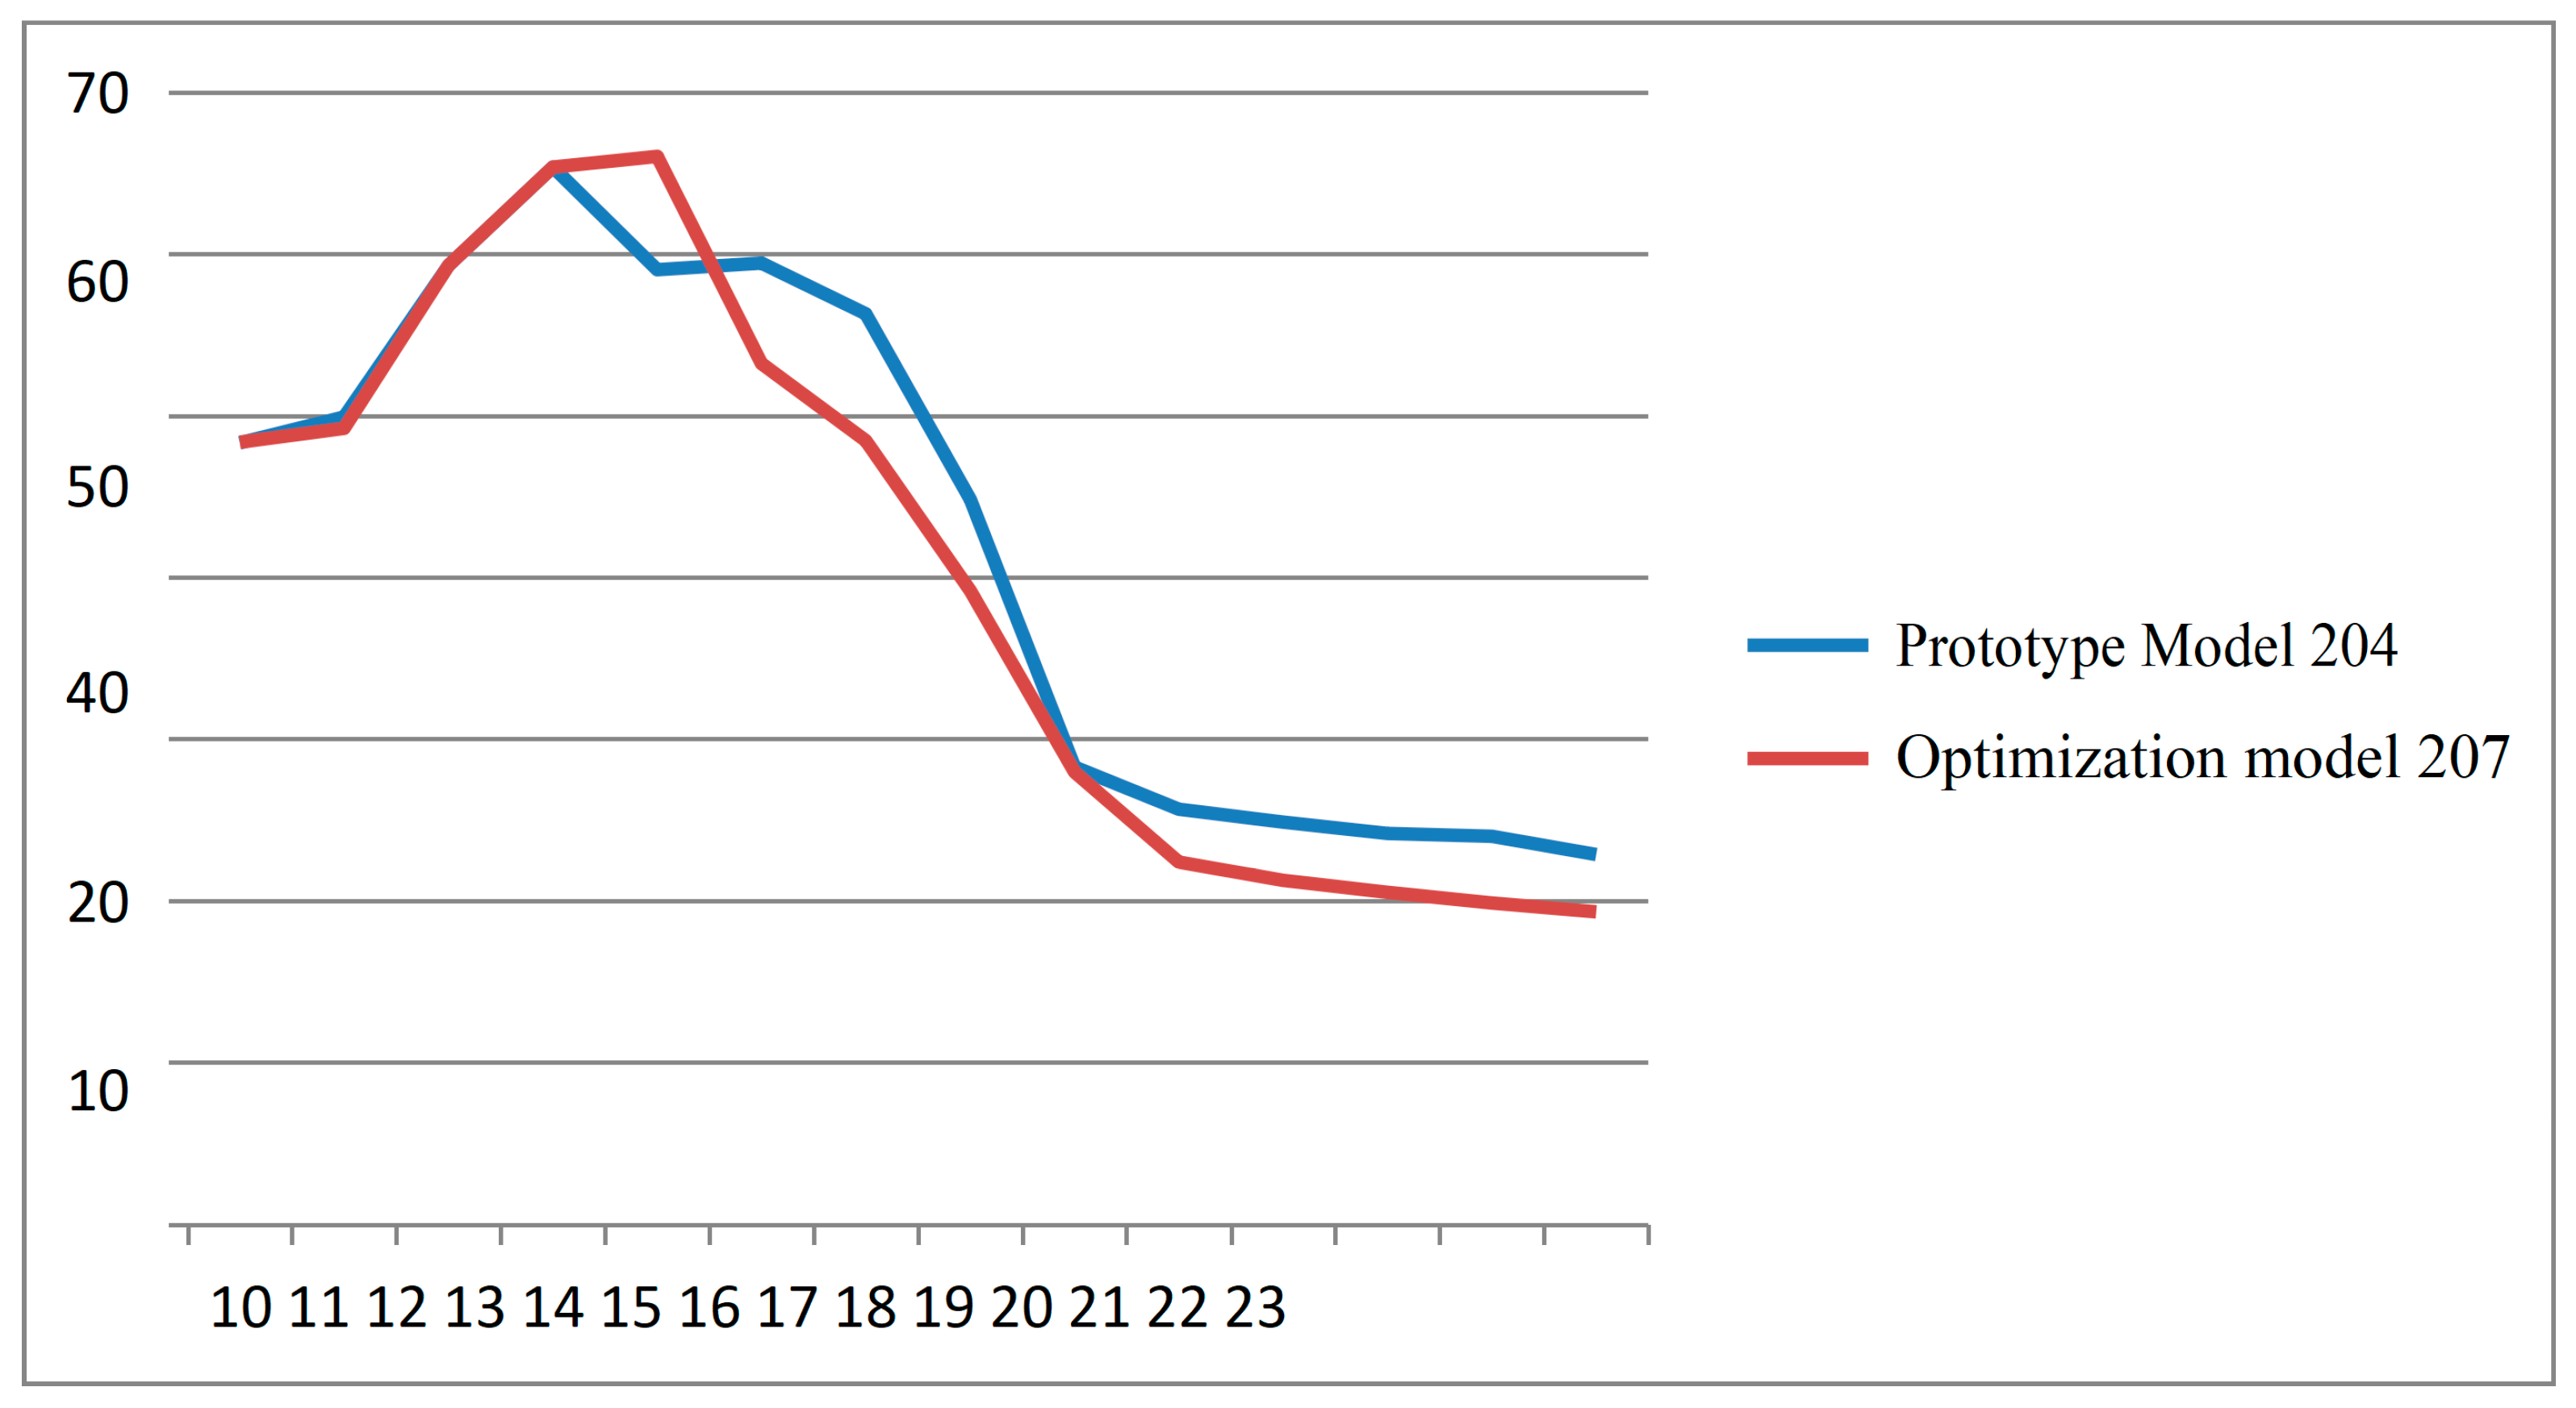
4.4. Thermal Comfort Analysis After Model Optimization

Based on the three sets of numerical computer simulations from different perspectives mentioned above, it can be concluded that street density, the number of street intersections, and the direction of streets within the block all have an impact on the thermal comfort of the human body.
Based on the conclusions above, the author designs a new optimized prototype model and simulates it using numerical computer simulation, data sorting, and analysis to verify the research findings.
This optimized model is named prototype model 207, with street density, street intersection number, and street direction still serving as its shape control indices. According to the experimental conclusions in Section 4.1, Section 4.2 and Section 4.3 the author defines the above three quantitative indicators as follows:
(1) The street density is set to 12 km/km2.
(2) While maintaining the street density in the external space, the street layout is adjusted to create more street intersections. The number of street intersections in this optimization model is 6.
(3) The main street layout is oriented north–south to better align with the dominant wind direction in Shanghai during the summer, thus increasing average wind speed and enhancing heat convection and diffusion. Additionally, the podium building on the west side provides shadow areas in the afternoon when solar radiation is intense, effectively reducing direct solar radiation.
After the author defined the quantitative indices, the shape of the optimized model resembled that of prototype model 204 (Figure 20), which also explains why prototype model 204 had a better thermal comfort evaluation index. After determining the quantitative indicators, its spatial morphology is shown as follows (Figure 21):
The spatial structure of this model is very similar to that of prototype model 204, but there are slight differences in terms of quantitative indicators from prototype model 204:
(1) The street density did not change and was 12 km/km2.
(2) The number of street intersections has not changed, both being 6.
(3) The main direction of the street has been adjusted, from two east–west street spaces in prototype model 204 to two north–south street spaces.

Thermal Comfort Analysis of an Optimized Model

The same basic data for numerical simulation were used to simulate the optimized model using a computer. The emphasis was placed on sorting out the Average Radiation Temperature (MRT) index, and the data were compared with that of prototype model 204.
Figure 22 displays the mean radiant temperature (MRT) distribution of prototype model 204 and optimized model 207 at 16:00. From these two images, the MRT distribution during this time can be readily observed. The MRT distribution in the external space of optimized model 207 is noticeably larger than that of prototype model 204, with the majority concentrated in the north–south street space.
Figure 23 presents a numerical comparison of MRT values in the outer space from prototype model 101 to model 104, spanning from 10:00 to 23:00. Upon comparison, it is evident that the overall trend of MRT between the two models is similar. However, the MRT value of the optimized model 207 is significantly lower than that of the prototype model.
Moreover, optimized model 207 exhibits a larger shaded area in the external space, resulting in reduced solar radiation exposure and consequently a lower average radiation temperature—a factor closely linked to human thermal comfort.
In conclusion, variations in MRT are influenced not only by street density, the number of street intersections, and street orientation, but also by the amount of solar radiation received.

5. Discussion and Conclusions

5.1. Research Conclusions

5.1.1. Block Form Control Factors of Block-Style Commercial Complex

This paper compiles and organizes related concepts of streets and blocks in urban road traffic planning. It selects three control factor indicators of block shape that can be quantitatively studied: street density, number of street intersections, and street direction within blocks, as the variables for this study.
These three quantitative indicators can serve as reference points for architects and urban designers during the spatial form design stage of block-style commercial complexes, aiming to enhance human thermal comfort. They can also function as criteria for evaluating thermal comfort in existing block-style commercial complexes.
Based on the author’s actual investigation and analysis of numerical computer simulation data, it is evident that these three quantitative indicators possess a certain degree of universality. They are closely intertwined with spatial form design practices within the disciplines of architecture and urban design. Moreover, these three quantitative indicators are intricately linked to human thermal comfort.

5.1.2. The External Space of a Block-Style Commercial Complex Is Based on the Design Strategy of Thermal Comfort Enhancement

Based on the numerical computer simulation and data collection presented in this paper, along with the architectural design characteristics of block-style commercial complexes, the following design strategies for improving thermal comfort can be proposed. These strategies can serve as a reference for architects and urban designers during the preliminary decision-making stage of design:
(1)
The length of street spaces and street density within the block can be moderately increased to enhance the thermal comfort of the external space. The suggested street density value is 12 km/km2. For instance, in a 250 × 250 m block plot, cutting four streets across would notably enhance the thermal comfort of its external space. Additionally, from an architectural perspective, forming a block shape similar to the nine-palace format by cutting four streets can ensure the commercial building area and maintain its commercial value.
(2)
Given the predetermined street density of the external space of the block-style commercial complex, the street spaces can be appropriately repositioned to create more street intersections, thus enhancing the thermal comfort of the external space. The recommended number of street intersections is 6-8.
(3)
The main street space of the block-style commercial complex should be oriented in the north–south direction. This arrangement serves two purposes: firstly, it aligns with the prevailing wind direction in Shanghai during the summer, thereby increasing the average wind speed and accelerating heat convection and diffusion. Secondly, it allows the podium on the west side of the building to create shaded areas in the afternoon when solar radiation is high and the air temperature is elevated, reducing direct solar radiation and improving the overall thermal comfort of the block space.
The synergistic effects of the three control factors (street density, intersection count, and orientation) demonstrate a non-linear enhancement pattern on thermal comfort. Specifically:
  • Low-density blocks (street density <10 km/km2) show limited improvement even with optimal orientation, indicating a threshold effect of street network complexity.
  • Moderate-to-high density (12–14 km/km2) combined with 6–8 intersections achieves peak thermal performance, with significant reductions in MRT translating to improved PET values.
  • A north–south orientation enhances wind-driven cooling effects in high-density configurations, while east–west orientations increase solar radiation gains.
This trend highlights that morphological optimization requires balanced coordination between geometric parameters and climatic responsiveness, with diminishing returns observed beyond critical thresholds (e.g., street density > 15 km/km2).

5.2. Discussion on the Shortcomings of the Research

As discussed earlier, human thermal comfort is influenced by numerous factors. This study attempts to consider air temperature, relative humidity, and average wind speed. However, from the perspective of architecture and urban design, the focus lies primarily on the block form. Factors such as underlying surface material, building interface material, vegetation planting within the block, air flow within street spaces, and particle diffusion levels can all impact human thermal comfort through radiation and convection [16]. This study solely examines the impact of the building industry on human thermal comfort within the block without considering the combined effects of multiple factors on human thermal comfort in external spaces.
This research lays a foundation for integrating dynamic environmental factors into the design of block-style commercial complexes. Future research should prioritize the following directions to enhance practical applications of dynamic simulations:
  • Real-time monitoring and adaptive design: Integrate IoT sensors and real-time climate data with AI-driven models to dynamically optimize spatial configurations, balancing thermal comfort and energy efficiency.
  • Multi-factor synergistic analysis: Simulate interactions among vegetation, water features, building materials, and human activities, leveraging machine learning to identify synergistic cooling strategies.
  • Climate change resilience: Incorporate long-term climate projections (e.g., extreme heat, shifting wind patterns) into thermal comfort evaluations to ensure design robustness under global warming.
  • User-centric behavioral modeling: Integrate pedestrian flow dynamics and virtual reality (VR) tools to align spatial configurations with activity patterns and thermal demands.
Dynamic impact analysis will transcend static evaluations, offering actionable insights for designing adaptive, sustainable, and human-centric commercial complexes capable of maintaining comfort and functionality amid evolving climatic and usage challenges.
The data that support the findings of this study are available from the corresponding author upon reasonable request.

Author Contributions

Methodology, Y.Z. and Y.H.; Investigation, E.N.; Resources, J.Z.; Data curation, E.N.; Writing—original draft, E.N.; Writing—review & editing, Y.Z. and Y.H.; Project administration, J.Z. All authors have read and agreed to the published version of the manuscript.

Funding

This research received no external funding.

Data Availability Statement

Data are contained within the article.

Conflicts of Interest

Author Jiang Zhu was employed by the company Zhengzhou Zhengdong High tech Industrial Development Co., Ltd. The remaining authors declare that the research was conducted in the absence of any commercial or financial relationships that could be construed as a potential conflict of interest.

References

  1. Ali-Toudert, F.; Ali-Toudert, F. Dependence of Outdoor Thermal Comfort on Street Design in Hot and Dry Climate. Ph.D. Thesis, Universität Freiburg, Freiburg im Breisgau, Germany, 2005. [Google Scholar]
  2. Ali-Toudert, F.; Djenane, M.; Bensalem, R.; Mayer, H. Outdoor thermal comfort in the old desert city of Beni-Isguen, Algeria. Clim. Res. 2005, 28, 243–256. [Google Scholar] [CrossRef]
  3. ANSI/ASHRAE Standard 55-1992; Thermal Environmental Conditions for Human Occupancy. ASHRAE: Peachtree Corners, GA, USA, 1992.
  4. Bruse, M.; Fleer, H. Simulating surface–plant–air interactions inside urban environments with a three dimensional numerical model. Environ. Model. Softw. 1998, 13, 373–384. [Google Scholar] [CrossRef]
  5. Chen, T.Y.; Huang, C.S.; Sung, W.P. Improving summer outdoor comfort in metropolitan park: A data-driven approach using AI, experimental and design analysis. J. Meas. Eng. 2025, 13, 3–7. [Google Scholar] [CrossRef]
  6. Bulcao, C.F.; Frank, S.M.; Raja, S.N.; Tran, K.M.; Goldstein, D.S. Relative contribution of core and skin temperatures to thermal comfort in humans. J. Therm. Biol. 2000, 25, 147–150. [Google Scholar] [CrossRef]
  7. Ding, W.; Tong, Z. An approach for simulating the street spatial patterns. Build. Simul. 2011, 4, 321–333. [Google Scholar] [CrossRef]
  8. Fanger, P.O. Thermal Comfort. Analysis and Applications in Environmental Engineering; Danish Technical Press: Copenhagen, Denmark, 1970. [Google Scholar]
  9. Hao, T.; Huang, J.; He, X.; Li, L.; Jones, P. A machine learning-enhanced design optimizer for urban cooling. Indoor Built Environ. 2023, 32, 355–374. [Google Scholar] [CrossRef]
  10. Höppe, P. The physiological equivalent temperature—A universal index for the biometeorological assessment of the thermal environment. Int. J. Biometeorol. 1999, 43, 71–75. [Google Scholar] [CrossRef] [PubMed]
  11. Mahgoub, M.H.; Hamza, D.N.; Dudek, D.S. Microclimatic Investigation of Two Different Urban Forms in Cairo, Egypt: Meassurements and Model Simulations. In Proceedings of the Building Simulation Cairo 2013—Towards Sustainable & Green Built Environment, Cairo, Egypt, 23–24 June 2013. [Google Scholar]
  12. Cuce, P.M.; Cuce, E.; Santamouris, M. Towards Sustainable and Climate-Resilient Cities: Mitigating Urban Heat Islands Through Green Infrastructure. Sustainability 2025, 17, 1303. [Google Scholar] [CrossRef]
  13. Li, H.; Zhang, W.; Wang, F. Evaluation and optimization of thermal comfort in urban outdoor spaces in hot summer and cold winter climate zones: A case study of central Shanghai. Jianzhu Kexue 2022, 38, 45–54. (In Chinese) [Google Scholar]
  14. Zhao, Y.; Zhao, K.; Ge, J. Predicting the temperature distribution of a non-enclosed atrium and adjacent zones based on the Block model. Build. Environ. 2022, 214, 108952. [Google Scholar] [CrossRef]
  15. Meta, H. Space, Density and Urban Form; Technique University of Delft: Delft, The Netherlands, 2009. [Google Scholar]
  16. Yuan, S. Quantitative Analysis of Urban Street Network Spatial Form. Ph.D. Thesis, Tianjin University, Tianjin, China, 2012. (In Chinese). [Google Scholar]
Figure 1. Few pedestrians can be seen in the external space of Beijing’s Galaxy SOHO, while Xin Tian Di is bustling with crowds. The author took photographs.
Buildings 15 00929 g001
Figure 2. Envi-met software overall structure diagram; image from the Envi-met description.
Buildings 15 00929 g002
Figure 3. Texture comparison of Wujiaochang Wanda Plaza and Daning International Commercial Plaza—drawn by the author.
Buildings 15 00929 g003aBuildings 15 00929 g003b
Figure 4. Wujiaochang Wanda Commercial Plaza and Daning International Envi-met model (building only)—drawn by the author.
Buildings 15 00929 g004
Figure 5. MRT distribution map of Wujiaochang Wanda Plaza external space (16:00, 1.2 m above ground)—drawn by the author.
Buildings 15 00929 g005
Figure 6. MRT layout of Daning International Commercial Plaza (16:00, 1.2 m above ground)—drawn by the author.
Buildings 15 00929 g006
Figure 7. Comparison of MRT (°C) values of Wujiaochang Wanda and Daning International Commercial Plaza (10:00–23:00, 1.2 m above ground)—drawn by the author.
Buildings 15 00929 g007
Figure 8. Schematic of typical block size for Shanghai block-style commercial complexes—drawn by the author.
Buildings 15 00929 g008
Figure 9. Relationship between Wujiaochang Wanda Plaza and Daning International Commercial Plaza site plans—drawn by the author.
Buildings 15 00929 g009
Figure 10. Upper left: site plan of Hongqiao Tiandi commercial street district; upper right: site plan of Qibao Square commercial street district; bottom left: site plan of Bailian Outlet commercial street district; bottom right: site plan of Florence Town commercial street district—drawn by the author.
Buildings 15 00929 g010
Figure 11. Spatial prototype diagram—drawn by the author.
Buildings 15 00929 g011
Figure 12. The prototype models with street densities of 4 km/km2, 8 km/km2, 12 km/km2, and 16 km/km2 were modeled in Envi-met, and their corresponding model numbers were 101, 102, 103, and 104, respectively—drawn by the author.
Buildings 15 00929 g012
Figure 13. MRT (°C) distribution of prototype model 101–104 in outer space (at 16:00, 1.2 m above ground)—drawn by the author.
Buildings 15 00929 g013
Figure 14. Comparison of MRT (°C) values of prototype model 101–104 (10:00–23:00, 1.2 m above ground)—drawn by the author.
Buildings 15 00929 g014
Figure 15. The prototype models of street intersections 3, 4, 5, 6, 7, and 8 were modeled in Envi-met, and the corresponding model numbers were 201, 202, 203, 204, 205, and 206, respectively—drawn by the author.
Buildings 15 00929 g015
Figure 16. Prototype model 201–206 External space MRT (°C) distribution map (16:00, 1.2 m above ground)—drawn by the author.
Buildings 15 00929 g016
Figure 17. Comparison of MRT (°C) values of prototype model 201–206 (10:00–23:00, 1.2 m above ground)—drawn by the author.
Buildings 15 00929 g017
Figure 18. Prototype model 3000-30-45 MRT (°C) distribution map in outer space. (16:00, 1.2 m above ground)—drawn by the author.
Buildings 15 00929 g018
Figure 19. Numerical comparison of MRT (°C) in the outer space of prototype model 3000-30-45 (10:00–23:00, 1.2 m above ground)—drawn by the author.
Buildings 15 00929 g019
Figure 20. Prototype model 204 Schematic modeling in Envi-met—drawn by the author.
Buildings 15 00929 g020
Figure 21. The optimized prototype model 207 is modeled in Envi-met—drawn by the author.
Buildings 15 00929 g021
Figure 22. MRT (°C) distribution of prototype model 204 (top) and optimized model 207 (bottom). (16:00, 1.2 m above ground)—drawn by the author.
Buildings 15 00929 g022
Figure 23. Comparison of external space MRT (°C) between prototype model 204 and optimized model 207—drawn by the author.
Buildings 15 00929 g023
Table 1. Climatic zoning classification.
Climatic SystemApproximate Scale of Climate CharacteristicsDuration
Horizontal Range (km)Vertical Range (km)
Global Wind Zone Climate20003–101–6 months
Regional Macroclimate500–10001–101–6 months
Local Topographic Climate1–100.1–11–24 h
Microclimate0.1–10.124 h
Table 2. The relationship between PET values and the corresponding thermal sensation and physiological response levels is examined.
PET (°C)Thermal SensationPhysiological Response Level
4FreezingExtreme Cold Stress
8ColdSevere Cold Stress
13CoolModerate Cold Stress
18ChillyMild Cold Stress
23ComfortNo Heat Stress
29WarmModerate Heat Stress
35HotSevere Heat Stress
41ScorchingExtreme Heat Stress
Table 3. The basic characteristics of the two block-type commercial complexes.
Wujiaochang Wanda PlazaDaning International Commercial Plaza
Construction time2006.122006.10
Site area (m2)63,50055,000
Gross floor area (m2)333,000250,000
Floor area (m2)251,000200,000
Plot ratio3.953.63
Podium height (m)2424
Street density (km/km2)1020
Street area ratio (%)2020
Number of street crossings315
Block orientationNWbN 26°NWbN 32°
Table 4. The established model conditions.
LocationShanghai Urban Area (31.12° N, 121.30° E)
Simulation time5 August 2022
Simulation period9:00–23:00
Model gridWujiaochang Wanda Plaza:75/82/20 (ΔX = ΔY = 4 m, ΔZ = 8 m)
(Grid number and grid scale)Daning International Commercial Plaza:70/70/30 (ΔX = ΔY = 4 m, ΔZ = 6 m)
Number of nested grids5
Table 5. Show related parameters.
LocationShanghai Urban Area (31.12° N, 121.30° E)
Simulation time5 August 2022
Simulation period9:00–23:00
Atmospheric boundary conditionInitial wind speed (10 m): 3 m/s
Wind direction: 120° (Southeast)
Initial temperature: 300.15 K
Initial humidity (2500 m): 2 g/kg
Relative humidity (2 m): 50%
Ground roughness: 0.01
Substrate temperature, humidityInitial temperature: 293.3 K
Relative humidity: 60%
Human physiologyClothing thermal resistance: 0.3 clo
Activity: 53.6 W
Table 6. Results of questionnaire survey on comfort index.
Daning International Commercial Plaza
TemperatureHumidityWind SpeedPhysical Comfort
Very comfortable50323
Comfortable41015813
General31610149
Uncomfortable22244
Very uncomfortable12021
Total30303030
Wujiaochang Wanda Plaza
TemperatureHumidityWind SpeedPhysical Comfort
Very comfortable50040
Comfortable4510129
General31412912
Uncomfortable27657
Very uncomfortable14202
Total30303030
Disclaimer/Publisher’s Note: The statements, opinions and data contained in all publications are solely those of the individual author(s) and contributor(s) and not of MDPI and/or the editor(s). MDPI and/or the editor(s) disclaim responsibility for any injury to people or property resulting from any ideas, methods, instructions or products referred to in the content.

