Abstract
A series of vertical loading tests on stone columns based on transparent soil were conducted to investigate the failure modes and bearing characteristics of stone columns in layered soils. The influences of different layer thicknesses, different layer distributions, and different aggregate gradations on the bearing capacity of stone columns were examined. Based on the experimental results, a bearing capacity calculation method is proposed for stone columns subjected to bulging failures in lower soft soils. This new calculation method incorporates the self-weight of both the column and the surrounding soil. Verification through an engineering case study shows that, compared with the existing calculation methods, the outcomes derived from the proposed approach exhibit superior agreement with field measurements.
1. Introduction
In ground improvement projects, holes are typically formed by methods such as vibroflotation or driven casing. Afterward, coarse-grained materials such as gravel or sand are filled and densified within the holes. This process forms large-diameter, high-density columns that work together with surrounding soils to support loads, thus creating a composite foundation of granular columns. Stone columns, a classic form of granular columns, can effectively enhance drainage in soft ground by accelerating the consolidation process. They also improve the strength of the columns and the surrounding soil. Stone column technology is cost-effective, exhibits significant improvement effects, and provides a reliable means for soft soil foundation treatment [1]. Numerous engineering practices confirm that the use of stone columns is effective for mitigating poor ground conditions, such as soft soil. Projects such as the Yangshan Port in Ningbo-Zhoushan Port under the Shanghai International Shipping Center, the Tongshan Cement Plant, the main plant of the Longkou Power Plant in Shandong Province, and the Hong Kong–Zhuhai–Macao Bridge island-tunnel works all employed stone columns to treat soft soils. After treatment, the bearing capacities of the foundations were significantly enhanced—by factors of two to four—while the potential liquefaction risks were mitigated, ensuring both safety and stability.
Despite their success in engineering applications, the bearing mechanism and design theory for stone columns still require further research and development [2,3,4,5].
Many researchers have investigated the bearing mechanism of stone columns from various perspectives using different methods. Sivakumar et al. [6] performed undrained triaxial tests and observed that increasing the length of sand columns significantly improves the load-bearing capacity of composite specimens. However, due to the limited sample dimensions, boundary effects could not be entirely eliminated in those tests. Shivashankar et al. [7] employed laboratory model tests to demonstrate that stone columns in layered soils with top weak layers exceeding twice the column diameter exhibit drastically reduced bearing capacity and stiffness, with bulging localized in the weak upper layer. Kim et al. [8] conducted centrifuge model tests to show that gravel compaction piles (GCPs) achieve a 1.25–2.6 times higher bearing capacity than sand compaction piles (SCPs) at a 50% area replacement ratio. Ali et al. [9] and Fattah et al. [10] conducted model tests to demonstrate that fully geosynthetic-encased end-bearing stone columns enhance soft soil bearing capacity by up to 250% compared to untreated soil, while fully encased floating columns yield only a 28% improvement—underscoring the critical role of mobilized hoop stresses and the need for refined predictive models incorporating area replacement effects.
Hughes [11] revealed through radiographic techniques that stone columns in soft clay exhibit concentrated vertical settlement and radial bulging within the upper four diameters, with deformations attenuating rapidly with depth. Wood et al. [12,13] employed the exhumation technique to reveal that stone column groups exhibit deformation modes (bulging, shear plane formation, or axial compression) dependent on the column geometry and spacing. Black et al. [14] employed tubular wire mesh, metal bridging rods, and concrete plugs in laboratory plate loading tests, revealing the reduced bulging and enhanced settlement control of stone columns in peat. McKelvey et al. [15] utilized transparent clay and kaolin in laboratory tests to visualize deformation, revealing that long vibrated stone columns predominantly bulge, while short columns fail by punching, with optimal performance at six times the column diameter. Gupta et al. [16] performed static and cyclic model tests on geopolymer-stabilized columns, revealing that end-bearing configurations minimized the embankment settlement more effectively than floating columns, with higher area replacement ratios further enhancing the deformation resistance. Savvides et al. [17] utilized gravel pile groups and preloading through numerical analysis, showing a 50% displacement reduction in soft soils under seismic loads.
Existing studies on stone column behavior have predominantly focused on homogeneous soil conditions, with limited attention to the failure mechanisms in stratified profiles—particularly in sand-over-clay layered systems. A critical gap persists in understanding how bulging failure initiates and propagates within the underlying clay layer, as the conventional methods for estimating bearing capacity often neglect the unique stress re-distribution and deformation constraints imposed by layered soils. To address these limitations, this study pioneers the use of transparent soil visualization technology to experimentally characterize the failure patterns in stratified soil–column systems. This approach enables the direct observation of deformation mechanisms, including bulging localization in clay layers beneath sand overburdens—a phenomenon previously inferred, but rarely quantified.
Building on these insights, we propose a novel analytical method specifically designed to calculate the bearing capacity of stone columns undergoing bulging failures in clay layers under sand overburdens. Unlike prior methodologies that rely on empirical adjustments for layered soils, our framework explicitly integrates soil stratification effects, including variations in the layer thickness and interfacial shear resistance. Validation through controlled model tests and comparisons with field data underscore the method’s ability to resolve the discrepancies inherent in traditional approaches, offering a robust tool for practical applications in layered ground improvement.
2. Model Test Based on Transparent Soil
2.1. Transparent Soil
Transparent soil technology has been rigorously validated as a reliable modeling medium in geotechnical research, offering unique capabilities to visualize subsurface deformation while maintaining essential mechanical behaviors [18]. By synthesizing granular and cohesive materials with refractive index-matched fluids, this approach enables the non-invasive observation of failure mechanisms in layered systems—a critical advantage over traditional destructive excavation methods. Building on this established methodology, the present study employs a customized transparent soil system to investigate the stone column behavior in sand–clay strata. The following section details the material formulations ensuring both the optical clarity and geomechanical equivalence to natural soils.
The transparent soil used to simulate natural ground must not only approximate the physical and mechanical properties of real soils, but also have a low light absorption, low reflectivity, and uniform internal composition. Based on previous studies [18,19], fused quartz sand was used to simulate transparent sand, and precipitated silica was used to simulate transparent clay. The fused quartz sand has a particle size of 0.1–0.5 mm, mainly composed of silica (SiO2) with a content of 99.99%, a Mohs hardness of 7.0, a specific gravity of 2.21, a refractive index of approximately 1.4585, and a maximum and minimum dry density of 1.344 g/cm3 and 1.02 g/cm3, respectively. The precipitated silica used as the transparent clay has a major chemical component of SiO2, a refractive index of 1.442, and a relative density between 2.000 and 2.653, with a specific gravity of 2.01.
For the pore fluid, its refractive index must match that of the solid particles. According to prior research [20], for the transparent sand, an organic blend of 3# and 15# white oil was mixed in a 1:8 volume ratio with dodecane as an intermediate. This mixture matched the refractive index of the fused quartz sand.
Because precipitated silica has very fine particles, lasers passing through its interior do not naturally generate a speckle pattern. To solve this problem, tracer particles were added. Titanium oxide was chosen for its high chemical stability. The mass ratio between the titanium oxide and precipitated silica was set to 0.015% to minimize potential effects on the mechanical behavior and transparency [21].
The main physical and mechanical properties of the transparent sand and clay are listed in Table 1. To prevent any mixing of the different pore fluids used for the transparent clay and sand, a separating layer was placed between the bottom and top soil layers during the sample preparation.

Table 1.
Physical and mechanical properties of transparent sand and clay.
2.2. Model Stone Column and Test Protocol
Based on the typical stone column design parameters, the prototype column length is 10 m and the diameter is 1 m, with the particle size ranging from 20 to 50 mm. Adopting a 50:1 similarity ratio, the model column length was 200 mm, the diameter was 20 mm, and the infill material was Fujian standard sand (Xinyi Wanhe Mining Co., Ltd., Xuzhou, China) with a particle size of 0.2–2 mm. To ensure full visibility during testing, a transparent acrylic container was used as the model box, with dimensions of 150 mm × 150 mm × 200 mm and a 5 mm thick wall. The ratio of the distance from the stone column center to the container wall (L) over the column diameter (D) exceeded 3 (L/D > 3), eliminating significant boundary effects [22]. Schematic diagrams of the model column and test container are illustrated in Figure 1.
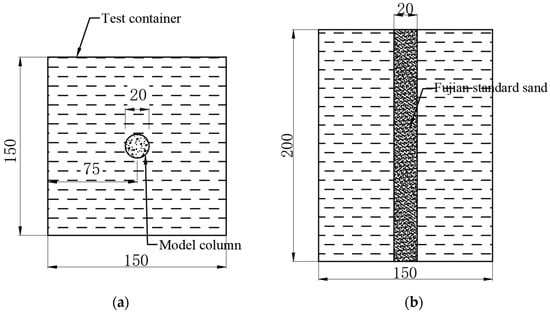
Figure 1.
The model column and the test container (unit: mm): (a) the plan view; (b) the front view.
To account for the size effects induced by particle dimensions and testing apparatus, the experimental groups were classified based on the particle size fraction within the 0.8–1.6 mm range, with those containing 25%, 50%, and 75% mass fraction percentages of this specific particle size designated as Gradation 1, 2, and 3 respectively, as detailed in Table 2.
Table 2.
Stone gradation schemes for model tests.
At a relative density of 0.7 [23], the stone backfill for each gradation had slightly different physical properties (Table 3). To approximate the real construction process in the model, the pile was formed by (1) pre-boring, (2) pouring the gravel, (3) vibrating the gravel, and (4) withdrawing the casing. The gravel was filled in layers, each no more than 2 cm thick.
Table 3.
Physical properties of stone column fill.
The static load tests were carried out using a slow-maintained loading method. The objective was to analyze how different layer thicknesses (total thickness 200 mm), layer distributions, and aggregate gradations affected the column bearing capacity. The test matrix is shown in Table 4. Notably, ST3, SL1, and SG3 share the same parameters; they are labeled differently only to facilitate discussion in the results.
Table 4.
Test matrix.
A preliminary trial was conducted to determine the ultimate bearing capacity of the single column. During the formal testing, weights were applied stepwise. At each load step, the total weight of the applied masses and the column top area were used to calculate the column’s vertical load.
The formal test procedure is as follows, and Figure 2 shows the test setup.

Figure 2.
Test setup: (a) schematic diagram; (b) photographic view.
- (1)
- Prepare the transparent soil layers according to the designated scheme, then allow the sample to stand for 24 h.
- (2)
- Construct the stone column in layers and allow it to stand for another 24 h.
- (3)
- Install and calibrate the data acquisition system, including earth pressure cells at the column base and a dial gauge above the loading plate. Position the camera so that the entire test container is in view. Turn on the laser device and ensure the laser plane aligns with the center of the test container and the column axis.
- (4)
- Load in increments of 1/8 of the column’s ultimate bearing capacity. At each load step, maintain the load and observe the dial gauge readings. If the settlement increment is less than 0.1 mm within 30 min, the settlement is considered stable, and the next load step is applied. If the total settlement exceeds 20 mm or the settlement rate increases sharply, the test is terminated. Throughout the loading process, photographs are taken at each stage.
3. Test Results and Discussion
3.1. Load–Settlement Curves
Figure 3 shows the load–settlement curves under different sand layer thicknesses. In test ST1, a turning point appears at a settlement of about 12 mm (at a load of 12.48 kPa); in ST2, it occurs at about 8 mm (21.84 kPa); and in ST3, around 6 mm (21.84 kPa). Along with these turning points, the stone columns clearly lose stability. Moreover, the column head exhibits noticeable bulging, confirming the occurrence of failure. In ST1, failure occurs at the fourth loading step as the column intrudes into the clay layer and bulges. Thus, ST1’s load–settlement curve shows a sharp drop, while ST2 and ST3 exhibit more moderate settlements and smaller settlement rates. When loaded to 12.48–24.96 kPa, the settlement in ST3 is smaller than that in ST2, and its curve lacks a distinct inflection point. Comparing the final settlements among the three conditions shows that ST2 has 36.35% less settlement than ST1, while ST3 has 10.37% less than ST2. Therefore, increasing the thickness of the sand layer leads to a higher stone column bearing capacity—a finding consistent with numerical studies on layered soil systems [24].
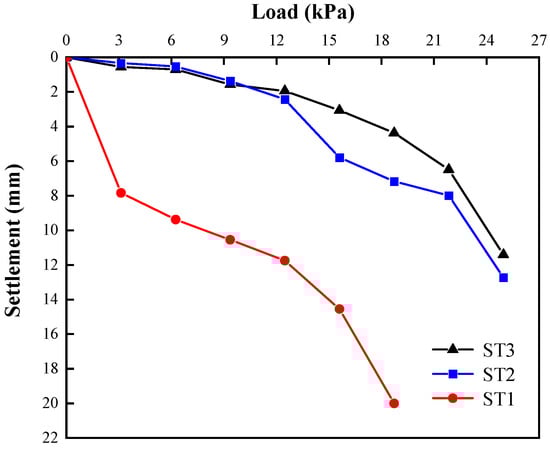
Figure 3.
Load–settlement curves for different layer thicknesses (ST1: sand layer thickness = 50 mm; ST2: 75 mm; ST3: 100 mm).
Figure 4 shows the load–settlement curves for the columns in upper sand–lower clay (SL1) and upper clay–lower sand (SL2). With incremental loading, the settlement–load relationships differ significantly between these two layering schemes. The column in SL2 undergoes an abrupt increase in settlement (the reasons for this behavior will be discussed in Section 3.2), indicating a lower bearing capacity. Under a load of 8.19 kPa, the settlement in SL1 is 0.70 mm, whereas it reaches 13.51 mm in SL2. Thus, for the same load level, the settlement is obviously smaller in SL1. When comparing the final settlements, SL1 has 42.95% less settlement than SL2. Consequently, stone columns perform better in situations where the upper layer has a higher strength, i.e., the upper layer is sand and the lower layer is clay.

Figure 4.
Load–settlement curves for different layer distributions (SL1: upper sand and lower clay; SL2: upper clay and lower sand).
Figure 5 compares the load–settlement curves for different aggregate gradations for the stone columns. Starting from the fifth load step, at the same load level, the settlement of the columns with Gradations 1 and 2 is 22.68–211.61% larger than those with Gradation 3. Compared with Gradation 1 (with a smaller coefficient of uniformity and friction angle), Gradation 3 (with a larger uniformity coefficient and friction angle) shows a marked advantage in bearing capacity. When comparing the final settlements, SG2 is 8.85% lower than SG1, and SG3 is 25.87% lower than SG2. Thus, a stone column with a larger uniformity coefficient and friction angle more effectively develops its bearing capacity and overall stiffness.
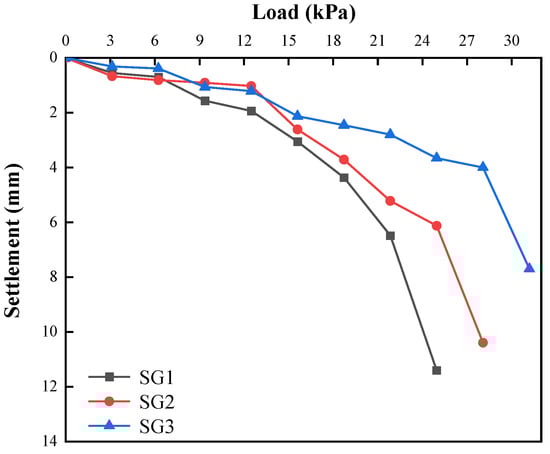
Figure 5.
Load–settlement curves for different filler gradations (SG1: Gradation 1; SG2: Gradation 2; SG3: Gradation 3).
3.2. Failure Modes and Bulging Deformation
Based on the images captured during loading, two major failure modes were identified:
- (1)
- Bulging failure in the clay layer caused by the downward penetration of the column through the sand layer:
For columns in the upper sand–lower clay configuration, bulging appears in the zone below the column top, as well as the upper portion of the clay layer. The maximum bulging occurs within 0–2 column diameters from the top of the clay layer. Eventually, the pile fails by bulging in the clay layer and intrusion from the sand layer, as seen in Figure 6.
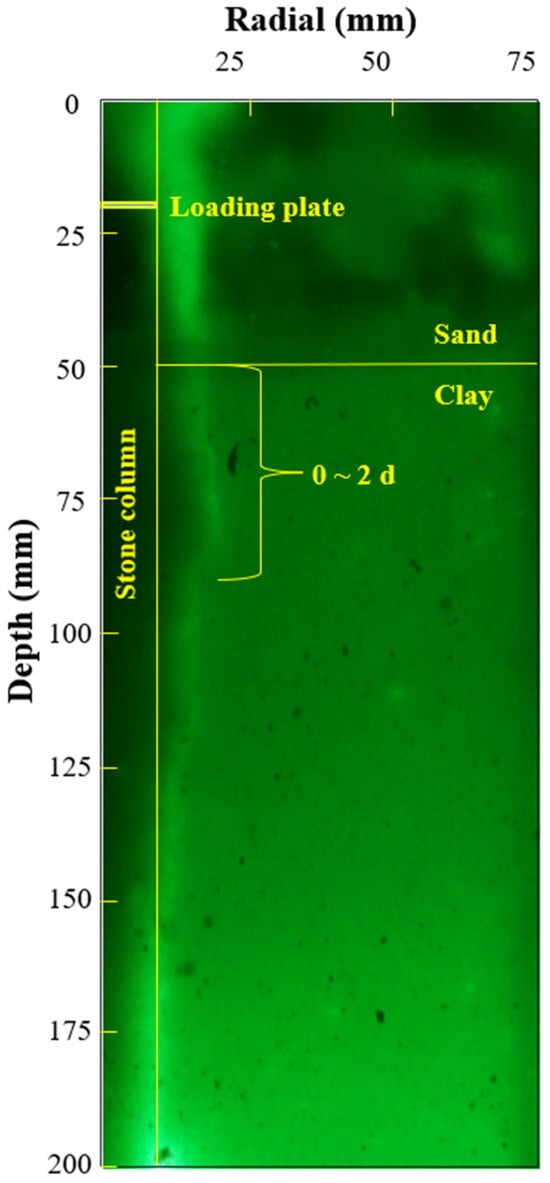
Figure 6.
Bulging failure in upper sand–lower clay.
- (2)
- Bulging failure at the column top:
For columns in the upper clay–lower sand configuration, bulging occurs in the top region (0–2.5 column diameters), with the maximum bulging in the 1–2 column diameter zone below the column head. As the top settlement grows excessive, the pile ultimately fails, as shown in Figure 7.
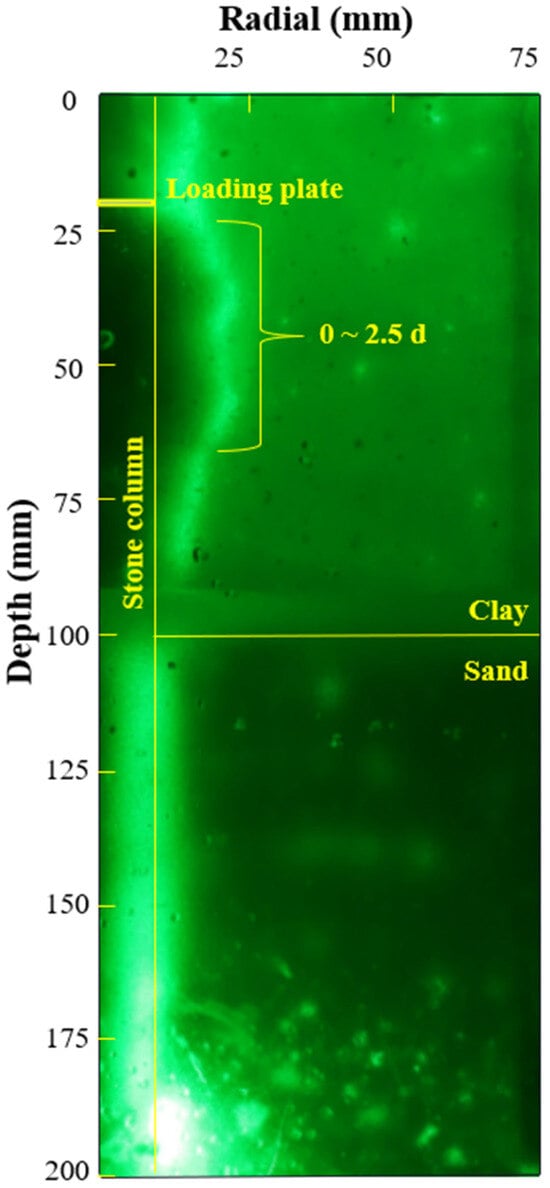
Figure 7.
Bulging failure in upper clay–lower sand.
Under all tested conditions, the column failed due to significant bulging in the clay layer. Further analysis was performed using PIVview2C (version 3.0.3) to quantify the bulging at various depths. Several measuring points were placed every 5 mm along the column–soil interface, recording their lateral displacement to capture the bulging at each depth.
Figure 8 shows the final bulging profiles along the column length under different layer thicknesses. In all three cases, the bulging is prominent within one column diameter below the top of the clay layer, and the maximum bulge appears in the clay. It is observed that the three groups of curves exhibit distinct bulging deformation positions. Specifically, ST1 initiates bulging deformation at approximately 25 mm in depth, ST2 at approximately 50 mm in depth, and ST3 undergoes two bulging events at approximately 40 mm and 90 mm in depth. Considering the overlying sand layer thicknesses in the three tests—50 mm (ST1), 75 mm (ST2), and 100 mm (ST3)—it is evident that the onset of the bulging deformation correlates with the sand layer thickness. This behavior is attributed to the higher strength of the sand layer, which provides enhanced lateral confinement, thereby suppressing significant bulging deformation within this stratum. For the cases with thinner sand layers (e.g., ST1 and ST2), once the load transfers to the underlying clay layer, the reduced confinement leads to pronounced bulging. Due to the influence of the internal friction angles of both the soil and stone column fills, this deformation propagates upward within a zone of approximately one column diameter above the soil interface. Consequently, bulging initiates near one pile diameter above the interface in ST1 and ST2. In contrast, ST3 demonstrates a unique response: the thicker sand layer allows the stone column to experience shear failure within the upper sand stratum under the applied loading, resulting in an initial bulging at 40 mm depth, governed by the fill’s friction angle and sand layer strength. The secondary bulging at 90 mm in depth aligns with the mechanism observed in ST1 and ST2, driven by the reduced confinement in the clay layer.
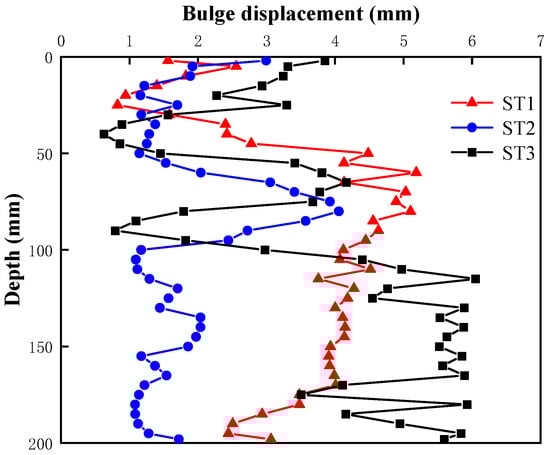
Figure 8.
Bulging profiles for different layer thicknesses (ST1: sand layer thickness = 50 mm; ST2: 75 mm; ST3: 100 mm).
Among the three cases, the largest maximum bulge is in ST3, followed by ST1, then ST2, indicating that peak bulging does not always correlate directly with the bearing capacity. On one hand, bulging increases the passive earth pressure around the column, thus increasing the frictional resistance; on the other hand, excessive bulging may cause the soil around the column to enter a plastic state and reduce the friction. Large lateral deformations also cause substantial column settlement, leading to final failure. Crucially, the load–settlement trends (Figure 3) reveal a nonlinear relationship: increasing the sand thickness from 50 mm to 75 mm reduces the settlement by 60%, while further thickening to 100 mm yields only 47% in additional reduction under 15 kPa. The stabilization coincides with the partial mobilization of sand–column interaction, as evidenced by the emerging lateral strains in the sand layers beyond 75 mm in thickness (Figure 8). These observations suggest an optimal thickness ratio (h1/h2 ≈ 0.6, where h1 and h2 denote the thicknesses of the sand layer and clay layer, respectively), balancing the settlement control and constructability. Regardless of the sand layer thickness, the maximum column bulge consistently appears within about one column diameter below the soil interface. Hence, in real projects, additional measures can be considered in this zone for reinforcement or confinement.
Figure 9 shows the final bulging profiles under different layer distributions. In the upper sand–lower clay (SL1), bulging occurs in the lower layer as the column penetrates into the clay. In contrast, for the upper clay–lower sand (SL2), appreciable bulging occurs only near the column top, and the deeper sand layer or even the lower half of the clay layer do not develop significant frictional resistance before excessive settlement occurs. This leads to a notably lower bearing capacity in SL2.
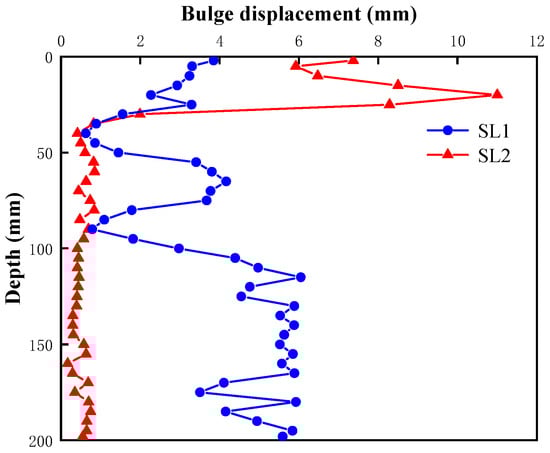
Figure 9.
Bulging profiles for different layer distributions (SL1: upper sand and lower clay; SL2: upper clay and lower sand).
Figure 10 compares the final bulging profiles under different aggregate gradations for the stone columns. Columns with larger uniformity coefficients show more uniform bulging along the shaft and a smaller maximum bulge. In SG3, only a relatively small lateral deformation is needed to attain a good overall compaction degree, contributing to the higher bearing capacity and stability. Regarding the locations of the bulging deformations, SG2 exhibits a pattern similar to SG1 (ST3). As previously described, the first bulging deformation occurs within the sand layer at approximately 45 mm in depth, while the second deformation initiates near the soil interface at approximately 80 mm in depth. Although the positions of the maximum bulging and initial deformation of these two columns are comparable, slight discrepancies arise due to differences in the load levels at column failure. In contrast, SG3 demonstrates distinct behavior. Benefiting from its well-graded fill material, which provides enhanced shear strength, the stone column in SG3 does not undergo a complete failure even under the ultimate load. Consequently, its bulging deformation remains minimal and uniformly distributed along the column length, with no distinct peak observed. Therefore, optimizing the stone column gradation to include a wider range of particle sizes not only improves the overall packing and stiffness, but also helps prevent excessive local bulging.

Figure 10.
Bulging profiles for aggregate gradations (SG1: Gradation 1; SG2: Gradation 2; SG3: Gradation 3).
3.3. Load Transfer
A single column’s vertical bearing capacity is primarily carried by two components: the shaft resistance along the column–soil interface, and the end resistance from the column tip. Following findings on the end-bearing ratios of rigid piles [25], a load transfer factor α was introduced to quantify the ratio of the stress transmitted to the column base. It is defined as follows:
where is the stress at the column top, is the stress at the column base, and is the total load at the top.
Figure 11 depicts the variations in α under different layer thicknesses. Overall, α decreases as the sand thickness increases. In ST1, α initially rises sharply after the second load level, then stabilizes around 0.15. This matches the steep slope in the load–settlement curve (Figure 2) from the first to second load steps, indicating limited shaft resistance during early loading, causing more load to be transmitted to the column tip. In ST2 and ST3, α remains stable throughout loading: 0.04–0.08 in ST2 and 0.03–0.06 in ST3. This suggests that the shaft resistance is fully mobilized over the entire loading process.
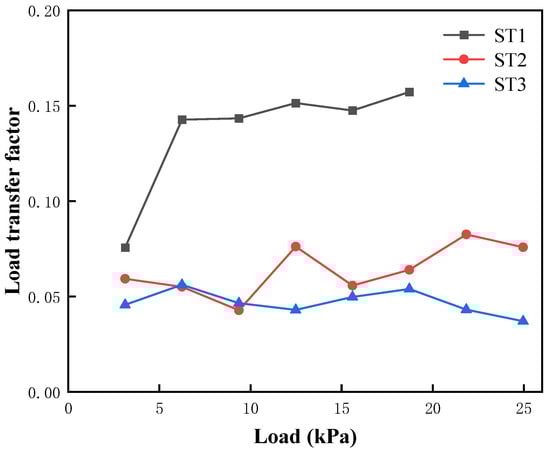
Figure 11.
Load transfer factors for different layer thicknesses (ST1: sand layer thickness = 50 mm; ST2: 75 mm; ST3: 100 mm).
Numerically, the average load transfer factors for ST1, ST2, and ST3 are , , and , respectively. All are less than 0.5, indicating that under the conditions tested, most of the load is carried by shaft friction rather than end bearing. Moreover, as the sand thickness grows, the stone column can develop a greater bearing capacity and α gets smaller, showing that the enhancement of the column bearing capacity mainly results from the shaft friction. When the sand layer is too thin (as in ST1), a large portion of the load is prematurely transferred into the clay. This triggers bulging in the soft clay and undermines the stable shaft resistance, ultimately reducing the column capacity.
Figure 12 shows the evolution of α under different layer distributions. In SL1, , whereas in SL2, . The average α of SL2 is higher and generally increases with loading, which is due to the delayed shaft resistance mobilization. The underlying sand layer’s high stiffness restricts the clay-to-column stress transfer, forcing gradual end-bearing engagement as the clay weakens. After the fourth load increment, it drops slightly, indicating that the shaft friction in the lower part of the sand layer starts contributing. Nonetheless, α eventually continues to grow with loading, signifying that in the upper clay–lower sand (SL2), the column side friction does not mobilize as stably as in SL1, leading to a lower overall bearing capacity compared with SL1.

Figure 12.
Load transfer factors for different layer distributions (SL1: upper sand and lower clay; SL2: upper clay and lower sand).
Figure 13 compares α under different aggregate gradations. From Gradation 1 to Gradation 3, the coefficient of uniformity and the friction angle both increase. The mean α values are , and Thus, a larger coefficient of uniformity and friction angle help reduce the proportion of the load carried by the pile tip, increase the contribution of the side friction, and enhance the column capacity. Notably, show a clear downward trend throughout loading, indicating that the columns with better gradation (larger uniformity coefficients and friction angles) stabilize more quickly after bulging, enabling earlier and more extensive side friction mobilization, which in turn increases the bearing capacity.
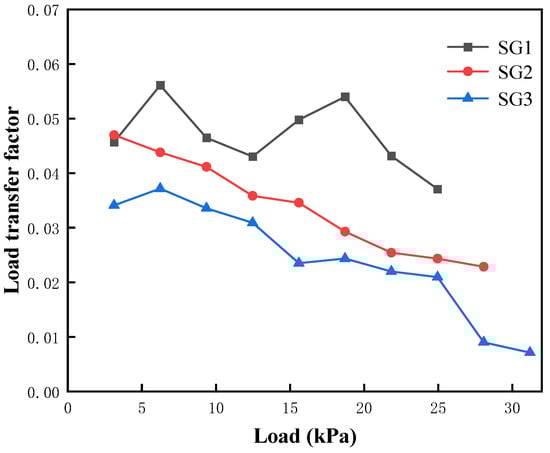
Figure 13.
Load transfer factors for different aggregate gradations (SG1: Gradation 1; SG2: Gradation 2; SG3: Gradation 3).
4. Bearing Capacity Calculation Method for Stone Columns in Stratified Soil
4.1. Calculation Model and Basic Assumptions
Based on the laboratory model test, stone columns in layered soils (upper sand–lower clay) fail predominantly via bulging in the soft layers. Accordingly, the derivation below is based on the bulging failure. For simplicity, the following assumptions are made:
- (1)
- Under vertical loading, the bearing capacity of the stone column follows the Mohr–Coulomb failure criterion. The effect of the layered soil is considered by assuming the bulging failure takes place in the clay layer.
- (2)
- The circumferential stress and shear resistance at the column–soil interface are simplified.
With these assumptions, the calculation model is shown in Figure 14. In this figure, is the column top stress, is the radial thrust by the stone particles, is the self-weight stress of the column, is the column length in the sand layer, is the failure length in the clay layer, R is the column radius, δ is the angle between the failure surface and the horizontal, and are the unit weights of the sand and clay, respectively, is the undrained shear strength of the clay, and is the angle between the column’s failure surface and the horizontal. According to the assumption, , where is the internal friction angle of the stone infill.
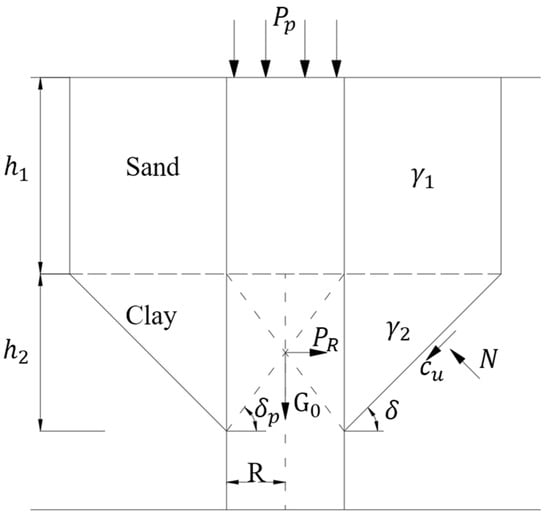
Figure 14.
Calculation model for stone column in upper sand–lower clay.
4.2. Bearing Capacity Formula Considering Self-Weight
By the equilibrium of forces in the failing portion of the clay layer,
where is the area on which acts (the lateral surface of the pile within ), is the area of the clay failure surface, and is the weight of the soil (both clay and upper sand) above the failure surface projected onto that surface. Geometric considerations yield the following:
Substituting Equations (3)–(5) into Equation (2) gives
Considering the self-weight of the column,
Substituting Equations (6) and (8) into Equation (7) yields the following:
Taking the derivative with respect to δ and setting provides the angle that maximizes . Consequently, the angle (related to ) can be solved from the following:
Once , , , and the undrained shear strength are known, (the angle of the failure surface in the clay) can be found, and then can be obtained. The ultimate bearing capacity of the stone column is as follows:
The above derivation is based on the bulging failure mode observed in layered soils with an upper sand layer and a lower soft clay layer. It accounts for the self-weight of both the column and the surrounding soil. This formula applies when the stone infill friction angle lies in the range of 35–43°, the ratio of the upper sand layer thickness to the lower soft layer thickness is between 0.33 and 1.66, and the ratio of the column diameter to the upper sand layer thickness ranges from 0.2 to 0.4.
4.3. Engineering Verification
To verify the proposed formula, it was applied to stone columns in the Yingliangbao Hydropower Station project. Four test columns were subjected to static load tests. The soil profile from top to bottom is as follows: (1) a gravel layer (10 m thick, a density of 2.24 g/cm3, an undrained shear strength of 60 kPa), (2) a fine-grained sediment layer (10 m thick, a density of 1.99 g/cm3, an undrained shear strength of 15 kPa), (3) another gravel layer (20 m thick, a density of 2.31 g/cm3, an undrained shear strength of 60 kPa), (4) a fine-grained fill layer (20 m thick, a density of 1.89 g/cm3, an undrained shear strength of 18 kPa), and (5) a gravelly layer (50 m thick, a density of 2.33 g/cm3, an undrained shear strength of 65 kPa).
The four stone columns—S1, S2, S3, and S4—have the following parameters:
S1: length—23.8 m, diameter—1.3 m.
S2: length—21.4 m, diameter—1.3 m.
S3: length—21.4 m, diameter—1.3 m.
S4: length—21.4 m, diameter—1.1 m.
All columns have a unit weight of 26.487 kN/m3 and an internal friction angle of 38.66°.
The field static load tests showed that the failure planes for all columns were confined to the first soil layer. Thus, the parameters for the calculation are = 60 kPa, = 64, and = 27 kN/m3. Substituting these into Equations (10) and (11) yields the ultimate bearing capacity predicted by the proposed method. Figure 15 compares the proposed method with the field test results and the other existing methods [11,26,27,28]. The relative errors between the calculation methods and the measured results are summarized in Table 5. The proposed formula, which explicitly accounts for the column and soil self-weights and bulging in the soft layer, delivers more accurate bearing capacity estimates and aligns better with the actual measurements. Therefore, it provides a theoretically sound basis for stone column design.
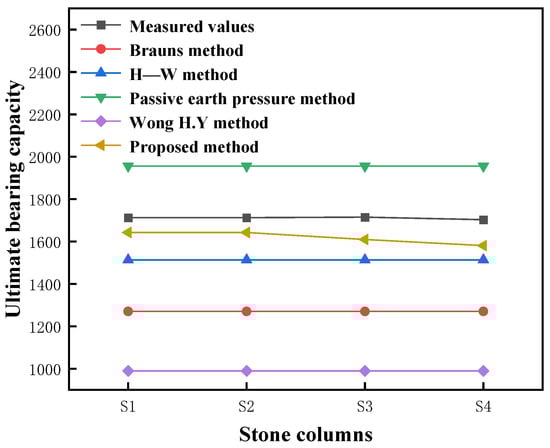
Figure 15.
Comparison of calculated and measured bearing capacities of stone columns [11,26,27,28].
Table 5.
Discrepancies in bearing capacity calculations for stone columns.
It should be noted that the proposed methodology is primarily applicable to stone columns in sand-over-clay layered systems where failure is governed by bulging deformation within the soft clay layers. The formulation assumes the dominance of clay plasticity over interfacial shear resistance, as validated in the scenarios where the sand overburden stiffness does not significantly constrain the clay layer yielding. For conditions involving stiff sand overburdens or complex multi-layered clay sequences, supplementary numerical modeling is recommended to account for advanced soil–structure interactions.
5. Conclusions
In this study, a series of laboratory tests on single stone columns in layered transparent soil were conducted. The tests examined the load–settlement behaviors, failure modes, bulging deformations, and load transfer patterns, focusing on the effects of the sand layer thicknesses, layer distributions, and column gradations. A new bearing capacity formula is also proposed. The main conclusions are as follows:
- (1)
- In an upper sand–lower clay configuration, the stone column bulges in the lower clay layer after penetrating downward from the sand layer. As the sand layer thickness increases, pronounced bulging may also occur in the sand, activating greater shaft friction and improving the column’s overall bearing capacity. Under the tested conditions, stone columns perform better if the thickness ratio of the upper sand to the lower clay exceeds approximately 0.6.
- (2)
- In an upper clay–lower sand configuration, bulging often initiates at the column top, with the maximum bulging at 1–2 column diameters below the top. In this case, the bearing capacity is noticeably lower, demonstrating that stone columns are more suitable when the upper layer is relatively strong.
- (3)
- Higher uniformity coefficients and friction angles in the stone infills favor faster post-bulging stabilization. This results in a higher bearing capacity and a better overall stiffness. Therefore, optimizing the stone infill gradation to include a wide range of particle sizes not only increases the bearing capacity, but also mitigates excessive local bulging.
- (4)
- The proposed bearing capacity calculation method accounts for the self-weights of the stone column and surrounding soil. Compared with conventional approaches, the revised formula yields predictions that are closer to the field test data, with a maximum discrepancy within 10%. Under specific conditions, this approach can guide the engineering design of stone columns in layered soils.
While the transparent soil system successfully captures the failure mechanisms in layered soils, its synthetic composition precludes the long-term physicochemical processes inherent to natural clays. Future studies should integrate multi-scale modeling with field instrumentation to bridge the laboratory observations and prototype behaviors, particularly for time-dependent settlements and micro-scale soil–column interactions.
Author Contributions
Conceptualization: J.L. and Y.W. Methodology: J.L., Y.W. and Y.Z. Software: Y.Z. and J.R. Validation: Y.Z. and Y.W. Formal analysis: J.L., Y.Z. and Y.W. Investigation: J.L. Resources: Y.W. and Y.Z. Data curation: J.L. and L.Z. Writing—original draft preparation: J.L. and Y.Z. Writing—review and editing: Y.W. Visualization: Y.Z. and Z.W. Supervision: Y.W. Project administration: J.L. Funding acquisition: Y.W. All authors have read and agreed to the published version of the manuscript.
Funding
This work was supported in part by the National Natural Science Foundation of China under Grant 52378337.
Data Availability Statement
The data presented in this study are available in the article.
Conflicts of Interest
The authors declare no conflicts of interest.
References
- Demir, A.; Sarici, T. Bearing Capacity of Footing Supported by Geogrid Encased Stone Columns on Soft Soil. Geomech. Eng. 2017, 12, 417–439. [Google Scholar] [CrossRef]
- El Sherbiny, E.M.; Wang, J.-T. Stone Column Strategies for Mitigating Liquefaction-Induced Uplift of Tunnels. Soil. Dyn. Earthq. Eng. 2024, 187, 108961. [Google Scholar] [CrossRef]
- Jamshidi Chenari, R.; Karimpour Fard, M.; Jamshidi Chenari, M.; Shamsi Sosahab, J. Physical and Numerical Modeling of Stone Column Behavior in Loose Sand. Int. J. Civ. Eng. 2019, 17, 231–244. [Google Scholar] [CrossRef]
- Van Impe, W.F.; Adhav, M.R.M.; Andercruyssen, J.P.V. Considerations in Stone Column Design. In Ground Improvement Geosystems Densification and Reinforcement; Conference Proceedings; Thomas Telford Publishing: London, UK, 1997; pp. 190–196. ISBN 978-0-7277-4761-7. [Google Scholar]
- Pal, S.; Deb, K. Effect of Stiffness of Stone Column on Drainage Capacity during Soil Liquefaction. Int. J. Geomech. 2018, 18, 04018003. [Google Scholar] [CrossRef]
- Sivakumar, V.; McKelvey, D.; Graham, J.; Hughes, D. Triaxial Tests on Model Sand Columns in Clay. Can. Geotech. J. 2011, 41, 2. [Google Scholar] [CrossRef]
- Shivashankar, R.; Dheerendra Babu, M.R.; Nayak, S.; Rajathkumar, V. Experimental Studies on Behaviour of Stone Columns in Layered Soils. Geotech. Geol. Eng. 2011, 29, 749–757. [Google Scholar] [CrossRef]
- Kim, B.-I.; Lee, S.-H. Comparison of Bearing Capacity Characteristics of Sand and Gravel Compaction Pile Treated Ground. KSCE Int. J. Civ. Eng. 2005, 9, 197–203. [Google Scholar] [CrossRef]
- Ali, K.; Shahu, J.; Sharma, K. Geosynthetic Reinforced Stone Columns in Soft Soils: An Experimental and Analytical Study. In Proceedings of the 9th International Symposium on Lowland Technology, Saga, Japan, 29 September 2014. [Google Scholar]
- Fattah, M.Y.; Zabar, B.S.; Hassan, H.A. Experimental Analysis of Embankment on Ordinary and Encased Stone Columns. Int. J. Geomech. 2016, 16, 04015102. [Google Scholar] [CrossRef]
- Hughes, J.M.O.; Withers, N.J. Reinforcing of Soft Cohesive Soils with Stone Columns. Int. J. Rock. Mech. Min. Sci. Geomech. Abstr. 1974, 11, A234. [Google Scholar] [CrossRef]
- Muir Wood, D.; Hu, W.; Nash, D.F.T. Group Effects in Stone Column Foundations: Model Tests. Géotechnique 2000, 50, 689–698. [Google Scholar] [CrossRef]
- Shahu, J.T.; Reddy, Y.R. Clayey Soil Reinforced with Stone Column Group: Model Tests and Analyses. J. Geotech. Geoenviron. Eng. 2011, 137, 1265–1274. [Google Scholar] [CrossRef]
- Black, J.A.; Sivakumar, V.; Madhav, M.R.; Hamill, G.A. Reinforced Stone Columns in Weak Deposits: Laboratory Model Study. J. Geotech. Geoenviron. Eng. 2007, 133, 1154–1161. [Google Scholar] [CrossRef]
- McKelvey, D.; Sivakumar, V.; Bell, A.; Graham, J. Modelling Vibrated Stone Columns in Soft Clay. Proc. Inst. Civ. Eng. Geotech. Eng. 2004, 157, 137–149. [Google Scholar] [CrossRef]
- Gupta, S.; Kumar, S.; Pradeep, N.M.; Nishant, M. Behavior of an Embankment on Soft Ground Improved with Soil–Geopolymer Deep Mix Columns under Static and Cyclic Loadings. Int. J. Geomech. 2025, 25, 04024340. [Google Scholar] [CrossRef]
- Savvides, A.A.; Antoniou, A.A.; Markogiannakis, A. The Design of Tanks’ Settlement and Onshore Pipelines to Withstand Earthquake-Induced Geohazards and Difficult Site Conditions: Its Application in the Region of Kalochori, Thessaloniki, Greece. Geotechnics 2025, 5, 7. [Google Scholar] [CrossRef]
- Ezzein, F.M.; Bathurst, R.J. A Transparent Sand for Geotechnical Laboratory Modeling. Geotech. Test. J. 2011, 34, 590–601. [Google Scholar] [CrossRef]
- Guzman, I.L.; Iskander, M.; Suescun-Florez, E.; Omidvar, M. A Transparent Aqueous-Saturated Sand Surrogate for Use in Physical Modeling. Acta Geotech. 2014, 9, 187–206. [Google Scholar] [CrossRef]
- Kong, G.; Li, H.; Yang, G.; Cao, Z. Investigation on Shear Modulus and Damping Ratio of Transparent Soils with Different Pore Fluids. Granul. Matter 2018, 20, 8. [Google Scholar] [CrossRef]
- Tong, L.; Zhou, H.; Sheil, B. Multicore CPU-Based Parallel Computing Accelerated Digital Image Correlation for Large Soil Deformations Measurement. Comput. Geotech. 2024, 166, 106027. [Google Scholar] [CrossRef]
- Gao, L.; Dai, G.; Zhang, J.; Wan, Z.; Yao, Z.; Wang, Y. Centrifugal Model Tests on Lateral Cyclic Loading Behavior of Large-diameter Monopiles in Soft Clay. Rock Soil Mech. 2024, 45, 2411–2420. [Google Scholar] [CrossRef]
- Farah, R.E.; Nalbantoglu, Z. Behavior of Geotextile-Encased Single Stone Column in Soft Soils. Arab. J. Sci. Eng. 2020, 45, 3877–3890. [Google Scholar] [CrossRef]
- Kiruthika, P.; Banerjee, S.; Murali Krishna, A.; Boominathan, A. Performance of Stone Columns in Multi-Layered Soils System. In Proceedings of the Geo-Congress 2022, American Society of Civil Engineers, Charlotte, NC, USA, 17 March 2022; pp. 50–60. [Google Scholar]
- Ahmed, M.; Iskander, M. Evaluation of Tunnel Face Stability by Transparent Soil Models. Tunn. Undergr. Space Technol. 2012, 27, 101–110. [Google Scholar] [CrossRef]
- Brauns, J. Die Anfangstraglast von Schottersaeulen im Bindigen Untergrund. Die Bautechnik 1978, 8, 263–271. [Google Scholar]
- Wong, H.Y. Field Instrumentation of Vibroflotation Foundation; Elsevier: Amsterdam, The Netherlands, 1974; pp. 475–487. [Google Scholar]
- Peng, X.; Yang, S.; Wei, X. Study on a Calculation Model for Ultimate Bearing Capacity of Granular Piles Based on Improved Brauns’ Theory. J. China Foreign Highw. 2014, 34, 20–23. [Google Scholar] [CrossRef]
Disclaimer/Publisher’s Note: The statements, opinions and data contained in all publications are solely those of the individual author(s) and contributor(s) and not of MDPI and/or the editor(s). MDPI and/or the editor(s) disclaim responsibility for any injury to people or property resulting from any ideas, methods, instructions or products referred to in the content. |
© 2025 by the authors. Licensee MDPI, Basel, Switzerland. This article is an open access article distributed under the terms and conditions of the Creative Commons Attribution (CC BY) license (https://creativecommons.org/licenses/by/4.0/).