
Study on Load-Bearing Characteristics and Engineering Applications for Cement–Soil Pipe Pile


Abstract
1. Introduction
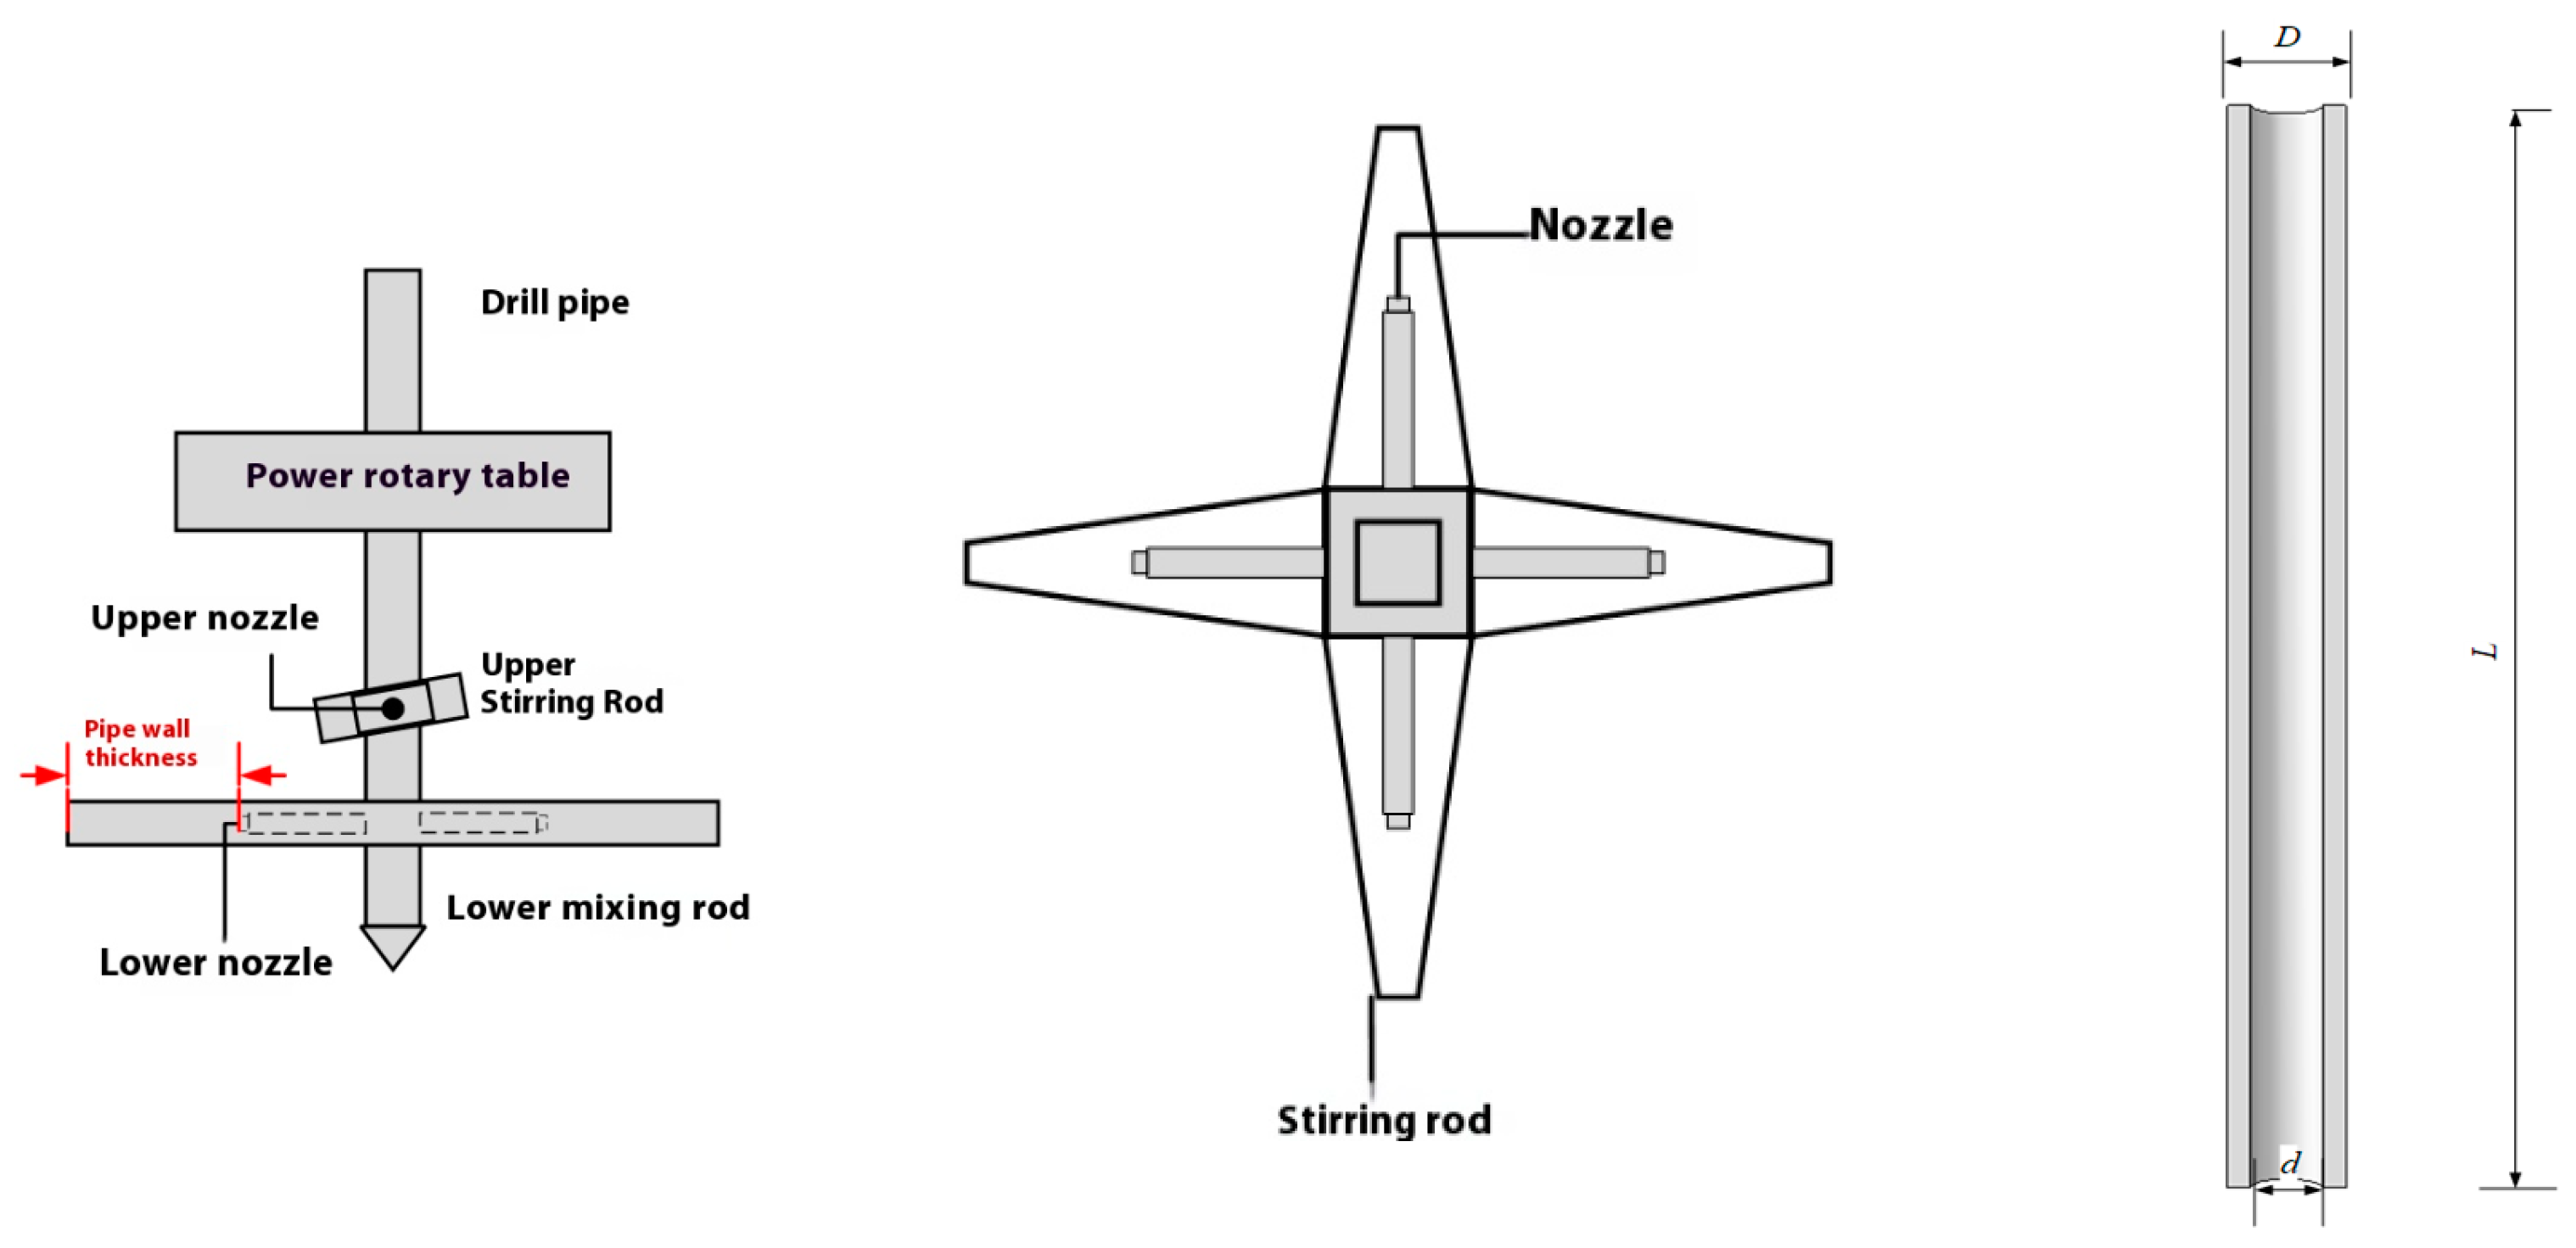
2. Field Experiment
- (1)
- The pipe pile should adopt a special pipe pile churning and spraying drill bit, and it is preferable to adopt the sinking drilling and spraying method as a priority.
- (2)
- When the driving pipe pile spraying and stirring bit sinks into the ground, start the high-pressure mud pump to supply cement slurry to the nozzle, and turn off the mud pump while drilling and spraying and stirring until the designed depth is reached; the value of the cement slurry spraying pressure is 10 Mpa–12 Mpa (adjusted according to the wall thickness).
- (3)
- Stirring and lifting at the same time, turn on the mud pump for re-spraying and re-stirring when it reaches a height of 2.5 m from the top of the pile. Stop the slurry after the drill is lifted to the ground elevation.
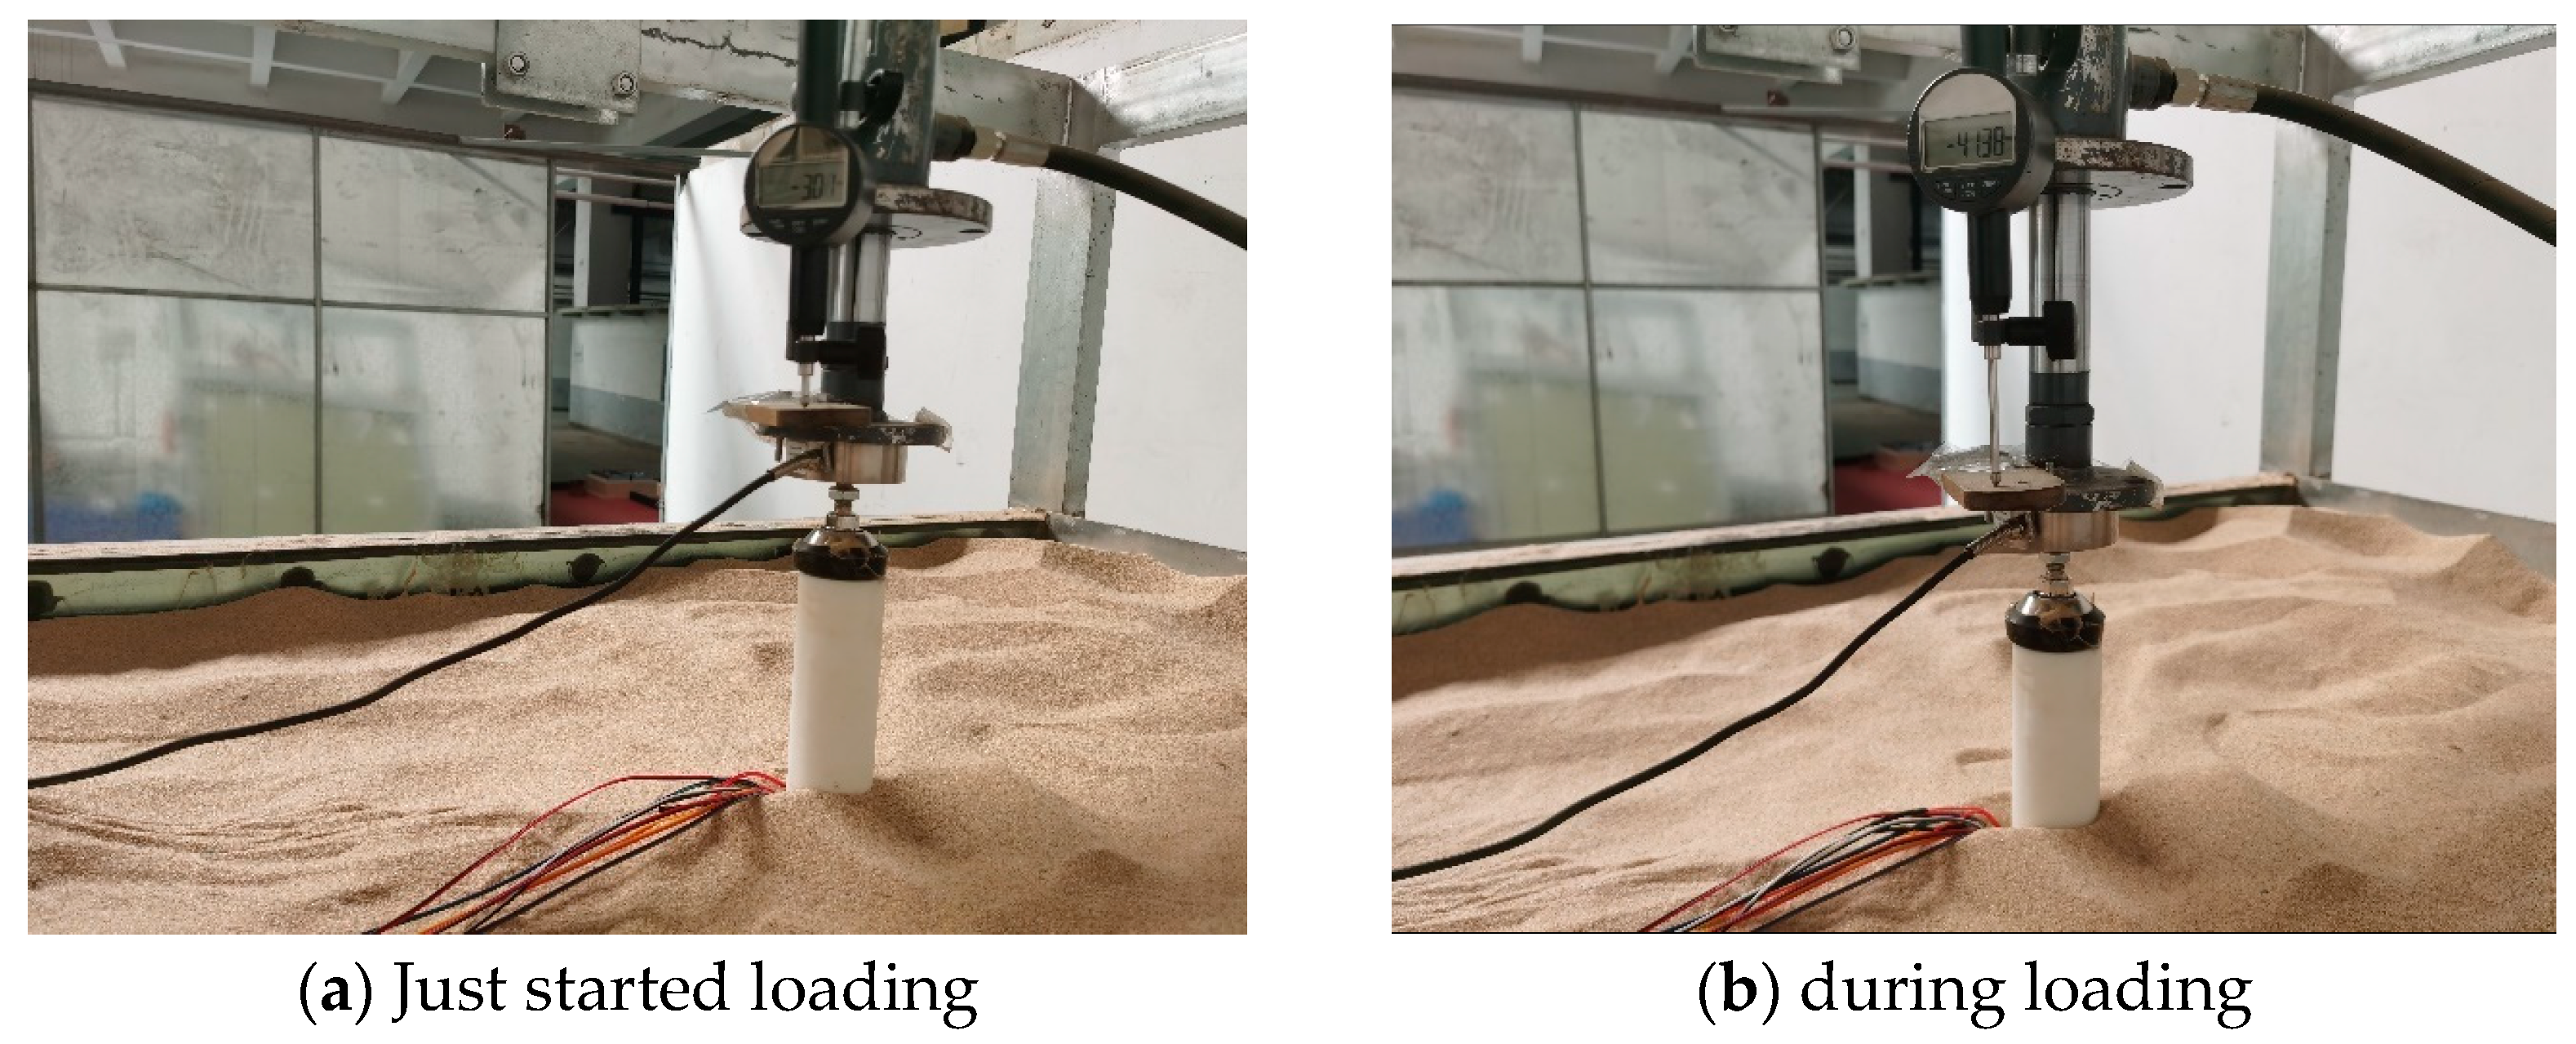
3. Physical Model Testing
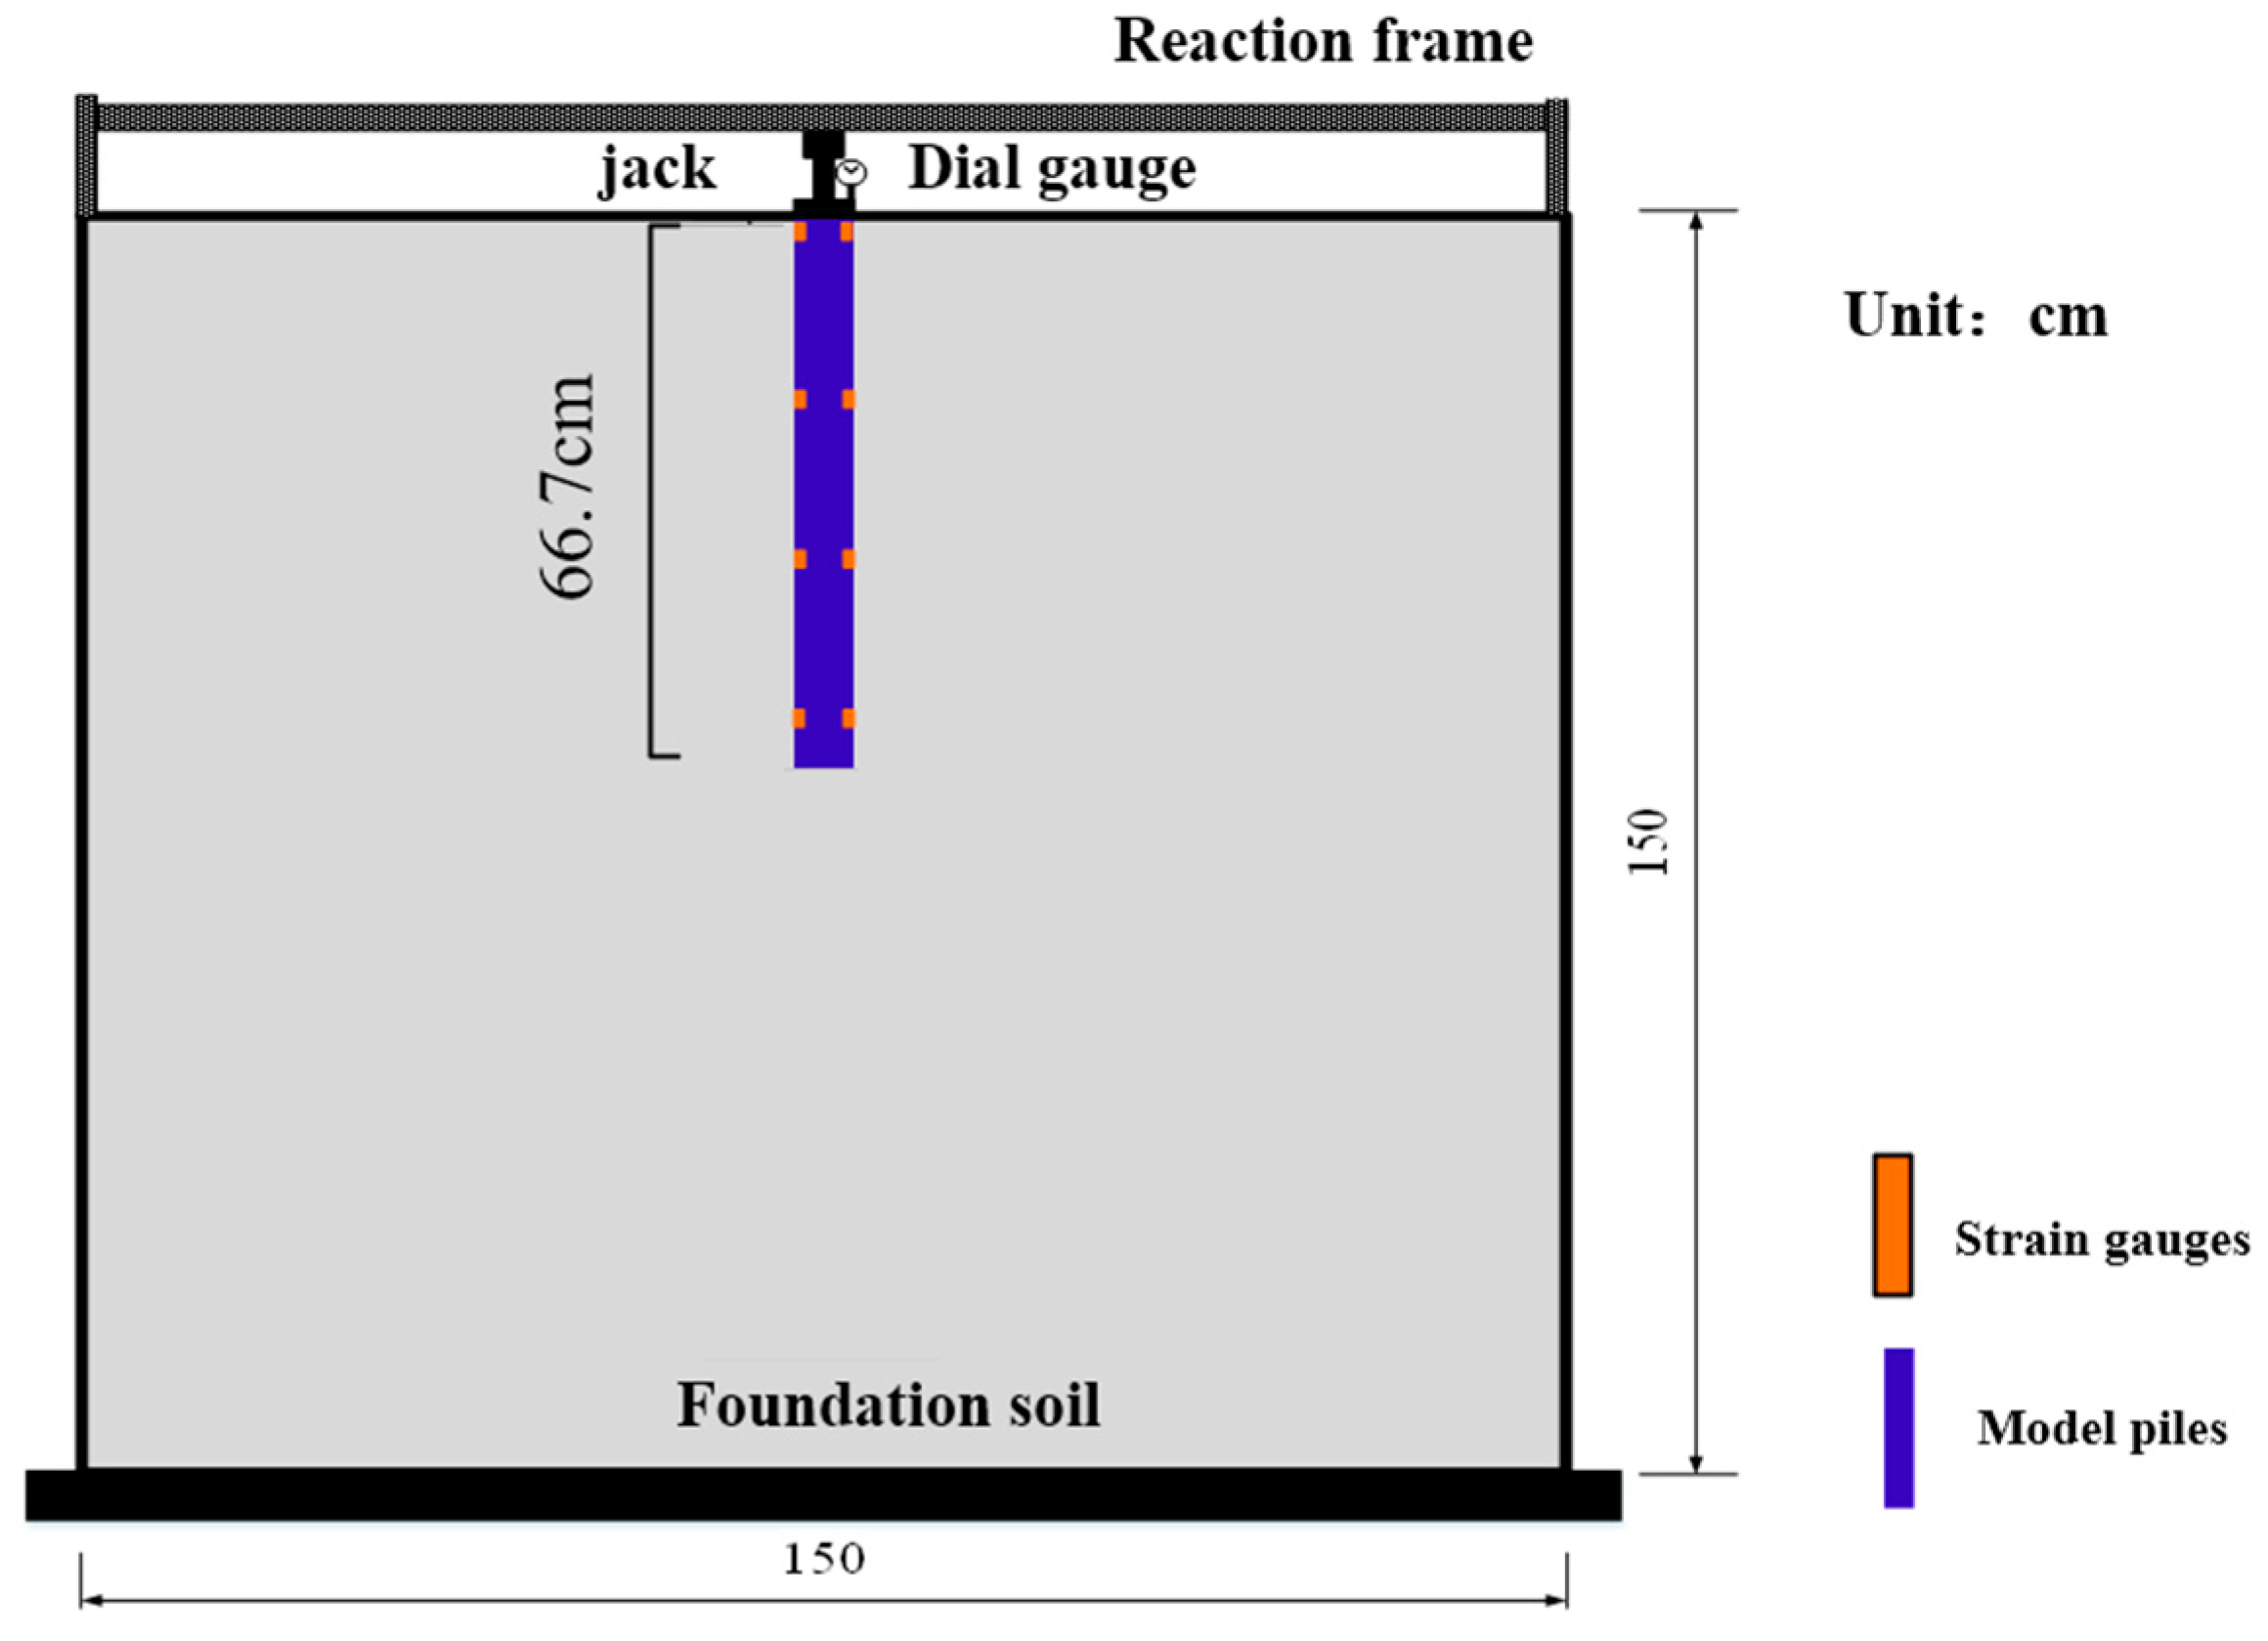
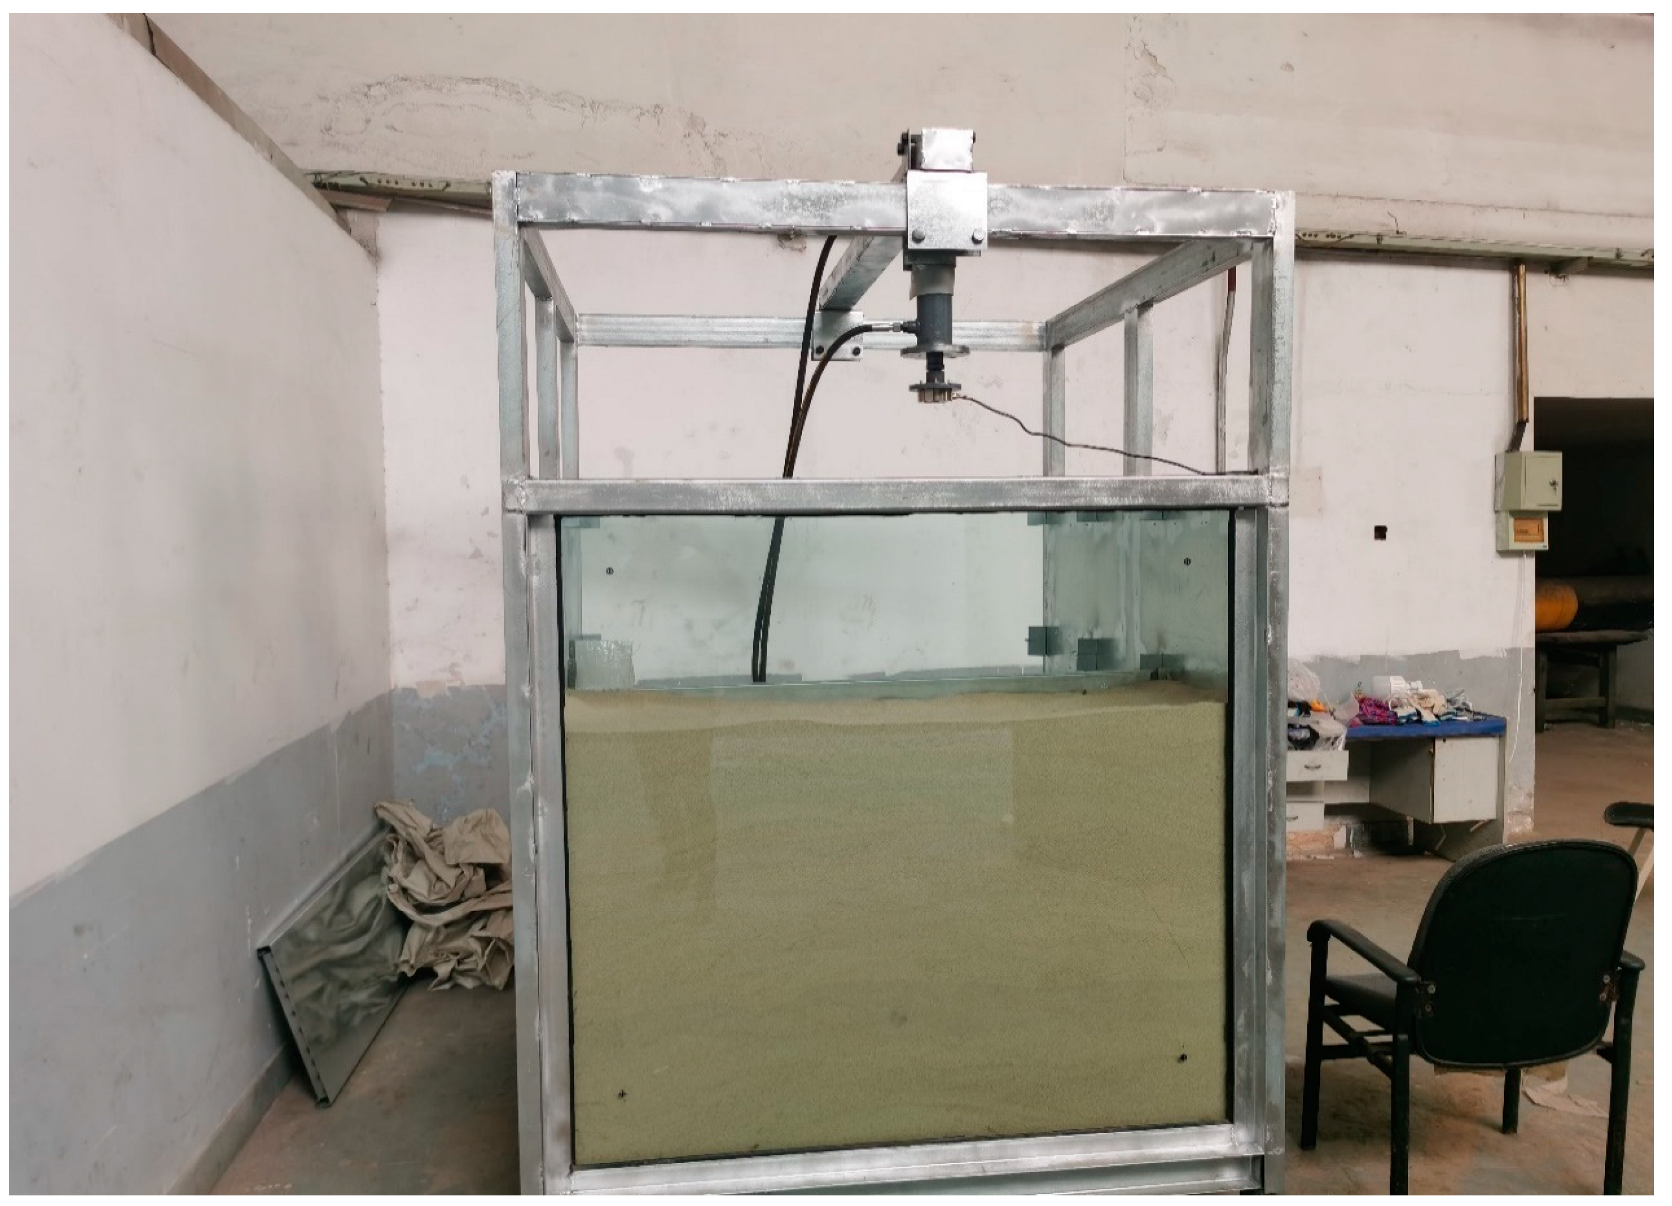
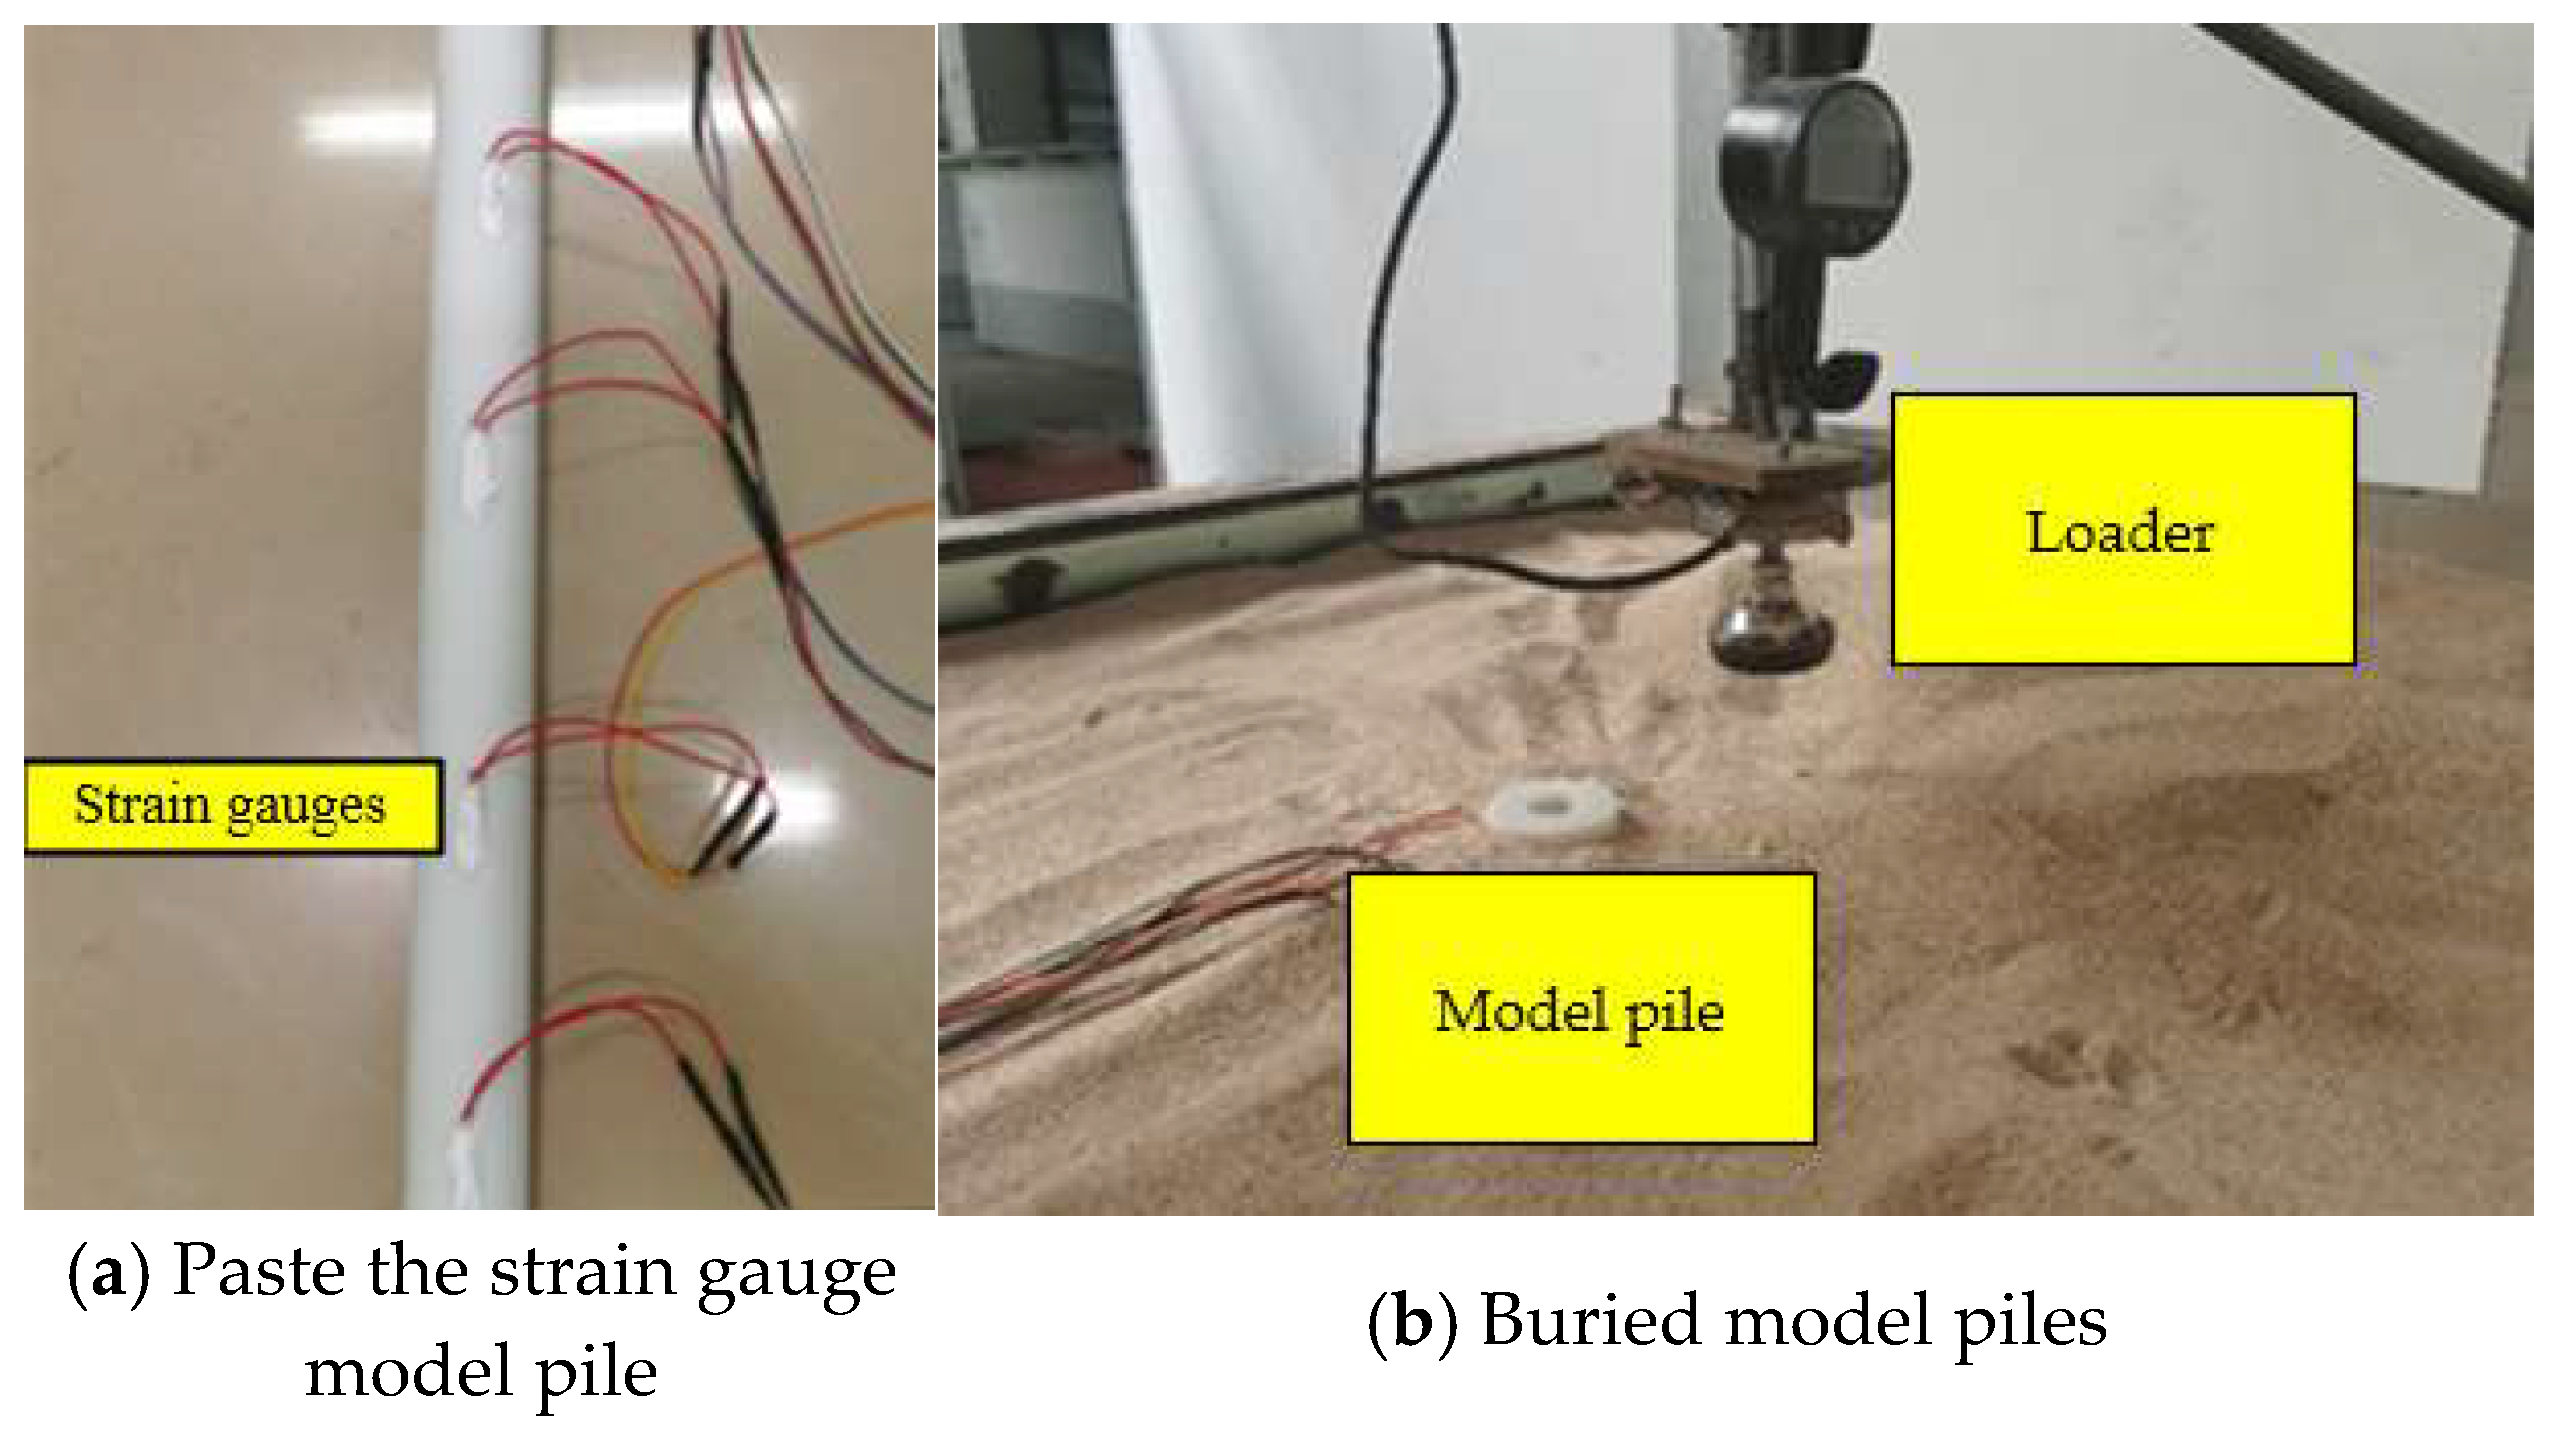
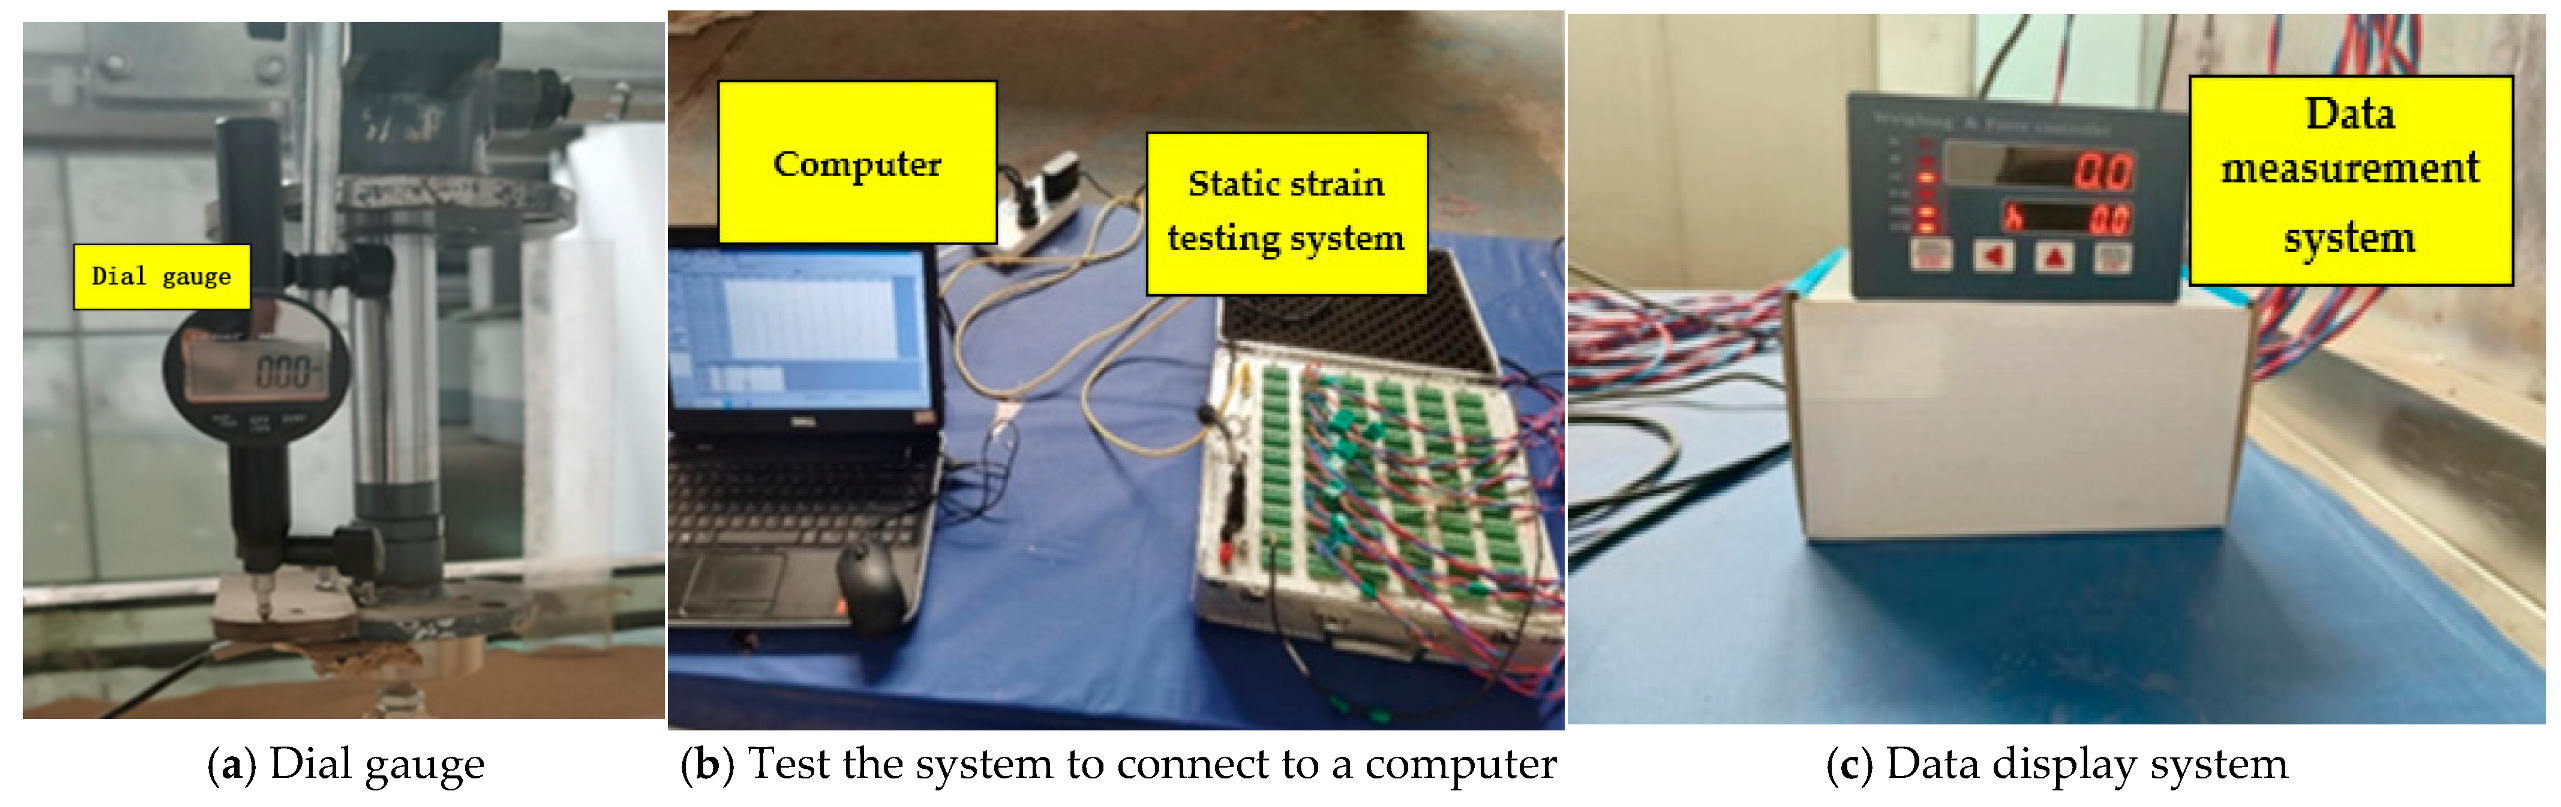
3.1. Model Testing System
3.2. Test Conditions
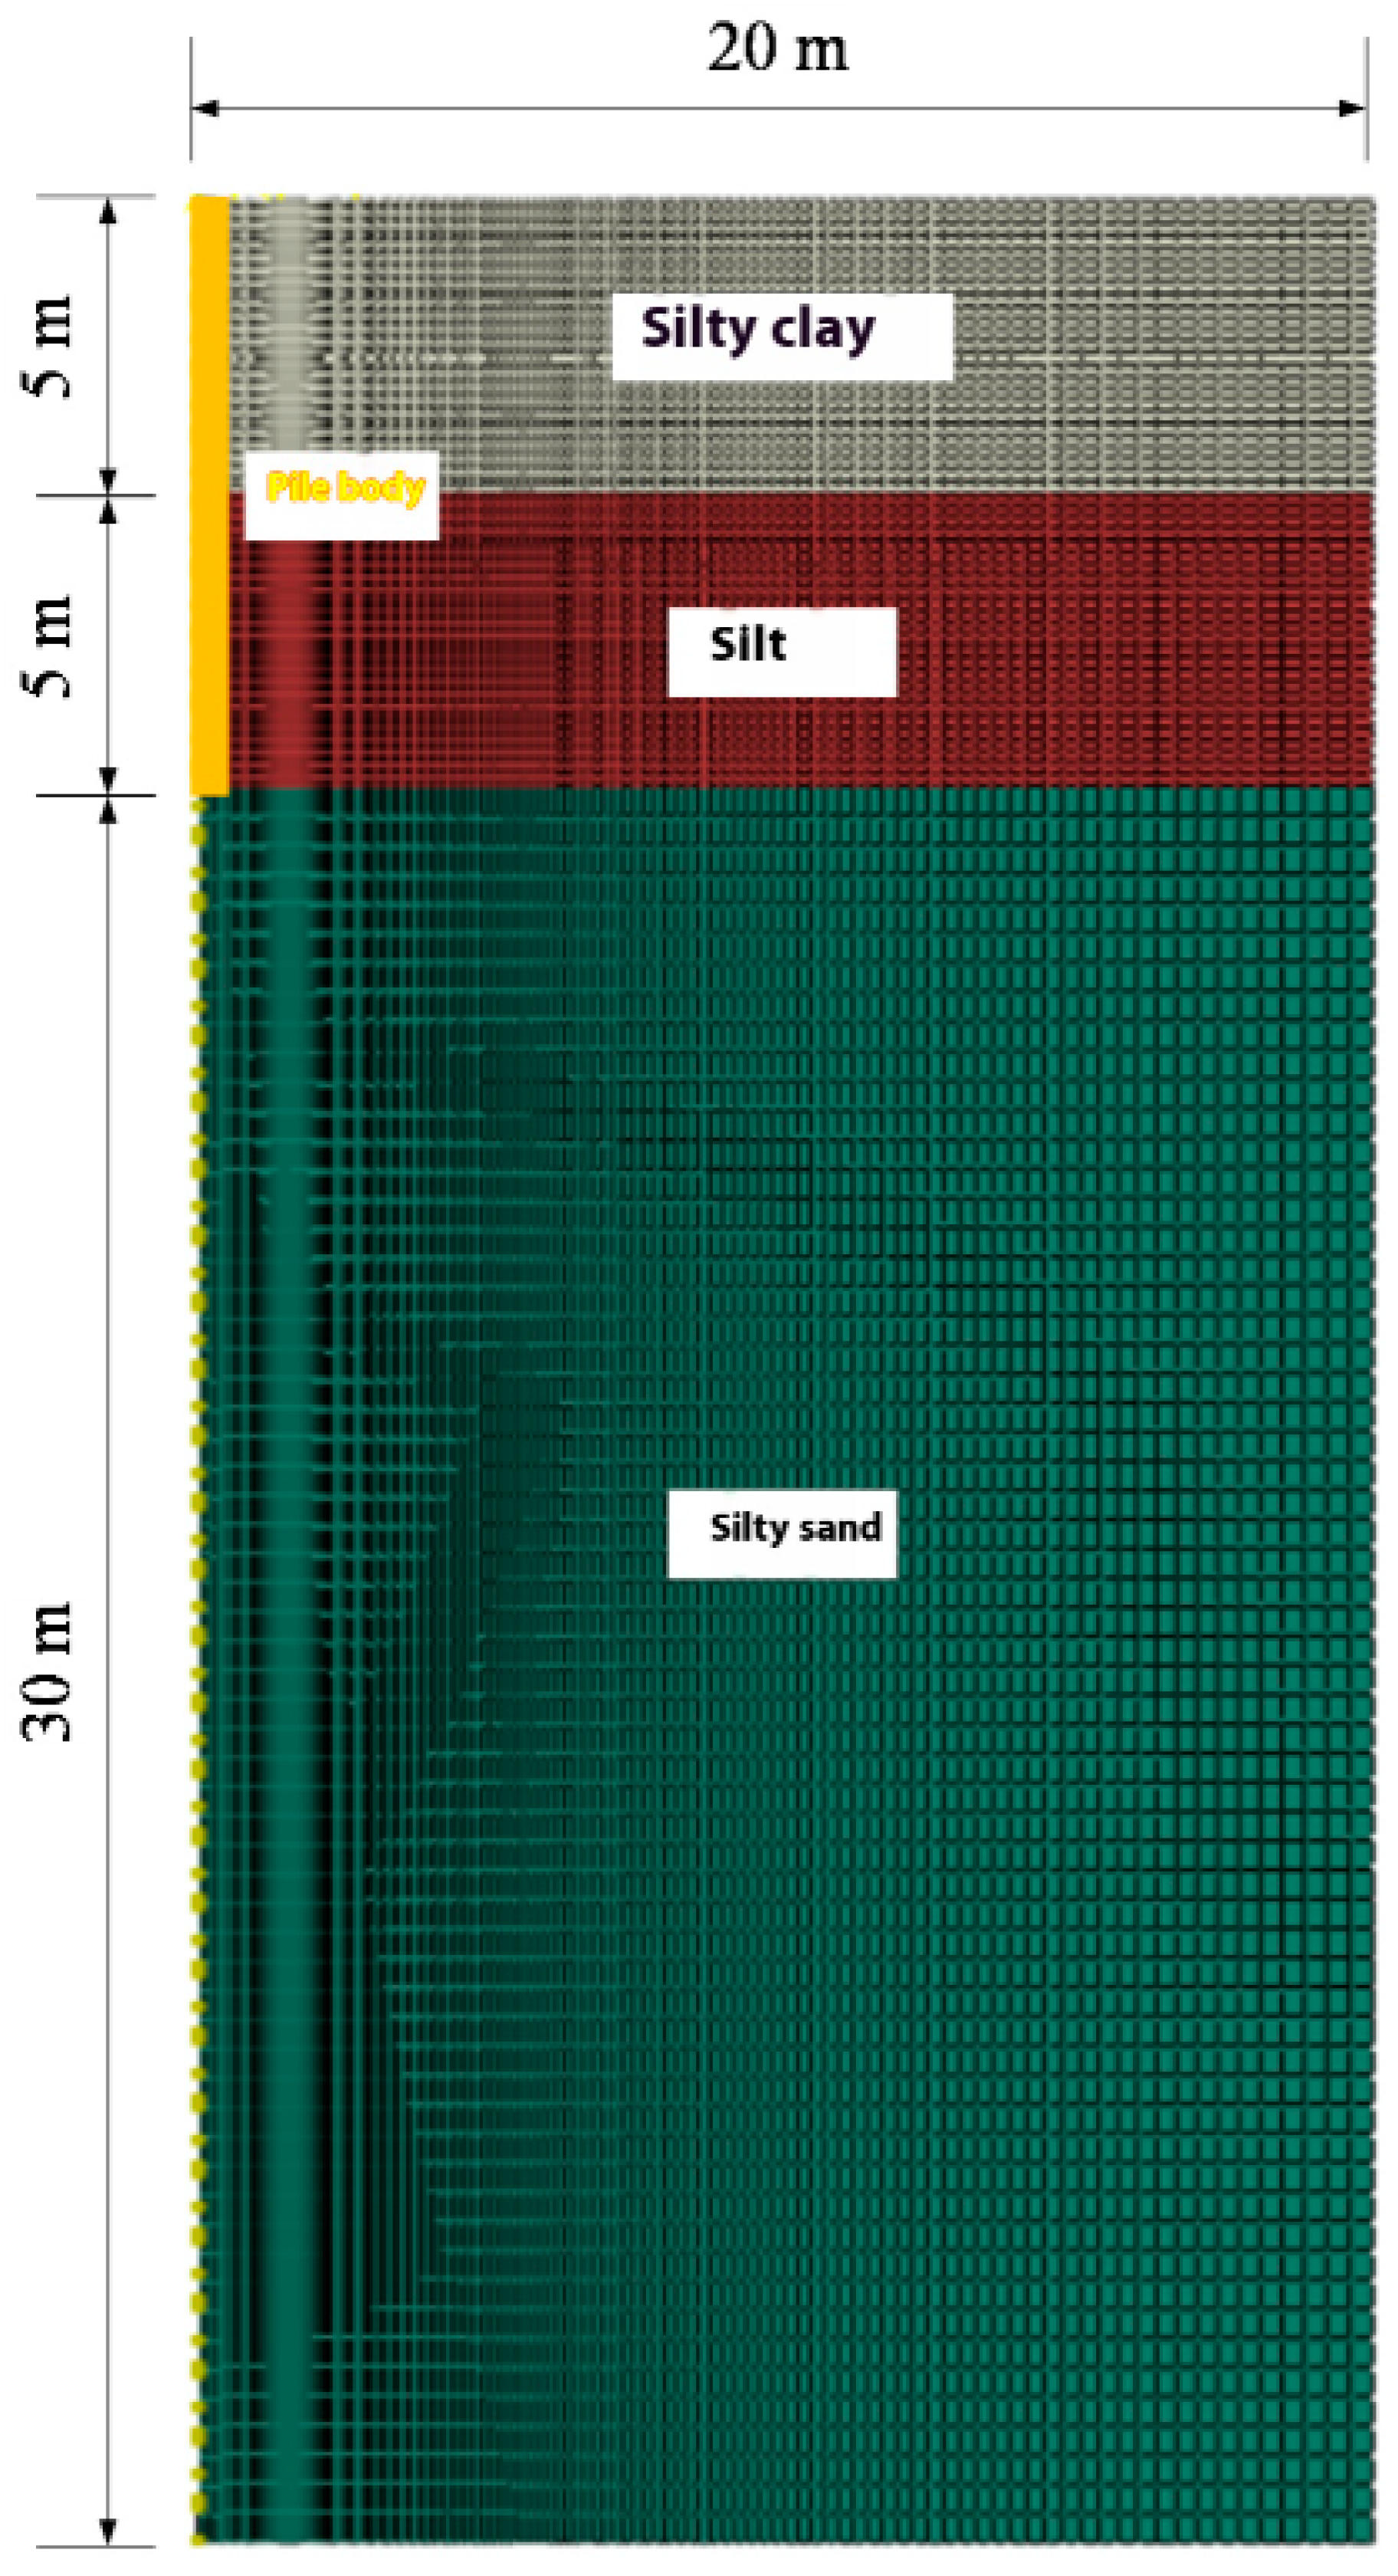
3.3. Model Building
3.4. Test Methods
3.5. Test Steps
- (1)
- The control model pile is loaded with 200 N until the ultimate load is obtained.
- (2)
- The settlement observation specification stipulates that the next level of loading shall not be carried out when the subsidence is not stabilized. The observation time of each level of loading is as follows: Each level of loading should be observed immediately after loading, and then in the first hour, it is observed every 15 min; in the second hour, it is observed every 30 min; from the third hour onwards, it is observed every 1 h.
- (3)
- Stabilization standard of settlement: If the amount of subsidence of each level of load is not more than 0.1 mm in the last 30 min, the settlement can be regarded as stabilized, and the next level of load can be applied.
- (4)
- The termination of loading and the value of limit load: The loading can be terminated when the sinking amount of the current load is equal to or greater than 2 times the sinking amount of the previous load.
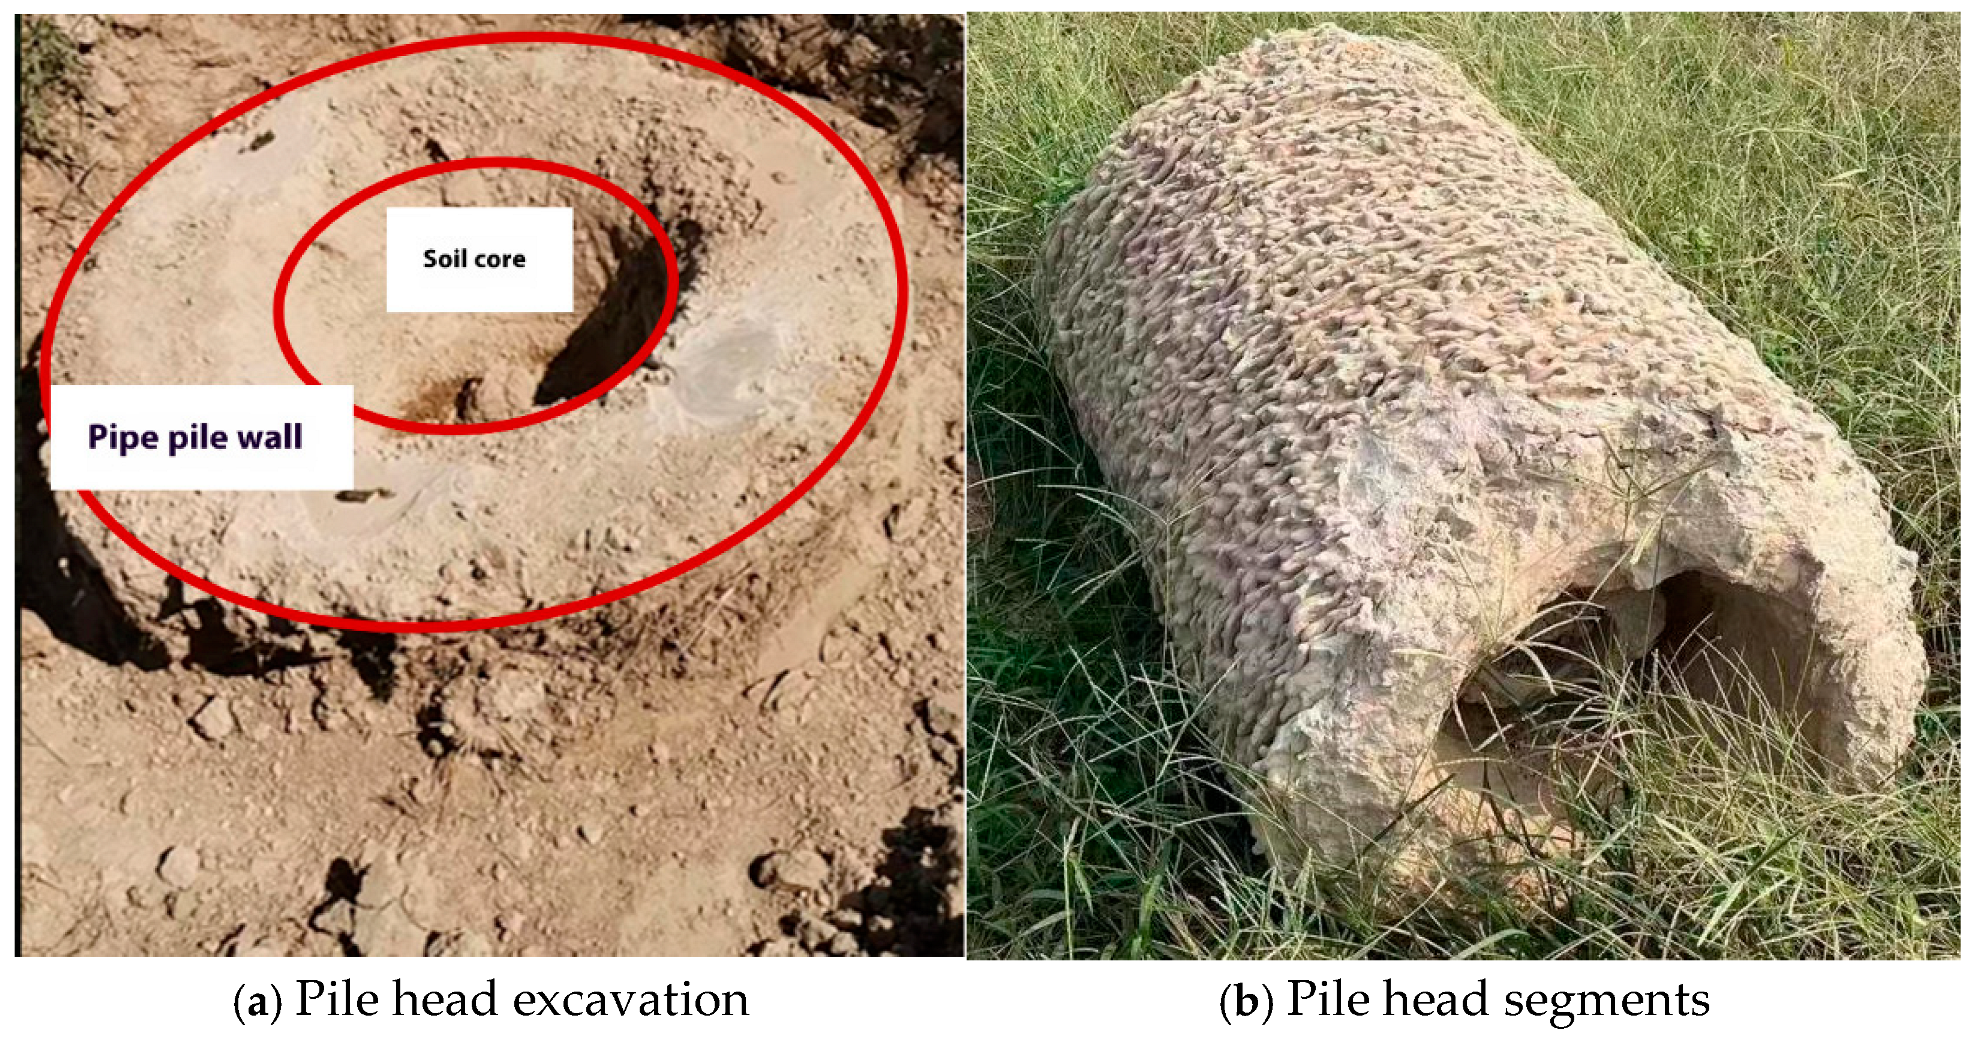
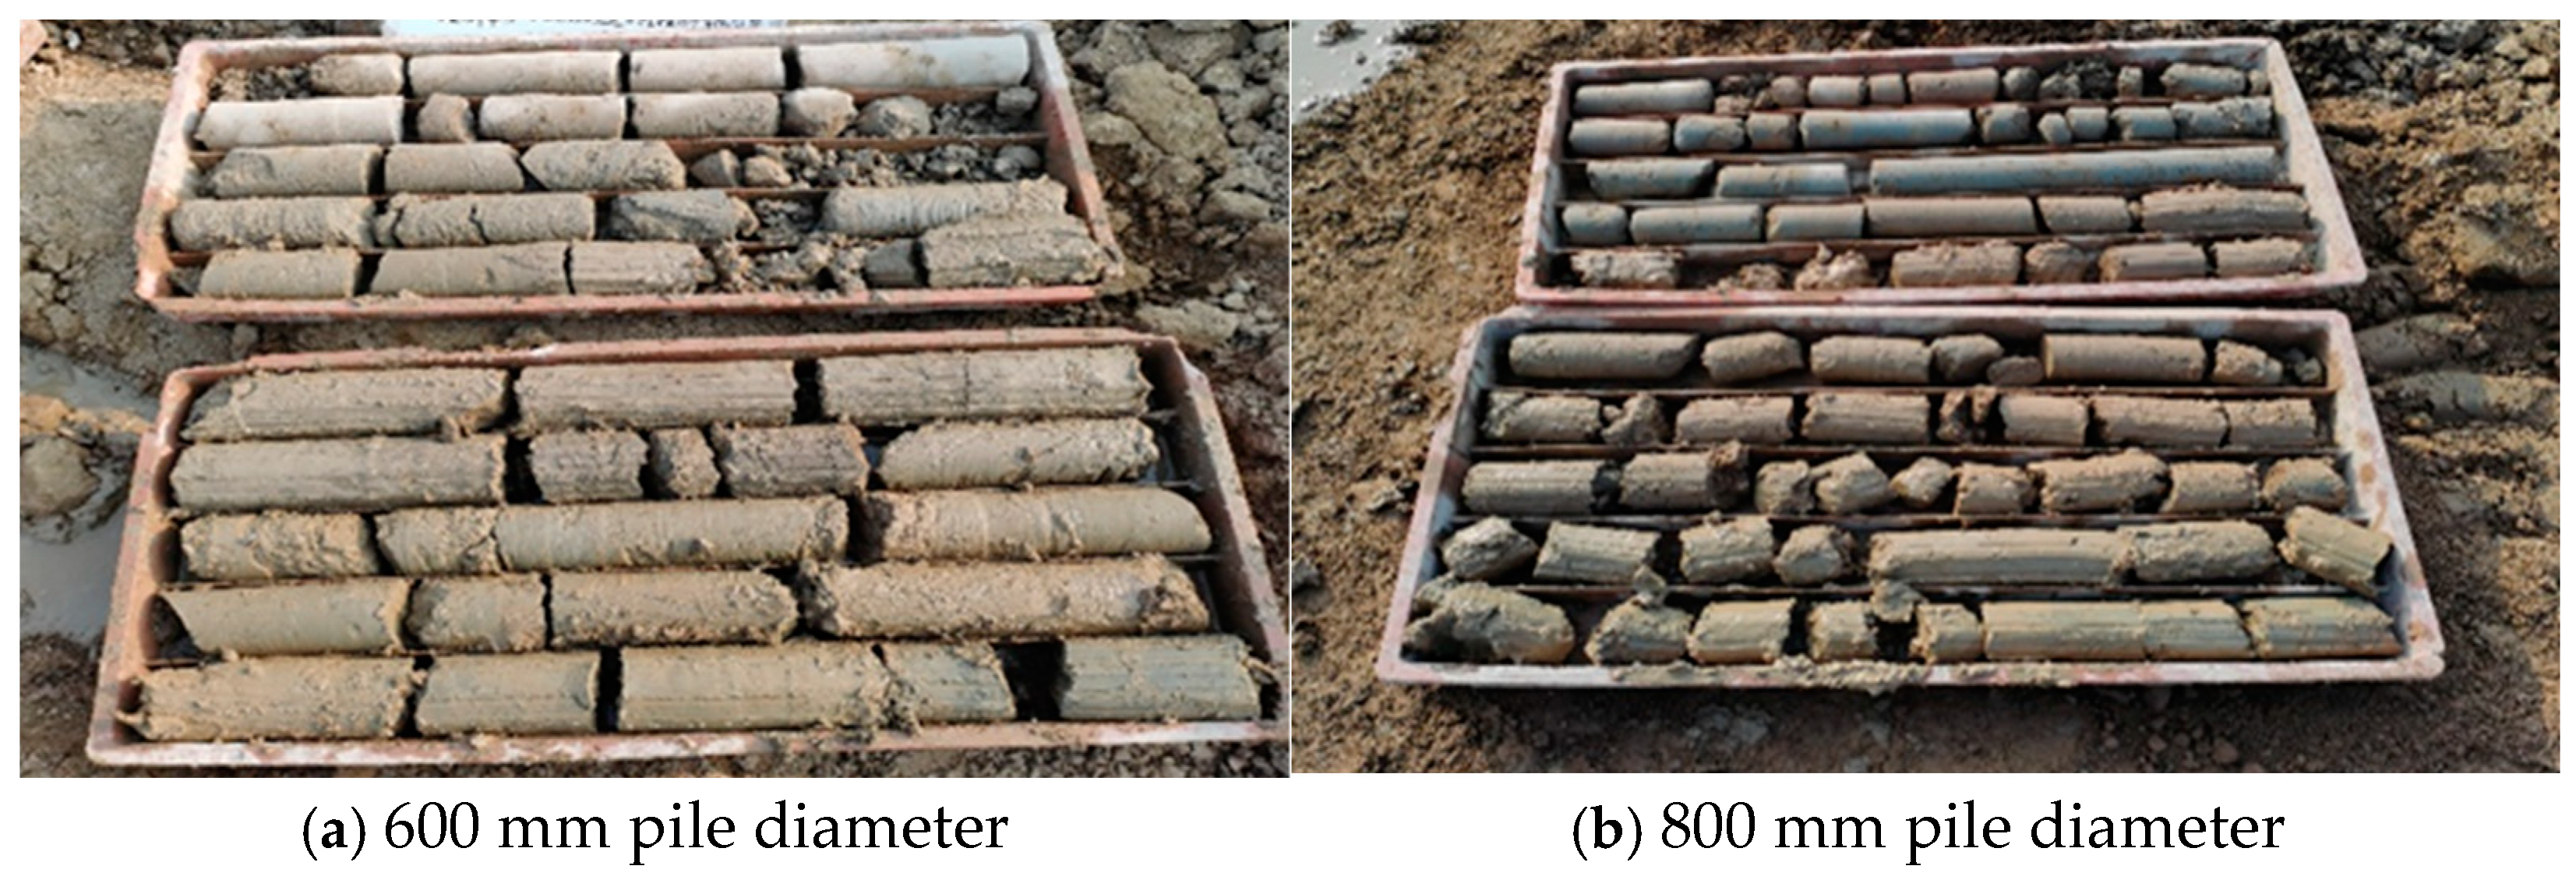
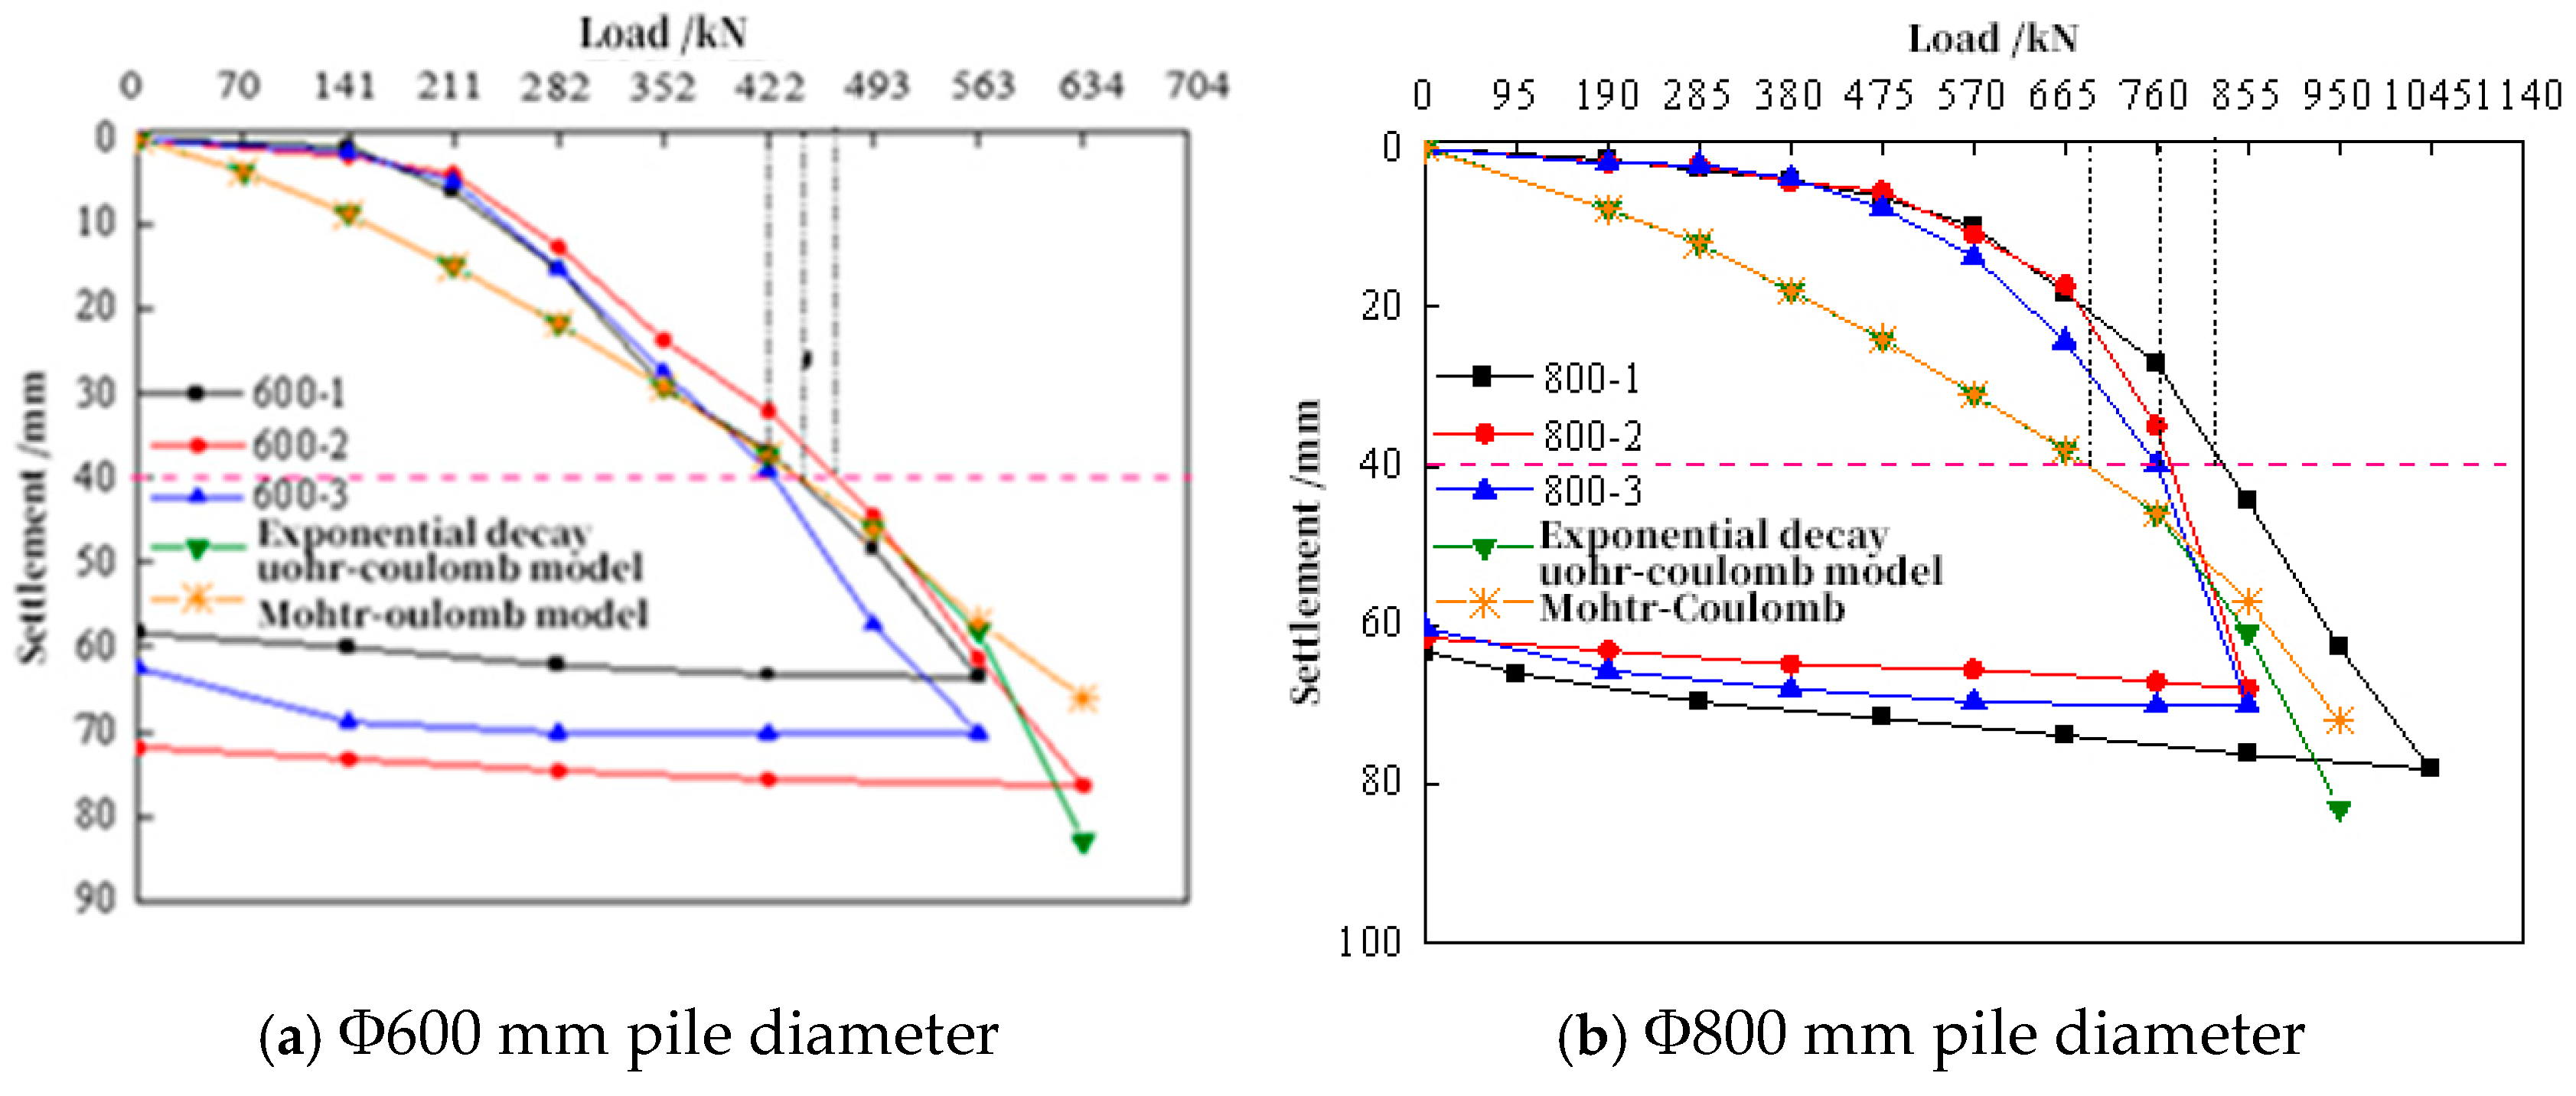
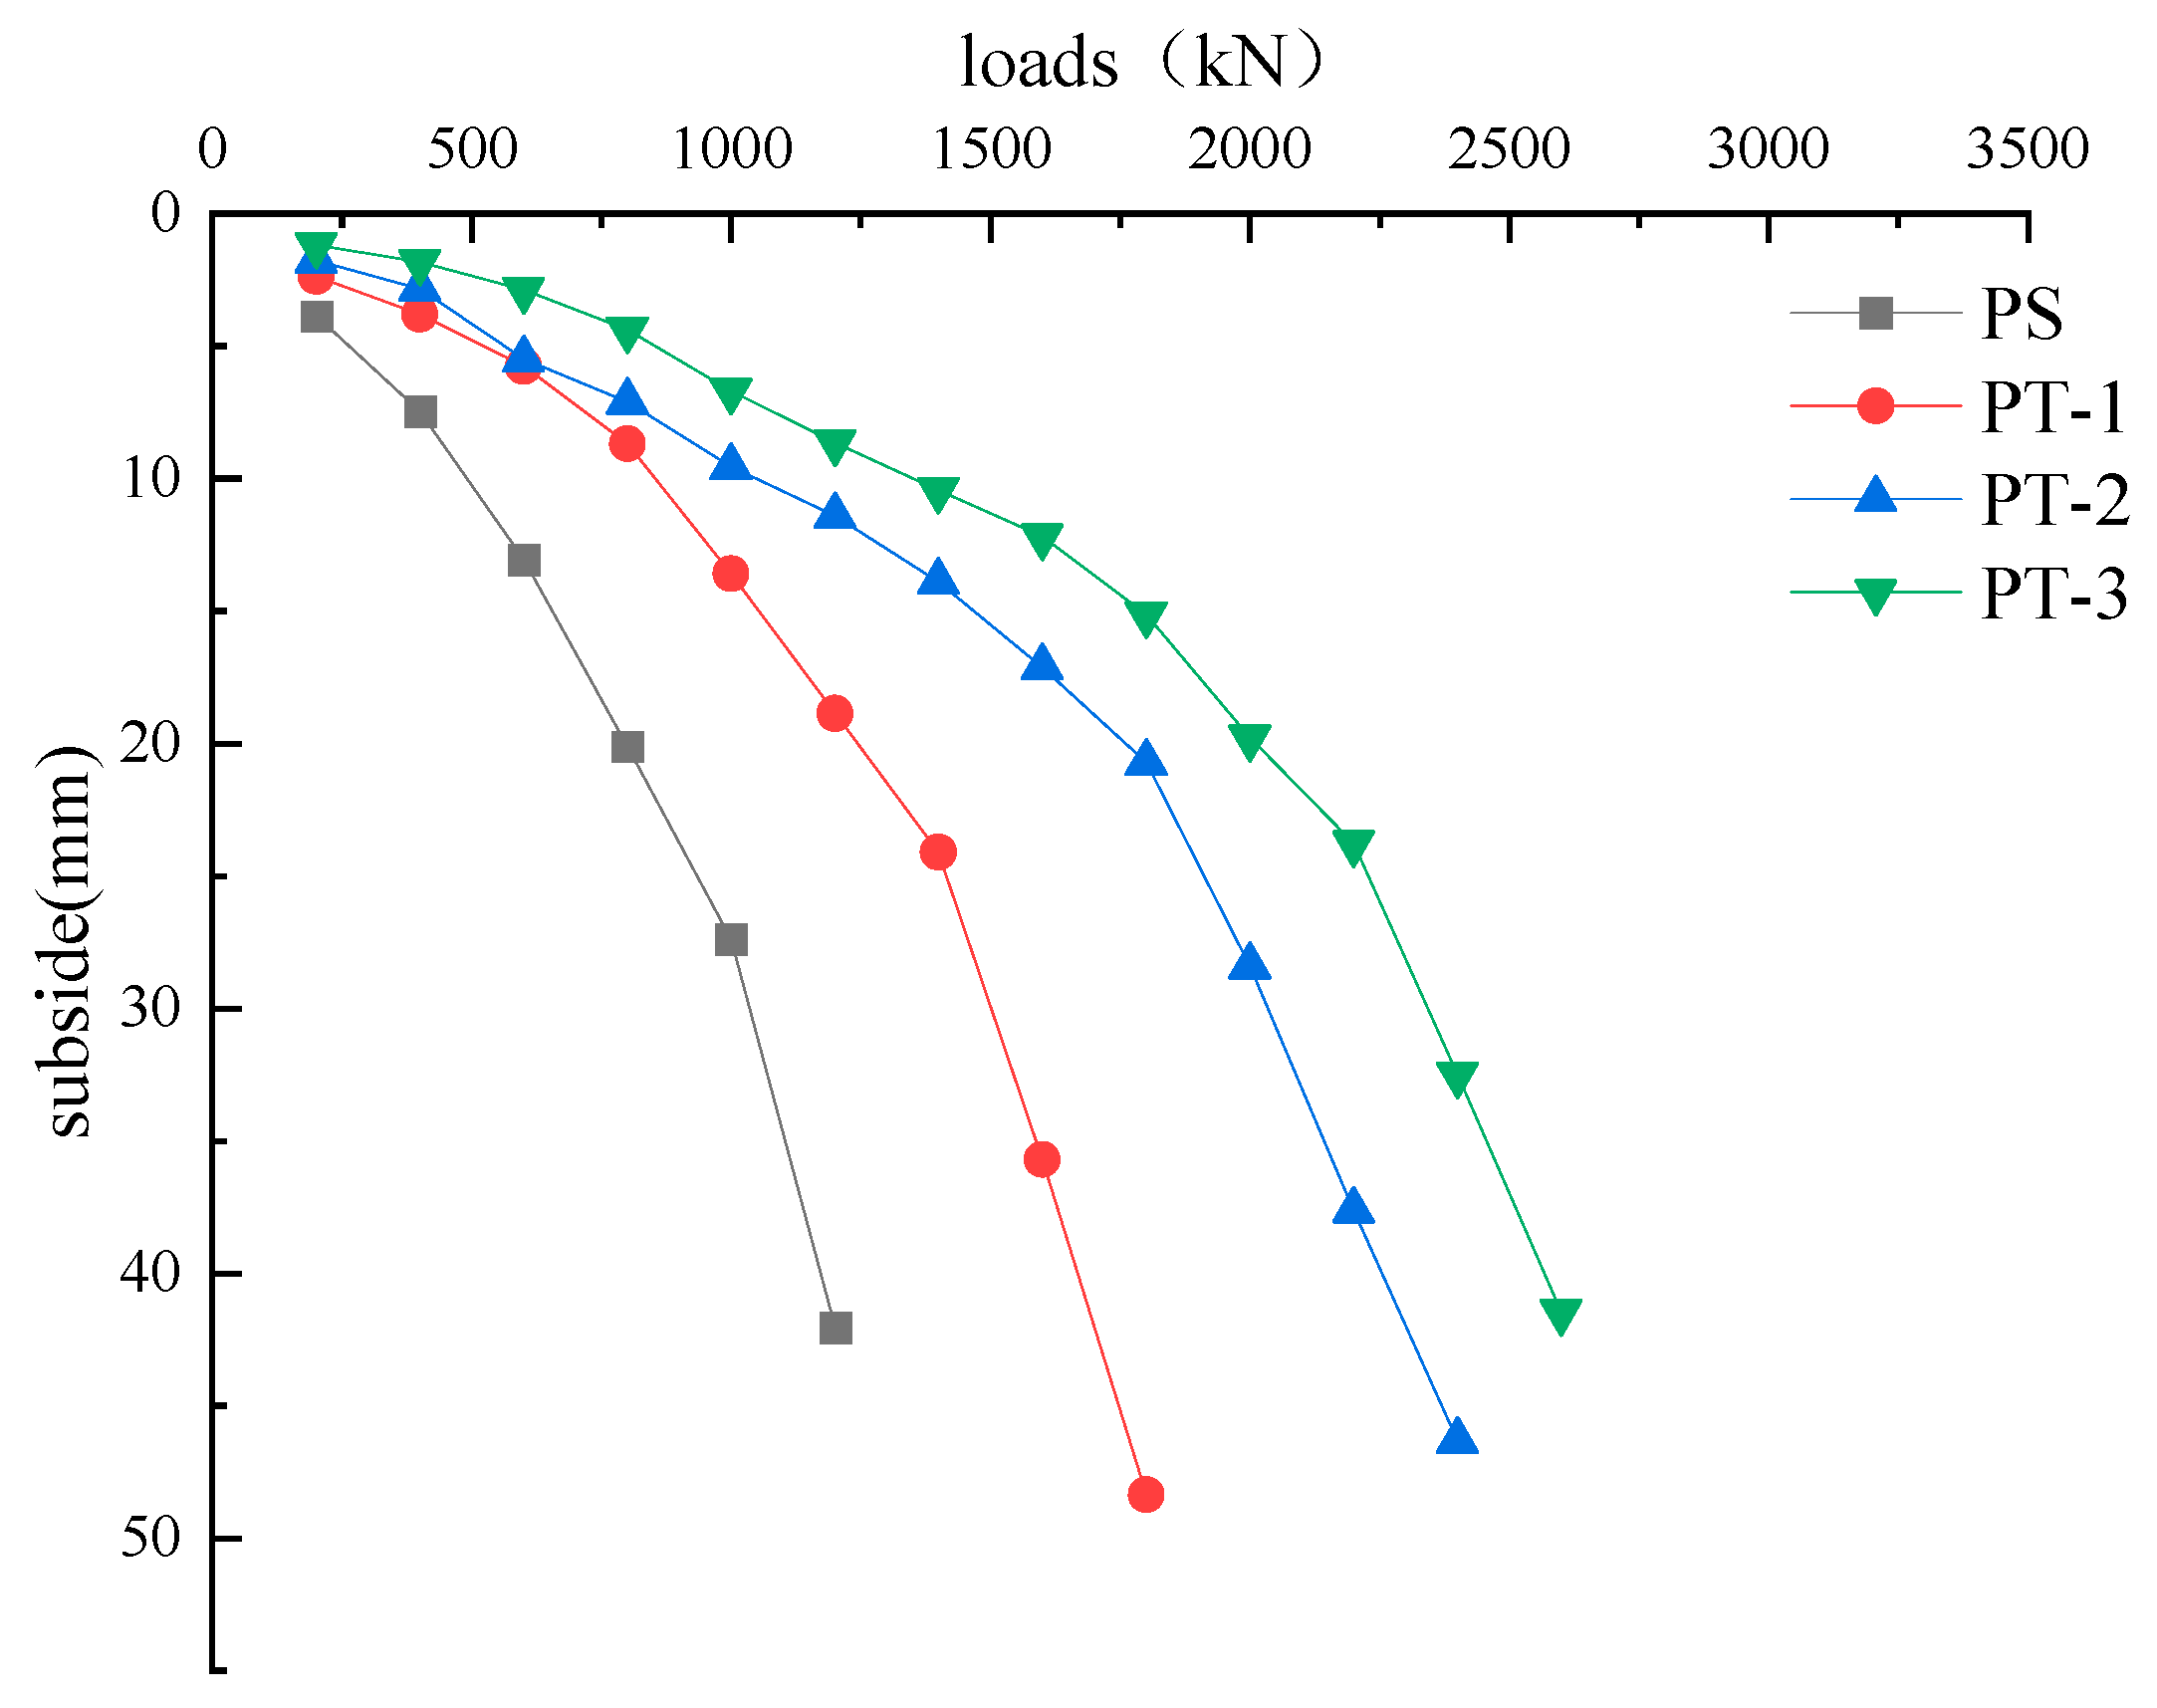
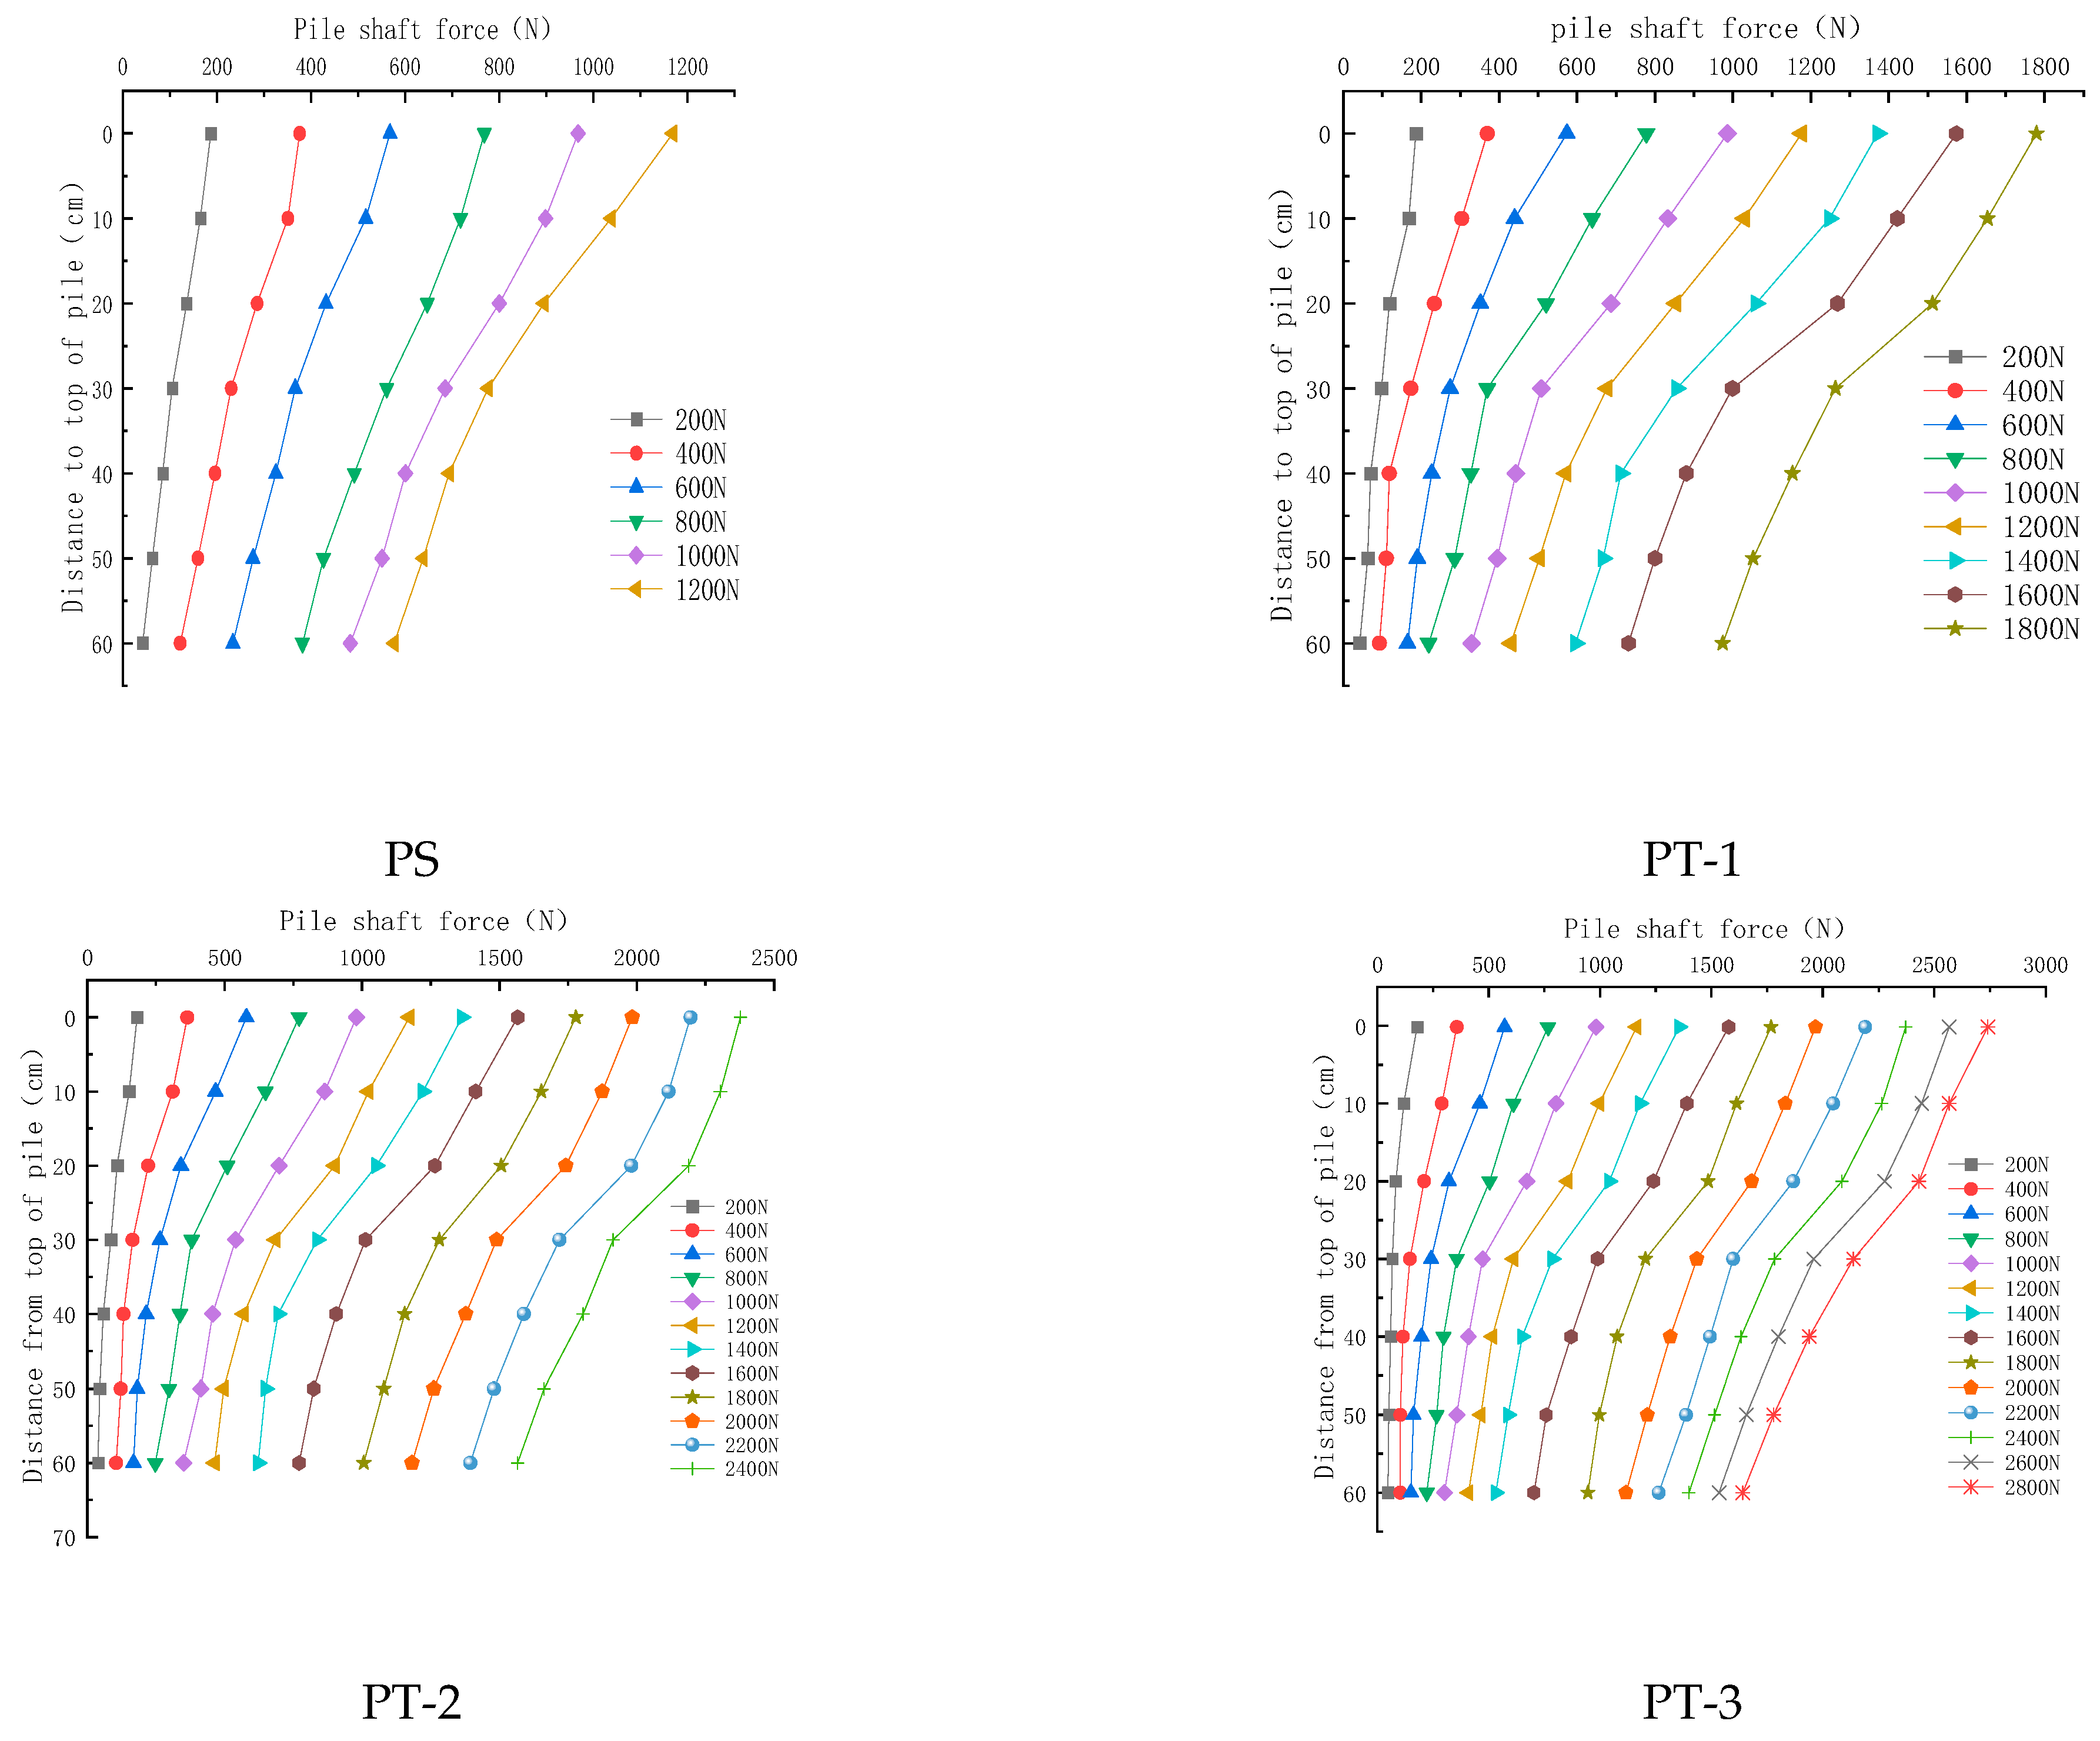
3.6. Experimental Results and Analysis
4. Computational Modeling
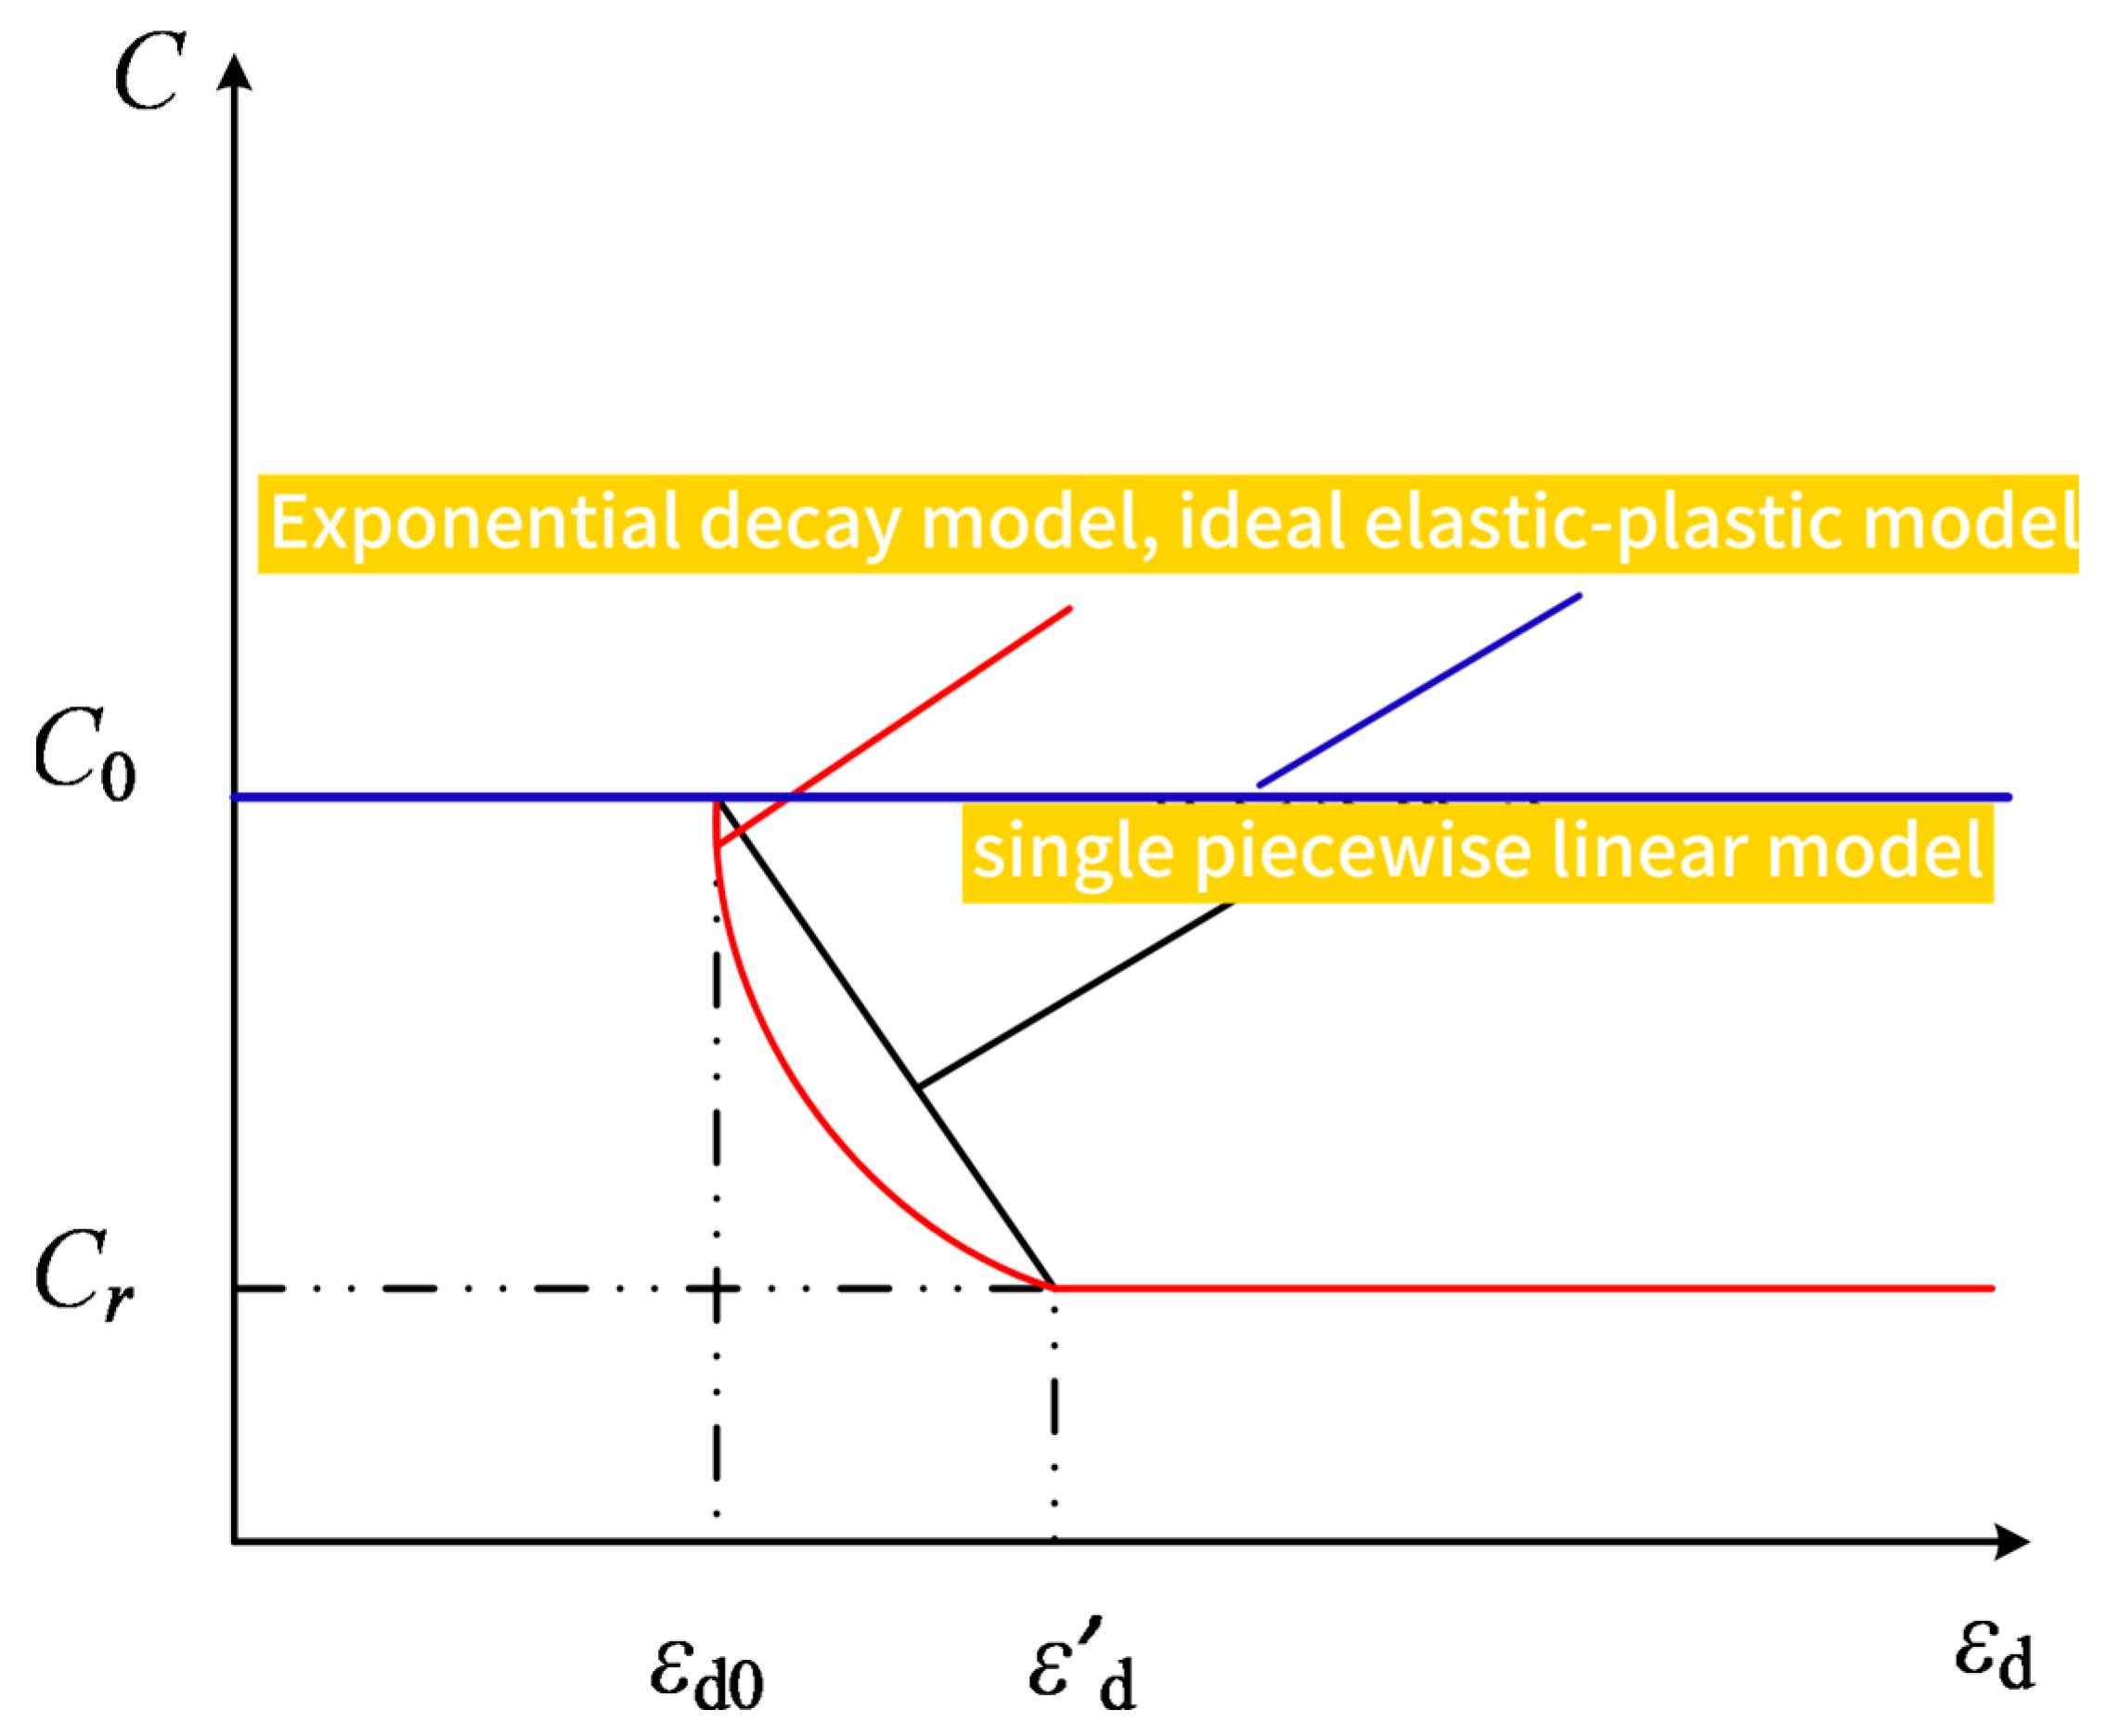
4.1. Mohr–Coulomb Model for Exponential Decay of Hydraulic Soils
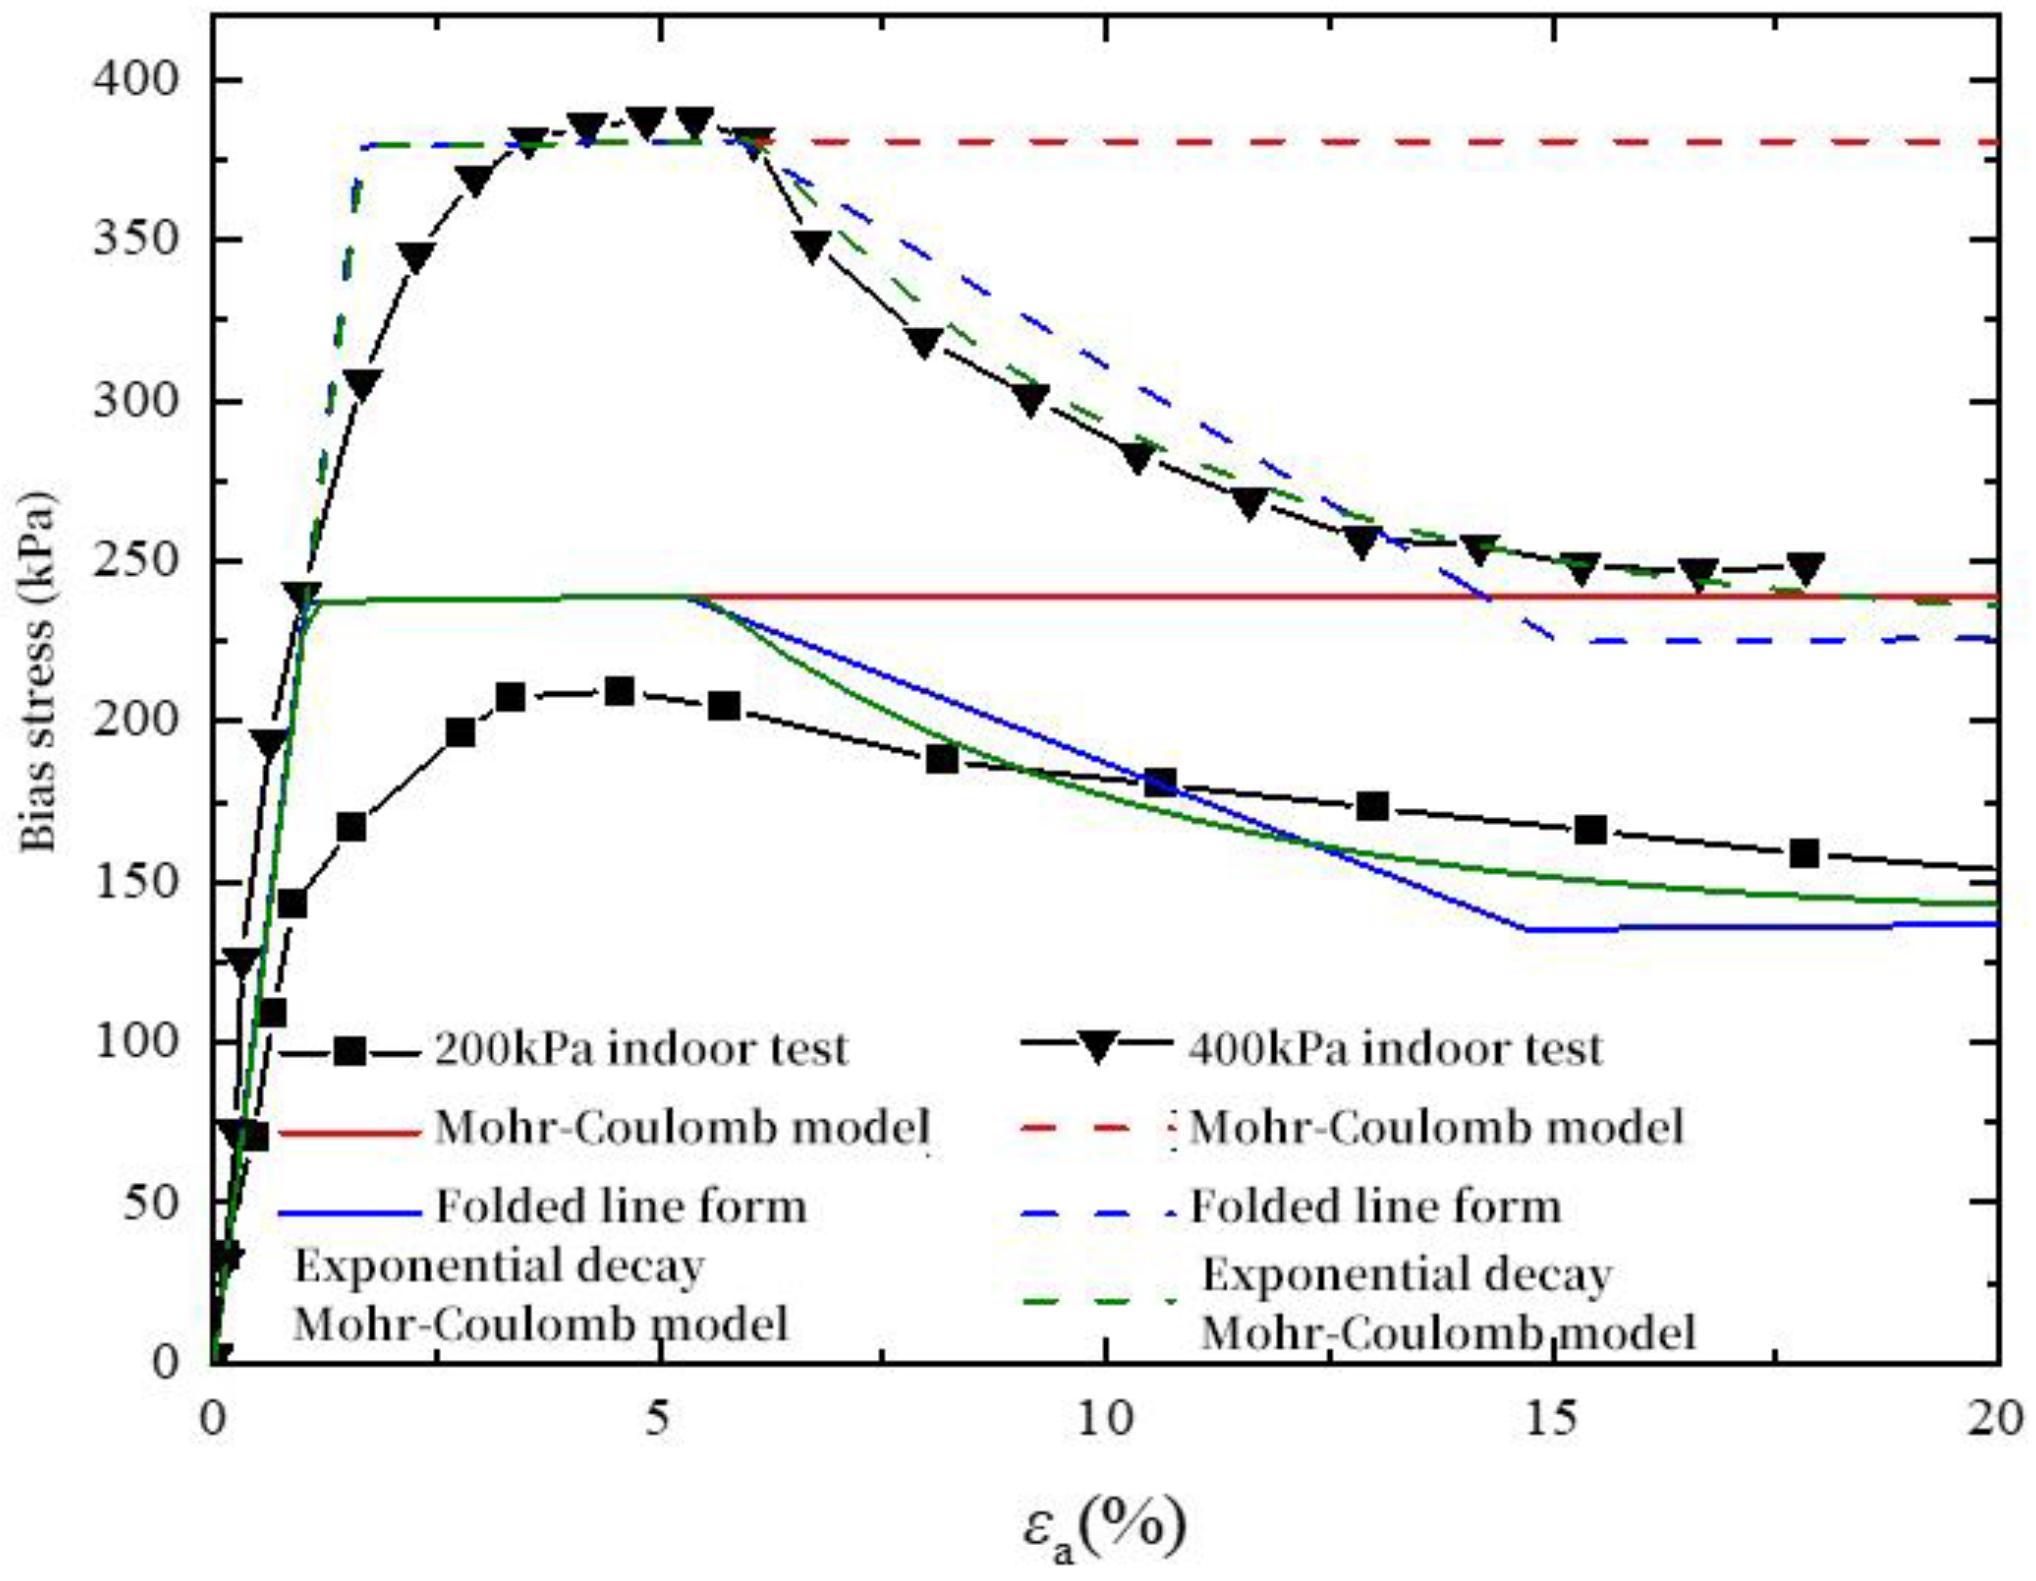
4.2. Triaxial Test Validation
4.3. Field Test Validation
4.4. Calculate the Operating Conditions
5. Analysis of Calculation Results
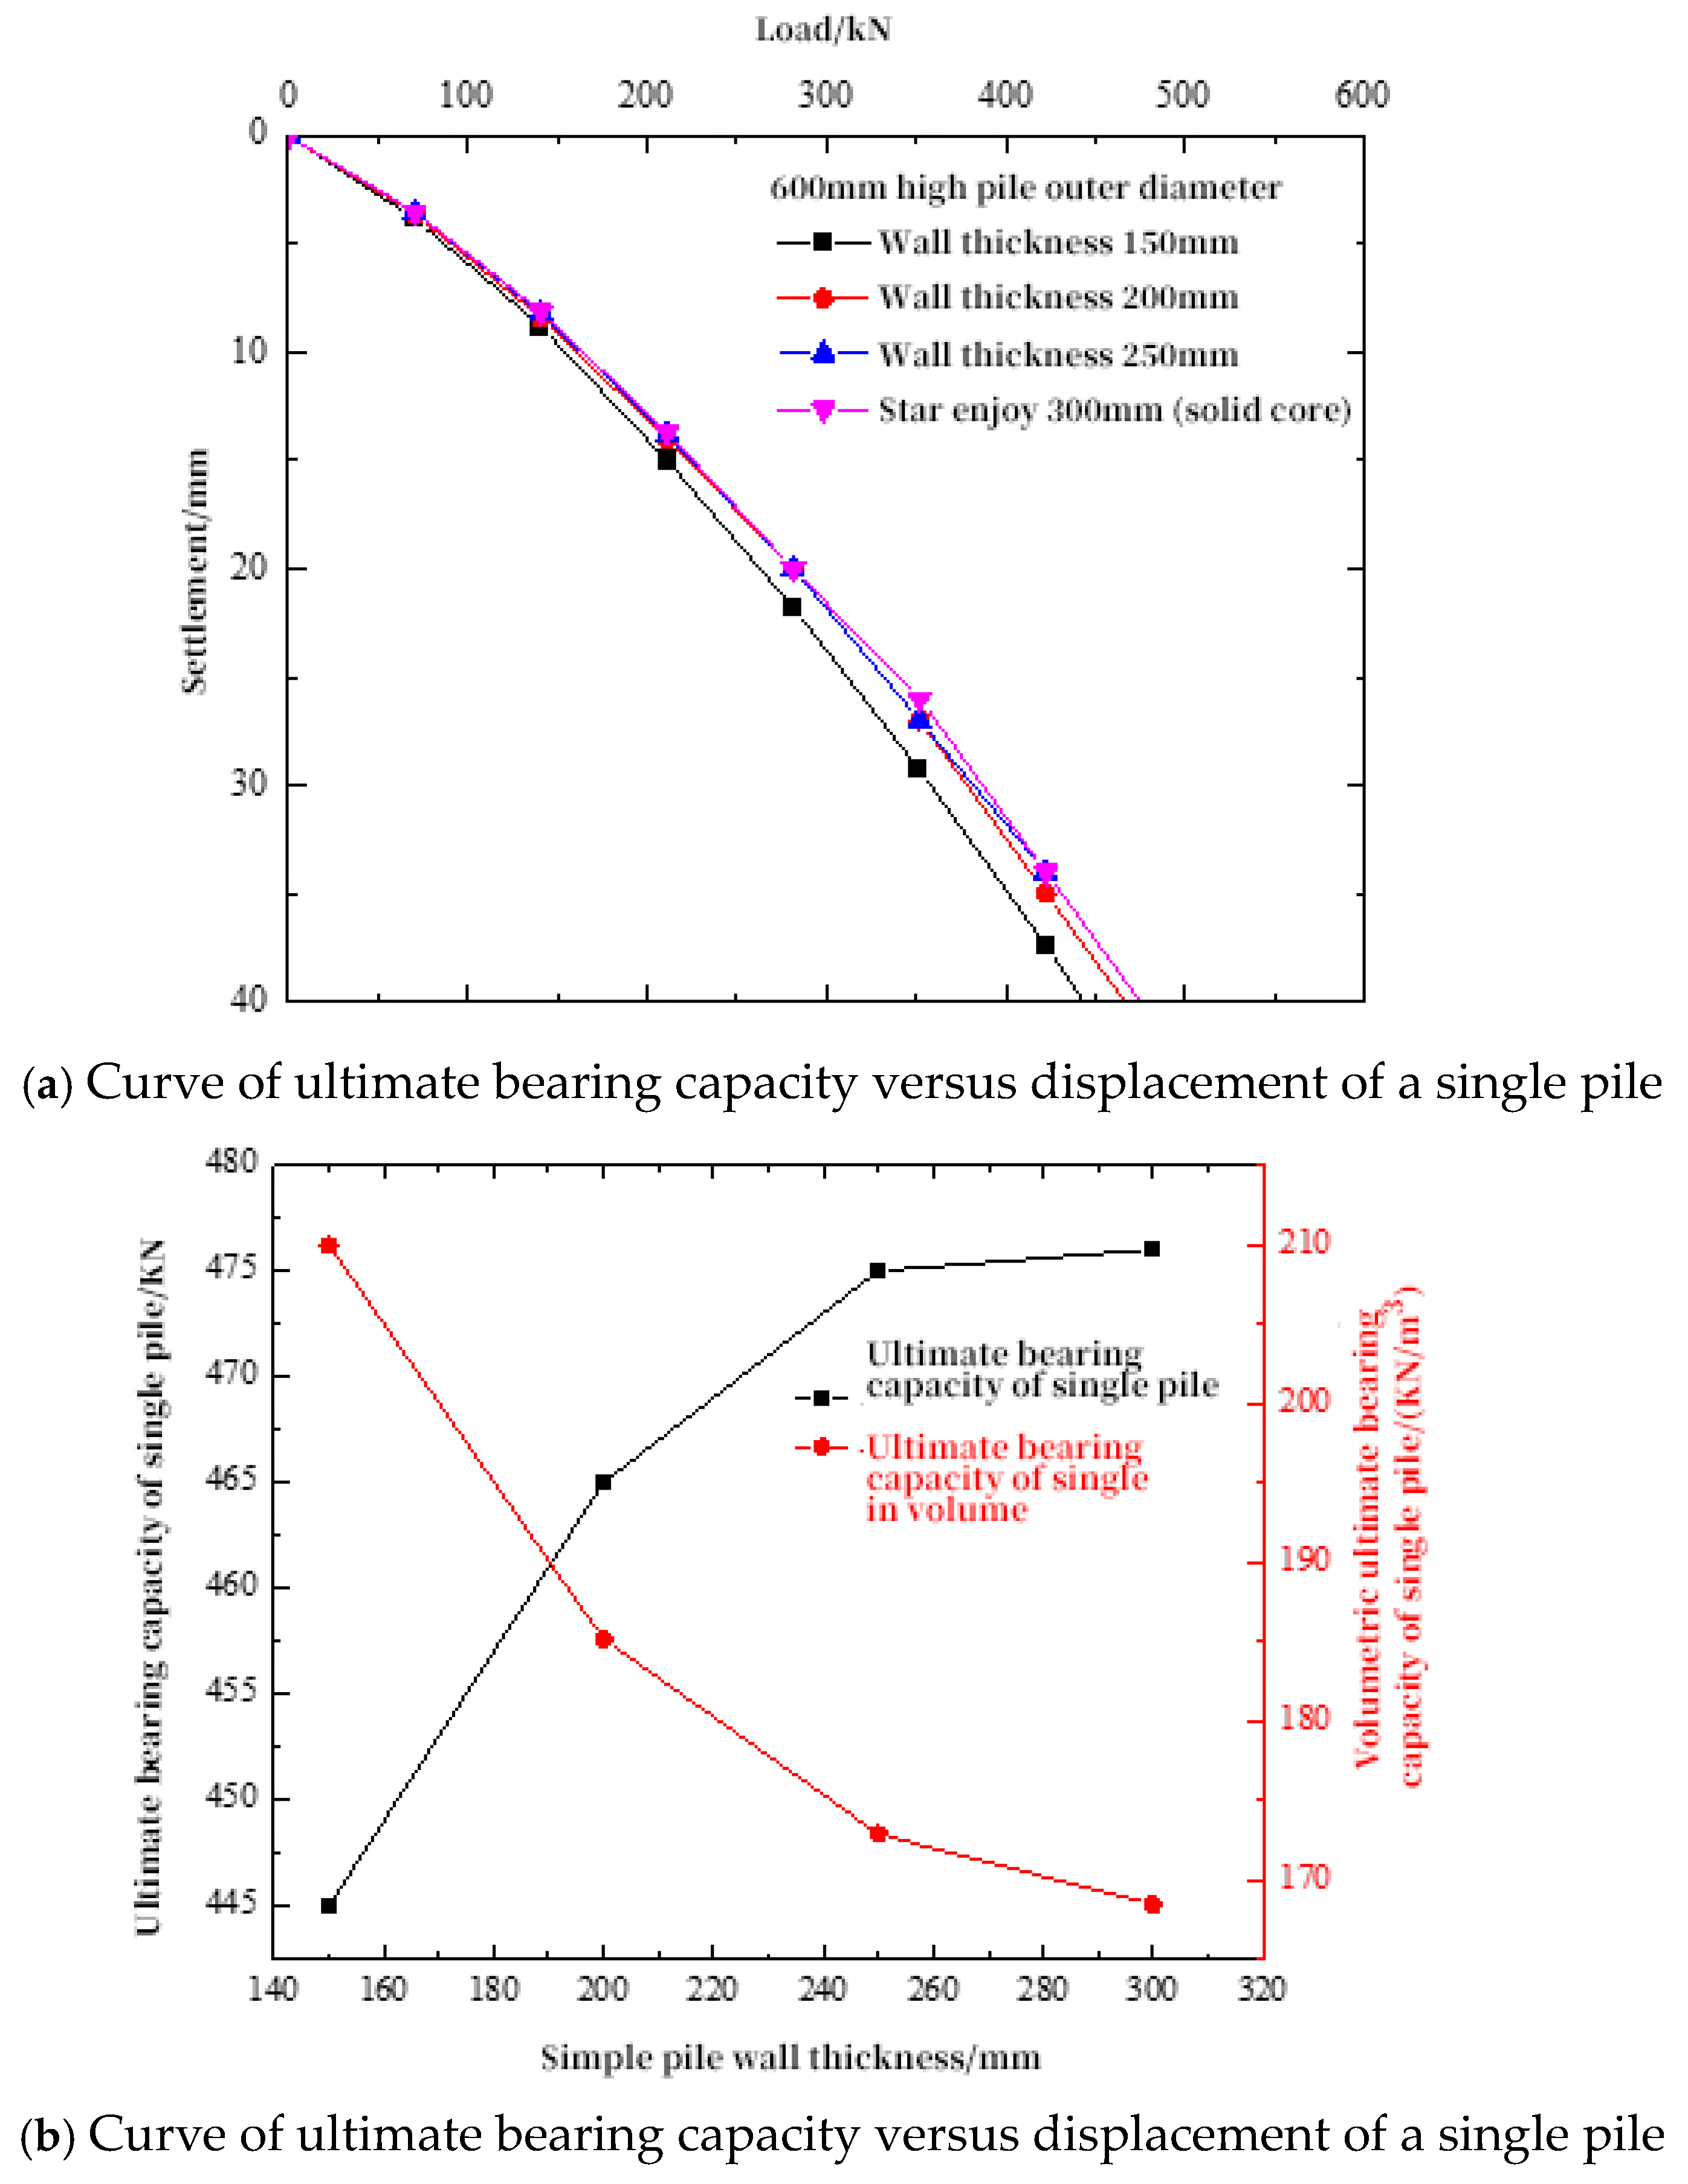
5.1. Analysis of the Influence of Cement Soil Pipe Pile Wall Thickness on Bearing Capacity
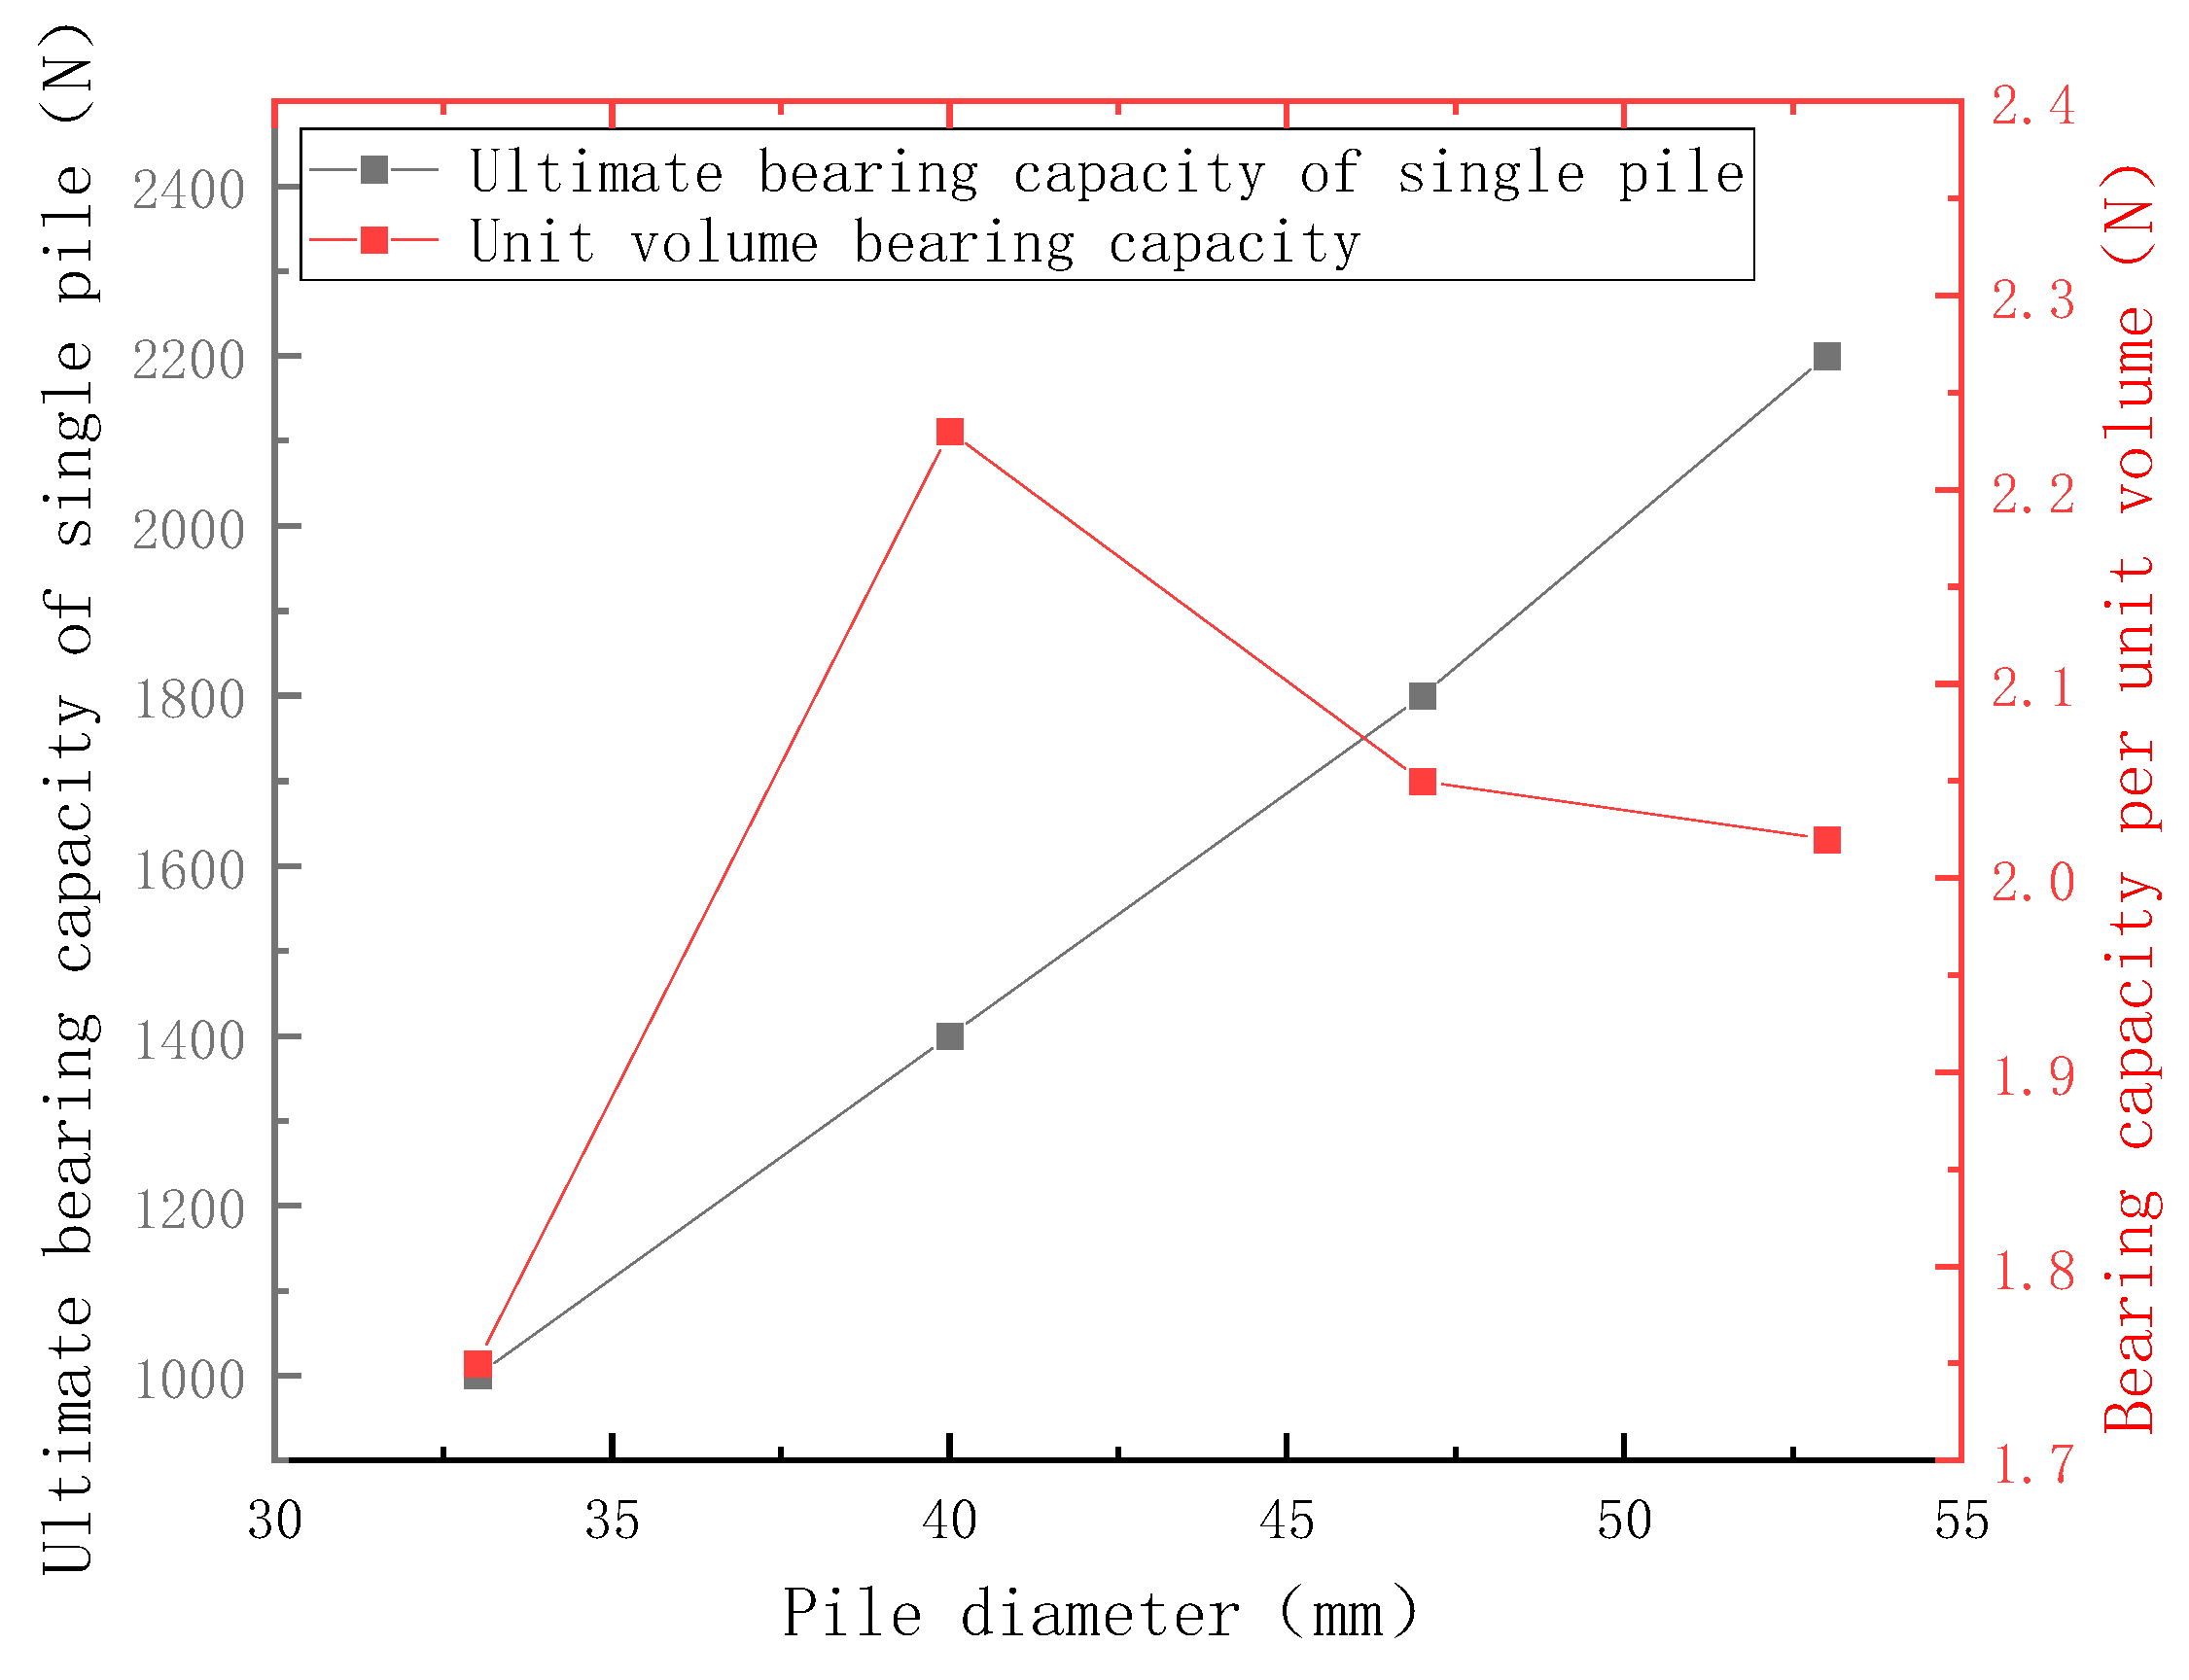
5.2. Analysis of the Effect of Pile Diameter on Bearing Capacity
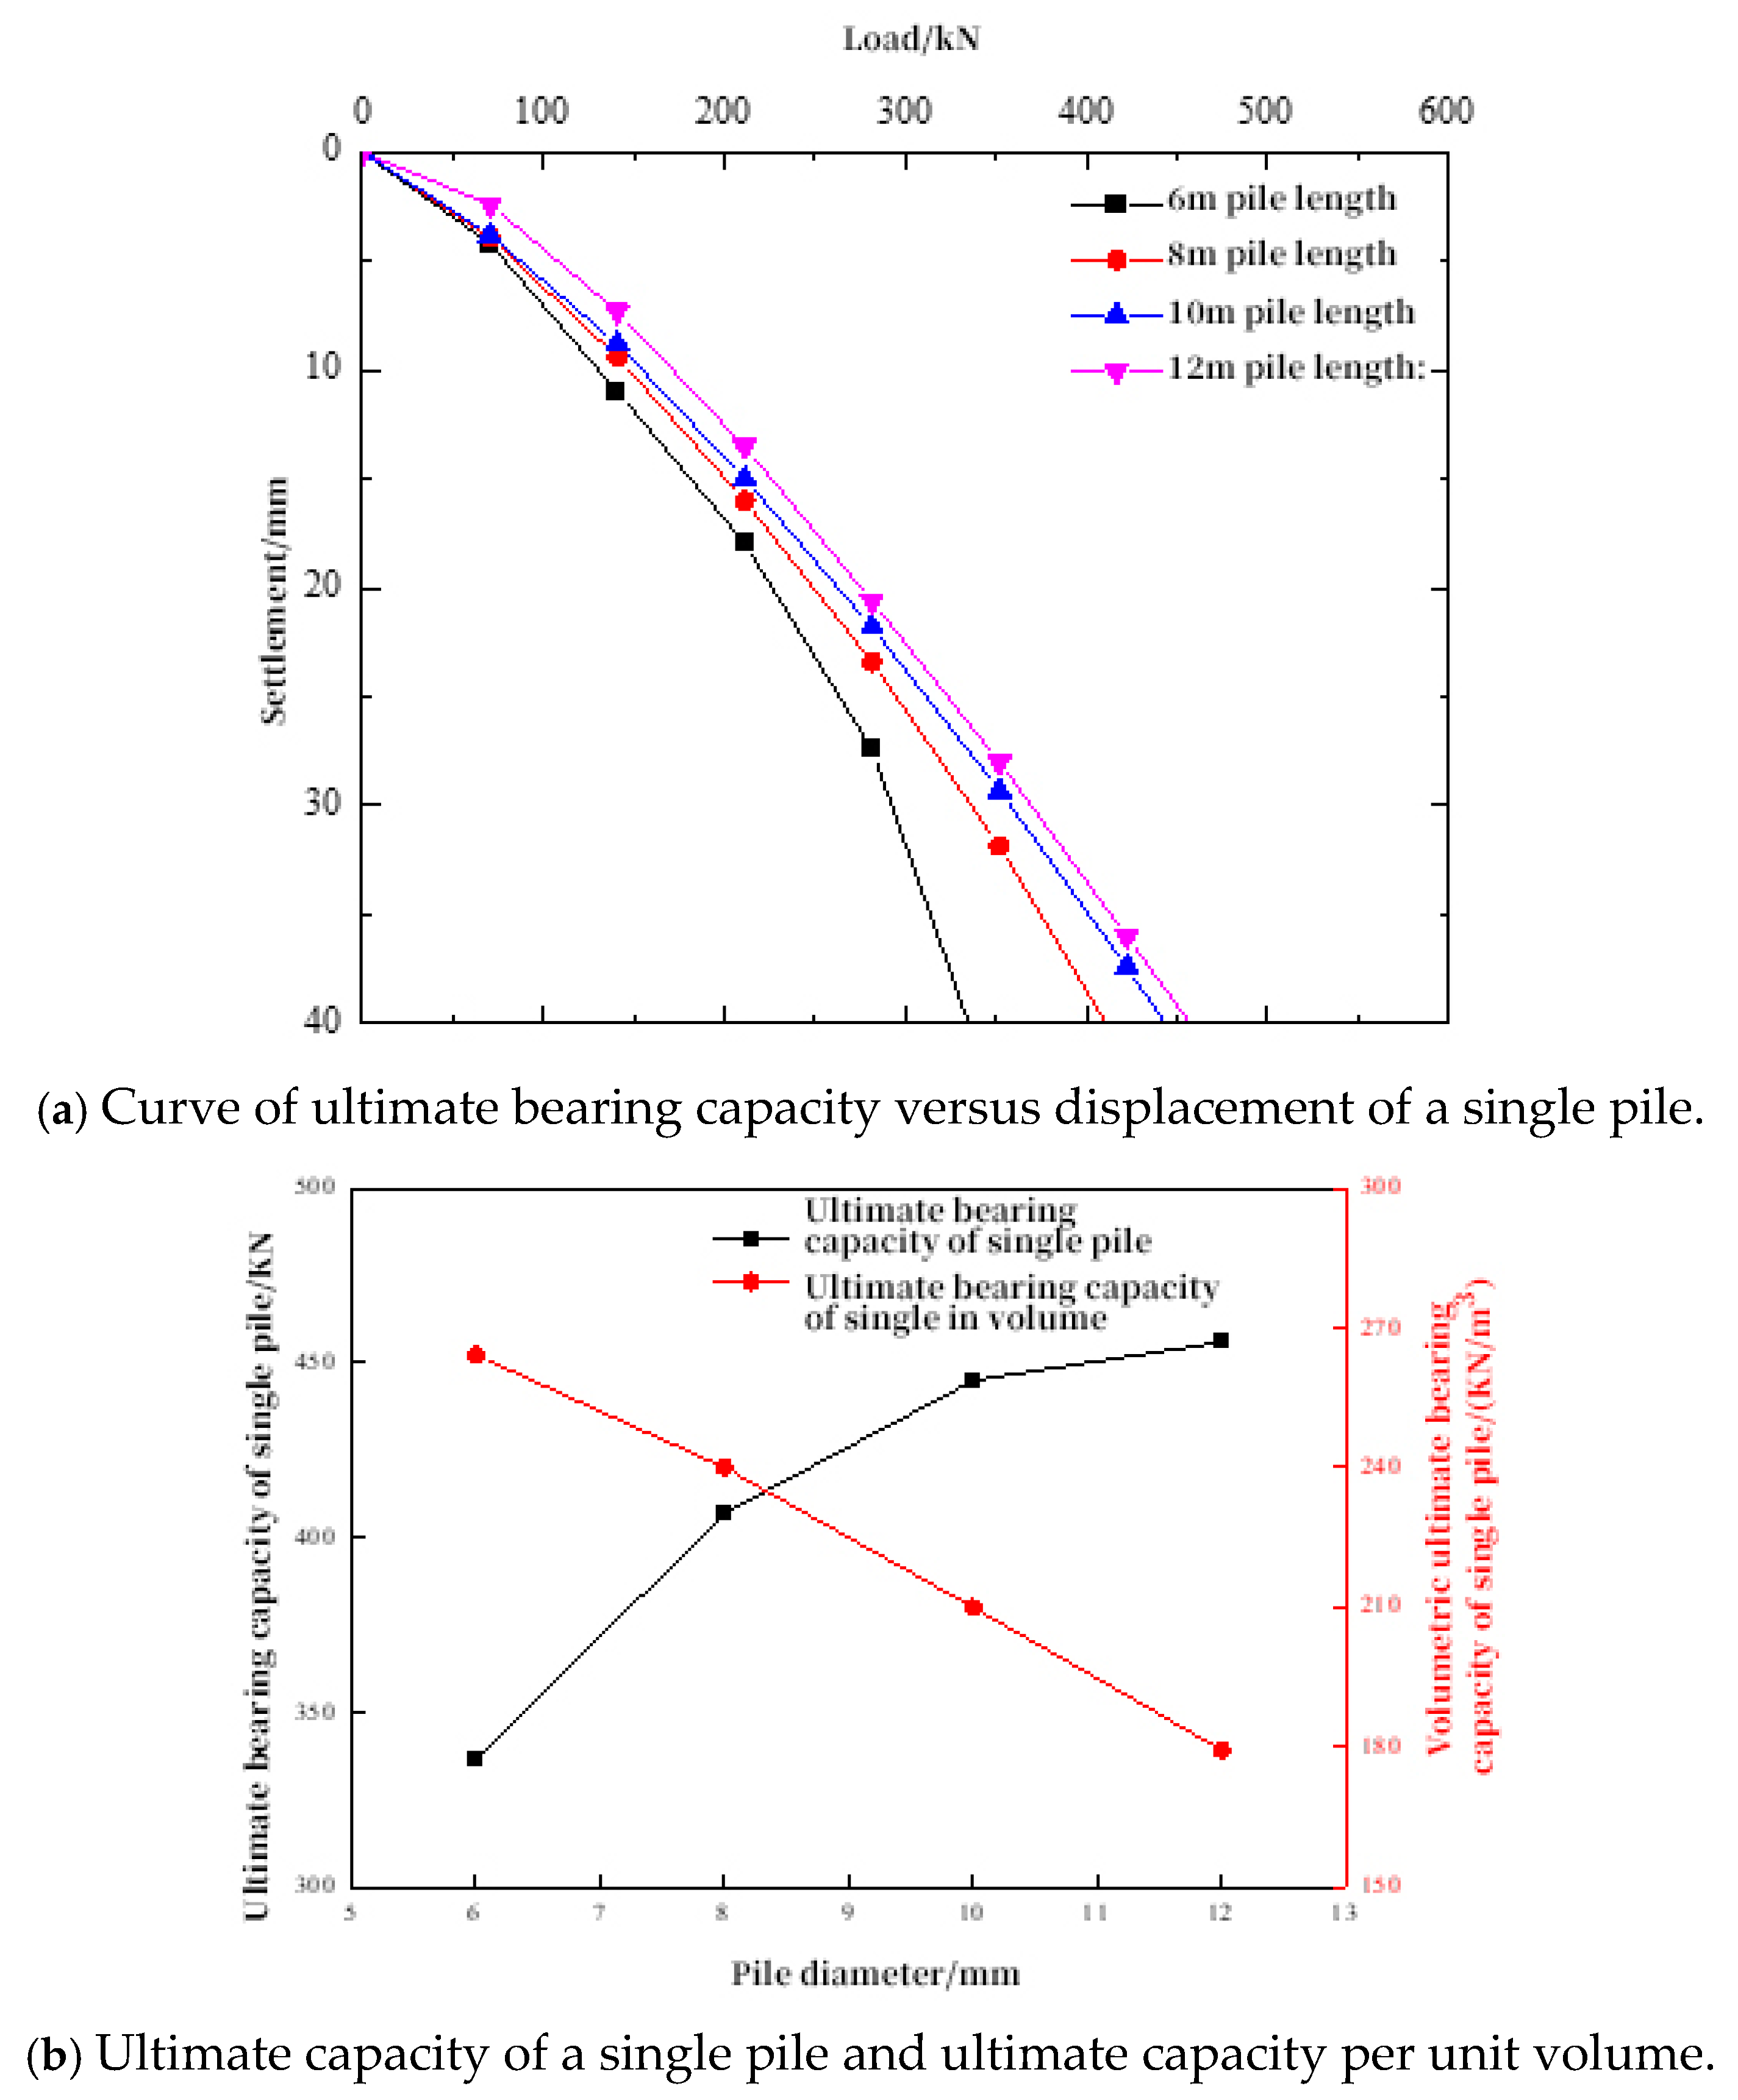
5.3. Analysis of the Effect of Pipe Pile Length on Bearing Capacity
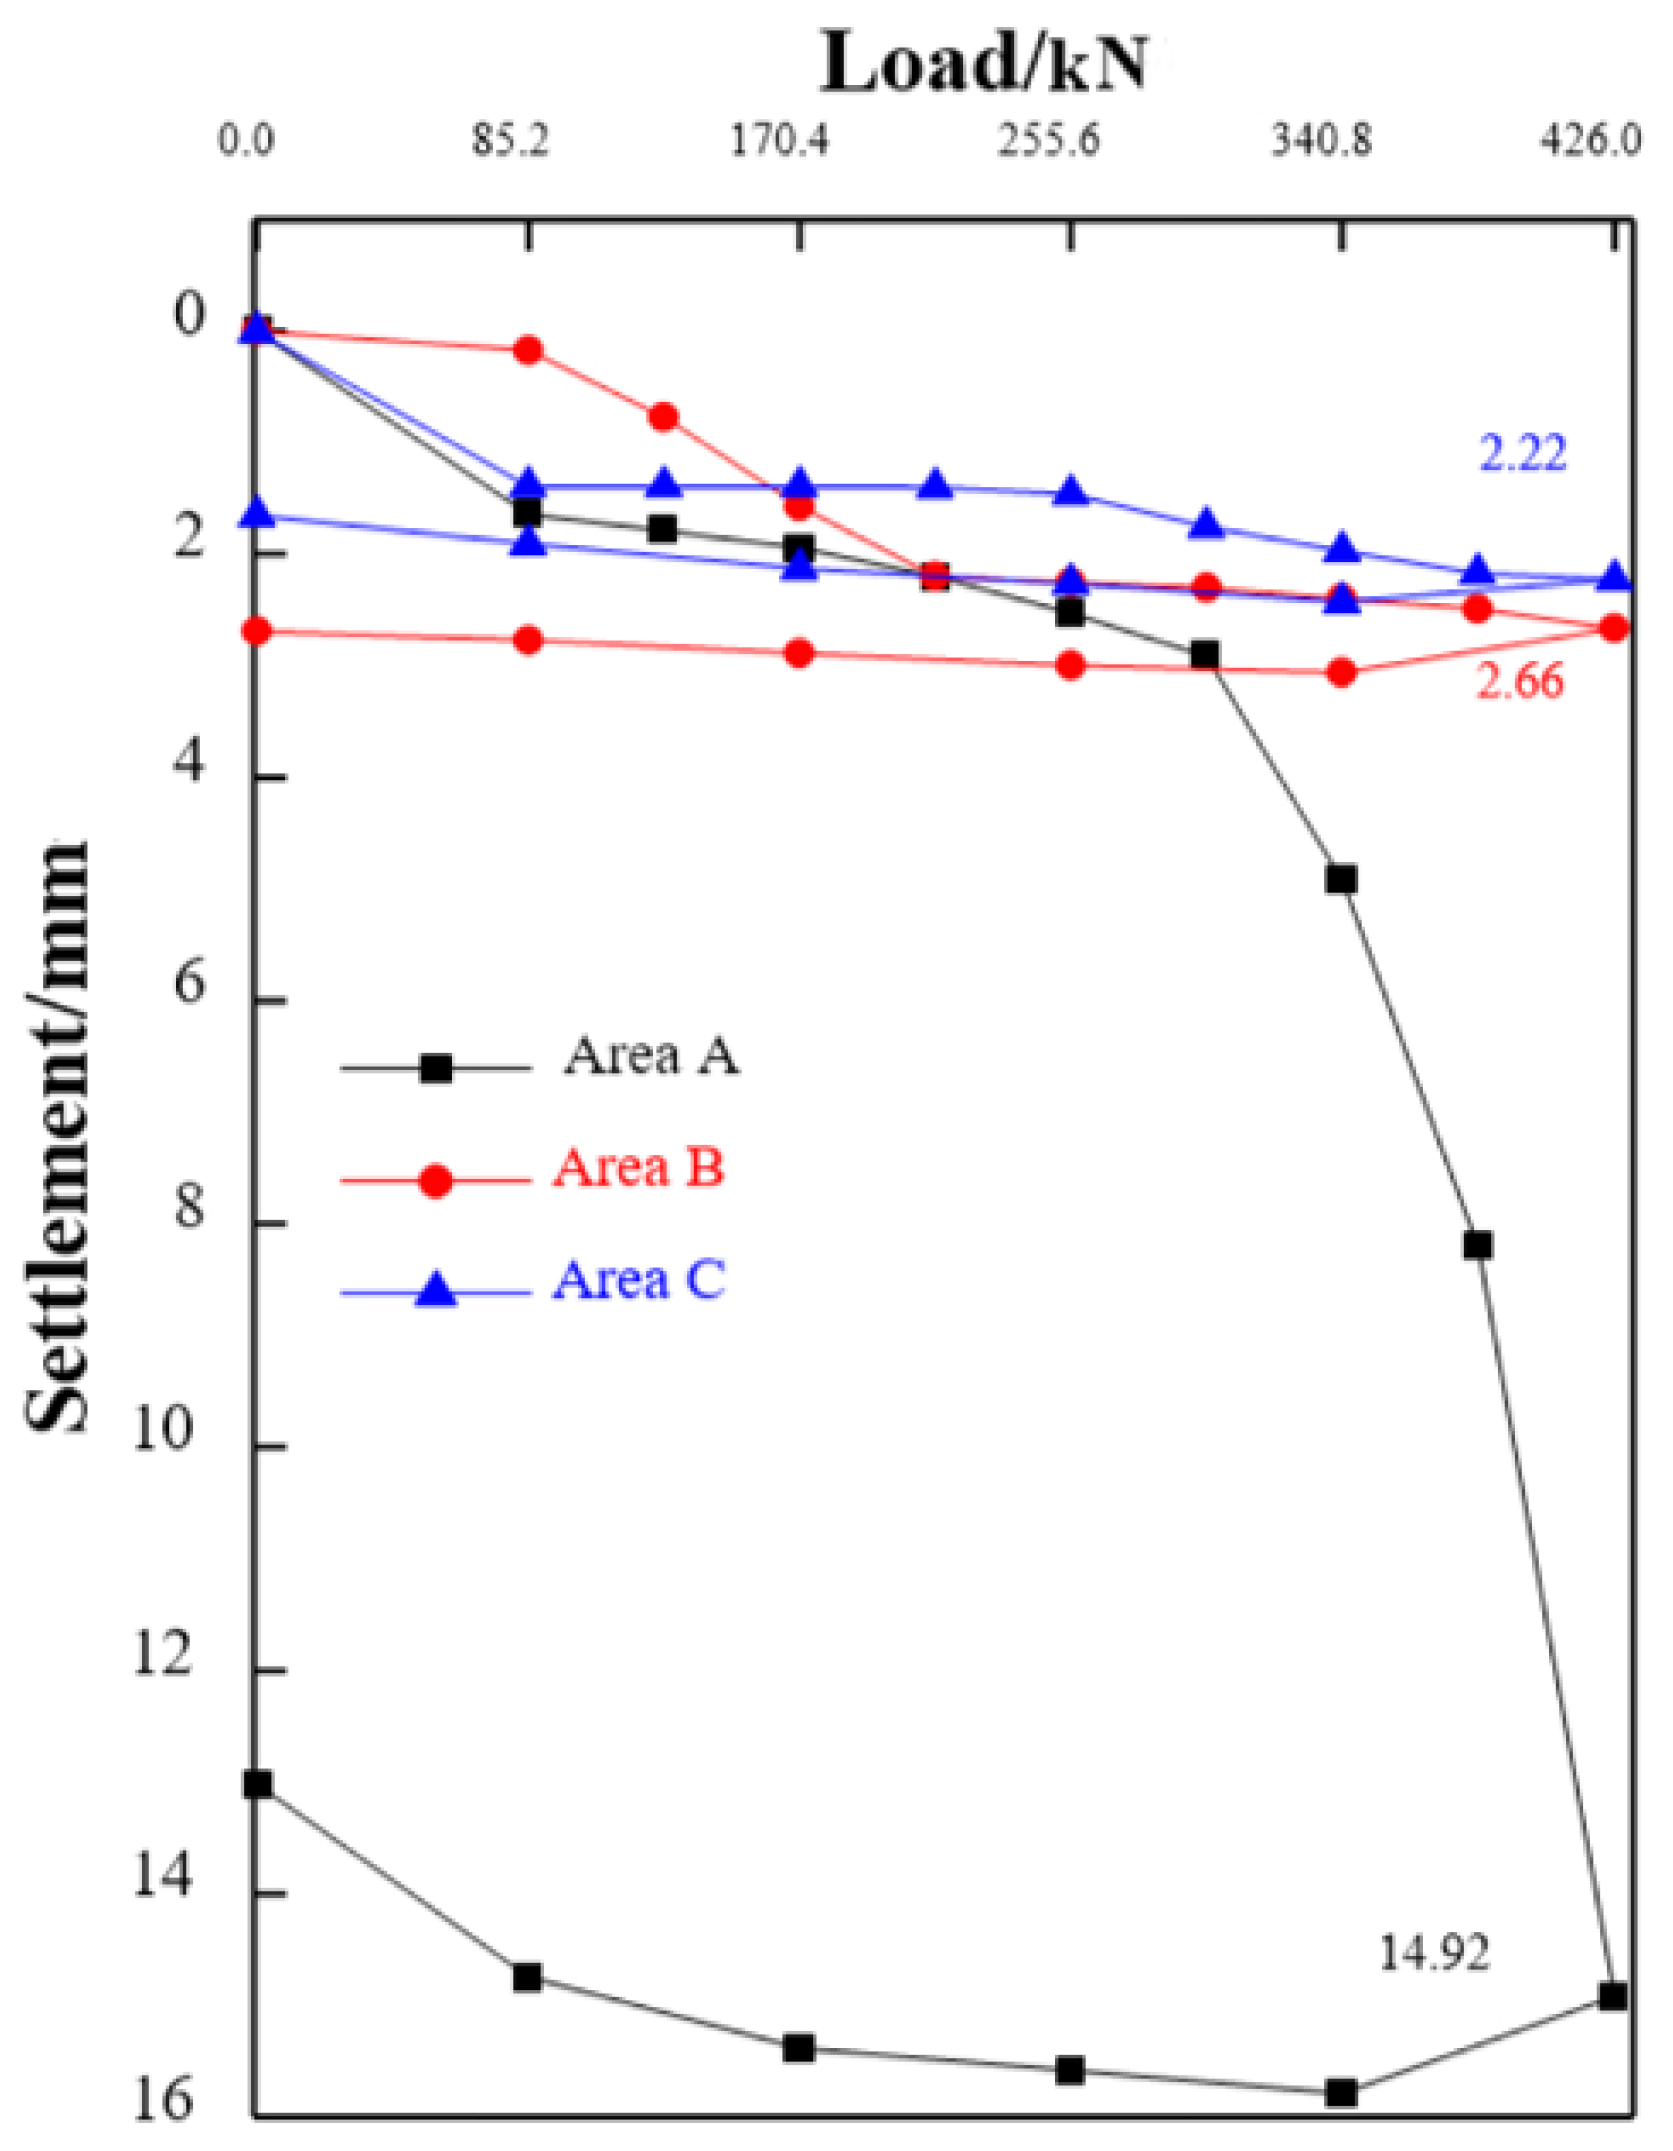
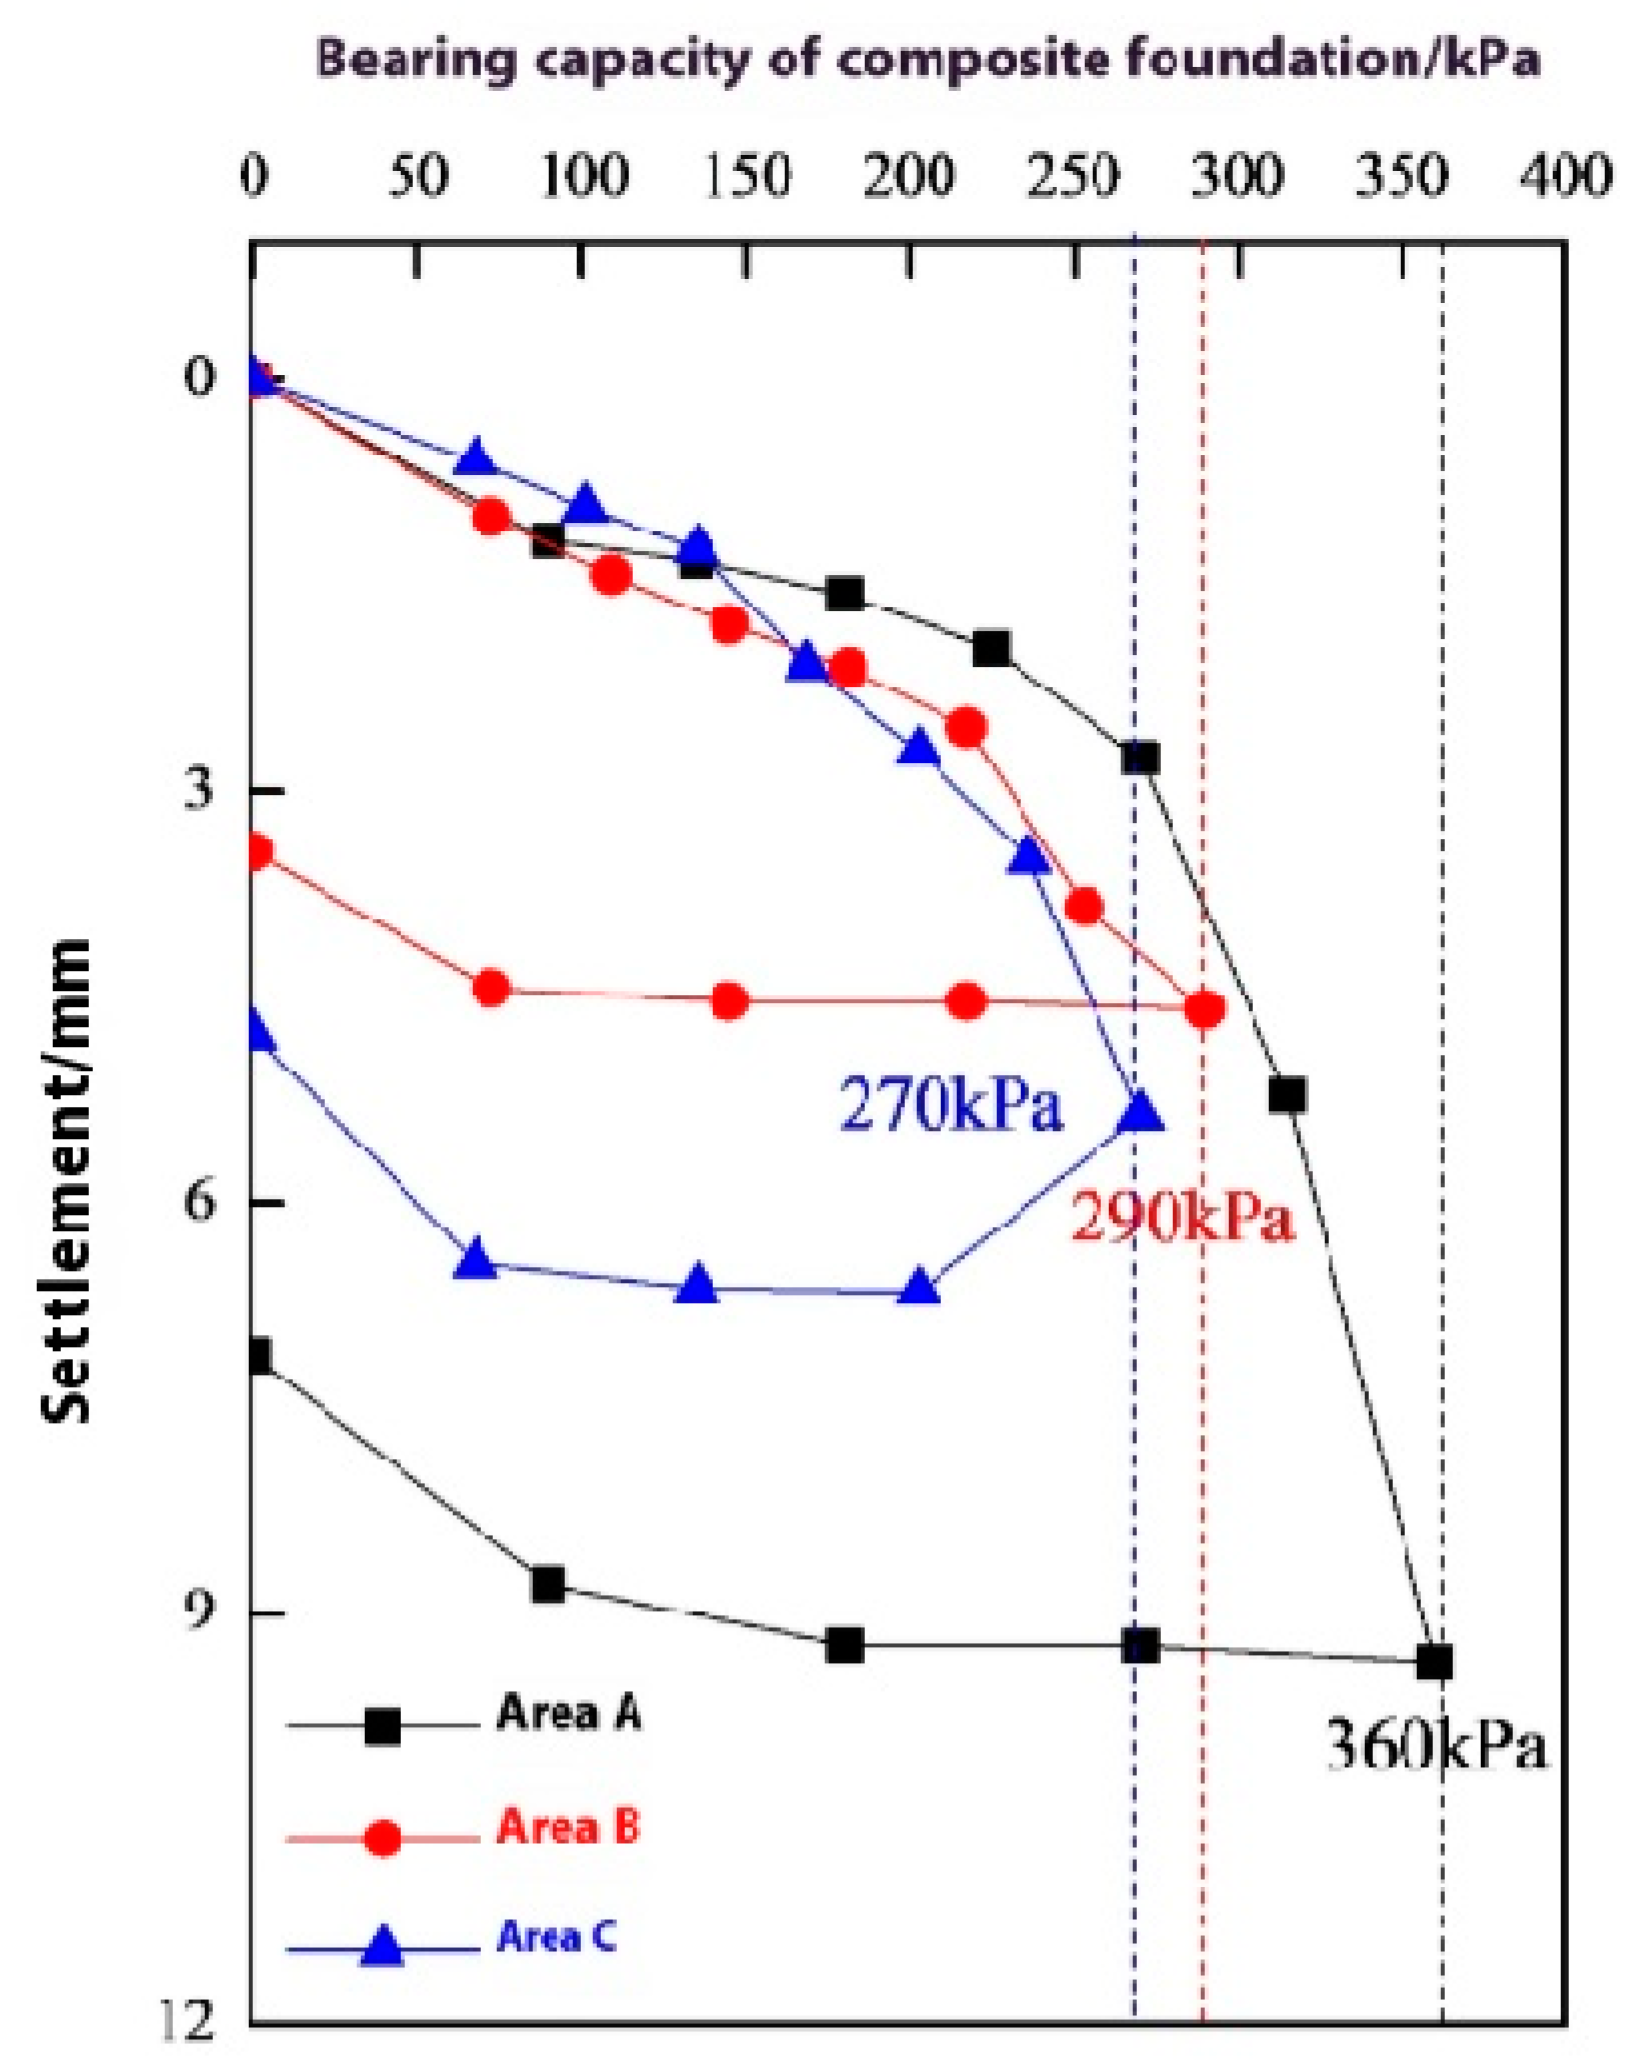
6. Engineering Applications
7. Conclusions and Prospects
7.1. Conclusions
- Drilling head and construction techniques for cement–soil pipe piles were developed, their reliability through on-site testing was validated, and a novel method for composite foundation treatment was proposed.
- As the diameter of equal cross-section cylinder piles increases, their single-pile bearing capacity rises, while the unit volume bearing capacity initially increases and then decreases, with the axial force showing a pattern of larger results upwards and smaller downwards.
- An exponential decay model using plastic shear strain was introduced, where cohesion, friction angle, and shear expansion angle decrease exponentially with shear plastic strain, effectively modeling strain softening in cement–soil pipe piles. The model’s validity was confirmed by triaxial tests and on-site single-pile bearing assessments.
- The diameter of cement–soil pipe piles significantly influences bearing capacity, with an increase from 600 mm to 1000 mm enhancing capacity by 2.14 times, while wall thickness has a minimal impact. The typical effective length is around 10 m. Larger diameters improve overall capacity but decrease per unit volume. A 600 mm diameter and 150 mm wall thickness are optimal for efficient material use.
- This study explores how the dimensions of cement–soil pipe piles affect their load-bearing capacity. Future research will address factors like lateral friction, end resistance, axial load, and soil core influence on bearing properties, enhancing understanding of load-bearing mechanisms.
7.2. Prospects
Author Contributions
Funding
Data Availability Statement
Conflicts of Interest
References
- Wang, B.; Zhang, Y. Analysis of settlement characteristics of cement-soil mixed pile roadbed in soft soil area. Highway 2021, 66, 107–114. [Google Scholar]
- Zhao, C.; Hu, J.; Huang, Q.; Lang, F.; Leng, W.; Chen, L. Model Test on railway embankment reinforced with inclined soil-cement piles. J. China Railw. Soc. 2021, 43, 136–141. [Google Scholar]
- Sun, M.; Zhang, N.; Xiao, J.; Liu, M. Application of cement-soil mixing piles in embankment landslide treatment. Yellow River 2016, 38, 120–122. [Google Scholar]
- Lv, G.; Ge, J.; Xiao, H. Treatment of coastal soft foundation with cement-soil mixing pile. J. Shandong Univ. (Eng. Sci.) 2020, 50, 73–81. [Google Scholar]
- Bai, Y.; Jiang, C.; Zhao, D. Application of cement-soil mixing pile in soft soil foundation reinforcement. Yellow River 2022, 44, 280–281. [Google Scholar]
- Wang, X.; Cheng, Q.; Pang, J.; Wang, Q.; Liu, F. Engineering properties of waterproof curtain from cement mixing piles. Chin. J. Undergr. Space Eng. 2015, 11, 706–712. [Google Scholar]
- Liu, S.; Xi, P.; Chu, H.; Gong, N. Research on practice of bidirectional deep mixing cement-soil columns for reinforcing soft ground. Rock. Soil Mech. 2007, 28, 560–564. [Google Scholar]
- Liu, S.Y.; Du, Y.J.; Yi, Y.L. Field Investigations on Performance of T-Shaped Deep Mixed Soil Cement Column–Supported Embankments over Soft Ground. J. Geotech. Geoenviron. Eng. 2012, 138, 718–727. [Google Scholar] [CrossRef]
- Yi, Y.; Liu, S.; Zhao, W.; Sun, H.; Chen, W.; Li, H. Installation of variable diameter soil-cement double mixed column. Chin. J. Geotech. Eng. 2010, 32 (Suppl. 2), 387–390. [Google Scholar]
- Xi, P.; Liu, S. Load transmission law of T-shaped cement-soil mixing piles. Build. Struct. 2014, 44, 96–100. [Google Scholar]
- Liu, H.; Fei, K.; Ma, X.; Gao, Y. Cast-in-situ concrete thin-wall pipe pile with Vibrated and steel tube mould technology and its application (I): Development and design. Rock. Soil Mech. 2003, 24, 164–168. [Google Scholar]
- Liu, H.; Hao, X.; Fei, K.; Chen, Y. Field pour concrete thin wall cased pile technology and its application (II): Application and in-situ test. Rock. Soil Mech. 2003, 24, 372–375. [Google Scholar]
- Liu, H.; Tao, X.; Zhang, J.; Chen, Y. Behavior of PCC pile composite foundation under lateral load. Rock. Soil Mech. 2010, 31, 2716–2722. [Google Scholar]
- Liu, H.; Zhou, M.; Chen, Y.; Xie, S.; Sun, H. Field test of railway soft clay subgrade reinforced by PCC piles. Rock. Soil Mech. 2012, 33, 3201–3207. [Google Scholar]
- Wang, Z.; Gong, X.; Ding, Z.; Zhou, J. Research on influence of soil core on load bearing character of large-diameter tubular pile using cast-in-situ concrete. Chin. J. Rock. Mech. Eng. 2005, 24, 3916–3921. [Google Scholar]
- Xu, J.; Zheng, L.; Yu, Z.; Li, Y.; Cai, G. Effects of bending stiffness and interface roughness on tunnel-embedded wall interaction. Tunn. Undergr. Space Technol. 2025, 155, 106209. [Google Scholar] [CrossRef]
- Xu, J.; Gao, M.; Wang, Y.; Yu, Z.; Zhao, J.; DeJong, M. Numerical investigation of the effects of separated footings on tunnel-soil-structure interaction. J. Geotech. Geoenviron. Eng. 2025. accepted. [Google Scholar]
- Quiroga, A.J.; Thompson, Z.M.; Muraleetharan, K.K.; Miller, G.A.; Cerato, A.B. Stress–strain behavior of cement-improved clays: Testing and modeling. Acta Geotech. 2017, 12, 1003–1020. [Google Scholar] [CrossRef]
- Aniroot, S.; Suksun, H. Evaluation of cement stabilized recycled asphalt pavement/lateritic soil blends for soft soil improvement. Rock Soil Mech. 2023, 43, 3305–3315. [Google Scholar]
- Yapage, N.N.S.; Liyanapathirana, D.S. A review of constitutive models for cement-treated clay. Int. J. Geotech. Eng. 2019, 13, 525–537. [Google Scholar] [CrossRef]
- Yapage, N.N.S.; Liyanapathirana, D.S.; Poulos, H.G.; Kelly, R.B.; Leo, C.J. Numerical modeling of geotextile-reinforced embankments over deep cement mixed columns incorporating strain-softening behavior of columns. Int. J. Geomech. 2015, 15, 04014047. [Google Scholar] [CrossRef]
- Porcino, D.D.; Marcianò, V. Bonding degradation and stress–dilatancy response of weakly cemented sands. Geomech. Geoengin. 2017, 12, 221–233. [Google Scholar] [CrossRef]
- Kamruzzaman, A.H.; Chew, S.H.; Lee, F.H. Structuration and destructuration behavior of cement-treated Singapore marine clay. J. Geotech. Geoenvironmental Eng. 2009, 135, 573–589. [Google Scholar] [CrossRef]
- Helwany, S. Applied Soil Mechanics with ABAQUS Applications; John Wiley & Sons: Hoboken, NJ, USA, 2007. [Google Scholar]
- Fei, K.; Peng, J. Detailed Explanation of ABAQUS Geotechnical Engineering Examples; Posts and Telecom Press: Beijing, China, 2017. [Google Scholar]
- Wang, Z. Study on Stability of Approach Channel Embankment of Baishan Junction Reinforced by Intelligent Bidirectional Djm Piles. Master’s Thesis, Southeast University, Nanjing, China, 2022. [Google Scholar]
- Yang, H. Experimental research on bearing capacity of single pile of cement-soil mixed pile composite foundation. Master’s Thesis, Zhengzhou University, Zhengzhou, China, 2022. [Google Scholar]
- Feng, W. Research on Bearing Characteristics of Improved Deep Cement Mixing Pile Composite Foundation inYellow River Flooding Area. Ph.D. Thesis, Shandong University, Jinan, China, 2022. [Google Scholar]
- Sophana, K.T. Numerical Analysis of T-Shaped Deep Mixed Soil Cement Columns Supported Embankment. Ph.D. Thesis, Beijing Jiaotong University, Beijing, China, 2019. [Google Scholar]
- Navin, M.P.; Filz, G.M. Statistical analysis of strength data from ground improved with DMM columns. In Proceedings of the Deep Mixing’05: Proceedings, International Conference on Deep Mixing Best Practice and Recent Advances, Stockholm, Sweden, 23–25 May 2005; pp. 145–154. [Google Scholar]
- Bruce, D.A. An Introduction to the Deep Mixing Methods as Used in Geotechnical Applications, Volume III: The Verification and Properties of Treated Ground; Bibliogov: Asheville, NC, USA, 2001. [Google Scholar]
- Porbaha, A.; Shibuya, S.; Kishida, T. State of the art in deep mixing technology. Part III: Geomaterial characterization. Proc. Inst. Civ. Eng.-Ground Improv. 2000, 4, 91–110. [Google Scholar]
- Liu, S.; Qian, G.; Zhang, D. The Principle and Applicationof Dry Jet Mduingcomposite Foundation; China Building Industry Press: Beijing, China, 2006. [Google Scholar]
- Yi, Y. Sustainable Novel Deep Mixing Methods and Theory. Ph.D. Thesis, Southeast University, Nanjing, China, 2013. [Google Scholar]
- Wang, H.; Chen, F.; Huang, J.; Song, M. Investigation into progressive failure mechanisms of geosynthetic-reinforced pile supported embankment considering strain softening behaviors of cement soils. J. Basic Sci. Eng. 2023, 31, 197–209. [Google Scholar]
- Zhao, D. Effective length of deformable pile composite foundation under embankment. J. Hebei Eng. Tech. Coll. 2013, 20–23+65. [Google Scholar]
- Ge, X.; Gong, X.; Zhang, X. Discussion on design calculation method of long-short pile composite foundation. Build. Struct. 2002, 32, 3–5. [Google Scholar]


| Working Condition | Serial Number | OD/mm | ID/mm | Pile Length/mm | Note |
|---|---|---|---|---|---|
| PS | PS | 33 | 33 | 667 | |
| PT-1 | 40 | 20 | 667 | effect of cylinder pile size | |
| PT | PT-2 | 47 | 23 | 667 | |
| PT-3 | 53 | 27 | 667 |
| Appearance | White |
|---|---|
| Density | 1.11~1.15 g/cm3 @25 °C |
| Viscosity | 280~420 cps @ 25 °C |
| Dp | 0.135~0.158 mm |
| Ec | 8.1~9.0 mJ/cm2 |
| Building 1ayer thickness | 0.05~0.12 mm |
| Measurement | Test Method | Value |
|---|---|---|
| 90 min UV post-cure | ||
| Hardness Shore D | ASTM D 2240 | 76~88 |
| Flexural modulus Mpa | ASTM D 790 | 2692~2775 |
| Flexural strength Mpa | ASTM D 790 | 69~74 |
| Tensile modulus MPa | ASTM D 638 | 2589~2695 |
| Tensile strength MPa | ASTM D 638 | 38~56 |
| Elongation at break | ASTM D 638 | 8~12% |
| Poisson’s ratio | ASTM D 638 | 0.4~0.44 |
| Impact strength notched Izod, J/m | ASTM D 256 | 32~38 |
| Heat deflection temperature, °C | ASTM D 648@66 PSI | 39~52 |
| Glass transition, Tg °C | DMA, E” peak | 40~57 |
| Coefficient of thermal expansion/°C | TMA(T) | 90~103 × 106 |
| Density g/cm3 | 1.12~1.18 | |
| Dielectric constant 60 Hz | ASTM D 150-98 | 4.2~5.0 |
| Dielectric constant 1 kHz | ASTM D 150-98 | 3.3~4.2 |
| Dielectric constant 1 MHz | ASTM D 150-98 | 3.2~4.0 |
| Dielectric strength kV/mm | ASTM D 1549-97a | 12.8~16.1 |
| Profundity/m | Material Type | Severe/ (kN/m3) | Cohesion/ kPa | Internal Friction Angle/° | Young’s Modulus/ MPa | Poisson’s Ratio |
|---|---|---|---|---|---|---|
| 0–5 | Silty Clay | 17 | 32 | 28 | 24.5 | 0.3 |
| 5–10 | Dust | 18 | 20 | 20.5 | 22.5 | 0.3 |
| 10–40 | Silt | 18.5 | 12 | 28 | 17.5 | 0.3 |
| Modulus of Elasticity (kPa) | Cohesion (kPa) | Angle of Internal Friction (°) | Residual Value of Cohesion (kPa) | Residual Value of Angle of Internal Friction (°) | Cr/C0 | Critical Plastic Shear Strain εd0 (%) |
|---|---|---|---|---|---|---|
| 225 × 103 | 412 | 35 | 164.8 | 21 | 0.6 | 1 |
| Φ600 mm Single Pile Bearing Capacity (kN) | Φ800 mm Single Pile Bearing Capacity (kN) | ||||
|---|---|---|---|---|---|
| On-Site Measurement | Exponential Decay Mohr–Coulomb | Mohr–Coulomb | On-Site Measurement | Exponential Decay Mohr–Coulomb | Mohr–Coulomb |
| 430 | 445 | 445 | 785 | 670 | 670 |
| Operating Condition | Outer Diameter/mm | Inner Diameter/mm | Pile Length/m | Pipe Wall Thickness/mm |
|---|---|---|---|---|
| 1 | 600 | 0 | 10 | 300 (Solid Core Pile) |
| 2 | 600 | 300 | 10 | 150 |
| 3 | 600 | 200 | 10 | 200 |
| 4 | 600 | 100 | 10 | 250 |
| 5 | 700 | 350 | 10 | 175 |
| 6 | 800 | 400 | 10 | 200 |
| 7 | 1000 | 500 | 10 | 250 |
| 8 | 600 | 300 | 6 | 150 |
| 9 | 600 | 300 | 8 | 150 |
| 10 | 600 | 300 | 12 | 150 |
| Zones | Pile Spacing/m | Eigenvalue of Bearing Capacity of Single Pile/kN | Eigenvalues of Bearing Capacity of Composite Foundations/kPa | Number of Piles/m | Cement Usage/t | ||||
|---|---|---|---|---|---|---|---|---|---|
| Devise | Pipe Pile | Devise | Pipe Pile | Devise | Pipe Pile | Devise | Pipe Pile | ||
| A | 1.2 | 1.5 | 140 | 213 | 180 | 11256 | 7475 | 617 | 447 |
| B | 1.5 | 1.8 | 140 | 213 | 145 | ||||
| C | 1.8 | 2.2 | 140 | 213 | 135 | ||||
Disclaimer/Publisher’s Note: The statements, opinions and data contained in all publications are solely those of the individual author(s) and contributor(s) and not of MDPI and/or the editor(s). MDPI and/or the editor(s) disclaim responsibility for any injury to people or property resulting from any ideas, methods, instructions or products referred to in the content. |
© 2025 by the authors. Licensee MDPI, Basel, Switzerland. This article is an open access article distributed under the terms and conditions of the Creative Commons Attribution (CC BY) license (https://creativecommons.org/licenses/by/4.0/).
Share and Cite
Zhou, C.; Zheng, X.; Zhang, S.; Li, C.; Yang, Y.; Han, J. Study on Load-Bearing Characteristics and Engineering Applications for Cement–Soil Pipe Pile. Buildings 2025, 15, 912. https://doi.org/10.3390/buildings15060912
Zhou C, Zheng X, Zhang S, Li C, Yang Y, Han J. Study on Load-Bearing Characteristics and Engineering Applications for Cement–Soil Pipe Pile. Buildings. 2025; 15(6):912. https://doi.org/10.3390/buildings15060912
Chicago/Turabian StyleZhou, Chong, Xiangzhuo Zheng, Sifeng Zhang, Chao Li, Yaohui Yang, and Jianyong Han. 2025. "Study on Load-Bearing Characteristics and Engineering Applications for Cement–Soil Pipe Pile" Buildings 15, no. 6: 912. https://doi.org/10.3390/buildings15060912
APA StyleZhou, C., Zheng, X., Zhang, S., Li, C., Yang, Y., & Han, J. (2025). Study on Load-Bearing Characteristics and Engineering Applications for Cement–Soil Pipe Pile. Buildings, 15(6), 912. https://doi.org/10.3390/buildings15060912