Article

A Study on the Spatial Perception and Inclusive Characteristics of Outdoor Activity Spaces in Residential Areas for Diverse Populations from the Perspective of All-Age Friendly Design

1
School of Architecture, Tianjin University, No. 92, Weijin Road, Nankai District, Tianjin 300072, China
2
Tianjin Key Laboratory of Healthy Habitat and Smart Technology, No. 92, Weijin Road, Nankai District, Tianjin 300072, China
3
College of Design and Engineering, National University of Singapore, Block EA, #06-16, 9 Engineering Drive 1, Singapore 117575, Singapore
*
Author to whom correspondence should be addressed.
Buildings 2025, 15(6), 895; https://doi.org/10.3390/buildings15060895
Submission received: 21 February 2025 / Revised: 7 March 2025 / Accepted: 11 March 2025 / Published: 13 March 2025
(This article belongs to the Section Architectural Design, Urban Science, and Real Estate)

Abstract

With the transformation of urban development patterns and profound changes in population structure in China, outdoor activity spaces in residential areas are facing common issues such as obsolete infrastructure, insufficient barrier-free facilities, and intergenerational conflicts, which severely impact residents’ quality of life and hinder high-quality urban development. Guided by the principles of all-age friendly and inclusive design, this study innovatively integrates eye-tracking and multi-modal physiological monitoring technologies to collect both subjective and objective perception data of different age groups regarding outdoor activity spaces in residential areas through human factor experiments and empirical interviews. Machine learning methods are utilized to analyze the data, uncovering the differentiated response mechanisms among diverse groups and clarifying the inclusive characteristics of these spaces. The findings reveal that: (1) Common Demands: All groups prioritize spatial features such as unobstructed views, adequate space, diverse landscapes, proximity accessibility, and smooth pavement surfaces, with similar levels of concern. (2) Differentiated Characteristics: Children place greater emphasis on environmental familiarity and children’s play facilities, while middle-aged and elderly groups show heightened concern for adequate space, efficient parking management, and barrier-free facilities. (3) Technical Validation: Heart Rate Variability (HRV) was identified as the core perception indicator for spatial inclusivity through dimensionality reduction using Self-Organizing Maps (SOM), and the Extra Trees model demonstrated superior performance in spatial inclusivity prediction. By integrating multi-group perception data, standardizing experimental environments, and applying intelligent data mining, this study achieves multi-modal data fusion and in-depth analysis, providing theoretical and methodological support for precisely optimizing outdoor activity spaces in residential areas and advancing the development of all-age friendly communities.

1. Introduction

Driven by the dual forces of accelerated new-type urbanization and deep social structural transformation, China is facing spatial governance challenges brought about by dramatic changes in its population age structure [1]. According to the Seventh National Population Census, the proportion of the population aged 65 and above has reached 13.5%, an increase of 4.63 percentage points compared to 2010 [2], indicating a continuous intensification of the aging problem [3,4]. This not only places immense pressure on the social security system and healthcare resource allocation but also raises higher demands for the adaptability of living environments. Simultaneously, the population aged 0–17 has reached 298 million, accounting for 21.1% of the total population [2]. As an important social group, the needs of children for growth and development have not been adequately met in urban and residential construction, with widespread issues such as insufficient public spaces and activity facilities, as well as a lack of safety and friendliness in their growing environments. The dual challenges of “the elderly and the young” reflect deep-seated contradictions between the supply of residential spaces and the evolving needs across generations.
As a core component of residents’ daily lives, the design flaws of outdoor activity spaces in residential areas can exacerbate intergenerational conflicts through spatial exclusion. For instance, the elderly experience a shrinking radius of activity due to the lack of barrier-free facilities [5], children are forced to turn to risky areas such as streets due to insufficient play spaces [1], and middle-aged and young adults feel a sense of spatial deprivation as fitness spaces are increasingly encroached upon [6]. The concepts of all-age friendly and inclusive design provide a theoretical breakthrough for this predicament. By creating inclusive spaces that cater to the needs of all age groups, these concepts promote intergenerational interactions, broaden the dimensions of social engagement, and foster a cohesive state of mutual assistance and reciprocity [7], thereby alleviating intergenerational conflicts and enhancing the sense of happiness and fulfillment among all residents [8,9].
Based on the above background, this study aims to enhance the inclusivity of outdoor activity spaces in residential areas. To achieve this, a progressive research framework of “element identification–typology classification–feature analysis” was established. First, a standardized experiential environment was created using a VR panoramic platform, and technologies including eye-tracking and multi-modal physiological monitoring were integrated into human factors experiments to collect both subjective evaluations and objective physiological data from different age groups under a unified scenario. Next, a Self-Organizing Map (SOM) neural network was employed to perform dimensionality reduction on the collected data, uncovering the underlying relationships between various physiological indicators and spatial inclusivity, thereby classifying spatial inclusivity. Finally, supervised machine learning models were used to analyze the differential response mechanisms of diverse groups to spatial elements, clarifying the characteristic of spatial inclusivity and forming a complete research pathway of “data collection–pattern recognition–law extraction”. Through the fusion of multi-group perception data, standardization of the experimental environment, and intelligent data mining, this study achieved multimodal data integration and in-depth analysis, revealing both the commonalities and differences in spatial perception among different groups and providing theoretical and methodological support for the design of all-age friendly residential areas.

1.1. The Connotation and Relationship of All-Age Friendly and Inclusive Design

The concept of all-age friendly design originates from the idea of all-age communities [10]. It aims to construct a spatial support system that covers the entire life cycle by providing suitable housing, public service facilities, outdoor environments, and social interaction spaces, enabling residents to access health benefits and social participation opportunities. Its connotation encompasses two dimensions: the temporal dimension of being lifetime-oriented emphasizes the dynamic adaptation to individual needs across different life stages, while the spatial dimension of all-age friendly design focuses on creating symbiotic spaces for intergenerational groups. This concept represents a critical reflection on the traditional single-group-oriented approach in community planning, marking a shift from “compensatory differentiation” to “systemic inclusion”. Although the concept of all-age friendly design has gained widespread recognition, its implementation at the residential level still faces numerous challenges. Most residential developments continue to be oriented toward single groups, such as addressing aging through community-based elderly care services, and few residential areas have truly achieved intergenerational integration.
Inclusive design provides essential methodological support for the development of all-age friendly residential areas. This concept, proposed in the mid-1990s in the UK, is closely related to theories such as Design for All and Universal Design. Inclusive design does not focus solely on a specific group but emphasizes the universality and inclusiveness of design [11]. Its core lies in meeting diverse needs to ensure that spaces can be used by as many people as possible. The theoretical foundations of inclusive design include the User Pyramid (Figure 1) and the Inclusive Design Cube Model (Figure 2). The User Pyramid theory suggests that design should prioritize the needs of top-tier users, thereby accommodating the needs of middle- and lower-tier users [12]. Meanwhile, the Inclusive Design Cube Model [13] further deconstructs human capability differences into three dimensions—mobility, sensory, and cognitive—emphasizing that design should adapt to the varying capabilities of different groups.
Inclusive design is characterized by fairness, flexibility, and diversity, which collectively form its core philosophy: promoting social equality, diversity, and inclusion through design, ultimately benefiting a broader population. In the context of an aging population and increasing intergenerational conflicts, inclusive design can create living environments that meet the needs of vulnerable groups such as the elderly, children, and people with disabilities while also catering to other age groups. This makes it a valuable theoretical and methodological framework for the development of all-age-friendly residential areas [16].

1.2. Current Research on Spatial Perception Driven by Human Factor Technology

Human Factor Engineering, based on human factor technology, studies the interactions among humans, machines, and environments [17]. By leveraging empirical dynamic human measurement data, it provides precise support for the design of healthy living environments and has been widely applied in fields such as product design [18], user experience evaluation [19], and emergency response of operators [20]. The advancement of human factor technology has offered technical support for spatial perception research by quantifying the physiological and psychological responses of populations to spatial environments, revealing potential spatial exclusion mechanisms, and thereby offering empirical support for space design.
Existing studies widely acknowledge that the essence of spatial perception lies in the dynamic interaction between environmental stimuli and human physiological and psychological responses. Upon receiving environmental information, the brain rapidly processes it, forming an understanding and judgment of the stimuli, which subsequently induces changes in physiological indicators [21]. This understanding not only provides a theoretical foundation for spatial perception research but also enables the use of wearable physiological devices to monitor participants’ real-time feedback in different spatial environments, thereby objectively inferring their psychological characteristics and perceptual states [22]. Xu Xiaotong et al. [23], from the perspective of residents’ psychological experiences, established a comprehensive spatial quality evaluation standard by linking spatial elements with subjective perceptions (e.g., esthetics, vibrancy, safety, affluence, and boredom). Their study emphasized the close relationship between objective spatial characteristics and individual subjective experiences. Zhang Ruoxi et al. [24] utilized VR technology to clarify the characteristics of urban landscape elements, revealing differences in urban element perception among different groups and proposing diversified strategies for urban landscape protection. Their findings indicate that virtual reality not only simulates real spatial environments but also effectively captures differences in spatial perception among various groups, providing valuable insights for urban planning and landscape preservation. Omidvar et al. [25] developed a thermal sensation prediction model by correlating physiological indicators such as skin temperature and heart rate with air temperature, accurately predicting individual thermal sensation. The significance of this research lies in demonstrating a quantifiable relationship between physiological indicators and environmental parameters, opening new avenues for environmental comfort assessment. Zhuang Weimin et al. [26] conducted a dynamic evaluation of historical urban districts using deep learning on street images from different years. Similarly, Liang et al. [27] leveraged street view imagery to uncover the spatiotemporal evolution of urban visual environments and employed clustering analysis to identify patterns in urban landscape changes across both temporal and spatial dimensions. These studies demonstrate that data-driven analytical methods can systematically extract the evolutionary patterns of spatial visual environments, providing robust support for spatial design and landscape optimization.
Despite significant progress in the application of human factor engineering to spatial perception research, certain limitations remain. Current studies often focus on single physiological indicators, lacking synergistic analysis of multimodal data, which makes it difficult to comprehensively establish the complex mechanisms of spatial perception. Additionally, there is limited research on cross-generational perceptual differences among all-age groups, resulting in a lack of precise evidence for inclusive design. Traditional statistical methods are also inadequate for processing high-dimensional heterogeneous data.

1.3. Intelligent Prediction and Model Evaluation Based on Machine Learning

In recent years, machine learning (ML) techniques, owing to their strong nonlinear modeling and generalization capabilities, have demonstrated significant advantages in intelligent prediction tasks across various domains including materials science, medical imaging, financial risk assessment, and industrial manufacturing. Commonly used models include Support Vector Machine (SVM), K-Nearest Neighbors (KNN), Logistic Regression (LR), Decision Tree (DT), and Random Forest (RF). Existing studies have gradually established intelligent prediction frameworks for complex scenarios through algorithmic innovation and data-driven approaches, with a core focus on selecting appropriate models based on data characteristics and systematically evaluating their performance.
Regarding data scale and partitioning strategies, research generally follows the “large sample priority” principle while dynamically adjusting partition ratios according to task requirements. For instance, Kazemi et al. [28] proposed an ensemble ML method integrating Extra Trees Regressor (ETR), Adaptive Boosting (AdaBoost), and Gradient Boosting Regressor (GBR) to predict the mechanical properties of building materials. They adopted a 75% training and 25% validation data split, balancing model complexity and generalization performance. Similarly, Arunkumar et al. [29] analyzed 7200 samples to explore the electronic properties of MXenes using Kernel Ridge Regression (KRR), Support Vector Machine (SVM), and Gaussian Process Regression (GPR) algorithms. They allocated 90% of the data for model training and the remaining for testing, systematically evaluating model performance using RMSE and R2 metrics.
In terms of prediction accuracy comparison, algorithm performance depends on data distribution and task objectives. Aryal et al. [30] assessed the prediction accuracy of thermal comfort models using Random Forest (RF), Support Vector Machine (SVM), and K-Nearest Neighbors (KNN), finding that different ML algorithms exhibited similar predictive accuracy, with SVM slightly outperforming others. Yang et al. [31] developed a thermal comfort model based on physiological and environmental data, demonstrating that K-Nearest Neighbors (KNN) outperformed other algorithms in predicting thermal sensation and comfort. Wu et al. [32] established a local skin temperature prediction model, comparing Random Forest (RF), Logistic Regression (LR), and Support Vector Machine (SVM), and found that Logistic Regression (LR) and Random Forest (RF) achieved higher predictive accuracy (Table 1).
In summary, ML methods have been widely applied to capture and predict complex data characteristics. Existing studies not only focus on the predictive capabilities of individual models but also conduct systematic validation through multi-model comparisons. The literature indicates that dataset sizes range from hundreds to tens of thousands of samples, commonly adopting hold-out validation with training-to-test ratios between 70/30 and 90/10. In small-sample scenarios, a higher proportion of training data (75–90%) is preferred, with cross-validation employed to mitigate overfitting, while large-scale datasets reserve a smaller test set (typically 90%/10%) to balance efficiency and reliability. In terms of evaluation metrics, classification tasks prioritize accuracy and F1-score, whereas regression tasks rely on R2 and RMSE to quantify errors. Notably, ML’s end-to-end feature learning capability reduces reliance on prior knowledge required by traditional methods. Future research should further explore lightweight model architectures, enhanced interpretability techniques, and cross-domain transfer mechanisms to facilitate the broader application of intelligent predictive models in engineering scenarios.

2. Materials and Methods

2.1. Research Framework Construction

This study aims to enhance the inclusivity of outdoor activity spaces in all-age-friendly residential areas, constructing a progressive research framework of “element identification–typology classification–feature analysis” (Figure 2). First, through bibliometric analysis and empirical interviews, the spatial perception elements of diverse populations are systematically identified. Next, a human factor experimental platform is established, integrating devices such as eye-tracking and multi-modal physiological monitoring devices to collect subjective and objective data from different groups in residential outdoor activity spaces. The collected data are then processed through Self-Organizing Map (SOM) neural networks for dimensionality reduction to explore the relationships between physiological indicators and spatial inclusivity, thus classifying spatial inclusivity. Finally, supervised machine learning models are used to analyze the differential responses of diverse groups to spatial elements, clarifying the characteristic differences in spatial inclusivity among these groups. This forms a comprehensive research pathway of “data collection–pattern recognition–law extraction”.

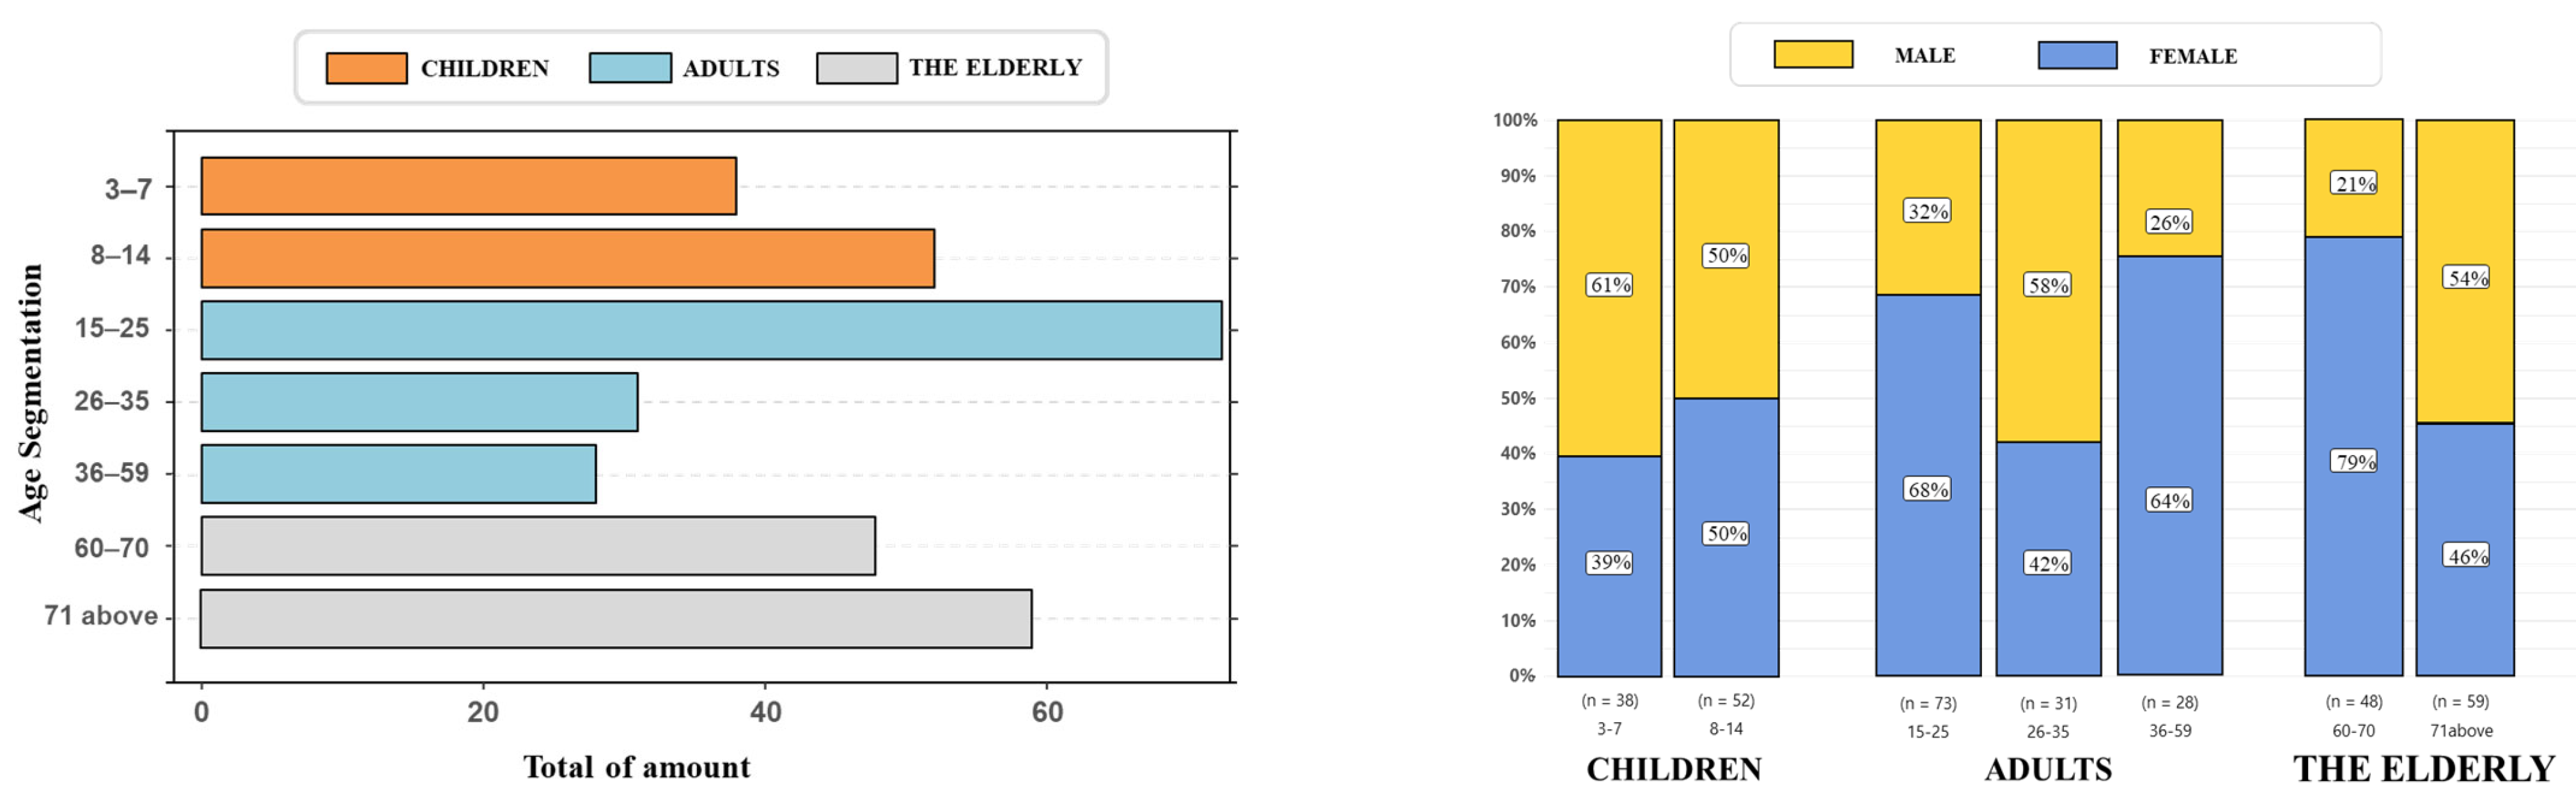
2.2. Population Group Classification

Outdoor activity spaces in residential areas accommodate individuals of different age groups. The significant differences in physical conditions and cognitive abilities caused by age disparities are key factors leading to intergenerational conflicts in the same space [33]. Many research studies have classified population groups based on three main aspects: the roles individuals assume in social divisions (e.g., rights, responsibilities, and status), physiological characteristics (e.g., physical functions and health conditions), and psychological characteristics (e.g., cognitive abilities, emotional states, and values). This has established a multi-layered perspective on population classification.
Based on the diversity and complexity of population groups in residential outdoor activity spaces, this study systematically classifies these groups according to physiological, psychological, and behavioral differences. In the intergenerational relationships within residential outdoor activity spaces, infants and children are in a state of passive physiological nurturing, requiring assistance from other age groups. They are also characterized by easily distracted attention, difficulty maintaining stillness for extended periods, and a tendency to engage in group activities with peers. Young and middle-aged individuals often play the role of organizers in intergenerational relationships, typically bearing dual family responsibilities of raising children and caring for the elderly. The elderly, due to declining physical functions and increased leisure time after retirement, become one of the primary users of residential outdoor activity spaces. These spaces play a crucial role in facilitating community engagement, restoring mental health, and alleviating chronic diseases among the elderly [34].
To address intergenerational conflicts in residential outdoor activity spaces, this study fully considers the natural attributes of intergenerational relationships, such as kinship and age differences, as well as cultural attributes, including values, lifestyles, and emotional patterns [35]. Integrating the concepts of elderly-friendly and child-friendly, this study classifies residential population groups into three categories [9]: children (0–14 years), adults (15–59 years), and the elderly (60 years and above).

2.3. Evaluation Indicator Selection

2.3.1. Objective Physiological Indicator Selection

The detection of physiological indicators is an essential method for studying human responses to perceptual stimuli. Different physiological indicators can reflect individual emotional changes in response to environmental stimuli from various dimensions. Electrodermal Activity (EDA), originating from the autonomous activation of sweat glands, is used to quantify changes in the sympathetic nervous system. It is commonly used to assess participants’ arousal levels and emotional states [36]. Generally, lower EDA values indicate higher relaxation levels [37]. Heart Rate Variability (HRV) is often used as a predictive indicator of overall comfort, cognitive load, and fatigue levels. HRV encompasses multiple metrics, including SDNN, RMSSD, PNN50, and PNN20 [38]. From a statistical perspective, RMSSD is superior to PNN50 [39]. Skin Temperature (SKT) and Respiratory Rate (RESP) are also closely related to emotional fluctuations. When individuals are tense or excited, skin temperature decreases, and respiratory rate increases, whereas the opposite trends occur during relaxation [40]. This study selects four physiological indicators—HRV, EDA, RESP, and SKT—and collects physiological perception data from diverse populations in residential outdoor activity spaces using wearable physiological monitoring devices (e.g., ear clip sensors, finger sensors, and chest strap sensors).

2.3.2. Subjective Evaluation Indicator Selection

Based on the population classification, semi-structured interviews covering all age groups were conducted across multiple residential areas to comprehensively collect subjective perceptions of outdoor activity spaces. A total of 612 interview responses related to spatial perception were obtained, including 111 from children, 293 from adults, and 208 from the elderly. From these responses, 672 keywords were extracted (102 from children, 368 from adults, and 202 from the elderly). Ultimately, 15 subjective evaluation indicators were identified: proximity accessibility, environmental familiarity, adequate space, unobstructed views, diverse landscapes, vibrant colors, cleanliness, tranquility, family companionship (the elderly/children), well-managed parking, smooth pavement surfaces, adequate seating, adequate barrier-free facilities, adequate sport facilities, and adequate children’s play facilities.

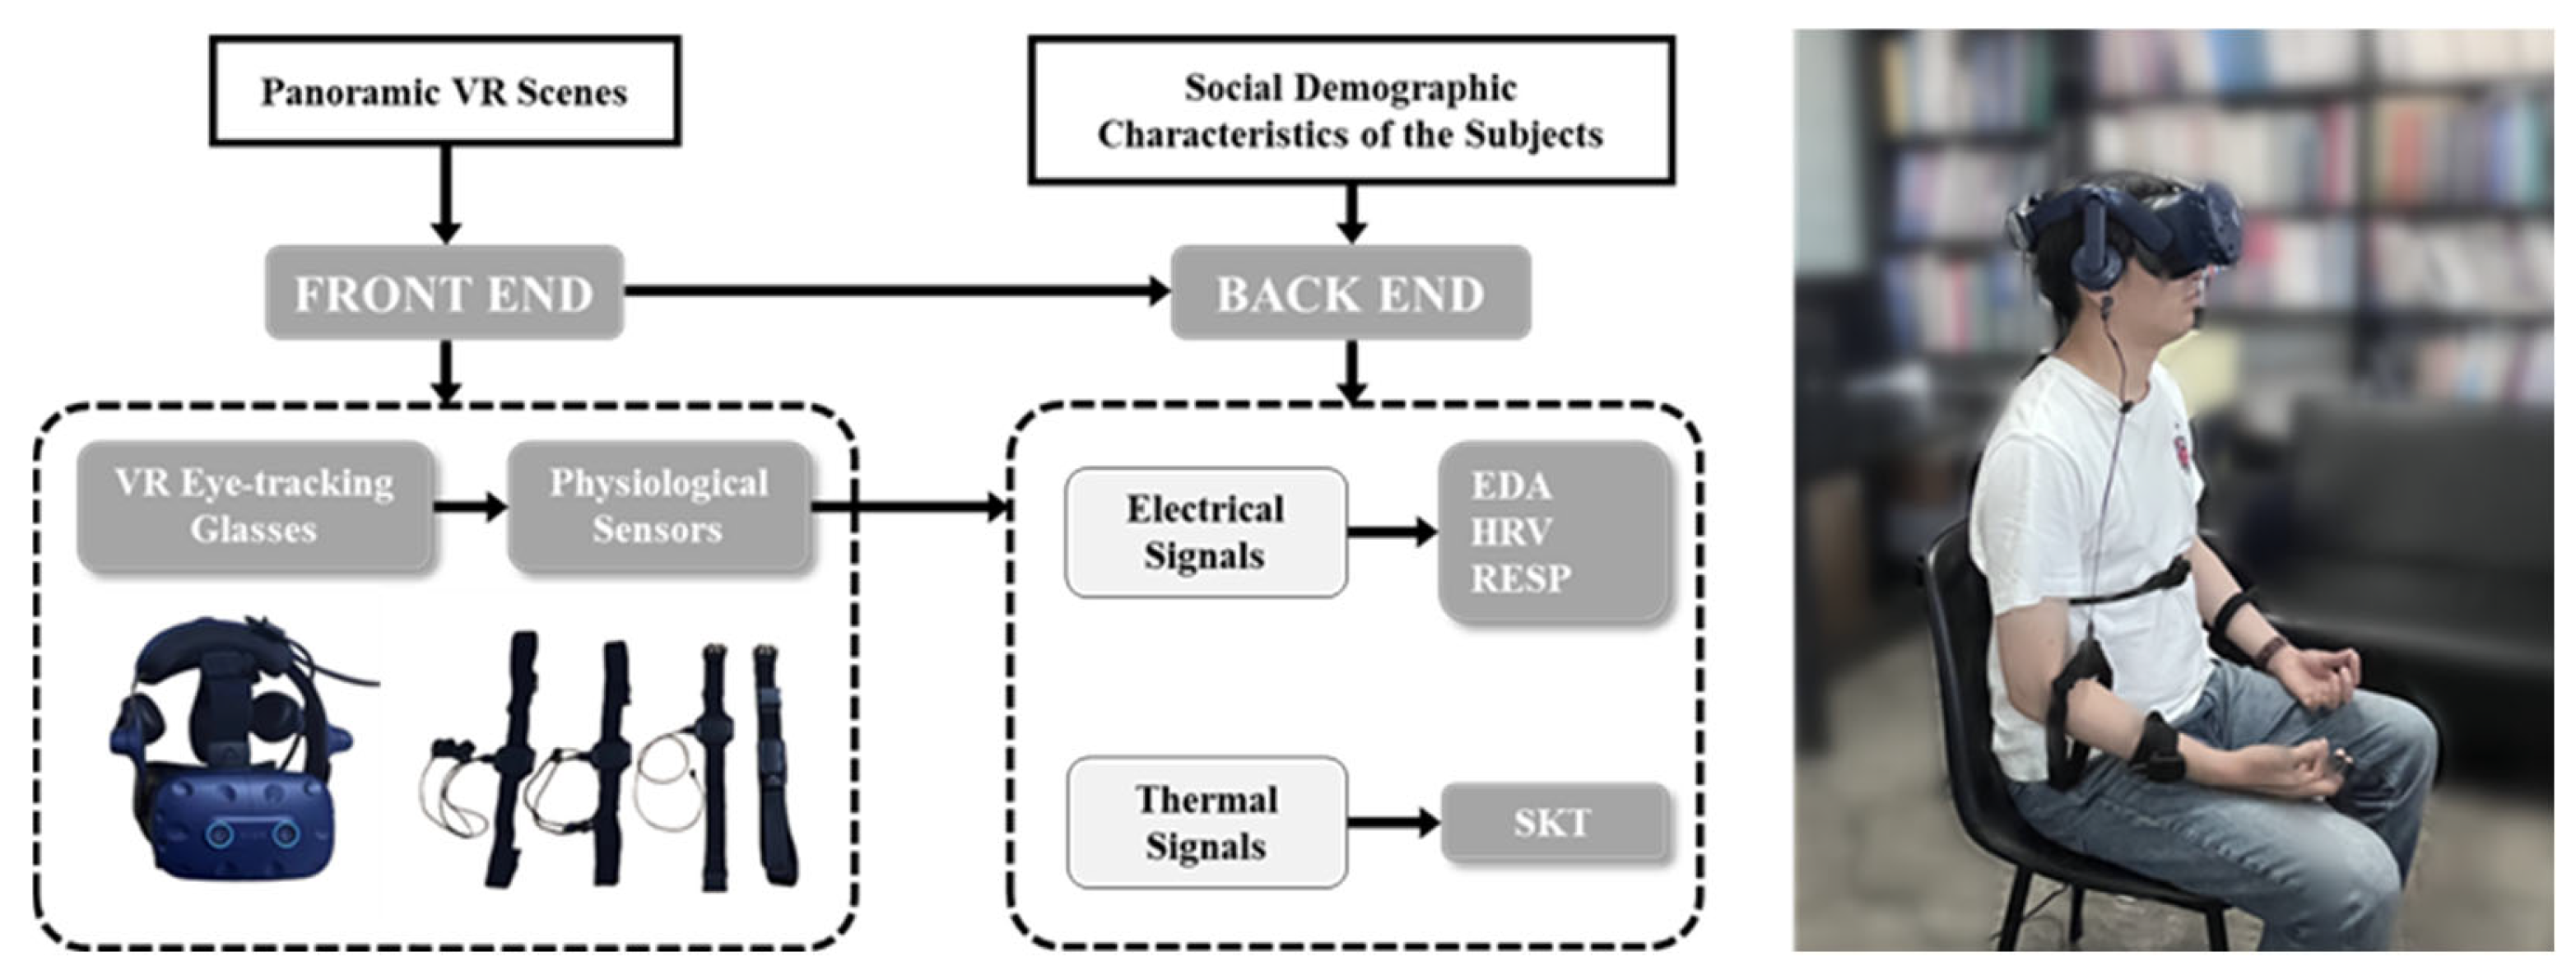
2.4. Human Factor Experiment Setup

2.4.1. Spatial Sample Collection

This study establishes a human-factor experimental platform integrating eye-tracking and multi-modal physiological monitoring devices to collect objective physiological data and subjective evaluation data from diverse groups in residential outdoor activity spaces. To minimize potential biases from different living environments, which could affect the participants’ evaluations, standardized evaluation scenes were generated through VR technology, ensuring uniform visual stimuli for all participants.
To ensure the representativeness of the VR scenes, this study comprehensively considers factors such as regional distribution, urbanization levels, and national urban renewal policies, conducting in-depth investigations in representative cities in China. Specifically, the selection process involved the following aspects: (1) Regional Distribution and Urban Scale: The study covered various regions, including East China, North China, South China, and Southwest China, ensuring that the data reflect variations in urbanization processes and public space planning across diverse geographical areas; (2) Urban Renewal Policies and Economic Development: The selected cities, such as Beijing, Shanghai, and Tianjin, represent first- and second-tier cities characterized by high population density, advanced urbanization, and significant exemplary roles in urban renewal policies. Additionally, small-sized and medium cities, such as Jingdezhen and Suzhou, provide unique perspectives on balancing cultural heritage preservation with modernization efforts.
After extensive field investigations and data comparisons, seven cities were ultimately selected: Beijing, Shanghai, Tianjin, Nanjing, Suzhou, Xiamen, and Jingdezhen. These cities encompass megacities (e.g., Shanghai), new first-tier cities (e.g., Tianjin), and Chinese first batch of urban renewal pilot cities (e.g., Beijing, Jingdezhen, Xiamen, Nanjing, and Suzhou), collectively representing the diversity of residential outdoor activity space at different developmental stages and across various regions. Following further data screening and comparison, a total of 30 residential outdoor activity space scenes, covering both new and old residential areas, were selected for subsequent analysis (Figure 3).

2.4.2. Experimental Platform Construction

The experimental platform consists of two parts: the front-end (participant experience) and the back-end (data processing) (Figure 4). The front-end includes VR headsets and multi-modal physiological monitoring devices. The constructed VR panoramic platform was integrated into the front-end, allowing participants to experience the collected residential outdoor activity spaces through VR headsets. The multi-modal physiological monitoring devices worn by participants captured physiological signals such as electrical and thermal signals. The back-end of the platform converted these signals into digital data recognizable by computers, ultimately generating readable and interpretable physiological data.

2.4.3. Experiment Execution and Data Collection

The experiments were conducted in a controlled laboratory environment to ensure stable indoor temperature, humidity, and lighting conditions, minimizing potential interference with physiological signal acquisition. Additionally, all VR scenarios were uniformly calibrated before deployment to minimize the impact of external environmental factors on participants’ experiences.
The experiment consisted of two phases: the pre-experiment and the formal experiment. Recent studies have shown that random sampling methods may introduce hidden biases or errors [41], as participants may exhibit systematic differences due to voluntary participation, varying adaptability to the experimental environment or other unknown factors. To mitigate these biases, two rounds of the pre-experiment were conducted to refine experimental equipment, experiment duration, and questionnaire design. The formal experiment was then carried out, followed by stringent data quality control procedures to eliminate outliers, further reducing sampling bias and enhancing the representativeness and stability of the results. The processing methods for physiological data are detailed in Section 3.2.1. Moreover, to ensure the accuracy and reliability of physiological data acquisition, all physiological signals were calibrated and validated during the pre-experiment to confirm data stability.
The experimental procedure was as follows: Participants first completed the basic information section of the questionnaire and familiarized themselves with the experimental environment, procedures, and relevant precautions. After these steps, they were fitted with and adjusted for the necessary equipment, then remained on the initial VR interface for 2 min to adapt to the virtual environment. During this period, experimenters monitored participants’ physiological fluctuations in the background to ensure normal responses. Each participant was then randomly assigned 5–10 VR scenes of residential outdoor activity spaces, with a minimum viewing duration of 2 min per scene. To reduce movement-related noise, participants remained seated throughout the experiment. After completing the VR experience, participants filled out the remaining questionnaire sections, rating 15 subjective evaluation indicators for the observed spatial scenarios. Experimenters then verified whether all collected data met quality standards.
A total of 404 participants were recruited, including 126 children, 153 adults, and 125 elderly individuals (Figure 5), with a relatively balanced distribution of gender and age groups. After excluding invalid samples, the final experimental dataset included 102 children, 132 adults, and 107 elderly individuals.

3. Results

3.1. Analysis of Differences in Spatial Subjective Perception

Descriptive statistics and visualization (Figure 6) were applied to the spatial perception content and keywords summarized in Section 2.3.2 to analyze the focus content and potential needs of different groups. The results show that the most prominent keywords for children are adequate children’ s play facilities, diverse landscapes, and environmental familiarity, indicating that children place more emphasis on the recreational and social attributes of spaces and rely heavily on a sense of familiarity with their surroundings. Additionally, the variety of keywords mentioned by children is fewer than that of the other two groups, with significantly lower attention to needs such as environmental safety, cleanliness, and intergenerational conflicts.
In contrast, the spatial perception keywords of adults are more extensive, starting with adequate sport facilities, smooth pavement surfaces, and diverse landscapes, and further extending to factors such as family companionship (elderly/children), well-managed parking, and intergenerational conflicts. This suggests that this group not only has strong demands for physical activities but also pays close attention to whether the space can simultaneously meet their family members’ needs for activities, particularly in terms of safety and convenience.
For the elderly, the primary spatial perception keywords are smooth pavement surfaces, diverse landscapes, and well-managed parking. Compared to middle-aged adults, the elderly place greater emphasis on the completeness of infrastructure, especially the need for spatial safety. At the same time, they are particularly concerned about community-based elderly care and intergenerational conflicts, suggesting that when choosing to use residential outdoor activity spaces, the elderly consider not only their physical conditions and activity needs but also the safety of the space and the availability of elderly care facilities.

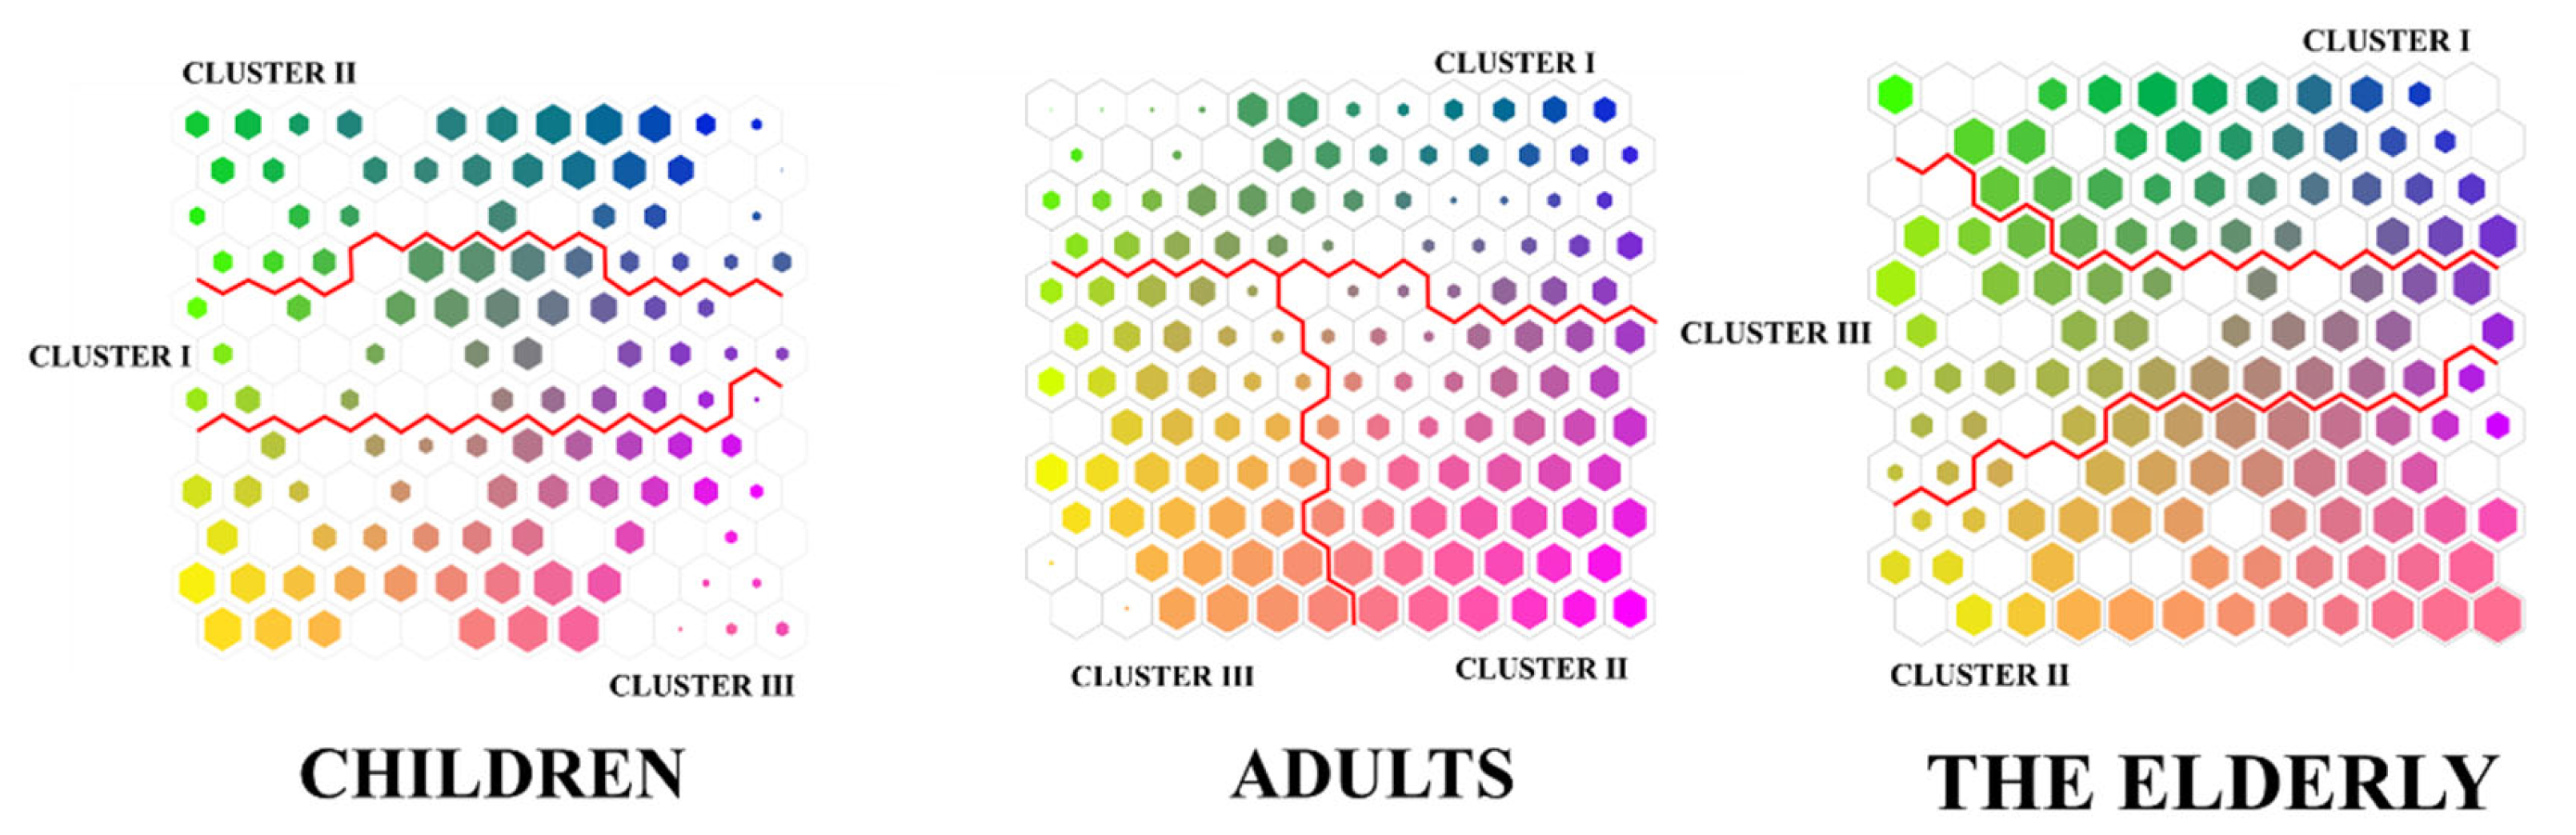
3.2. Analysis of Spatial Inclusivity Classification

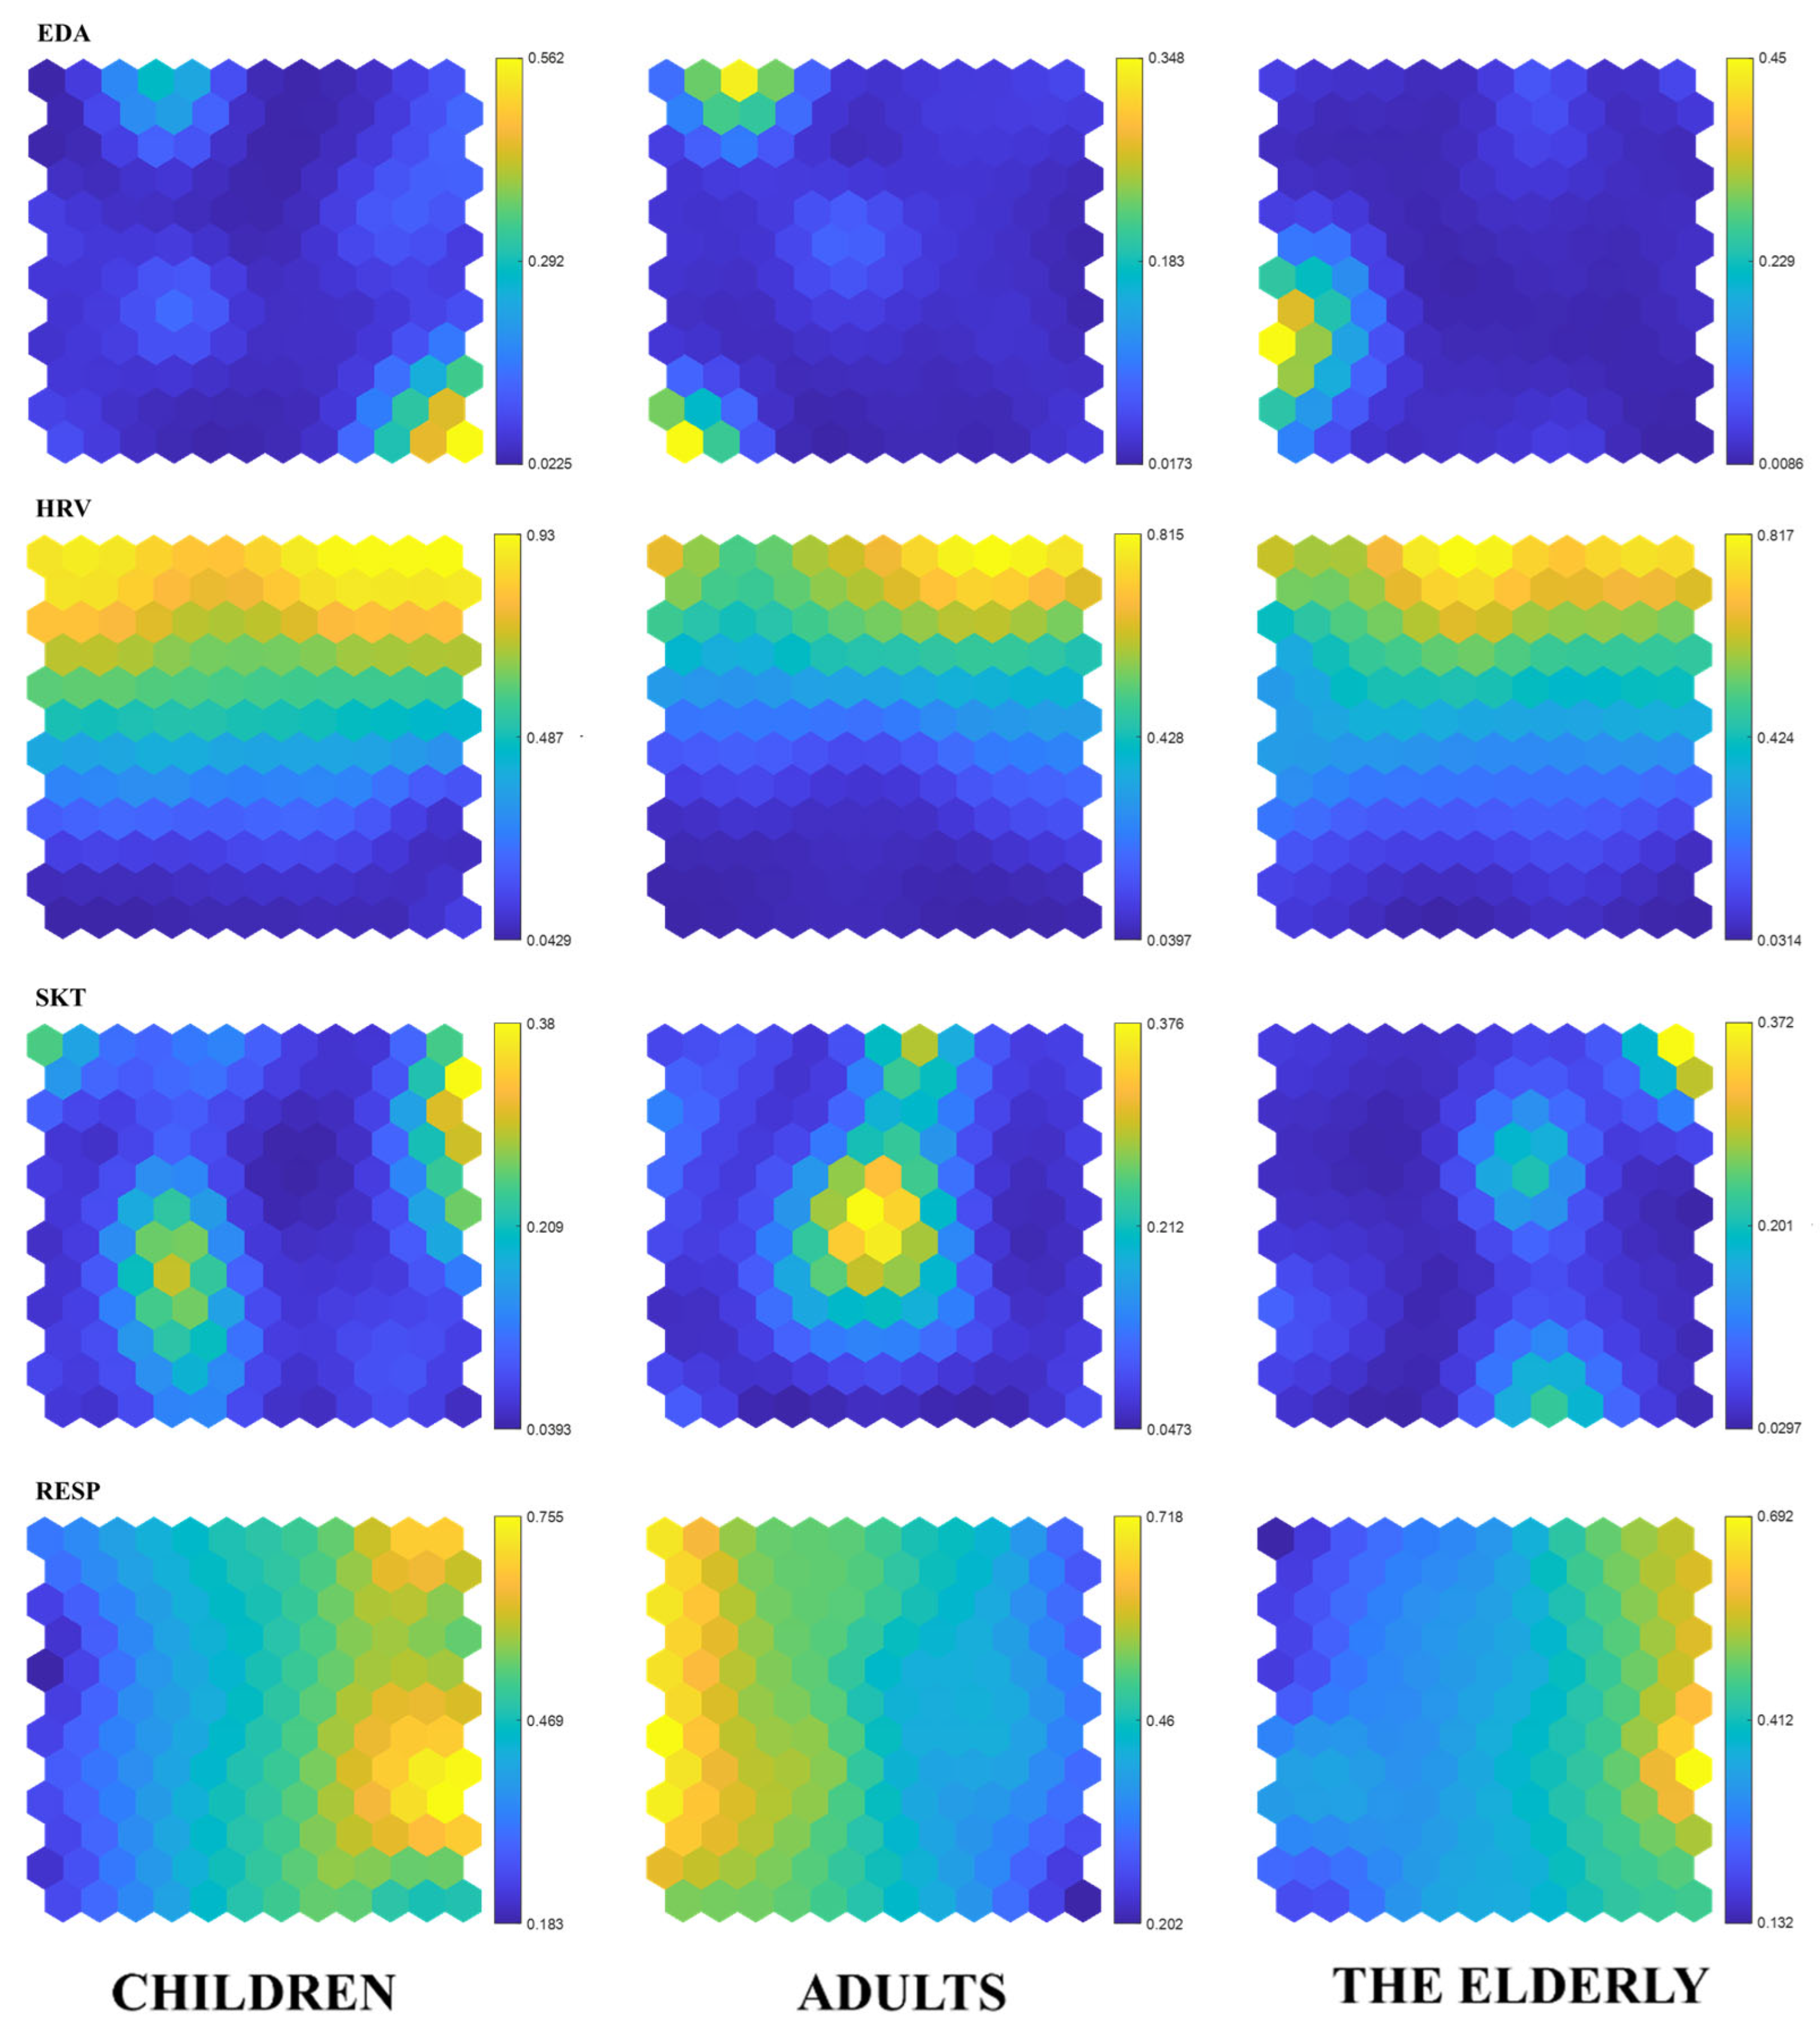
3.2.1. Data Mining Based on SOM Neural Network

To further analyze the inclusivity typology of residential outdoor activity spaces, the four types of physiological data collected were analyzed using the SOM neural network to explore the structural differences among these data types. By integrating the implications of the changes in each indicator, the intrinsic correlation between physiological data and spatial inclusivity was clarified [42].
Firstly, samples with abnormal fluctuations in physiological data were processed to ensure the validity and reliability of the experimental data. Noise signals were removed by reducing the sample sampling rate, applying wavelet denoising, high/low-pass filtering, and band-stop filtering, retaining effective data frequency bands, and eliminating environmental power frequency interference to ensure data quality. Subsequently, the four types of processed physiological data were subjected to variance testing to analyze whether significant differences existed among multiple groups of spatial samples. The results of the variance analysis (Table 2) show a significant p-value of 0.000, indicating that there are significant differences in the four physiological indicators (EDA, HRV, RESP, and SKT), with Cohen’s f values of 3.266, 3.659, and 3.549, indicating large effect sizes.
Next, the SOM neural network was used to unsupervised learning and classification of the four physiological indicators data. The steps of SOM training were as follows: First, the grid size was determined based on the cumulative sample size, and a 17 × 17 two-dimensional grid was constructed in this study. Then, the initial weights of each neuron in the competitive layer were set, and random input samples were fed through each node in the competitive layer. The Euclidean distance between the sample and each node was calculated, and the node with the smallest distance was selected as the winning node. Next, the winning neighborhood was determined based on the neighborhood radius, and the weights of the nodes within this neighborhood were updated using the neighborhood function [43]. This learning process was repeated until the objective function no longer changed, indicating model convergence, and the clustering results were obtained (Figure 7 and Figure 8).
From the visualization results, it is evident that the structural characteristics of the four physiological indicators differ significantly across different neuron regions, indicating that all four types of data influence the clustering results to varying degrees. Additionally, the distribution patterns and clustering results of the four physiological data across the three groups are largely consistent, indicating reliable data quality and demonstrating that the four types of physiological data can reflect the spatial perception of the three groups. Finally, each group’s samples were ultimately divided into three distinct types, confirming the effectiveness of the SOM model in clustering physiological data from different groups.

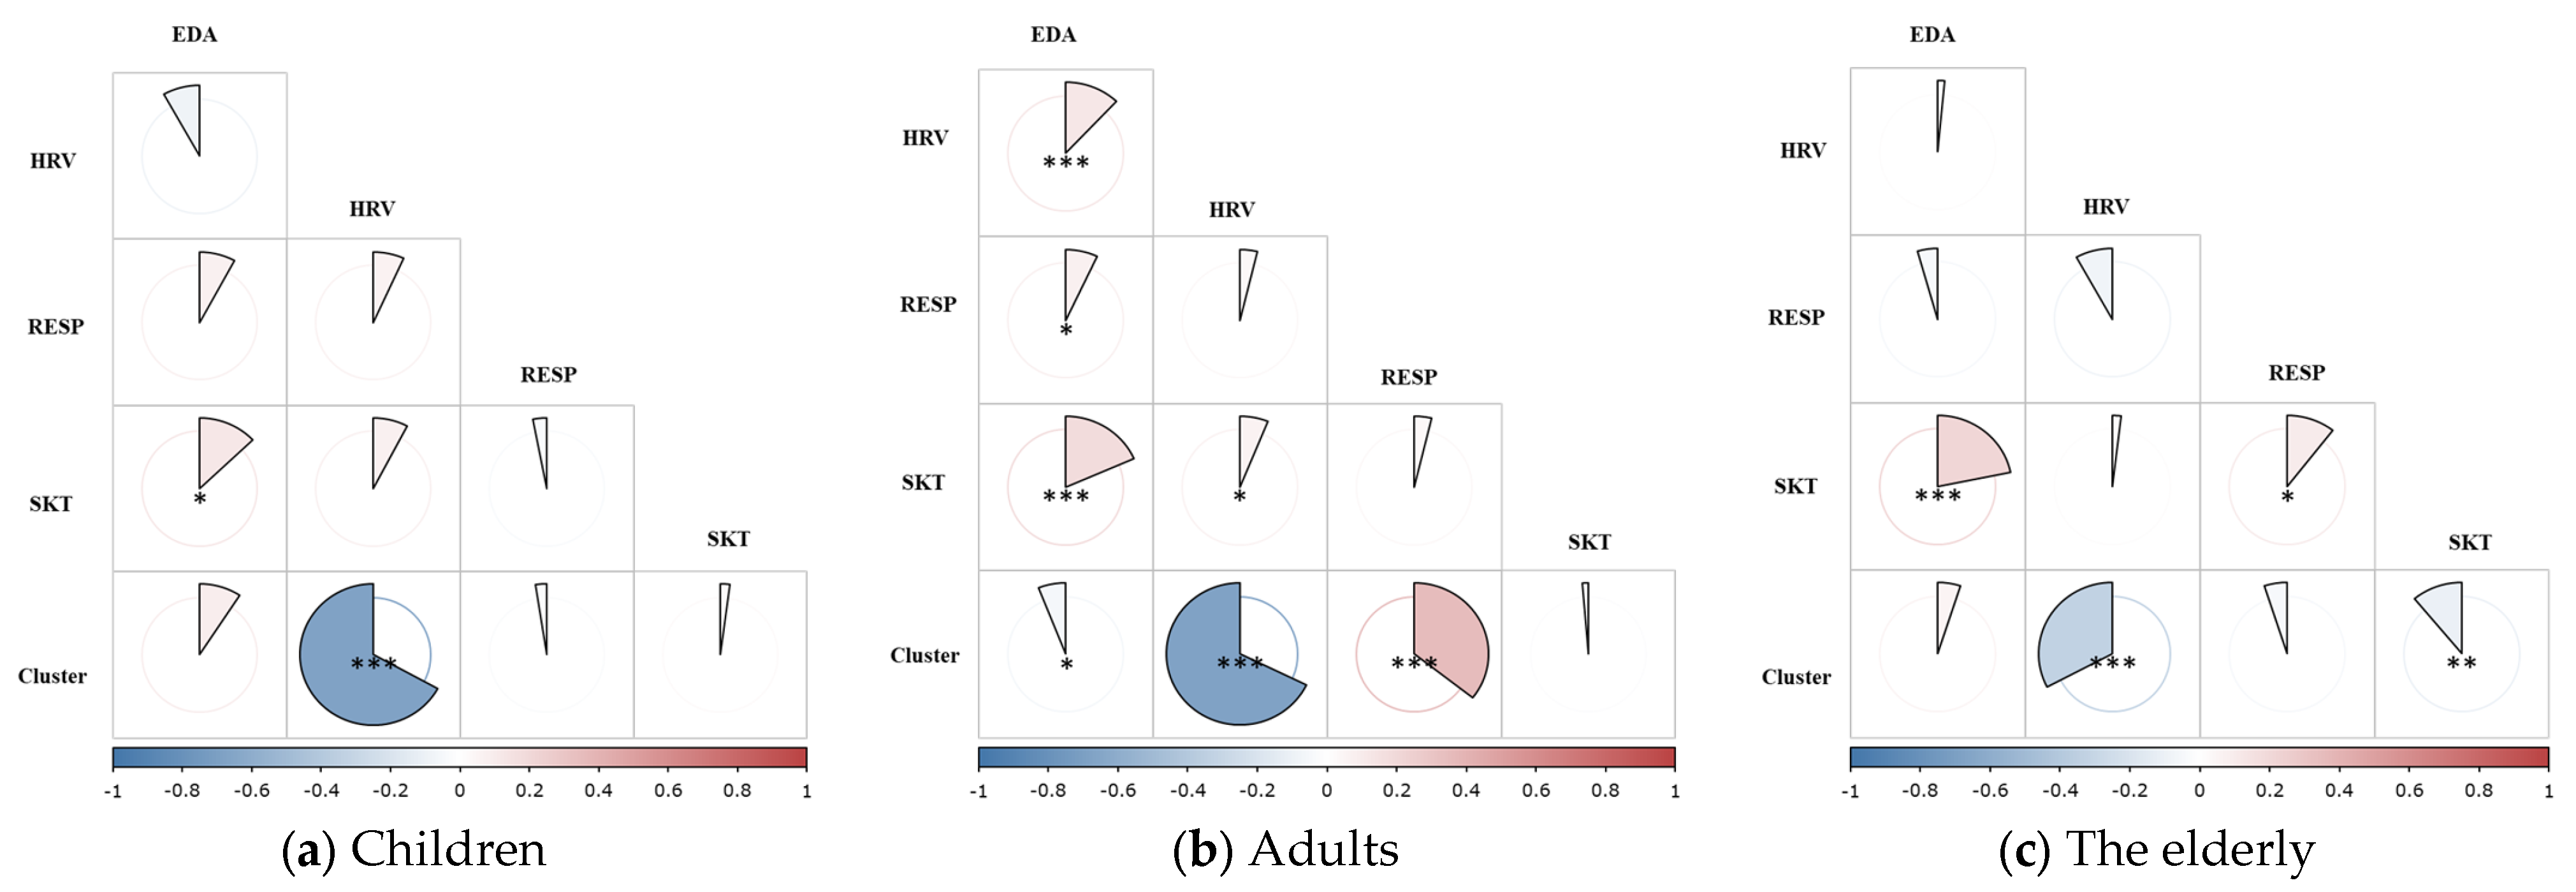
3.2.2. Matching Physiological Indicators with Clustering Results

Since the clustering results of SOM are labels generated by machine learning based on the structural characteristics of the data and lack inherent meaning, it is necessary to interpret the specific implications of the SOM clustering results by combining the meanings of the physiological indicators.
First, relationships between the four physiological indicators and the three clustering results were clarified through correlation analysis, as shown in Figure 9. For children, HRV showed significant correlation with the clustering results (p < 0.05), with a correlation coefficient of 0.606, while EDA, RESP, and SKT did not show significant correlations (p > 0.05). For adults, EDA, HRV, and RESP showed significant correlations with the clustering results (p < 0.05), with correlation coefficient of 0.06, 0.678, and 0.356, respectively, while SKT did not show a significant correlation (p > 0.05). For the elderly, HRV and SKT showed significant correlations with the clustering results (p < 0.05), with correlation coefficients of 0.327 and 0.11, respectively, while EDA and RESP did not show significant correlations (p > 0.05). From these results, it is evident that HRV data showed significant correlations with the clustering results across all three groups. For children, HRV was the only indicator showing a significant correlation, making it the key factor in interpreting and naming the clustering results. For adults, HRV and RESP were the key indicators, as EDA’s correlation coefficient was relatively small. For the elderly, HRV and SKT were the key indicators for interpreting and naming the clustering results.
Subsequently, the clustering results were named based on the meanings of the physiological indicators identified above. In terms of HRV, RMSSD reflects the activity of the autonomic nervous system. Generally, higher RMSSD values are associated with greater balance in the autonomic nervous system, indicating better equilibrium between the sympathetic and parasympathetic nervous systems, and thus suggesting more positive or calmer emotional states [38]. For SKT, lower skin temperatures are associated with tension or excitement, while higher skin temperatures indicate greater comfort [44]. Changes in RESP are consistent with heart rate fluctuations: higher respiratory rates indicate tension, while lower rates indicate relaxation [40]. Since SKT and RESP in this study were evaluated based on standard deviation, higher values for these indicators indicate greater emotional variation and less comfort.
Therefore, the interpretation of the SOM clustering results is as follows: For children, higher HRV values indicate greater comfort in spatial perception and higher evaluations of spatial inclusivity. For adults, higher HRV values and lower RESP values indicate greater comfort in spatial perception and higher evaluations of spatial inclusivity. For the elderly, higher HRV values and lower SKT values indicate greater comfort in spatial perception and higher evaluations of spatial inclusivity. Ultimately, CLUSTER I was identified as the high spatial inclusivity group for children, CLUSTER II for adults, and CLUSTER I for the elderly.
Finally, the sample proportions of different inclusivity groups in each VR scenario were calculated, as shown in Figure 10. A higher proportion of high inclusivity samples indicates greater spatial inclusivity, while a lower proportion indicates lower spatial inclusivity. The results show that scenes 13, 21, 29, 10, and 18 had high inclusivity, exceeding 60%, while scenes 8, 19, and 4 had lower inclusivity, at 40.9%, 42.42%, and 44.93%, respectively.
Based on the above analysis, this study has established the correlation and classification analysis between physiological indicators of diverse populations and spatial inclusivity. It clarifies the differences in the feedback of the four physiological data (EDA, HRV, RESP, and SKT) on spatial perception, highlighting that HRV has the most significant effect on spatial perception feedback, showing outstanding performance across all groups, while RESP and SKT have a noticeable impact on spatial perception feedback for adults and the elderly groups, respectively. Additionally, by calculating the sample proportions of different inclusivity classifications in each space, a comprehensive evaluation of spatial inclusivity using objective physiological data was achieved, providing a methodological basis for research related to spatial perception and physiological feedback.

3.3. Analysis of Spatial Inclusivity Characteristics

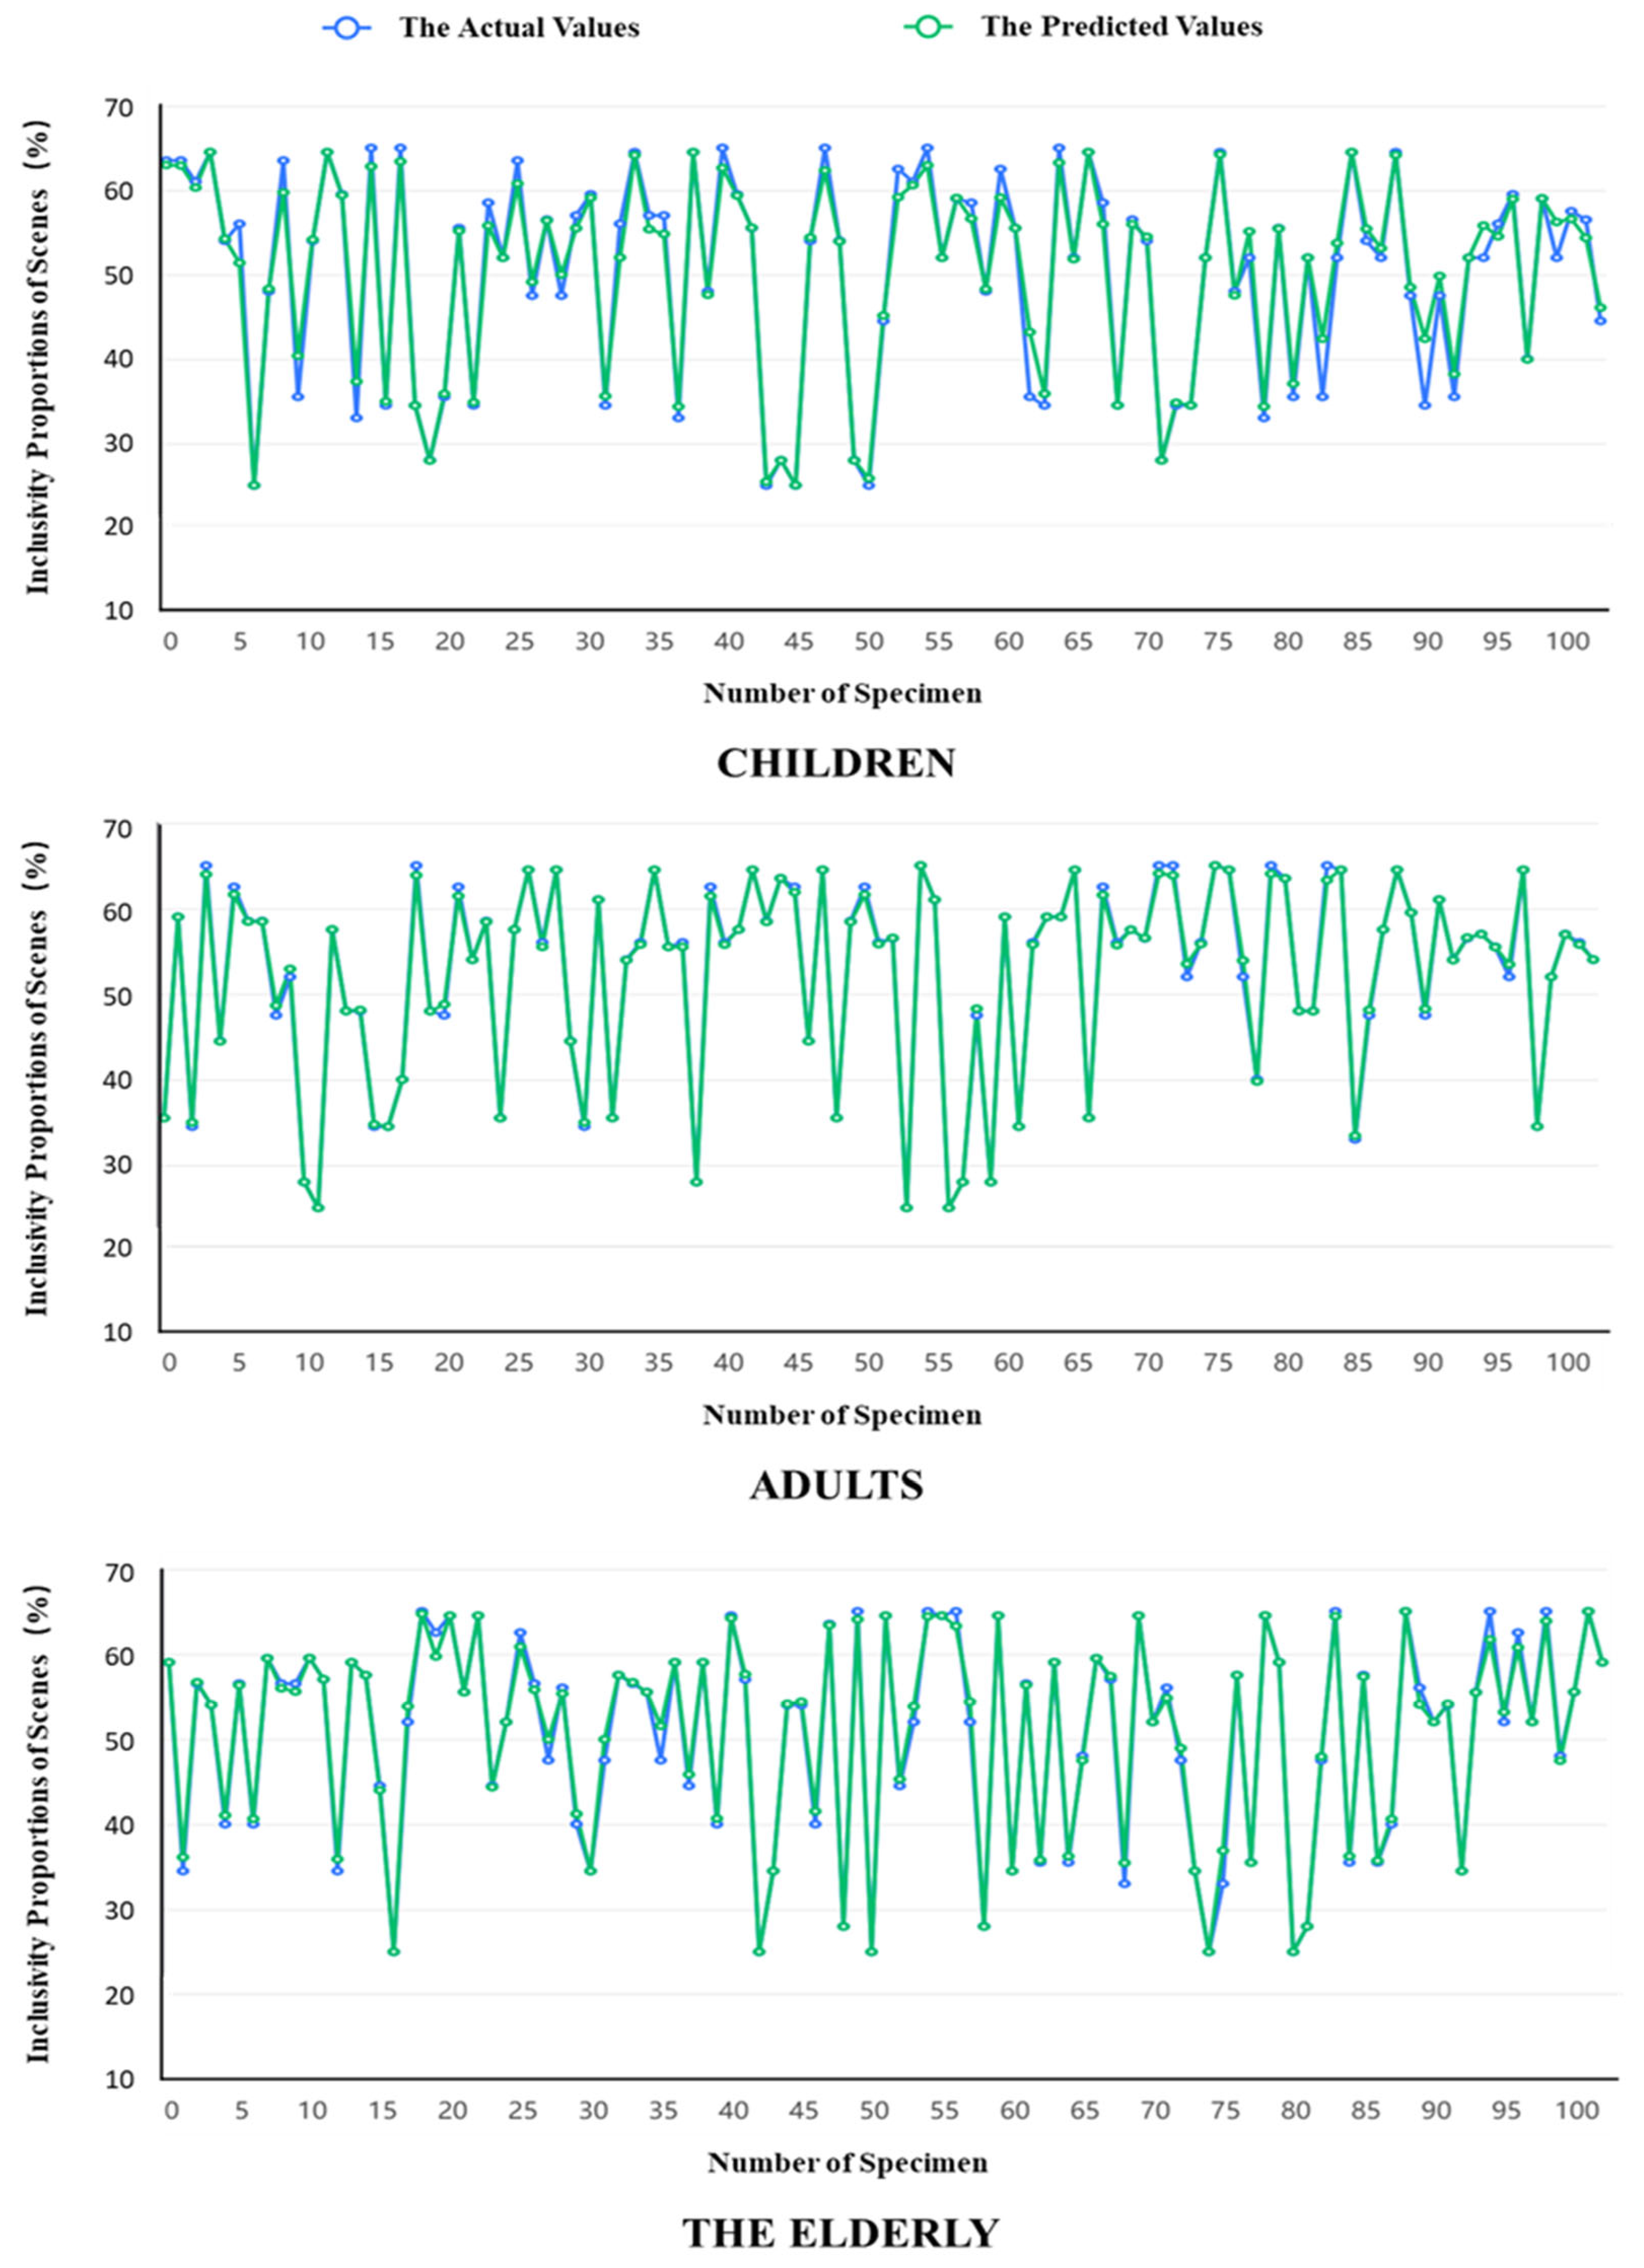
3.3.1. Comparative Analysis of Machine Learning Models

Based on the above spatial inclusivity classification, supervised machine learning was employed to analyze the inclusivity characteristics of residential outdoor activity spaces, clarifying the relationship between different subjective evaluation indicators and spatial inclusivity. Given the variety of supervised machine learning models, the performance of different models can be compared by evaluating their prediction results [22]. Based on the literature review in Section 1.3 and considering the characteristics of the data and task requirements of this study (with a sample size of 1372, including 349 children, 531 adults, and 492 elderly participants), four machine learning algorithms were selected for comparison: Extra Trees, K-Nearest Neighbors (KNN), Backpropagation Neural Network (BPNN), and Support Vector Regression (SVR). Specifically, Extra Trees reduces model variance through random feature subspace selection and split threshold mechanisms, making it suitable for handling high-dimensional, noisy residential environment data; KNN, based on the principle of local similarity, is appropriate for capturing the convergence of inclusivity scores among neighboring samples in spatial data; the multilayer perceptron structure of BPNN can model the complex nonlinear mapping between subjective evaluation indicators and inclusivity proportions; and SVR, using a radial basis function (RBF) kernel, is well-suited for the small-sample, high-dimensional spatial segmentation problem encountered in this study.
To mitigate overfitting and achieve models with stronger generalization capabilities, each algorithm was trained on a training set and validated on a test set, with performance comprehensively evaluated using a five-fold cross-validation strategy. Additionally, specific measures were adopted according to each algorithm’s characteristics: for Extra Trees, limiting the maximum tree depth (10) and the minimum number of samples per leaf node (5) helped avoid overly complex branch structures and reduce overfitting risk; for KNN, cross-validation was used to select the optimal k value (10) to prevent excessive sensitivity to outliers and improve generalization; for BPNN, cross-validation was employed to adjust the L2 regularization parameter and reduce the number of hidden neurons (50) to lower model complexity and prevent overfitting; and for SVR, both the kernel function and the regularization parameter C were tuned to avoid overfitting and enhance generalization.
In the study, the feature variables were the 15 subjective evaluation indicators selected in Section 2.3.2, and the response variable was the proportion of spatial inclusivity derived in Section 3.2.2. The prediction evaluation metrics of the training results are shown in Table 3. Among the evaluation metrics, MSE represents the expected value of the mean squared error between the predicted and actual values (with smaller values indicating higher accuracy); RMSE, the square root of MSE, similarly indicates that lower values correspond to higher accuracy; MAE, the mean absolute error, reflects the average magnitude of prediction errors (with lower values indicating better performance); and an R2 value closer to 1 indicates greater model accuracy [28]. The results show that Extra Trees achieved the highest scores across all metrics for the three population groups, with R2 values closest to 1 (0.978, 0.982, and 0.973, respectively), explaining 97.8%, 98.2%, and 97.3% of the variance. Moreover, its error metrics (MSE, RMSE, MAE) were the lowest, demonstrating its superior predictive performance. KNN and BPNN yielded R2 values ranging from 0.689 to 0.781 with moderate error metrics, indicating a certain degree of predictive capability. In contrast, SVR produced R2 values between 0.532 and 0.612 along with higher error metrics, indicating relatively poor performance and suboptimal prediction accuracy. Figure 11 presents a comparison between the predicted and actual values for the three population groups using the Extra Trees model. The results indicate that the predicted values closely align with the actual values across all three groups, further validating the accuracy of the Extra Trees model in predicting spatial inclusivity.

3.3.2. Summary of Spatial Inclusivity Characteristics for Diverse Groups

Subsequently, the Extra Trees model was used to rank the spatial inclusivity characteristics for each group (Figure 12). The results reveal both commonalities and differences in the inclusivity characteristics of residential outdoor activity spaces across different groups.
In terms of commonalities, all groups ranked spatial features such as unobstructed views, adequate space, diverse landscapes, proximity accessibility, and smooth pavement surfaces highly, with similar levels of importance. The emphasis on unobstructed views across all groups likely reflects a psychological need for open sightlines, which enhance a sense of safety and reduce feelings of confinement. Adequate space facilitates smooth activities and interactions, avoiding discomfort caused by overcrowding. Diverse landscapes meet the esthetic needs of all groups, enhancing visual appeal and evoking emotional resonance, thereby increasing the enjoyment of activities. Proximity accessibility is critical for functional distribution and usability, preventing inconvenience caused by distant locations. Smooth pavement surfaces, as a key component of infrastructure, significantly improve usability and reduce the risk of accidents.
In terms of differences, certain elements were ranked differently among groups. For children, environmental familiarity and adequate children’s play facilities were ranked higher, while adequate barrier-free facilities and well-managed parking were ranked lower. Children primarily engage in play and recreational activities, making them more focused on the availability of suitable play facilities and activity areas, and they often rely on their familiarity with the environment to feel safe. For both adults and the elderly, the rankings showed high consistency, particularly in their emphasis on adequate space, well-managed parking, and adequate barrier-free facilities. These features reflect the functional, safety, and convenience needs of both groups. Adults, balancing family life, work, and leisure activities, require ample space to accommodate diverse needs. The elderly, facing declining physical abilities, need spacious and barrier-free spaces for rest and social interaction. Regarding parking management, adults have strong demands for parking facilities due to daily commuting, while the elderly are more concerned with the safety issues caused by disorganized parking. Barrier-free design is particularly important for the elderly, as declining mobility makes barrier-free facilities a key factor in their spatial preferences.
In summary, when designing residential outdoor activity spaces, it is essential to consider the commonalities of inclusivity characteristics shared across diverse groups, such as unobstructed views, adequate space, diverse landscapes, convenient proximity, and smooth pavement surfaces. These elements ensure that spaces are both functional and esthetically pleasing while providing high levels of comfort for all. At the same time, the differences in inclusivity characteristics across populations should be addressed by optimizing various functional areas within residential outdoor spaces. For example, creating rich playgrounds and open spaces for children fosters a safe and stimulating environment. Additionally, focusing on barrier-free design, parking facilities, and provision of adequate activity spaces ensures that spaces for the elderly and adults are both convenient and safe.

4. Discussion

This study, based on human factor engineering technology, involved experiments with diverse groups in residential outdoor activity spaces, collecting physiological perception data from over 400 participants. The SOM algorithm was employed to explore the underlying relationships among four types of physiological data. Additionally, four supervised learning models were compared to identify and rank the inclusivity characteristics that influence spatial perception across different groups. These findings provide valuable recommendations for the inclusive design of residential outdoor activity spaces.
However, the study still has some limitations. Despite careful handling of the experimental process, some anomalies were identified during post-data processing, particularly within the children’s group. These anomalies were largely attributed to the potential loosening of experimental equipment during the process. To ensure scientific rigor, outliers were processed, but some samples had to be excluded, which may have impacted the conclusions to some extent. Additionally, while the selection of VR scenes considered both new and old residential areas, the collected spaces generally exhibited good quality and did not include environments with particularly poor conditions. As a result, regarding the identification of inclusivity characteristics, factors such as tranquility, and cleanliness were ranked relatively low. Future research should focus on optimizing experimental equipment and procedures to improve the success rate of physiological data collection. Furthermore, a control group should be introduced, with greater variation in spatial perception elements, to enhance the accuracy of studying the importance of spatial inclusivity characteristics in residential outdoor activity spaces.

5. Conclusions

This study, based on the concepts of age-friendly and inclusive design, constructs a progressive framework of “Feature Identification—Classification—Feature Analysis”: First, human factor experiments and empirical interviews were conducted to identify perception elements of residential outdoor activity spaces among diverse groups. Next, SOM neural networks were used to uncover the intrinsic relationships between four types of physiological data and spatial inclusivity. Finally, by comparing multiple machine learning methods, the inclusivity characteristics of residential outdoor activity spaces for diverse groups were clarified. The findings are as follows:
(1).
Subjective Perception of Residential Outdoor Activity Spaces: Children prioritize the recreational attributes of spaces, paying less attention to the completeness of facilities and crowd conflicts. Adults emphasize child companionship and property management, while also paying more attention to intergenerational conflicts. The elderly focus more on spatial safety, such as pavement conditions, barrier-free facilities, and parking management.
(2).
Physiological Perception of Diverse Populations: Among the four physiological indicators (EDA, HRV, RESP, and SKT), HRV provides the most significant feedback on spatial perception. In terms of predicting spatial inclusivity, the Extra Trees model demonstrated the highest accuracy.
(3).
Inclusivity Characteristics of Residential Outdoor Activity Spaces: All groups highly ranked spatial characteristics such as unobstructed views, adequate space, diverse landscapes, proximity accessibility, and smooth pavement surfaces, with similar levels of importance. Differences were observed in the children placed a higher emphasis on environmental familiarity and play facilities, while the adults and elderly prioritize space sufficiency, parking management, and barrier-free facilities.
Therefore, when designing residential outdoor activity spaces, it is essential to consider the shared inclusivity characteristics of diverse groups, ensuring that spaces are both functional and esthetically pleasing while providing high levels of comfort. Additionally, optimizing spaces based on the different inclusivity characteristics of diverse groups is crucial. For example, providing rich play facilities and open spaces can meet the recreational needs of children, while barrier-free design, parking facilities, and ample activity spaces ensure that the elderly have comfortable, safe, and accessible environments. At the same time, multifunctional and convenient spaces should be provided to meet the needs of adults.

Author Contributions

Conceptualization, B.Y. and L.W.; methodology, B.Y. and L.W.; software, B.Y. and L.W.; validation, B.Y., L.W. and Y.X.; formal analysis, B.Y.; investigation, B.Y. and Y.X.; resources, B.Y. and L.W.; data curation, B.Y. and Y.X.; writing—original draft preparation, B.Y.; writing—review and editing, B.Y., L.W. and K.C.H.; visualization, B.Y.; supervision, L.W. and K.C.H.; project administration, L.W.; funding acquisition, L.W. All authors have read and agreed to the published version of the manuscript.

Funding

This research was funded by the National Key Research and Development Program of China, grant number 2023YFC3807404-3.

Data Availability Statement

Data are unavailable due to privacy or ethical restrictions.

Acknowledgments

The authors are deeply indebted to the postgraduate students in the School of Architecture, Tianjin University, for their direct and indirect help in the collection of the data in this research.

Conflicts of Interest

All authors declare that there are no conflicts of interest in relation to the manuscript titled “A Study on the Spatial Perception and Inclusive Characteristics of Outdoor Activity Spaces in Residential Areas for Diverse Populations from the Perspective of All-Age Friendly Design” submitted to Buildings. We confirm that the results and interpretations reported in the manuscript are original and have not been plagiarized.

Abbreviations

The following abbreviations are used in this manuscript:
EDAElectrodermal Activity
HRVHeart Rate Variability
SKTSkin Temperature
RESPRespiratory Rate
VRVirtual Reality
SOMSelf-Organizing Map neural network

References

  1. Aerts, J. Shaping Urbanization for Children—A Handbook on Child-Responsive Urban Planning; United Nations Children’s Fund (UNICEF): Beijing, China, 2018; p. 10. [Google Scholar]
  2. Du, S.; Wang, C.; Mao, L. Exploring the Influence of the Perceived Neighborhood Built Environment on the Fall Risks among Older Adults in China. J. Build. 2024, 14, 2631. [Google Scholar] [CrossRef]
  3. He, D.; Liu, H. Population Aging Trend, Impact and Coping Strategies in China. J. Party Sch. Cent. Comm. CPC.(Chin. Acad. Gov.) 2019, 23, 84–90. [Google Scholar]
  4. Fan, S.; Yang, Y.; Liu, Y. The Experiences of Foreign Cities Handling the Aging of Population. J. Southwest Jiaotong Univ. (Soc. Sci.) 2017, 18, 82–90. [Google Scholar]
  5. Zhang, C. Research on the Planning and Design Strategy of All-Age Elderly Care Community from the Perspective of Intergenerational Integration. Master’s Thesis, Liaoning Technical University, Fuxin, China, 2023. [Google Scholar]
  6. Wu, X. Development Trend, Realistic Dilemma, and Optimization Path of the Smart Elderly Care Industry. J. East China Econ. Manag. 2021, 35, 1–9. [Google Scholar]
  7. Li, Q.; Kaplan, M. The intergenerational strategy and its social practice under the background of aging—The possibility and future of China. J. Soc. Sci. Int. 2017, 4, 54–63. [Google Scholar]
  8. Li, X. Inclusive Design: Public Space Regeneration Strategy for the Targets of Residential area for All Ages. Urban Dev. Stud. J. 2019, 26, 27–31. [Google Scholar]
  9. Li, H. Research on Spatial Environment Optimization Design of Urban Collective Residential Areas to Promote Intergenerational Integration. Ph.D. Thesis, Harbin Institute of Technology, Harbin, China, 2019. [Google Scholar]
  10. Harding, E. Towards Lifetime Neighborhoods: Designing Sustainable Communities for All; International Longevity Centre: London, UK, 2007. [Google Scholar]
  11. Bianchin, M.; Heylighen, A. Fair by design. Addressing the paradox of inclusive design approaches. Des. J. 2017, 20 (Suppl. S1), S3162–S3170. [Google Scholar] [CrossRef]
  12. Benktzon, M. Designing for our future selves: The Swedish experience. J. Appl. Ergon. 1993, 24, 2–69. [Google Scholar] [CrossRef]
  13. Clarkson, J.; Coleman, P.R. History of Inclusive Design in the UK. J. Appl. Ergon. 2015, 46, 235–247. [Google Scholar] [CrossRef]
  14. Microsoft Corporation; Forrester Research. The Wide Range of Abilities and Its Impact on Computer Technology; Microsoft Corporation: Cambridge, UK, 2003. [Google Scholar]
  15. Keates, S.; Clarkson, P.J. Countering design exclusion: Bridging the gap between usability and accessibility. Univers. Access Inf. Soc. 2003, 2, 215–225. [Google Scholar] [CrossRef]
  16. Yi, S. A study on the Health-Promotion Outdoor Space of Chengdu Urban Built Community Under the Aging Background. Ph.D. Thesis, Sichuan Agriculture University, Chengdu, China, 2018. [Google Scholar]
  17. Bridger, R. Introduction to Human Factors and Ergonomics, 4th ed.; CRC Press: Milton, ON, Canada, 2017. [Google Scholar]
  18. Mccauley-Bush, P. Ergonomics: Foundational Principles, Applications, and Technologies; CRC Press: Boca Raton, FL, USA, 2011. [Google Scholar]
  19. Rayner, K. Eye Movements and Visual Cognition: Scene Perception and Reading; Springer Science & Business Media: New York, NY, USA, 2012. [Google Scholar]
  20. Cifrek, M.; Medved, V.; Tonković, S. Surface EMG based muscle fatigue evaluation in biomechanics. Clin. BioMech. 2009, 24, 327–340. [Google Scholar] [CrossRef]
  21. Bell, S. Landscape: Pattern, Perception, and Process; E & FN Spon: New York, NY, USA, 1999. [Google Scholar]
  22. Pigliautile, I.; Casaccia, S.; Morresi, N.; Arnesano, M.; Pisello, A.L.; Revel, G.M. Assessing occupants’ personal attributes in relation to human perception of environmental comfort: Measurement procedure and data analysis. Build. Environ. 2020, 177, 106901. [Google Scholar] [CrossRef]
  23. Xu, X.; Long, H.; Zhao, C.; Jiang, N.; Xiao, J. Quantitative Evaluation of Street Space Quality Based on Residents’ Psychological Feelings: Taking Streets in Chongqing’s Main Districts as an Example. J. Huazhong Archit. 2020, 39. [Google Scholar]
  24. Zhang, L.M.; Zhang, R.X.; Jeng, T.S.; Zeng, Z.Y. Cityscape protection using VR and eye tracking technology. J. Vis. Commun. Image Represent. 2019, 64, 102639. [Google Scholar] [CrossRef]
  25. Omidvar, A.; Kim, J. A novel theoretical model for predicting the individuals’ thermal sensations based on air temperature and biomarkers measured by wearable devices. Build. Environ. 2023, 232, 110050. [Google Scholar] [CrossRef]
  26. Wang, Z.; Zhuang, W. Research on Block Renewal Post Occupancy Evaluation Methods Based on Image Deep Learning: A Case Study of Shichahai in Beijing. New Archit. 2022, 3, 5–8. [Google Scholar]
  27. Tao, Y.; Wang, Y.; Wang, X.; Tian, G.; Zhang, S. Measuring the Correlation between Human Activity Density and Streetscape Perceptions: An Analysis Based on Baidu Street View Images in Zhengzhou, China. Land 2022, 11, 400. [Google Scholar] [CrossRef]
  28. Kazemi, F.; Çiftçioğlu, A.Ö.; Shafighfard, T.; Asgarkhani, N.; Jankowski, R. RAGN-R: A multi-subject ensemble machine-learning method for estimating mechanical properties of advanced structural materials. Comput. Struct. 2025, 308, 107657. [Google Scholar] [CrossRef]
  29. Rajan, A.C.; Mishra, A.; Satsangi, S.; Vaish, R.; Mizuseki, H.; Lee, K.R.; Singh, A.K. Machine-Learning-Assisted Accurate Band Gap Predictions of Functionalized MXene. Chem. Mater. 2018, 30, 4031–4038. [Google Scholar] [CrossRef]
  30. Aryal, A.; Becerik-Gerber, B. A comparative study of predicting individual thermal sensation and satisfaction using wrist-worn temperature sensor, thermal camera and ambient temperature sensor. Build. Environ. 2019, 160, 106223. [Google Scholar] [CrossRef]
  31. Yang, B.; Li, X.; Liu, Y.; Chen, L.; Guo, R.; Wang, F.; Yan, K. Comparison of models for predicting winter individual thermal comfort based on machine learning algorithms. Build. Environ. 2022, 215, 108970. [Google Scholar] [CrossRef]
  32. Wu, Y.; Fan, J.; Cao, B. Comparison among different modeling approaches for personalized thermal comfort prediction when using personal comfort systems. Energy Build. 2023, 285, 112873. [Google Scholar] [CrossRef]
  33. Yang, H.; Shi, X.; Zheng, L. A review of Piaget’s theory of child cognitive development. Forw. Position 2007, 6, 55–57. [Google Scholar]
  34. Sheng, K.; Liu, L.; Wang, F.; Li, S.; Zhou, X. An Eye-Tracking Study on Exploring Children’s Visual Attention to Streetscape Elements. Buildings 2025, 15, 605. [Google Scholar] [CrossRef]
  35. Li, X. A Study on Intergenerational Cultural Harmony of Contemporary China. Ph.D. Thesis, Southwest Jiaotong University, Chengdu, China, 2008. [Google Scholar]
  36. Malmberg, J.; Järvelä, S.; Holappa, J.; Haataja, E.; Huang, X.; Siipo, A. Going beyond what is visible: What multichannel data can reveal about interaction in the context of collaborative learning? Comput. Hum. Behav. 2019, 96, 235–245. [Google Scholar] [CrossRef]
  37. Fournier, L.R.; Wilson, G.F.; Swain, C.R. Electrophysiological, behavioral, and subjective indexes of workload when performing multiple tasks: Manipulations of task difficulty and training. Int. J. Psychophysiol. 1999, 31, 129–145. [Google Scholar] [CrossRef]
  38. Liu, W.; Lian, Z.; Liu, Y. Heart rate variability at different thermal comfort levels. Eur. J. Appl. Physiol. 2008, 103, 361–366. [Google Scholar] [CrossRef]
  39. Nickel, P.; Nachreiner, F. Sensitivity and Diagnosticity of the 0.1-Hz Component of Heart Rate Variability as an Indicator of Mental Workload. J. Hum. Factors Ergon. Soc. 2003, 45, 575–590. [Google Scholar] [CrossRef]
  40. National Institutes of Health. Respiratory Research; Pubmed, C., Ed.; BioMed Central: London, UK, 2000.
  41. Shang, Y. Subgraph Robustness of Complex Networks Under Attacks. IEEE Trans. Syst. Man Cybern. Syst. 2019, 49, 821–832. [Google Scholar] [CrossRef]
  42. Torku, A.; Chan, A.P.; Yung, E.H.; Seo, J. The influence of urban visuospatial configuration on older adults’ stress: A wearable physiological-perceived stress sensing and data mining based-approach. Build. Environ. 2001, 206, 108298. [Google Scholar] [CrossRef]
  43. Wu, Y.; Yang, Y.; Liang, X. Typical spatiotemporal patems of the Kuroshio south of Japan and the Kuroshio extension using selforganizing maps and their causal relationship. Haiyang Xuebao 2022, 44, 38–54. [Google Scholar]
  44. Yamamoto, Y.; Yamamoto, D.; Takada, M.; Naito, H.; Arie, T.; Akita, S.; Takei, K. Efficient Skin Temperature Sensor and Stable Gel-Less Sticky ECG Sensor for a Wearable Flexible Healthcare Patch. Adv. Healthc. Mater. 2017, 6, 1700495. [Google Scholar] [CrossRef] [PubMed]
Figure 1. Inclusive theoretical model. (a) User Pyramid [14], (b) Inclusive Design Cube Model [15].
Buildings 15 00895 g001
Figure 2. Research framework.
Buildings 15 00895 g002
Figure 3. Residential outdoor activity space scenes.
Buildings 15 00895 g003
Figure 4. Human factor experimental platform.
Buildings 15 00895 g004
Figure 5. Descriptive statistics of basic information.
Buildings 15 00895 g005
Figure 6. Space perception of diverse population groups.
Buildings 15 00895 g006
Figure 7. Distribution of Competitive Layer Neuron Weights.
Buildings 15 00895 g007
Figure 8. Clustering results of physiological data.
Buildings 15 00895 g008
Figure 9. Correlation analysis results. Note: ***, **, and * denote significance at the 1%, 5%, and 10% levels, respectively.
Buildings 15 00895 g009
Figure 10. Inclusivity proportions of scenes.
Buildings 15 00895 g010
Figure 11. Prediction results of extra trees model.
Buildings 15 00895 g011
Figure 12. Ranking of inclusivity characteristics for diverse groups.
Buildings 15 00895 g012
Table 1. Comparison of existing studies on the application of machine learning models.
Research FieldDataset SizeTrain/Test PercentageModels UtilizedModel
Metrics
References
Mechanical properties of advanced structural materials120075%/25%Artificial Neural Network (ANN)
Extra Trees (ET)
Adaptive Boosting (AdaBoost)
Gradient Boosting (GB)
Extreme Gradient Boosting (XGBoost)
Support Vector Machine (SVM)
RMSE
MSE
R2
Farzin Kazemi (2025) [28]
Personalized thermal comfort119680%/20%Random Forest (RF)
Logistic Regression (LR)
Support Vector Machine (SVM)
AccuracyYeyu Wu (2023) [32]
Winter individual thermal comfort800070%/30%Support Vector Machine (SVM)
Decision Tree (DT)
K-Nearest Neighbors (KNN)
Precision
Recall
F1-score
Bin Yang (2022) [31]
Individual thermal sensation and satisfaction54380%/20%Random Forest (RF)
K-Nearest Neighbors (KNN)
Support Vector Machine (SVM)
MAPE
R2
Ashrant Aryal (2019) [30]
Band Gap Predictions of Functionalized MXene720090%/10%Kernel Ridge Regression (KRR)
Support Vector Machine (SVM)
Gaussian Process Regression (GPR)
RMSE
R2
Arunkumar Chitteth Rajan (2018) [29]
Table 2. Results of Variance Testing.
Diverse PopulationIndicatorsMetricsp-ValuesCohen’s F-Values
ChildrenEDAStandard Deviation (μS)0.000 ***3.266
HRVRMSSD (ms)
RESPStandard Deviation (rpm)
SKTStandard Deviation (°C)
AdultsEDAStandard Deviation (μS)0.000 ***3.659
HRVRMSSD (ms)
RESPStandard Deviation (rpm)
SKTStandard Deviation (°C)
The elderlyEDAStandard Deviation (μS)0.000 ***3.549
HRVRMSSD (ms)
RESPStandard Deviation (rpm)
SKTStandard Deviation (°C)
Note: *** denote significance at the 1% levels, respectively.
Table 3. Metrics results for the prediction performance of four ML algorithms.
Diverse PopulationML AlgorithmR2MSERMSEMAE
ChildrenExtra Trees0.97812.343.512.345
KNN0.75248.766.985.123
BPNN0.69858.327.636.234
SVR0.56378.918.886.789
AdultsExtra Trees0.9829.873.142.123
KNN0.78142.346.504.567
BPNN0.72354.327.35.678
SVR0.61272.348.505.789
The elderlyExtra Trees0.97313.453.663.012
KNN0.73547.896.925.234
BPNN0.68962.347.896.567
SVR0.53282.349.077.123
Disclaimer/Publisher’s Note: The statements, opinions and data contained in all publications are solely those of the individual author(s) and contributor(s) and not of MDPI and/or the editor(s). MDPI and/or the editor(s) disclaim responsibility for any injury to people or property resulting from any ideas, methods, instructions or products referred to in the content.

