Article

Investigating the Effects of Occupancy and Natural Ventilation on the Indoor Air Quality of Dormitories in Cold Regions

1
Department of Civil Engineering, School of Engineering, University of Birmingham, Edgbaston, Birmingham B152TT, UK
2
Department of Civil Engineering, College of Engineering, Qassim University, Buraydah 51452, Qassim, Saudi Arabia
3
School of Environment and Geography, Qingdao University, Qingdao 266071, China
*
Author to whom correspondence should be addressed.
Buildings 2025, 15(6), 896; https://doi.org/10.3390/buildings15060896
Submission received: 11 February 2025 / Revised: 9 March 2025 / Accepted: 10 March 2025 / Published: 13 March 2025
(This article belongs to the Section Building Energy, Physics, Environment, and Systems)

Abstract

:
Indoor air quality (IAQ) in higher education institutions’ dormitories, without mechanical ventilation, is a significant concern for students’ health due to prolonged occupancy in cold regions. The present investigation assessed IAQ by measuring two dormitories’ CO2, temperature, and relative humidity with the presence of one, two, three, and four occupants in the United Kingdom. Considering the possibility of natural ventilation by opening the windows in the summer, IAQ was monitored using two sensors located at 1 m and 2 m heights from the floor level of the dormitories in July. The tracer mass balance model showed close agreement with the monitored IAQ levels, with a direct relationship observed between occupant numbers and CO2 build-up. CO2 levels exceeded 1000 ppm within an hour during occupancy and closed ventilation, with air exchange rates between 0.12 and 0.2 h−1, increasing to 1334, 1259, 1884, and 2064 ppm after 30 min with one, two, three, and four occupants, respectively. Desired IAQ standards (1000 ppm) were achieved in 13, 33, 80, and 86 min for one, two, three, and four occupants after starting natural ventilation by opening 20% of the windows. The analysis of variance affirmed the effect of occupancy on IAQ, while the impact of height (1 m and 2 m) on CO2 levels was insignificant. This study underscores the need to effectively ventilate the partial opening of windows in dormitories to mitigate CO2 build-up, ensuring the desired ambient environment within dormitory rooms during summers in cold regions.

1. Introduction

Humans residing in urban areas of developed countries spend most (~90%) of their time in homes, offices, and public buildings, highlighting the significance of indoor air quality (IAQ) [1,2]. Over the last two decades, a shift from outdoor air quality to IAQ assessment has been observed due to extensive urbanization [3]. After realizing the benefits of economic and energy saving, many organizations allow their employees to work from home, even after the COVID-19 pandemic [4]. In the UK, around 25 to 40 percent of people preferred working from home in 2022 [5]. This lifestyle change indicates the need to develop new techniques to monitor IAQ and to ensure a desired indoor CO2 level [6].
As a healthy and adequate lifestyle requires a clean and green environment, indoor air pollution has been recognized as a significant human health issue worldwide. The World Health Organization (WHO) reported 3.2 million deaths yearly due to indoor air pollution [7]. In classrooms and office buildings, carbon dioxide (CO2) is generally regarded as an indicator of IAQ and ventilation, since elevated levels of CO2 are linked to poor ventilation [8,9,10]. The maximum allowable concentration of CO2 is an essential parameter in determining IAQ, since humans are the primary source of CO2 generation through the natural exhalation process. CO2 levels exceeding the limit of 1000 ppm may cause diseases such as sick building syndrome, which affects the decision-making ability of a human being and may cause dizziness, eye and throat irritation, headaches, allergies, and fatigue [11,12,13,14]. Furthermore, CO2 levels higher than 1500 ppm indicate poor ventilation quality [15]. In addition, higher CO2 levels can indirectly contribute to indoor humidity, fostering the growth of bacteria and dust mites and incomplete combustion in gas stoves and fireplaces, increasing carbon monoxide (CO), nitrogen oxide (NOx), and particulate matter (PM) [16]. As relative humidity (RH) and temperature are vital for creating a comfortable indoor environment, RH should lie within 40% to 70% for adequate IAQ [17,18].
Educational institutions and dormitories need more attention regarding ventilation rate (VR) and IAQ due to their high occupancy rates and specific character associated with human health and working efficiency [10]. Excluding combustion from stoves and heaters, human respiration is the main contributor to indoor CO2, which directly increases with the number of occupants in residential, commercial, and public buildings [1,2]. The primary source of indoor CO2 is human respiration. Each person exhales approximately 1 kg of CO2 per day, which can significantly increase indoor CO2 concentrations, particularly in enclosed spaces with limited ventilation.
The effect of occupancy on the concentration of CO2 has been a subject of interest for years [19,20]. To understand the impact of human exhalation and its relationship with air movement and different ventilation setups, Mahyuddin and Awbi [21] monitored horizontal and vertical CO2 concentrations in test chambers with two occupants and evaluated the impact of ventilation strategies on CO2 distribution patterns in a room. Liu et al. [22] monitored CO2 in a university classroom (7.9 m width × 9.1 m length × 3 m height) with 30 students during the summer and winter. They reported CO2 concentration exceeding 1500 ppm after 30 min of occupancy in the respiration region near the floor. Interestingly, no significant change in CO2 levels was observed across the seasons. Their findings coincide with the proposition Mahyuddin and Awbi [21] gave that buoyancy, a non-uniform airflow field, and gravitational settling are responsible for the change in the vertical profile of CO2. Studies by Mohamed et al. [23] and Lama et al. [24] observed CO2 in classrooms with 30 to 60 students and reported levels higher than 1000 ppm. Recently, Sakamoto et al. [25] studied the emission rates of individuals in a controlled chamber and reported the direct effect of participants’ temperature on CO2 generation. McLeod et al. [26] and Zuhaib et al. [27] showed increased monitored CO2 concentrations from 600 with 50 students to over 1000 with 83 students, although the room size was larger in the latter case.
Along with occupancy, other factors that contribute to increased CO2 are occupant behavior (activity level), the rate at which the air is being renewed (ventilation), the amount of time the occupants spend in a room, and the ambient concentration of CO2 [14,28]. Other studies reported that the size of the room and ceiling height are also essential factors for IAQ assessment [21].
In an indoor environment, thermal stratification forms layers of air (with temperature differences) that influence CO2 distribution by raising the warmer air toward the ceiling and keeping the cooler air closer to the floor. Huang et al. [29] identified a 300 ppm difference in CO2 concentration between two points one meter vertically apart in a heavily occupied classroom. CO2 accumulates at the ceiling if the space is naturally ventilated, even though its density is 1.5 times higher than fresh air [30]. This phenomenon predominantly occurs in large spaces with high ceilings, as observed by Wang et al. [31]. They found that thermal stratification in five warehouse buildings, ranging from 6.6 m to 9.2 m in height, is attributed to different temperature zones. Seduikyte et al. [32] assessed ventilation performance in a mechanically ventilated sports hall 6.9 m in height. Data loggers measured CO2, temperature, and RH at six different heights between 0.1 and 6.9 m and reported elevated temperatures above 3.9 m. The above discussion concludes that most studies relate thermal stratification to large indoor spaces, while studies on small indoor spaces with low ceiling heights are not frequently reported.
IAQ in educational institutions has obtained prime importance since the COVID-19 outbreak, with indoor activities rapidly increasing because of online teaching. Consequently, more studies have taken CO2 as a proxy to determine the IAQ in educational institutions [33,34]. Higher CO2 levels in classrooms are related to the decreased cognitive performance of students; therefore, adequate CO2 monitoring in classrooms can help reduce the transmission of air-induced pollutants [35,36]. Awang et al. [37] investigated IAQ in dormitories in the absence of occupants by measuring background concentrations of CO2, total volatile organic compounds (TVOCs), RH, carbon monoxide (CO), and ozone (O3). The results indicated increased TVOC concentrations when the windows were open. Korsavi et al. [38] explained the discrepancy in CO2 levels in educational institutions in the UK, considering the occupancy ratios, behaviors, and generation rates of the occupants. Although most of the variation in CO2 was linked to the open area (m2), occupant behaviors tend to change CO2 levels more than other factors. The study recommended that the occupant density of 2.3 m2 per person and a 7.76 m3 space volume can maintain CO2 levels below 1000 ppm. Although some studies have linked students’ performance to IAQ [39,40,41], occupancy as a primary function has yet to be further investigated in dormitories in educational institutions.
Low-cost sensors are practical for indoor monitoring because they provide real-time data with high spatial frequency. Non-dispersive Infrared (NDIR) is the most commonly used sensor for CO2 measurement. TVOC sensors indirectly measure CO2 by providing equivalent CO2 levels; consequently, their use is limited [42]. A survey by Mahyuddin and Awbi [43] identified the current techniques of IAQ monitoring and the suitable locations of monitoring sensors and found that 1 to 1.2 m from the floor level is the most preferred height for CO2 measurements. The International Well Building standard also specifies measuring CO2 levels 1.2 to 1.8 m above the floor level [44]. Palmisani et al. [45] measured CO2, particulate matter-2.5 (PM2.5), and TVOCs in oncology wards at two European hospitals using low-cost sensors installed at 1.5 to 2 m heights. Pei et al. [46] investigated the effect of sensor location on the energy performance and demand control ventilation of a building. They found variations in monitoring results due to the sensors’ placement and thermal plumes generated by occupants. The study recommended attaching the sensor to a wall, as sensors placed near the occupants recorded higher concentrations. Mahyuddin and Awbi [43] also reported higher concentrations of pollutants in rooms with low localized air movement.
Students in cold regions can only open dormitory windows for natural ventilation during the summer. The above studies on higher education institutions primarily shed light on occupant behaviors and their relationship with increasing CO2 levels in large rooms with higher occupancy and shorter durations or controlled conditions with mechanical ventilation. The impact of occupancy and natural ventilation on the IAQ of dormitories without HVAC in cold regions with longer student residence time needs further attention.
The primary aim of the present work is to find the impact of occupancy and natural ventilation on IAQ in dormitories of a higher education institution (HEI). The specific objectives were (i) to monitor CO2, temperature, and relative humidity in real dormitories under varying graduate student occupancy states using sensors; (ii) to estimate the air exchange rate, the CO2 generation rates under varying occupancies, and estimate CO2 levels using the tracer gas mass balance model; and (iii) to evaluate the impact of natural ventilation on CO2 decline. This study’s results will help assess the natural ventilation intervals needed to maintain the desired IAQ in dormitory rooms.

2. Materials and Methods

2.1. Methodological Approach

The current study achieved its objectives by conducting indoor air quality monitoring experiments with natural ventilation in two dormitories of an HEI located outside the main city center in Birmingham, UK. First, air quality monitoring sensors were installed on the walls of dormitories. Experiments were performed with one, two, three, and four occupants inside the rooms to evaluate the impact of occupancy. Sensors monitored CO2, temperature, and RH in airtight conditions until the CO2 levels exceeded the maximum allowable concentration of 1000 ppm, followed by natural ventilation by opening the windows. This study’s second phase estimated the air exchange rate, theoretical CO2 levels using the tracer gas mass balance model, and CO2 generation rates per person for varying occupancies. The tracer gas decay approach has been used in various studies to model air exchange rates and natural ventilation efficiency in residential and commercial buildings [47,48]. The data obtained from sensors were compared with the results of the mass balance model. Third, an analysis of variance (ANOVA) evaluated the hypothesis on the impact of occupancy on CO2 levels in respiration zones with varying occupancy levels. Finally, this study recommends guidelines regarding using sensors and their accuracy in determining CO2 profiles indoors and strategies for natural ventilation in dormitories for graduate students in HEIs.

2.2. Study Area

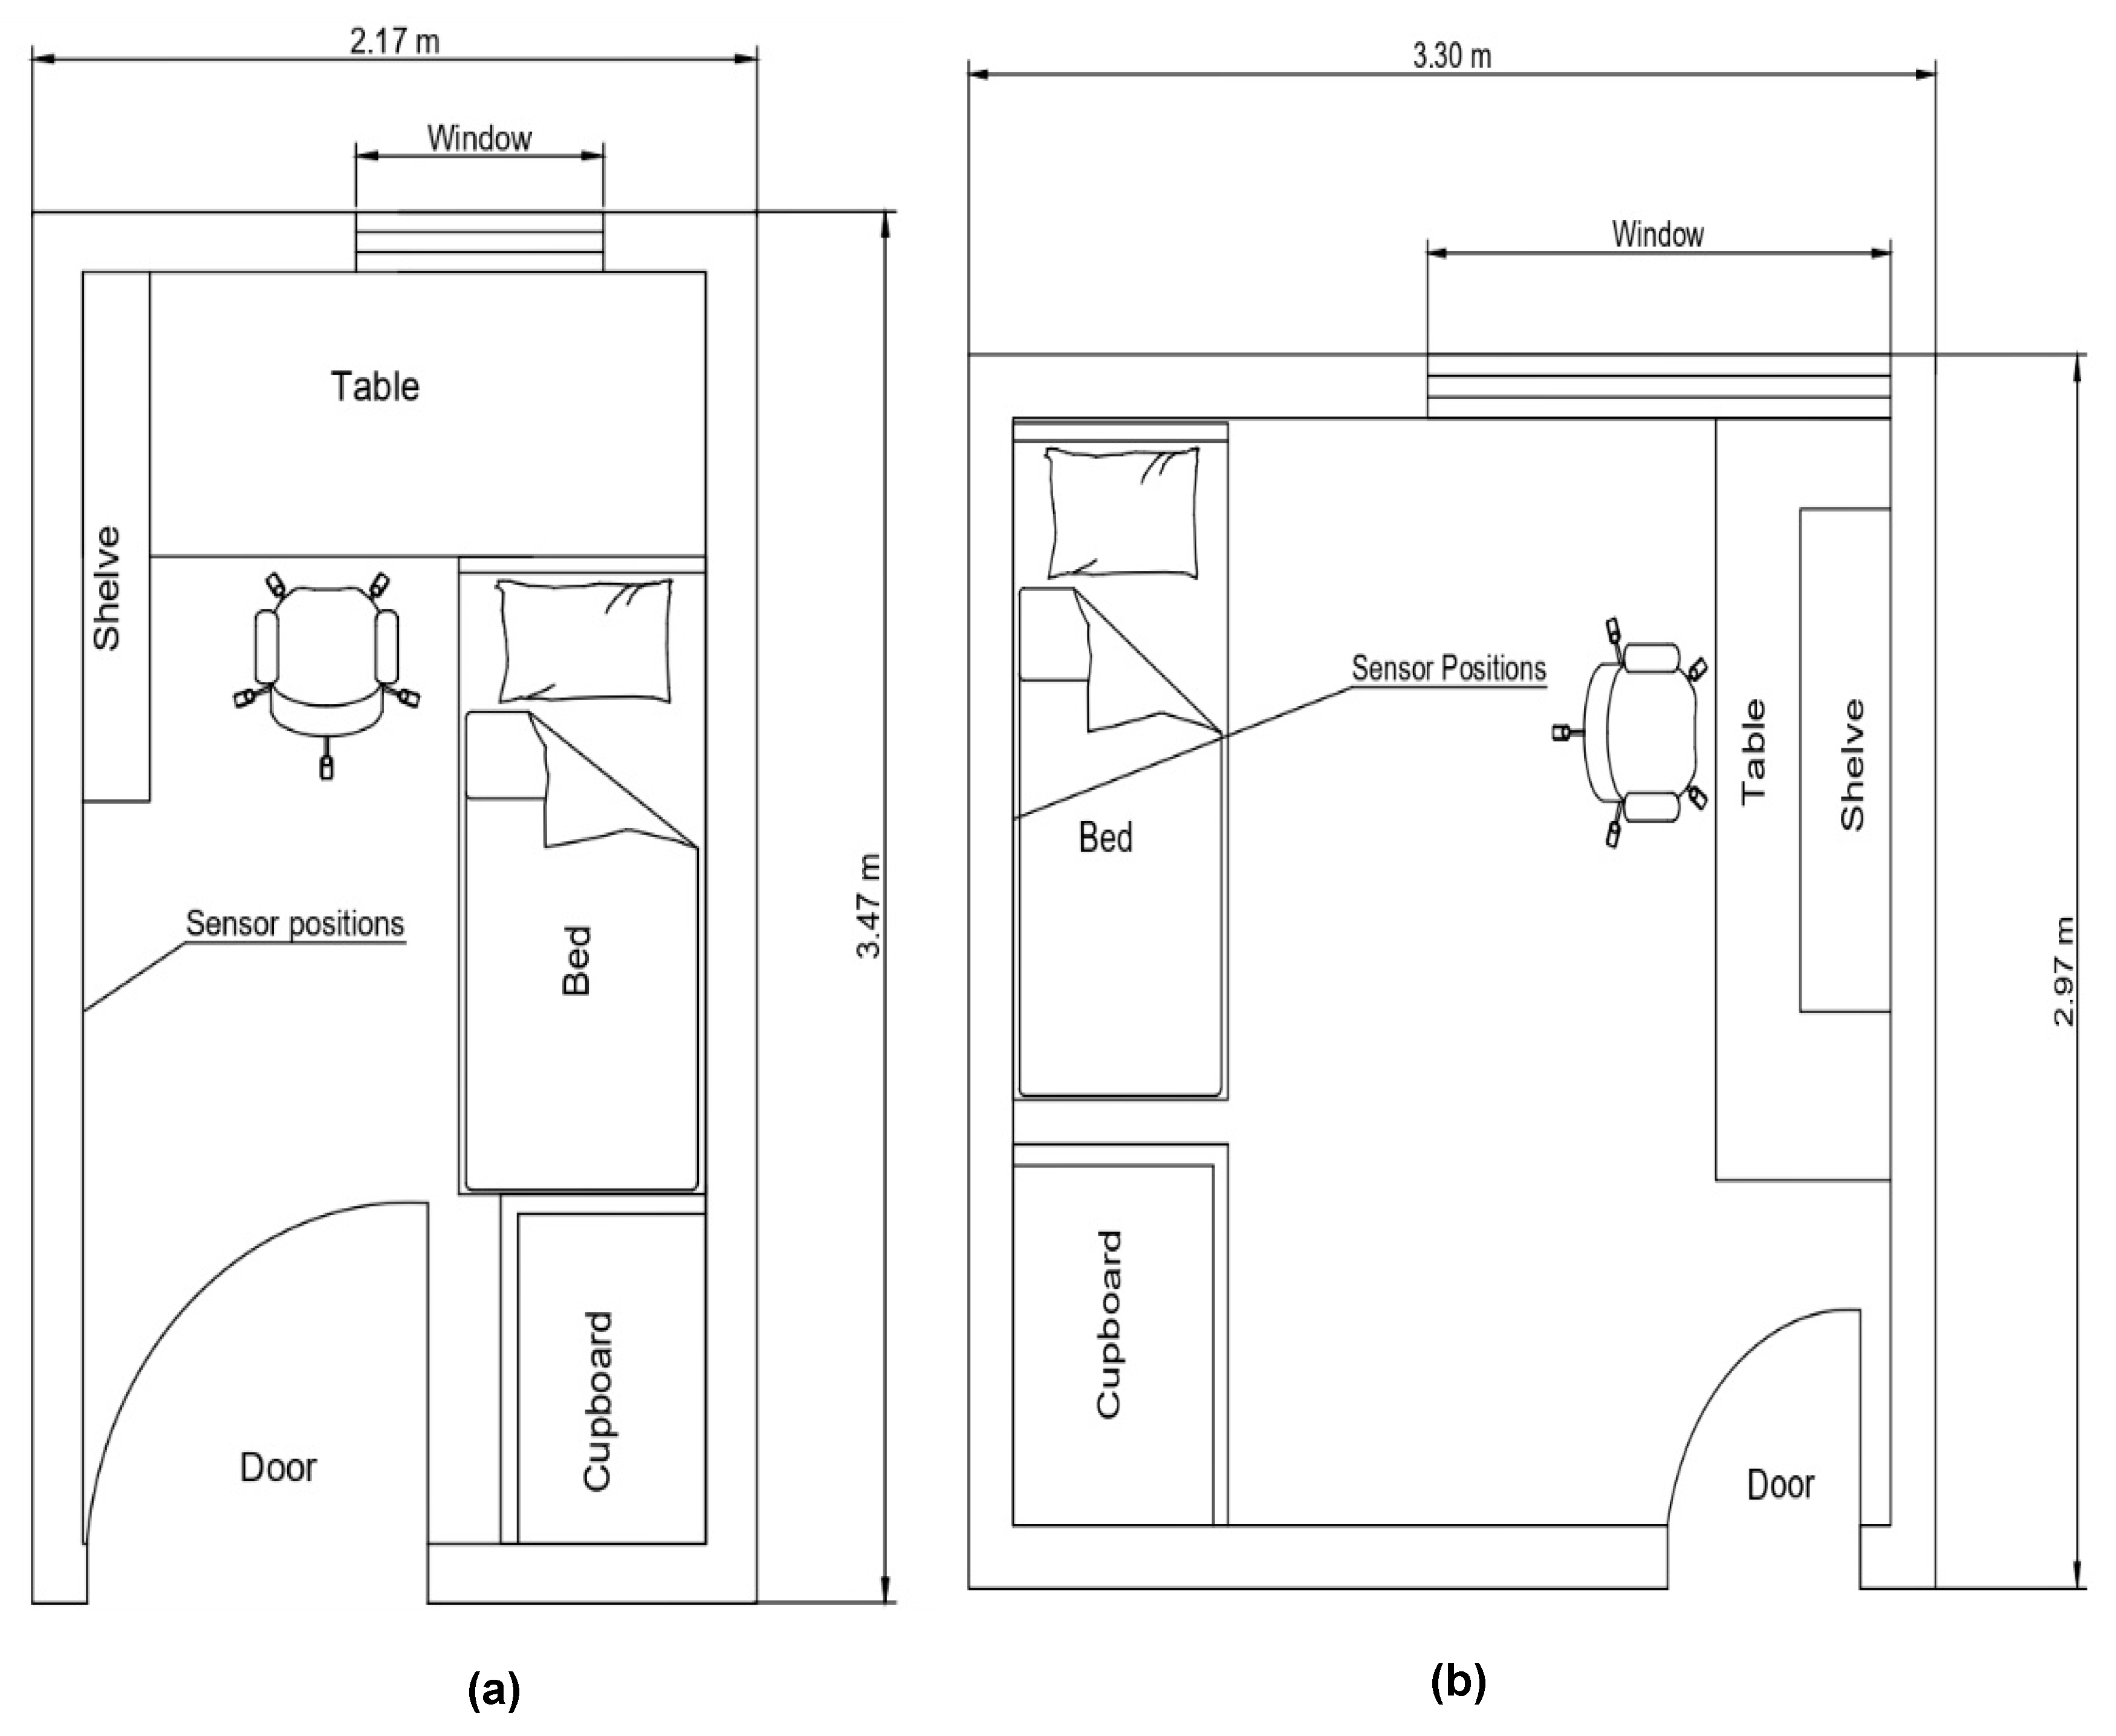
The current study focuses on student accommodation named “The Spinney”, located in Pritchatts Park Village near the University of Birmingham, UK. This accommodation has single bedrooms for university students and can hold 104 students. This study selected two dormitory rooms, namely Room A and Room B, in the same building for CO2 monitoring. One flat is on the first floor, and the other is on the second. The second room can hold more occupants and has a higher ceiling than the first room. Figure 1 shows a location map and photographs of the room, whereas Figure 2 illustrates the dimensions of the rooms. Room B, with a higher ceiling and capacity for more occupants than Room A, was used to assess CO2 levels with 2, 3, and 4 occupants, whereas Room A was monitored with 1 occupant. Although Room B also contains one resident on regular days, this study was performed with more occupants during the monitoring period to evaluate the impact of occupancy on CO2. Both rooms feature single-sided windows with a maximum 20% opening allowance.
Two non-dispersive infrared (NDIR) sensors were placed at two heights, 1 m and 2 m (see Figure 1 and Figure 2). The sensors were placed based on the location specified by Pei et al. [46], according to the standard set by ASHRAE [49]. Mahyuddin and Awbi [21] also conducted an extensive study on the placement of sensors to monitor IAQ and reported that 1 m to 1.2 m was the preferred CO2 measurement height. Hence, 1 m was selected as the first point, and 2 m was selected to capture the spatial distribution of CO2. Table 1 describes the conditions of the four tests, including occupancy, room number (as explained in Figure 1 and Figure 2), room size, the number and size of windows, and room volume.

2.3. Carbon Dioxide Monitoring

Two non-dispersive infrared (NDIR) ARANET sensors were installed to measure the CO2 concentrations at the selected locations in the room. The rates of measurement error of ARANET are as follows: ±30 ppm (±3%) for CO2, ±0.4 °C for temperature, and ±3% for RH. ARANET 4 provides wireless data collection; subsequently, the recorded CO2 concentrations can be extracted from the device directly using the ARANET 4 phone application. The sensor gives accurate readings up to 5000 ppm from the ARANET datasheet. This instrument can also measure additional features like RH and atmospheric pressure. The sensor’s maximum range is 9999 ppm and can operate from 0 °C to 50 °C [50].
The measurement of CO2 indoors and its relation to IAQ and ventilation have been the subject of many research studies [10,51,52]. Three techniques using CO2 as a tracer gas to measure the indoor air change rate are build-up, steady-state, and decay [53,54]. With technological advances, the use of sensors has become the more convenient and affordable method of CO2 measurement. ARANET is a low-cost and durable sensor that provides real-time coverage of CO2, RH, and atmospheric data and easy access to recorded data using the Internet of Things (IoT). Conversely, a short life span of <2 years and calibration and standardization issues are some reported limitations [45]. Due to their ease of use and affordability, most researchers and organizations use NDIR sensors to ensure ambient IAQ, owing to their advantage. According to Mahyuddin and Awbi [43], one CO2 sensor installed at a 1 m or 2 m height is enough for measuring a floor area of <100 m2. The current study used multiple sensors to find the spatial distribution of CO2. Two sensors were wall-mounted at 1 m and 2 m, and the measurements were recorded at 1 min intervals. All the experiments were carefully conducted under controlled ventilation, and the rooms were kept airtight to minimize the impact of zonal infiltration or air.

2.4. Air Exchange Rate

Exhaling CO2 as a tracer gas has been used in many studies to find the room’s air exchange rate (AER) [55,56]. The present study assessed the AER before the start of the monitoring period. The measurements were obtained in the empty room as per the method prescribed by Fan et al. [57], stating that AER can be calculated by air infiltration using the decay method when the initial CO2 is >1000 ppm. Subsequently, the decrease (decay) in CO2 levels was monitored without any occupant.
AER was estimated by measuring CO2 in an empty room for 2 h before the experiment with a fitting parameter of R2 > 0.99. Equation (1) calculated the AER following first-order kinetics, as follows:
N = ln C i n i t i a l C f i n a l t
where N represents the air exchange rate (AER) h−1, t is the time in minutes, Cinitial is the initial CO2 when the concentration was higher than 1000 ppm, and Cfinal is the CO2 when the concentration reached 1000 ppm.

2.5. Mass Balance for CO2 Estimation

Many studies have used a tracer gas mass balance Equation (2) to predict subjects’ VR, as shown below [57].
C i n = C o u t + [ C i n ( 0 ) C o u t ( t ) ]   e ( N ) t
where C i n is the indoor CO2 in ppm at time t = 0, Cout is the outdoor concentration, and Equation (1) estimated N for different occupancy levels. The current study used Equation (2) to assess the theoretical concentration of CO2 and compared it with the sensor data. All the occupants involved in monitoring were male, aged between 21 and 30, and their activity was sedentary.
According to Ahn et al. [58], Equation (2) holds the following assumptions: (i) the dilution of CO2 is only possible with natural ventilation, and (ii) the zonal infiltration of air in the room is negligible.

2.6. CO2 Generation Rates

Occupant emission rates were calculated using Equation (3), assuming the air was well mixed [25,59].
n E = Q ( C s s C i n i t i a l )
where n denotes the number of occupants, E shows the average CO2 generation rate per occupant [mL/h], and Css and Cfinal show the indoor CO2 mixing ratio at a steady state and the mixing ratio in the supply air and natural ventilation, respectively. At the steady state, initial CO2 refers to the experiment’s last and first 15 min when the occupants left and entered the room, respectively. Here, Cinital was assumed to be at 420 ppm since no occupant was present in the room.
Q in Equation (3) denotes the volumetric outdoor air change rate given in [m3/h], which was calculated as a product of room volume and renewal rate per hour. The renewal rate for dormitories was assumed to be 4, according to the standard by DIN 1946 [60]. Q was found to be 71.68 m3/h for Room 1 (17.92 m3) and 116.4 m3/h for Room 2 (29.1 m3).

3. Results

3.1. CO2 Monitoring

Figure 3 presents the monitoring results for CO2 levels obtained from sensors for different numbers of occupants, showing a clear trend of rising CO2 concentrations with increasing occupancy. However, the rate of increase varied based on room size, with smaller rooms experiencing a sharper rise in CO2 levels. In Room A, CO2 levels rose significantly after one occupant entered at 22:38, reaching 1542 ppm at 1 m and 1614 ppm at 2 m within an hour. Ventilation intervals showed a distinct difference in CO2 levels between sensors, attributed to the room’s smaller size. In Room B, with two occupants, CO2 levels steadily increased, peaking at 1932 ppm at 1 m and 2026 ppm at 2 m. Ventilation at 20% for 18–23 min helped reduce CO2 levels below 1000 ppm. When three occupants were present in Room B, CO2 concentrations rose rapidly, especially when occupants were standing and talking, reaching 1903 ppm at 1 m and 2039 ppm at 2 m in 35 min. Ventilation at 20% lowered the 1 m sensor reading below 1000 ppm after 48 min, while the 2 m sensor remained slightly higher. During the test with four occupants in Room B, CO2 spiked to 4192 ppm at 1 m and 4266 ppm at 2 m in around 1.6 h, with fluctuations due to movement and talking. Ventilation at 20% reduced CO2 levels but took longer to bring them below 1000 ppm, particularly at 2 m.
Figure 3a–d also compare actual data with theoretical data. Table 2 presents the AER values estimated using the decay method described in Equation (1) for rooms A and B. The AER for tests 2 and 3 was similar despite the higher occupants in test 3. The mass balance Equation (2) obtained theoretical concentrations compared to the sensors’ readings. The modeling results accurately predicted CO2 concentration, except for Test 1 (Figure 3a). Test 1 (Figure 3a) showed a discrepancy between the model and actual data. The model predicted ventilation onset earlier than observed, causing variations in predicted CO2 levels from 1860.48 ppm to 1308.70 ppm, causing skewness. The model prediction for Test 3 (Figure 3c) was the most accurate one observed since it readily predicted window opening and closing. Tests 2 and 4 (Figure 3b,d) show that the model had the same prediction rate for these scenarios, as the AER was similar for both cases. The AER results obtained were in the range of 0.12 to 0.37 h−1. The results in Figure 3 indicate that average CO2 levels throughout the day frequently exceeded the allowable concentration of 1000 ppm in dormitories with higher occupant density. The reasons for the CO2 profiles in Room B (Figure 3b–d) being slightly less smooth than those in Room A (Figure 3a) can be attributed to the impact of talking and standing by more occupants. The results in Figure 3 show that the mass balance model given in Equation (2) can estimate the time required to initiate natural ventilation with different occupancy levels in dormitories of the sizes shown in Figure 2.
Equation (3) calculated occupants’ average CO2 generation rates relating to metabolic activity [61]. CO2 generation rates were estimated to be between 0.0017 and 0.01062 L/s. The generation rates measured in Tests 2, 3, and 4 are slightly lower than those of Persily and Polidoro [62], between 0.0049 and 0.0051 L/s for lecture rooms and conference halls with 50 to 65 occupants. The generation rate estimated for one occupant in Test 1 (0.012 L/s) is well above the ranges reported by Presily and Polidoro [62].
An analysis of variance (ANOVA) was performed to evaluate the impact of occupancy on CO2 levels in the respiration zone at 1 m height from the floor of Room B, with two, three, and four occupants, for the following hypothesis:
H01. 
Occupancy does not affect CO2 levels in the respiration zone.
Ha1. 
Occupancy affects CO2 levels in the respiration zone.
H02. 
Occupancy does not affect CO2 levels above the respiration zone.
Ha2. 
Occupancy affects CO2 levels above the respiration zone.
The ANOVA results with an F-value of 138.8, significantly higher than the F-critical value of 3.012, reject H01 for a 95% confidence level. Thus, occupancy significantly affects CO2 levels in dormitories. Also, for the case of CO2 measurements 2 m from the floor level, the F-value of 145.8 is higher than the F-critical value of 3.012, rejecting H02. These results affirm the significant effect of occupancy on indoor CO2 levels in dormitories, while the impact of height (1 m and 2 m) on CO2 levels was insignificant with F-values < Fcritical. ANOVA results are given in Appendix A.

3.2. Temperature

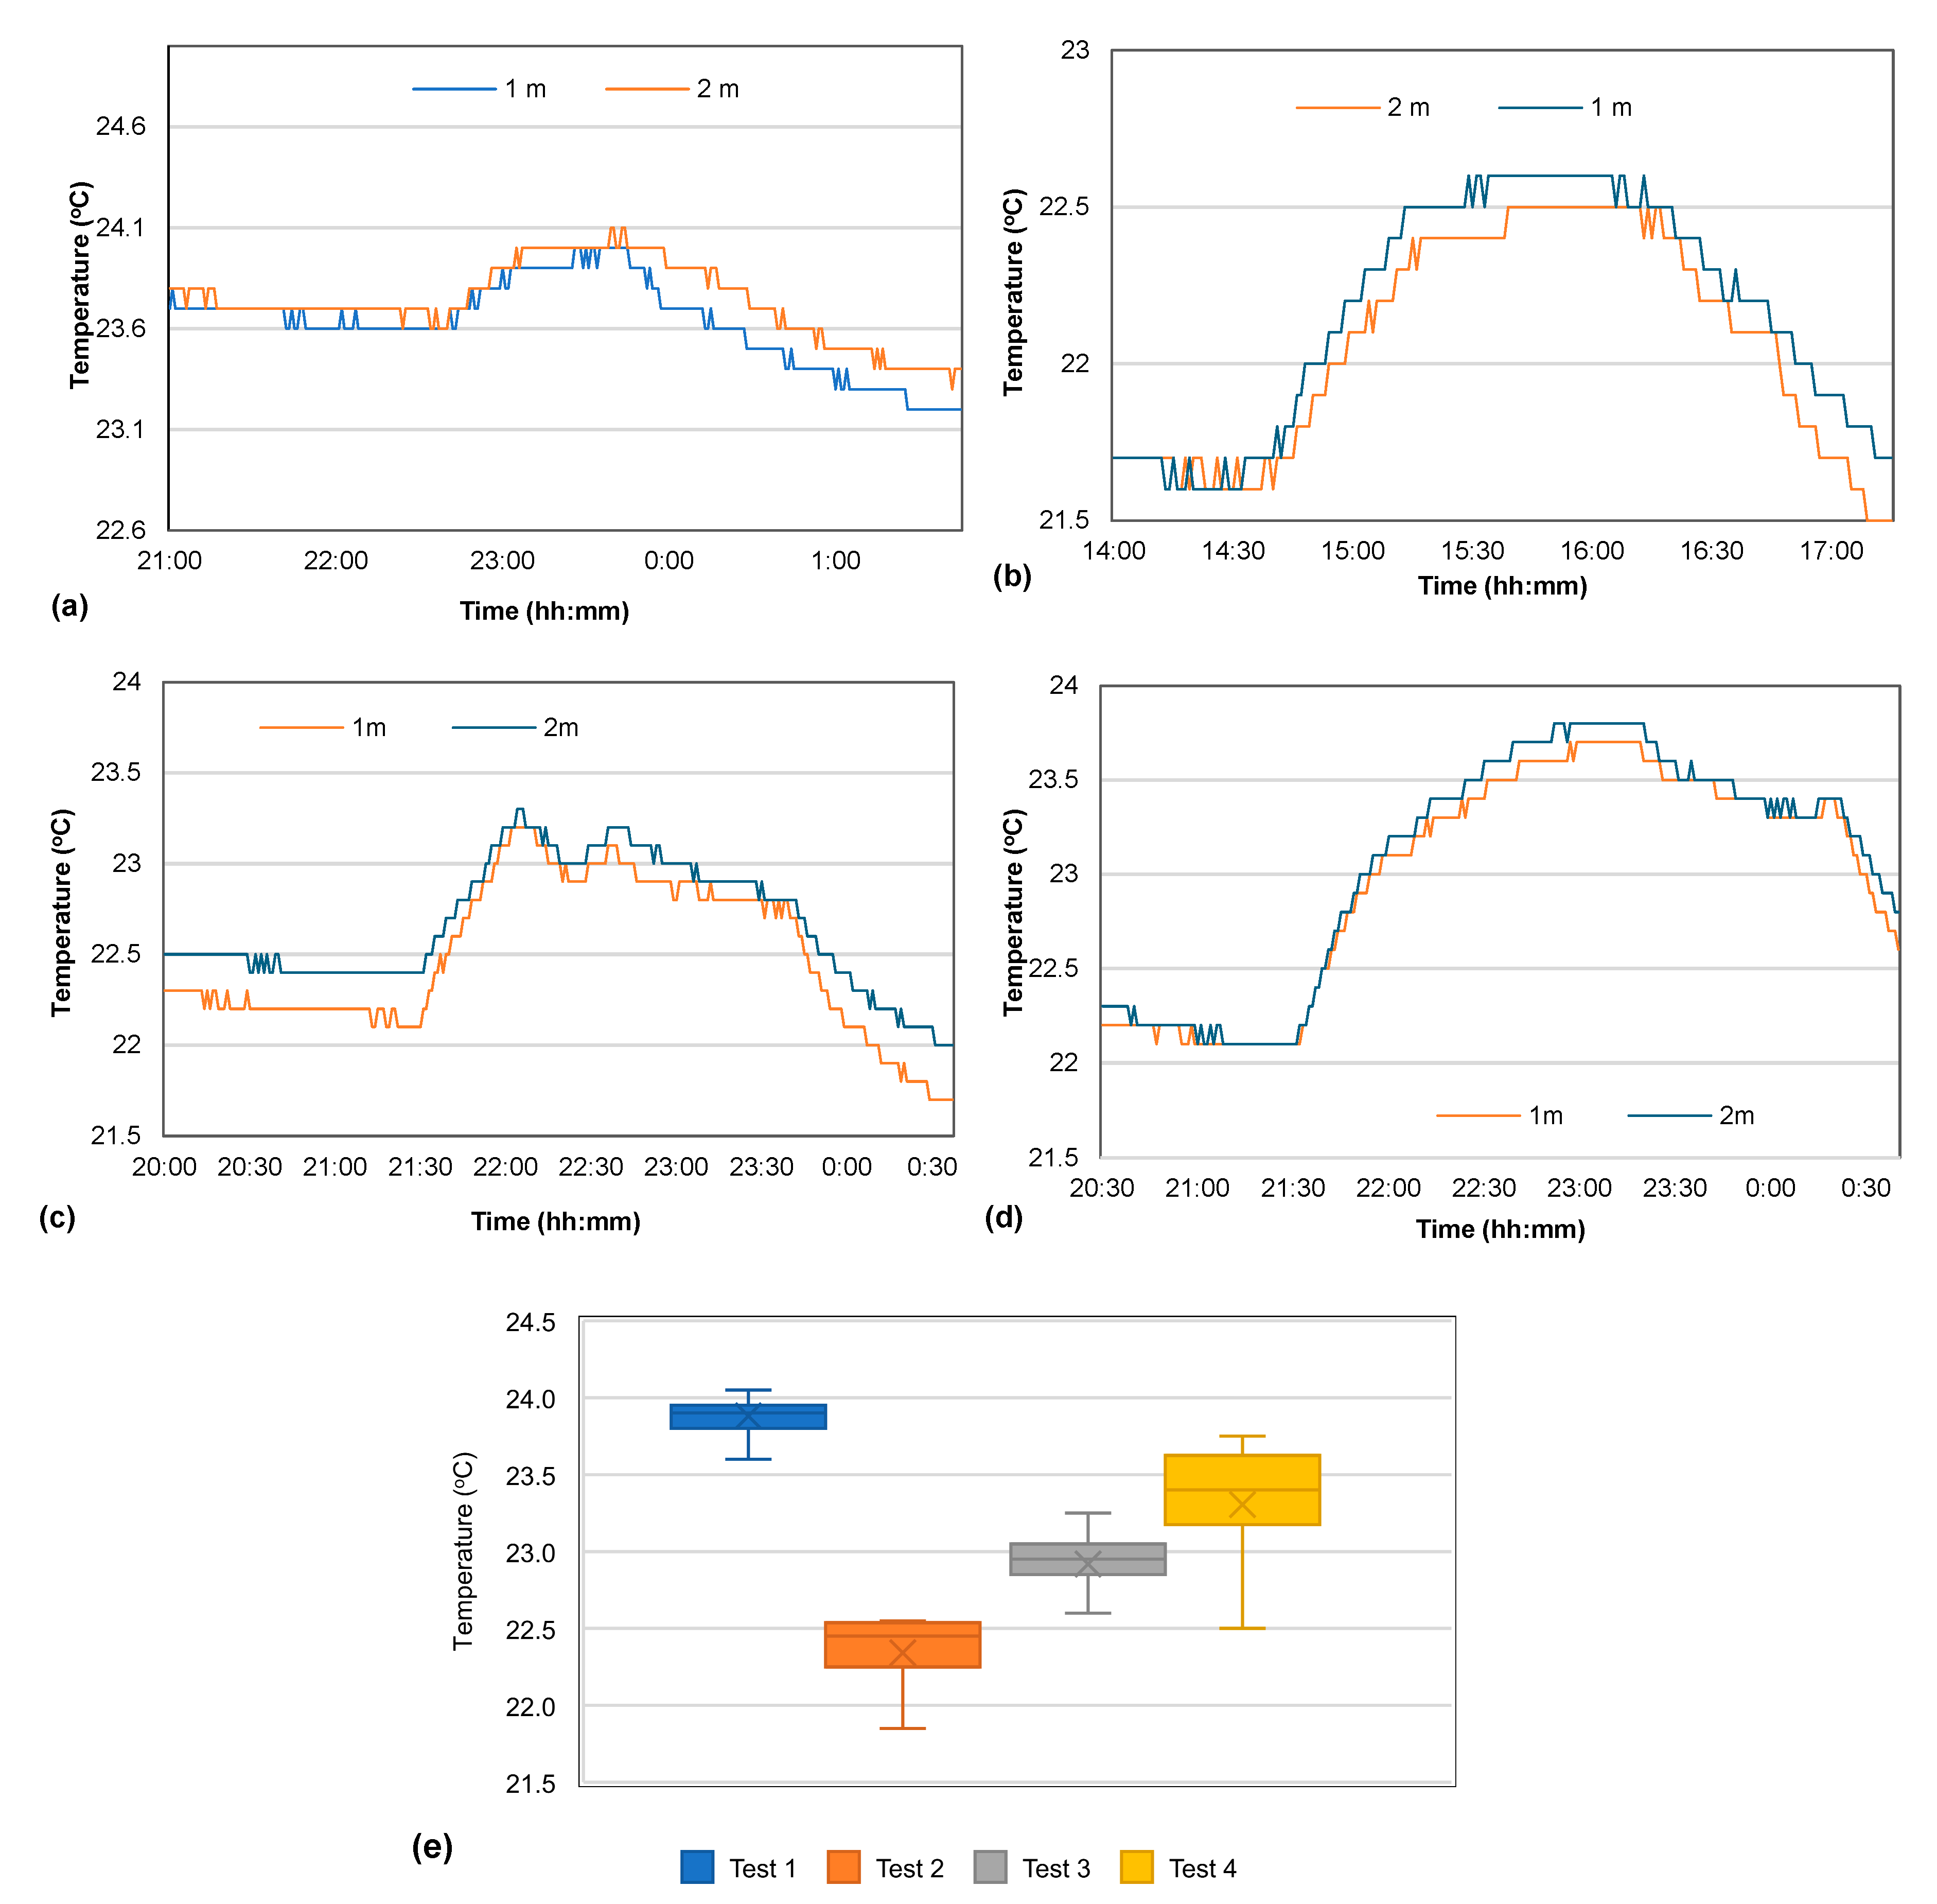
Figure 4a–d show the results of four tests for temperature measurements obtained at 1 m and 2 m heights. The figure illustrates that the temperature increases by increasing the number of people inside the room. Room A (18 m3) was used in Test 1, while the larger Room B (29 m3) was used in Tests 2, 3, and 4. Figure 4e displays a whisker diagram for temperature over the measurement period, showing consistent readings across measurements taken at 1 m and 2 m heights; as a result, absolute values were used in the box and whisker plots. Test 1 showed a peak temperature of 24 °C, while tests 2–4 show lower temperatures due to a larger room size.

3.3. Relative Humidity

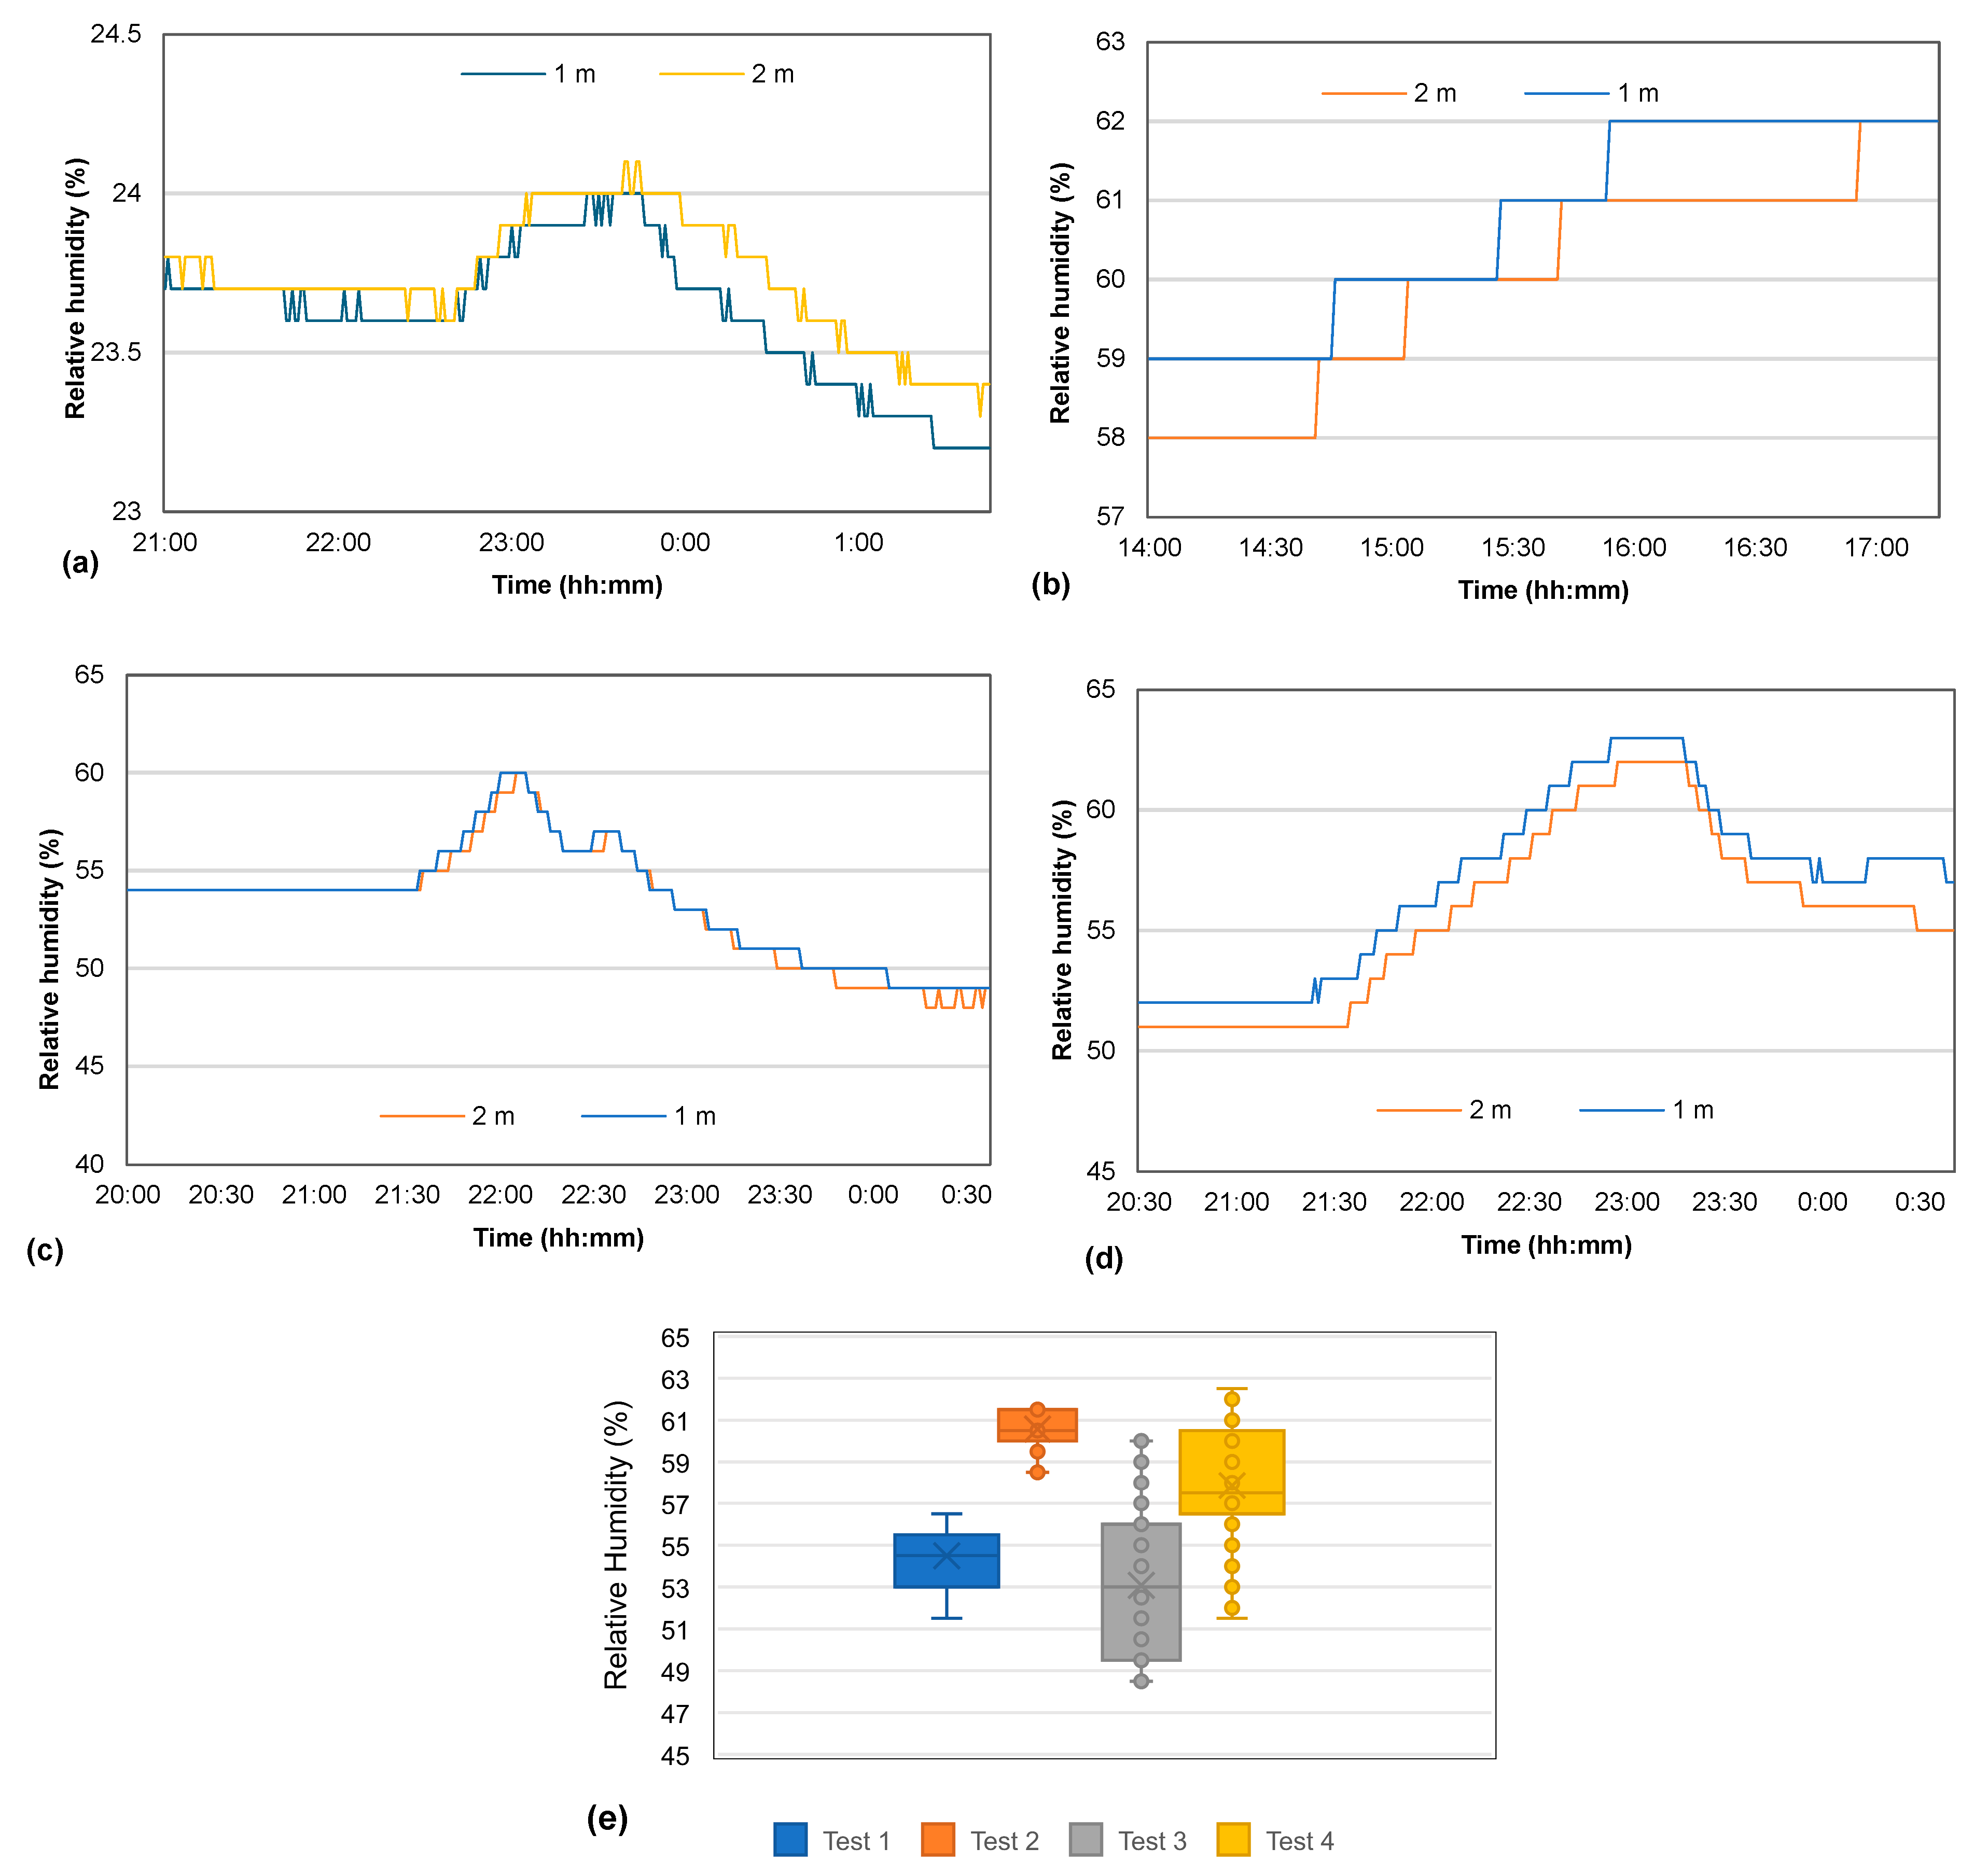
Figure 5a–d show the RH obtained in both rooms during the occupied period. The figures show increased RH with the increase in the number of people inside the room. The relative humidity levels in all four tests were between 52% and 65%, which aligned with the guidelines set by Health and Safety UK, ranging between 40% and 70% [63]. Figure 5e displays whisker diagrams for RH over the measurement period. The highest value of RH, 62.5%, was observed in Test 4. Evaluating the impact of occupancy in Room B shows that RH remained between 58.5 and 61.5% with two occupants, which decreased to 48.5–60% in the case of three occupants and then again increased to 52–62% with four occupants. These variations can be attributed to the dilution effect in a large room that can mitigate RH’s rise. Overall, the RH remained between 30% and 60% in Room B, the optimal range desired for occupants’ comfort and health of the occupants [61,64]. The findings also showed that RH and temperature exhibited minimal changes, suggesting that occupancy levels did not significantly impact these parameters.

3.4. Impact of Natural Ventilation

In Test 1, Room A’s CO2 levels varied between 727 ppm and 1551 ppm (at 1 m height from the floor) before the ventilation opening with one occupant in one hour (Figure 6a). Natural ventilation by opening 20% of windows reduced the CO2 levels to less than 1000 ppm (IAQ standards) in 13 min and 500 ppm at the end of Test 1, around one hour after opening the window (Figure 6b).
Tests 2, 3, and 4 were performed in Room B (3.30 m wide × 2.97 m long × 2.97 m high). In one hour, CO2 increased from 507 ppm to 1932 ppm in 80 min with two occupants (Test 2), substantially higher than the level found for one occupant. Natural ventilation initiated at 80 minutes reduced CO2 levels to 1000 ppm in around half an hour (33 min) and 500 ppm in one hour (Figure 6a). Interestingly, the desired IAQ was achieved in more than double the natural ventilation time (NVT) required in Test 1 due to higher CO2 levels, while the overall time to reach 500 ppm remained the same in both tests (Figure 6b).
In Test 3 with three occupants, the concentration increased from 536 ppm to 1903 ppm in the first 35 minutes, much earlier than the first two tests (Figure 6a). Test 3 shows a rapid increase in levels, compared to the first two cases, in less time due to excessive CO2 generation in the presence of three occupants. In this case, natural ventilation took 80 minutes (more than two times in Test 2) to achieve the desired IAQ standards of 1000 ppm and over two hours (80 minutes) to 500 ppm (Figure 6b).
Exceeding IAQ standards within 13 minutes, Test 4 with four occupants showed increased CO2 from 570 ppm to 4192 ppm (more than two times with three occupants) in ~1.5 h (Figure 6a). After 1 hour and 26 minutes (slightly more than Test 3) of the window opening, the CO2 level reduced to 1000 ppm, complying with IAQ standards. The results clearly show the impact of occupancy on IAQ. A significant increase in CO2 levels was observed in dormitory rooms by changing occupancy from two to three persons (Test 3 and Test 4).

4. Discussion

Due to the extensive nature of their studies, graduate students in HEIs spend extended hours in dormitories. In the case of group work, dormitories may house several occupants in a relatively small space, resulting in increased CO2 levels through human respiration and other academic activities. Such a situation may pose a unique challenge for maintaining acceptable air quality [65]. Diverse ventilation habits due to graduate students’ personal preferences bring about another challenge, particularly in dormitories without HVAC [48]. Most studies in the past assessed IAQ in large classrooms with many occupants in HEIs [23,24,25,26,27]. The present study investigated the impact of occupancy and natural ventilation in real dormitories of graduate students in HEIs.
CO2 levels varied between 727 ppm and 1542 ppm for Room A (17.92 m3) before the ventilation opening with one occupant in one hour. In the case of Room B (29.1 m3), in which Tests 2, 3, and 4 were performed, CO2 varied between 507 ppm and 1653 ppm with two occupants in one hour, substantially higher than the level found for one occupant. In this case, ventilation was initiated after 1 h and 20 min when the concentration was 1932 ppm. The concentration varied from 536 ppm to 1903 ppm in the first 35 min before the ventilation opening for three occupants. Test 3 shows a rapid increase in levels in less time, related to excessive CO2 generation. Test 4 with four occupants showed increased CO2 from 570 ppm to 4192 ppm after 1 h and 36 min. Batog and Badura [66] conducted a test in rooms of a similar size, with a volume of 21 m3 to 23.6 m3, and found CO2 levels within the range of 700 ppm to 1800 ppm in one hour, adjacent to the current study.
The average CO2 generation rate per person assessed in the present study for one occupant was higher, and for two, three, and four occupants, it was slightly lower than 0.0049 and 0.0051 L/s, reported by Persily and Polidoro [62] for lecture rooms and conference halls with 50 to 65 occupants. These variations can be attributed to confined dormitories where even a minor increase in occupants can accumulate higher CO2 levels [67]. Nusseck et al. [68] reported a significant increase in CO2 levels with an increase in occupants in an unventilated environment, akin to the present study.
The temperature difference remained below one degree Celsius in all scenarios, indicating no stratification conditions within the room. These results align with the previous study by Liu et al. [22], which reported that low vertical temperature differences suggest the effective insulation performance of vertical elements such as doors and windows, contributing to occupant comfort. The RH monitored of 52 to 65% lies within the prescribed humidity levels by HSE UK [63]. The temperature was also almost consistent at the two monitored depths. This stability in temperature and RH throughout the test period further emphasizes the adequacy of the room’s insulation and ventilation in maintaining a consistent indoor environment.
A close agreement between monitored CO2 levels and calculated values shows the suitability of using the mass balance approach for IAQ modeling in dormitory rooms in the HEI of cold regions and its utility in planning and managing ventilation in such settings. Due to the absence of heating, ventilation, and air conditioning (HVAC) systems, CO2 increases rapidly, negatively impacting the student’s well-being. The findings showed that adequate ventilation is necessary at regular intervals to reduce the accumulation of CO2 in these rooms. CO2 levels before the occupancy were below 1000 ppm, which agrees with the previous study performed by Pereira et al. [69]. Because of its overall condensed size, CO2 accumulates much faster in these rooms. After 30 min of occupancy, IAQ in these rooms decreases due to increased CO2 levels, akin to what Lama et al. [24] found in identical rooms. Future dormitory designs could benefit from incorporating hybrid ventilation systems, as discussed by Tognon et al. [41], to optimize air exchange without compromising thermal comfort, especially during seasonal extremes.
This study’s findings underscore the importance of natural ventilation in maintaining acceptable IAQ in dormitories without HVAC in cold regions and mitigating the adverse effects on student health and cognitive performance. Previous studies, such as that by Coley et al. [36], have established a direct link between high CO2 levels and diminished decision making and cognitive function, particularly concerning educational environments where student productivity is paramount. Natural ventilation through the window opening provided adequate airflow to reduce elevated CO2 below 1000 ppm within 0.5 h for one and two occupants and around 1.5 h for three and four occupants. This study also suggests natural ventilation after around half an hour in the case of two occupants and 15 min with three or four occupants in a ~10 m2 dormitory. This study’s observations highlight the model’s effectiveness in capturing CO2 variations and ventilation dynamics, although factors like occupant activity and initial ventilation assumptions might explain the discrepancies in Test 1. This analysis emphasizes the model’s potential utility in managing indoor air quality, especially when tailored to specific occupant behaviors and environmental variables. It is important to note that all the observations remained at 5000 ppm, which is the highest reliability of the ARANET sensors. The relatively consistent relative humidity and temperature across occupancy levels suggest that insulation in these dormitories is sufficient; however, the rapid accumulation of CO2 indicates a need for enhanced ventilation designs or automated systems to regulate air quality in real time.
The negligible vertical temperature differences observed between sensors confirm that thermal stratification does not significantly impact IAQ in dormitory rooms with low ceiling heights. This research highlights the importance of incorporating ventilation strategies into dormitory designs, particularly in cold regions with limited natural ventilation during winter. Partial window openings proved sufficient to maintain acceptable IAQ, suggesting that hybrid ventilation systems could enhance indoor air quality while ensuring thermal comfort. Future research should explore IAQ under varying occupant activities, extended monitoring durations, alternative ventilation strategies, and mechanical systems. Such studies would provide a more comprehensive understanding of IAQ dynamics and inform guidelines for improving student well-being and academic performance in residential settings.
Kiwan et al. [48] reported a precise assessment of AER in naturally ventilated buildings using the tracer gas decay rate method. The study faced limitations, particularly regarding the calculation of AER, which ideally should have been monitored for at least a week to accurately assess the ventilation rate (VR), considering variations in occupancy, weather, and ventilation. Time constraints prevented this extended data collection. In addition, this study did not include other essential air pollutants, such as NOx and TVOC, due to resource limitations. Future studies can include these and other relevant parameters for more comprehensive indoor air quality assessment.

5. Conclusions

This study evaluated the impact of occupancy and natural ventilation on indoor air quality (IAQ) in dormitory rooms in cold regions, using CO2 concentration as the primary metric. The CO2 levels exponentially increased to double with four occupants compared to one occupant’s case in one hour of monitoring. Importantly, desired IAQ standards (1000 ppm) were achieved in 13, 33, 80, and 86 min for one, two, three, and four occupants after starting natural ventilation by opening 20% of the windows. The results demonstrated that occupancy significantly affects CO2 levels, with concentrations exceeding the IAQ standard of 1000 ppm within 30 min under closed ventilation conditions for all tested scenarios. This study found negligible temperature variations in dormitories with ceiling heights lower than 3 m, ignoring the impact of thermal stratification. Ventilation through partial window openings can be increased in cold regions during summer to minimize the impact of CO2 on the indoor environment. This study highlighted the negligible effect of occupancy on the relative humidity in condensed dormitory rooms. Natural ventilation achieved desired IAQ levels, with ventilation times varying based on occupancy, underscoring its effectiveness in maintaining acceptable indoor environments. The mass balance model provided reasonable predictions of CO2 concentrations across all scenarios, validating its applicability for IAQ modeling and ventilation period assessment in similar settings. Partial window openings proved sufficient to maintain acceptable IAQ, suggesting that hybrid ventilation systems could enhance indoor air quality while ensuring thermal comfort.

Author Contributions

Conceptualization, I.N. and H.H.; methodology, I.N. and H.H.; software, I.N.; validation, H.H., M.S. and M.A.; formal analysis, I.N. and H.H.; investigation, I.N.; resources, M.A.; data curation, I.N.; writing—original draft preparation, I.N. and H.H.; writing—review and editing, G.H. and A.R.G.; visualization, M.S. and G.H.; supervision, H.H. All authors have read and agreed to the published version of the manuscript.

Funding

This research received no external funding.

Data Availability Statement

The data presented in this study are available on request from the corresponding author.

Acknowledgments

The Researchers would like to thank the Deanship of Graduate Studies and Scientific Research at Qassim University for financial support (QU-APC-2025). The authors thank the School of Engineering, University of Birmingham, Edgbaston, Birmingham, United Kingdom, for facilitating this study.

Conflicts of Interest

The authors declare no conflicts of interest.

Abbreviations

The following abbreviations are used in this manuscript:
ANOVAAnalysis of variance
HVACHeating, ventilation, and air conditioning
IAQIndoor air quality
NVTNatural ventilation time
OPNumber of occupants
RHRelative humidity
WHOWorld Health Organization

Appendix A. Analysis of Variance Results

Table A1. ANOVA results for CO2 levels monitored at 1 m height.
Source of VariationSSdfMSFp-ValueF Crit
Between Groups1.69 × 108284,400,821.2138.78712.49 × 10−493.012475
Within Groups3.27 × 108538608,131.737
Total4.96 × 108540
Table A2. ANOVA results for CO2 levels monitored at 2 m height.
Source of VariationSSdfMSFp-ValueF Crit
Between Groups1.72 × 108285,825,675145.78582.56 × 10−513.012475
Within Groups3.17 × 108538588,710.6
Total4.88 × 108540

References

  1. Odeh, I.; Hussein, T. Activity pattern of urban adult students in an eastern mediterranean society. Int. J. Environ. Res. Public Health 2016, 13, 960. [Google Scholar] [CrossRef]
  2. Leech, J.A.; Nelson, W.C.; Burnett, R.T.; Aaron, S.; Raizenne, M.E. It’s about time: A comparison of Canadian and American time–activity patterns. J. Expo. Sci. Environ. Epidemiol. 2002, 12, 427–432. [Google Scholar] [CrossRef] [PubMed]
  3. Ekmekcioglu, D.; Keskin, S.S. Characterization of Indoor Air Particulate Matter in selected elementary schools in Istanbul, Turkey. Indoor Built Environ. 2007, 16, 169–176. [Google Scholar] [CrossRef]
  4. Ipsen, C.; van Veldhoven, M.; Kirchner, K.; Hansen, J.P. Six key advantages and disadvantages of working from home in Europe during COVID-19. Int. J. Environ. Res. Public Health 2021, 18, 1826. [Google Scholar] [CrossRef] [PubMed]
  5. Grant, C. The UK Is the Work-from-Home Capital of Europe. Now Let’s Work on Getting It Right. 2023. Available online: https://www.theguardian.com/commentisfree/2023/jul/31/uk-work-from-home-capital-europe-make-sure-do-it-right (accessed on 1 November 2023).
  6. Tran, V.V.; Park, D.; Lee, Y.-C. Indoor air pollution, related human diseases, and recent trends in the control and improvement of Indoor Air Quality. Int. J. Environ. Res. Public Health 2020, 17, 2927. [Google Scholar] [CrossRef]
  7. WHO. Household Air Pollution, World Health Organization. World Health Organization. 2022. Available online: https://www.who.int/news-room/fact-sheets/detail/household-air-pollution-and-health (accessed on 17 April 2023).
  8. Deng, H.Y.; Feng, Z.; Cao, S.-J. Influence of air change rates on indoor CO2 stratification in terms of Richardson number and vorticity. Build. Environ. 2018, 129, 74–84. [Google Scholar] [CrossRef]
  9. Lowther, S.D.; Dimitroulopoulou, S.; Foxall, K.; Shrubsole, C.; Cheek, E.; Gadeberg, B.; Sepai, O. Low level carbon dioxide indoors—A pollution indicator or a pollutant? A health-based perspective. Environments 2021, 8, 125. [Google Scholar] [CrossRef]
  10. Chatzidiakou, L.; Mumovic, D.; Summerfield, A. Is CO2 a good proxy for indoor air quality in classrooms? Part 1: The interrelationships between thermal conditions, CO2 levels, ventilation rates and selected indoor pollutants’. Build. Serv. Eng. Res. Technol. 2015, 36, 129–161. [Google Scholar] [CrossRef]
  11. BS EN 16798-1:2019; Energy Performance of Buildings—Ventilation for Buildings—Part 1: Indoor Environmental Input Parameters for Design and Assessment of Energy Performance of Buildings Addressing Indoor Air Quality, Thermal Environment, Lighting and Acoustics—Module M1-6. BSI: London, UK, 2019; ISBN 978-0-580-07090-3. Available online: https://webstore.ansi.org/preview-pages/BSI/preview_30297474.pdf (accessed on 17 June 2023).
  12. Apte, M.G.; Fisk, W.J.; Daisey, J.M. Associations between indoor CO2 concentrations and sick building syndrome symptoms in US office buildings: An analysis of the 1994–1996 base study data. Indoor Air 2000, 10, 246–257. [Google Scholar] [CrossRef]
  13. Azuma, K.; Kagi, N.; Yanagi, U.; Osawa, H. Effects of low-level inhalation exposure to carbon dioxide in Indoor Environments: A short review on human health and psychomotor performance. Environ. Int. 2018, 121, 51–56. [Google Scholar] [CrossRef]
  14. ASHRAE. Position Document on Indoor Carbon Dioxide Ashrae.org. 2022. Available online: https://www.ashrae.org/file%20library/about/position%20documents/pd_indoorcarbondioxide_2022.pdf (accessed on 2 June 2023).
  15. HSE UK. Ventilation in the Workplace, Health and Safety Executive. Available online: https://www.hse.gov.uk/ventilation/using-CO2-monitors.htm (accessed on 2 June 2023).
  16. Asif, A.; Zeeshan, M. Comparative analysis of indoor air quality in offices with different ventilation mechanisms and simulation of ventilation process utilizing system dynamics tool. J. Build. Eng. 2023, 72, 106687. [Google Scholar] [CrossRef]
  17. Jiang, J.; Wang, D.; Liu, Y.; Di, Y.; Liu, J. A holistic approach to the evaluation of the indoor temperature based on thermal comfort and learning performance. Build. Environ. 2021, 196, 107803. [Google Scholar] [CrossRef]
  18. Alsmo, T.; Alsmo, C. Ventilation and relative humidity in Swedish buildings. J. Environ. Prot. 2014, 5, 1022–1036. [Google Scholar] [CrossRef]
  19. Szczurek, A.; Maciejewska, M.; Pietrucha, T. Occupancy determination based on time series of CO2 concentration, temperature and relative humidity. Energy Build. 2017, 147, 142–154. [Google Scholar] [CrossRef]
  20. Duarte, C.; Van Den Wymelenberg, K.; Rieger, C. Revealing occupancy patterns in an office building through the use of occupancy sensor data. Energy Build. 2013, 67, 587–595. [Google Scholar] [CrossRef]
  21. Mahyuddin, N.; Awbi, H.B. The spatial distribution of carbon dioxide in an environmental test chamber. Build. Environ. 2010, 45, 1993–2001. [Google Scholar] [CrossRef]
  22. Liu, S.; Yoshino, H.; Mochida, A. A measurement study on the indoor climate of a college classroom. Int. J. Vent. 2011, 10, 251–261. [Google Scholar] [CrossRef]
  23. Mohamed, S.; Rodrigues, L.; Omer, S.; Calautit, J. Overheating and indoor air quality in primary schools in the UK. Energy Build. 2021, 250, 111291. [Google Scholar] [CrossRef]
  24. Lama, S.; Fu, C.; Lee, A. Indoor Air Quality (IAQ) evaluation of Higher Education Learning environments. J. Constr. Res. 2021, 4. [Google Scholar] [CrossRef]
  25. Sakamoto, M.; Li, M.; Kuga, K.; Ito, K.; Bekö, G.; Williams, J.; Wargocki, P. CO2 emission rates from sedentary subjects under controlled laboratory conditions. Build. Environ. 2022, 211, 108735. [Google Scholar] [CrossRef]
  26. McLeod, R.S.; Mathew, M.; Salman, D.; Thomas, C.L.P. An investigation of indoor air quality in a recently refurbished educational building. Front. Built Environ. 2022, 7, 769761. [Google Scholar] [CrossRef]
  27. Zuhaib, S.; Manton, R.; Griffin, C.; Hajdukiewicz, M.; Keane, M.M.; Goggins, J. An Indoor Environmental Quality (IEQ) assessment of a partially-retrofitted University Building. Build. Environ. 2018, 139, 69–85. [Google Scholar] [CrossRef]
  28. Persily, A.; de Jonge, L. Carbon dioxide generation rates for building occupants. Indoor Air 2017, 27, 868–879. [Google Scholar] [CrossRef]
  29. Huang, Q.; Syndicus, M.; Ehrt, R.; Sacic, A.; Frisch, J.; van Treeck, C. Development of a CO2 based indoor air quality measurement box for classrooms. In Proceedings of the 18th Healthy Buildings Europe Conference, Aachen, Germany, 11–14 June 2023; pp. 1–7. [Google Scholar]
  30. Bhagat, R.K.; Wykes, M.S.D.; Dalziel, S.B.; Linden, P.F. Effects of ventilation on the indoor spread of Covid-19. J. Fluid Mech. 2020, 903, F1. [Google Scholar] [CrossRef]
  31. Wang, L.; Zhang, X.; Qi, D. Indoor thermal stratification and its statistical distribution. Indoor Air 2018, 29, 347–363. [Google Scholar] [CrossRef]
  32. Seduikyte, L.; Stasiulienė, L.; Prasauskas, T.; Martuzevičius, D.; Černeckienė, J.; Ždankus, T.; Dobravalskis, M.; Fokaides, P. Field measurements and numerical simulation for the definition of the thermal stratification and ventilation performance in a mechanically ventilated sports hall. Energies 2019, 12, 2243. [Google Scholar] [CrossRef]
  33. Di Gilio, A.; Palmisani, J.; Pulimeno, M.; Cerino, F.; Cacace, M.; Miani, A.; de Gennaro, G. CO2 Concentration Monitoring Inside Educational Buildings as a strategic tool to reduce the risk of SARS-COV-2 airborne transmission. Environ. Res. 2021, 202, 111560. [Google Scholar] [CrossRef] [PubMed]
  34. Peng, Z.; Jimenez, J.L. Exhaled CO2 as a COVID-19 infection risk proxy for different indoor environments and activities. Environ. Sci. Technol. Lett. 2021, 8, 392–397. [Google Scholar] [CrossRef]
  35. Sadrizadeh, S.; Yao, R.; Yuan, F.; Awbi, H.; Bahnfleth, W.; Bi, Y.; Cao, G.; Croitoru, C.; de Dear, R.; Haghighat, F.; et al. Indoor Air Quality and health in schools: A critical review for developing the roadmap for the Future School Environment. J. Build. Eng. 2022, 57, 104908. [Google Scholar] [CrossRef]
  36. Coley, D.A.; Greeves, R.; Saxby, B.K. The effect of low ventilation rates on the cognitive function of a primary school class. Int. J. Vent. 2007, 6, 107–112. [Google Scholar] [CrossRef]
  37. Awang, N.R.; Ridzuan, A.S.; Zainol, M.H. Background concentration of indoor air quality in hostel rooms during varying conditions. J. Trop. Resour. Sustain. Sci. (JTRSS) 2018, 6, 100–108. [Google Scholar] [CrossRef]
  38. Korsavi, S.S.; Montazami, A.; Mumovic, D. Indoor Air Quality (IAQ) in naturally-ventilated primary schools in the UK: Occupant-related factors. Build. Environ. 2020, 180, 106992. [Google Scholar] [CrossRef]
  39. Lei, Z.; Liu, C.; Wang, L.; Li, N. Effect of natural ventilation on indoor air quality and thermal comfort in dormitory during winter. Build. Environ. Vol. 2017, 125, 240–247. [Google Scholar] [CrossRef]
  40. McGill, G.; Oyedele, L.O.; McAllister, K. Case study investigation of indoor air quality in mechanically ventilated and naturally ventilated UK social housing. Int. J. Sustain. Built Environ. 2015, 4, 58–77. [Google Scholar] [CrossRef]
  41. Tognon, G.; Marigo, M.; De Carli, M.; Zarrella, A. Mechanical, natural and hybrid ventilation systems in different building types: Energy and indoor air quality analysis. J. Build. Eng. 2023, 76, 107060. [Google Scholar] [CrossRef]
  42. Ródenas García, M.; Spinazzé, A.; Branco, P.T.B.S.; Borghi, F.; Villena, G.; Cattaneo, A.; Di Gilio, A.; Mihucz, V.G.; Gómez Álvarez, E.; Lopes, S.I.; et al. Review of low-cost sensors for indoor air quality: Features and applications. Appl. Spectrosc. Rev. 2022, 57, 747–779. [Google Scholar] [CrossRef]
  43. Mahyuddin, N.; Awbi, H.B. A Review of CO2 Measurement Procedures in Ventilation Research. Int. J. Vent. 2016, 10, 353–370. [Google Scholar] [CrossRef]
  44. International WELL Building. Ventilation Effectiveness. 2020. Available online: https://standard.wellcertified.com/air/ventilation-effectiveness (accessed on 19 November 2023).
  45. Palmisani, J.; Di Gilio, A.; Viana, M.; de Gennaro, G.; Ferro, A. Indoor Air Quality Evaluation in oncology units at two European hospitals: Low-cost sensors for TVOCs, PM2.5 and CO2 Real-time monitoring. Build. Environ. 2021, 205, 108237. [Google Scholar] [CrossRef]
  46. Pei, G.; Rim, D.; Schiavon, S.; Vannucci, M. Effect of sensor position on the performance of CO2-based demand controlled ventilation. Energy Build. 2019, 202, 109358. [Google Scholar] [CrossRef]
  47. Hattori, S.; Iwamatsu, T.; Miura, T.; Tsutsumi, F.; Tanaka, N. Investigation of indoor air quality in residential buildings by measuring CO2 concentration and a questionnaire survey. Sensors 2022, 22, 7331. [Google Scholar] [CrossRef]
  48. Kiwan, A.; Berg, W.; Fiedler, M.; Ammon, C.; Gläser, M.; Müller, H.J.; Brunsch, R. Air exchange rate measurements in naturally ventilated dairy buildings using the tracer gas decay method with 85Kr, compared to CO2 mass balance and discharge coefficient methods. Biosyst. Eng. 2013, 116, 286–296. [Google Scholar] [CrossRef]
  49. ASHRAE Standard 62.1–2016; Ventilation for Acceptable Indoor Air Quality. American Society of Heating, Refrigerating, and Air-Conditioning Engineers: Peachtree Corners, GA, USA, 2016.
  50. ARANET. Aranet4—CO2 Monitor, Aranet. 2023. Available online: https://pro.aranet.com/products/aranet4/ (accessed on 26 January 2024).
  51. Kalimeri, K.K.; Saraga, D.E.; Lazaridis, V.D.; Legkas, N.A.; Missia, D.A.; Tolis, E.I.; Bartzis, J.G. Indoor air quality investigation of the school environment and estimated health risks: Two-season measurements in primary schools in Kozani, Greece. Atmos. Pollut. Res. 2016, 7, 1128–1142. [Google Scholar] [CrossRef]
  52. Jung, C.-C.; Wu, P.-C.; Tseng, C.-H.; Su, H.-J. Indoor air quality varies with ventilation types and working areas in hospitals. Build. Environ. 2015, 85, 190–195. [Google Scholar] [CrossRef]
  53. Zhou, L.; Sun, W.; Huang, C.; Li, H.; Zou, Z.; Wu, C. Studies on comparison of Particle Concentration Models for cleanroom. Procedia Eng. 2017, 205, 3308–3315. [Google Scholar] [CrossRef]
  54. Reda, I.; AbdelMessih, R.N.; Steit, M.; Mina, E.M. Exhaled CO2-based tracer gas for measuring ventilation rates and energy consumption with application to worship places. Ain Shams Eng. J. 2023, 14, 102138. [Google Scholar] [CrossRef]
  55. Fujikawa, M.; Yoshino, H.; Takaki, R.; Okuyama, H.; Hayashi, M.; Sugawara, M. Experimental study of the multi-zonal airflow measurement method using human expiration. J. Environ. Eng. (Trans. AIJ) 2010, 75, 499–508. [Google Scholar] [CrossRef]
  56. Lawrence, T.M.; Braun, J.E. A methodology for estimating occupant CO2 source generation rates from measurements in small commercial buildings. Build. Environ. 2007, 42, 623–639. [Google Scholar] [CrossRef]
  57. Fan, G.; Chang, H.; Sang, C.; Chen, Y.; Ning, B.; Liu, C. Evaluating indoor carbon dioxide concentration and ventilation rate of research student offices in Chinese universities: A case study. Processes 2022, 10, 1434. [Google Scholar] [CrossRef]
  58. Ahn, K.U.; Kim, D.-W.; Cho, K.; Cho, D.; Cho, H.M.; Chae, C.-U. Hybrid model for forecasting indoor CO2 Concentration. Buildings 2020, 12, 1540. [Google Scholar] [CrossRef]
  59. ASHRAE. ASHRAE Handbook Fundamentals; ASHRAE: Atlanta, GA, USA, 2013. [Google Scholar]
  60. Cosals. Available online: https://www.casals.com/en/ventilation-tools/calculation-help/air-change-rates-in-typical-rooms-and-buildings/ (accessed on 23 October 2023).
  61. Fonseca, A.; Abreu, I.; Guerreiro, M.J.; Abreu, C.; Silva, R.; Barros, N. Indoor air quality and sustainability management—Case study in three Portuguese healthcare units. Sustainability 2018, 11, 101. [Google Scholar] [CrossRef]
  62. Persily, A.K.; Polidoro, B. Indoor Carbon Dioxide Metric Analysis Tool. In Building Energy and Environment Division Engineering Laboratory; National Institute of Standards and Technolog: Gaithersburg, MD, USA, 2022. [Google Scholar] [CrossRef]
  63. HSE UK. OC 311/2: Sick Building Syndrome, OC 311/2: Sick Building Syndrome. 1992. Available online: https://www.hse.gov.uk/foi/internalops/ocs/300-399/oc311_2.htm (accessed on 28 January 2024).
  64. Hiwar, W.; King, M.F.; Shuweihdi, F.; Fletcher, L.A.; Dancer, S.J.; Noakes, C.J. What is the relationship between indoor air quality parameters and airborne microorganisms in hospital environments? A systematic review and meta-analysis. Indoor Air 2021, 31, 1308–1322. [Google Scholar] [CrossRef] [PubMed]
  65. Persily, A.K. Field measurement of ventilation rates. Indoor Air 2016, 26, 97–111. [Google Scholar] [CrossRef] [PubMed]
  66. Batog, P.; Badura, M. Dynamic of changes in carbon dioxide concentration in bedrooms. Procedia Eng. 2013, 57, 175–182. [Google Scholar] [CrossRef]
  67. Qi, M.W.; Li, X.F.; Weschler, L.B.; Sundell, J. CO2 generation rate in Chinese people. Indoor Air 2014, 24, 559–566. [Google Scholar] [CrossRef]
  68. Nusseck, M.; Richter, B.; Holtmeier, L.; Skala, D.; Spahn, C. CO2 measurements in instrumental and vocal closed room settings as a risk reducing measure for a Coronavirus infection. medRxiv 2020, 2020-10. [Google Scholar] [CrossRef]
  69. Pereira, P.F.; Ramos, N.M.M.; Almeida, R.M.S.F.; Simões, M.L.; Barreira, E. Occupant influence on residential ventilation patterns in mild climate conditions. Energy Procedia 2017, 132, 837–842. [Google Scholar] [CrossRef]
Figure 1. Study area: (a) location map, (b) photograph of Test 1 conducted in Room A, and (c) photograph showing the location of Tests 2, 3, and 4 carried out in Room B with a single window with a 20% allowable opening.
Buildings 15 00896 g001
Figure 2. Plan of the rooms under study. (a) Small Room A and (b) Large Room B.
Buildings 15 00896 g002
Figure 3. Impact of occupants on CO2 concentration: (a) one occupant in Room A (3.47 m × 2.17 m × 2.38 m, (b) two occupants in Room B (3.30 m × 2.97 m × 2.97 m), (c) three occupants in Room B, and (d) four occupants in Room B.
Buildings 15 00896 g003
Figure 4. Monitored temperature from sensors installed at 1 m and 2 m: (a) Room A (1 occupant), (b) Room B (2 occupants), (c) Room B (3 occupants), (d) Room B (4 occupants), (e) whisker diagrams.
Buildings 15 00896 g004
Figure 5. Monitored relative humidity from sensors installed at 1 m and 2 m: (a) Room A (1 occupant), (b) Room B (2 occupants), (c) Room B (3 occupants), (d) Room B (4 occupants), (e) whisker diagram.
Buildings 15 00896 g005
Figure 6. Impact of natural ventilation on indoor CO2 levels in four tests with different numbers of occupants (OP), (a) CO2 levels at which natural ventilation time (NVT) started and associated times, (b) NVT to reach CO2 levels ~500 ppm and less than 1000 ppm.
Buildings 15 00896 g006
Table 1. Room size and characteristics of the tested dormitory.
OccupancyTest LocationRoom Size
(m × m × m)
Number of WindowsWindow Size (m2)Room Area (m2)Room Volume (m3)Sensor Location
1Room A3.47 × 2.17 × 2.3821.67 × 17.5217.92Wall mounted
2Room B3.30 × 2.97 × 2.9711.67 × 19.8029.10Wall mounted
3Room B3.30 × 2.97 × 2.9711.67 × 19.8029.10Wall mounted
4Room B3.30 × 2.97 × 2.9711.67 × 19.8029.10Wall mounted
Table 2. Estimated AERs and CO2 generation rates.
Test No. Room No.Occupancy
(n)
Air Exchange Rate ERs
“N” (h−1)
Average CO2 Generation Rate Per Person “E” (L/s)
Test 1 A10.120.0106
Test 2B20.160.0035
Test 3B30.160.0017
Test 4B40.370.0020
Disclaimer/Publisher’s Note: The statements, opinions and data contained in all publications are solely those of the individual author(s) and contributor(s) and not of MDPI and/or the editor(s). MDPI and/or the editor(s) disclaim responsibility for any injury to people or property resulting from any ideas, methods, instructions or products referred to in the content.