
Research and Advances in the Characteristics of Blast-Induced Vibration Frequencies


Abstract
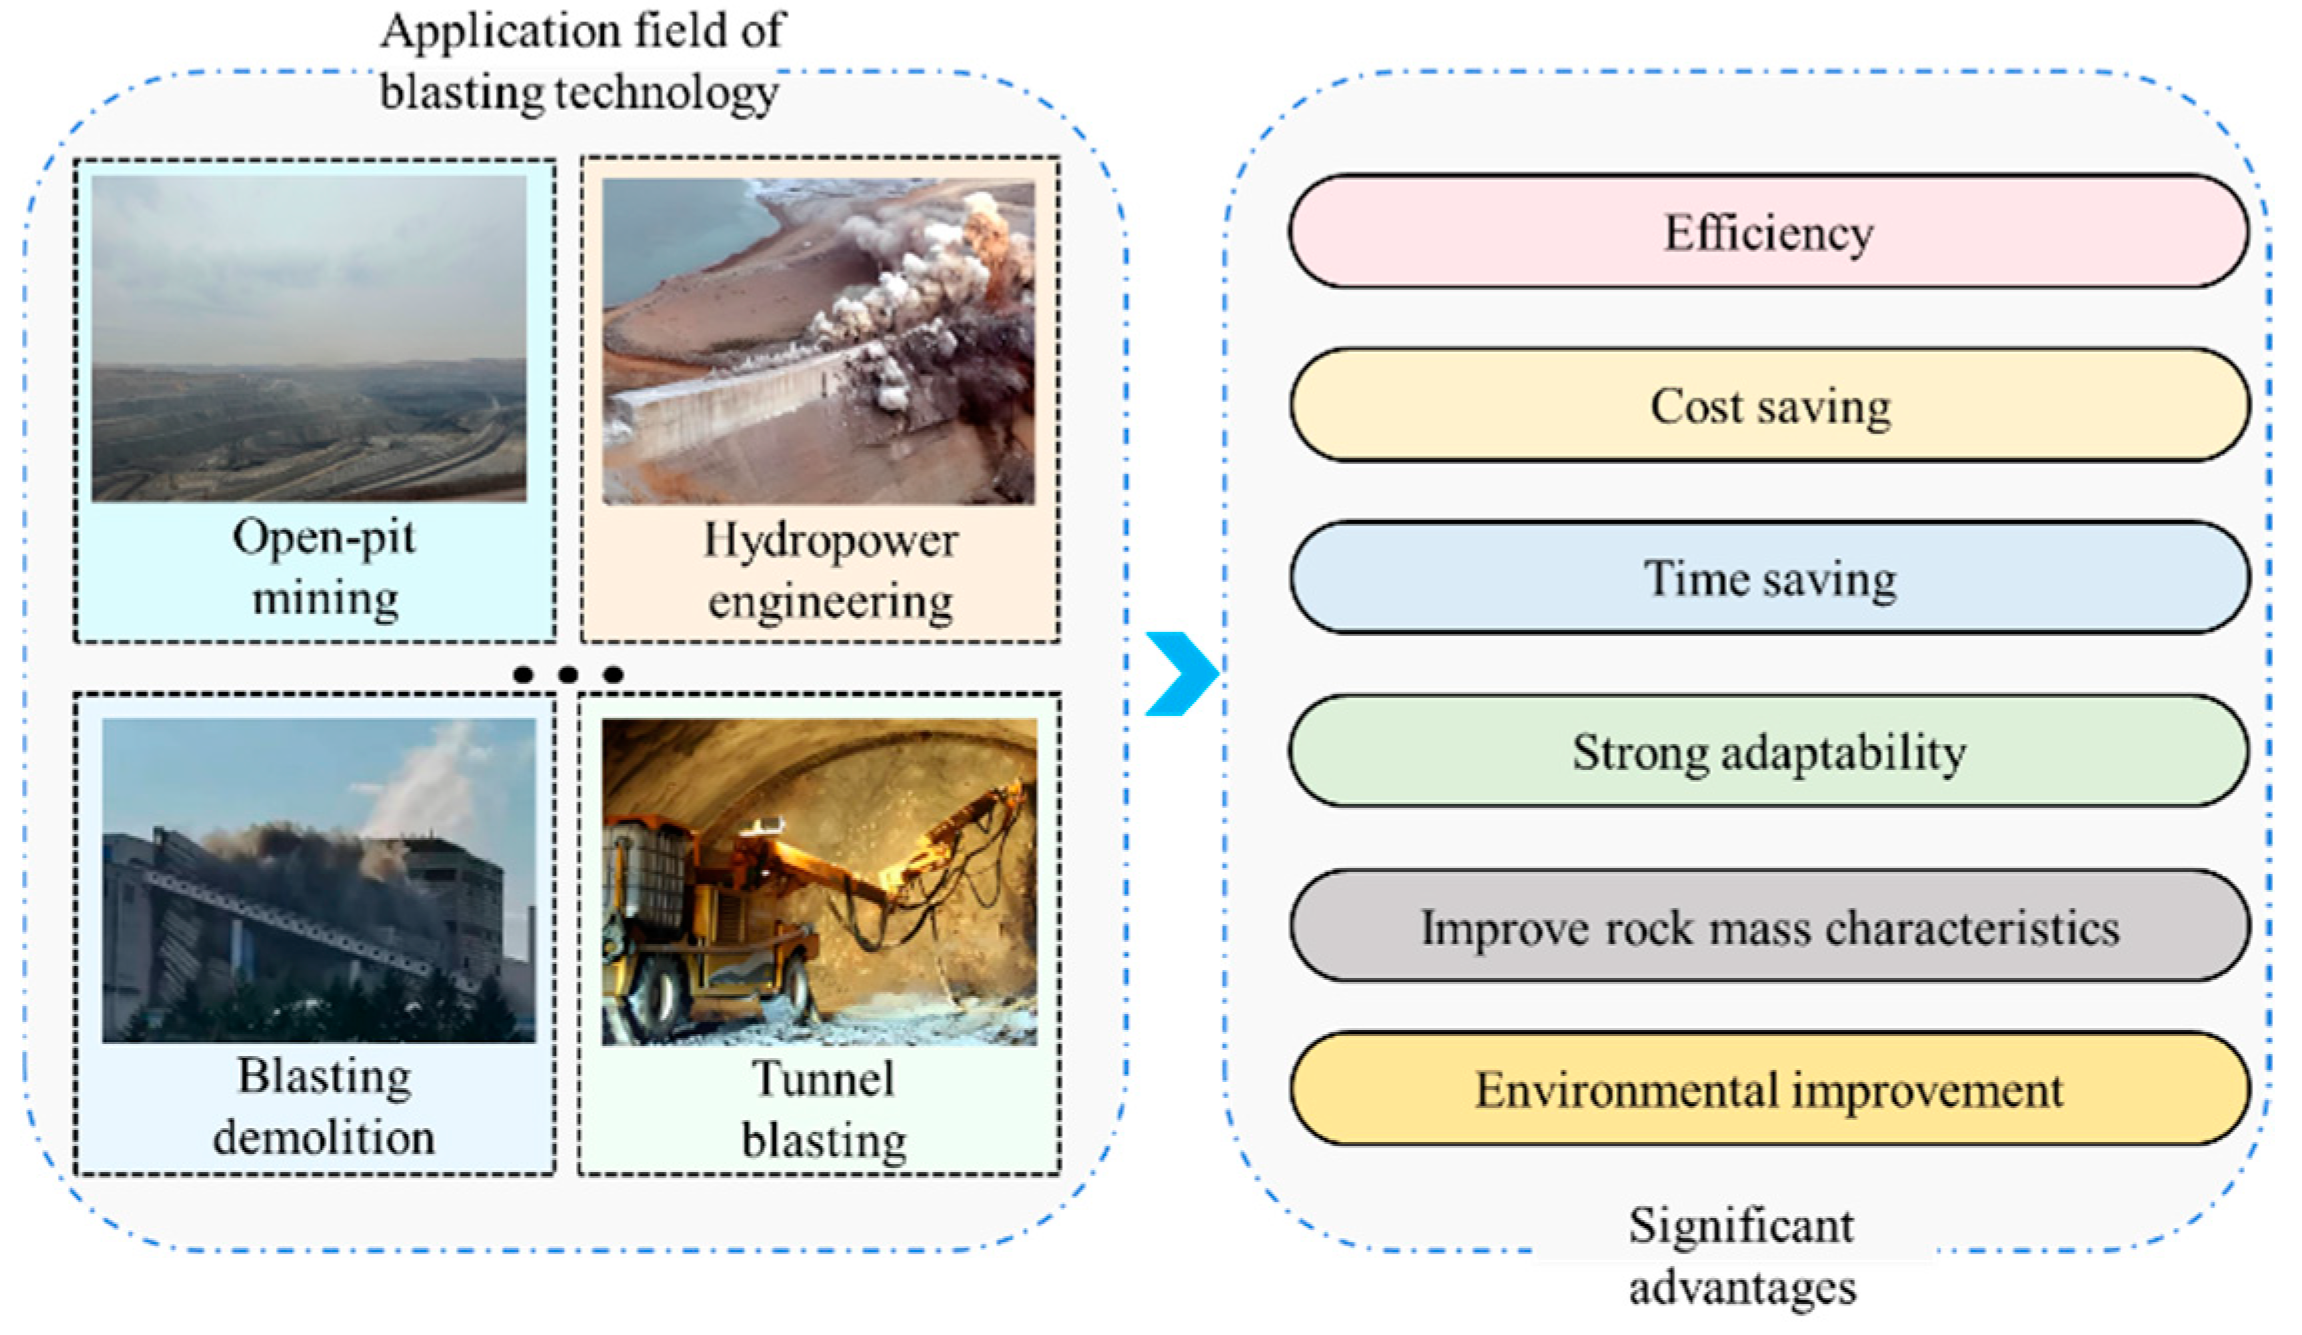
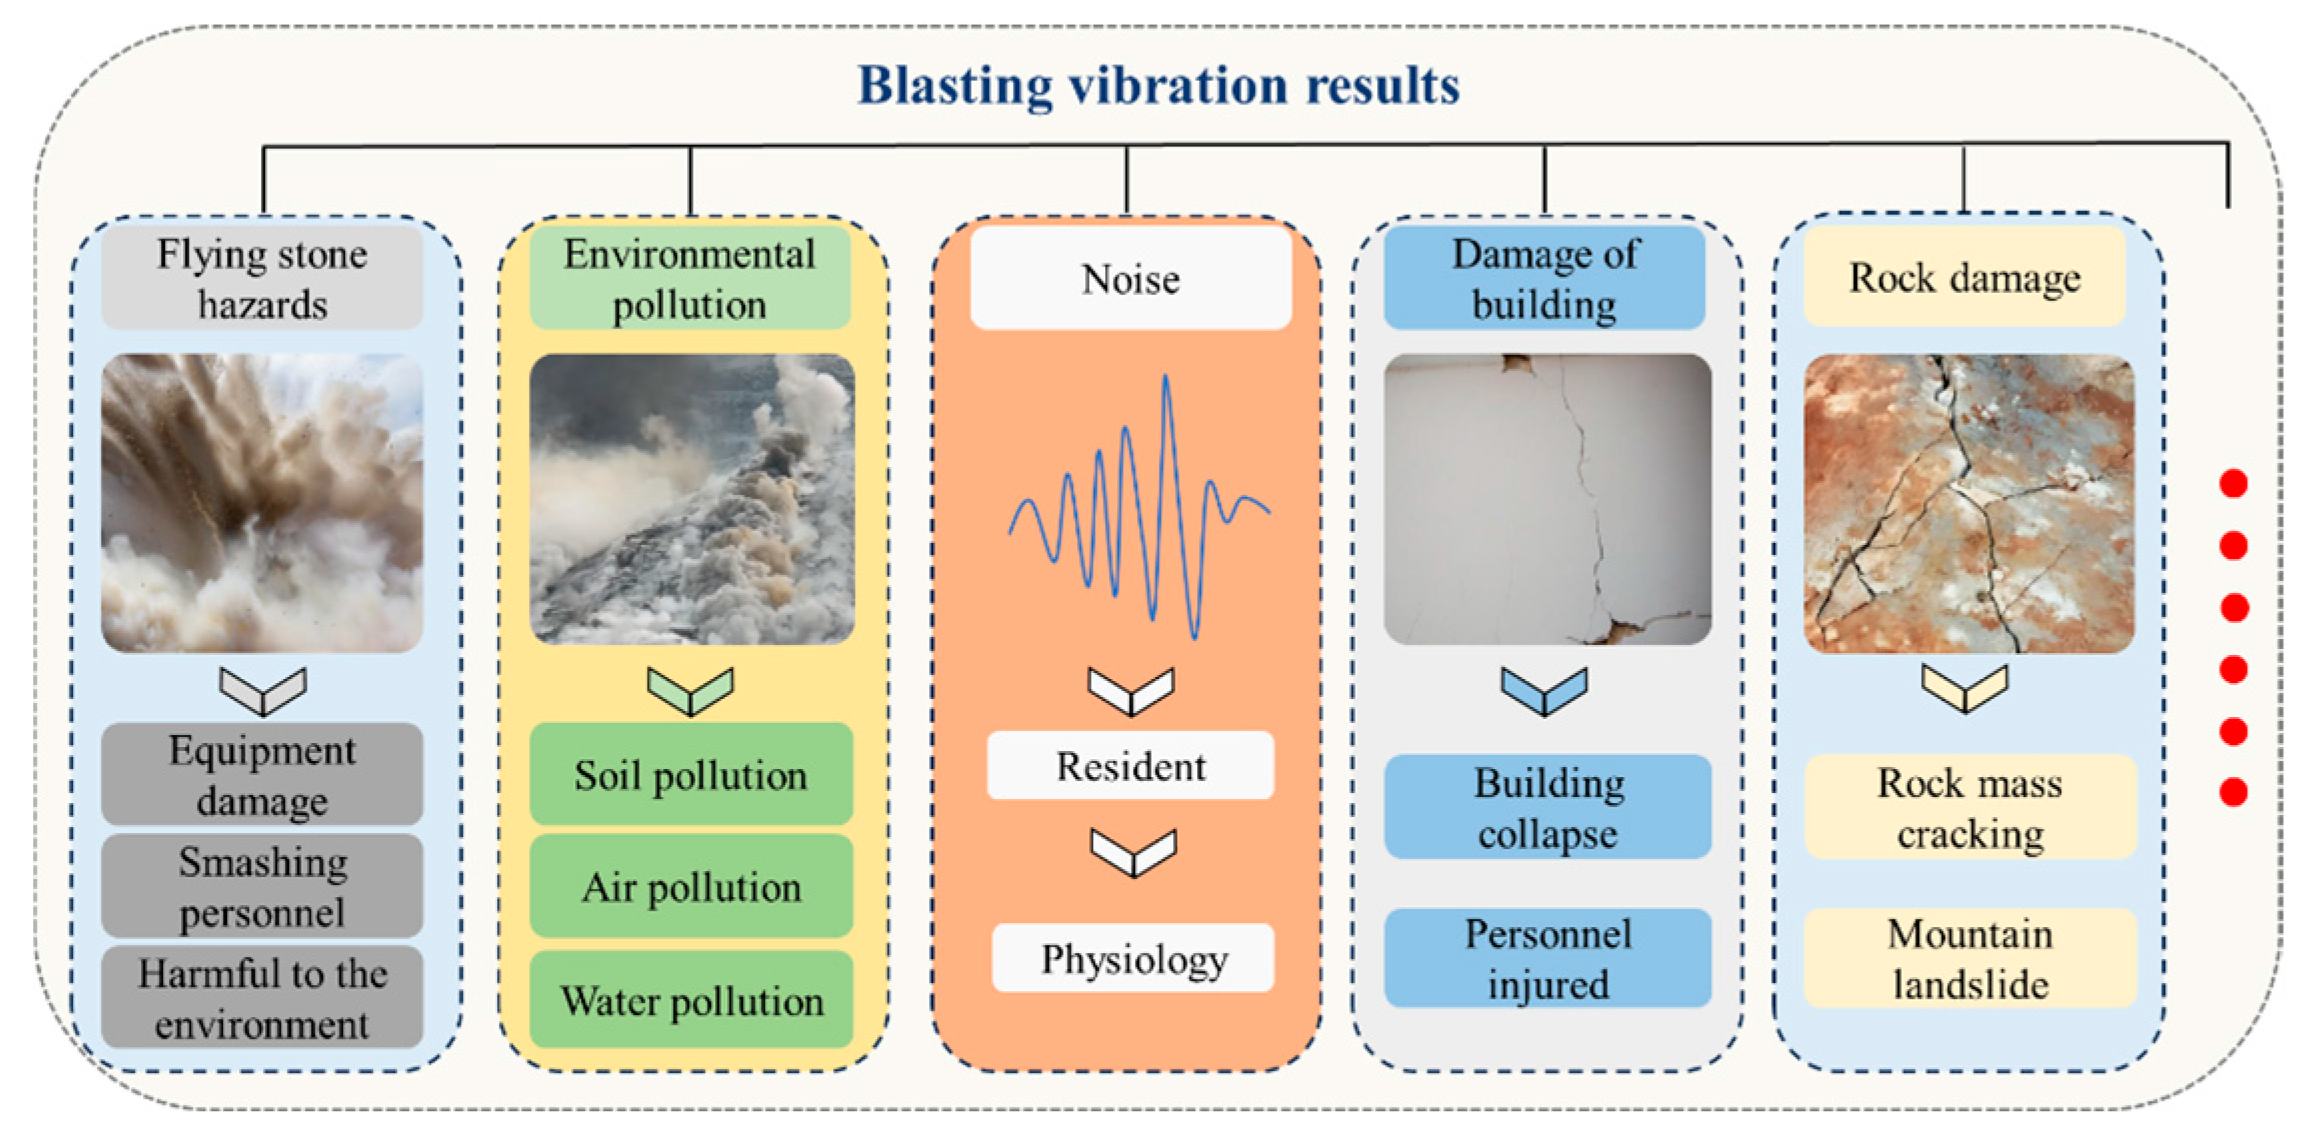
1. Introduction
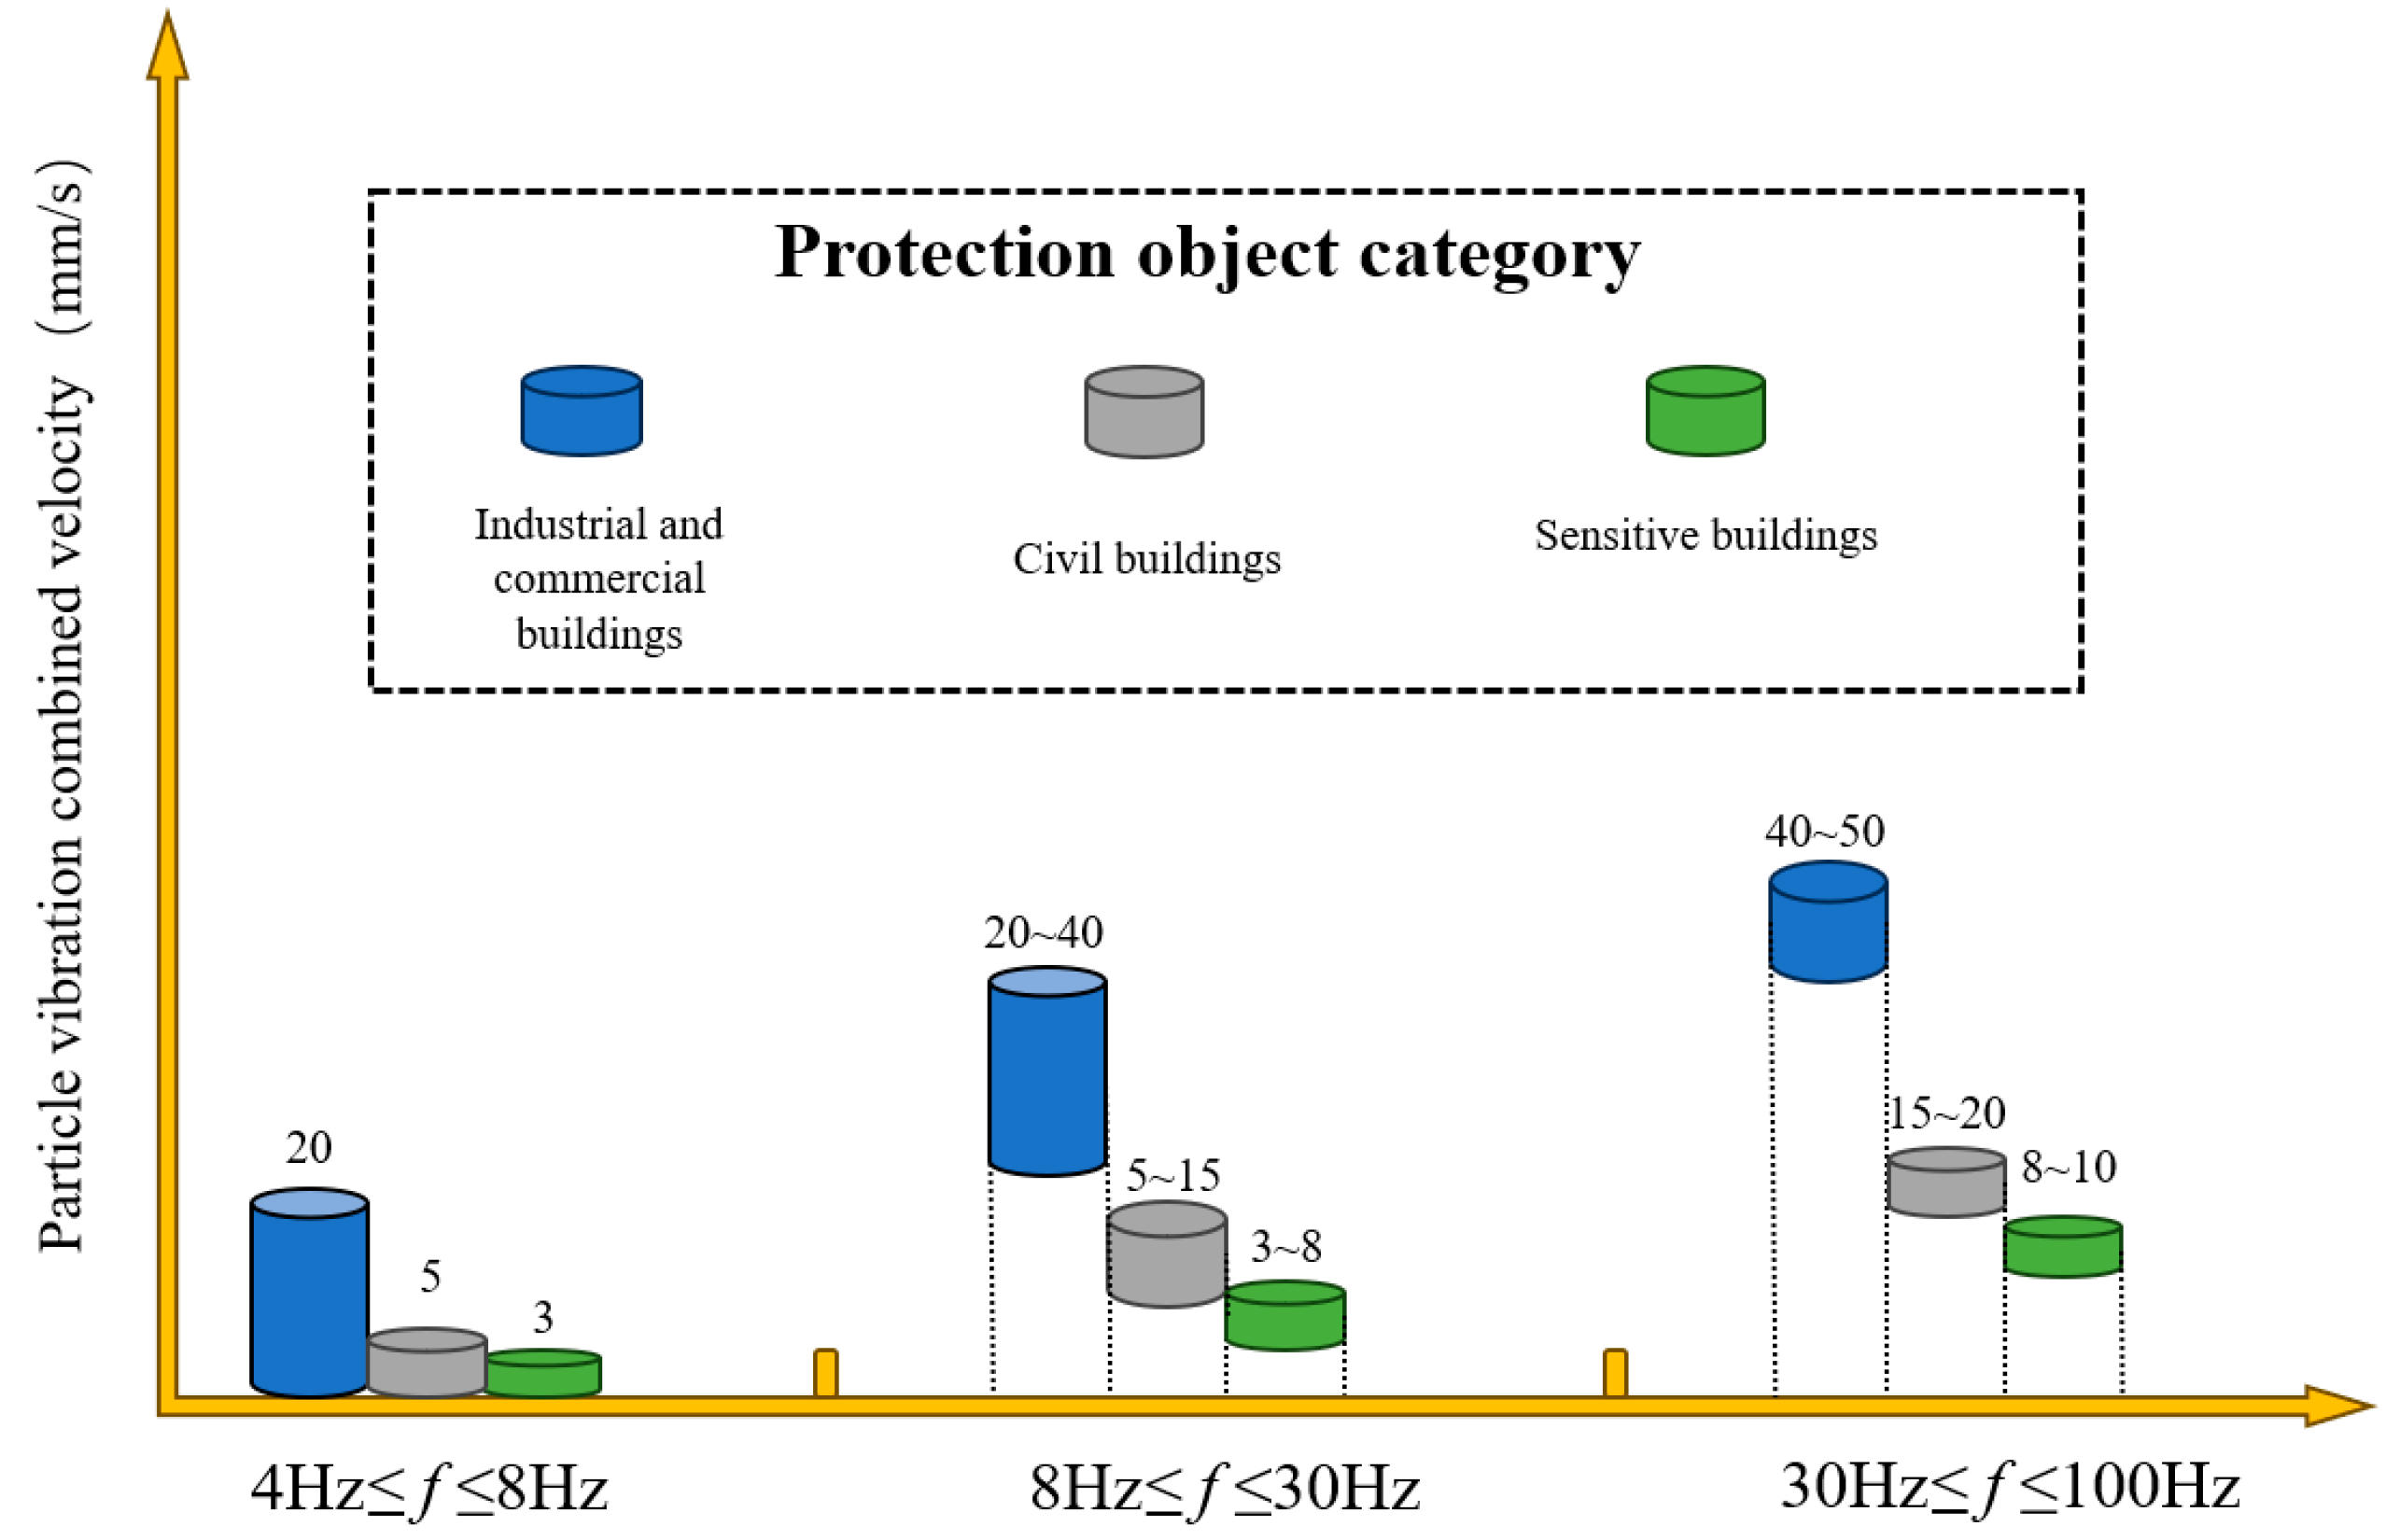
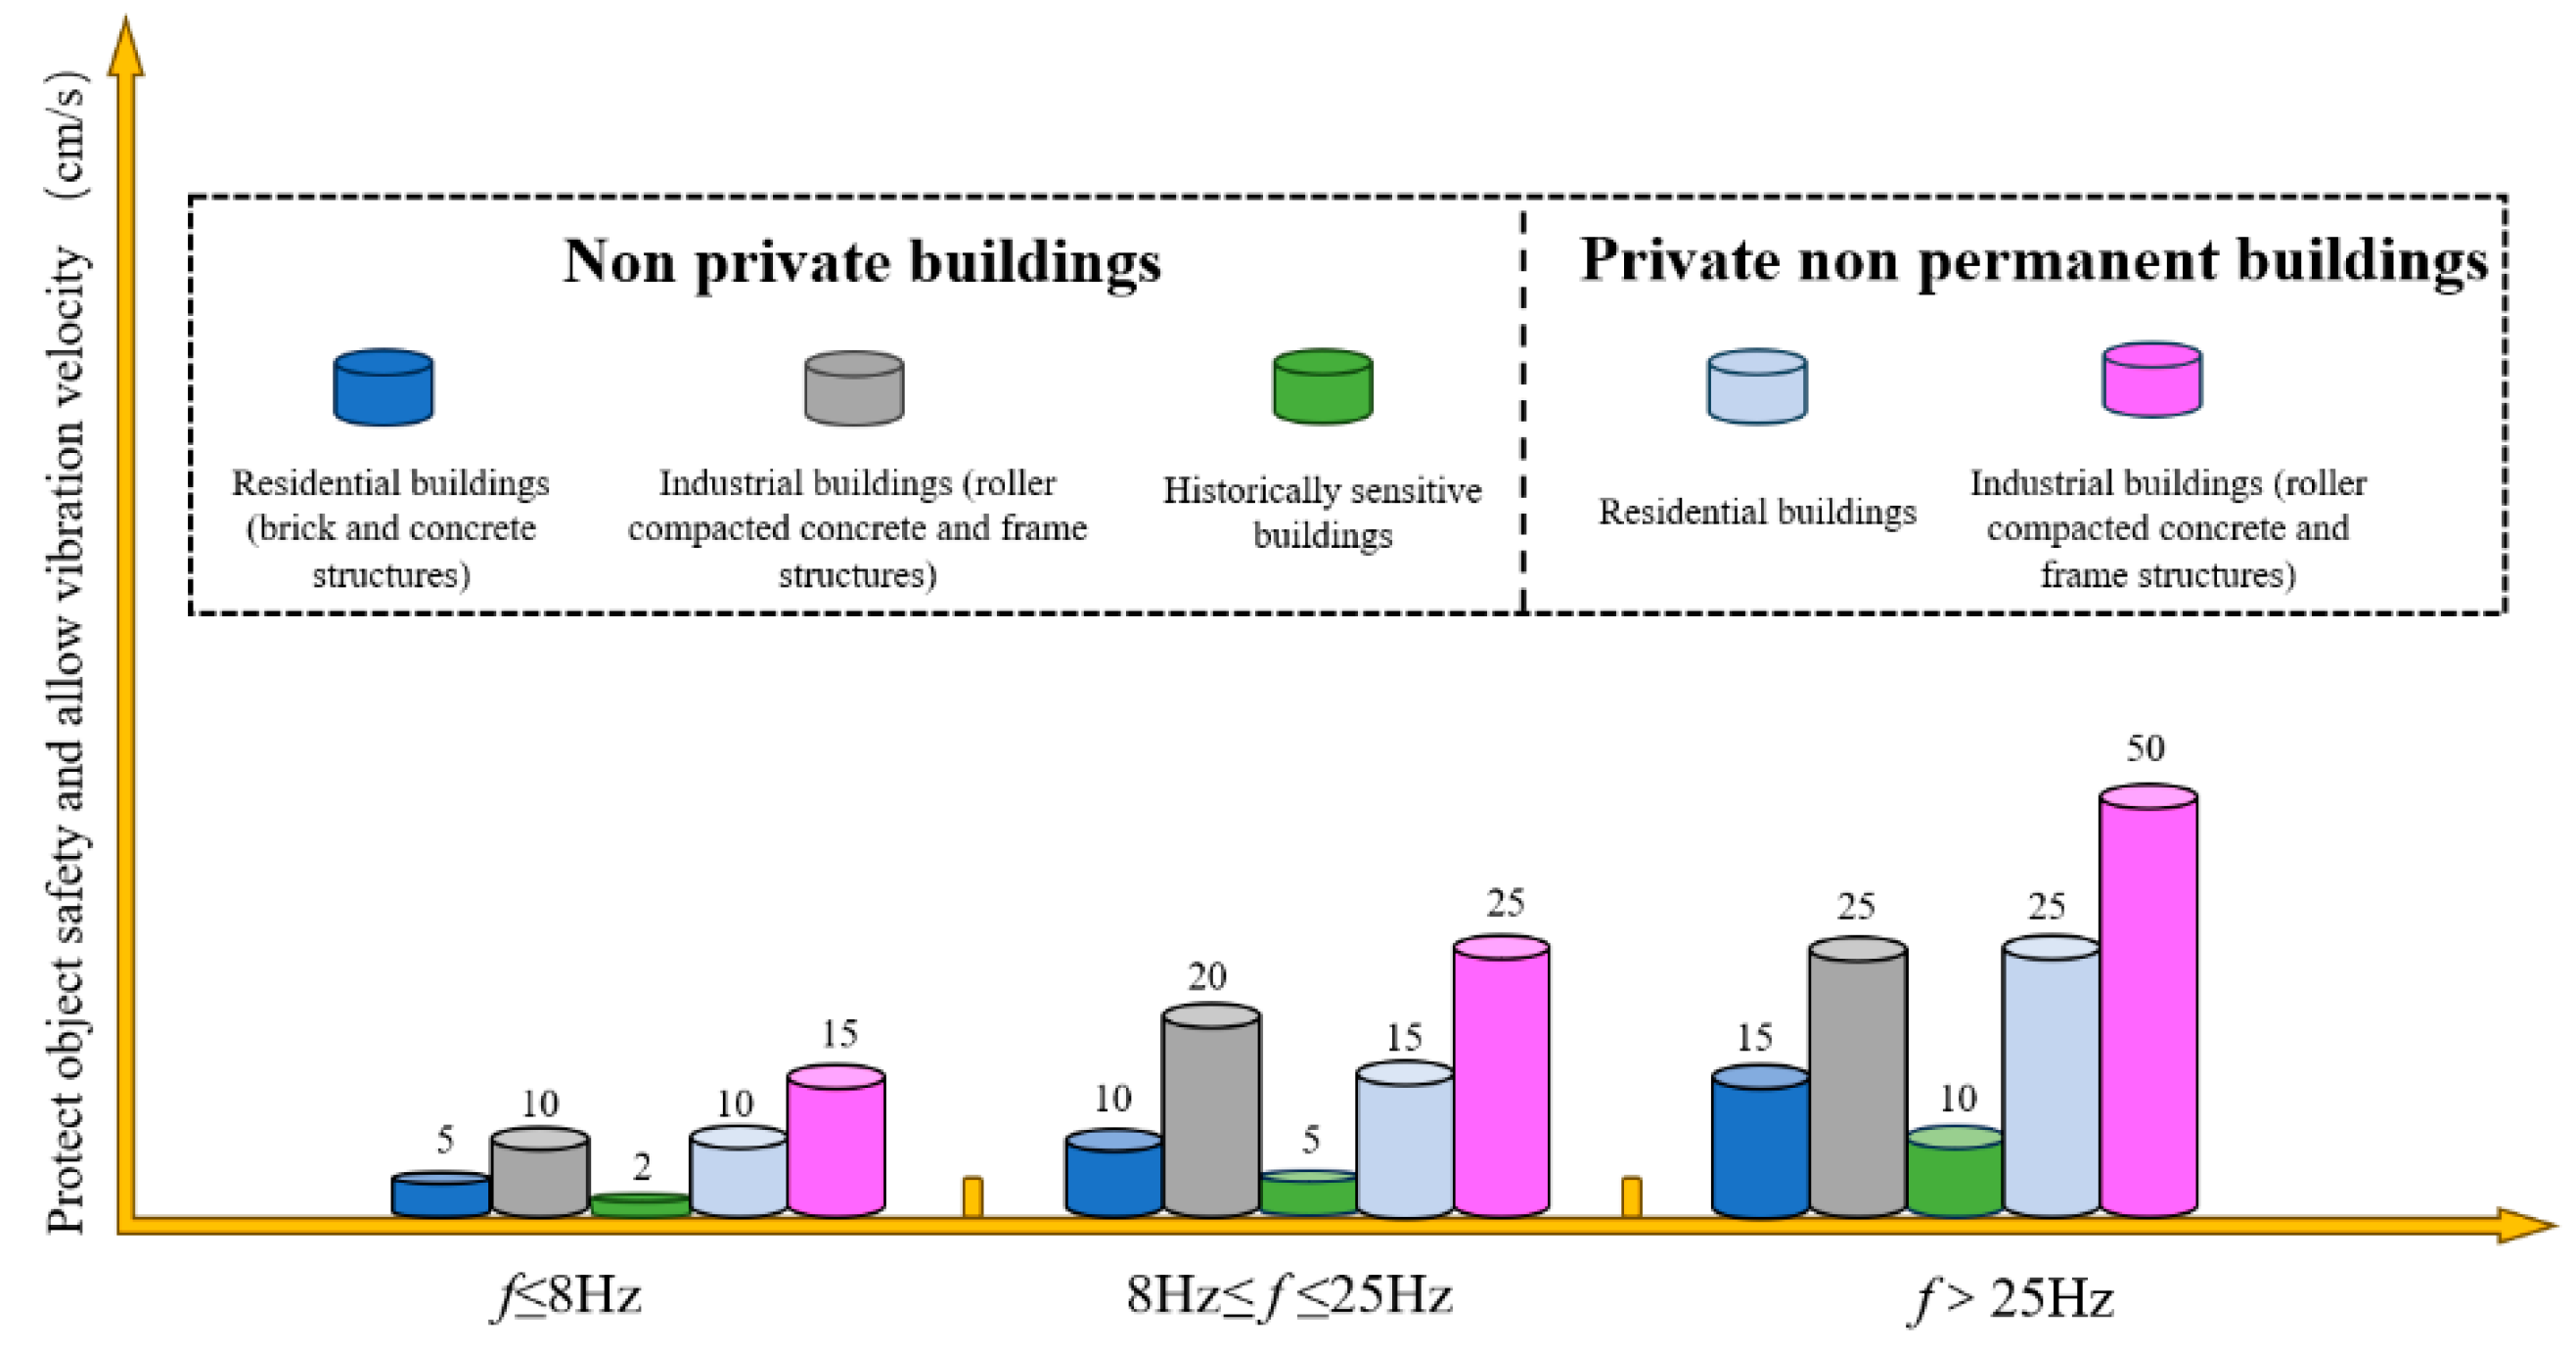
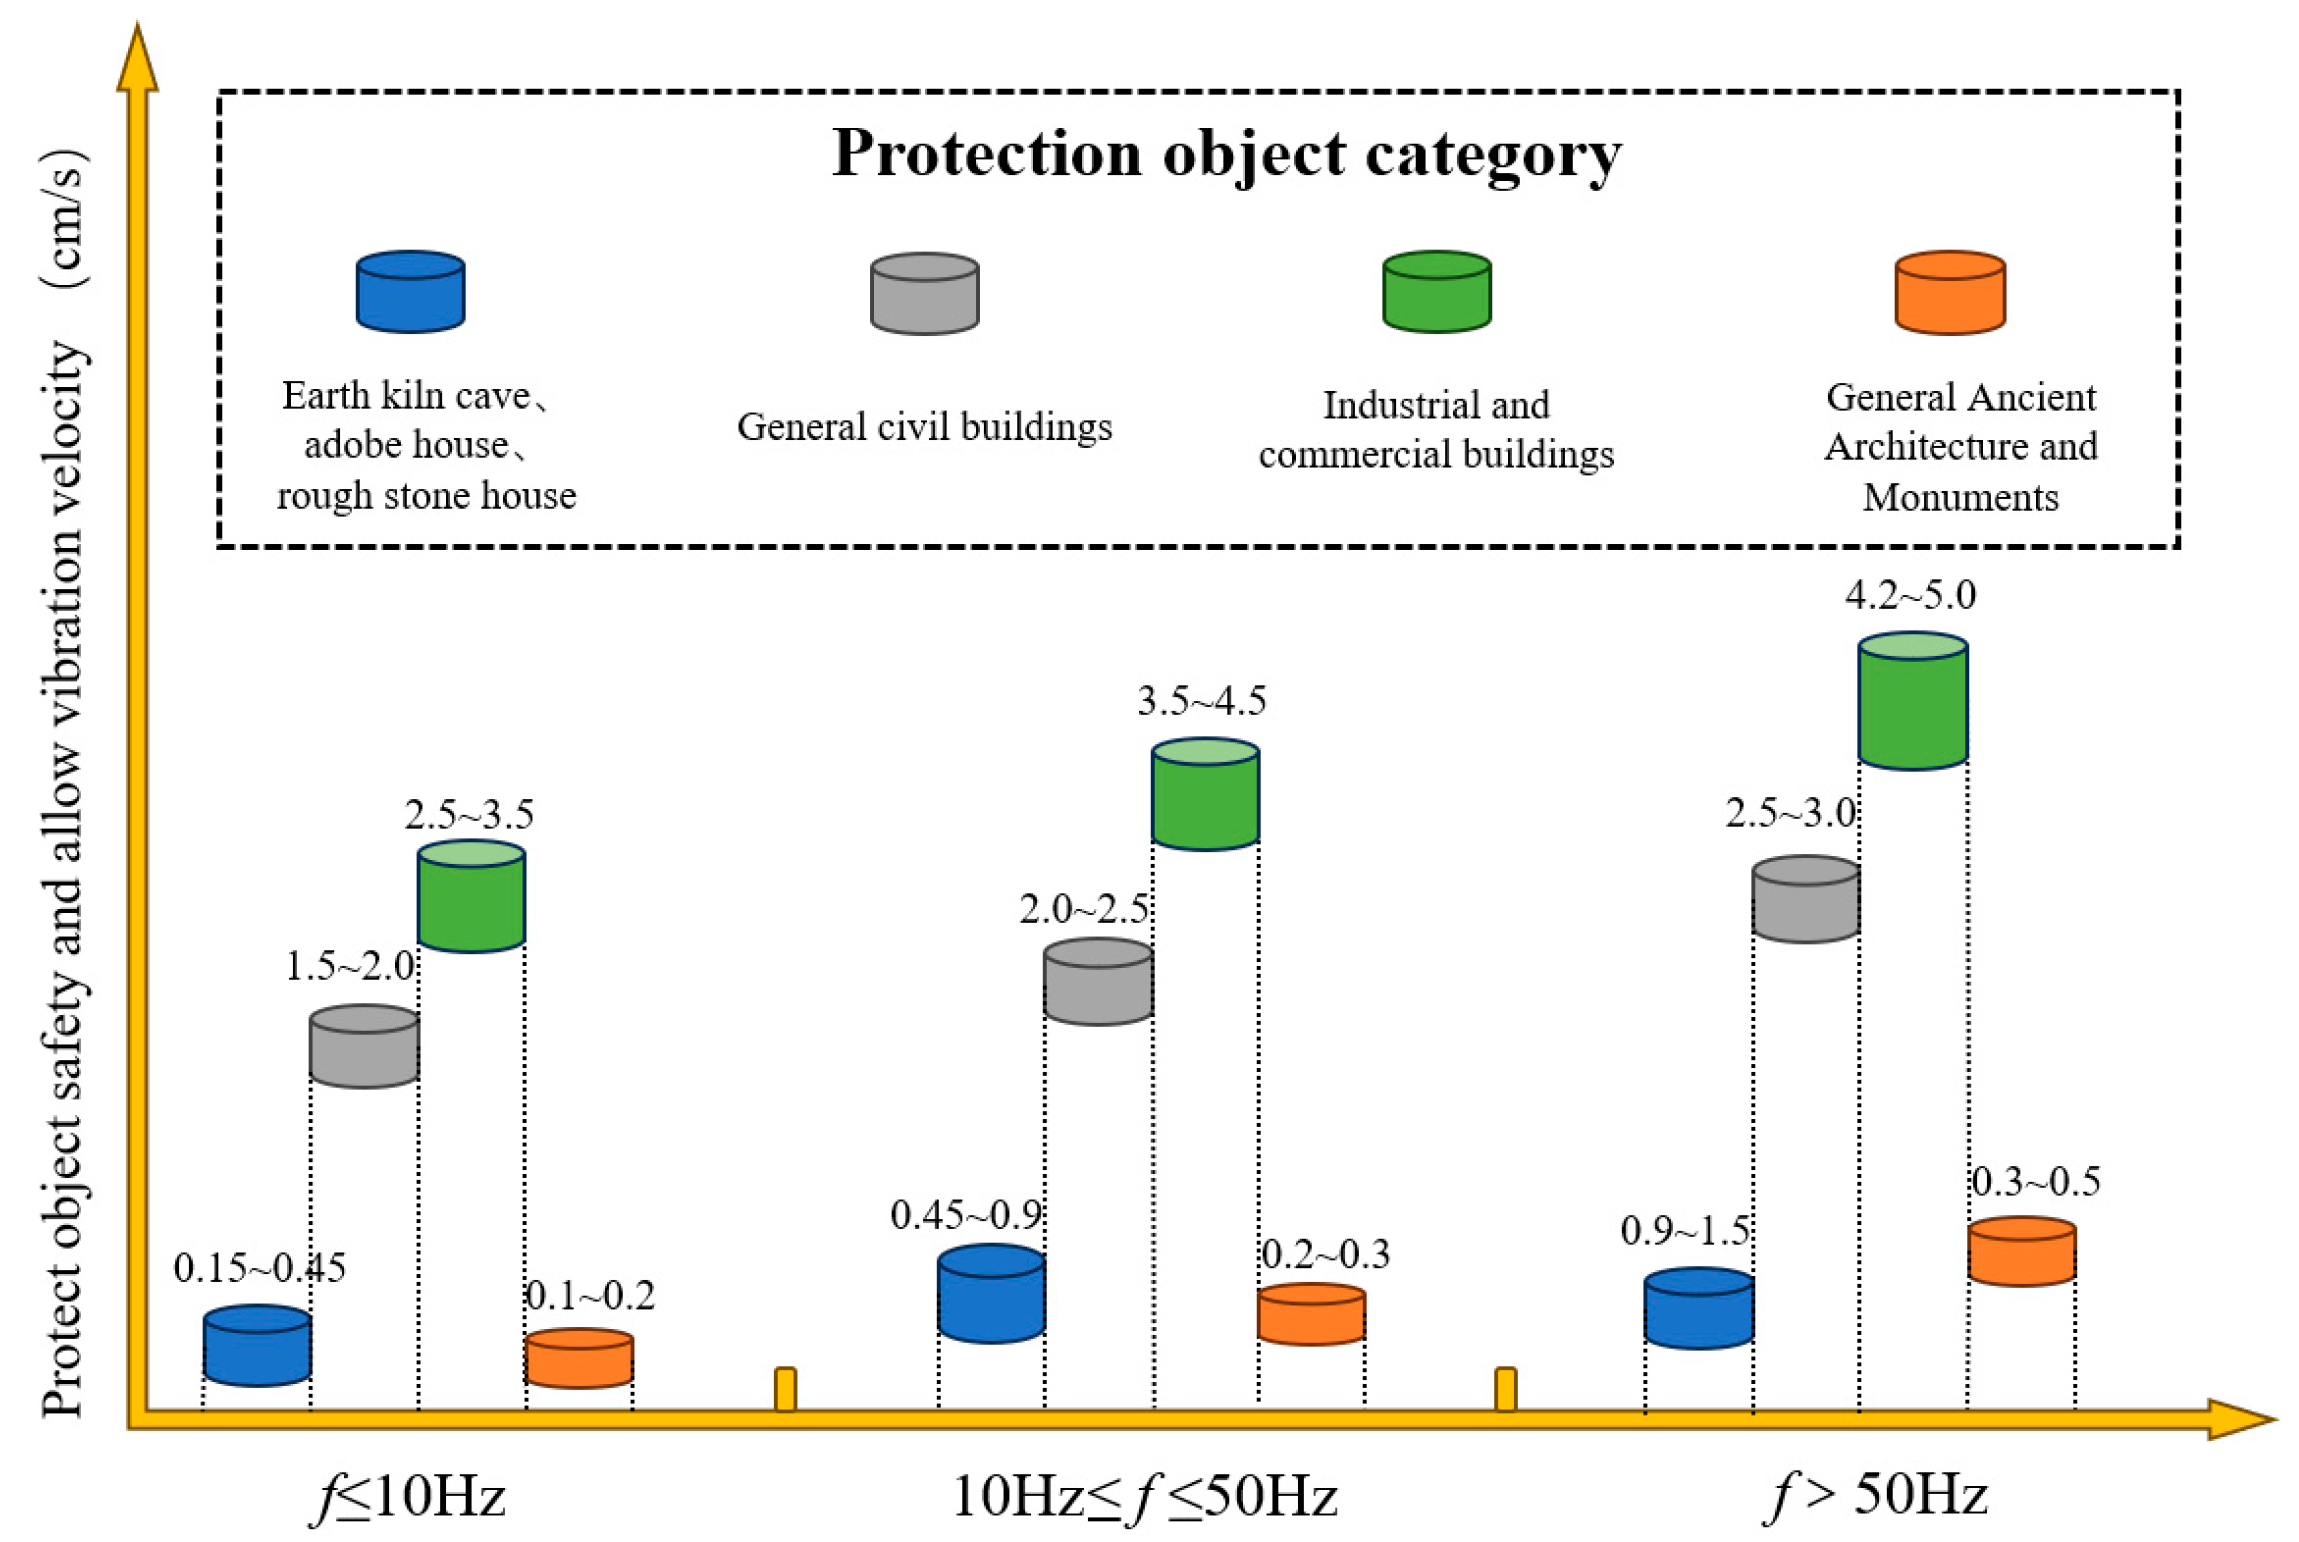
2. Safety Criteria for Blast-Induced Vibrations
3. Blast-Induced Vibration Frequency
3.1. Characteristic Frequencies in Blast-Induced Vibration Spectrum Analysis
3.1.1. Zero-Cross Dominant Frequency
3.1.2. Fourier Dominant Frequency
3.1.3. Centroid Frequency
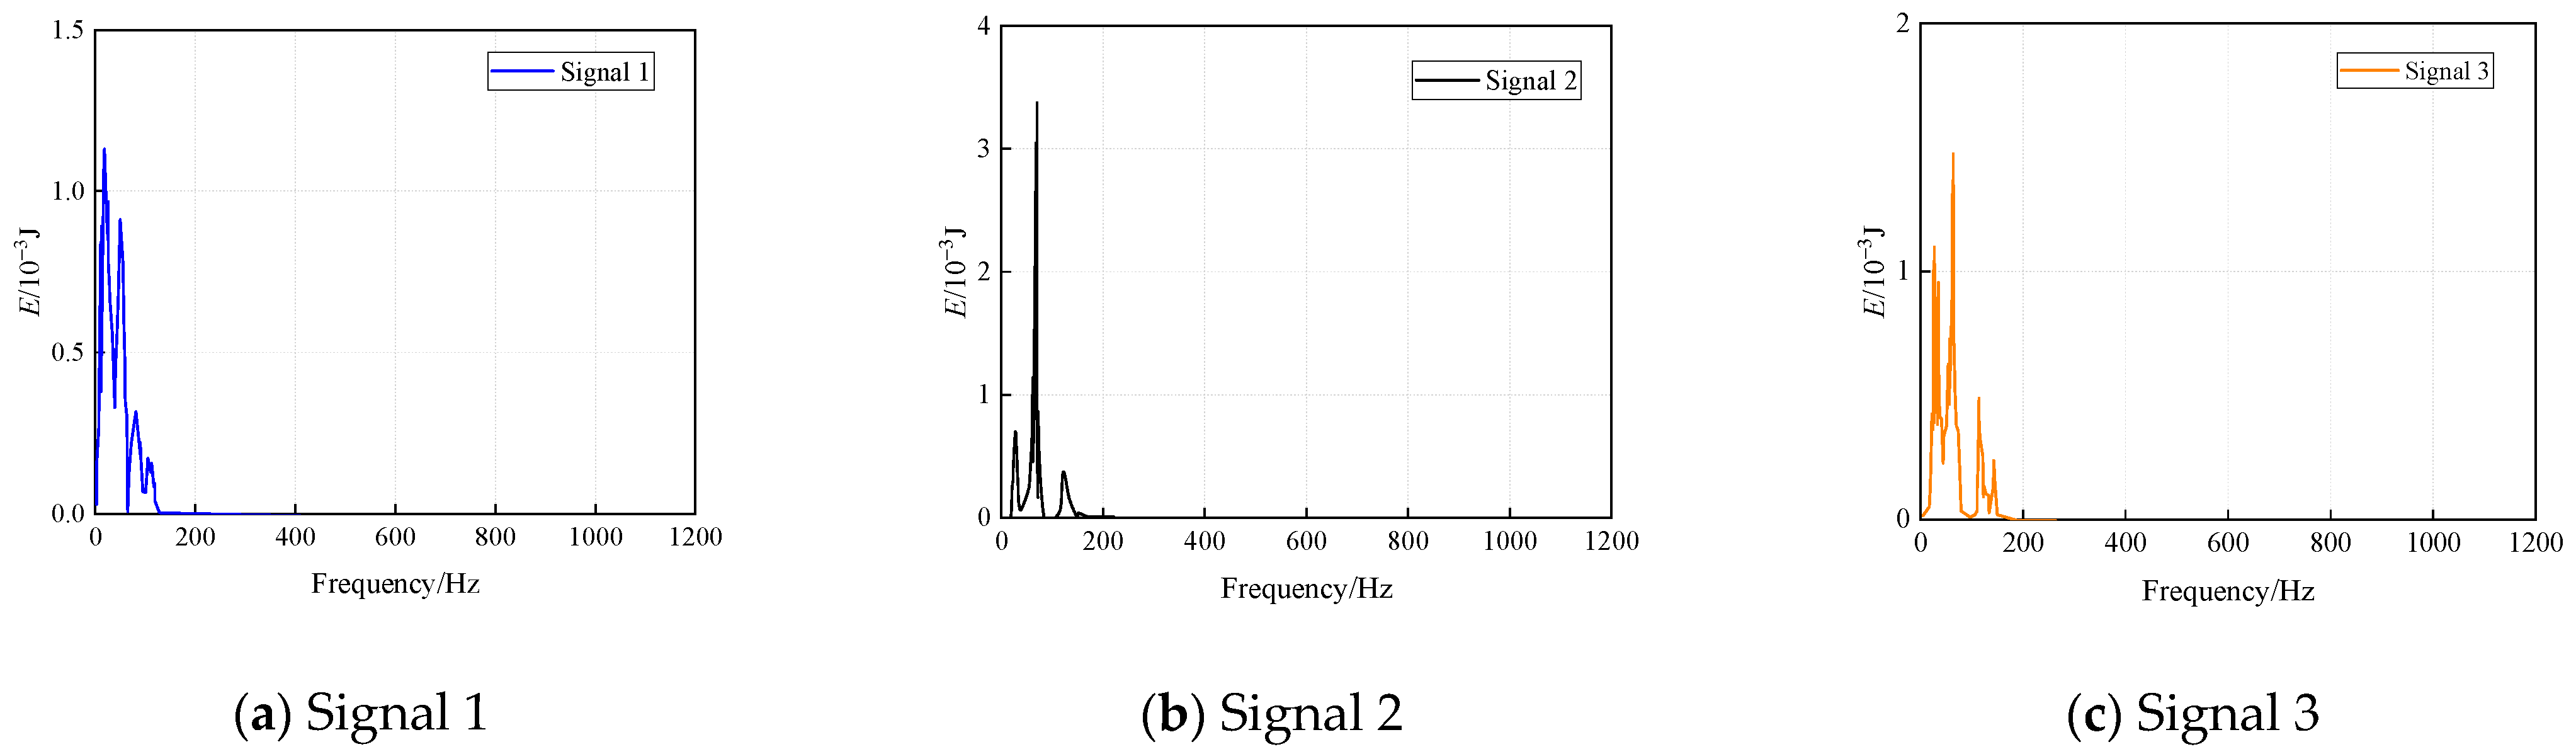
3.2. Spectrum Analysis Techniques for Blast-Induced Vibrations
4. Factors Influencing Blast-Induced Vibration Frequency
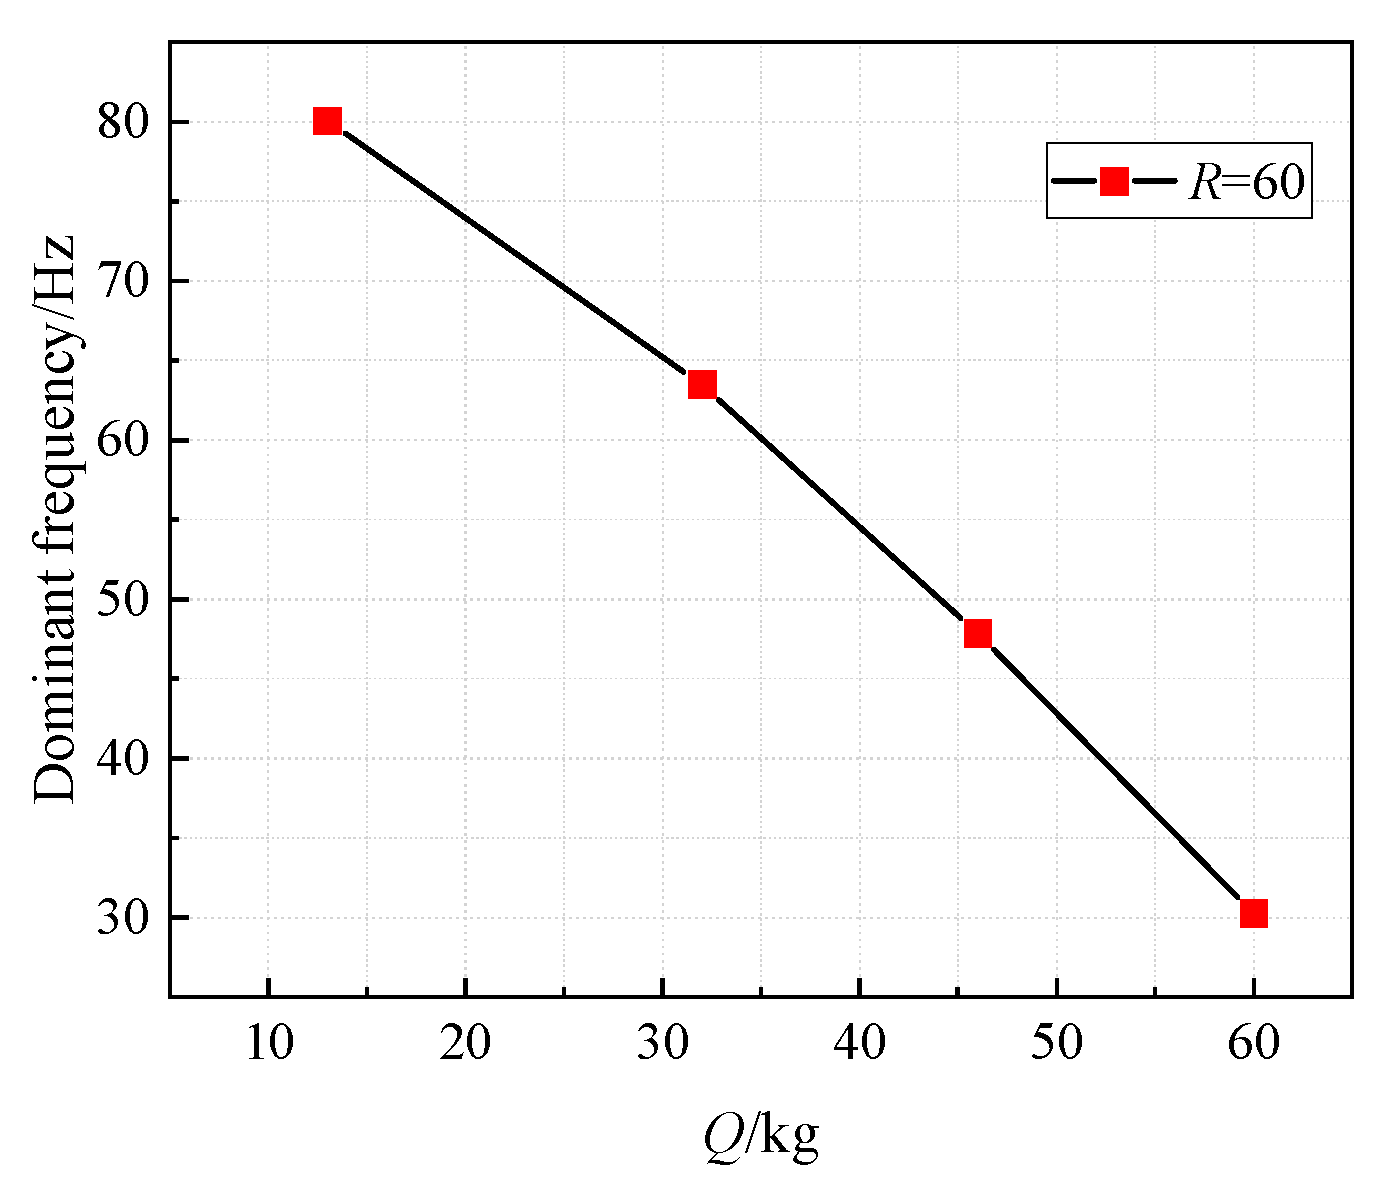
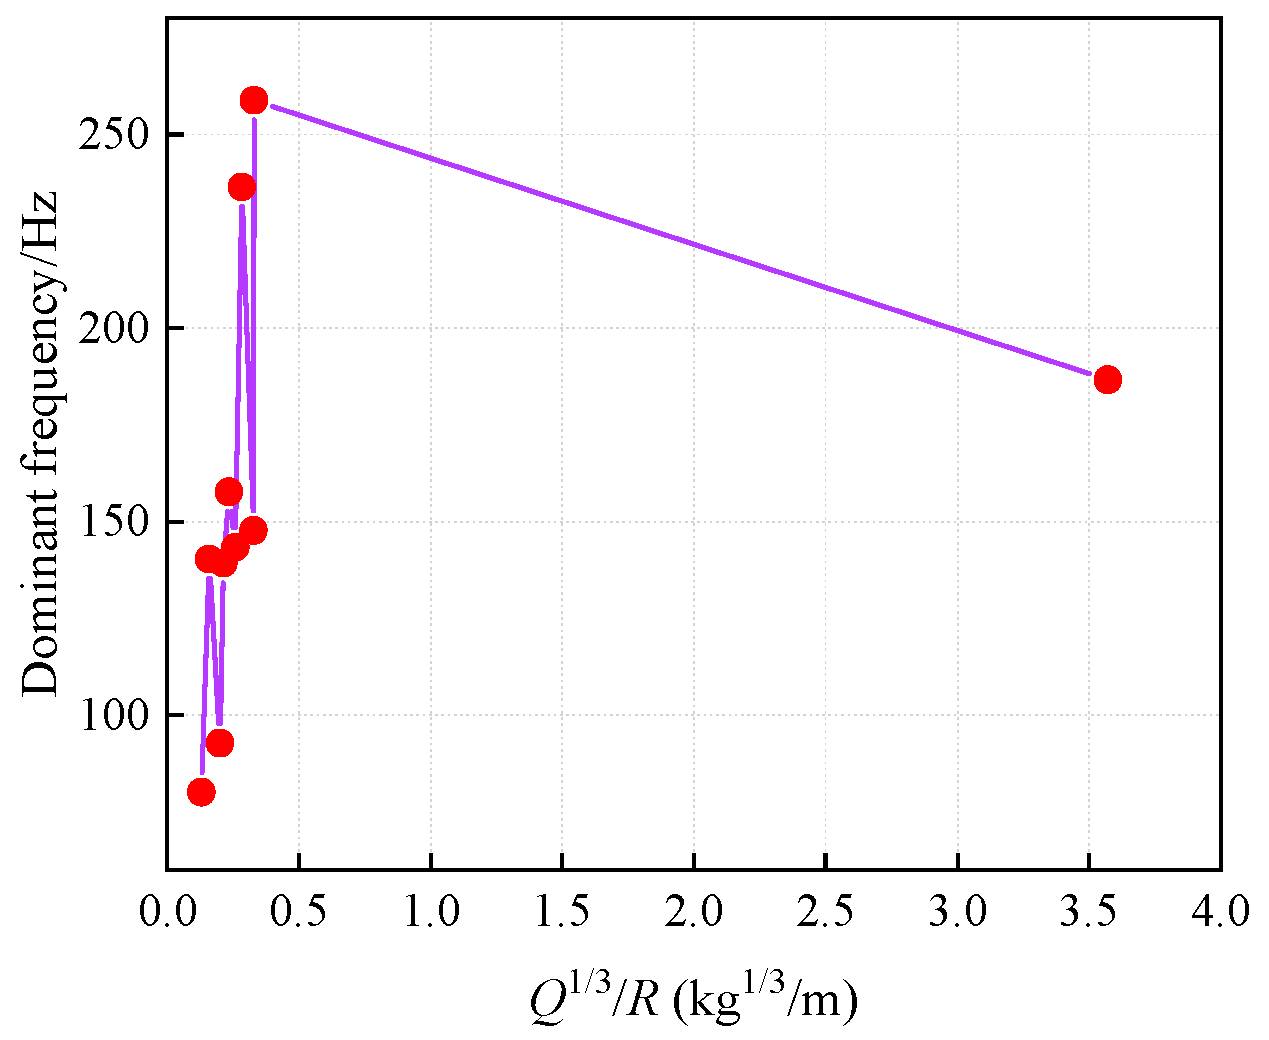
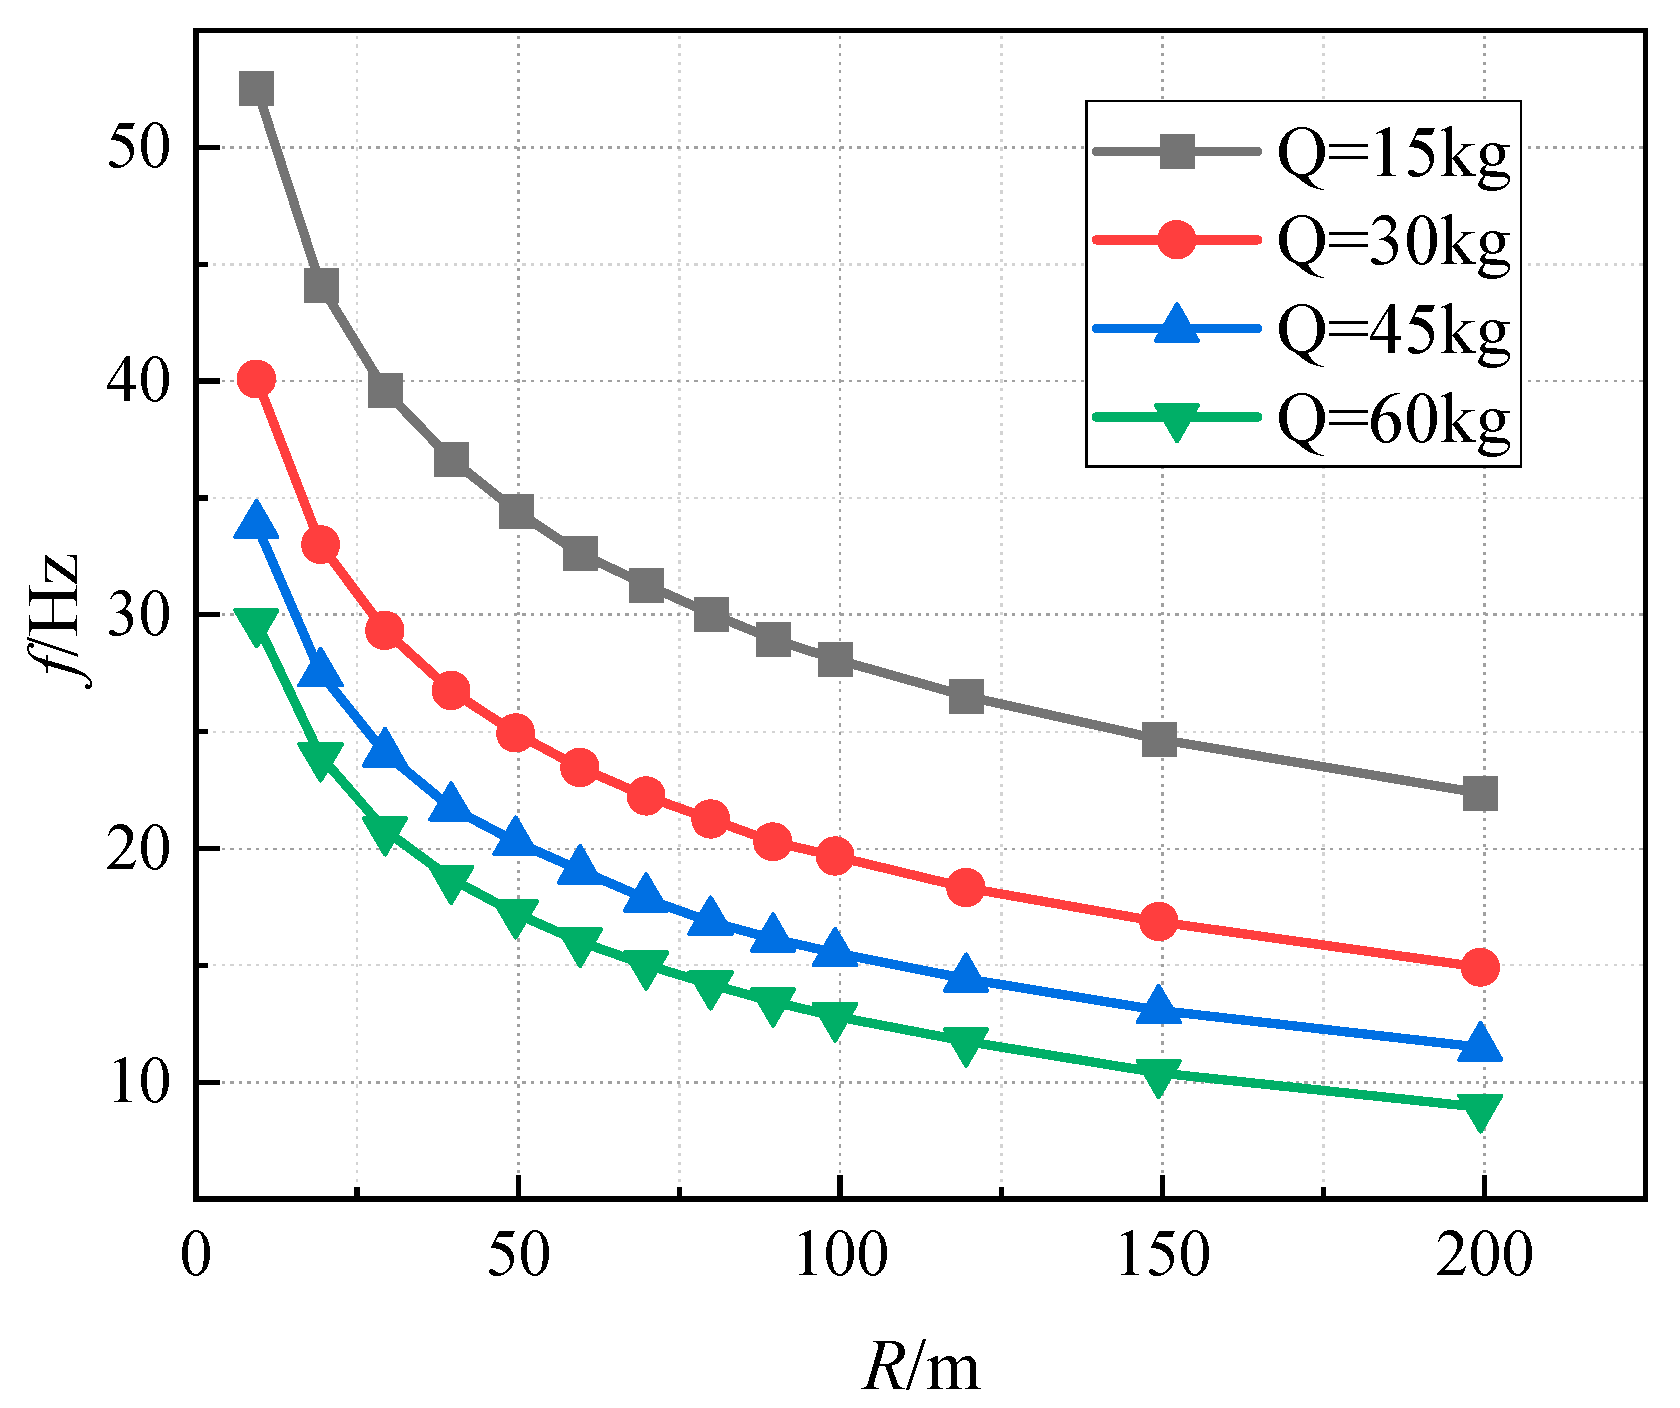
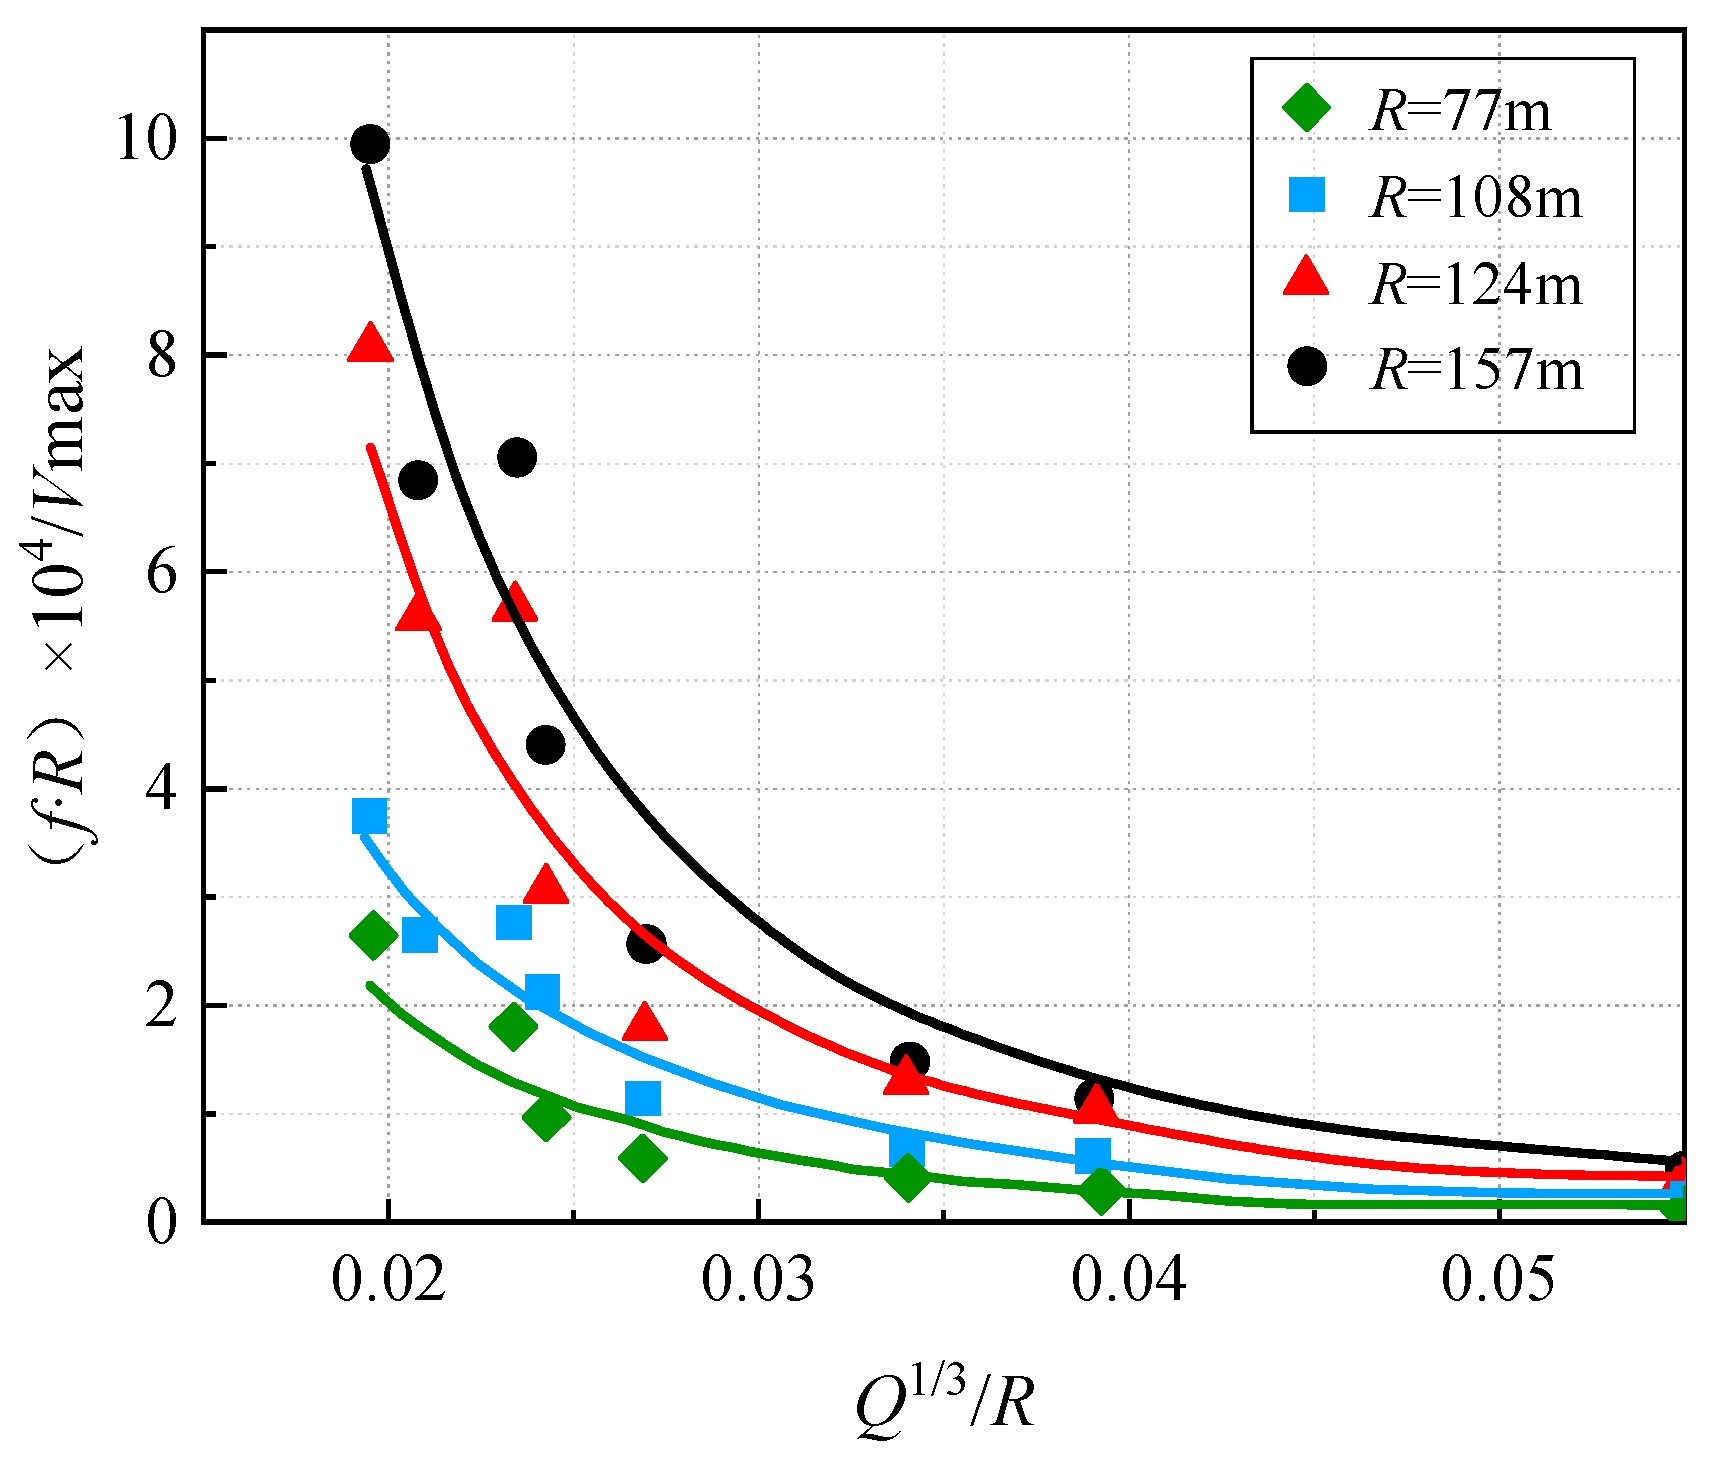
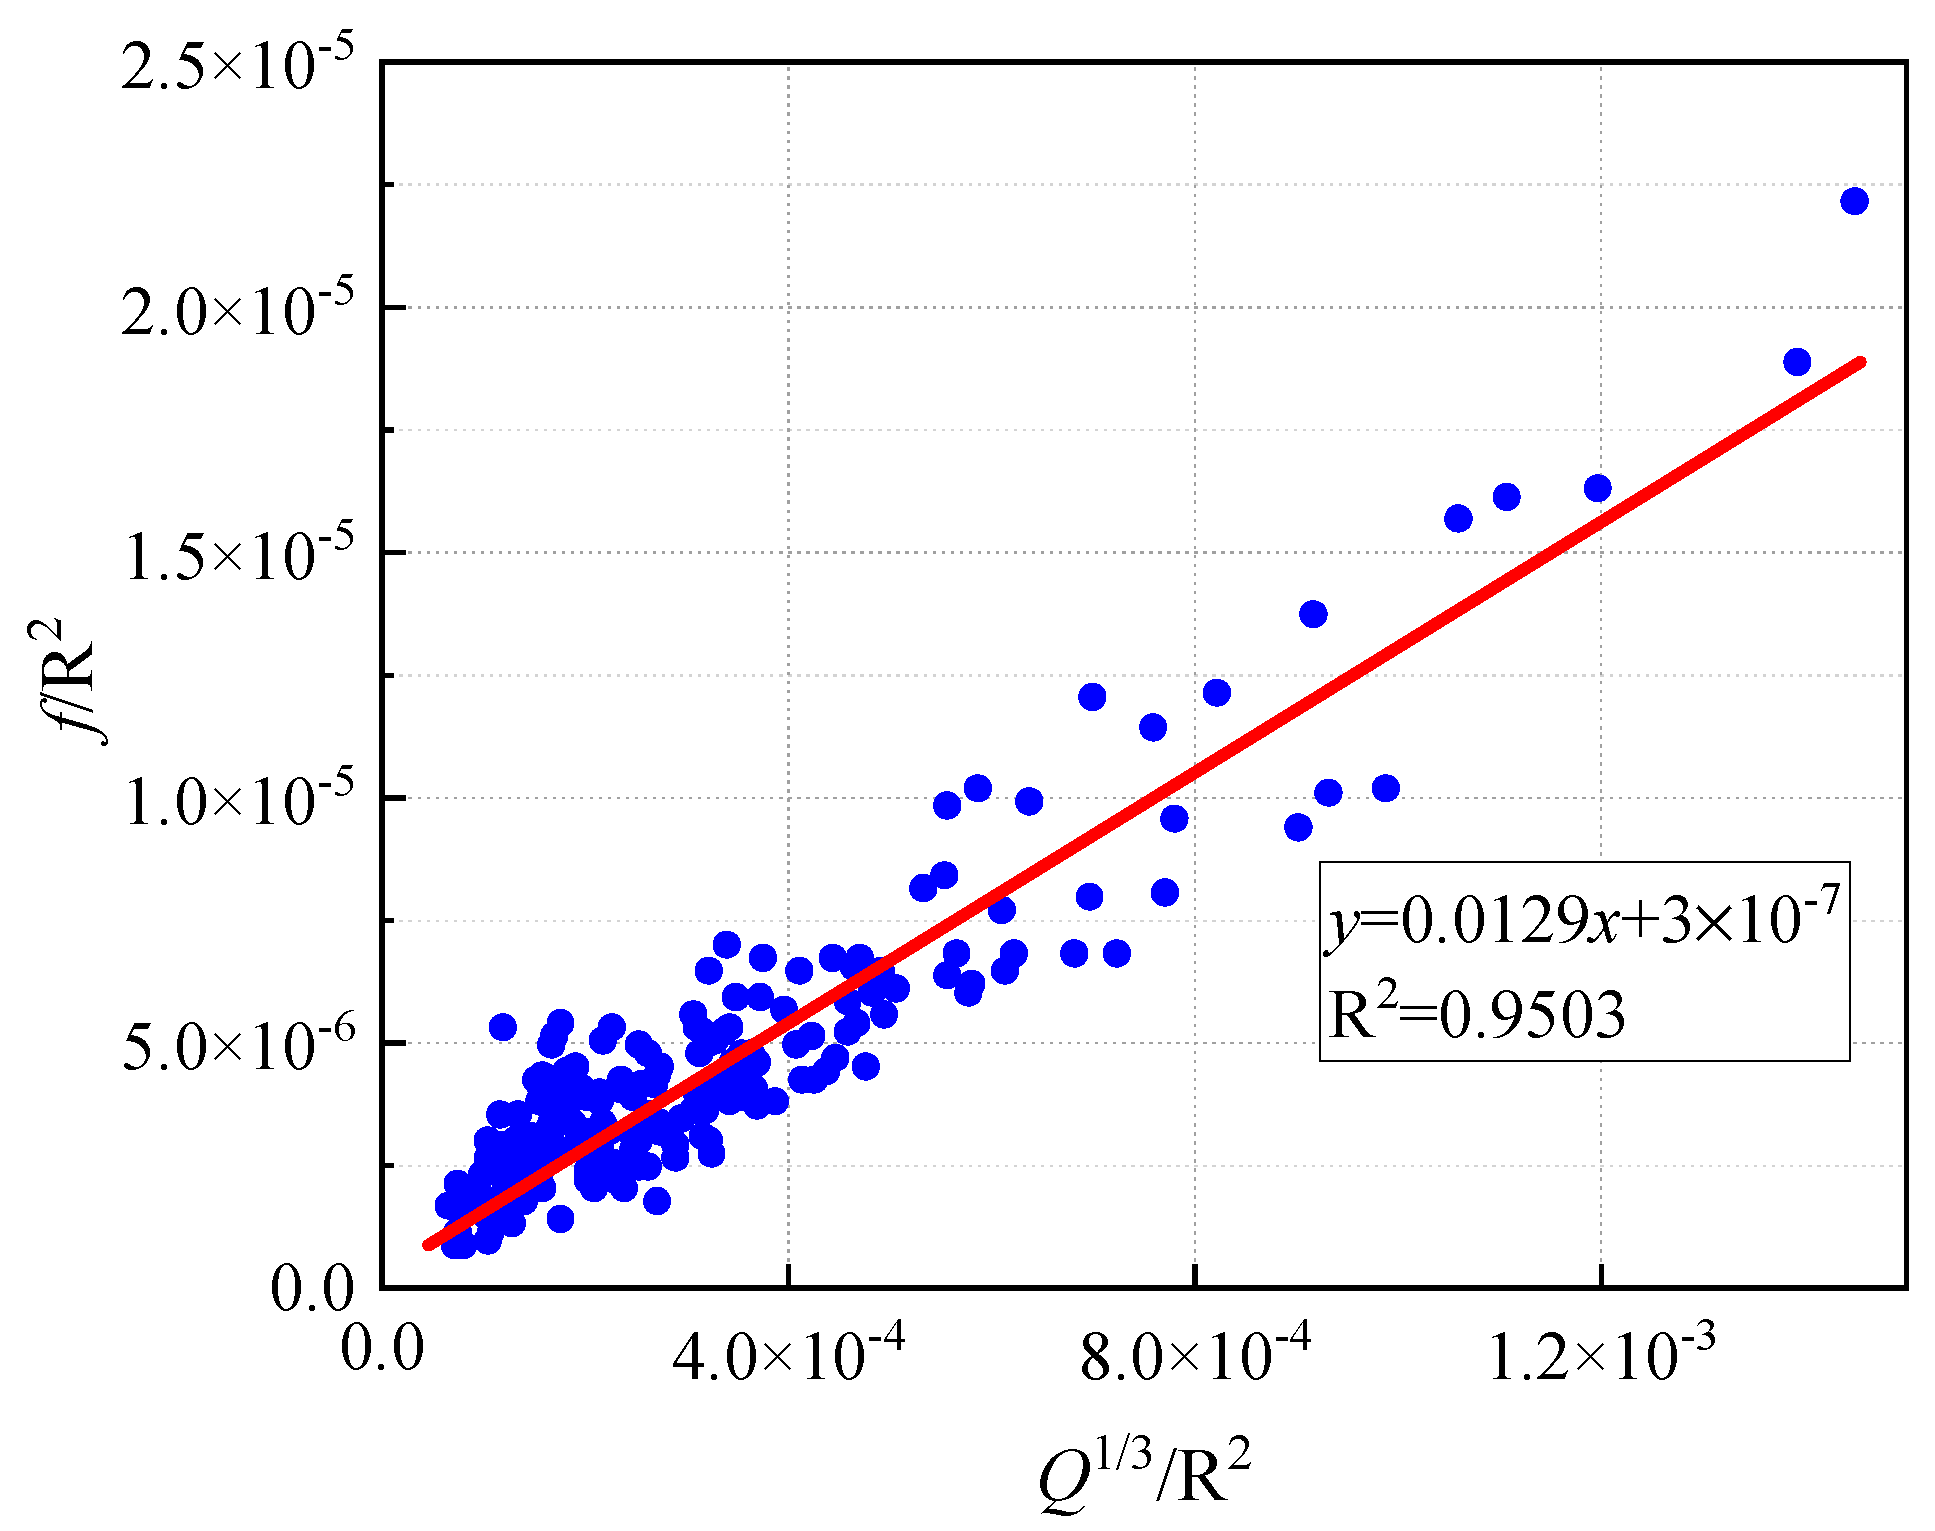
4.1. Charge Weight
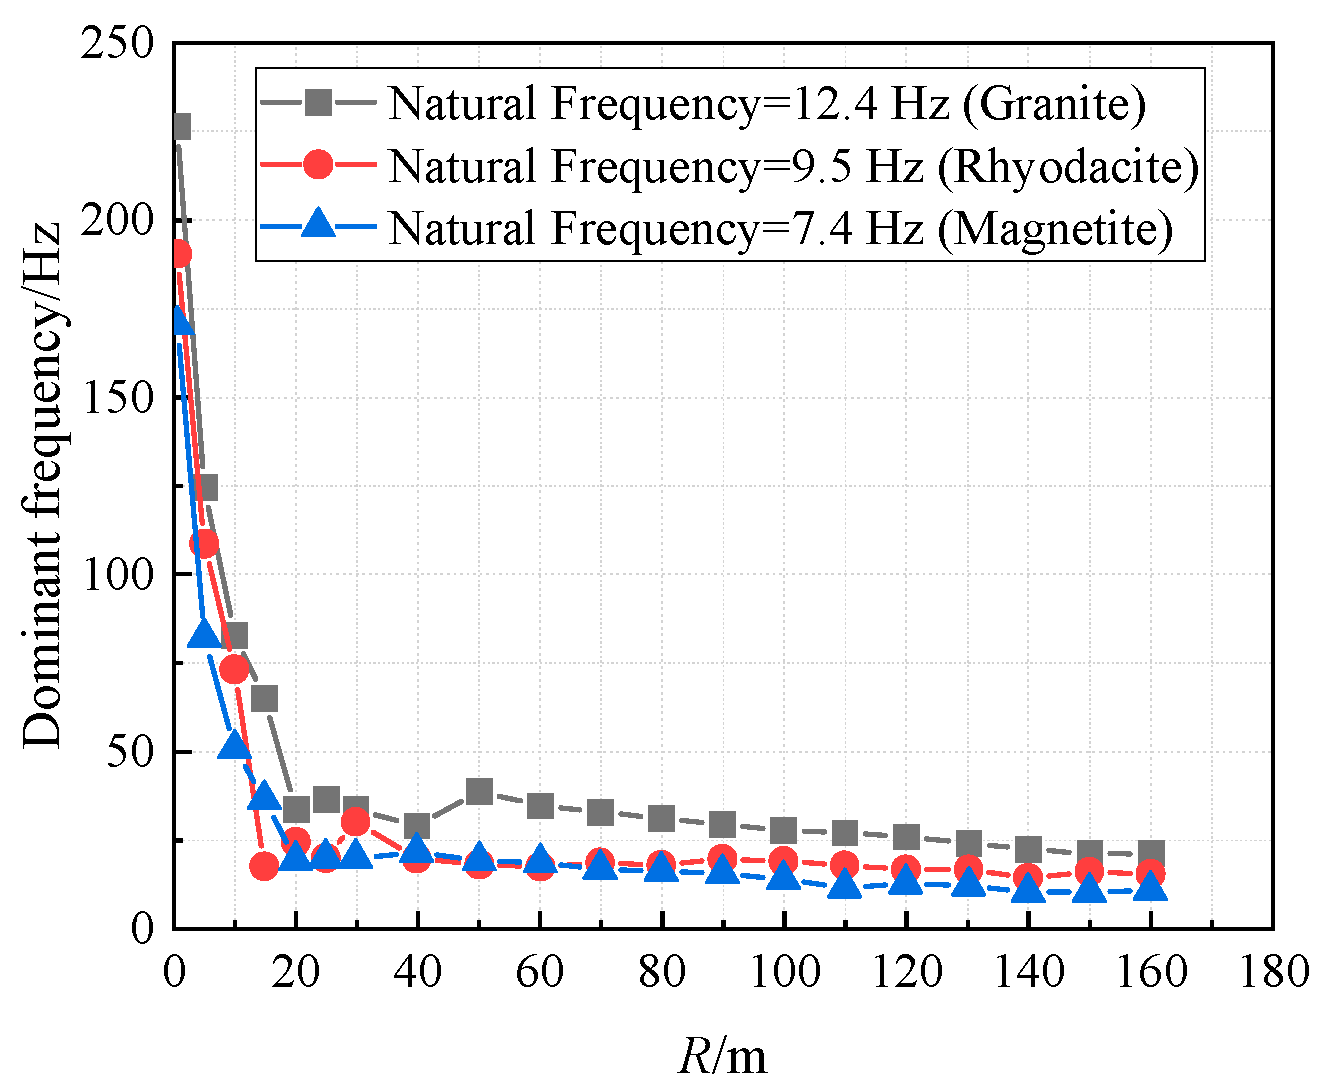
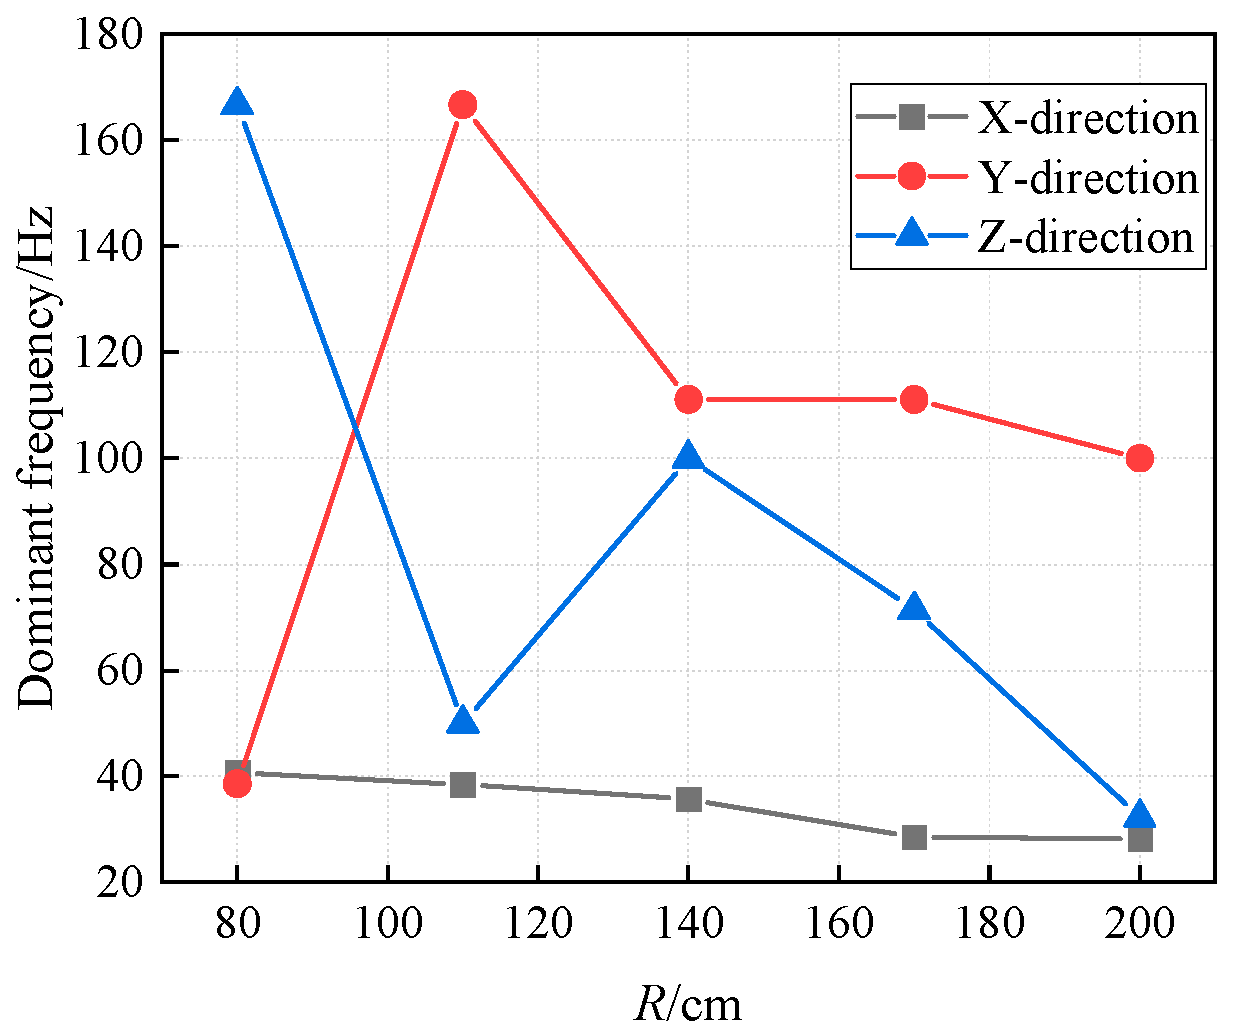
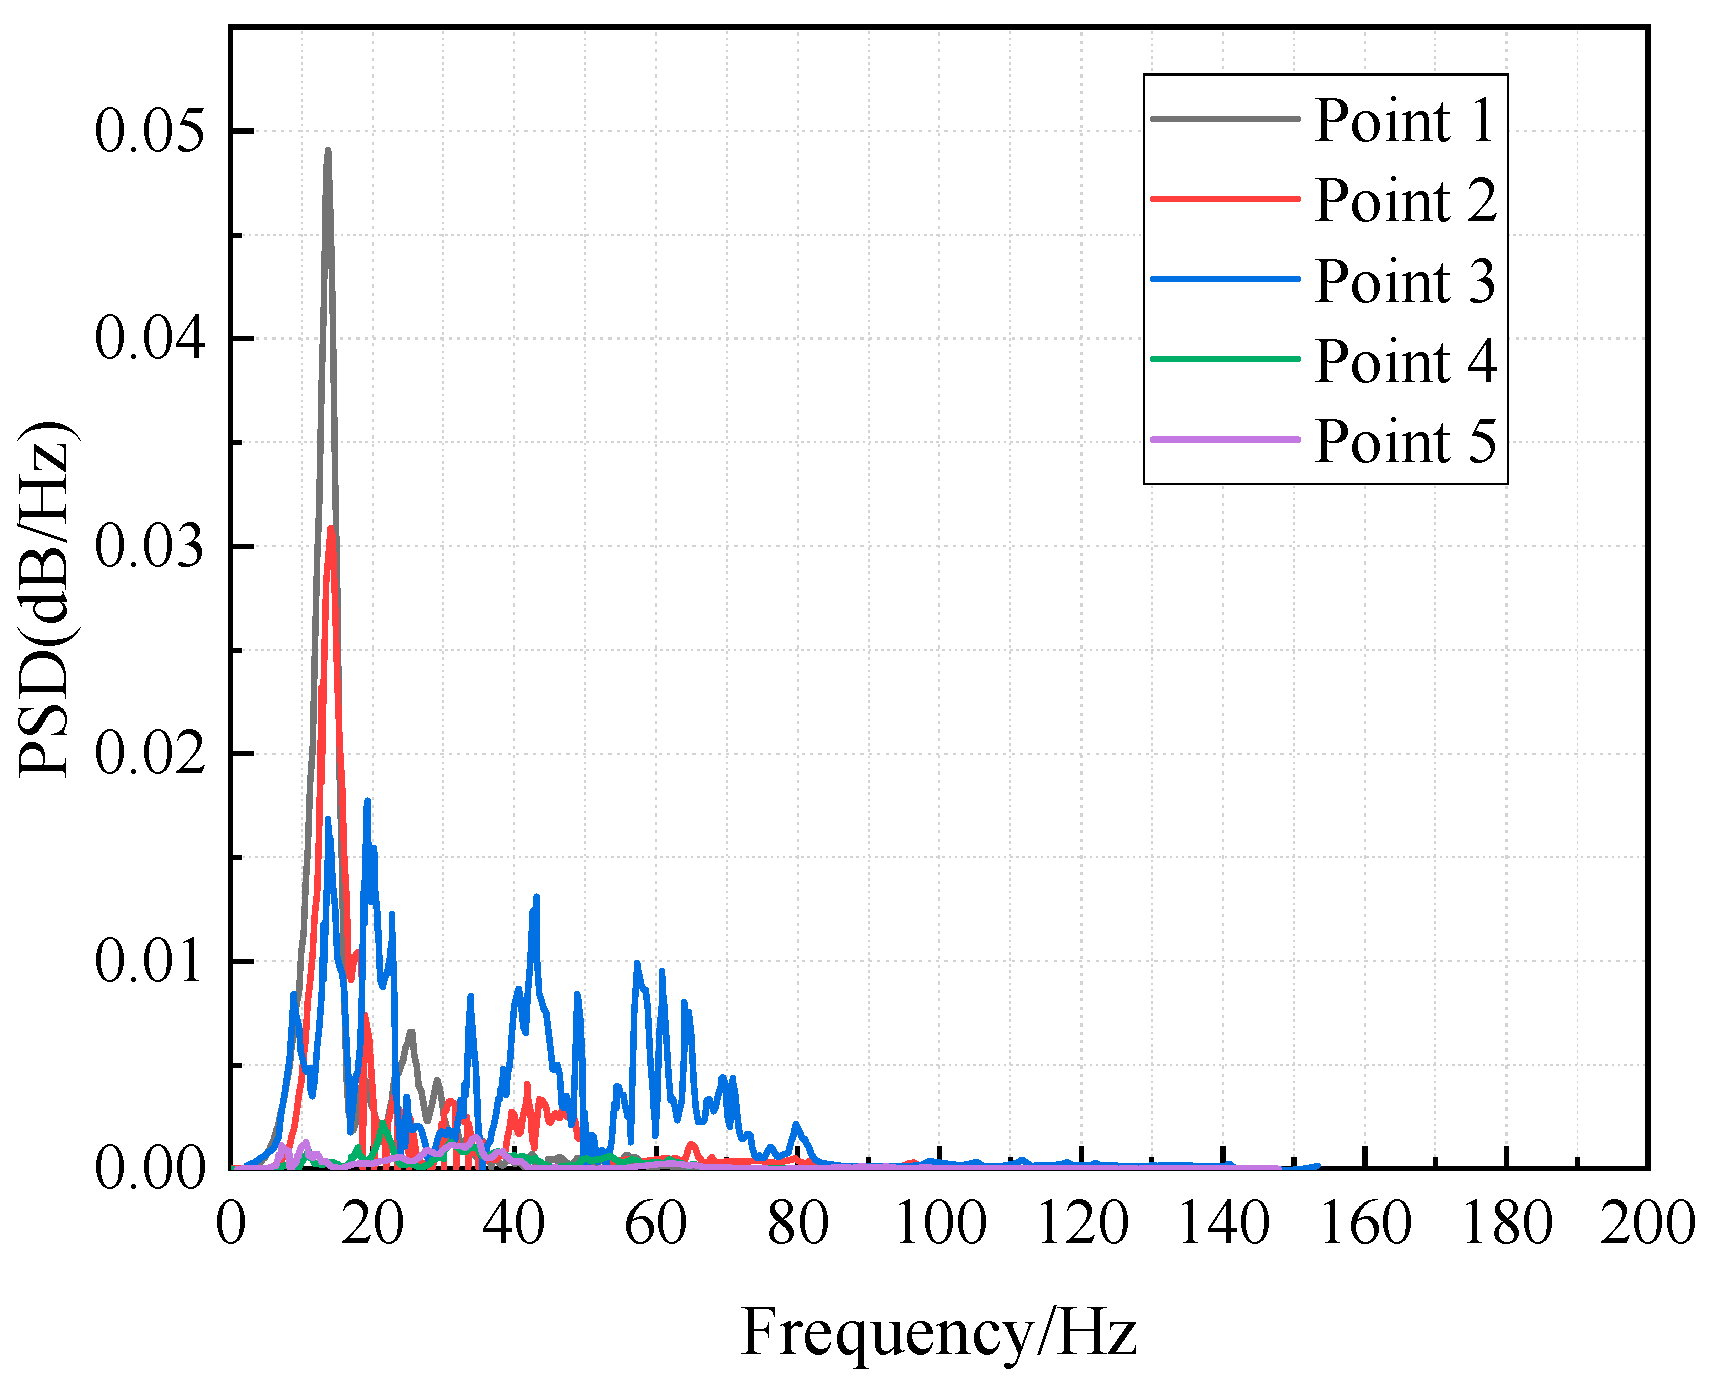
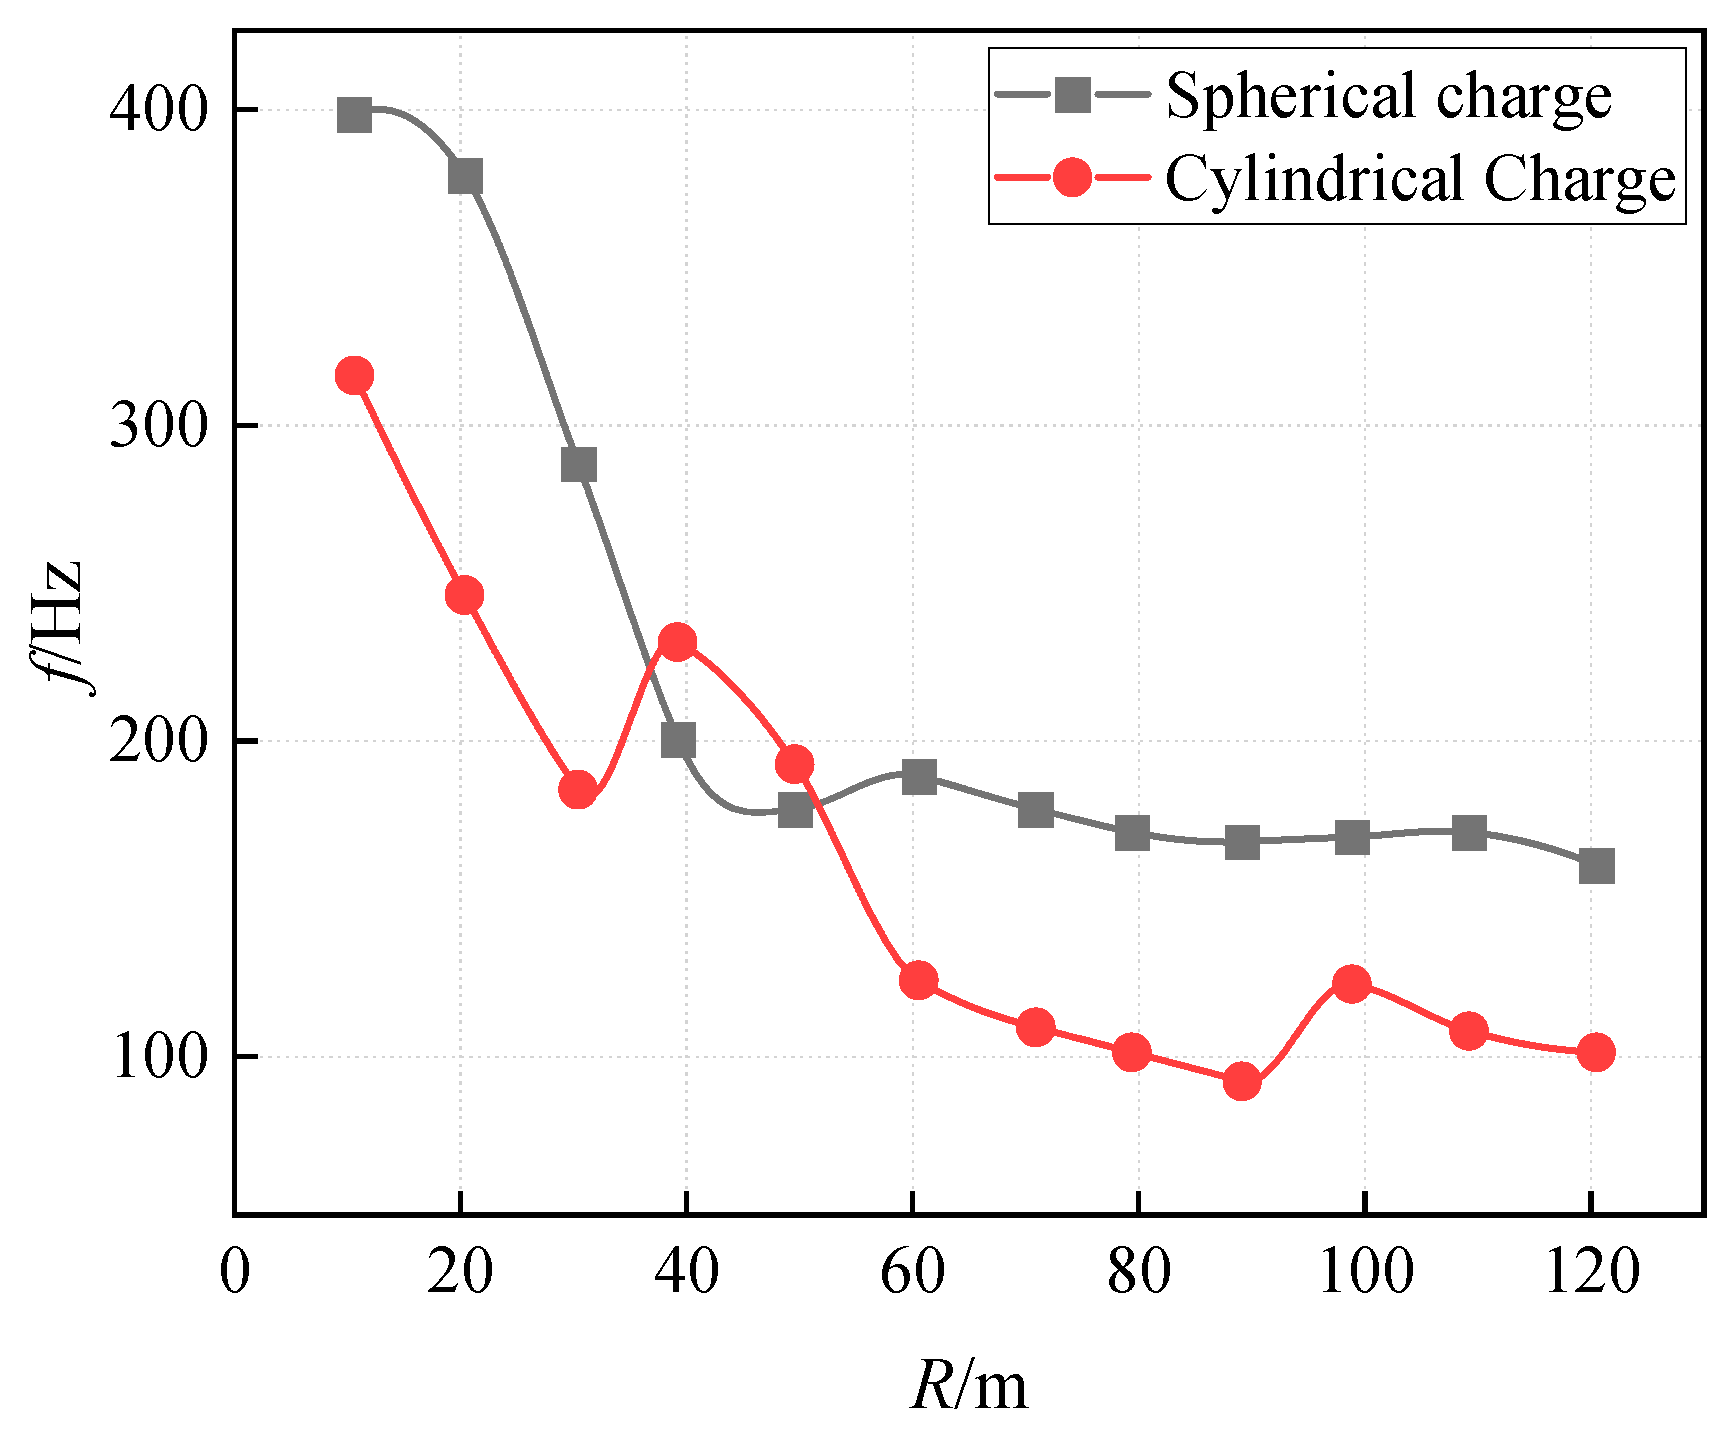
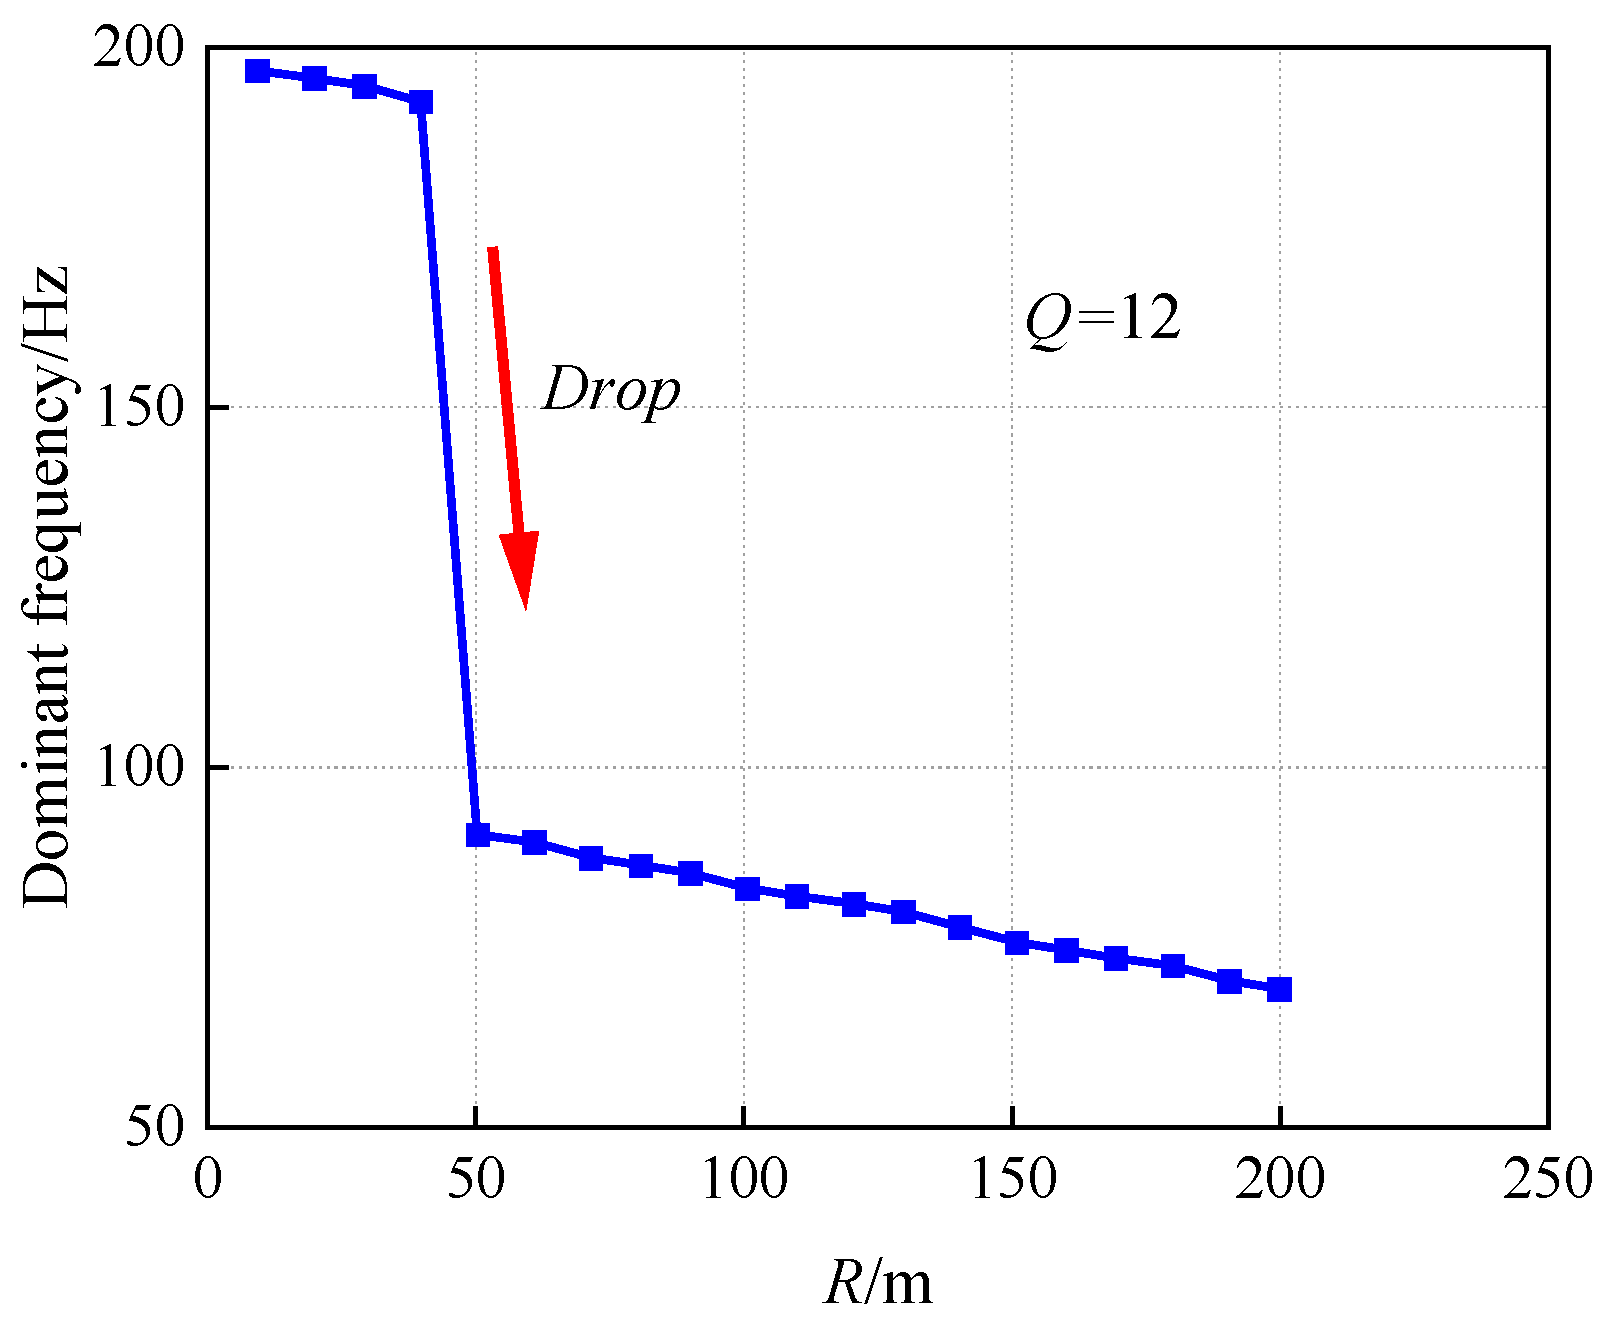
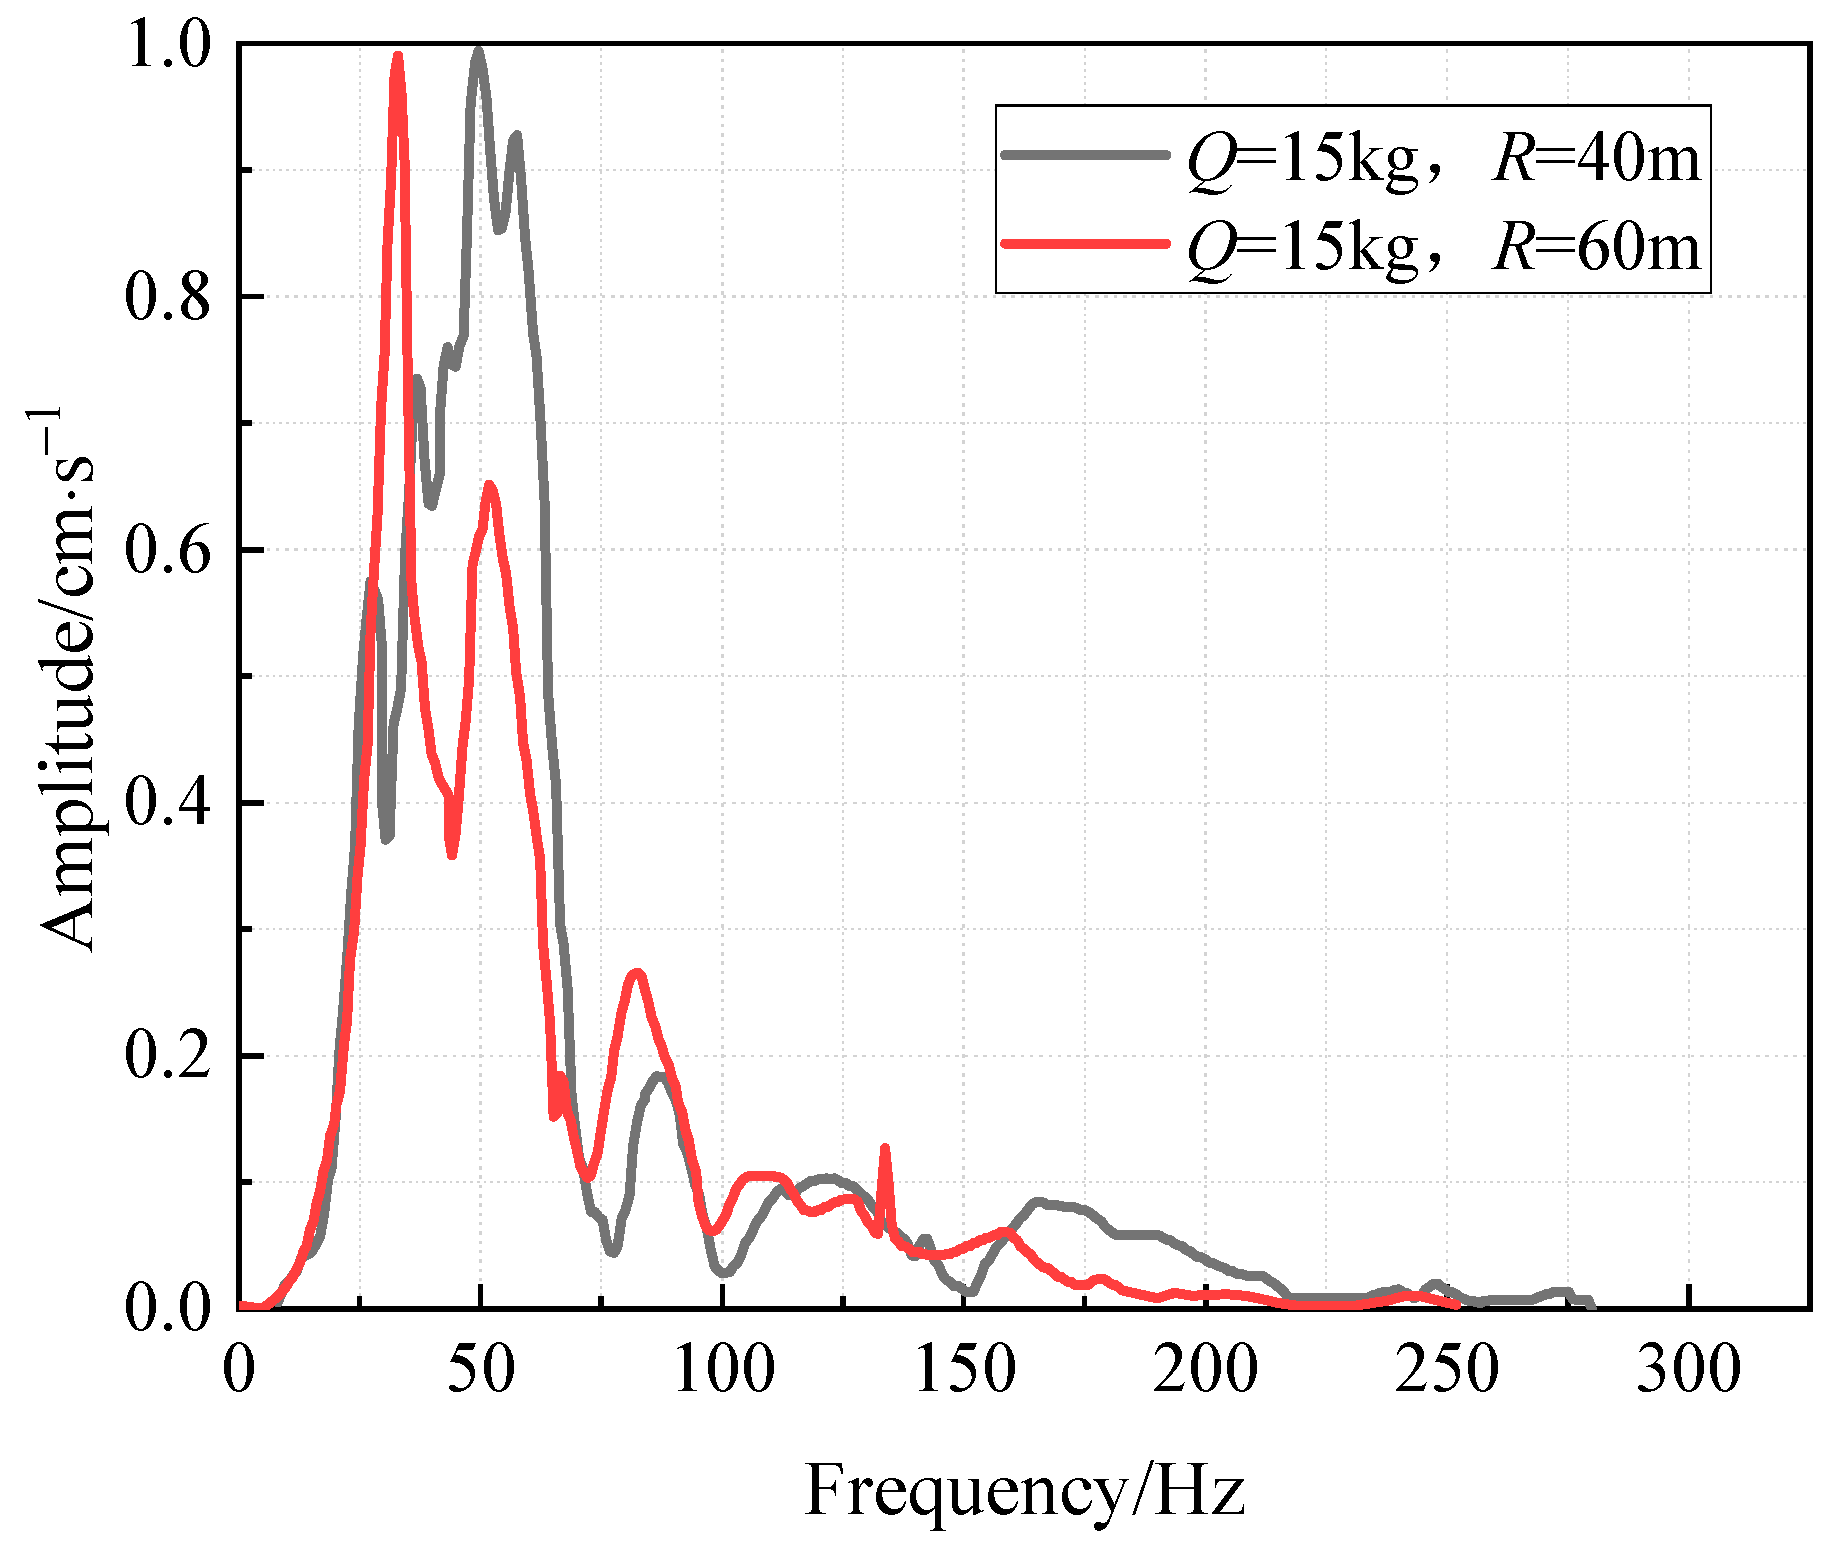
4.2. The Distance from the Explosion Source to the Monitored Location (R)
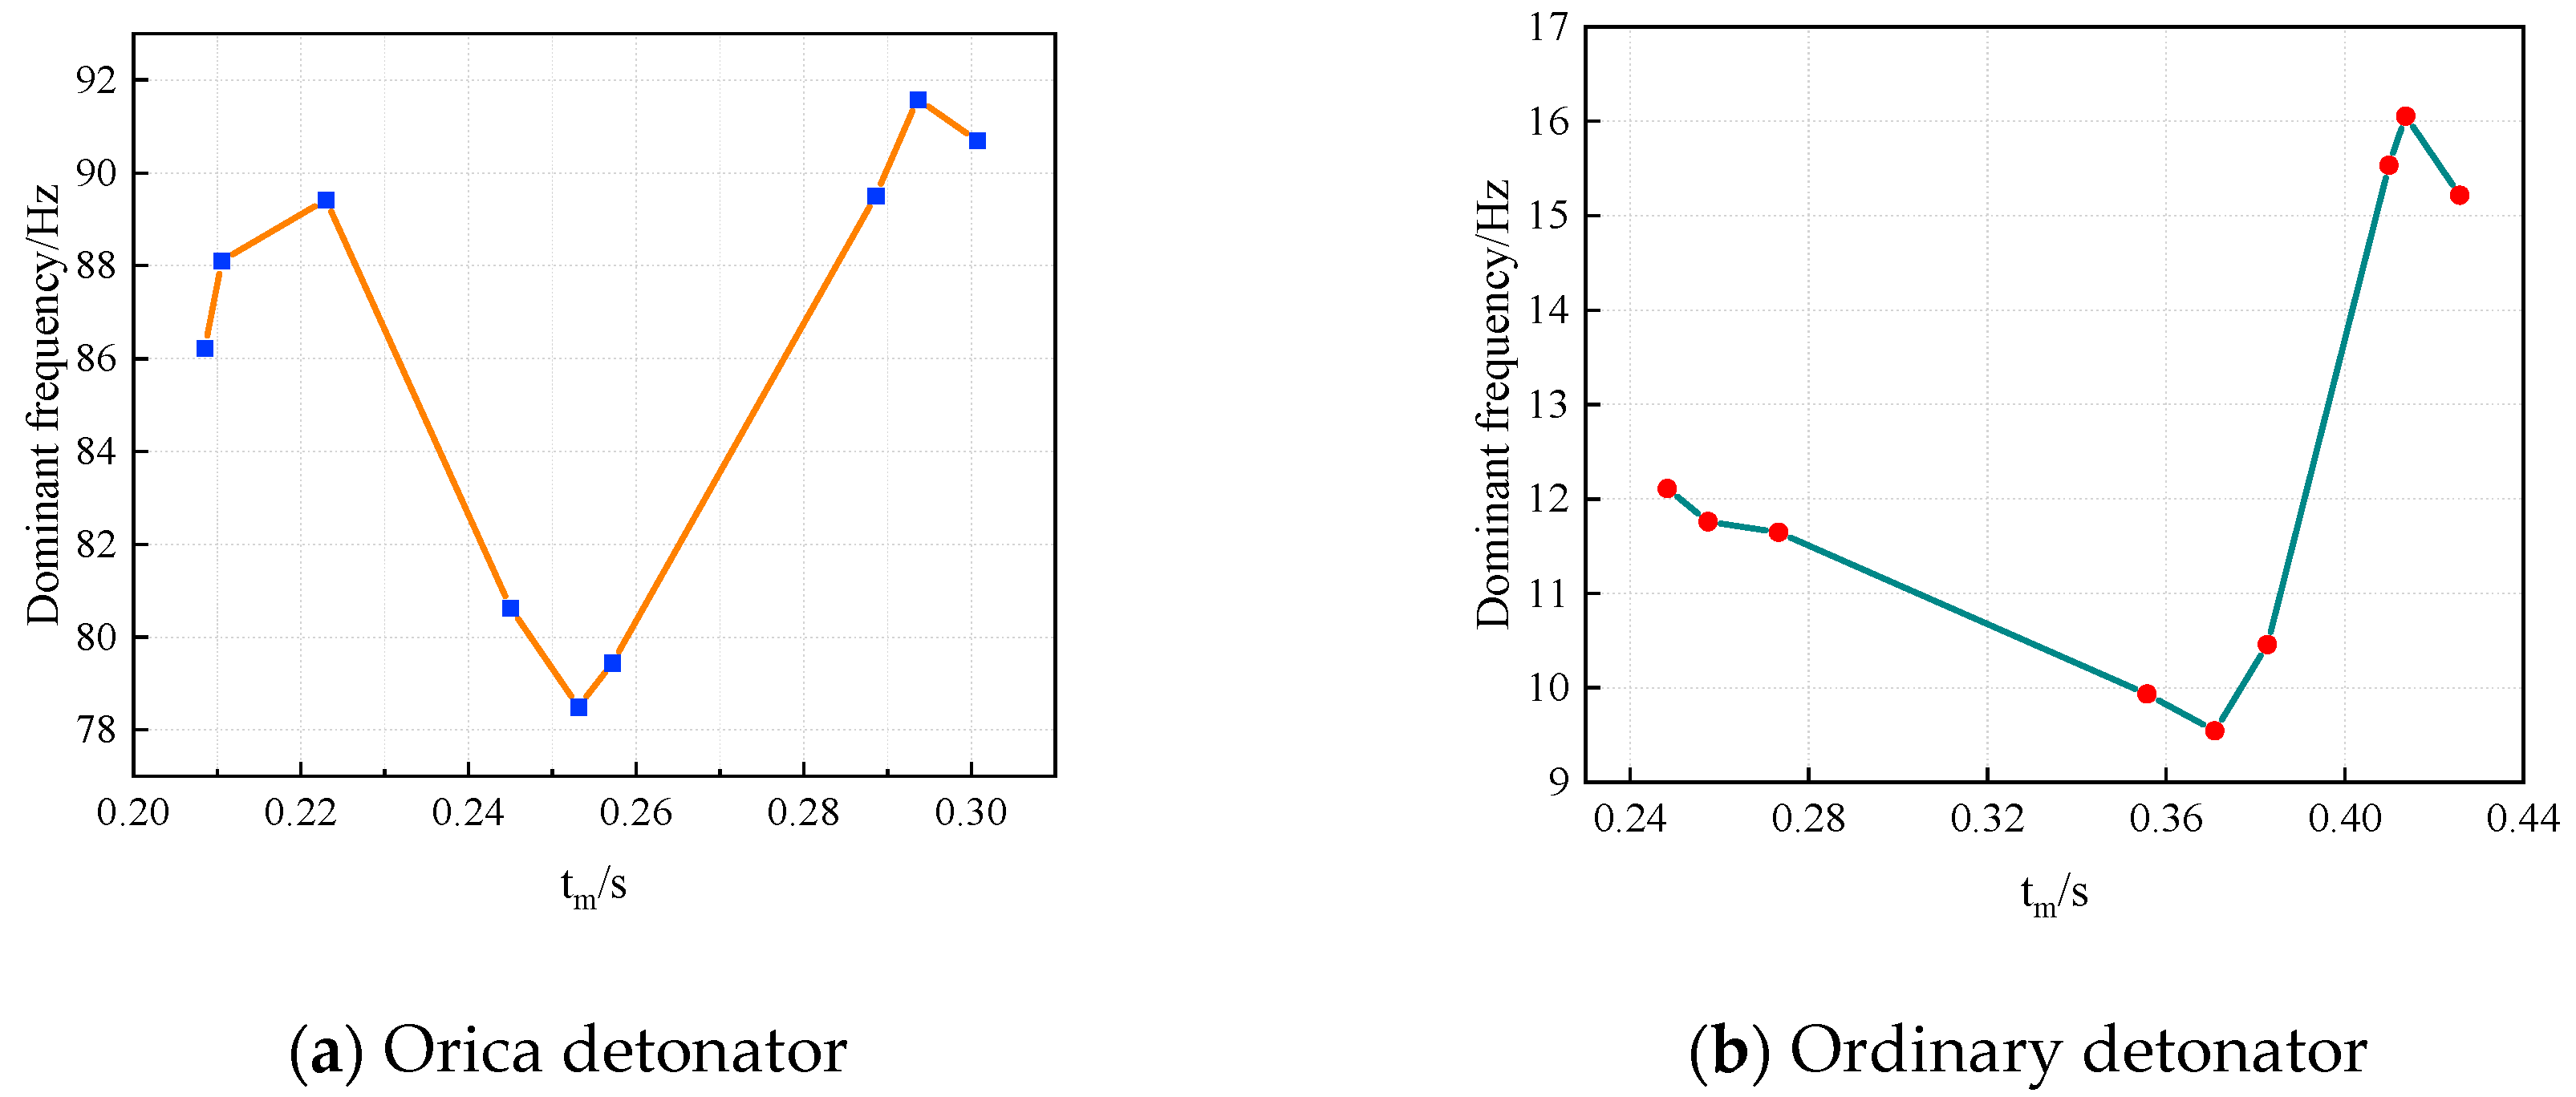
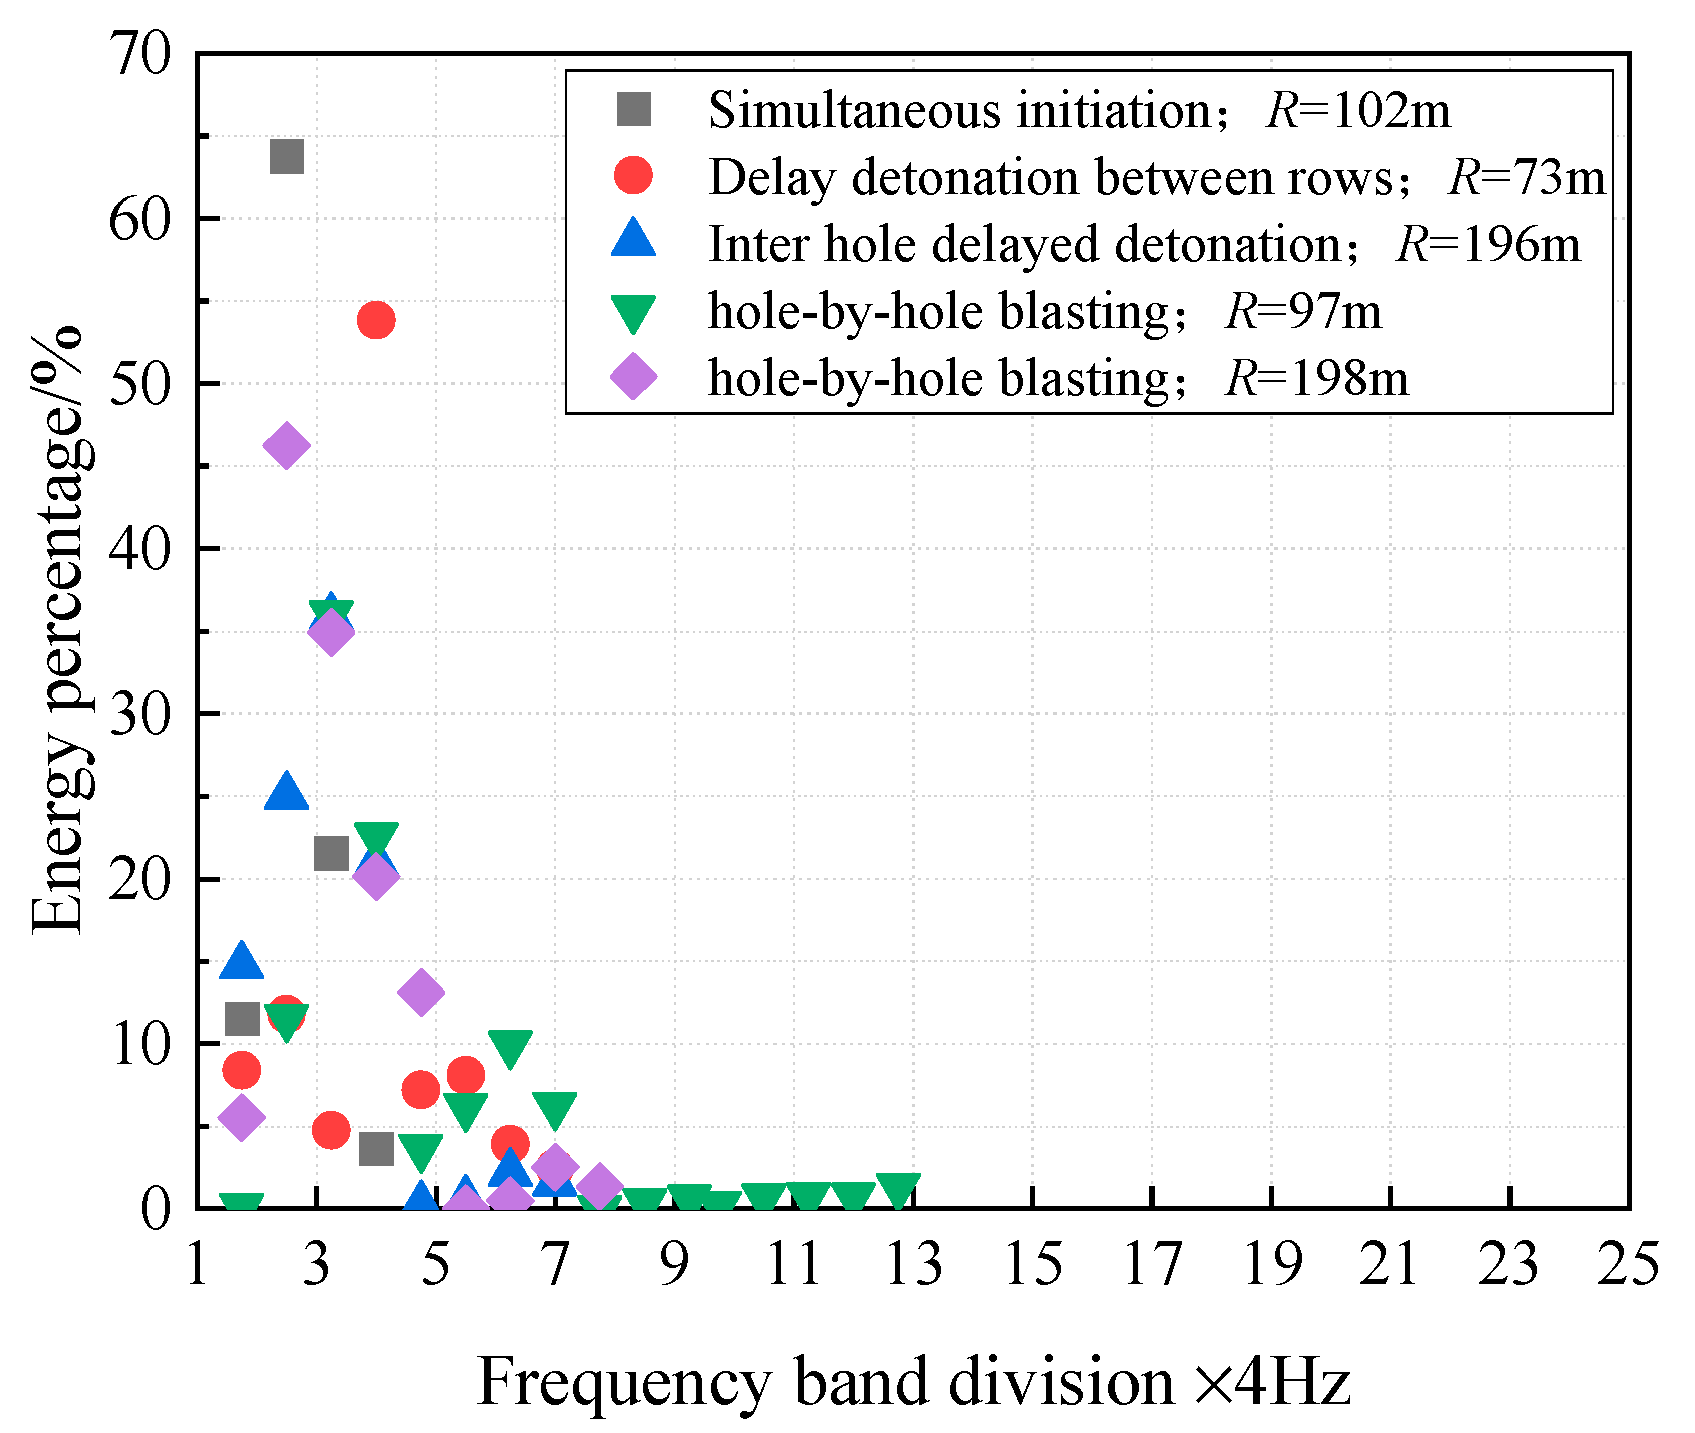
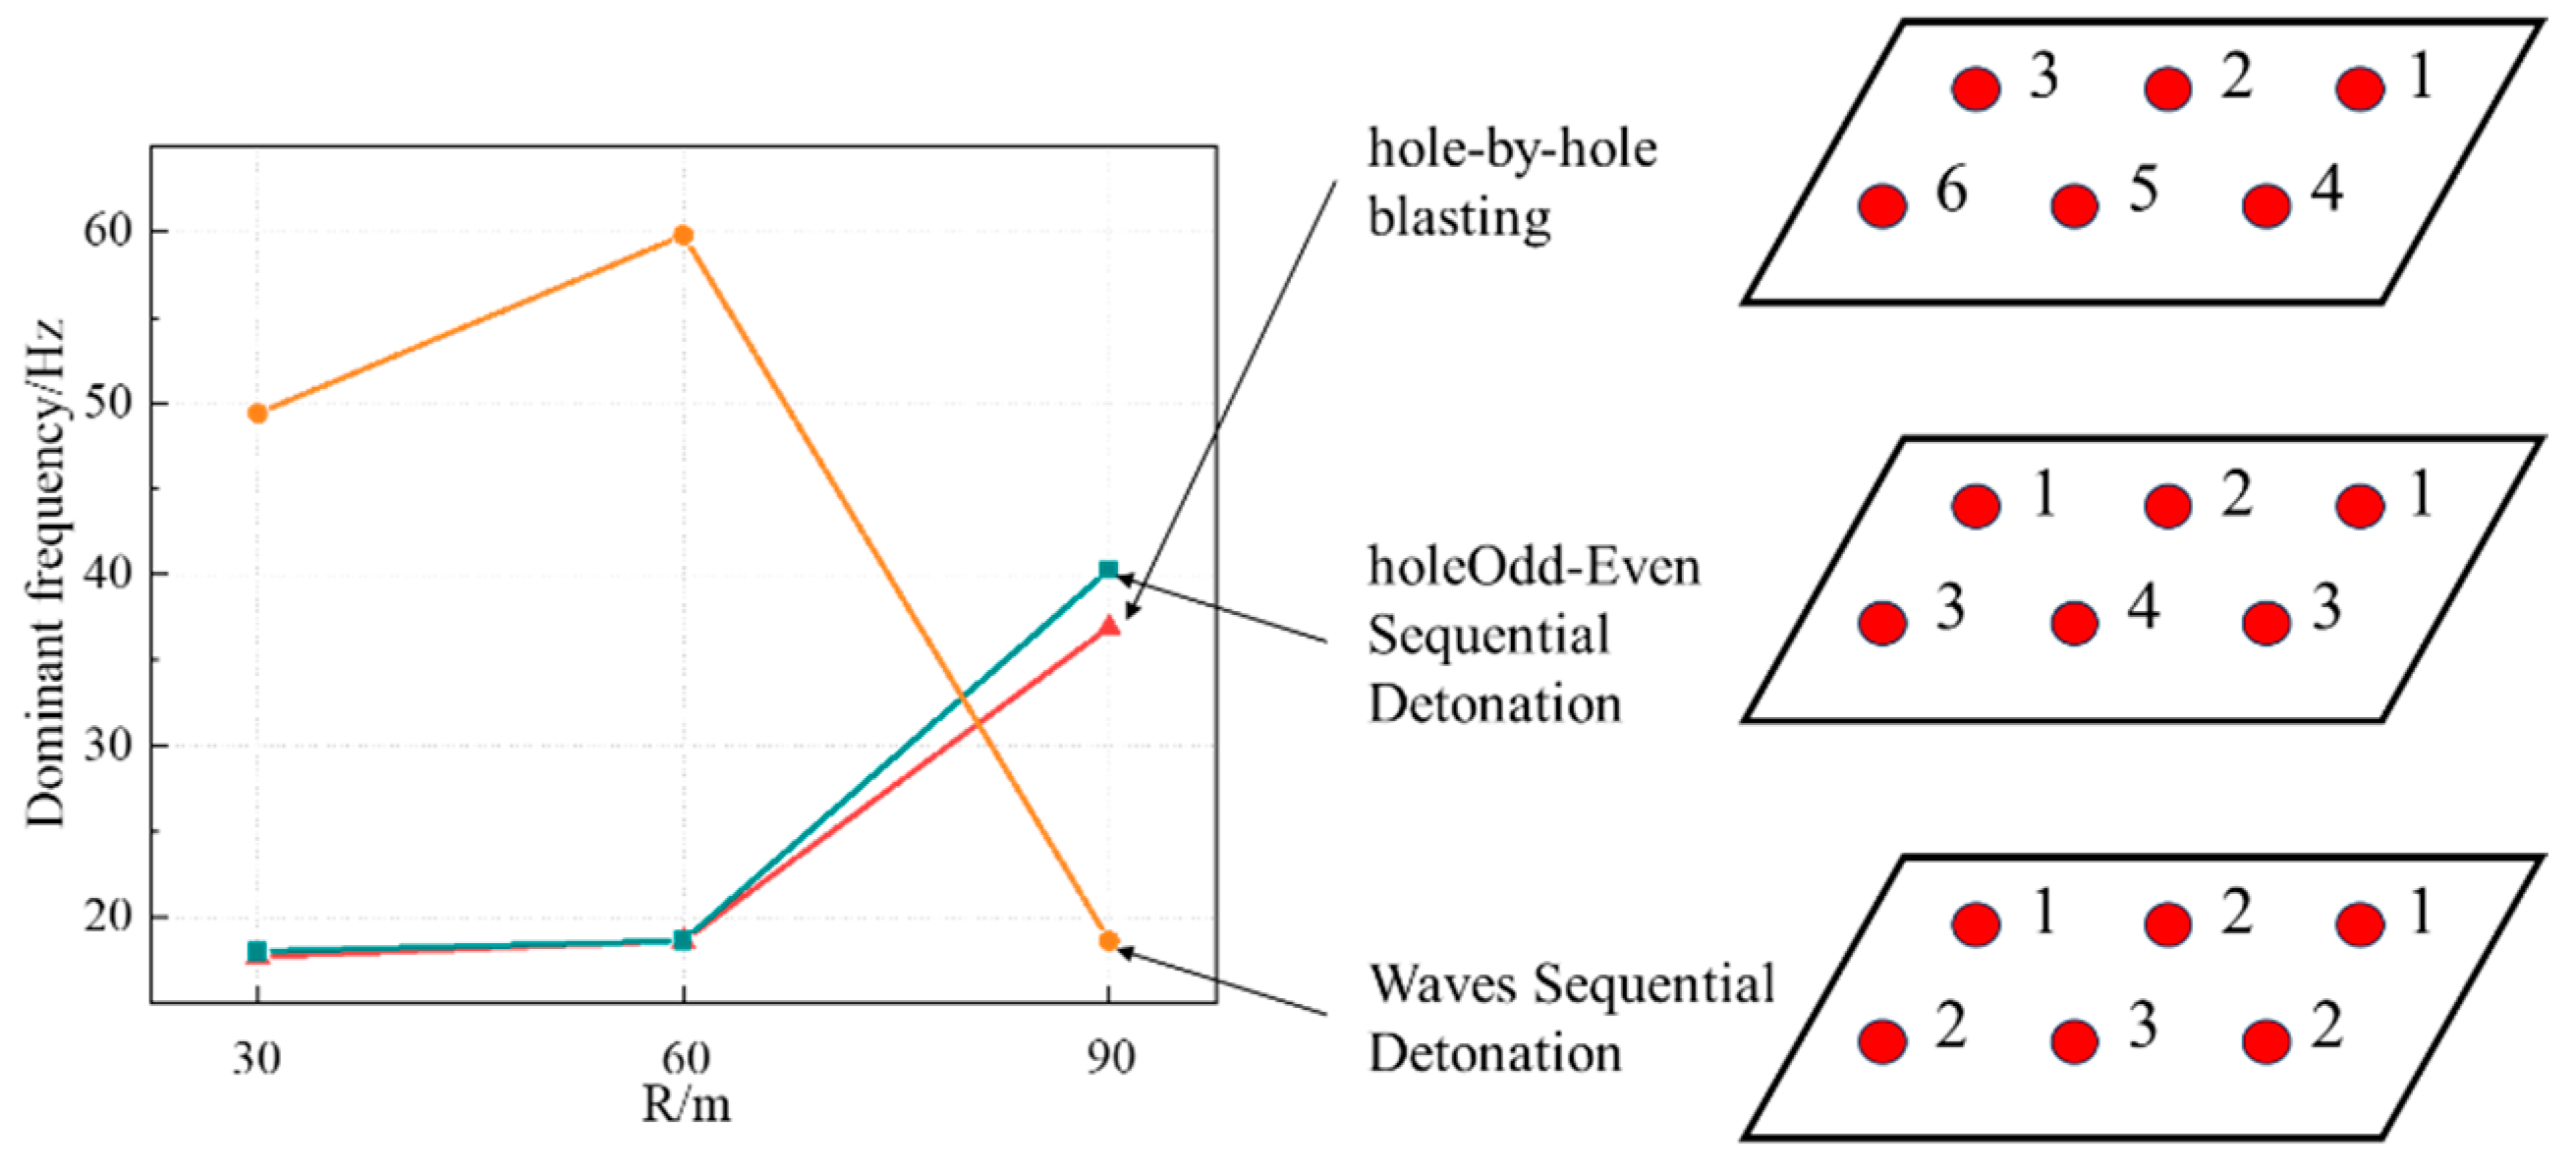
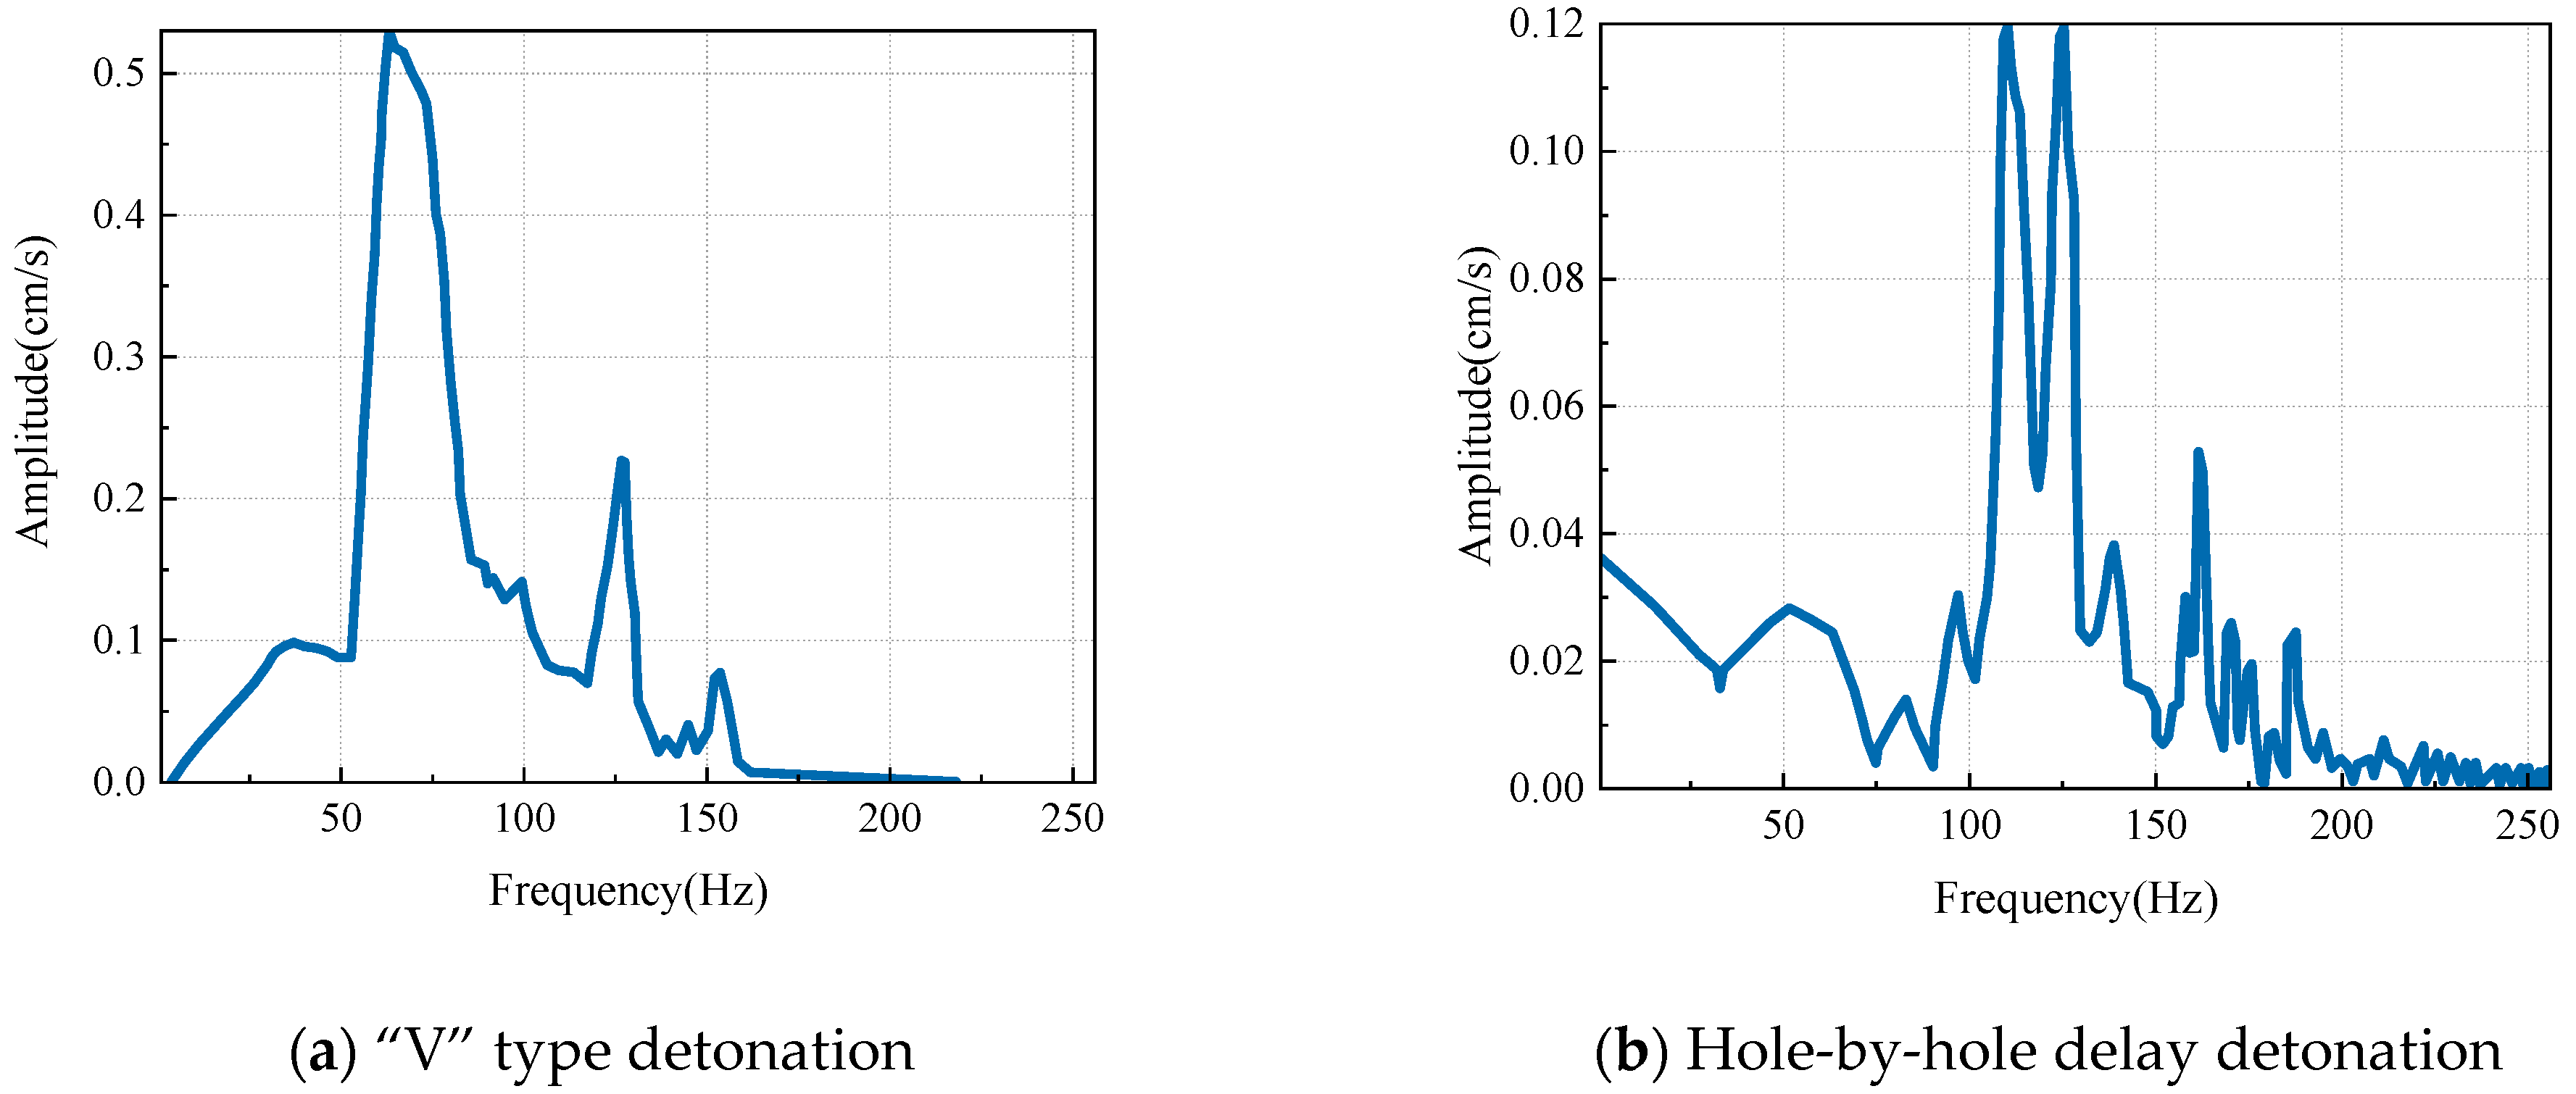
4.3. Detonation Method
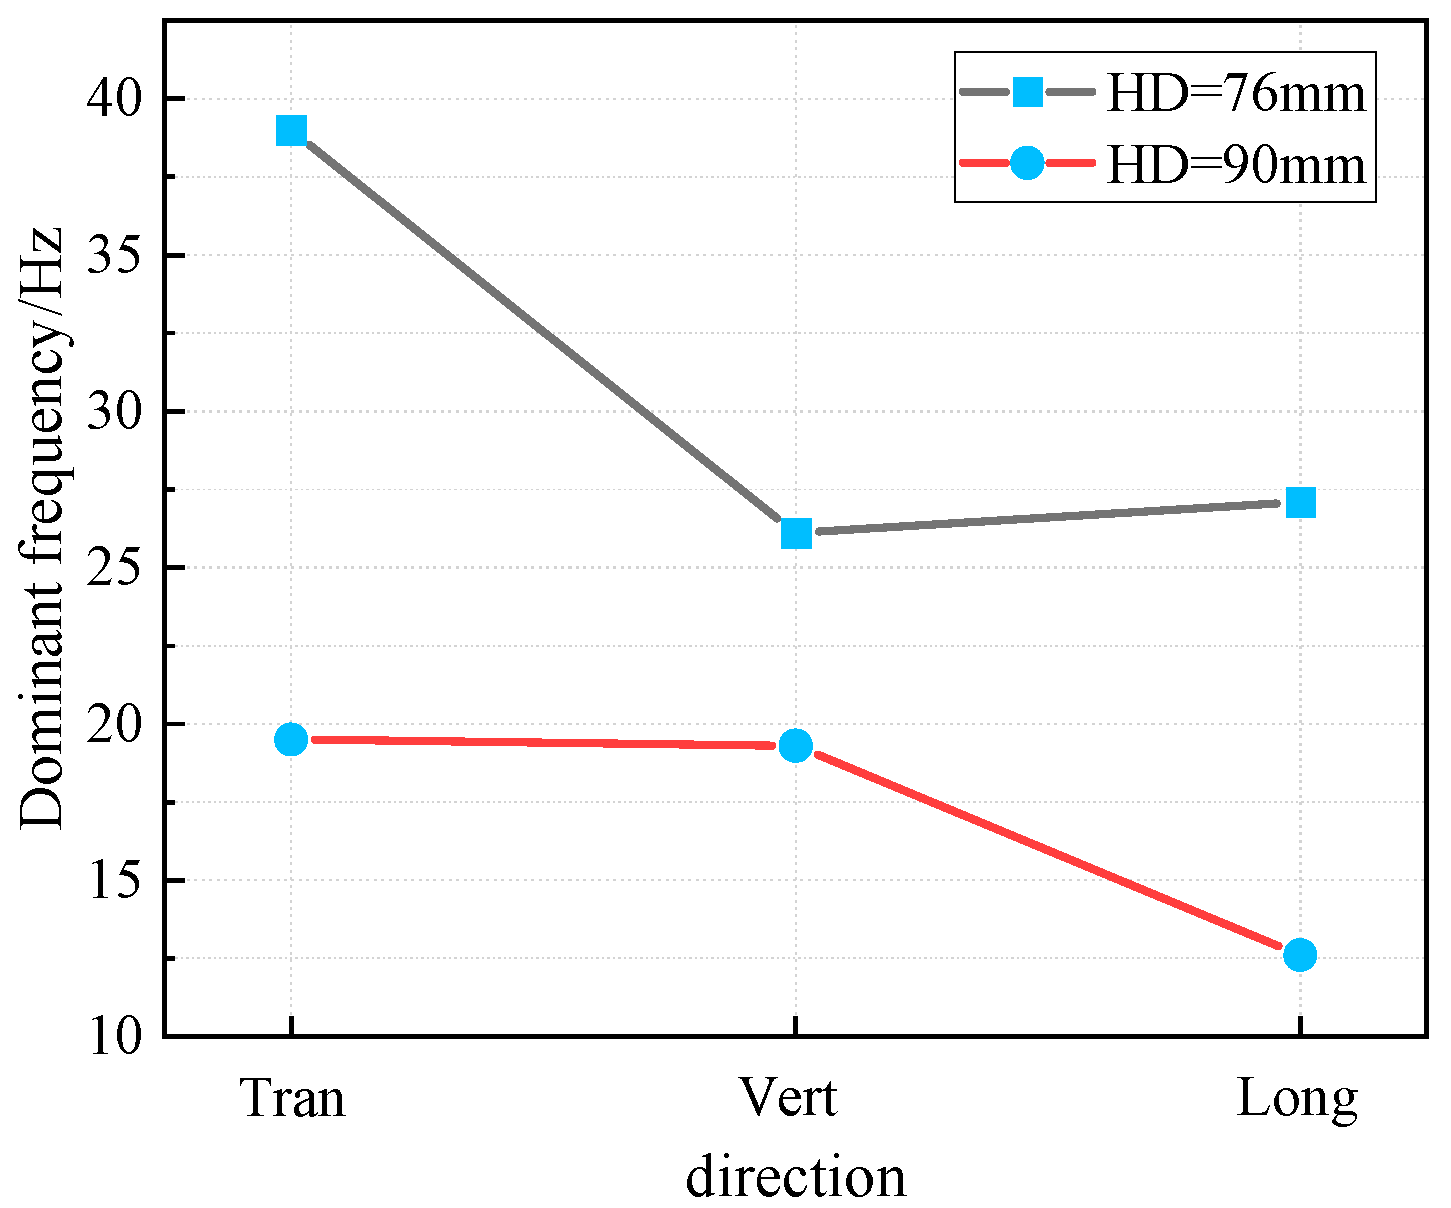
4.4. Borehole Parameters
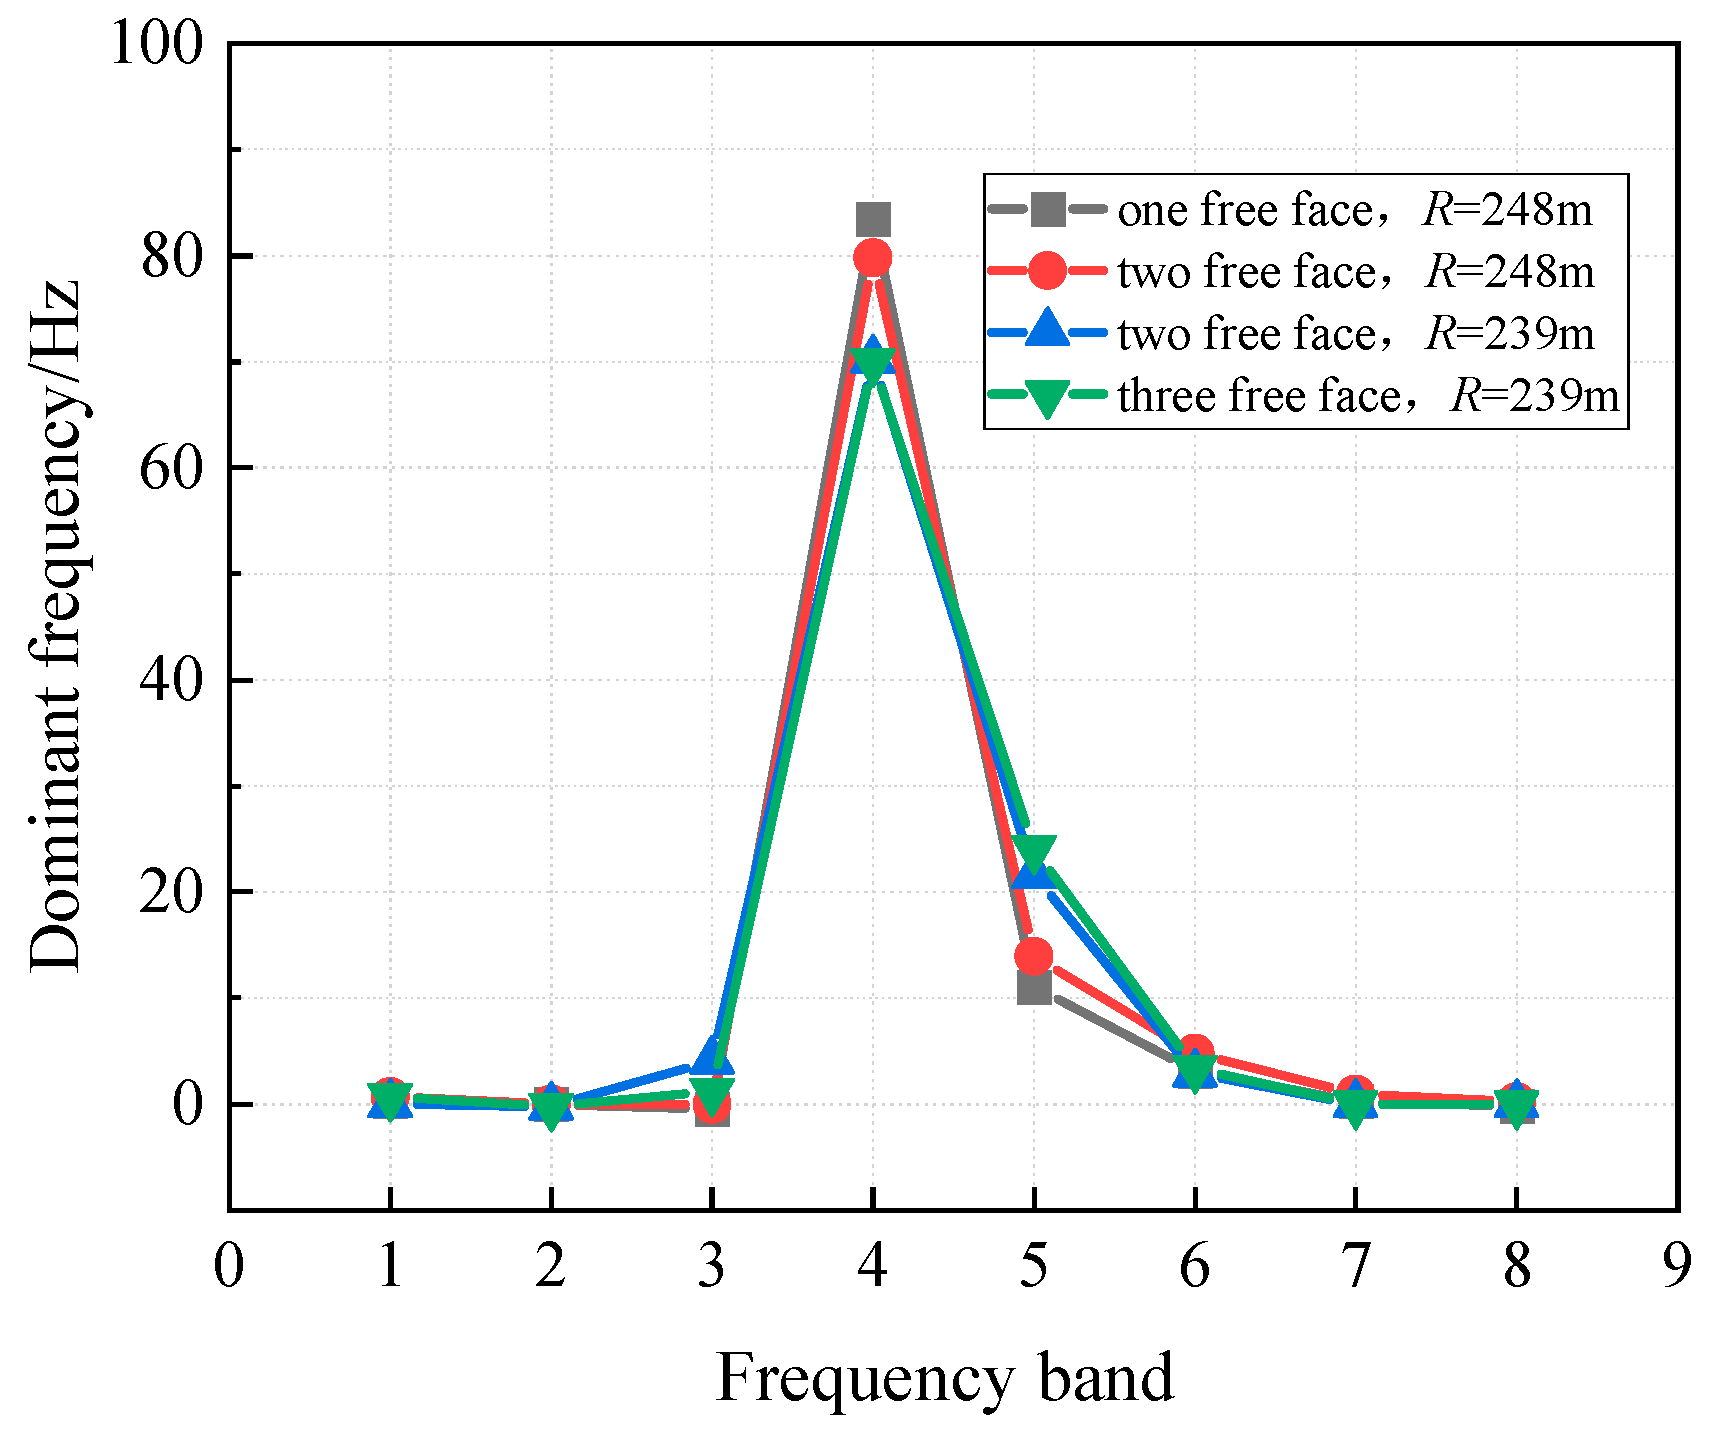
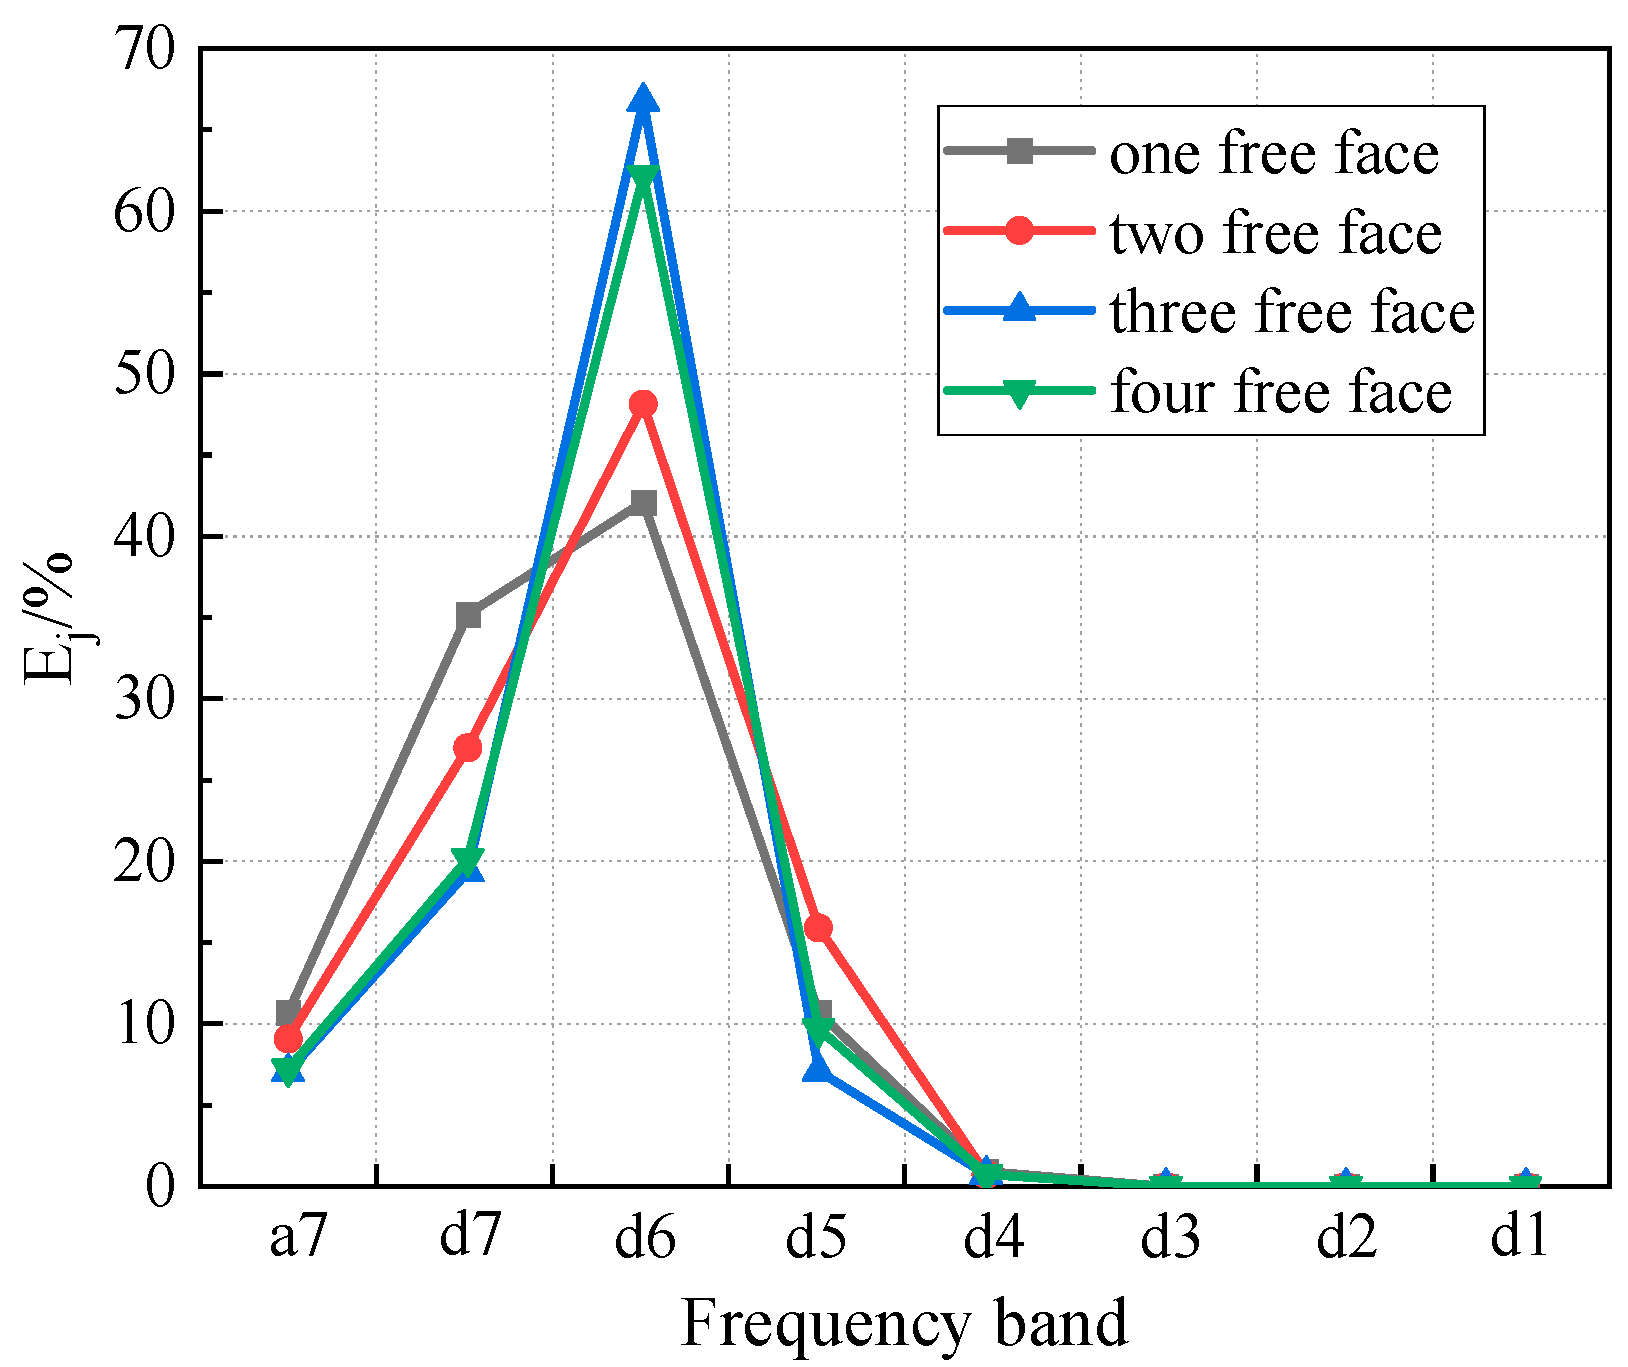
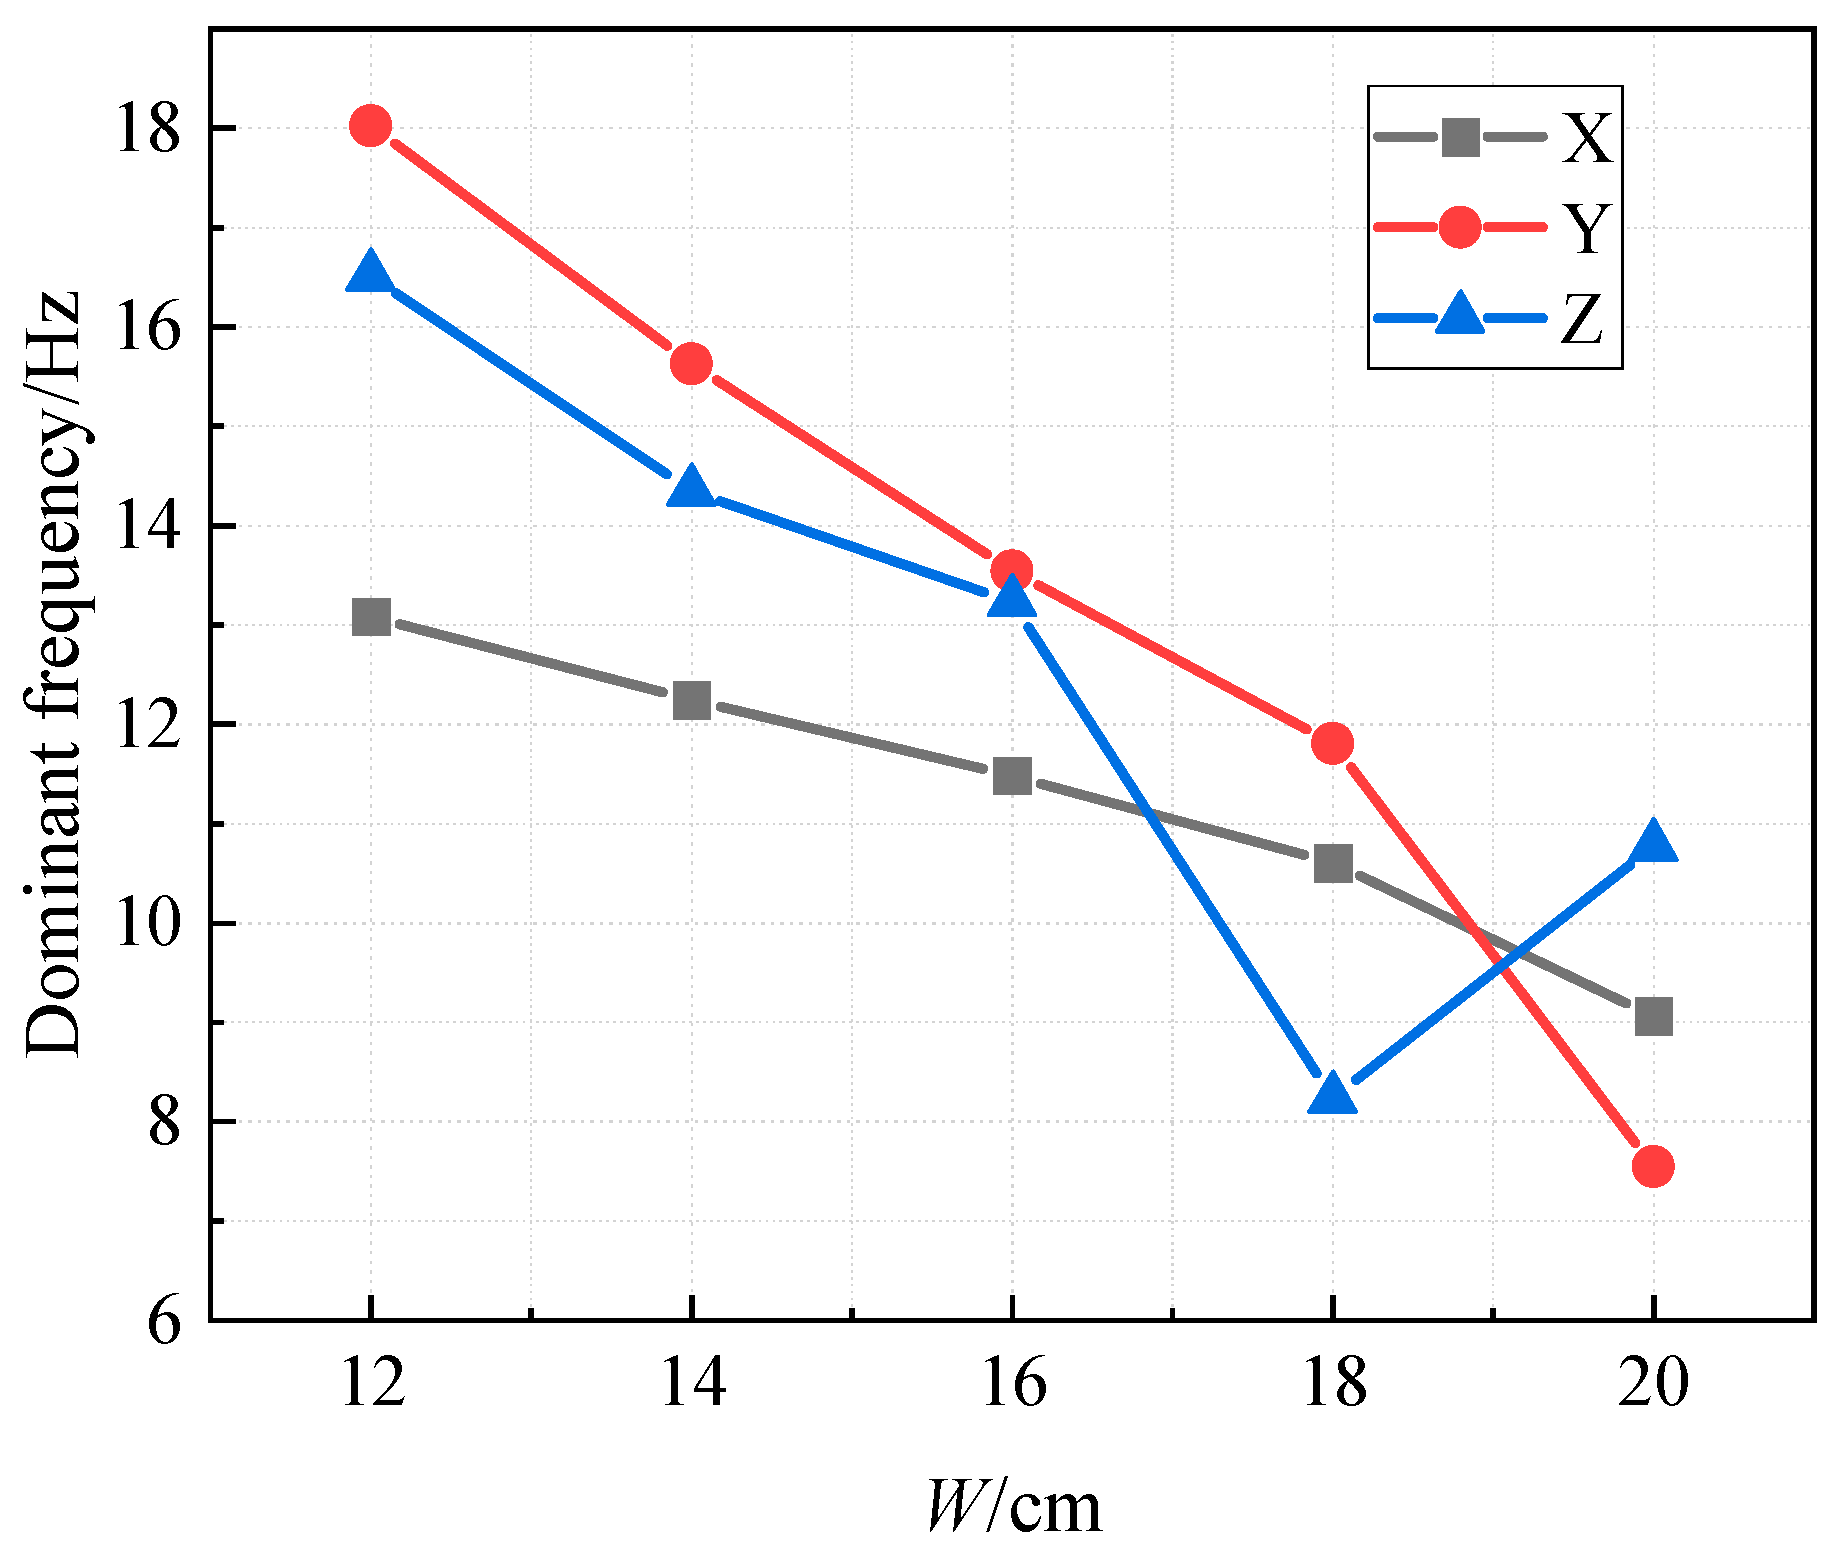
4.5. Free Surface
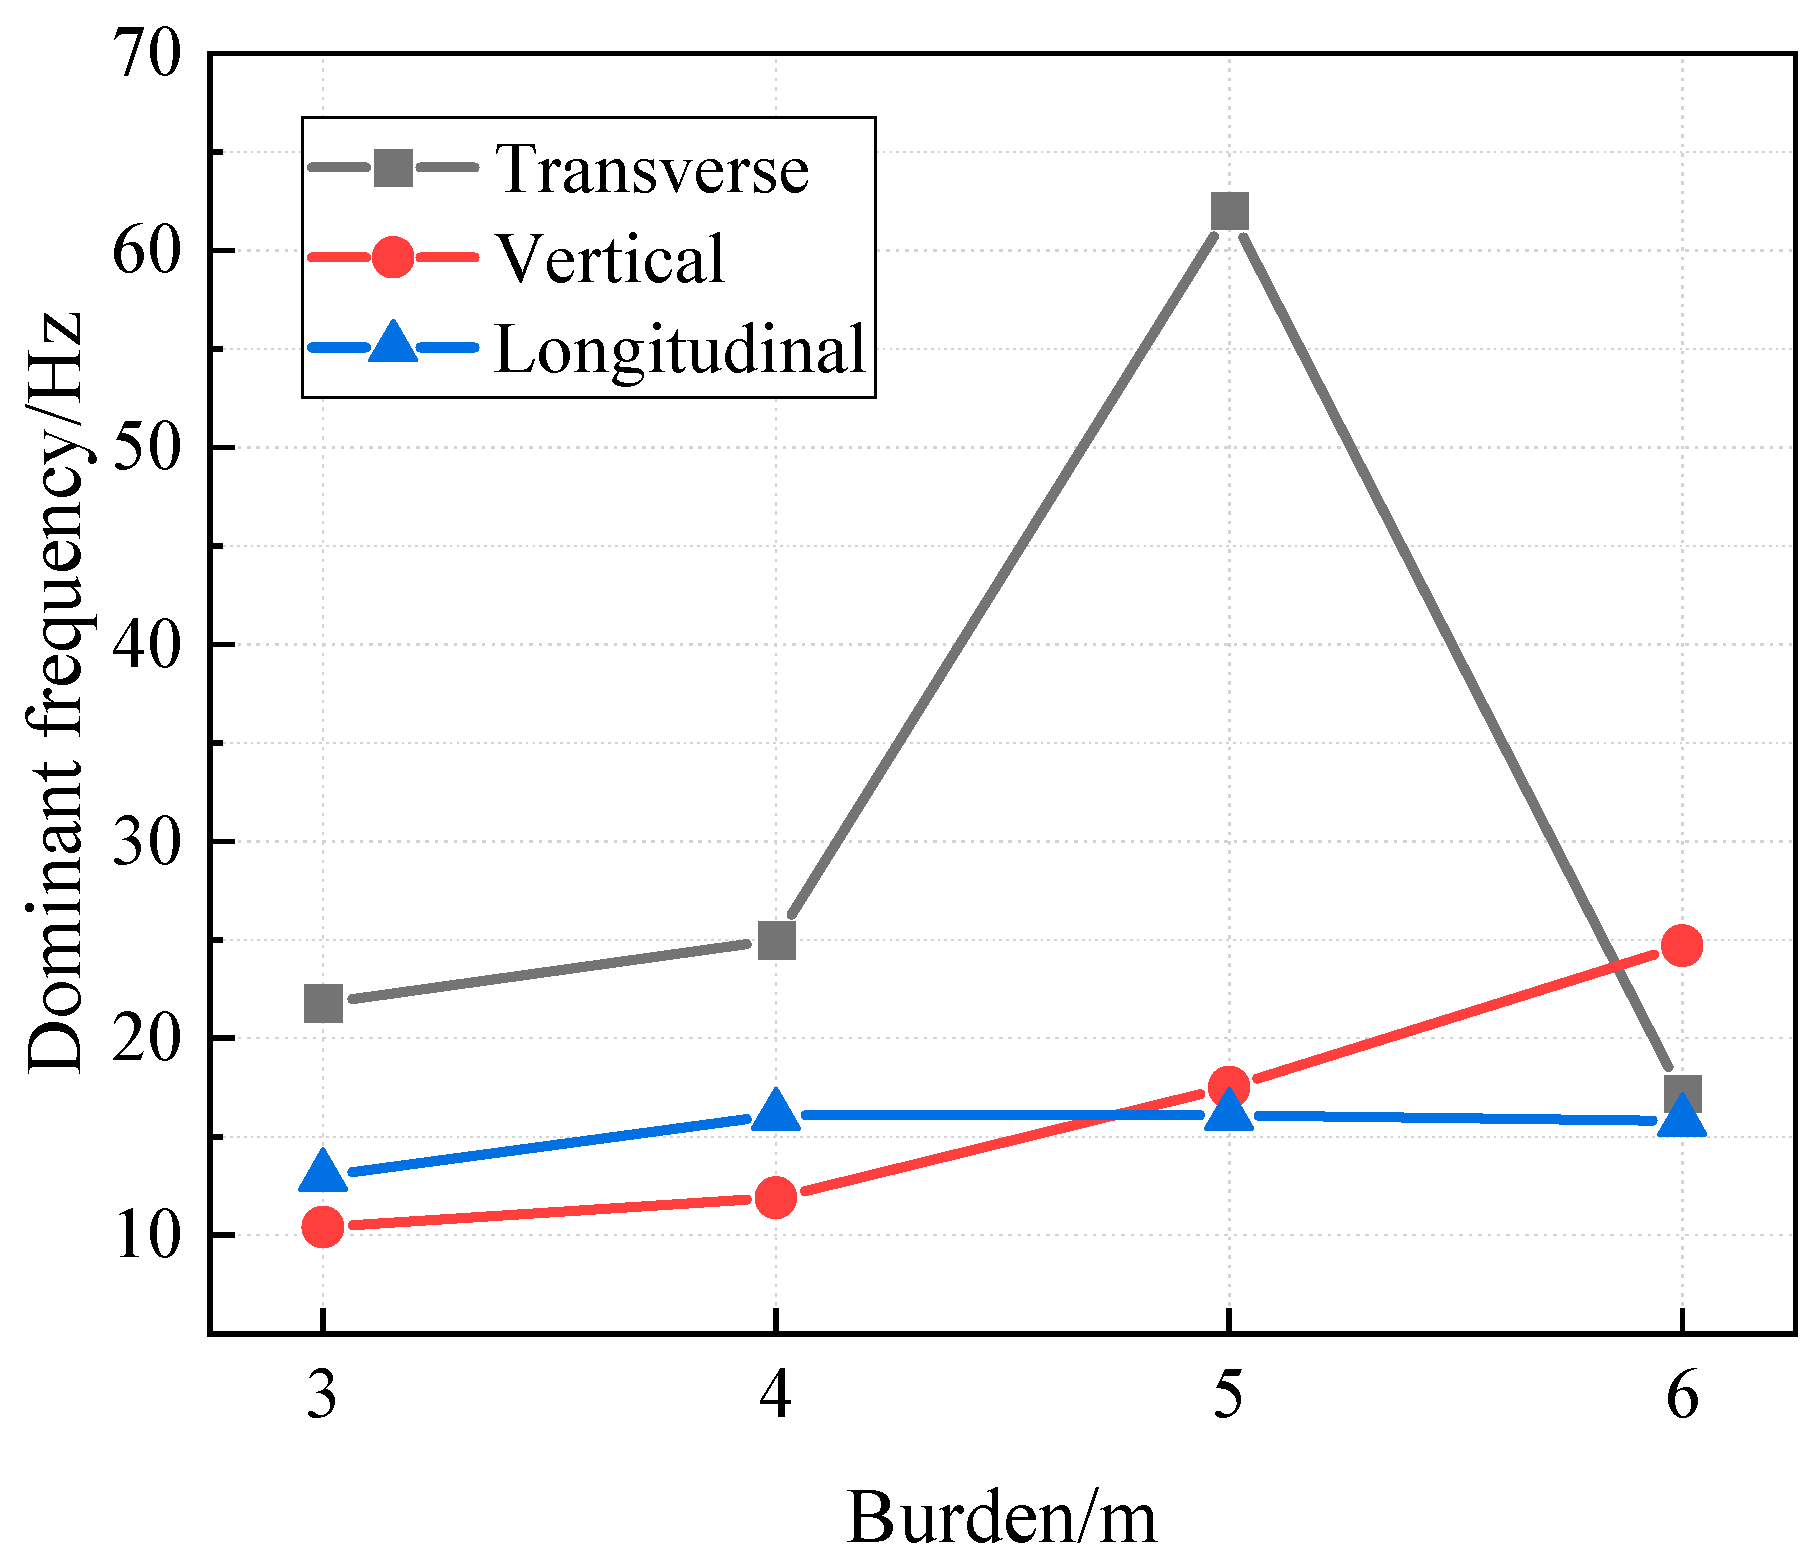
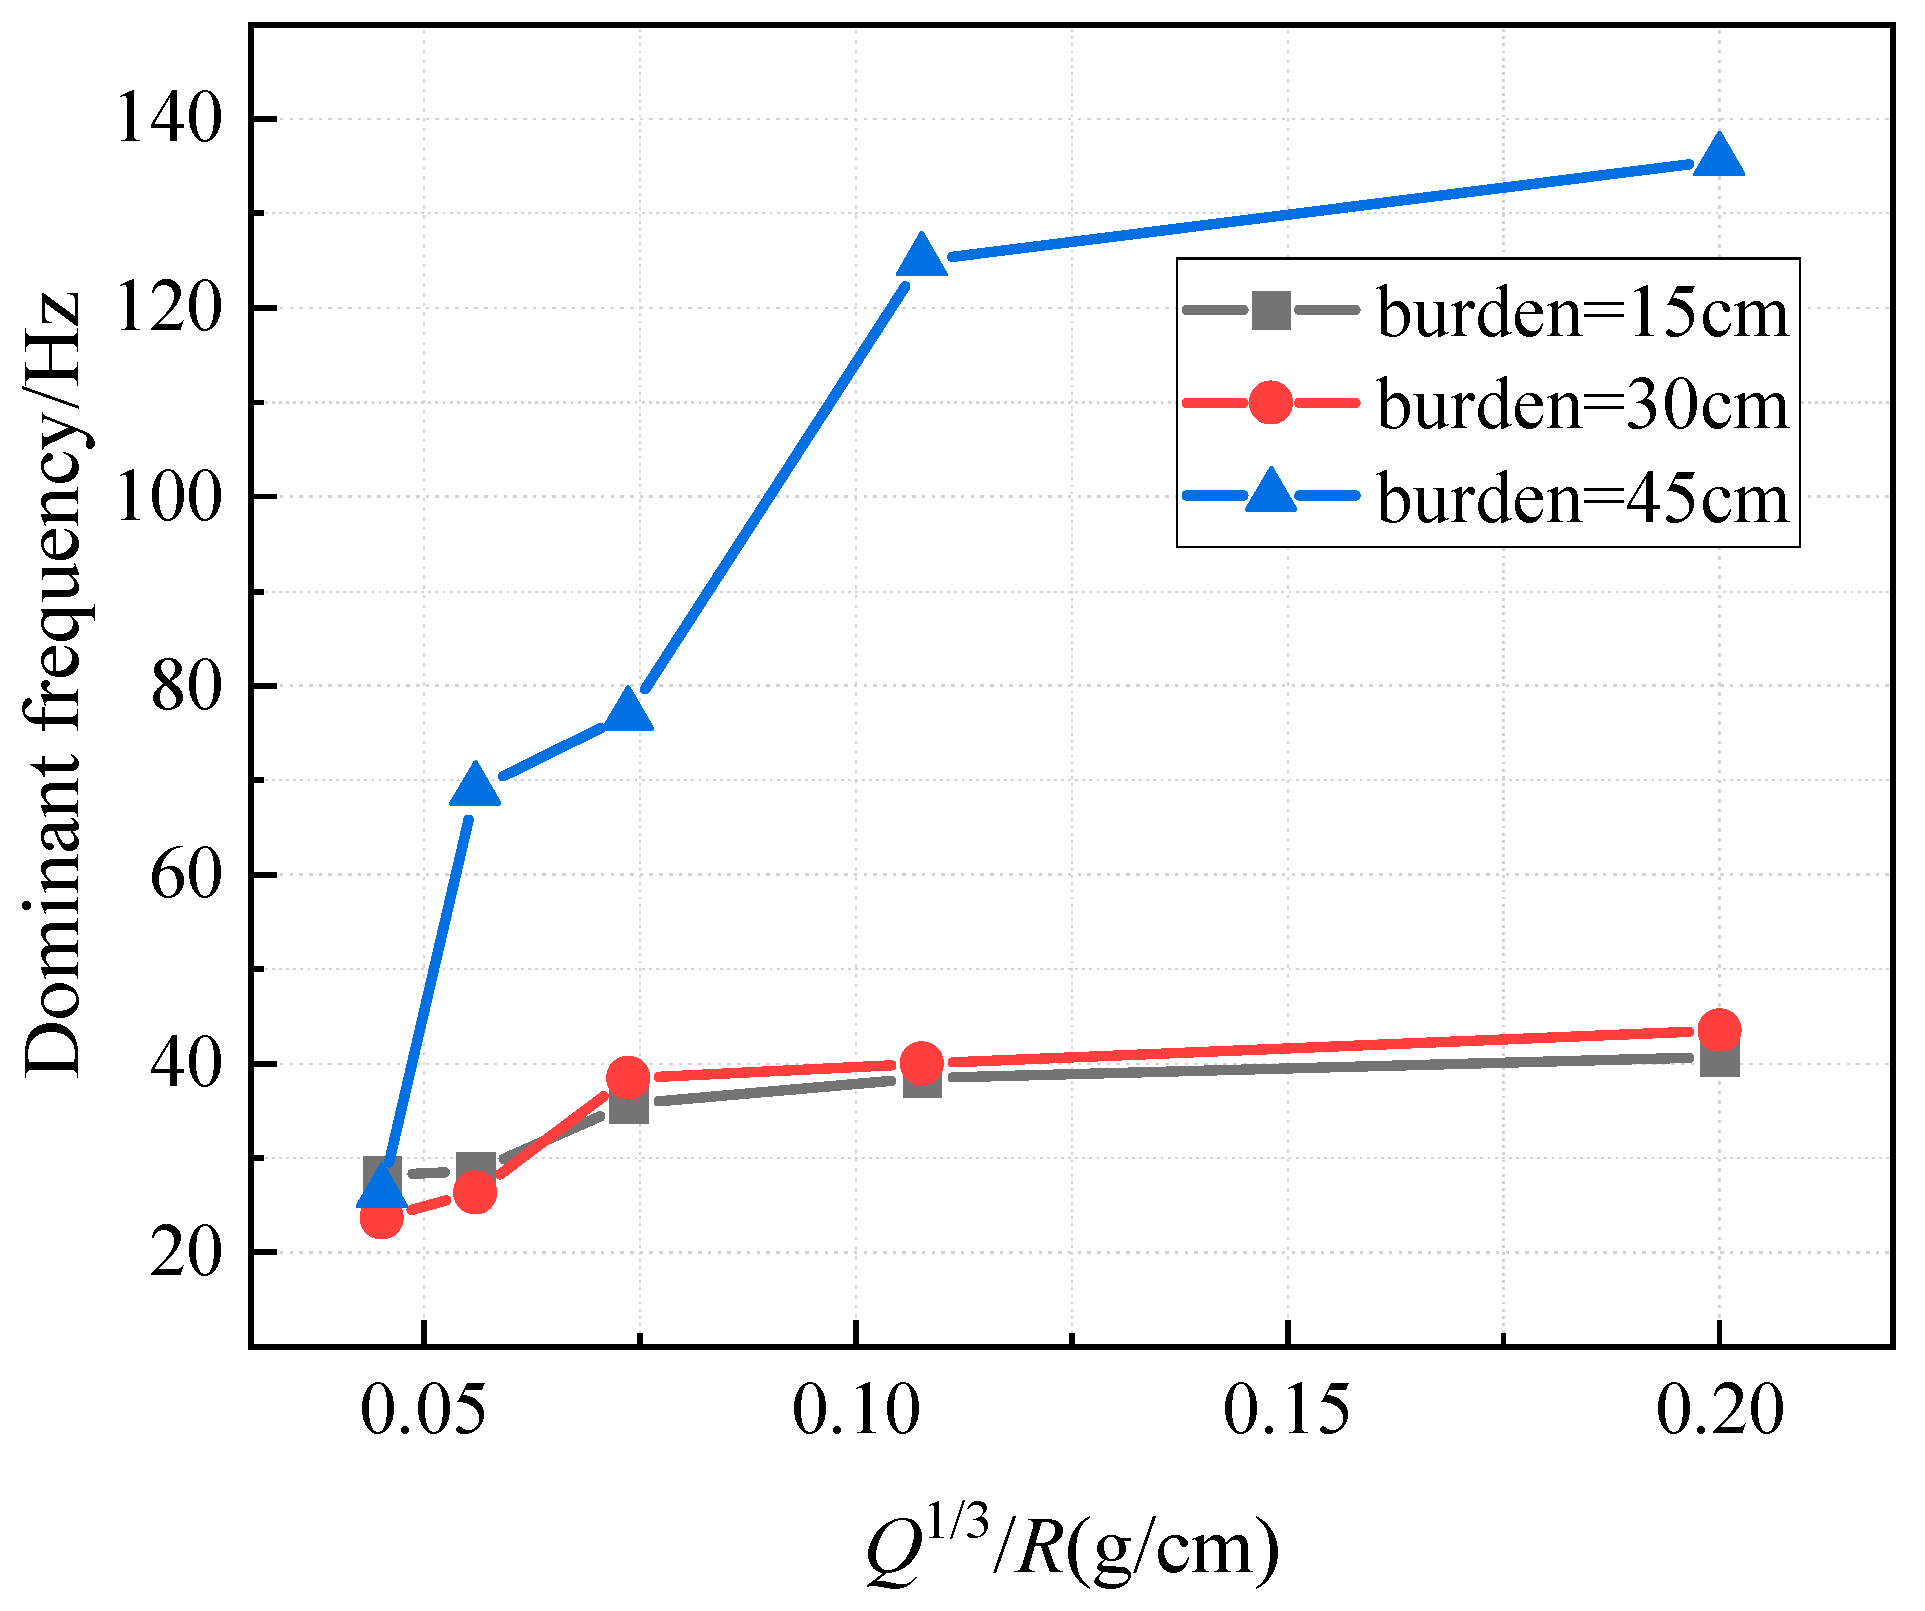
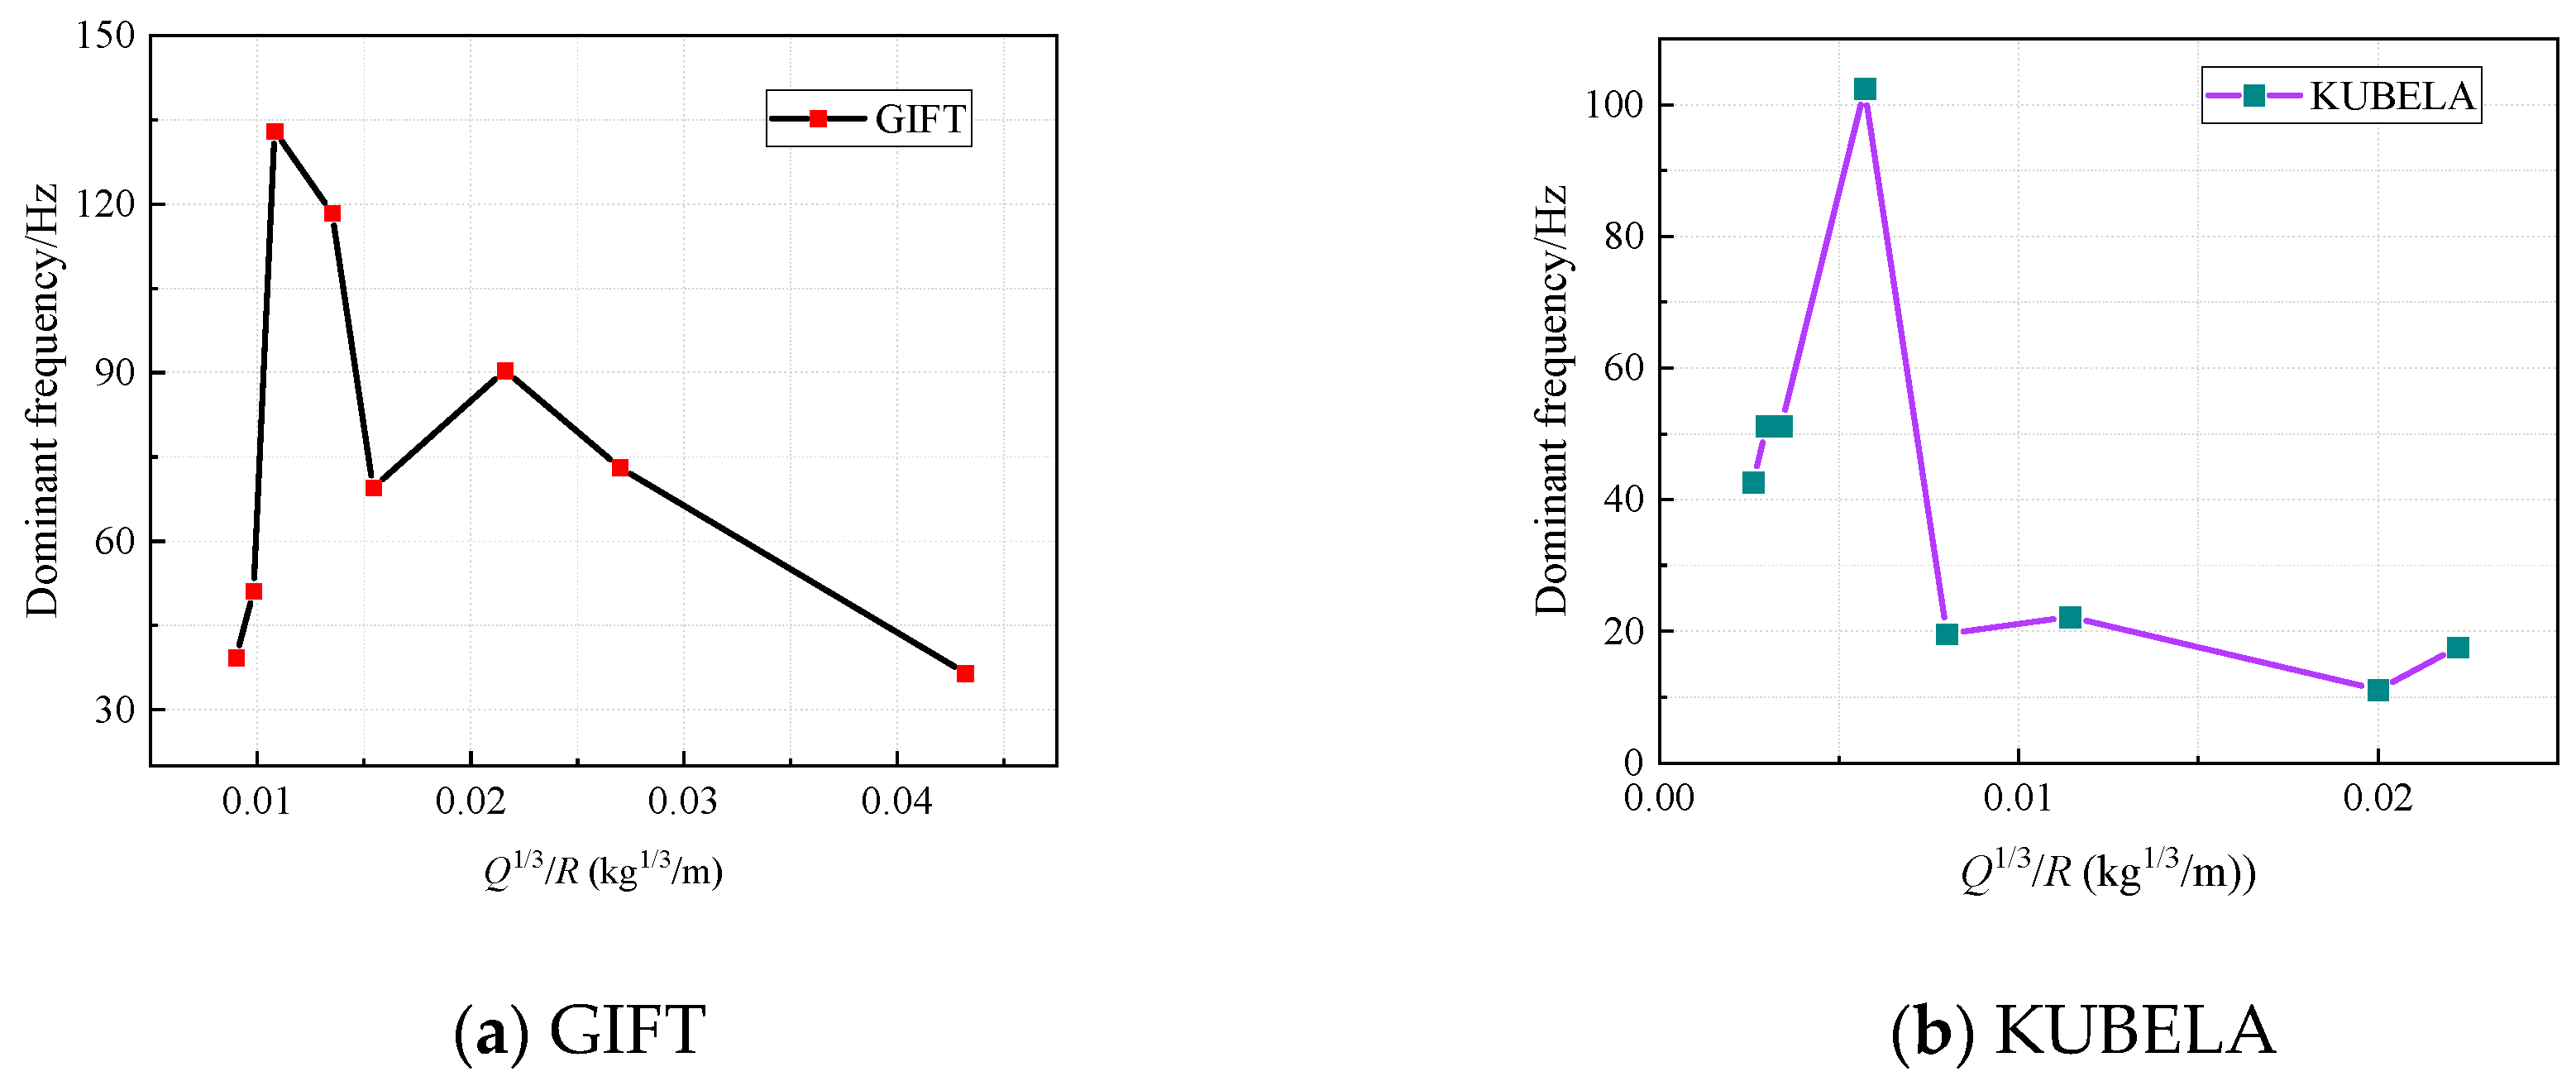
4.6. Burden
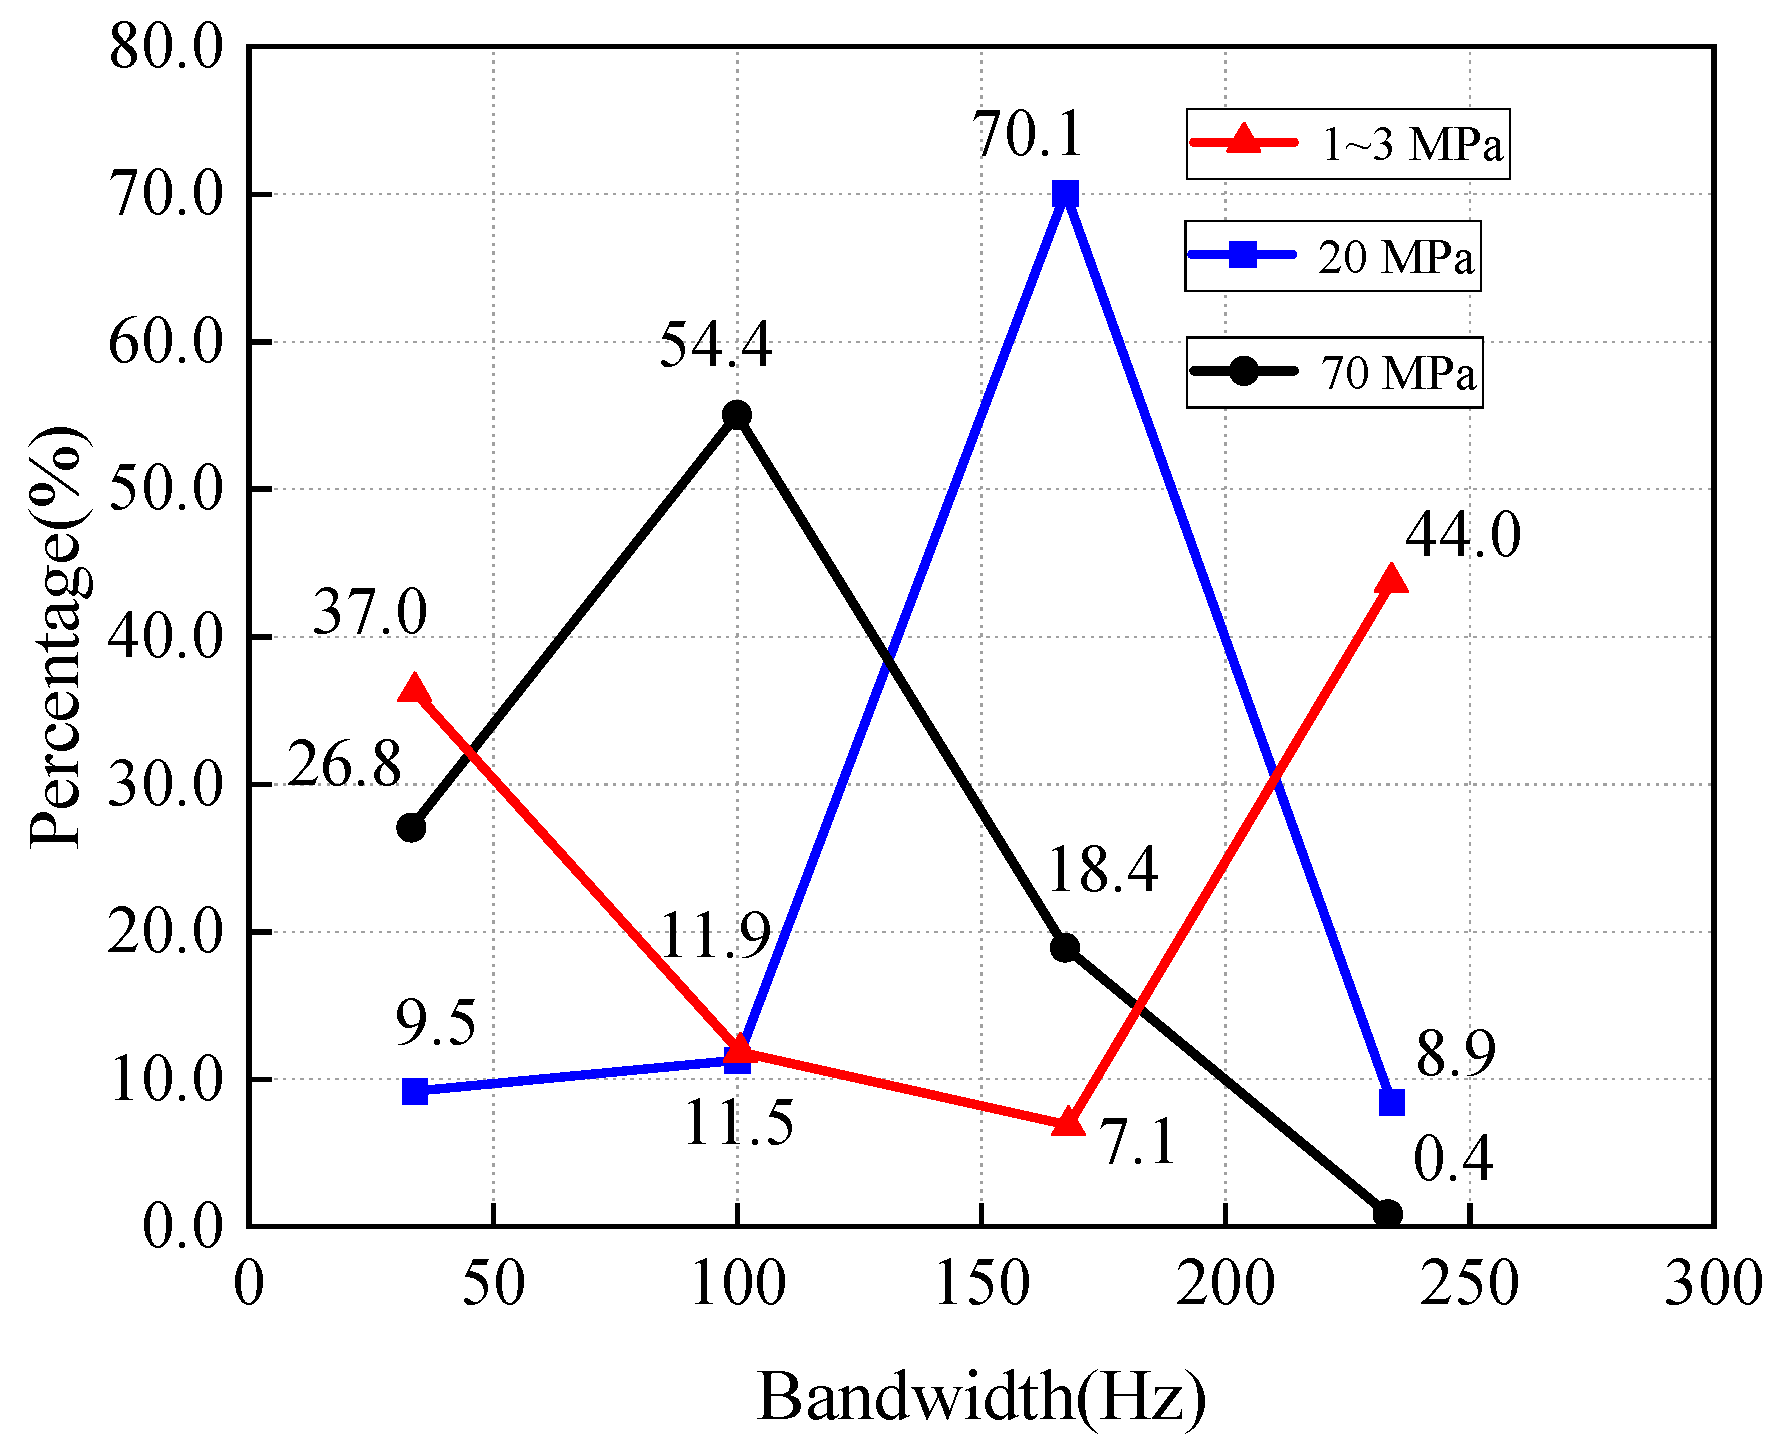
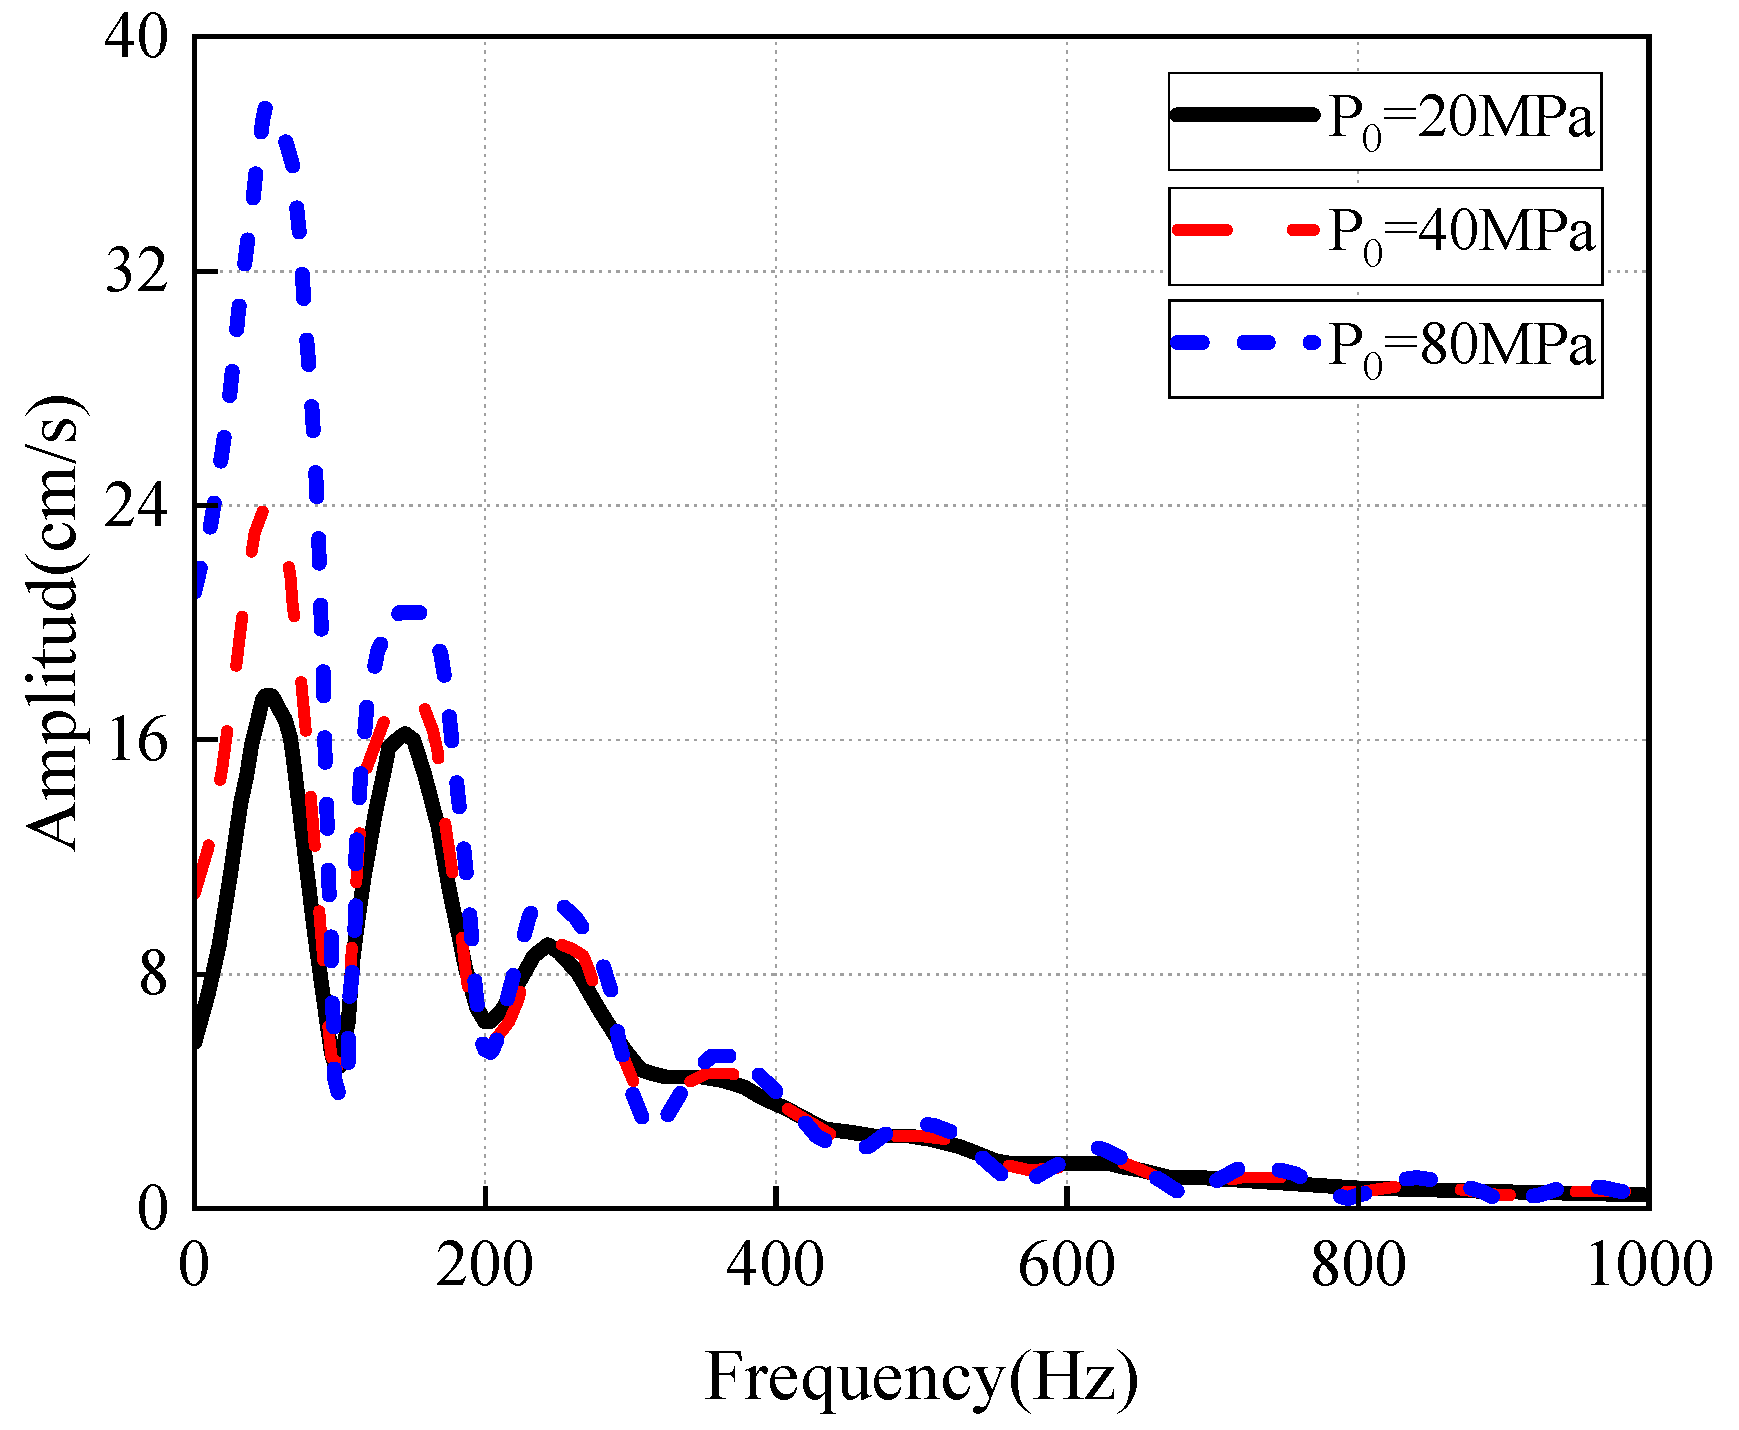
4.7. Explosive Type
4.8. Geological Condition
5. Prediction of Blast-Induced Vibration Dominant Frequency
5.1. Empirical Equation
5.2. Artificial Intelligence (AI) Techniques for Blast-Induced Vibration Dominant Frequency
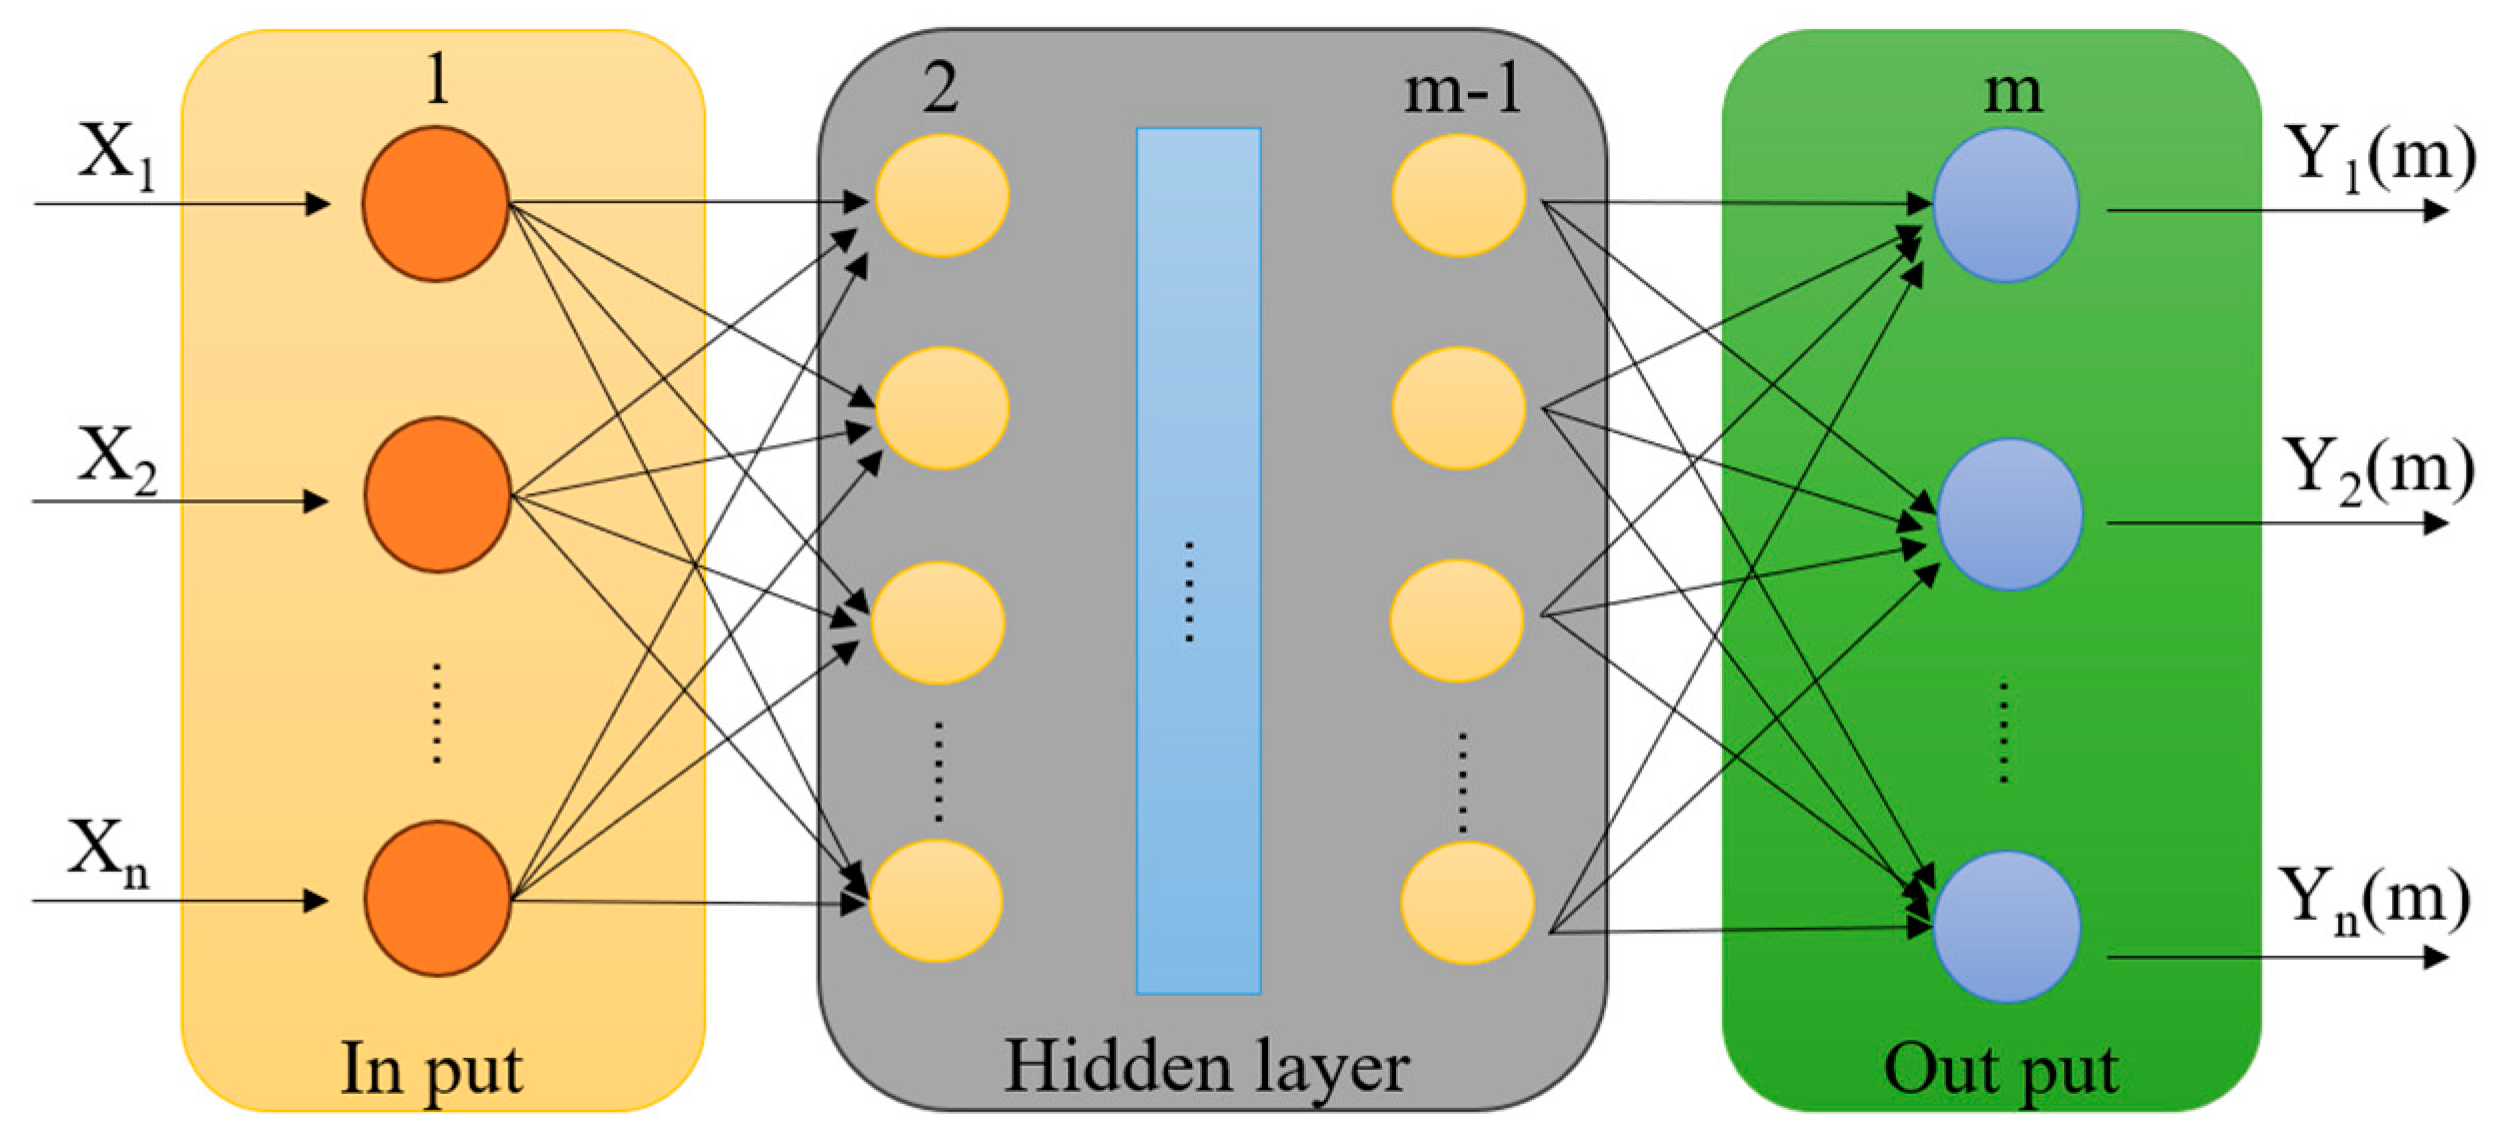
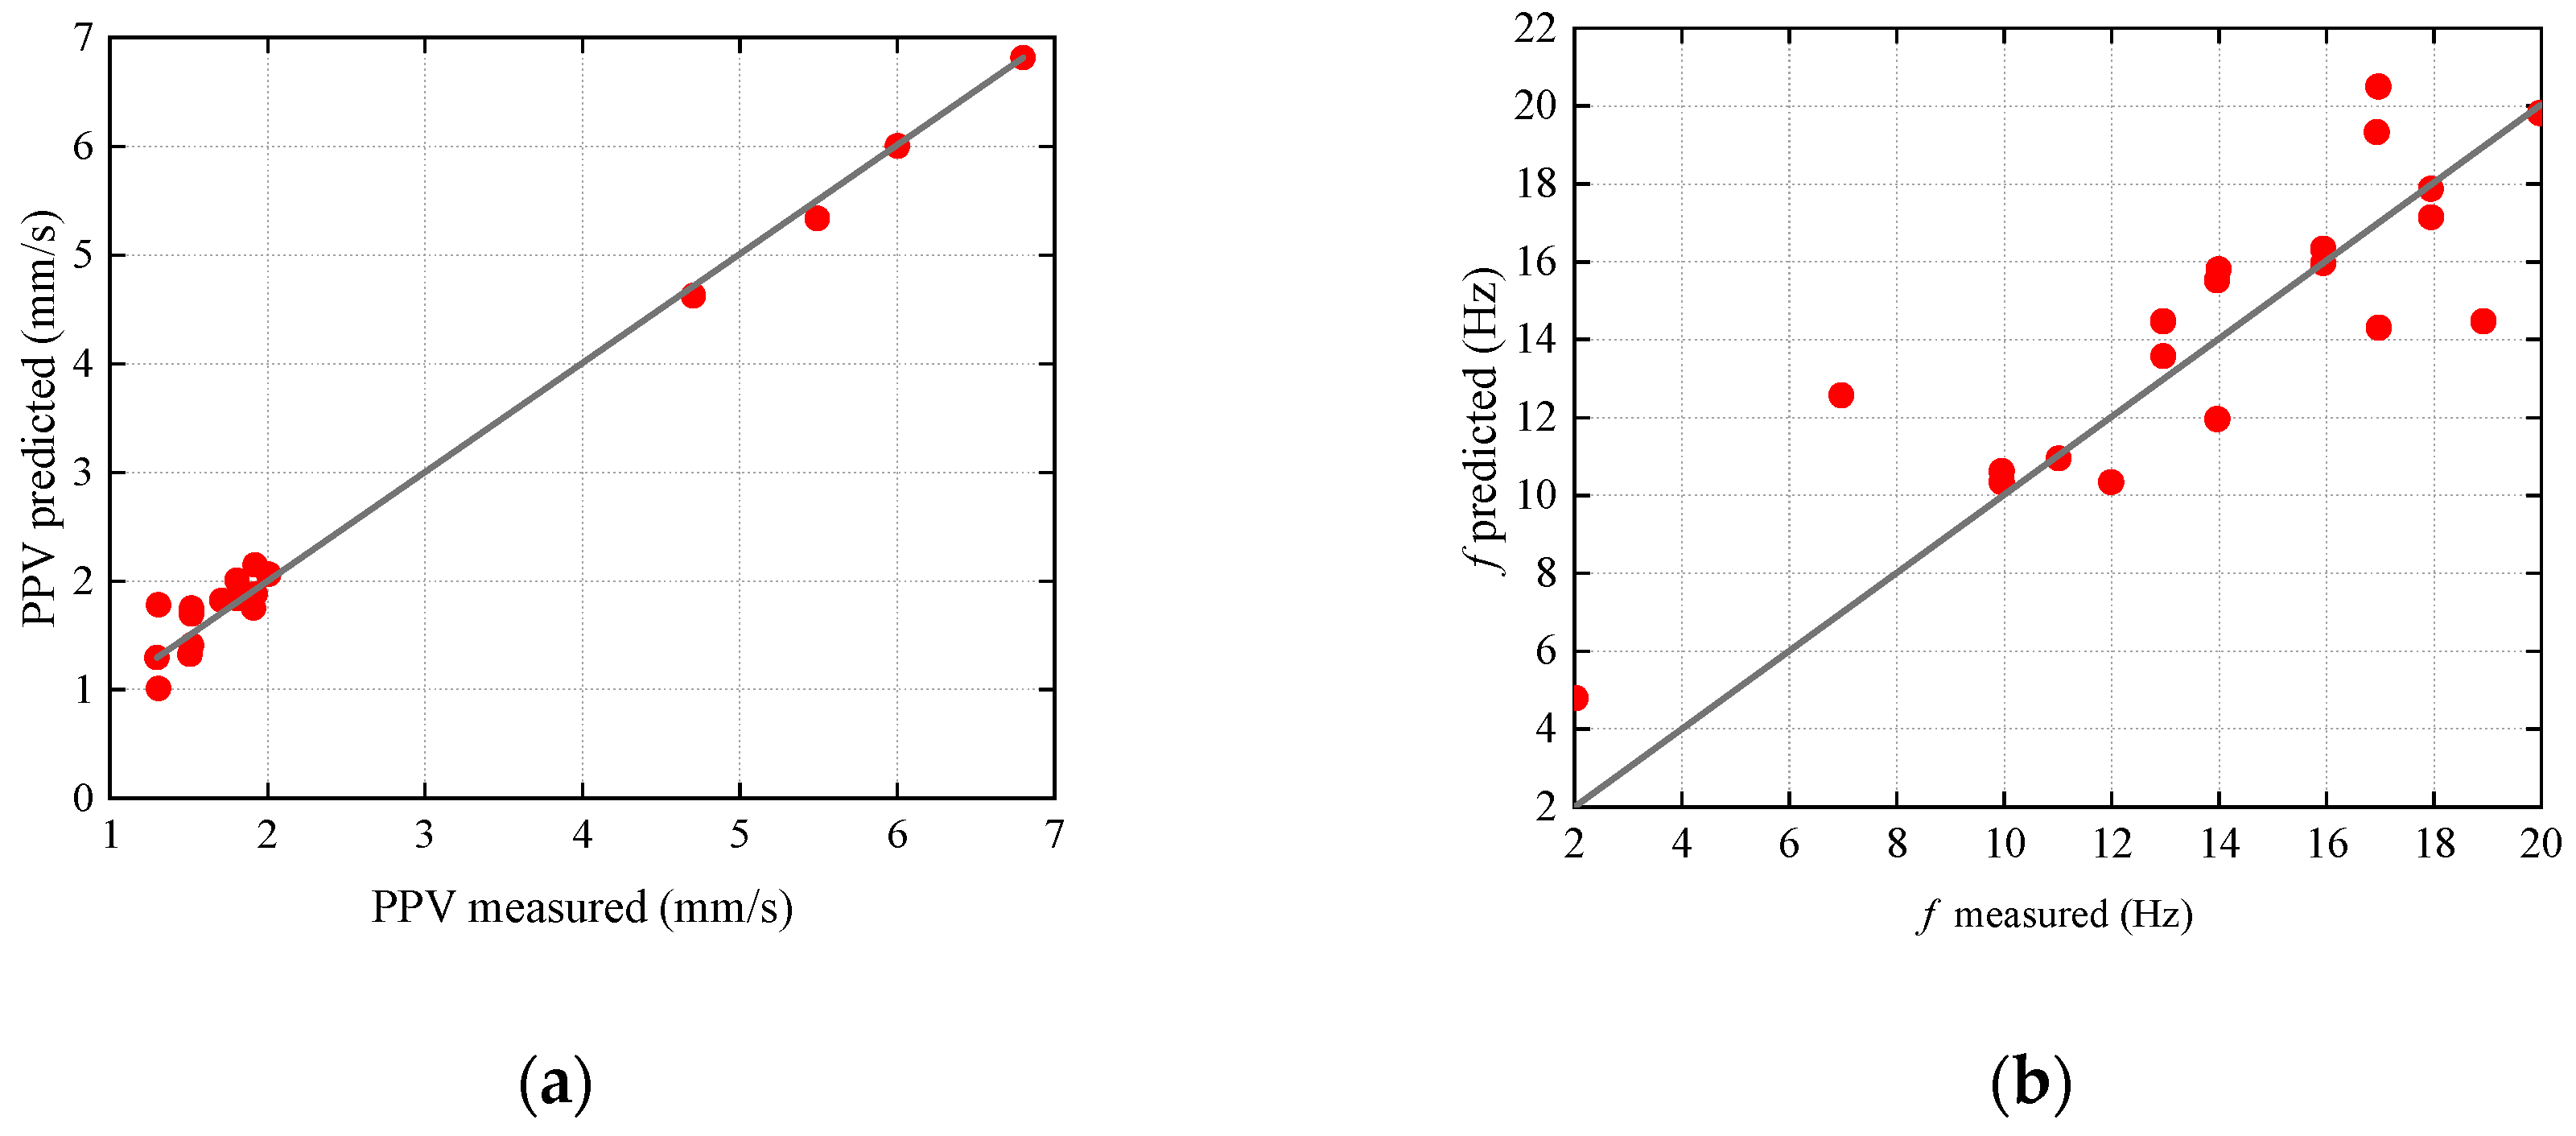
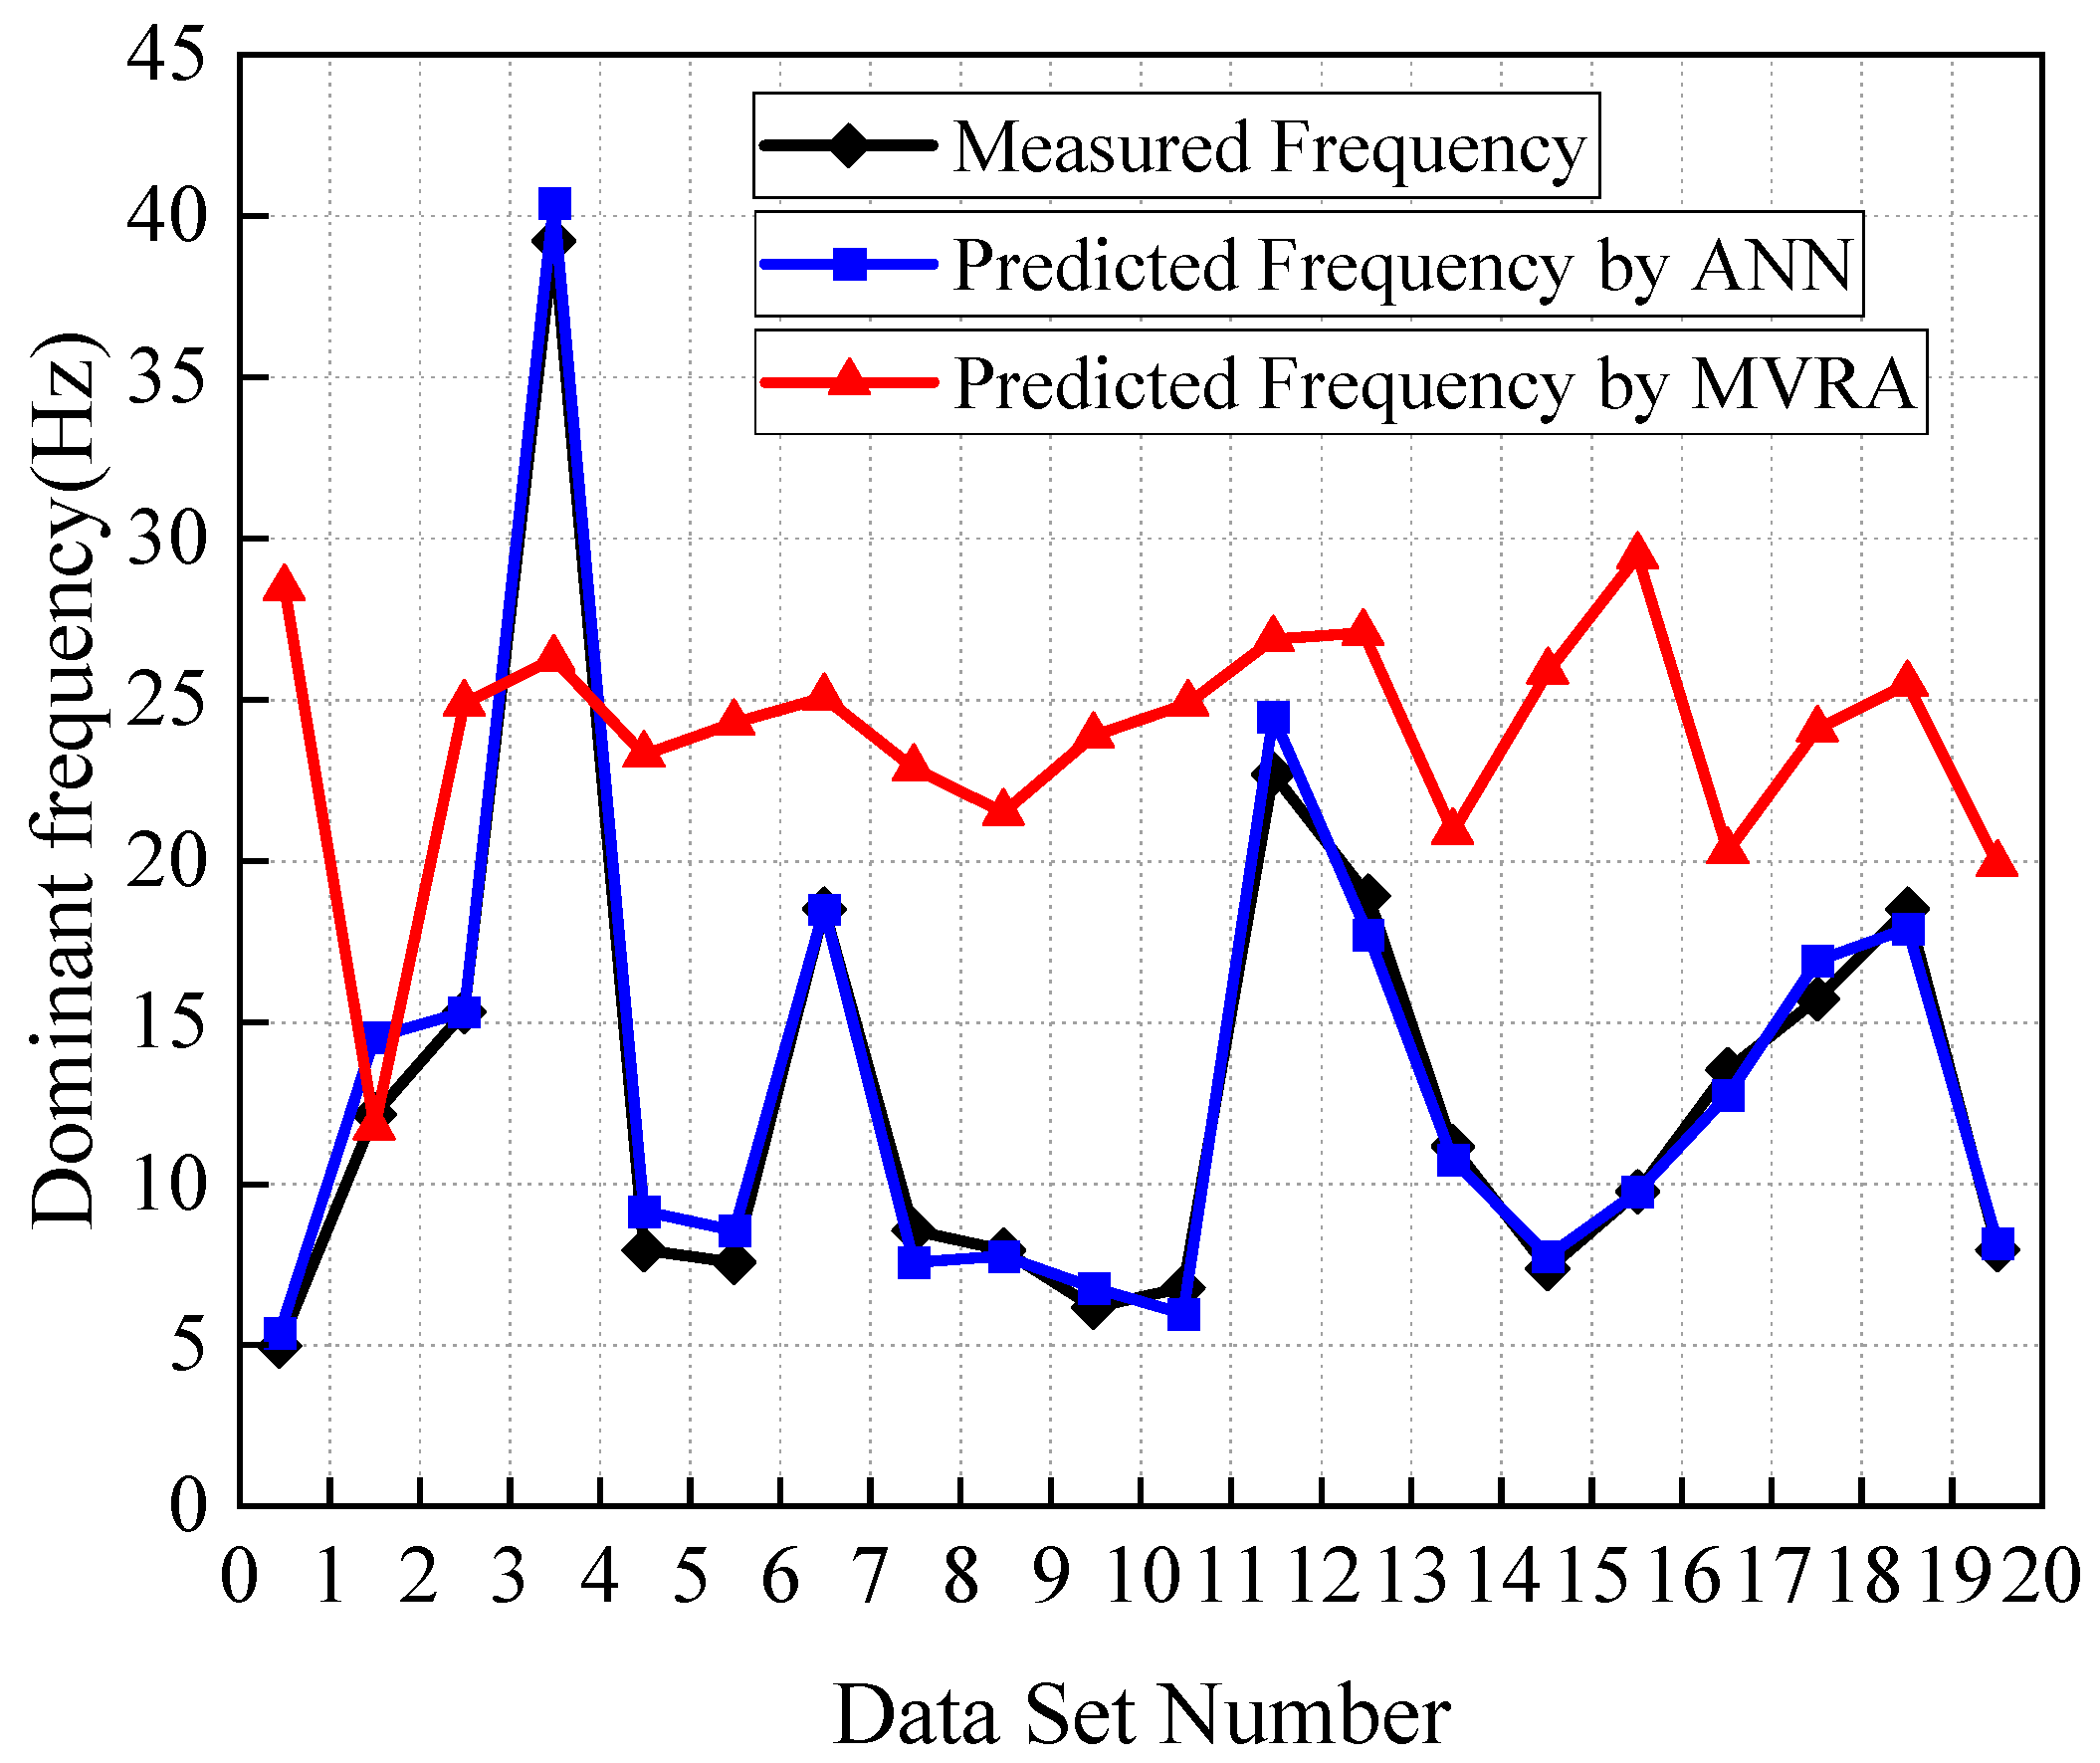
5.2.1. Artificial Neural Network (ANN)
5.2.2. Support Vector Machine (SVM)
5.2.3. Adaptive Neuro-Fuzzy Inference System (ANFIS)
5.2.4. Gene Expression Programming (GEP)
5.2.5. Random Forest (RF)
5.2.6. Optimization Algorithm
6. Discussion
7. Outlook
- There are significant differences in blasting vibration safety standards across different countries, particularly regarding the setting of frequency-velocity thresholds. For example, the standards in the United States, Switzerland, and Germany show inconsistencies in building classification and frequency division, while the standards in Italy and China may underestimate the risks associated with high-frequency vibrations in the high-frequency band. To promote the safety and sustainability of global blasting operations, there is an urgent need to establish a unified evaluation framework. Future research may require international organizations to coordinate data from multiple countries and develop a hierarchical evaluation system based on structural types, geological conditions, and service life. To more effectively control the impact of blast-induced vibrations on surrounding structures, it is first necessary to conduct a natural frequency survey of protected targets (such as buildings and equipment) and establish a relevant database. Before blasting, the natural frequencies of nearby structures should be assessed, and parameters such as charge weight and delay time should be dynamically adjusted to ensure that the dominant frequency is far from the sensitive frequency range of the structures. Additionally, by deploying a sensor network to collect real-time data on PPV and dominant frequency from blasting vibrations and combining ML models (such as PSO-LSSVM and random forests), vibration propagation can be predicted. On this basis, an adaptive control system can be developed, capable of automatically alarming when the dominant frequency approaches the structure’s natural frequency, allowing adjustments to blasting parameters to ensure safety. Furthermore, it is essential to define the applicable scenarios for different dominant frequency types. For engineering analysis, zero-cross dominant frequency should be prioritized, while dynamic response evaluation should use the response spectrum dominant frequency. For complex signals, wavelet transform or HHT analysis must be performed to identify multi-peak frequency components.
- The dominant frequency of blast-induced vibration is a key indicator for assessing the impact of blasting operations on the environment and structures. When the dominant frequency approaches the natural frequency of a structure, it may pose a threat to the safety of buildings and personnel. Therefore, strict control of vibration frequency is necessary. Currently, there are no clear standards for the applicability of Zero-cross dominant frequency, Fourier dominant frequency, and Centroid frequency, and further research is required.
- In the future, the analysis of blast-induced vibration signals should integrate various time–frequency analysis methods (such as Fourier Transform, Wavelet Transform, and HHT) to construct a comprehensive analysis framework. With the aid of ML and intelligent algorithms, automatic feature recognition should be achieved, and real-time monitoring and early warning of vibration signals should be realized through the integration of high-precision monitoring equipment.
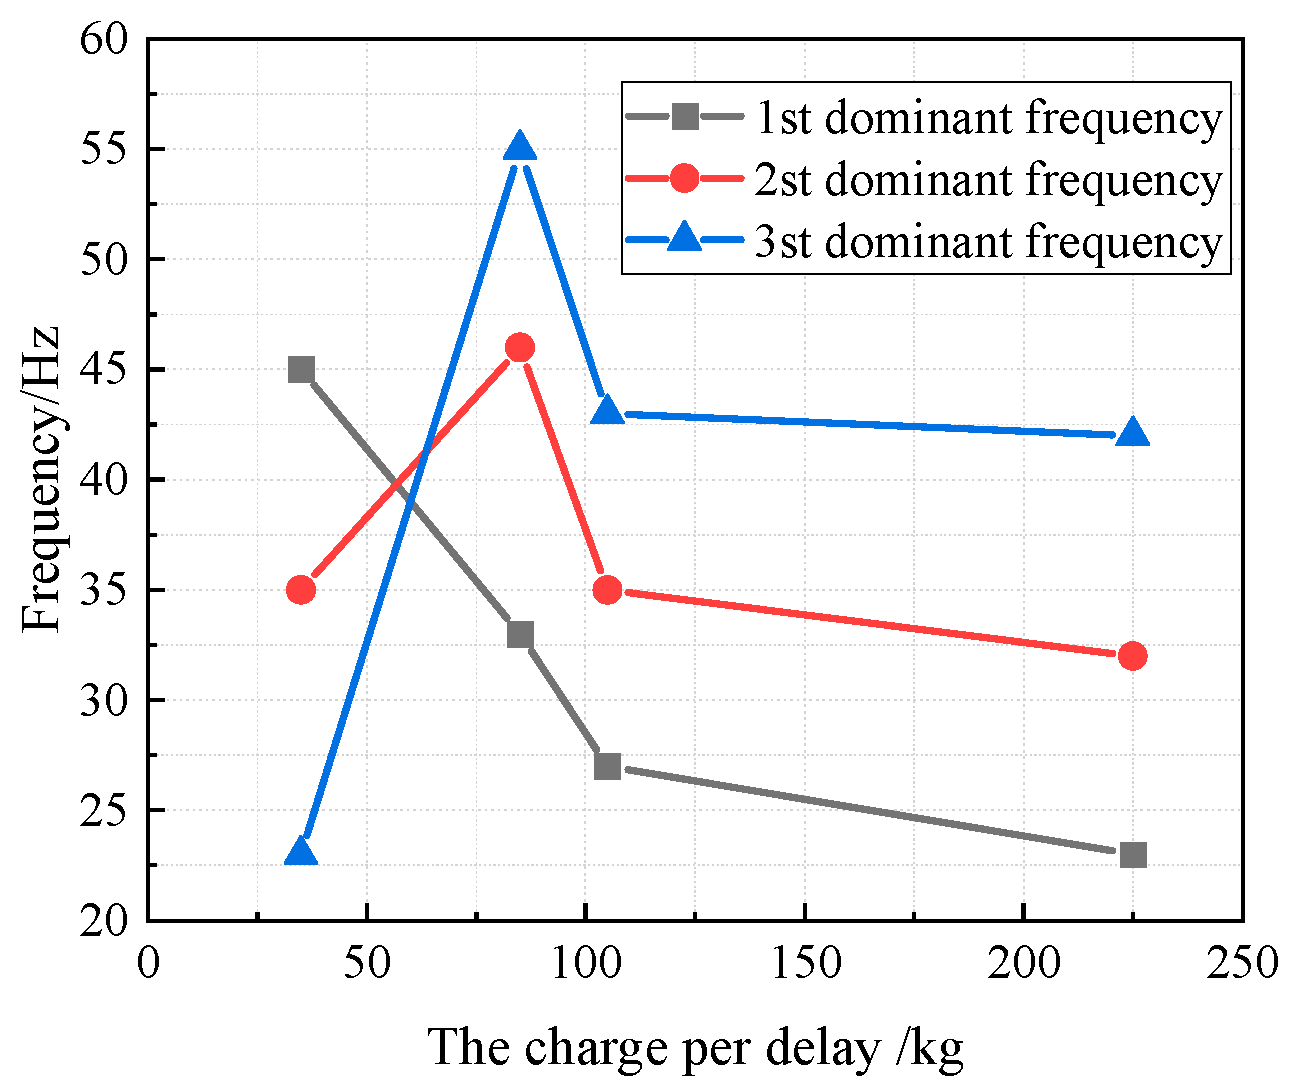
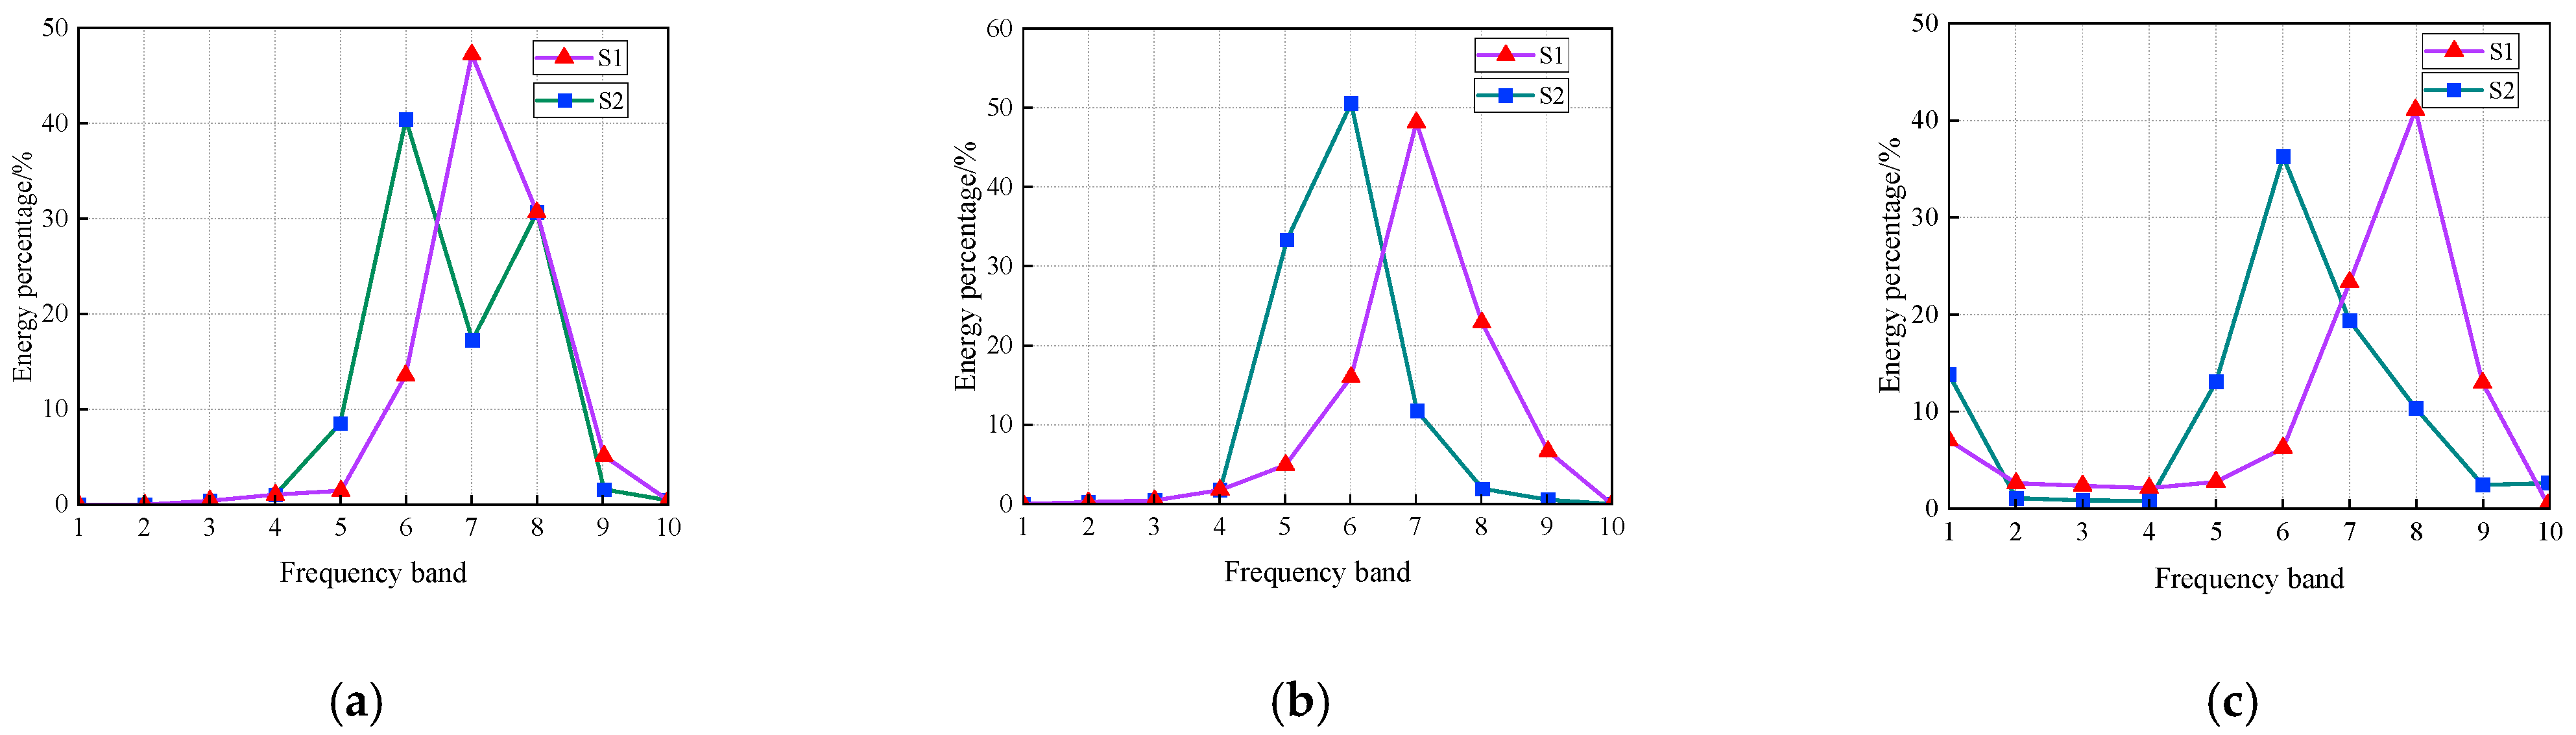
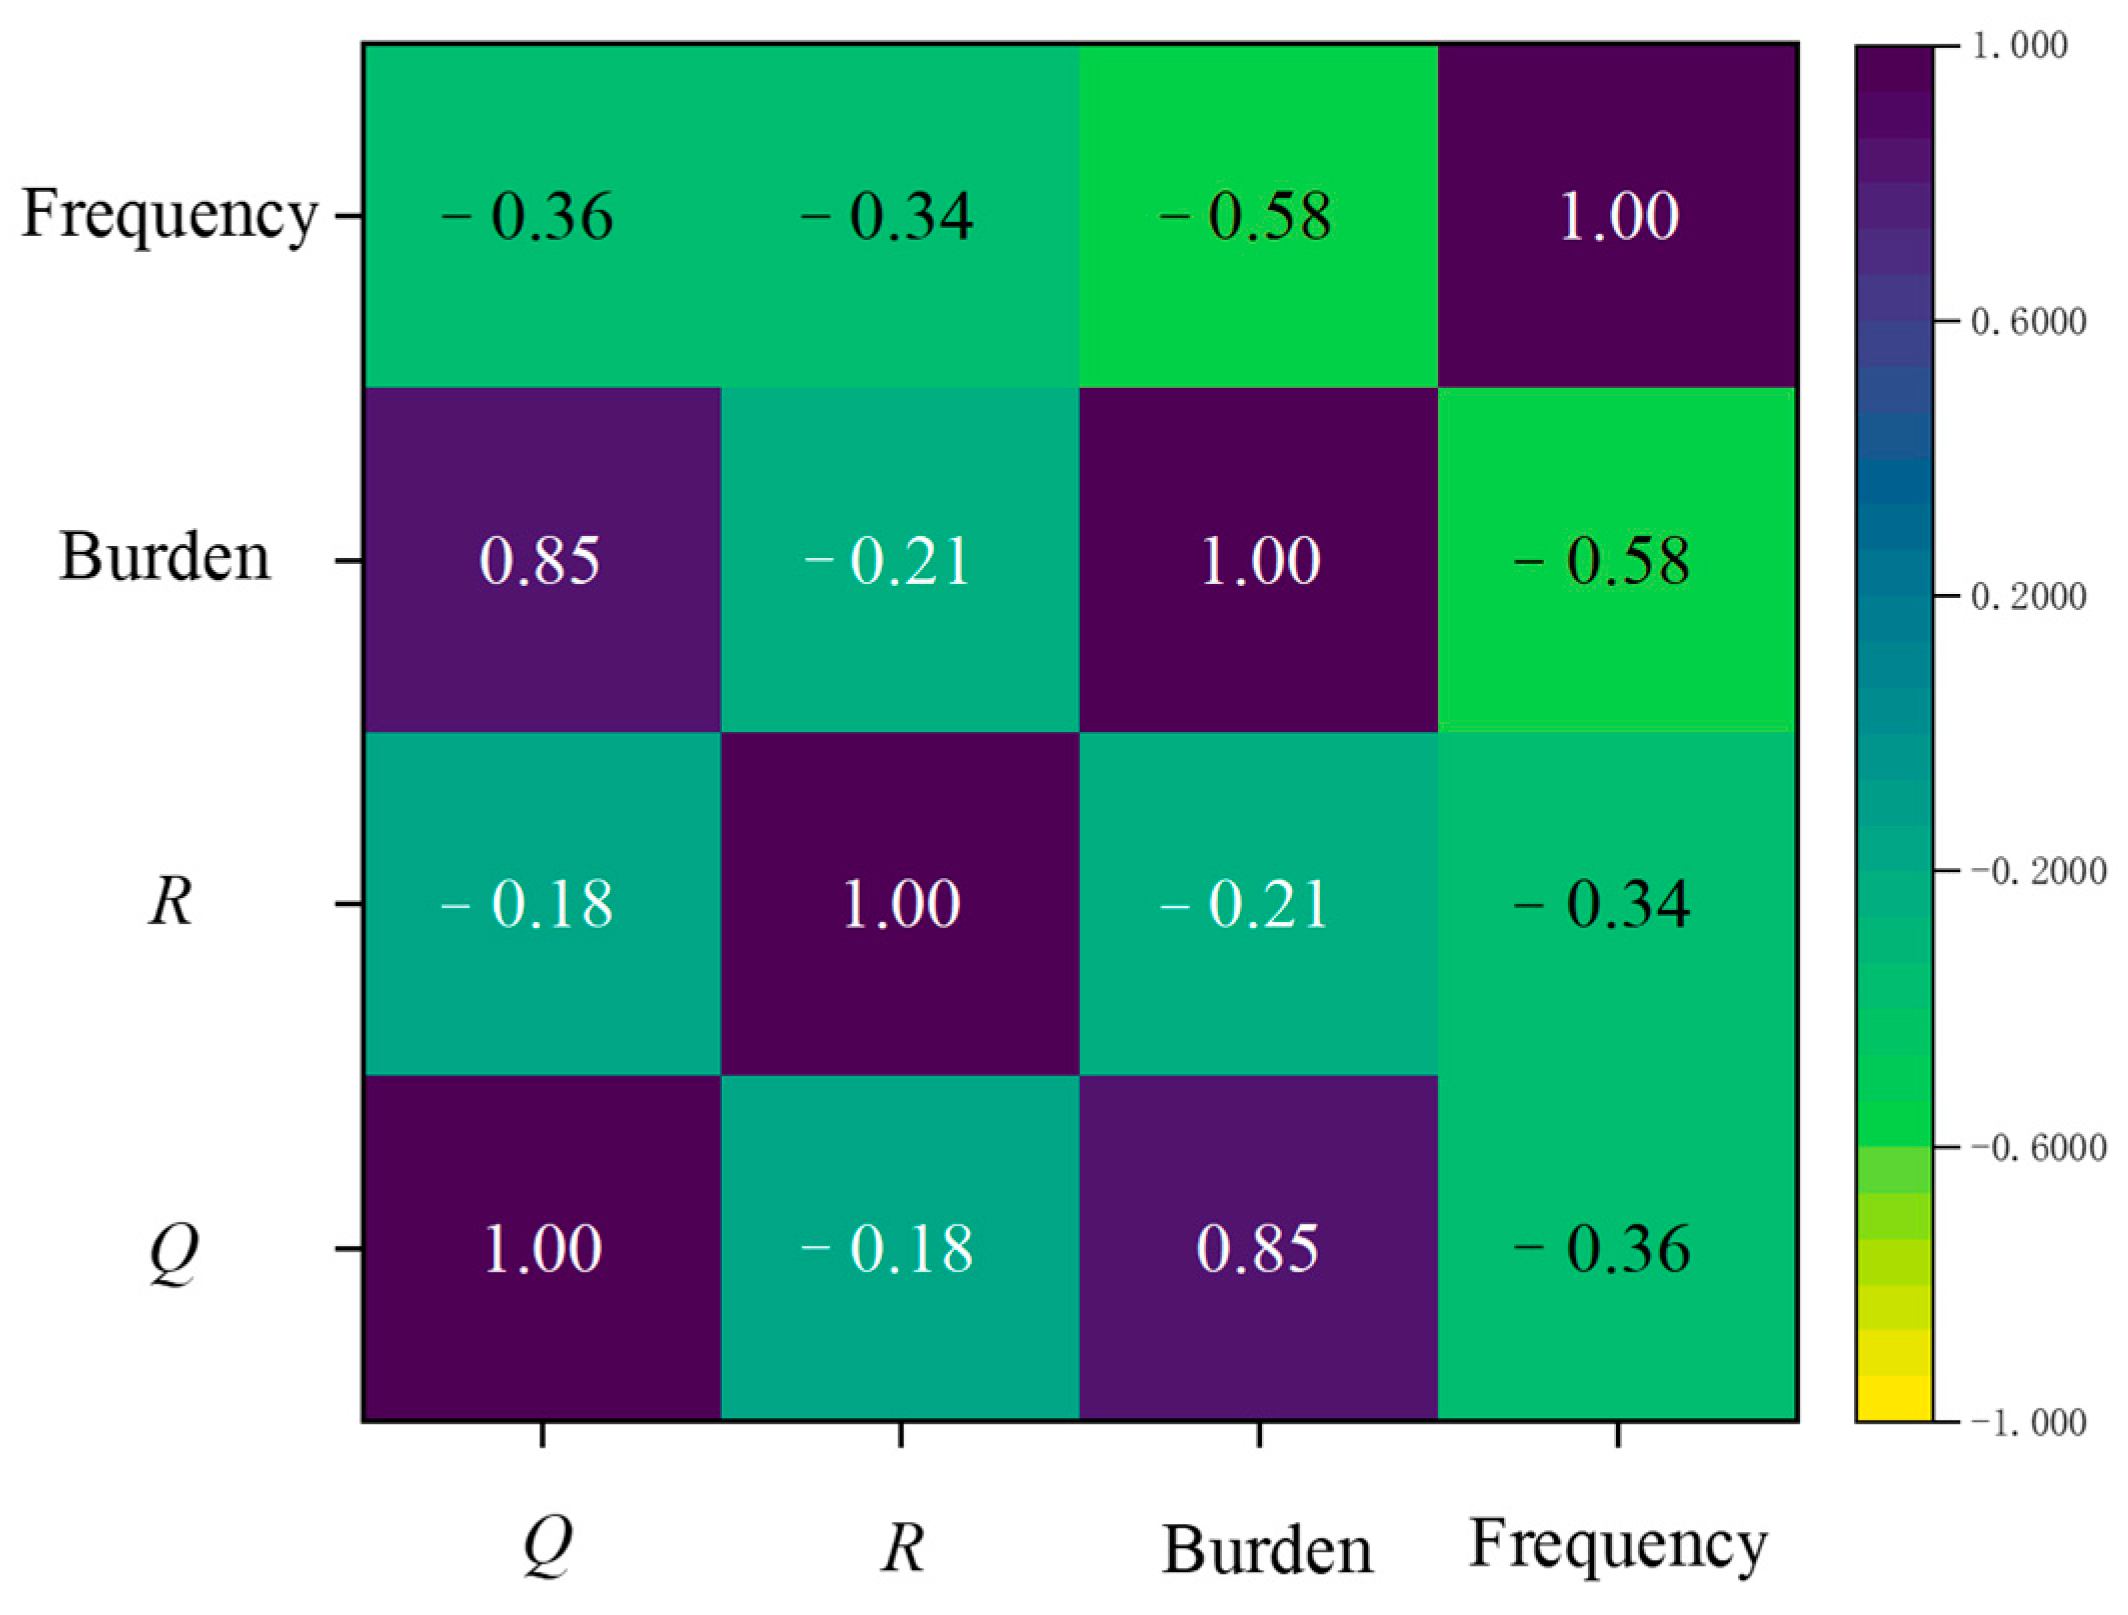
- An increase in the number of delay segments causes the vibration signal energy to concentrate in the mid-high frequency range, resulting in an increase in the dominant frequency. An increase in R and burden leads to a decrease in the dominant frequency. Additionally, increases in hole diameter, the number of free surfaces, maximum charge quantity, and elevation raise the dominant frequency. Furthermore, the hardness, density, and elastic modulus of the rock, as well as the damping effect of the medium, significantly affect the vibration propagation characteristics. However, research on factors such as borehole parameters, free face, charge coefficient, and delay time remains limited and requires further exploration. An in-depth study of these factors is essential to achieve precise blasting control, avoid excessive material or energy consumption, and ultimately enhance the sustainability of the blasting industry. Future research could systematically study the impact of geological conditions, blasting parameters, and other factors on vibrations by designing different types of blasting experiments. For example, variables such as Q, R, and delay time could be varied in the experiment while controlling geological conditions (e.g., rock type, porosity, stratification), and the effects of these factors on vibration frequency, amplitude, and attenuation patterns could be observed. Reliable data collected from multiple experiments would provide a solid foundation for subsequent model development. In terms of field measurements, it is recommended to use high-precision vibration sensors for multi-point synchronized measurements, particularly in different locations near and far from the blast source, to ensure comprehensive capture of frequency variations during the vibration propagation process. At the same time, integrating real-time monitoring systems to dynamically track the time–frequency characteristics of vibrations would help acquire richer vibration data. Advanced technologies such as 3D seismic exploration and fiber-optic sensors could be used for data collection, providing more comprehensive geological information and blasting data. In terms of data modeling methods, combining ML, deep learning, and other advanced technologies can improve the predictive accuracy for complex blast vibration characteristics. For example, ML methods could be used to train and validate predictive models for blast vibrations, integrating traditional physical models with modern statistical methods to offer more comprehensive support for vibration prediction models, thereby enhancing the reliability and accuracy of prediction results.
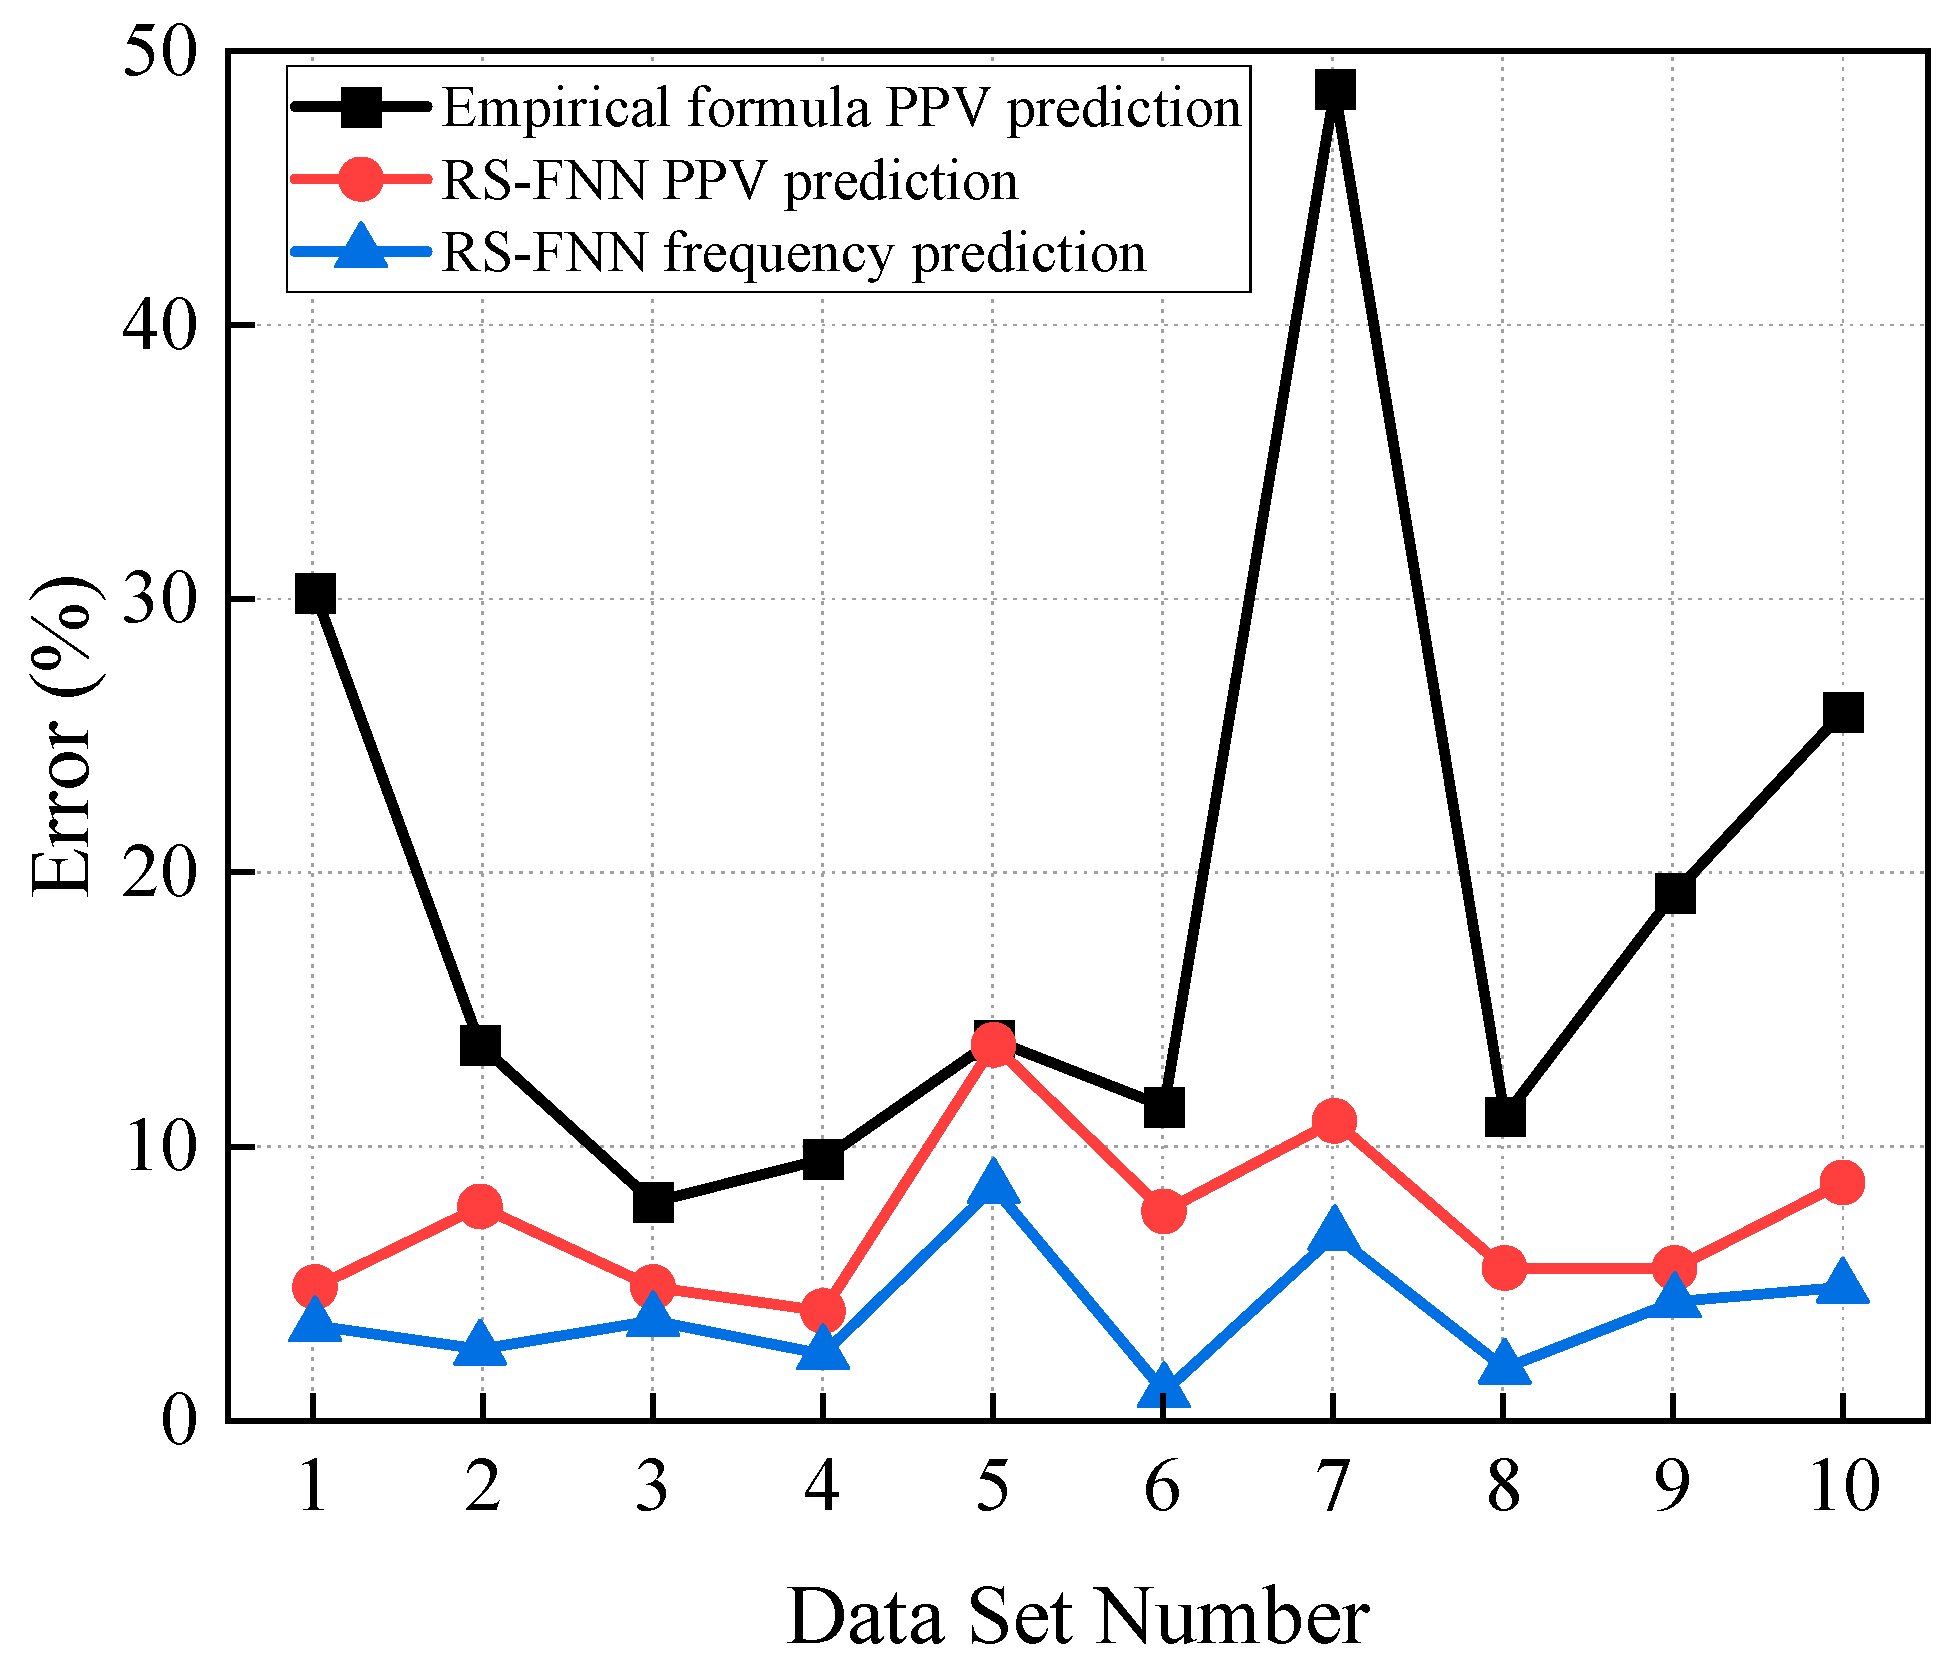
- Existing dominant frequency equations are primarily based on the Sadove formula, which only considers a few factors, such as R and charge quantity, limiting their prediction accuracy and applicability. In contrast, ML algorithms have significantly improved the accuracy of dominant frequency prediction, although issues related to algorithm complexity and limitations still need to be addressed. In the future, a large-scale database should be established, widely applicable for predicting open-pit mining blasts, to prevent the fundamental frequency from approaching the natural frequency of structures, reducing the potential threats of blasting to the environment and buildings, and ensuring the sustainable development of blasting engineering.
- To enhance the accuracy and safety of the blasting design, multiple influencing factors (such as charge weight, charge structure, initiation sequence, geological conditions, and R) are comprehensively considered and incorporated into the dominant frequency prediction model. Based on the prediction results, engineers can adjust the charge weight and charge structure to achieve the ideal vibration frequency range, thereby reducing the risk of damage to surrounding structures. Optimizing the initiation sequence and delay time helps to reduce the superimposition effect of vibration waves, further decreasing the impact on the surrounding environment. Geological conditions play an important role in the propagation and attenuation of vibration frequencies. By considering the influence of geological conditions, engineers can more accurately assess the variation of vibration frequencies under different geological conditions and adjust the blasting design to suit the specific geological environment.
Author Contributions
Funding
Data Availability Statement
Conflicts of Interest
Abbreviation
| PPV | Peak particle velocity |
| R | The distance from the explosion source to the monitored location |
| fV | Zero-cross dominant frequency |
| TV | Period |
| fd | Fourier Dominant Frequency |
| F(ω) | Fourier amplitude spectrum |
| ω | Angular velocity |
| v(t) | The vibration time profile |
| fc | Centroid frequency |
| fi | The individual frequency in the Fourier amplitude spectrum |
| A(fi) | The corresponding amplitude of the vibrational velocity spectrum |
| Q | Charge weight |
| HD, d | Borehole diameter |
| f | The dominant vibration frequency |
| a, a2 | Constants to be determined |
| Kf | The frequency coefficient |
| Cs | The transverse wave velocity of the rock |
| K(k), α, β, bs, as | Coefficients related to topographic and geologic conditions |
| Cp | The longitudinal wave velocity in the rock mass |
| H | The difference in elevation from the center of the explosion source to the measurement point |
| ρ | The rock density |
| AI | Artificial Intelligence |
| ANN | Artificial Neural Network |
| R2 | Correlation coefficient |
| hd | The hole depth |
| B | burden |
| S | Spacing |
| Qmax | The maximum charge per delay |
| BI | The geotechnical index |
| E | The Young’s modulus |
| v | The Poisson’s ratio |
| Pv | The P-wave velocity |
| VOD | The velocity of detonation of explosive |
| SVM | Support Vector Machine |
| ANFIS | Adaptive Neuro-Fuzzy Inference System |
| MAPE | Mean Absolute Percentage Error |
| GEP | Gene Expression Programming |
| RF | Random Forest |
| ML | Machine Learning |
References
- Lu, W.; Yang, J.; Chen, M.; Zhou, C. An Equivalent Method for Blasting Vibration Simulation. Simul. Model. Pract. Theory 2011, 19, 2050–2062. [Google Scholar] [CrossRef]
- Parida, A.; Mishra, M.K. Blast Vibration Analysis by Different Predictor Approaches-A Comparison. Procedia Earth Planet. Sci. 2015, 11, 337–345. [Google Scholar] [CrossRef]
- Bao, S.; Fei, H.; Hu, G. Characteristics and Energy Distribution of Blast-Induced Ground Vibration in Deep-Hole Blasting. Buildings 2023, 13, 899. [Google Scholar] [CrossRef]
- Hu, Y.; Lu, W.; Wu, X.; Liu, M.; Li, P. Numerical and Experimental Investigation of Blasting Damage Control of a High Rock Slope in a Deep Valley. Eng. Geol. 2018, 237, 12–20. [Google Scholar] [CrossRef]
- Komadja, G.C.; Rana, A.; Glodji, L.A.; Anye, V.; Jadaun, G.; Onwualu, P.A.; Sawmliana, C. Assessing Ground Vibration Caused by Rock Blasting in Surface Mines Using Machine-Learning Approaches: A Comparison of CART, SVR and MARS. Sustainability 2022, 14, 11060. [Google Scholar] [CrossRef]
- Bayat, P.; Monjezi, M.; Mehrdanesh, A.; Khandelwal, M. Blasting Pattern Optimization Using Gene Expression Programming and Grasshopper Optimization Algorithm to Minimise Blast-Induced Ground Vibrations. Eng. Comput. 2022, 38, 3341–3350. [Google Scholar] [CrossRef]
- Li, G.; Kumar, D.; Samui, P.; Rad, H.N.; Roy, B.; Hasanipanah, M. Developing a New Computational Intelligence Approach for Approximating the Blast-Induced Ground Vibration. Appl. Sci. 2020, 10, 434. [Google Scholar] [CrossRef]
- Fu, B.; Ji, H.; Pei, J.; Wei, J. Numerical Computation-Based Analysis of Blasting Vibration Effects and Slope Stability in an Open-Pit Quarry. Fire 2024, 7, 420. [Google Scholar] [CrossRef]
- Jiang, N.; Zhou, C.; Lu, S.; Zhang, Z. Propagation and Prediction of Blasting Vibration on Slope in an Open Pit during Underground Mining. Tunn. Undergr. Sp. Technol. 2017, 70, 409–421. [Google Scholar] [CrossRef]
- Yan, Y.; Guo, J.; Bao, S.; Fei, H. Prediction of Peak Particle Velocity Using Hybrid Random Forest Approach. Sci. Rep. 2024, 14, 30793. [Google Scholar] [CrossRef]
- He, L.; Kong, D.; Lei, Z. Research on Vibration Propagation Law and Dynamic Effect of Bench Blasting. Mathematics 2022, 10, 2951. [Google Scholar] [CrossRef]
- Simangunsong, G.M.; Wahyudi, S. Effect of Bedding Plane on Prediction Blast-Induced Ground Vibration in Open Pit Coal Mines. Int. J. Rock Mech. Min. Sci. 2015, 79, 1–8. [Google Scholar] [CrossRef]
- Kumar, R.; Choudhury, D.; Bhargava, K. Determination of Blast-Induced Ground Vibration Equations for Rocks Using Mechanical and Geological Properties. J. Rock Mech. Geotech. Eng. 2016, 8, 341–349. [Google Scholar] [CrossRef]
- Murmu, S.; Maheshwari, P.; Verma, H.K. Empirical and Probabilistic Analysis of Blast-Induced Ground Vibrations. Int. J. Rock Mech. Min. Sci. 2018, 103, 267–274. [Google Scholar] [CrossRef]
- Cai, C.; Qian, Q.; Fu, Y. Application of Bas-Elman Neural Network in Prediction of Blasting Vibration Velocity. Procedia Comput. Sci. 2020, 166, 491–495. [Google Scholar] [CrossRef]
- Fissha, Y.; Ikeda, H.; Toriya, H.; Adachi, T.; Kawamura, Y. Application of Bayesian Neural Network (BNN) for the Prediction of Blast-Induced Ground Vibration. Appl. Sci. 2023, 13, 3128. [Google Scholar] [CrossRef]
- Arthur, C.K.; Bhatawdekar, R.M.; Mohamad, E.T.; Sabri, M.M.S.; Bohra, M.; Khandelwal, M.; Kwon, S. Prediction of Blast-Induced Ground Vibration at a Limestone Quarry: An Artificial Intelligence Approach. Appl. Sci. 2022, 12, 9189. [Google Scholar] [CrossRef]
- Shirani Faradonbeh, R.; Jahed Armaghani, D.; Abd Majid, M.Z.; MD Tahir, M.; Ramesh Murlidhar, B.; Monjezi, M.; Wong, H.M. Prediction of Ground Vibration Due to Quarry Blasting Based on Gene Expression Programming: A New Model for Peak Particle Velocity Prediction. Int. J. Environ. Sci. Technol. 2016, 13, 1453–1464. [Google Scholar] [CrossRef]
- Khandelwal, M. Evaluation and Prediction of Blast-Induced Ground Vibration Using Support Vector Machine. Int. J. Rock Mech. Min. Sci. 2010, 47, 509–516. [Google Scholar] [CrossRef]
- Singh, T.N.; Dontha, L.K.; Bhardwaj, V. Study into Blast Vibration and Frequency Using ANFIS and MVRA. Trans. Inst. Min. Metall. Sect. A Min. Technol. 2008, 117, 116–121. [Google Scholar] [CrossRef]
- Hasanipanah, M.; Faradonbeh, R.S.; Amnieh, H.B.; Armaghani, D.J.; Monjezi, M. Forecasting Blast-Induced Ground Vibration Developing a CART Model. Eng. Comput. 2017, 33, 307–316. [Google Scholar] [CrossRef]
- Shang, Y.; Nguyen, H.; Bui, X.N.; Tran, Q.H.; Moayedi, H. A Novel Artificial Intelligence Approach to Predict Blast-Induced Ground Vibration in Open-Pit Mines Based on the Firefly Algorithm and Artificial Neural Network. Nat. Resour. Res. 2020, 29, 723–737. [Google Scholar] [CrossRef]
- Ding, X.; Hasanipanah, M.; Nikafshan Rad, H.; Zhou, W. Predicting the Blast-Induced Vibration Velocity Using a Bagged Support Vector Regression Optimized with Firefly Algorithm. Eng. Comput. 2021, 37, 2273–2284. [Google Scholar] [CrossRef]
- Chen, W.; Hasanipanah, M.; Nikafshan Rad, H.; Jahed Armaghani, D.; Tahir, M.M. A New Design of Evolutionary Hybrid Optimization of SVR Model in Predicting the Blast-Induced Ground Vibration. Eng. Comput. 2021, 37, 1455–1471. [Google Scholar] [CrossRef]
- Bui, X.N.; Nguyen, H.; Tran, Q.H.; Nguyen, D.A.; Bui, H.B. Predicting Ground Vibrations Due to Mine Blasting Using a Novel Artificial Neural Network-Based Cuckoo Search Optimization. Nat. Resour. Res. 2021, 30, 2663–2685. [Google Scholar] [CrossRef]
- Roy, M.P.; Singh, P.K.; Sarim, M.; Shekhawat, L.S. Blast Design and Vibration Control at an Underground Metal Mine for the Safety of Surface Structures. Int. J. Rock Mech. Min. Sci. 2016, 83, 107–115. [Google Scholar] [CrossRef]
- Lu, W.B.; Luo, Y.; Chen, M.; Shu, D.Q. An Introduction to Chinese Safety Regulations for Blasting Vibration. Environ. Earth Sci. 2012, 67, 1951–1959. [Google Scholar] [CrossRef]
- Liu, D.; Lu, W.; Liu, Y.; Chen, M.; Yan, P.; Sun, P. Analysis of the Main Factors Influencing the Dominant Frequency of Blast Vibration. Shock Vib. 2019, 2019, 8480905. [Google Scholar] [CrossRef]
- Singh, P.K.; Roy, M.P. Damage to Surface Structures Due to Blast Vibration. Int. J. Rock Mech. Min. Sci. 2010, 47, 949–961. [Google Scholar] [CrossRef]
- Monjezi, M.; Ghafurikalajahi, M.; Bahrami, A. Prediction of Blast-Induced Ground Vibration Using Artificial Neural Networks. Tunn. Undergr. Sp. Technol. 2011, 26, 46–50. [Google Scholar] [CrossRef]
- Álvarez-Vigil, A.E.; González-Nicieza, C.; López Gayarre, F.; Álvarez-Fernández, M.I. Predicting Blasting Propagation Velocity and Vibration Frequency Using Artificial Neural Networks. Int. J. Rock Mech. Min. Sci. 2012, 55, 108–116. [Google Scholar] [CrossRef]
- Nateghi, R. Evaluation of Blast Induced Ground Vibration for Minimizing Negative Effects on Surrounding Structures. Soil Dyn. Earthq. Eng. 2012, 43, 133–138. [Google Scholar] [CrossRef]
- Karadogan, A.; Kahriman, A.; Ozer, U. A New Damage Criteria Norm for Blast-Induced Ground Vibrations in Turkey. Arab. J. Geosci. 2014, 7, 1617–1626. [Google Scholar] [CrossRef]
- GB6722-2014; Safety Regulations for Blasting. Standards Press of China: Beijing, China, 2014.
- Triviño, L.F.; Mohanty, B.; Milkereit, B. Seismic Waveforms from Explosive Sources Located in Boreholes and Initiated in Different Directions. J. Appl. Geophys. 2012, 87, 81–93. [Google Scholar] [CrossRef]
- Sun, P.; Lu, W.; Zhou, J.; Huang, X.; Chen, M.; Li, Q. Comparison of Dominant Frequency Attenuation of Blasting Vibration for Different Charge Structures. J. Rock Mech. Geotech. Eng. 2022, 14, 448–459. [Google Scholar] [CrossRef]
- Aldas, G.G.U. Explosive Charge Mass and Peak Particle Velocity (PPV)-Frequency Relation in Mining Blast. J. Geophys. Eng. 2010, 7, 223–231. [Google Scholar] [CrossRef]
- Kahriman, A. Analysis of Ground Vibrations Caused by Bench Blasting at Can Open-Pit Lignite Mine in Turkey. Environ. Geol. 2002, 41, 653–661. [Google Scholar] [CrossRef]
- Baoquan, G. Time-Domain Analysis and Research on Blasting Vibration Signals Based on Fourier Transform. In Proceedings of the 2011 International Conference on Electronic & Mechanical Engineering and Information Technology, Harbin, China, 12–14 August 2011; Volume 1, pp. 466–469. [Google Scholar] [CrossRef]
- Wang, H.; Bo, H.; Zhao, Y.; Wang, S. Analysis of Blasting Vibration Signals Based on FDM. Eng. Blasting 2022, 28, 7–13+24. [Google Scholar] [CrossRef]
- Wang, T.; Lin, M.; Zeng, Y.; Gu, C.; Qin, M.; Fu, X. Extraction and Analysis of Time-Frequency Characteristics of Blasting Signals in Open-Pit Mines. J. Sanming Univ. 2020, 37, 71–76. [Google Scholar] [CrossRef]
- Chakraborty, A.; Okaya, D. Frequency-Time Decomposition of Seismic Data Using Wavelet-Based Methods. Geophysics 2014, 60, 1058–1065. [Google Scholar] [CrossRef]
- Parameswariah, C.; Cox, M. Frequency Characteristics of Wavelets. IEEE Trans. Power Deliv. 2002, 17, 800–804. [Google Scholar] [CrossRef]
- Yan, J.; Long, Y.; Fang, X.; Zhou, C. Characterisation of Energy Distribution of Blast Vibration Signals Based on Wavelet Transforms. Explos. Shock Waves 2007, 5, 405–410. [Google Scholar]
- Huang, N.E. A New Method For Nonlinear And Nonstationary Time SeriesAnalysis:Empirical Mode Decomposition and Hilbert Spectral Analysis. Wavelet Appl. VII 2000, 4056, 197–209. [Google Scholar] [CrossRef]
- Liu, X.; Yuan, H.; Zheng, X.; Wang, Z. Time-Frequency and Energy Analysis of Blasting Vibration Signal Based on HHT Method. J. Hefei Univ. Technol. Sci. 2019, 42, 779–784. [Google Scholar] [CrossRef]
- Dong, E.; An, L.; Li, Y.; Wu, C. Hilbert Spectrum Analysis Method of Blast Vibration Signal Based on HHT Instantaneous Phase Optimization. Appl. Acoust. 2022, 192, 108732. [Google Scholar] [CrossRef]
- Yuan, P.; Xu, Y.; Zheng, Z. Time-Frequency Analyses of Blasting Vibration Signals in Single-Hole Blasting Model Experiments. J. Vibroengineering 2017, 19, 363–375. [Google Scholar] [CrossRef]
- Fei, H.; Guo, J.; Ren, G.; Jing, G.; Chen, K.; Ding, W. Optimization and Application of Blasting Parameters for Two-Stagepillar Recovery Adjacent to Large Goafs. Eng. Blasting 2024, 30, 125–142. [Google Scholar] [CrossRef]
- Yang, J.H.; Lu, W.B.; Jiang, Q.H.; Yao, C.; Zhou, C.B. Frequency Comparison of Blast-Induced Vibration per Delay for the Full-Face Millisecond Delay Blasting in Underground Opening Excavation. Tunn. Undergr. Sp. Technol. 2016, 51, 189–201. [Google Scholar] [CrossRef]
- Zhang, Q.; Wang, J.; Li, D.; Liu, W.; Wang, X. Grey Correlation Method in the Application of Influence Factors Analysis of Open-Pit Mine Blasting Vibration. Liaoning Tech. Univ. (Nat. Sci.) 2013, 32, 1334–1338. [Google Scholar] [CrossRef]
- Zhao, X.; Chen, G.; Huang, H. Application of Grey Correlation Analysis in the Control of BlastingVibration Effects. Explos. Mater. 2008, 37, 34–38. [Google Scholar]
- Sharpe, J.A. The Effect of Charge Size on Reflection Records. Geophysics 1994, 9, 131–142. [Google Scholar] [CrossRef]
- Fan, L.; Shen, W. Experimental Study on Frequency Spectrum Characteristics of Blast Vibration Wave. Blasting 2001, 18, 18–20. [Google Scholar]
- Zhong, G.; Ao, L.; Zhao, K. Influence of Explosion Parameters on Wavelet Packet Frequency Band Energy Distribution of Blast Vibration. J. Cent. South Univ. 2012, 19, 2674–2680. [Google Scholar] [CrossRef]
- Ling, T.H.; Li, X.B. Influence of Maximum Decking Charge on Intensity of Blasting Vibration. J. Cent. South Univ. Technol. (Engl. Ed.) 2006, 13, 286–289. [Google Scholar] [CrossRef]
- Ling, T.; Li, X.; Dai, T.; Peng, Z. Features of Energy Distribution for Blast Vibration Signals Based on Wavelet Packet Decomposition. J. Cent. South Univ. Technol. 2005, 12, 135–140. [Google Scholar] [CrossRef]
- Shi, X.; Chen, S. Explosive Blasted per Delay and Burden Effects on the Time-Frequency Characteristic of Vibration Induced by Blast. J. China Coal Soc. 2009, 34, 345–349. [Google Scholar]
- Hu, D.-D.; Cheng, K.; Liu, Y.; Wu, Q.-T. Discussion of Blasting Vibration Effect on Frequency Factor Condition. Blasting 2012, 29, 127–130. [Google Scholar] [CrossRef]
- Moszynski, J.R. The Dynamics of Explosion and Its Use. Nucl. Technol. 1983, 60, 167. [Google Scholar] [CrossRef]
- Zhou, J.; Lu, W.; Yan, P.; Chen, M.; Wang, G. Frequency-Dependent Attenuation of Blasting Vibration Waves. Rock Mech. Rock Eng. 2016, 49, 4061–4072. [Google Scholar] [CrossRef]
- Aftabi, M.; Motamedi, M.H.; Molladavoodi, H. A Study on Parameters Influencing Blast-Induced Frequency Content and Dominant Frequency Attenuation. Shock Vib. 2022, 2022, 7–10. [Google Scholar] [CrossRef]
- Chen, G.; Li, L.; Li, Y. Rule for Dominant Frequency Band of Blasting Vibration Varying with Propagation Distance. Min. Metall. Eng. 2018, 38, 15–19. [Google Scholar] [CrossRef]
- Li, X.B.; Ling, T.H. Response Spectrum Analysis of Ground Vibration Induced by Single Deck and Multi-Deck Blasting. Chin. J. Rock Mech. Eng. 2005, 24, 2409–2413. [Google Scholar]
- Sun, S. Study on the Influence of Different Size ResistanceLines on the Attenuation of Blasting Seismic Waves; Guizhou University: Guiyang, China, 2020. [Google Scholar]
- Tian, X.; Song, Z.; Wang, J. Study on the Propagation Law of Tunnel Blasting Vibration in Stratum and Blasting Vibration Reduction Technology. Soil Dyn. Earthq. Eng. 2019, 126, 105813. [Google Scholar] [CrossRef]
- Zhou, J.; Lu, W.; Zhang, L.; Chen, M.; Yan, P. Attenuation of Vibration Frequency during Propagation of Blasting Seismic Wave. Yanshilixue Yu Gongcheng Xuebao/Chin. J. Rock Mech. Eng. 2014, 33, 2171–2178. [Google Scholar] [CrossRef]
- Shi, C.; Zhao, X.; Jiang, H.; Li, Y. Frequency Band Energy Distribution Characteristics of Blasting Vibration Signals. Met. Mine 2014, 8, 6–10. [Google Scholar]
- Tian, Y.; Li, Z.; Wang, X.; Yu, Y. Spectra Character Istics of Blasting Vibration Wave from Foundation Pit Excavation. Blasting 2005, 22, 29–31, 50. [Google Scholar]
- Chiappetta, R.F. Blast Monitoring Instrumentation and Analysis Techniques, with an Emphasis on Field Applications. Fragblast 1998, 2, 79–122. [Google Scholar] [CrossRef]
- Katsabanis, P.D.; Tawadrous, A.; Braun, C.; Kennedy, C. Timing Effects on the Fragmentation of Small Scale Blocks of Granodiorite. Fragblast 2006, 10, 83–93. [Google Scholar] [CrossRef]
- Shi, X.Z.; Chen, S.R. Delay Time Lnterval Effect for the Time-Frequency Characteristic of Blast Vibration Signal. J. Hunan Univ. Sci. Technol. Sci. Ed. 2008, 23, 10–13. [Google Scholar]
- Zhao, M.; Zhang, J.; Yi, C. Time-Frequency Characteristics of Blasting Vibration Signals Measured in Milliseconds. Min. Sci. Technol. 2011, 21, 349–352. [Google Scholar] [CrossRef]
- Lou, X.; Zhou, W.; Jian, W.; Zheng, J. Control of Delay Time Characterized by Distribution of Peak Velocity Displacement Vibration of Millisecond Blasting. Explos. Shock Waves 2016, 36, 839–846. [Google Scholar] [CrossRef]
- Ma, Q.Y.; Yuan, P.; Zhang, J.S.; Han, B. Blasting Vibration Measurement and Analyses of Millisecond Blasting Models for Vertical Shaft Blasting. J. Vib. Shock 2015, 34, 172–176. [Google Scholar] [CrossRef]
- Peng, C.M. Application of a Combined Blasting Technique for Reducing Vibration in a Large Openpit Mine. Nonferrous Met. Eng. 2015, 5, 165–168. [Google Scholar]
- Zhang, Z.; Luan, L.; Yin, Z.; Miao, Y. Effects of Detonation Ways on Energy Distribution for Different Frequency Bands of Bench Blasting. Blasting. 2008, 2, 21–25. [Google Scholar]
- Duan, J.; Zong, Q.; Wang, H.; Wang, H. Study on Influence of Initiation Sequence on Fragmentation of Step Rock and Blasting Vibration. China Saf. Sci. J. 2024, 34, 192–199. [Google Scholar] [CrossRef]
- Li, X.; Wang, S.; Gao, H. Analysis of Factors Affecting Blasting Vibration Frequency. J. Liaoning Tech. Univ. Sci. 2006, 25, 204–206. [Google Scholar]
- Blair, D. Seismic Radiation from an Explosive Column. Geophysics 2010, 75, E55–E65. [Google Scholar] [CrossRef]
- Yan, Y.; Hou, X.; Fei, H. Review of Predicting the Blast-Induced Ground Vibrations to Reduce Impacts on Ambient Urban Communities. J. Clean. Prod. 2020, 260, 121135. [Google Scholar] [CrossRef]
- Liang, H.; Ding, S.; Xu, R.; Han, F.; Wu, C. The Influence of Borehole Diameter on Blasting Vibration. Min. Technol. 2016, 14, 144–147. [Google Scholar] [CrossRef]
- Xu, R.; Liang, H.; Wu, C. Wavelet Analysis of Energy Characteristics of Blasting Vibration Bands with Different Borehole Diameters. Min. Technol. 2016, 16, 62–66. [Google Scholar] [CrossRef]
- Lu, W.; Leng, Z.; Hu, H.; Chen, M.; Wang, G. Experimental and Numerical Investigation of the Effect of Blast-Generated Free Surfaces on Blasting Vibration. Eur. J. Environ. Civ. Eng. 2018, 22, 1374–1398. [Google Scholar] [CrossRef]
- Blair, D.P. The Free Surface Influence on Blast Vibration. Int. J. Rock Mech. Min. Sci. 2015, 77, 182–191. [Google Scholar] [CrossRef]
- Jianping, Z. Experimental Research on Effects of Free Surface Quantity on Blasting Vibration Laws. Mod. Min. 2009, 25, 46–48. [Google Scholar]
- Wu, C.; Xu, R.; Zhang, Q. Influence of Free Surface on Energy Distribution Characteristics of Blasting Vibration. Explos. Shock Waves 2017, 37, 907–914. [Google Scholar] [CrossRef]
- Yang, J.H.; Lu, W.B.; Yan, P.; Jiang, Q.H.; Zhou, C.B. Influences of Blast-Created Free Surfaces on Blasting Vibration Frequencies during Full-Face Excavation. J. Vib. Shock 2016, 35, 192–197. [Google Scholar] [CrossRef]
- Chi, E.; Zhao, M.; Liang, K.; Kang, Q.; Wei, X. Influence of Number of Free Surface on Time-Frequency Characteristics of Blasting Seismic Wave. Blasting 2013, 30, 16–20. [Google Scholar] [CrossRef]
- Uysal, Ö.; Arpaz, E.; Berber, M. Studies on the Effect of Burden Width on Blast-Induced Vibration in Open-Pit Mines. Environ. Geol. 2007, 53, 643–650. [Google Scholar] [CrossRef]
- Li, J.; Zhao, M.; Ouyang, Y. Study on the Influence of Resistance Line on the Attenuation Law of Blasting Seismic Wave. Min. Res. Dev. 2021, 41, 15–19. [Google Scholar] [CrossRef]
- Zhang, Z.Y.; Ding, F.; Li, H.C.; Huang, Y.H.; Xie, S.K. Study on the Effect of Minimum Resistance Line OnBlasting Effect of Bench Model. Trans. Beijing Inst. Technol. 2020, 40, 129–134. [Google Scholar] [CrossRef]
- Leidig, M.; Bonner, J.L.; Rath, T.; Murray, D. Quantification of Ground Vibration Differences from Well-Confined Single-Hole Explosions with Variable Velocity of Detonation. Int. J. Rock Mech. Min. Sci. 2010, 47, 42–49. [Google Scholar] [CrossRef]
- Xue, B.; Ling, J.; Chen, H.; Zhang, Y.; Zhao, J.; Liao, X.; Lin, M. Comparative Study on Blasting Vibration Characteristics of Base Gun Propellant and Emulsion Explosive. Blasting 2022, 39, 145–150+208. [Google Scholar] [CrossRef]
- Chai, X. Effects of Different Explosive Properties on Blast Vibration. Explos. Shock Waves 2011, 31, 548–552. [Google Scholar]
- Tripathy, G.R.; Gupta, I.D. Prediction of Ground Vibrations Due to Construction Blasts in Different Types of Rock. Rock Mech. Rock Eng. 2002, 35, 195–204. [Google Scholar] [CrossRef]
- Ma, G.; Hao, H.; Zhou, Y. Assessment of Structure Damage to Blasting Induced Ground Motions. Eng. Struct. 2000, 22, 1378–1389. [Google Scholar] [CrossRef]
- Zhang, S.; Gao, W.; Yan, L.; Liu, J.; Liu, L. The Characteristics of Blasting Vibration Frequency Bands in Jointed Rock Mass Slope. Environ. Earth Sci. 2020, 79, 519. [Google Scholar] [CrossRef]
- Song, G.; Zeng, X.; Chen, S.; Wu, C. Influence of Propagation Medium Property on Time-Frequency Characteristics of Blasting Vibration with Wavelet Packets Analysis. Eng. Blasting 2003, 9, 64–68. [Google Scholar]
- Yang, R.; Yan, P.; Lu, W.; Chen, M.; Wang, G. Effect of Crustal Stress Level on Frequency Characteristics of Blasting Vibration. Eng. Blasting 2016, 22, 50–56. [Google Scholar] [CrossRef]
- Yang, J.; Lu, W.; Jiang, Q.; Yao, C.; Jiang, S.; Tian, L. A Study on the Vibration Frequency of Blasting Excavation in Highly Stressed Rock Masses. Rock Mech. Rock Eng. 2016, 49, 2825–2843. [Google Scholar] [CrossRef]
- Liu, C.; Wang, W.; Li, Q.; Li, Z. Analysis of Blasting Vibration Attenuation Effect of Negative Elevation Difference. Eng. Blasting 2020, 26, 100–106. [Google Scholar]
- Zhang, S.; Liu, L.; Zhong, Q.; Qiu, J.; Zhong, W. Energy Distribution Characteristics of Blast Seismic Wave on Open Pit Slope. J. Vib. Shock 2019, 38, 224–232. [Google Scholar] [CrossRef]
- Savage, J.C. Thermoelastic Attenuation of Elastic Waves by Cracks. J. Geophys. Res. 1966, 71, 3929–3938. [Google Scholar] [CrossRef]
- Jiao, Y. A Preliminary Study of Seismic Safety Assessment Criteria for Blasting. Blasting 1995, 12, 45–47. [Google Scholar]
- Tang, C.; Yu, Y.; Wang, J. A Preliminary Discussion on the Safety Judgment of Ground Vibration of Blasting. Nonferrous Met. Eng. 2001, 1, 1–4. [Google Scholar]
- Zhang, L.; Gong, M.; Yu, Y. Forecast and Regression Analysis of Blasting Vibration Frequency. J. Liaoning Tech. Univ. Sci. 2005, 24, 187–189. [Google Scholar]
- Gao, F.; Hou, A.; Yang, X.; Yang, J. Analysis of Blasting Vibration Frequency Based on Dimensional Method. Blasting. 2010, 27, 1–3+8. [Google Scholar]
- Meng, H.; Guo, F. Experimental Research on the Master Frequency of Blasting Seismic Wave. J. Railw. Eng. Soc. 2009, 26, 81–83, 93. [Google Scholar]
- Lu, W.; Zhou, J.; Chen, M.; Yan, P.; Wang, G. Study on Attenuation Formula of Dominant Frequency of Blasting Vibration. Eng. Blasting 2015, 21, 1–6+24. [Google Scholar] [CrossRef]
- Peng, Y.X.; Wu, L.; Su, Y.; Chen, C.H. Study on the Effect of Elevation on the Prediction of Underwater Drill and Blasting Vibration Frequency. Geosystem Eng. 2016, 19, 170–176. [Google Scholar] [CrossRef]
- Yongqing, W.; Xiaolin, W.; Bairu, X.; Shouru, C. Study on Forecast of Blasting Seismotic Frequency. Blasting. 2007, 24, 17–20. [Google Scholar]
- Onifade, M.; Lawal, A.I.; Aladejare, A.E.; Bada, S.; Idris, M.A. Prediction of Gross Calorific Value of Solid Fuels from Their Proximate Analysis Using Soft Computing and Regression Analysis. Int. J. Coal Prep. Util. 2022, 42, 1170–1184. [Google Scholar] [CrossRef]
- Khandelwal, M.; Singh, T.N. Prediction of Blast Induced Ground Vibrations and Frequency in Opencast Mine: A Neural Network Approach. J. Sound Vib. 2006, 289, 711–725. [Google Scholar] [CrossRef]
- Khandelwal, M.; Singh, T.N. Prediction of Blast-Induced Ground Vibration Using Artificial Neural Network. Int. J. Rock Mech. Min. Sci. 2009, 46, 1214–1222. [Google Scholar] [CrossRef]
- Zhang, Y.; Yao, D.; Xie, Z. The Prediction of Blasting Vibration Peak Value & Main Frequency by BP Neural Network. Chin. J. Eng. Geophys. 2008, 5, 222–226. [Google Scholar]
- Singh, T.N.; Kanchan, R.; Verma, A.K. Prediction of Blast Induced Ground Vibration and Frequency Using an Artificial Intelligent Technique. Noise Vib. Worldw. 2004, 35, 7–15. [Google Scholar] [CrossRef]
- Görgülü, K.; Arpaz, E.; Uysal, Ö.; Durutürk, Y.S.; Yüksek, A.G.; Koçaslan, A.; Dilmaç, M.K. Investigation of the Effects of Blasting Design Parameters and Rock Properties on Blast-Induced Ground Vibrations. Arab. J. Geosci. 2015, 8, 4269–4278. [Google Scholar] [CrossRef]
- Lin, Y.; Li, C.; Zhou, K.; Guo, Z.; Zang, C. A Constitutive Model Study of Chemical Corrosion Sandstone Based on Support Vector Machine and Artificial Bee Colony Algorithm. Sustainability 2023, 15, 13415. [Google Scholar] [CrossRef]
- Wang, Y.; Tang, X.; Zhou, F.; Fang, Z. Research on Application of Blasting Vibration CharacteristicParameters by SVM and Predicting of Neural Network. Highway 2017, 62, 12–17. [Google Scholar]
- Jang, J.R. ANFIS: Adap Tive-Ne Twork-Based Fuzzy Inference System. IEEE Trans. Syst. Man Cybern. 1993, 23, 665–685. [Google Scholar] [CrossRef]
- Ferreira, C. Gene Expression Programming: A New Adaptive Algorithm for Solving Problems. Complex Syst. 2001, 13, 87–129. [Google Scholar] [CrossRef]
- Wang, B.; Zhang, X.; Sheng, J.; Chen, X.; Shi, X. Optimized GEP Algorithm and Its Application in Blasting Vibration Predicting. Comput. Eng. Appl. 2016, 52, 212–217. [Google Scholar] [CrossRef]
- Dindarloo, S.R. Prediction of Blast-Induced Ground Vibrations via Genetic Programming. Int. J. Min. Sci. Technol. 2015, 25, 1011–1015. [Google Scholar] [CrossRef]
- Ho, T.K. The Random Subspace Method for Constructing Decision Forests. IEEE Trans. Pattern Anal. Mach. Intell. 1998, 20, 832–844. [Google Scholar] [CrossRef]
- Dong, L.; Li, X.; Xu, M.; Li, Q. Comparisons of Random Forest and Support Vector Machine for Predicting Blasting Vibration Characteristic Parameters. Procedia Eng. 2011, 26, 1772–1781. [Google Scholar] [CrossRef]
- Yue, Z.; Wu, Y.; Wei, Z.; Wang, G.; Wang, Y.; Li, X.; Zhou, Y. Prediction of Blasting Vibration Effect in Open-Pit Mine Based on PSO-LSSVM Model. Eng. Blasting 2020, 26, 1–8. [Google Scholar] [CrossRef]
- Zhou, Y.; Wu, L.; Yuan, Q.; Ma, C. Blasting Vibration Prediction Based on Rough Set-Fuzzy Neural Network Method. Blasting 2016, 33, 127–131. [Google Scholar] [CrossRef]


| Distance for Blasting Site (m) | Maximum Allowable Peak Particle Velocity (mm/s) |
|---|---|
| 0–90 | 31.25 |
| 90–1500 | 25.00 |
| 1500 and above | 18.75 |
| Sources | Safety Condition of Buildings and Structures | Vibration Velocity (cm/s) |
|---|---|---|
| Railway Ministry Scientific Research Institute | Building safety | ≤5 |
| Cracking and peeling of house wall plaster | 12 | |
| Large rocks rolling down steep slopes; small cracks appearing on the ground surface, causing damage to buildings | 20 | |
| Cracks appearing in soft, weak rocks; dry-stacked stone displacement; severe building damage | 50 | |
| Rock fractures, significant changes in terrain; complete building destruction | 150 | |
| Institute of Geophysics | Slight damage to regular houses | 10–15 |
| General damage to houses | >30 | |
| Severe building damage, bedrock exposure causing cracks | ≥60–70 | |
| Changsha Mining Research Institute | Formation of loose stones and small debris falling | 8.1–11.1 |
| Formation of fine cracks or expansion of existing cracks | 13.5–24.7 | |
| Formation of 4~5 cm large cracks or expansion of existing cracks | 45.8–81.5 |
| The Dominant Frequency | Advantages | Disadvantages |
|---|---|---|
| Zero-cross dominant frequency | 1. Clearly reflects the frequency characteristics corresponding to the peak particle velocity. 2. Widely applied and recognized in engineering practice. | The accuracy of the calculation relies on the peak period of the vibration waveform. If the peak period is unclear or multiple peaks are present, it may lead to inaccurate results. |
| Fourier dominant frequency | 1. Capable of reflecting the energy-concentrated regions of blast-induced vibration signals. 2. Facilitates the analysis of frequency components and energy distribution within the signal. | There is a limitation in that a single dominant frequency provides poor representativeness. |
| Centroid frequency | The distribution of the signal across the entire frequency range is considered, which to some extent mitigates the limitation of poor representativeness associated with a single dominant frequency. | 1. The definition and calculation methods are relatively complex. 2. The specific applications and studies in blast-induced vibration analysis are relatively limited, and its advantages, disadvantages, and applicability require further exploration and validation. |
| Spectrum Analysis Techniques for Blast-Induced Vibrations | Advantages | Disadvantages |
|---|---|---|
| Fourier Transform | 1. Strong spectrum analysis capability, enabling a clear identification of the signal’s frequency components. 2. Exhibits linear properties, facilitating signal combination or decomposition. 3. The convolution theorem is highly useful in signal processing applications. | 1. Loss of time-domain information, making it impossible to determine when specific frequency components occur. 2. Not suitable for analyzing non-stationary signals. 3. High computational complexity when processing large-scale data. |
| STFT | 1. The fundamental algorithm is the Fourier Transform, which is straightforward to interpret in terms of its physical meaning. 2. Enables time–frequency analysis. | 1. The window width is fixed and cannot be adaptively adjusted, resulting in the inability to simultaneously achieve optimal time and frequency resolution. 2. For non-stationary signals, when the signal undergoes rapid changes, the window function requires high time resolution. Conversely, during periods of relatively smooth waveform changes dominated by low-frequency signals, the window function requires high frequency resolution. STFT cannot accommodate both requirements simultaneously. |
| Wavelet Transform | 1. Effectively addresses the limitations of the Fourier Transform and Short-Time Fourier Transform by providing a “time-frequency” window that adapts to changes in frequency. 2. Facilitates time–frequency analysis of non-stationary signals, offering information in both the time domain and frequency domain simultaneously. | The selection of wavelet bases is challenging, and different wavelet bases may yield varying analysis results. |
| HHT | 1. Suitable for the analysis of nonlinear and non-stationary signals, making it better aligned with the characteristics of blast-induced vibration signals. 2. Capable of analyzing irregular signals and demonstrating strong adaptability to noise. | 1. During the EMD decomposition process, mode mixing and over-decomposition may occur, which can compromise the accuracy of the analysis results. 2. The computational workload is significant, leading to relatively low efficiency. |
| Total Number of Holes | Total Charge Weight/t | Maximum Charge per Delay/kg | Maximum Charge of Single Holes/kg | Hole Depth/mm | Hole Diameter/mm | Charge Height/m | The Distance Between Front Hole/m | The Distance Between Holes/m | Row Spacing/m | Charge Structure | |
|---|---|---|---|---|---|---|---|---|---|---|---|
| Vertical vibration speed V | 0.76 | 0.85 | 0.83 | 0.52 | 0.78 | 0.69 | 0.77 | 0.77 | 0.50 | 0.51 | 0.77 |
| Vertical vibration frequency f | 0.75 | 0.79 | 0.79 | 0.51 | 0.76 | 0.75 | 0.77 | 0.76 | 0.51 | 0.51 | 0.78 |
| V+f | 1.51 | 1.63 | 1.62 | 1.03 | 1.54 | 1.44 | 1.54 | 1.53 | 1.01 | 1.02 | 1.55 |
| Borehole Diameter | R | Maximum Charge per Delay | Charge Weight |
|---|---|---|---|
| 0.73 | 0.54 | 0.65 | 0.8 |
| Scholars | Equations | Description of the Equation |
|---|---|---|
| Savage [104] | f is the dominant vibration frequency (Hz); Q is the total charge (kg); R is the distance from the explosion source to the monitored location (m); a, a2 are constants to be determined; Kf is the frequency coefficient; Cs is the transverse wave velocity of the rock; K(k), α, β, bs, as are coefficients related to topographic and geologic conditions; PPV is peak particle velocity (cm/s); Cp is the longitudinal wave velocity in the rock mass; H is the difference in elevation from the centre of the explosion source to the measurement point (cm); d is the diameter of the borehole. ρ is the rock density. | |
| Jiao [105] | ||
| Tang [106] | ||
| Zhang [107] | ||
| Gao [108] | ||
| Meng [109] | ||
| Lu [110] | ||
| Wang [112] | ||
| Peng [111] | ||
| Aldas [37] |
| Researcher | Model | Input Parameters | State-of-the-Art |
|---|---|---|---|
| Álvarez-Vigil [31] | ANN | RMR, blast-control point relative arrangement, R, borehole diameter, stemming, S, B, instantaneous charge, total charge weight, No. of blastholes, explosive detonation velocity | MRE = 2.77; R2 = 0.9012 |
| Khandelwal [114] | ANN | Hole depth, B, S, maximum charge per delay, R, geotechnical (compressive strength/tensile strength), E, v, Pv, VOD | MAE = 0.24467; R2 = 0.9086 |
| Khandelwal [115] | ANN | Hole diameter, average hole depth, average burden, average spacing, average charge length, average explosive per hole, R, blastability index, E, v, Pv, velocity of detonation of explosive, density of explosive | MAPE = 6.99; R2 = 0.9868 |
| Zhang [116] | ANN | Total charge weight, maximum charge per delay, number of blast segments, R, characteristics of site conditions | The relative errors were 11.16% and 13.59% for comparisons with S and Tang, respectively |
| Singh [117] | ANN | Borehole diameter, No. of holes, average hole depth, B, S, average top stemming, average explosive per hole, R, blastibility index (ratio of compressive to tensile strength), E | R2 = 0.8369 |
| Görgülü [118] | ANN | R, explosive amount per delay, number of drill holes, distance between holes, burden, stemming, resistivity, P-wave and S wave velocities | R2 = 0.83~0.98 |
| Wang [120] | RBF | R, maximum charge per delay | Average relative error is 11.08% |
| ANN | Average relative error is 12.58% | ||
| SVM | Average relative error is 6.72% | ||
| Singh [20] | ANFIS | (B/S), (explosive/ delay), R, E, Pv, VOD | R2 = 0.9988 |
| Wang [123] | ANN | Total charge weight, maximum charge per delay, elevation difference, minimum burden, R, delay time, rock integrity coefficient, rock solidity coefficient, angle between measurement point and minimum burden direction | Average relative error is 12.92% |
| GEP | Average relative error is 7.00% | ||
| Dindarloo [124] | ANN | Borehole diameter, No. of holes, hole depth, B, S, stemming, maximum charge per delay, R, radial R | MAPR = 9.3%; R2 = 0.81 |
| GEP | MAPR = 4.7%; R2 = 0.97 | ||
| Dong [126] | SVM | maximum charge per delay, Total charge weight, horizontal distance, R, B, presplit penetration ratio, integrity coefficient, angel of minimum resistance line tomeasured point, VOD | Average relative error is 8.07% |
| RF | Average relative error is 12.04% |
| Prediction Method | Advantages | Disadvantages | Comparison of Individual Cases Under the Same Working Conditions |
|---|---|---|---|
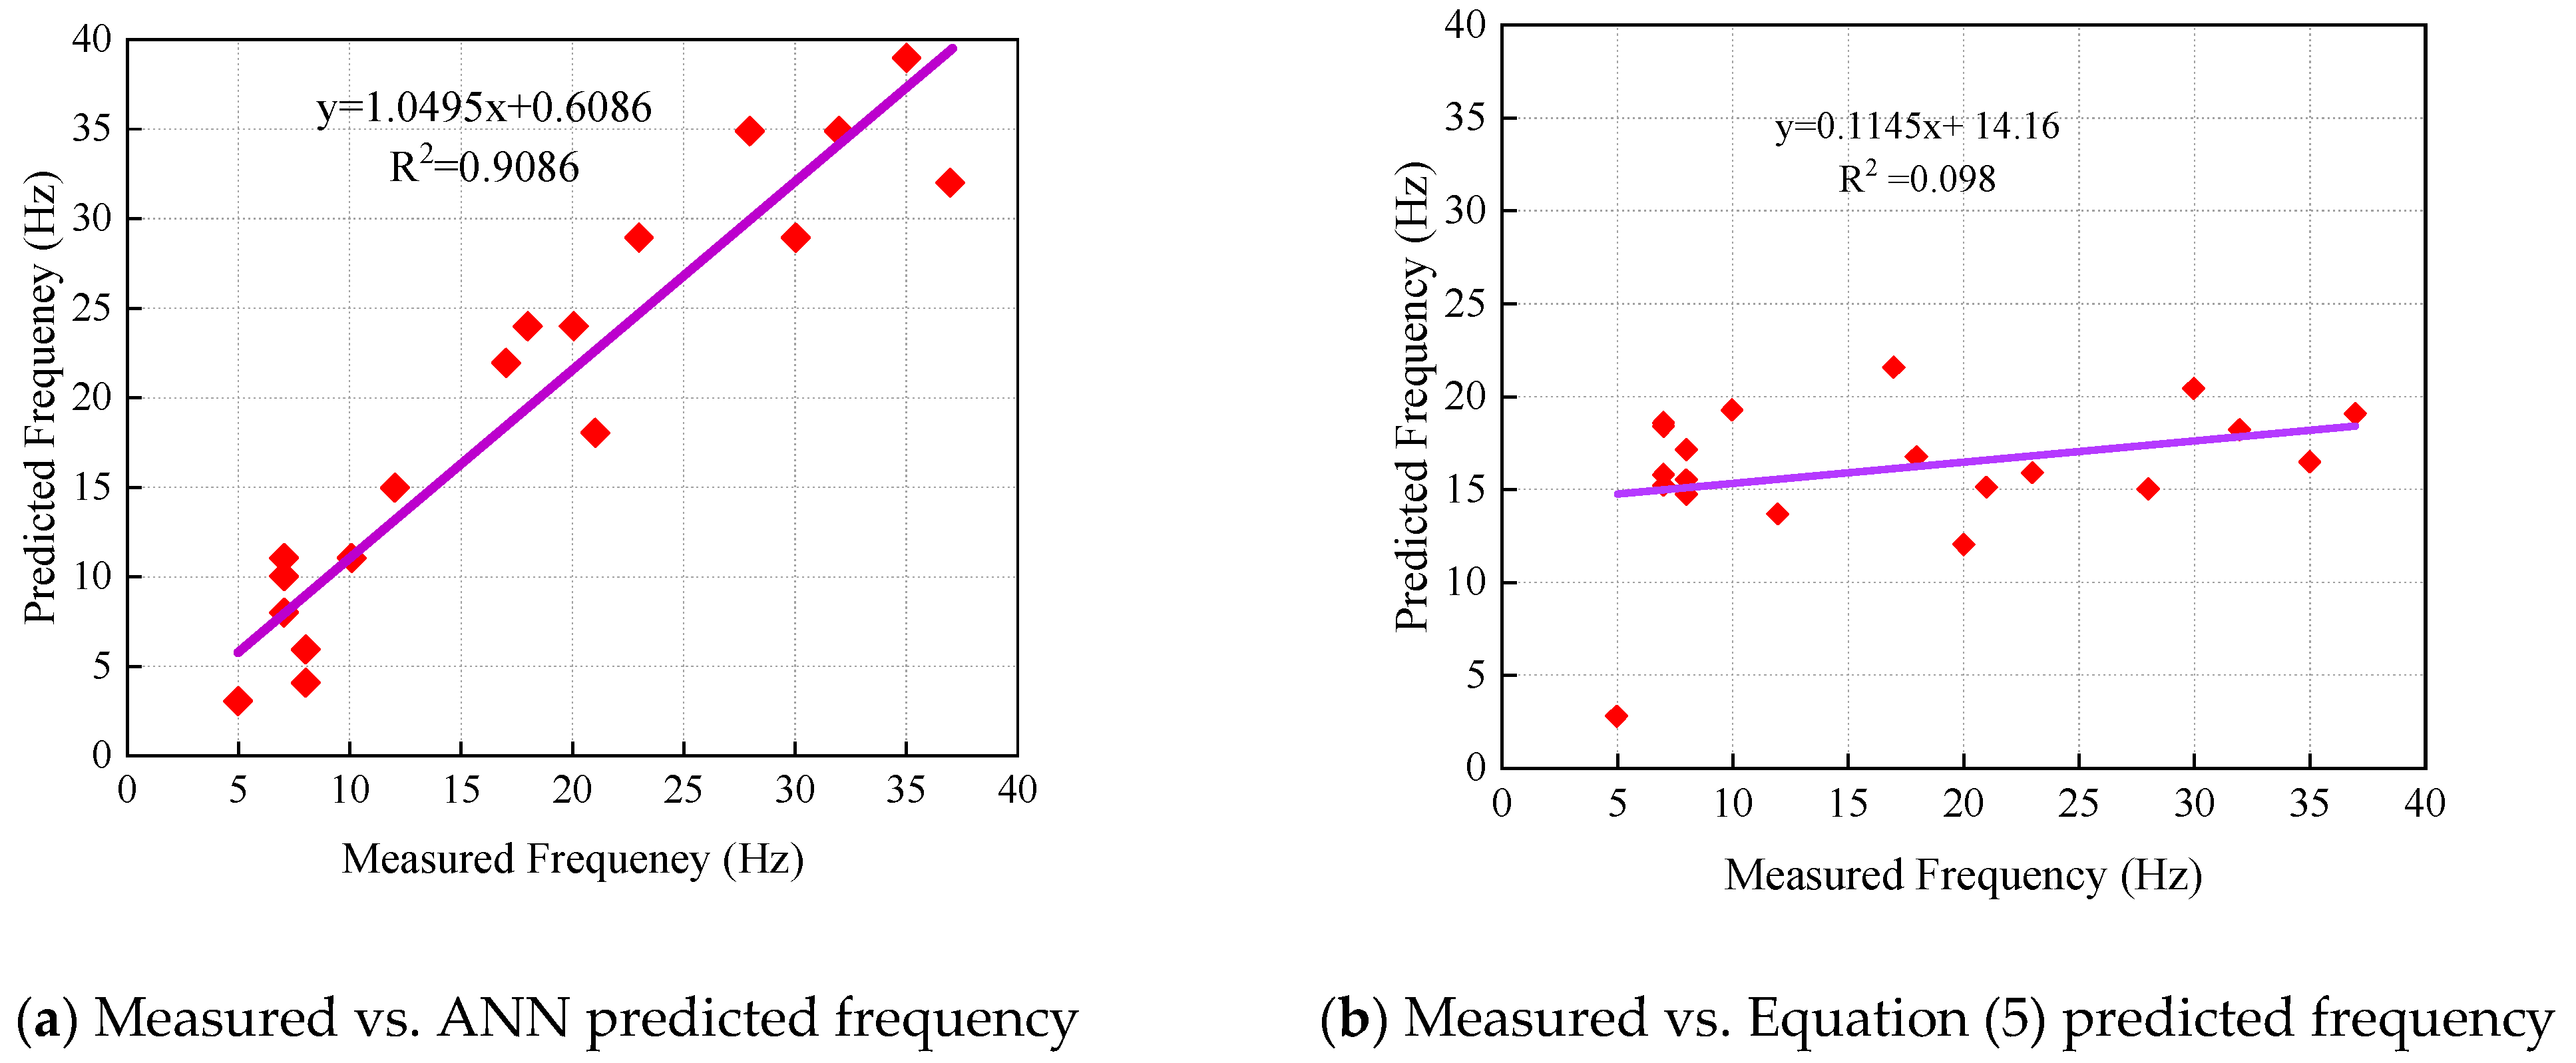
| Empirical equation | 1. Simple to calculate and cost-effective to implement. 2. Capable of providing reasonable predictions for relatively simple blast vibration scenarios. 3. Requires minimal data, making it suitable for situations with small sample sizes. | 1. Difficult to address complex nonlinear relationships and the impact of multiple variables. 2. Sensitive to variations in geological conditions, blasting parameters, and other factors, limiting its adaptability to complex environments. 3. Prediction accuracy is relatively low and significantly decreases as the complexity of the conditions increases. | Condition 1 [115]: R2 = 0.098 Condition 2 [116]: Average relative error = 11.16% Condition 3 [118]: R2 = 0.17 |
| AI Techniques | 1. High accuracy, with the ability to automatically learn complex patterns from large datasets. 2. Capable of adapting to various geological and blasting conditions, with strong modeling capabilities for handling multivariable influences. 3. Exhibits strong adaptability to large and complex datasets. | 1. The training process is complex and demands significant data and computational resources. 2. The model requires high-quality data, as noise or missing data can negatively impact its performance. 3. The model is prone to overfitting and necessitates the use of appropriate regularization techniques to improve its generalization capability. | Condition 1 [115]: R2 = 0.9086 Condition 2 [116]: Average relative error = 13.59% Condition 3 [118]: R2 = 0.83~0.98 |
| Research Field | Future Research Directions |
|---|---|
| Safety Standards | By considering multiple factors, establish a unified evaluation framework based on structural types and geological conditions. |
| Dominant Frequency Type | Through theoretical and experimental studies, establish application criteria for different dominant frequency types and clarify their applicability in engineering scenarios. |
| Signal Analysis Techniques | Construct a time–frequency analysis framework based on multi-method integration; combine ML to achieve intelligent signal feature recognition and real-time monitoring and early warning. |
| Influencing Factors | Conduct in-depth research on the influence mechanisms of complex factors (such as geological conditions, charge structure, and uncoupling coefficient) on the dominant frequency; explore the patterns of difficult-to-quantify parameters. |
| Frequency Prediction | Consider the impact of geological conditions and establish a large-scale database, widely applicable for predicting open-pit mining blasting; comprehensively consider multiple factors and incorporate them into dominant frequency prediction to improve the accuracy and safety of blasting design; adjust the blasting design based on predictions, optimize blasting parameters, and ensure operational safety. |
Disclaimer/Publisher’s Note: The statements, opinions and data contained in all publications are solely those of the individual author(s) and contributor(s) and not of MDPI and/or the editor(s). MDPI and/or the editor(s) disclaim responsibility for any injury to people or property resulting from any ideas, methods, instructions or products referred to in the content. |
© 2025 by the authors. Licensee MDPI, Basel, Switzerland. This article is an open access article distributed under the terms and conditions of the Creative Commons Attribution (CC BY) license (https://creativecommons.org/licenses/by/4.0/).
Share and Cite
Guo, J.; Fei, H.; Yan, Y. Research and Advances in the Characteristics of Blast-Induced Vibration Frequencies. Buildings 2025, 15, 892. https://doi.org/10.3390/buildings15060892
Guo J, Fei H, Yan Y. Research and Advances in the Characteristics of Blast-Induced Vibration Frequencies. Buildings. 2025; 15(6):892. https://doi.org/10.3390/buildings15060892
Chicago/Turabian StyleGuo, Jiwei, Honglu Fei, and Yu Yan. 2025. "Research and Advances in the Characteristics of Blast-Induced Vibration Frequencies" Buildings 15, no. 6: 892. https://doi.org/10.3390/buildings15060892
APA StyleGuo, J., Fei, H., & Yan, Y. (2025). Research and Advances in the Characteristics of Blast-Induced Vibration Frequencies. Buildings, 15(6), 892. https://doi.org/10.3390/buildings15060892