1. Introduction
In modern life, humans spend most of their time indoors. Human health and quality of life are directly correlated with indoor air quality [
1]. Research has shown that indoor air pollution in many buildings is even more severe than outdoor air pollution. Poor indoor air quality can lead to Sick Building Syndrome (SBS), causing symptoms such as eye discomfort, dry throat, runny nose, shortness of breath, dizziness, and nausea, which significantly reduce people’s quality of life and work efficiency [
2,
3].
Indoor air pollution primarily includes physical, chemical, and biological pollutants. The harmful effects of bacteria, fungi, viruses, and their byproducts on the environment and other living things are sometimes referred to as biological pollution. Microorganisms in the air generally do not exist alone; most of them attach to particles and exist as aerosols [
4]. Microbial aerosols have the same characteristics as regular aerosols and pose the same risks as inhalable particulate matter (PM), such as PM
10 and PM
2.5 [
5]. These aerosols can enter the upper respiratory tract through breathing and even reach the bronchi and alveoli, damaging lung tissue and causing asthma, bronchitis, and even life-threatening conditions [
6]. The hazards become more severe and widespread when pathogenic bacteria are present in microbial aerosols [
7,
8,
9].
Since the outbreak of SARS in 2003, followed by avian flu [
10], Middle East Respiratory Syndrome (MERS) [
11], and COVID-19 [
12,
13], indoor microbial pollution has drawn increased attention. In indoor environments, infected occupants and contaminated air-conditioning systems are two main sources of microbial pollution. The human body is not only a reservoir and breeding ground for microorganisms but also a significant source of emissions. In a static state, the body can release 500–1500 bacteria-carrying particles into the air every minute, reaching up to 104–106 particles per cough or sneeze [
5].
While air-conditioning systems provide a comfortable indoor environment, they also create suitable temperature and humidity conditions for microbial growth. Therefore, contamination of air-conditioning systems is another important source of indoor pollution. Typical breeding grounds for microorganisms are filters, cooling coils, condensate pans and humidifiers in air-conditioning systems. Moreover, cleaning and disinfecting the interior of air-conditioning systems cannot be fully guaranteed, making it easy for microorganisms to spread. Furthermore, microorganisms inside air-conditioning systems can enter the indoor environment through ventilation systems, polluting indoor air and endangering human health [
14].
Furthermore, parameters such as pH, nutrient availability, the physical properties of the substrate, and the presence of other microorganisms also exert influence. For instance, the pH level of approximately 6.5–7.5 is conducive to the growth of Staphylococcus aureus. Nutrients from airborne organics and the activated carbon’s surface, along with its porosity and surface area, impact colonization. The interaction with other microbes can either promote or suppress growth through competition and metabolite effects.
The most popular pollution control technique in air-conditioning systems is filtration, which effectively eliminates microbiological pollutants [
15]. However, if the surrounding environment remains at high humidity levels (RH > 80%) for extended periods, certain types of bacteria can still grow within the filters. Wang et al. [
16] studied microorganisms attached to filters and found that the relative culturability of
Bacillus subtilis increased with relative humidity. Activated carbon has been widely used as an adsorbent in refrigeration systems. For example, Banker [
17] showed its widespread applicability by creating a laboratory model for a thermally driven adsorption refrigeration system utilizing activated carbon as the adsorbent and HFC 134a as the refrigerant. Al-Ghouti [
18] successfully established and characterized the adsorption of ether on activated carbon in a novel adsorption refrigerator.
Most studies have focused on using commercially available activated carbon in adsorption refrigeration systems [
19]. Adsorption technology has broad potential to compete with traditional absorption and vapor compression technologies. Therefore, studying bacterial growth and reproduction on the surface of activated carbon is highly valuable.
Al Horr et al. [
20] compared the effects of UV radiation on bioaerosols in HEPA photocatalytic filters coated with TiO
2 and those containing activated carbon. The HEPA photocatalytic filter could completely destroy bacterial cells because the TiO
2 coating breaks down bacterial cells upon contact. In contrast, filters with activated carbon showed an inactivation threshold because the aerosol cells penetrated the activated carbon layer without making contact with the carbon. Understanding the growth and reproduction of microorganisms on the surface of activated carbon can provide valuable insights into improving indoor air quality.
A primary focus in predictive microbiology is the shape of microbial growth curves. Many models are used to fit microbial count data, with exponential and logistic regression analyses being the main methods. Gradeci [
21] proposed various mold prediction models, which can be used to better predict the risk of mold growth in buildings. Kreyenschmidt et al. [
22] studied the growth and reproduction patterns of lactic acid bacteria at different temperatures, and their results showed that the modified logistic model provided the best prediction of microbial counts. Ross [
23] developed a predictive model for the growth and reproduction of Listeria, and now the risk can be quantitatively or semi-quantitatively assessed (0.7 < Bf < 1.15) in products with similar microbial ecology. Membré [
24] applied predictive modeling to the growth of
Penicillium brevicompactum on solid media, using nonlinear models to fit curves and conducting non-parametric multiple comparisons to detect fungal growth differences on solid media. Zurera [
25] developed two predictive models, RS and Davey, to study the combined effects of varying temperatures (7–19 °C), pH levels (4.5–8.5), sodium chloride levels (0–8%), and sodium nitrite levels (0 to 200 ppm) on the expected growth rate and lag time of
Staphylococcus aureus under aerobic and anaerobic conditions.
Although numerous studies have delved into various aspects of indoor microbial pollution and the application of activated carbon in different systems, there remain many unsolved mysteries regarding the growth and reproduction characteristics of Staphylococcus aureus on the surface of activated carbon and the construction of accurate mathematical models within the specific context of air-conditioning filtration systems. The scarcity of relevant research has led to a lack of crucial theoretical guidance in preventing and controlling microbial pollution in air-conditioning systems, accurately determining the service life of filters and optimizing maintenance strategies. This is precisely the core motivation and key breakthrough point for conducting this study. This study was founded on the hypothesis that temperature and humidity significantly modulate the growth and reproduction of Staphylococcus aureus on the surface of activated carbon within air-conditioning filtration systems. Through comprehensive experimental investigations and precise mathematical model analyses, we aimed to rigorously test and validate this hypothesis.
3. Results and Discussion
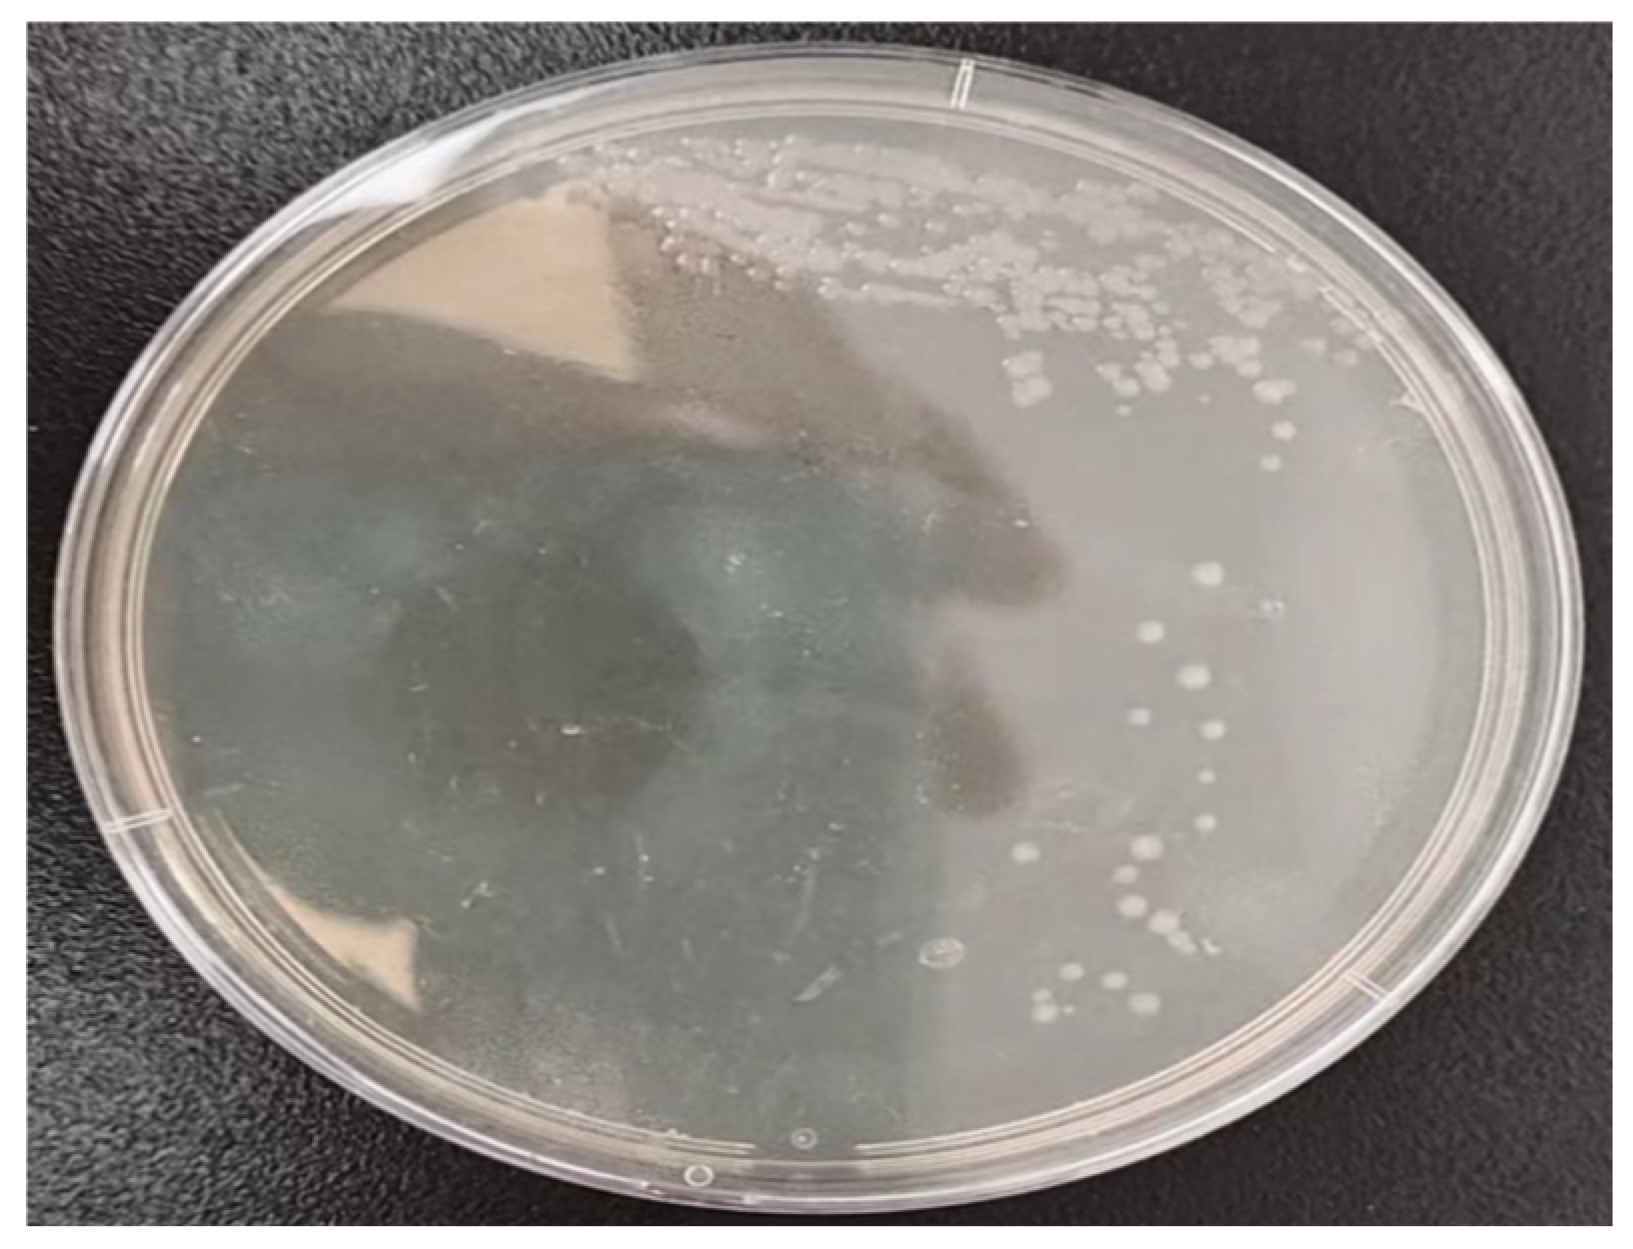
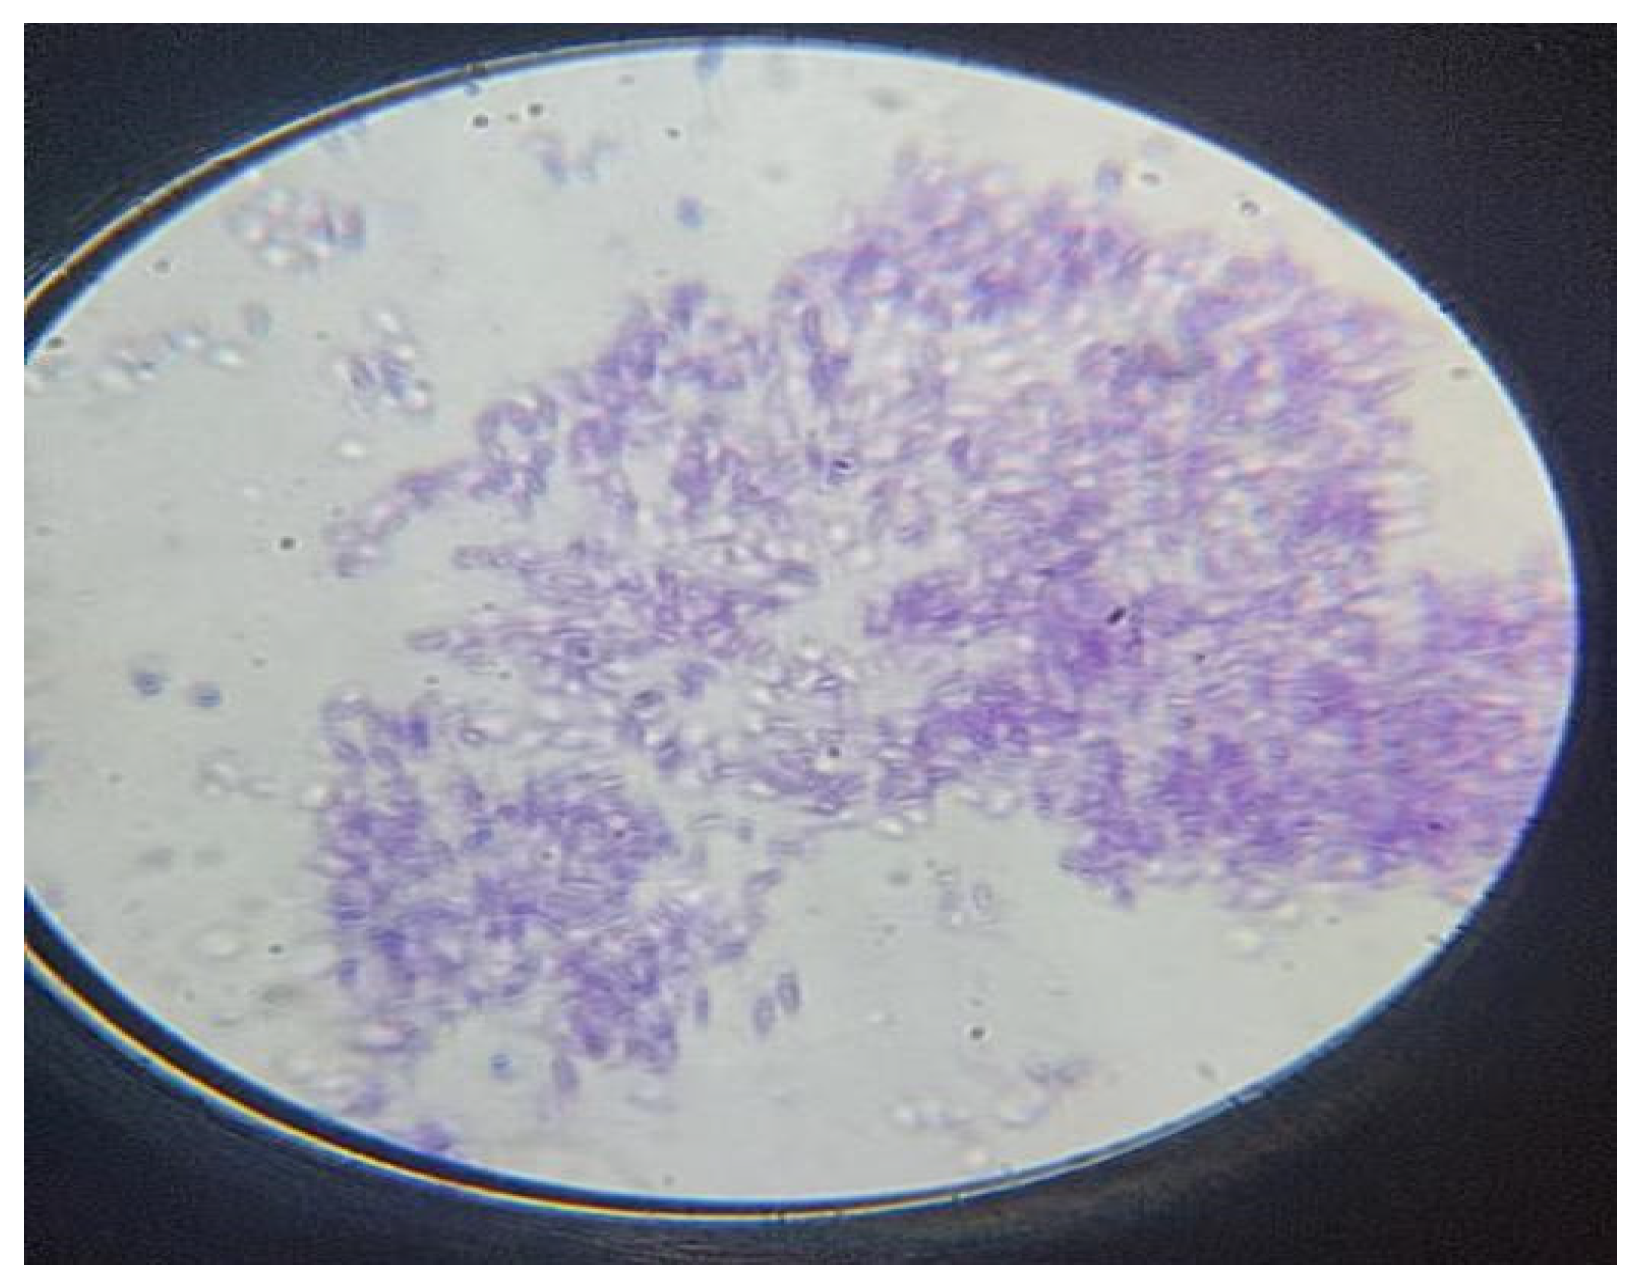
3.1. Growth of Staphylococcus aureus
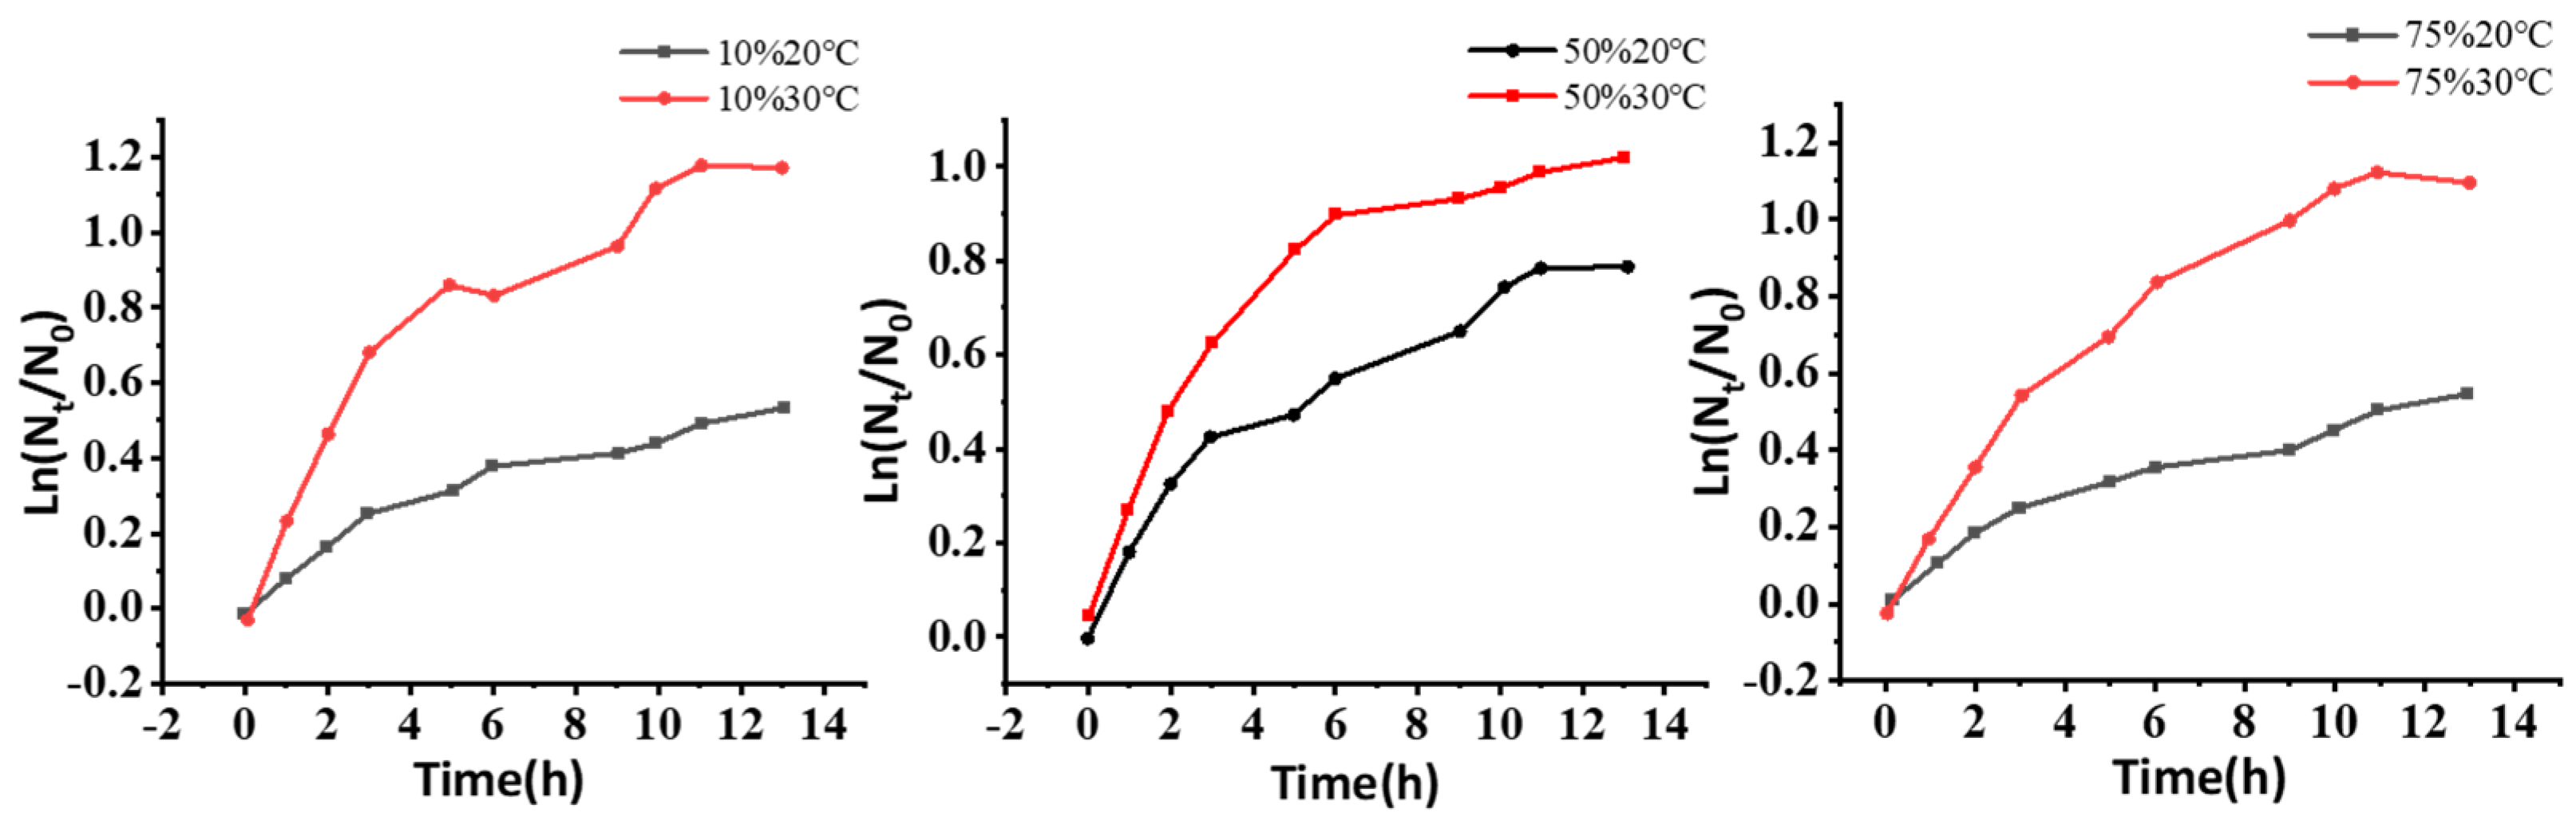
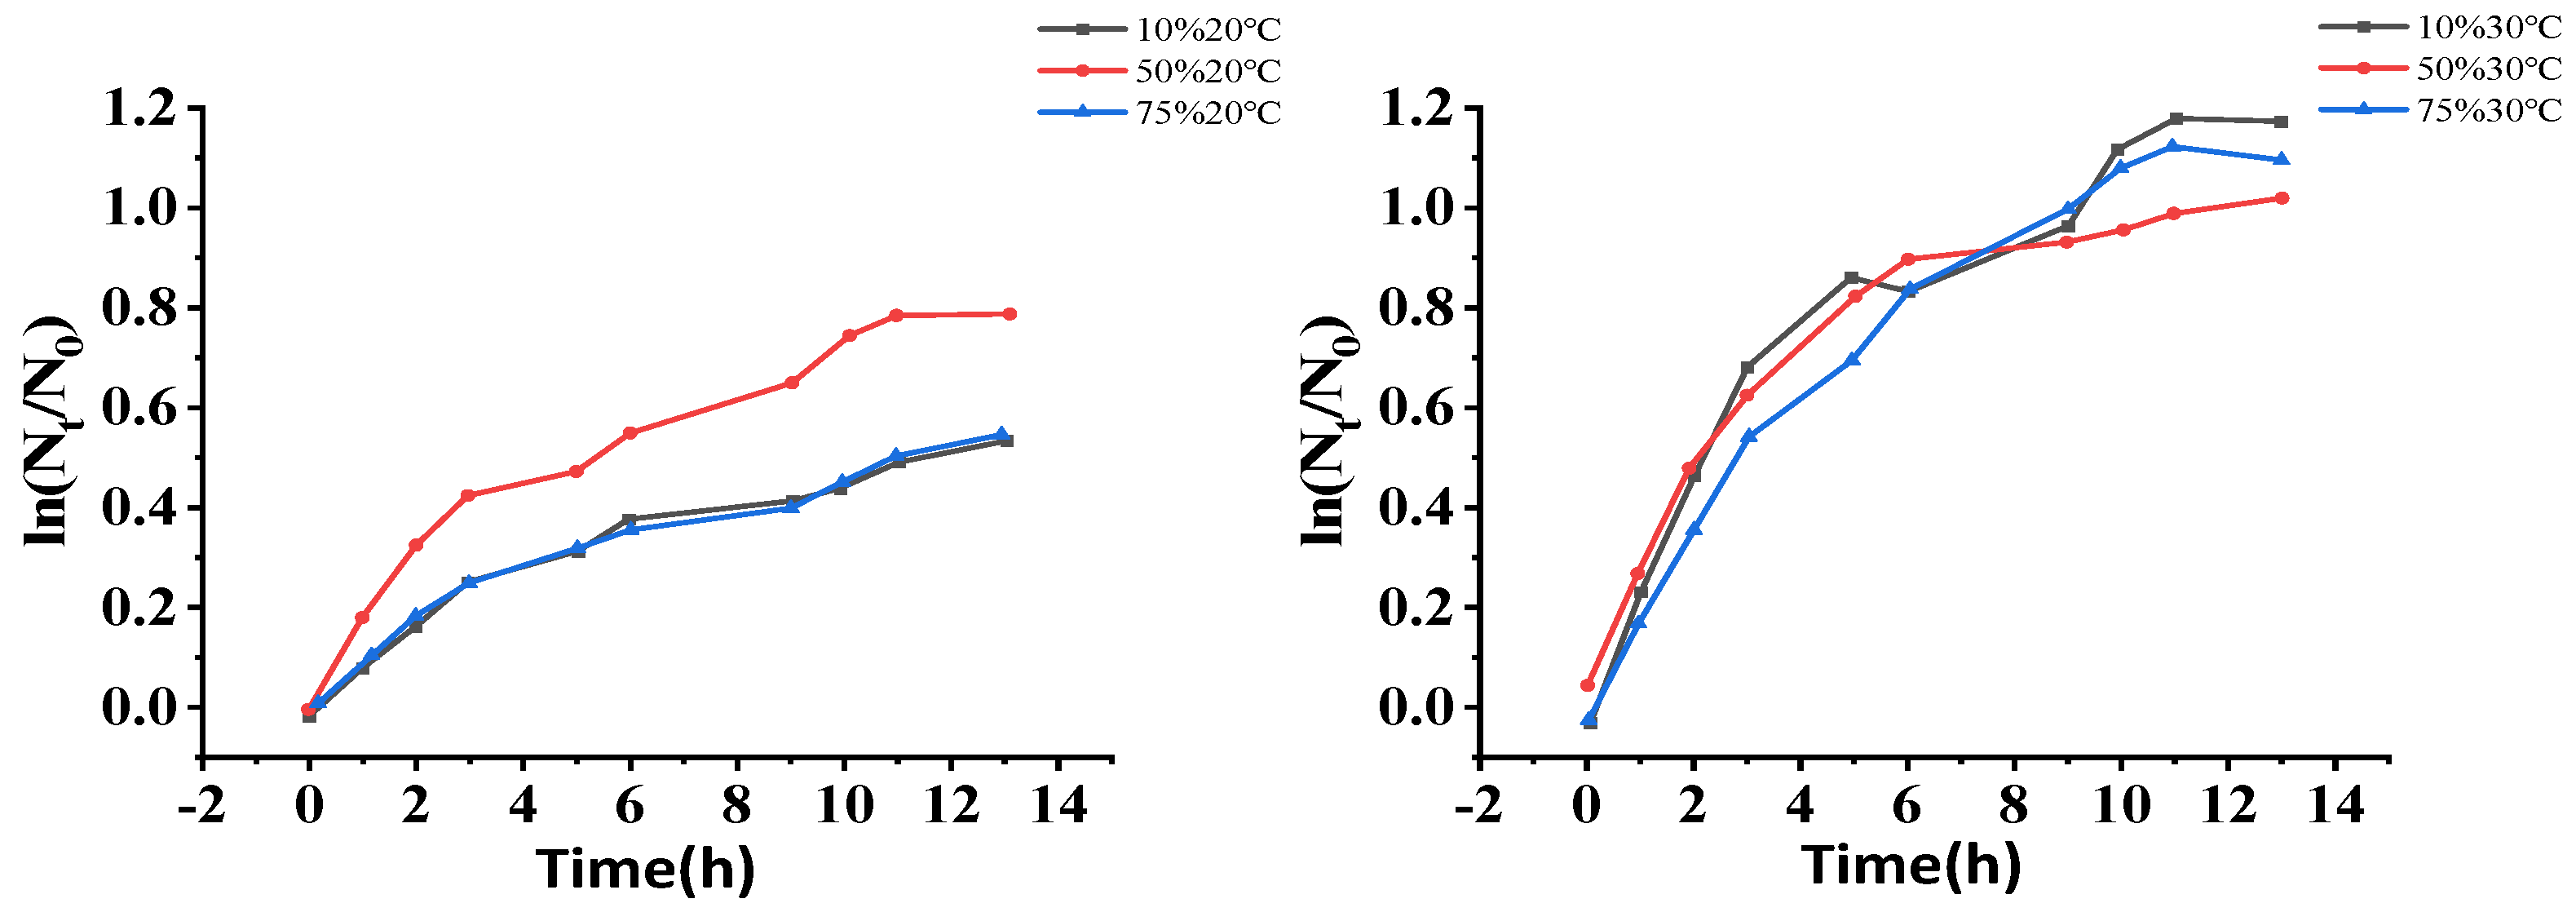
Figure 4 depicts the growth and reproduction curves of
Staphylococcus aureus on the surface of activated carbon under temperature conditions of 20 °C and 30 °C, along with relative humidity levels of 10%, 50%, and 75%. Evidently, across all tested temperature–humidity combinations, the population of
Staphylococcus aureus exhibits a continuous upward trend over time. Notably, its growth pattern closely adheres to the typical microbial growth model, with a distinct logarithmic growth phase being clearly observable.
Upon a meticulous comparison of the curves at different temperatures, it becomes apparent that the growth of bacteria at 30 °C surpasses that at 20 °C significantly. From a microbiological perspective, this can be attributed to the fact that, at 30 °C, the enzymes involved in various metabolic pathways within the bacteria possess heightened catalytic activities. This leads to enhanced efficiency in nutrient uptake, transformation, and utilization, thereby furnishing a more ample energy and material foundation for bacterial growth and reproduction, and ultimately facilitating the rapid proliferation of bacteria.
A more in-depth examination of the curves under diverse humidity conditions reveals that, at 20 °C, the growth of microorganisms is most robust at 50% relative humidity, with a higher growth yield compared to the 75% relative humidity condition. This phenomenon can be ascribed to the fact that the water activity associated with 50% relative humidity is optimally suited to the physiological requirements of Staphylococcus aureus for maintaining normal cellular functions. Under such conditions, the osmotic pressure across the cell membrane remains in equilibrium. This equilibrium state enables the seamless influx of nutrients into the cell and the efficient efflux of metabolic waste, thereby ensuring the unimpeded progression of cellular metabolism and growth. Conversely, in a high-humidity environment (e.g., 75% relative humidity), the pore structure of activated carbon may become inundated with excessive moisture. This not only obstructs the effective interaction between bacteria and nutrients but also has the potential to dilute the nutrient concentration, rendering it more challenging for bacteria to acquire an adequate supply of nutrients. In a low-humidity environment (e.g., 10% relative humidity), the scarcity of water impedes the dissolution and diffusion of nutrients on the surface of activated carbon. As a result, bacteria face difficulties in obtaining sufficient nutrients to sustain growth, consequently inhibiting their reproductive capacity.
Figure 5 further illustrates the growth and reproduction of
Staphylococcus aureus on the surface of activated carbon under different relative humidity conditions at 20 °C and 30 °C in greater detail. At 30 °C, the growth curves under varying relative humidity conditions exhibit a high degree of similarity, with minimal discrepancies in growth yields. This may be attributed to the increased adaptability of bacteria to humidity variations at this temperature, such that fluctuations in humidity within a certain range have a relatively negligible impact on bacterial growth. In contrast, at 20 °C, the growth disparities under different humidity conditions are more pronounced. The growth of bacteria at 50% relative humidity is markedly higher than that at 75% relative humidity, reaffirming that 50% relative humidity represents a more favorable condition for the growth of
Staphylococcus aureus in a 20 °C environment.
3.2. Logistic Prediction Model
The Logistic model, with its sophisticated theoretical underpinnings, has excelled in characterizing the growth dynamics of microorganisms in resource-limited habitats. Its efficacy has been widely corroborated in a plethora of microbial growth investigations. Hence, it constitutes one of the principal models in this study. It is adept at precisely portraying the growth progression of Staphylococcus aureus on the activated carbon surface. The growth process, initiated by exponential proliferation, is later influenced by resource competition and environmental restrictions, leading to a deceleration and eventual stabilization of the growth rate. The Logistic model adeptly captures this entire sequence, taking into account the restricted adsorption sites and nutrient availability on the activated carbon surface.
Based on previous research [
22], the modified Logistic equation is the most widely applied form and is expressed as follows:
where:
y—the population count at time t, pc;
t—time of microbial growth, hour;
A—logarithm of the initial bacterial count, ln (pc/mL);
C—the difference between the logarithm of the initial and maximum bacterial counts, ln (pc/mL);
M—the time at which the growth rate reaches its maximum, hour;
B—the maximum growth rate, 1/h.
The modified Logistic equation parameters for growth are calculated using the following formulas:
μm (maximum specific growth rate) = (B × C)/4, 1/h;
λ (lag phase duration) = M − (2/B);
MPD (maximum bacterial count) = A + C.
3.2.1. Logistic Model Fitting for Staphylococcus aureus
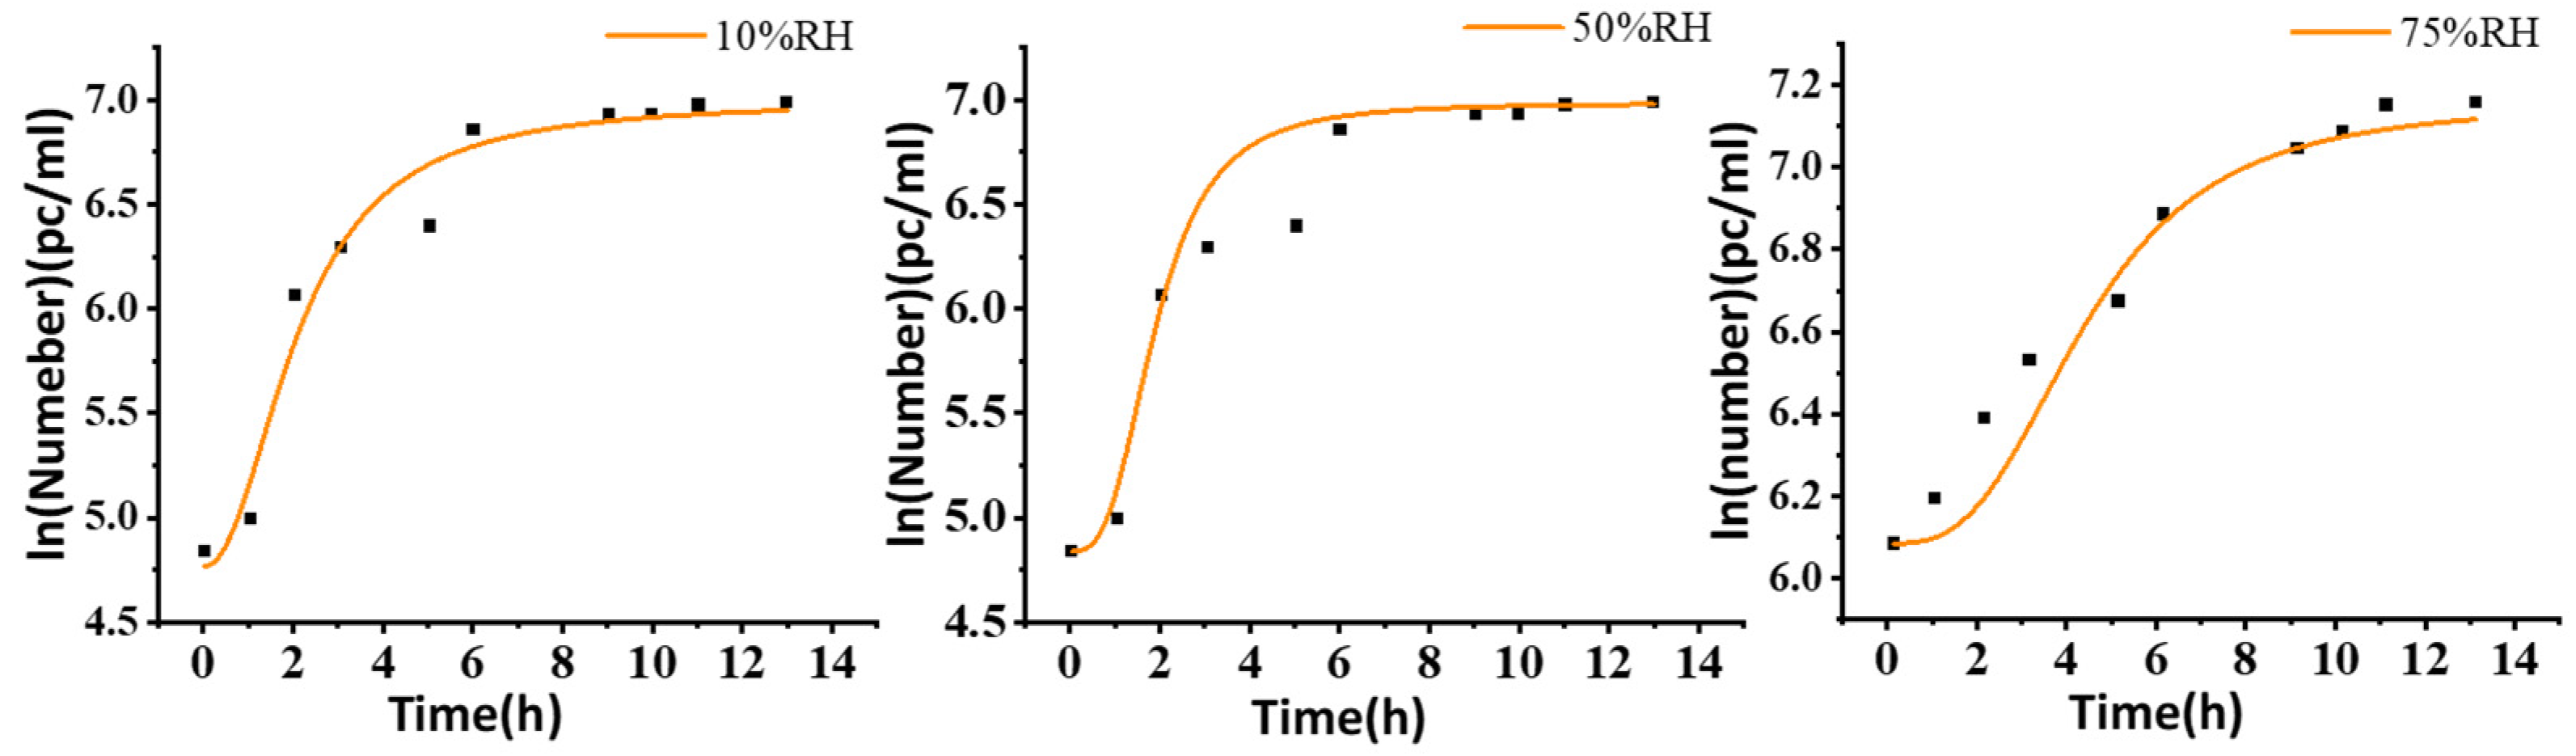
The growth curves of Staphylococcus aureus under temperature conditions of 20 °C and 30 °C, and relative humidities of 10%, 50%, and 75% RH, were fitted using the Logistic model, as shown in the figures below.
3.2.2. Logistic Model Parameters
Table 1 shows the Logistic model parameters and fitting results.
From
Figure 6 and
Figure 7 and
Table 1, it can be observed that the Logistic model fits the data well, with R
2 values all above 0.9. The model fit is better at 30 °C than at 20 °C, and as the relative humidity increases, the model’s fit improves. The Logistic model is a commonly used model for predicting microbial growth, where the fitted growth curve defines the relationship between the logarithm of the population count and time.
Kajak established a Logistic model for the growth of natural microbial communities in salted and cured meat products, which provided a good fit for the model of total plate count growth (cfu/g) in meat products stored at different temperatures [
26]. F. Özadali used a Logistic model to simulate microbial growth in fed-batch fermentation tanks, successfully modeling six sets of fed-batch fermentation data from different sources using the same expression [
27].
3.2.3. Logistic Model Fitting Parameter Verification
In the field of statistics, a crucial metric for evaluating the adequacy of a model’s fit is the assessment of its bias factor (B
f) and accuracy factor (A
f). These factors are used to evaluate the average deviation and accuracy between predicted and experimental values. The bias factor (B
f) represents the structural bias of the model, primarily indicating how well the model fits the training data. If B
f < 1, it suggests that the model’s predicted value is underestimated; if B
f > 1, it suggests that the predicted value is overestimated. Ross T. [
28] established a standard for the bias factor of bacteria: when the bias factor is within the range of 0.9 to 1.05, the model fits well and is highly applicable. If the bias factor is between 0.7 and 0.9 or between 1.05 and 1.15, the model is acceptable. If the bias factor ≤0.07 or >1.15, the model is considered unacceptable.
The accuracy factor (A
f) refers to the prediction error of the established model across different training sets. To comprehensively evaluate the predictive model for the growth of microorganisms on activated carbon, and to avoid the limitations of a single indicator, the accuracy factor is introduced to cross-verify the equation model. The closer the A
f value is to 1, the smaller the percentage error, and the more accurate the model. These two indicators are mainly calculated using the predicted and observed values of the model and the number of measurements with the following formulas:
where:
Npredicted represents the predicted number of microorganisms obtained by the model, pc/mL;
Nobserved represents the number of microorganisms obtained through actual experiments, pc/mL;
n is the number of measurements.
As shown in
Table 2, under temperature conditions of 20 °C and 30 °C, and relative humidity conditions of 10%, 50%, and 75%, the Bf values range between 0.96 and 1, indicating that the model is highly applicable. All models are suitable for predicting the growth and reproduction of
Staphylococcus aureus on activated carbon. Additionally, all fitted models have A
f values close to 1, with only minor variations, indicating that the Logistic model’s prediction of
Staphylococcus aureus growth on activated carbon is highly accurate. Therefore, it can be concluded that under the experimental conditions of temperature and humidity, the Logistic model can be reliably used to predict
Staphylococcus aureus growth on activated carbon.
3.3. Gompertz Model
The Gompertz equation was initially proposed to explain human mortality curves, and modern research has successfully applied it to describe growth curves in various disciplines, such as agronomy, medicine, engineering, and economics. The Gompertz model has also been widely used in biology. The Gompertz model is expressed as follows:
where:
ln(y)—logarithm of the number of bacteria at time t, ln(pc/mL);
t—time of microbial growth, hour;
A—logarithm of the initial bacterial count, ln(pc/mL);
C—the difference between the logarithm of the initial and maximum bacterial counts, ln(pc/mL);
M—the time at which the growth rate reaches its maximum, hours;
B—the maximum growth rate, 1/h.
The parameters for the Gompertz model’s growth calculations are:
3.3.1. Fitting of Staphylococcus aureus Growth with the Gompertz Model
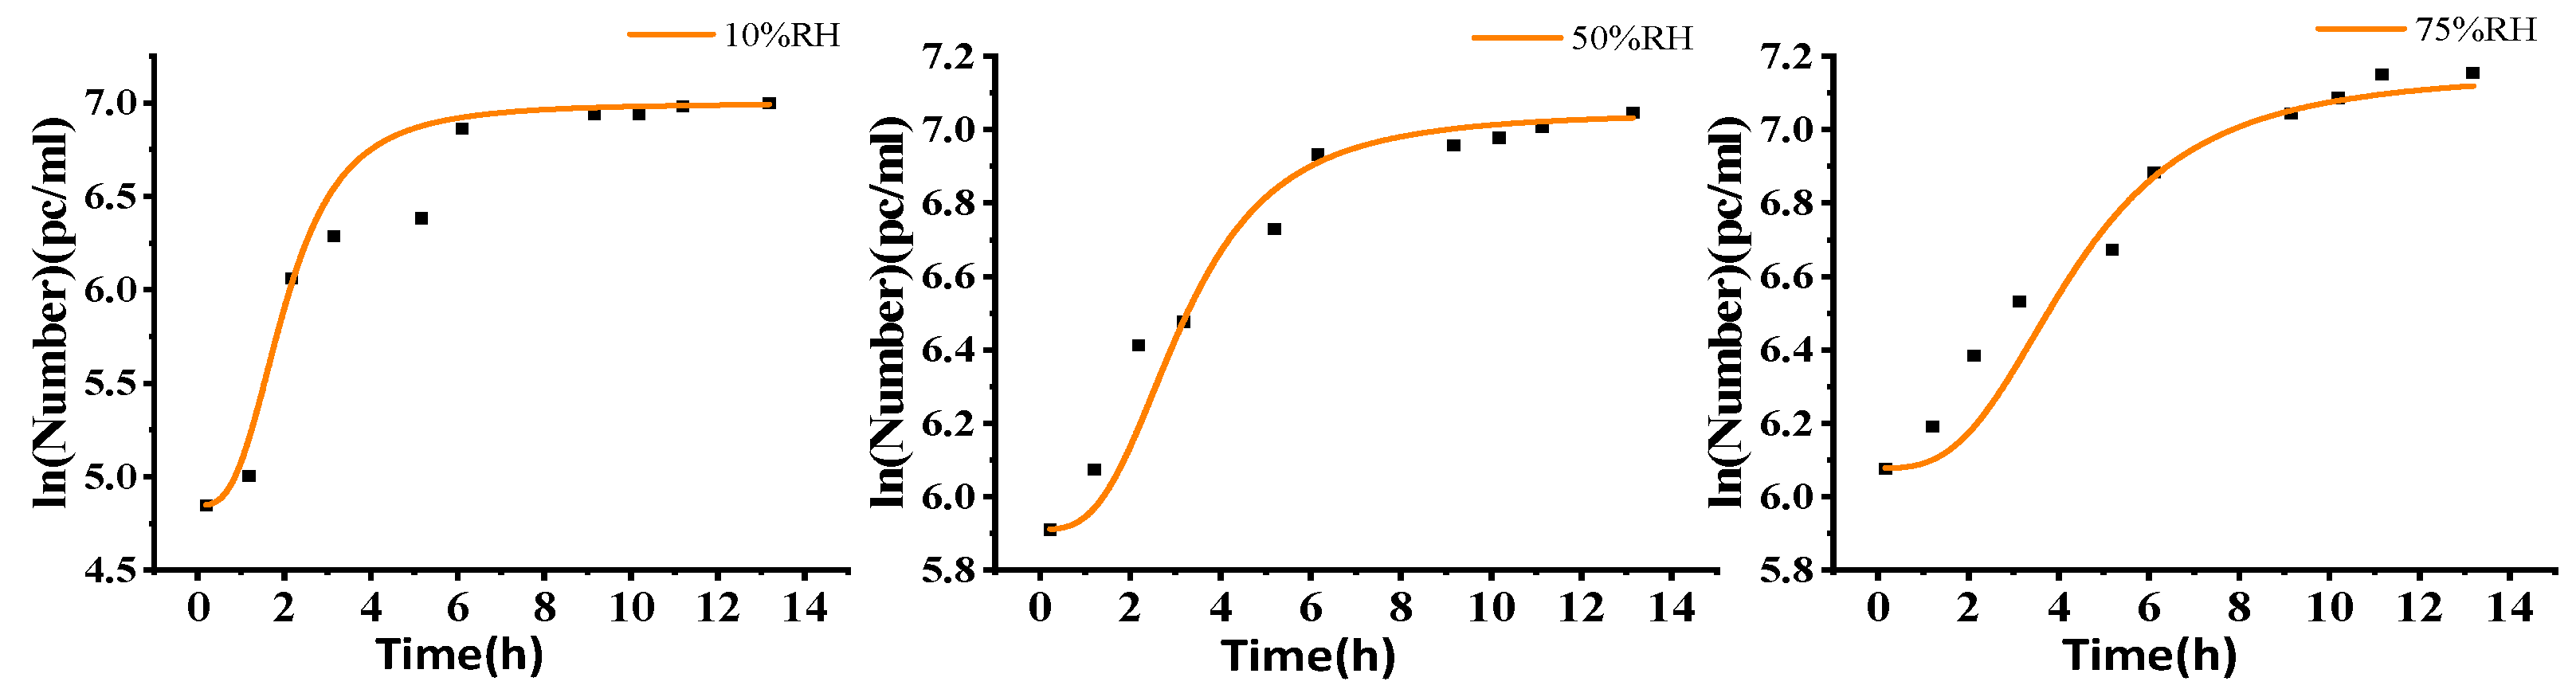
The growth curves of Staphylococcus aureus under temperature conditions of 20 °C and 30 °C, and relative humidities of 10%, 50%, and 75% RH, were fitted using the Gompertz model, as shown in the figures below.
3.3.2. Gompertz Model Parameters
Table 3 shows the Gompertz model parameters and fitting results.
From
Figure 8 and
Figure 9 and
Table 3, it can be seen that the overall fitting effect of the Gompertz model is good, with R
2 values above 0.9 in most cases. Under the same relative humidity conditions, the model fit at 30 °C is better than at 20 °C, except for the condition of 10% RH, where the R
2 value is lower than that of the Logistic model. In all other conditions, the Gompertz model shows better fitting results than the Logistic model.
Panigrahi predicted the growth of aerobic thermophilic molds and yeast molds using the Zwietering-modified Gompertz model, with R
2 values ranging from 0.92 to 0.98, confirming that ultrafiltered, ozonized sugarcane juice can be safely stored for up to 90 days under refrigeration [
29]. The Winsor-modified Gompertz model was used to predict the growth of
Rhodobacter capsulatus, with R
2 values ranging from 0.99924 to 0.9968, reliably determining the growth parameters of
Rhodobacter capsulatus [
30].
3.3.3. Gompertz Model Fitting Parameter Verification
The Gompertz model was verified using the same evaluation standards as the Logistic model, with bias factors (Bf) and accuracy factors (Af) used to assess the model’s goodness of fit. The specific verification methods are the same as those described for the Logistic model.
As shown in
Table 4, under temperature conditions of 20 °C and 30 °C, and relative humidity conditions of 10%, 50%, and 75%, the Bf values range between 0.96 and 1, indicating that the model is highly applicable. All models are suitable for predicting the growth and reproduction of
Staphylococcus aureus on activated carbon. Additionally, all fitted models have A
f values close to 1 with only minor variations, indicating that the Gompertz model’s prediction of
Staphylococcus aureus growth on activated carbon is highly accurate. Therefore, it can be concluded that under the experimental conditions of temperature and humidity, the Gompertz model can be reliably used to predict
Staphylococcus aureus growth on activated carbon.
When comparing the Gompertz and Logistic models for reliability and applicability, there is little difference between the two. However, overall, except for the condition of 10% RH at 20 °C where the Gompertz model’s R2 value is lower than that of the Logistic model, the Gompertz model performs better under all other conditions. Therefore, when considering various temperature and humidity conditions, the Gompertz model should be preferred for fitting the data.
4. Discussion
4.1. Comparison of the Two Models
In this study, we employed two models, the Logistic and Gompertz models, to simulate the growth of Staphylococcus aureus on the surface of activated carbon under controlled temperature and humidity conditions. Both models demonstrated high accuracy in predicting microbial growth, with the coefficient of determination (R2) greater than 0.9.
In terms of the overall simulation effect, the Gompertz model performed better in most cases. It could more accurately capture the dynamic changes in the lag phase, logarithmic growth phase, and stationary phase of bacterial growth. This was especially so when reflecting the rapid growth stage of bacteria and the process of reaching a stable state, where it showed a high degree of fit with the experimental data. This might be because the Gompertz model has a more flexible curve shape, which can better adapt to the complex physiological changes and environmental impacts during the bacterial growth process. However, under the specific conditions of 30 °C and 10% relative humidity, the Logistic model had a slightly better fitting effect. This indicates that in a relatively dry environment, the Logistic model may more accurately describe the growth pattern of Staphylococcus aureus. This could be due to the fact that in dry conditions, the limiting factors for bacterial growth are relatively simple, and the simple and classic growth curve form of the Logistic model can better reflect this relatively stable growth mode.
Based on the simulation results of these models, we can fully leverage their advantages in practical applications. For air filtration systems, these models can be used to accurately predict the growth of microorganisms on the surface of activated carbon, thereby optimizing the service-life assessment and maintenance strategies of air filters. For example, according to the model prediction results, the filters can be replaced or cleaned in a timely manner before the bacterial growth may reach a relatively high level to ensure the efficient operation of the air filtration system and the indoor air quality. Meanwhile, in different temperature and humidity environments, a more suitable model can be selected for prediction to improve the accuracy and reliability of the prediction. For instance, the Gompertz model can be preferentially used under most conventional temperature and humidity conditions, while the Logistic model can be considered in dry environments.
4.2. Impact of Temperature and Humidity on Bacterial Growth
Numerous studies have shown that temperature and water activity do not affect bacterial growth independently. Instead, they are interrelated and act synergistically in the process of bacterial growth and reproduction. The results of this study reconfirm this view, with the research of Medveďová et al. being a notable example. They deeply explored the tolerance limits and growth response characteristics of
Staphylococcus aureus strain 2064 to reduced water activity at different temperatures [
31]. This corresponds to the focus of this study on the growth of
Staphylococcus aureus on the surface of activated carbon under different combinations of temperature and relative humidity (as an indicator of water activity). Both studies have taken into account the combined effects of these two key environmental factors on bacterial growth.
However, due to differences in experimental conditions and detection methods among various studies, there are also differences in the specific degree of the synergistic effect of temperature and water activity and the details of growth limitations. In the specific environment of the activated carbon surface in the air-conditioning filtration system of this study, we found that the inhibitory effects of changes in water activity on the growth of Staphylococcus aureus vary at different temperatures. At 20 °C, when the relative humidity increases from 50% to 75%, the inhibitory effect on bacterial growth is enhanced. At 30 °C, however, the trend of this inhibitory effect is different from that at 20 °C, and the differences in the amount of bacterial growth under different relative humidity levels are relatively small.
Upon in-depth analysis of the reasons, the filling effect of water on the pores of activated carbon cannot be ignored. In a high-humidity environment, water will fill the pore structure of activated carbon. When the temperature is 20 °C, excessive water filling the pores of activated carbon, on the one hand, hinders the contact between bacteria and nutrients, making it more difficult for bacteria to obtain nutrients. On the other hand, it may change the micro-environment on the surface of activated carbon, affecting the attachment and survival of bacteria, thus having a relatively strong inhibitory effect on bacterial growth. At 30 °C, although water also fills the pores of activated carbon, since this temperature is more suitable for bacterial growth, the metabolic activity of bacteria is relatively high, which offsets the adverse effects caused by pore filling to a certain extent. Therefore, the differences in bacterial growth amounts under different relative humidity levels are relatively less obvious.
5. Conclusions
This study deeply explored the growth and reproduction patterns of Staphylococcus aureus on the surface of activated carbon under controlled temperature and humidity conditions, with a focus on its application in air-conditioning filtration systems. The following key findings were obtained.
Temperature significantly affects the growth of Staphylococcus aureus. The research indicated that an environment of 30 °C is more conducive to the growth of this bacterium compared to 20 °C. Further investigation showed that at a temperature of 30 °C, a relative humidity of 50% provides the most suitable conditions for bacterial reproduction.
Regarding the prediction of microbial growth, two common models, the Logistic and Gompertz models, were applied to analyze the experimental data in this study. The results show that both models can fit the data well, with the coefficient of determination (R2) being greater than 0.9, indicating a high prediction accuracy. Although the Gompertz model generally performs slightly better in most cases, under the specific conditions of 30 °C and 10% relative humidity, the fitting effect of the Logistic model is relatively better. The good performance of these two models in this study provides practical references for researchers to use existing models to study such problems.
For subsequent research, it is recommended to introduce advanced visualization techniques such as confocal microscopy and consider environmental factors like nutrient competition to further explore the growth mechanism of microorganisms on the surface of activated carbon. This can help improve the relevant theoretical system and enhance the effectiveness of research results in practical applications. The findings of this study have positive implications for improving indoor air quality and safeguarding human health, and are expected to provide useful references for research and practice in related fields.


