Article

Physical and Microscopic Characterization of Thermal Treatment Products of Plant Waste for Recycling in Sustainable Construction

Faculty of Civil Engineering, National University of Engineering, Lima 150128, Peru
*
Author to whom correspondence should be addressed.
Buildings 2025, 15(6), 870; https://doi.org/10.3390/buildings15060870
Submission received: 8 December 2024 / Revised: 27 February 2025 / Accepted: 7 March 2025 / Published: 11 March 2025
(This article belongs to the Section Building Materials, and Repair & Renovation)

Abstract

Organic plant waste is a significant source of environmental pollution, necessitating proper disposal methods. One sustainable approach is recycling this waste for beneficial applications. Recent studies have explored the potential of incorporating organic waste into construction materials. In this study, selected municipal organic wastes—orange peel, corn cob and husk, pineapple leaf, and garden grass—were characterized and evaluated for their suitability in mortar and concrete production. A preliminary assessment involved substituting various percentages of sand with these organic residues in mortar mixtures. Among the tested materials, garden grass yielded the most promising results, exhibiting compressive strengths comparable to the control sample after seven days of curing. Based on these findings, mortar and concrete samples were prepared with 5% and 10% volumetric replacement of sand by grass. After seven days of curing, mortar samples with 5% and 10% grass replacement achieved 88% and 74.6% of the control sample’s compressive strength, respectively. Similarly, concrete samples reached 87% and 85% of the control strength after 28 days of curing. These results suggest that recycling garden grass as a partial sand substitute in mortar and concrete is a viable option. However, further research is necessary to determine the optimal substitution percentage and to evaluate long-term durability, ensuring safe and effective implementation in construction applications.

1. Introduction

Environmental pollution caused by human activities is one of the most pressing global concerns today. A significant portion of municipal solid waste consists of organic materials, such as food scraps and pruning waste. Various disposal and treatment methods exist for managing this waste, and the construction sector has shown increasing interest in reducing the environmental impact of its operations. Previous studies have investigated the use of organic waste in construction materials, such as eggshells as a cement substitute [1], ashes from various plant residues [2,3], sawdust [4], dried corn husk fibers [5], corn cob [6], corn cob and sawdust [7] and corn cob waste [8].
These organic residues have undergone various processing methods, including air drying, oven drying, and autoclaving at different temperatures and durations, depending on the selected drying technique. The resulting materials—such as charcoal, particles, and fibers—were chopped or ground into different sizes for diverse applications, including the production of mortars and cement concretes. These materials have demonstrated promising performances in terms of compressive strength, tensile strength, and other mechanical properties while offering a lower environmental impact by reducing the consumption of non-renewable resources.
Drying, in this context, refers to the process of producing solid materials by removing water through heating [9]. Various drying methods for organic residues have been developed to extend their shelf life [10]. In recent years, the drying of fruits and vegetables has gained considerable attention for preservation purposes, as water removal reduces many moisture-driven deterioration reactions that compromise bioproduct quality [11].
Incorporating organic waste into construction materials supports sustainability by decreasing the exploitation of natural resources and promoting a circular economy. Specifically, the integration of organic residues as partial replacements for traditional aggregates in concrete presents an innovative solution to mitigate environmental impact, aligning with the construction industry’s growing commitment to sustainability.
Fonseca et al. [12] studied Amazonian fibers comparing them with the behavior of jute fiber, pointing out that Piassava, tucum palm and grass fibers have no studies on the influence of their physical and chemical properties within cementitious matrices. The fibers were chemically characterized to quantify cellulose, extractives, lignin and ash. Fibers with high cellulose content usually present superior tensile strength. The treatment of washing in hot water was carried out. The hornification treatment process consisted of the application of 10 wetting/drying cycles. The hybridization treatment process consisted of: washing in hot water; the hornification cycles process; treatment with NaOH; and finally, the application of 5% hydrogen peroxide solution. After that, compressive tests were conducted in order to evaluate compressive strength variation. Ahmed et al. [4] conducted similar tests, but using sawdust as replacement of sand.
Experimental tests conducted by [4,12] used mortars with a mass ratio of 1:2 (binder to sand) and a water to cement (w/c) of 0.5–0.6. The fibers were saturated for 24 h before molding. In the case of the substitution of plant residues, the percentages of substitution of the aggregates varied between 0 and 15% of the total volume of dry sand. Both studies yielded good results for resistance to compression and bending [4,12]. Additionally, the internal structure of the fibers (with the separation into microfibrils) allowed good fiber/matrix adhesion [12].
This study focuses on the physical and microscopic characterization of materials derived from the thermal treatment of plant-based waste, assessing their potential as sustainable aggregate alternatives. The research aims to contribute to more responsible construction practices by encouraging waste utilization and reducing environmental pollution, which is why it was aimed at finding new waste alternatives and analyzing the possibility of simplifying treatments by reducing drying time and energy use in the process and achieving the necessary results for its use in structural applications.

2. Materials and Methods

The stages of the process are shown in Figure 1. Samples were then characterized, and exploratory tests were carried out to select the one with the best results and carry out the final tests with it.
The definition of waste to be analyzed was carried out by observing the type of waste and the quantities discarded in various markets and in homes in different areas of the city, randomly selecting those with the greatest presence.

2.1. Components of Mortar and Concrete

2.1.1. Vegetable Waste

Samples of organic wastes, including orange peel, corn cob, corn husk, pineapple leaf, and grass were evaluated, as shown in Figure 2. The preparation process involved air-drying the plant waste for four days, followed by oven drying in three cycles with incremental temperature increases from 50 °C to 100 °C until a constant weight was achieved. After drying, the plant residues were cut or crushed to particle sizes comparable to coarse and medium sand. These processed materials were then blended with standard sand for testing.
For sample characterization, Scanning Electron Microscopy (SEM) was used to analyze the surface morphology, while X-ray spectrometry was employed to determine the chemical composition and elemental analysis. Additionally, the cellulose content was assessed before and after UV exposure using an Elemental Analyzer in conjunction with infrared spectroscopy.

2.1.2. Cement

The components of cement type Portland I are listed in Table 1. Its physical properties comply with the requirements of ASTM C150 [13] indicated in Table 2.

2.1.3. Fine Aggregate

The particle size was evaluated according to ASTM C136 [14] for fine aggregates. Table 3 shows the granulometric analysis of the sand used; the fineness modulus obtained was 2.84. Figure 3 shows the sieve analysis curve, which falls within the range recommended by ASTM C136 [14].
Table 4 presents the physical properties of sand, along with the corresponding reference standards. The values fall within the limits recommended by the indicated standards, considered for the mix design.

2.1.4. Coarse Aggregate

The coarse aggregate used in this study was a natural material commonly employed in construction. Table 5 presents the physical properties of the coarse aggregate, along with the corresponding reference standards. Its particle size distribution met the requirements of ASTM C136 standard [14], allowing the aggregate to be utilized for the mix design. Furthermore, the granulometric analysis yielded a fineness modulus of 7.40. Other properties of the coarse aggregate are shown in Table 5.

2.2. Experimental Program

2.2.1. Exploratory Tests

Exploratory tests were carried out with the five residues using compression tests of mortar mixtures with various percentages of sand replacement after 7 days of curing.
  • Mortar Mix Design: Table 6, Table 7 and Table 8 present thirteen mortar mixes with sand substitutions in weight proportions of 0.2–0.6%, 0.6–1.2% and 1.2–1.8% of the natural sand weight, respectively. The water/cement ratio (w/c) of 0.63 was kept constant.
  • Production of Cubical Mortar Specimens: The mortar mixture is prepared according to ASTM C305 [18]. During the mortar mixing process, the waste particles were added simultaneously with fine aggregate. Then, mortar cubes of 50 mm per side were molded in accordance with ASTM C109 [19]. For each design, three cubes were molded, making a total of 39 samples. The specimens remained in the molds for 24 h, after which they were removed and cured in alkaline water (3 g of lime per liter) for proper hydration over a period of 7 days, as shown in Figure 4.
  • Mortar Compressive Strength: Eighteen cubic mortar samples were tested in accordance with ASTM C109/109M [19], at a curing age of 7 days, as shown in Figure 5.

2.2.2. Tests with the Residue with the Best Results

With the residue with the best results in the exploratory tests, samples of mortars and concrete were prepared and tested with sand replacement percentages of 5% and 10% by volume.
  • Mix Design: Table 9 presents six concrete dosages with water/cement (w/c) ratio of 0.57 constant, and sand substitutions with grass in volumetric proportions of 5% and 10% (CG-5% and CG-10%) of the natural sand volume.
  • Production of Cylindrical Concrete Specimens: The concrete mixture was prepared in accordance with ASTM C192 [20]. During the mixing process, saturated waste particles were incorporated along with the fine aggregate. Cylindric specimens were molded in accordance with ASTM C192 [20]. For each design, 10 cylindric specimens were molded, making a total of 30 samples. The specimens remained in the molds for 24 h before being removed and cured in alkaline water (3 g of lime per liter) for 7, 14, and 28 days to ensure proper hydration, as shown in Figure 6.
  • Concrete Slump Testing: The concrete slump test was determined in accordance with ASTM 143 [21]. Figure 7 shows this test.
  • Unit Weight of Concrete: The unit weights of the three types of concrete were determined in accordance with ASTM C138 [22]. Figure 8 presents the weights obtained for each type of concrete tested.
  • Setting Time of Concrete: The setting time was measured in accordance with ASTMC403/403M [23], as shown in Figure 9. The initial and final setting times were also determined, and the corresponding graphs were plotted.
  • Concrete Temperature Testing: The temperature of the three types of concrete was tested, as shown in Figure 10. The values obtained range from 19.2 °C to 21.3 °C.
  • Compressive Tests: Thirty concrete samples were tested in accordance with ASTM C39 [24], as shown in Figure 11, at curing ages of 7, 14, and 28 days.

3. Results and Discussion

3.1. Botanical Identification

The samples were identified as Citrus aurantium L. (orange peel), Zea mays L. (corn cob, corn husk), Ananas comosus (L.) Merr. (pineapple leaf), and Stenotaphrum secundatum (grass), as shown in Table 10.

3.2. Microscopic Images of Vegetal Waste

Scanning Electron Microscopy was used to analyze the surface morphology of each sample, as shown in Figure 12. The analysis revealed that the residues exhibited varied surface structures, ranging from elongated forms to particles with voids of different sizes. These structural differences likely influenced the compressive strength results. Notably, corn cob and grass—both of which achieved the best results—had fewer voids. Grass, which outperformed all other residues, displayed the greatest compactness and was the only material with an elongated structure.
Figure 13 shows the epidermis of Kikuyu grass [25]. It shows a configuration like the American grass analyzed in the present study. The superior performance of grass is attributed to the dense internal structure and its thin, elongated shape which facilitates better integration into the mortar mix when proper mixing procedures are followed.

3.3. Chemical Elements of Waste Materials

The chemical elements of the vegetal waste are shown in Figure 14 as weight percentages.
From the results in Table 11, the most relevant is the higher silica content of the corn husk, which gives it a greater pozzolanic potential.

3.4. Elemental Analysis of Waste

Table 12 shows the percentages of carbon, oxygen and nitrogen in each waste.
The carbon, hydrogen, and nitrogen contents were similar across all samples, suggesting these elements had no significant impact on the compressive strength results.

3.5. Cellulose Content Before and After UV Exposure

Table 13 and Table 14 shows the cellulose content before and after 7 days UV exposure, respectively.
Cellulose content was consistent across most samples, except for pineapple leaf, which exhibited a higher cellulose content but resulted in the lowest compressive strength. Initially, it was hypothesized that cellulose content would significantly affect strength due to its role as a structural component, but this was not confirmed.
Although no direct correlation was found between cellulose content and compressive strength, the internal configuration of the residues—where cellulose serves as a structural component—appears to influence performance.
In general, plant fibers with a higher cellulose content have a higher tensile strength and better results are obtained in samples with these materials in tests in other studies, mainly in tensile and bending strength [12].
A 7-day UV exposure did not significantly reduce the cellulose content, suggesting minimal degradation over this period. This analysis was conducted based on the initial hypothesis that cellulose content might influence performance and degrade over time.

3.6. Results of Exploratory Tests

The compressive strength of the waste mortar cubes in the exploratory tests, at a curing age of 7 days, is shown in Table 15 and Figure 15. The control samples had a compressive strength of 25.89 MPa and the highest strengths were up to 27.81 MPa with 0.21% substitution of sand by grass while the lowest strengths were obtained with orange peel and pineapple leaf.
The incorporation of fiber showed an increase at 0.1–0.2%, while at fiber contents exceeding 0.2%, the mortar strength started to decline. The incorporation of 0.2% vol. of jute fiber could increase the concrete strength of High Strengh Concrete by 8.6% [26].
In this study, this increase is only observed in the case of replacing the fine aggregate with grass at 7% with dosages similar to those reported by Alomayri [26].

3.7. Results of Mortar with Grass Tests

Using grass—the residue that demonstrated the best compressive strength performance—27 mortar cubes were prepared with 5% and 10% sand substitution by volume. These samples were subjected to compressive strength testing at curing ages of 7 and 28 days. The results obtained are shown in Table 16.
The aggregate replacement percentages used in the study are similar to other references between 0 and 10% plant waste of total dry volume of sand [4,12,27].
Figure 16 and Table 17 show the compressive strength values of the mortar specimens of the pattern and the dosages, at 7, 14 and 28 days.
Figure 17 shows the average compressive strength values for 7, 14, and 28 days in three dosages.
The results obtained indicate that the proportion of grass is a factor influencing the material’s compressive strength, showing that strength decreases as the grass content in the mix increases as in other studies [26].
On the other hand, it is observed that, unlike the standard samples in which the compressive strength increases with time, in the case of samples with grass, the strength increases at 14 days but decreases at 28 days.

3.8. Results of Concrete with Grass Tests

3.8.1. The Concrete Slump Testing

Applying the ASTM C143 [21], Table 18 shows the concrete slump of the standard concrete (PC) and the concrete with grass 5% and 10% (CG-5% and CG-10%).
Concrete workability increased with higher proportions of sand replaced by grass waste, ranging from 11% to 28%. On the contrary, Alomayri, T. and Ali, B. [26] point out that studies report that workability is reduced with the rise in fiber content from 37% to 24% at 0.5% vol. despite the fibers being incorporated in a saturated form to prevent them from absorbing water from the mixture.
If in the case studied the fibers had an excess of water, this could have been reflected in a reduction in strength, so if the water is controlled more precisely to avoid the increase in the workability of the mixture, an improvement in strength would be expected by reducing the w/c ratio of the mixture.

3.8.2. Other Properties

Table 19 presents the volumetric weight. The volumetric weight of three concrete dosages was slightly reduced by 1 and 2% for the replacement of 5 and 10%, respectively, which is attributed to the increase in air in the mix due to the inclusion of plant material.
Figure 18 shows setting times for standard concrete (PC), CG-5%, and CG-10%, in accordance with ASTM C305-20 [20]. The setting time of the concrete with addition of grass was evaluated for CG-5% and CG-10%, as these mixes exhibited the best strength performance among the thirteen designs studied in exploratory tests. A slightly increase in setting time was observed for the 5% substitution mixture, while the 10% substitution mixture showed a 13% increase compared to the standard mix.

3.8.3. Compressive Strength

Table 20 and Table 21 present the results of these tests according to ASTM C31 [28].
Figure 19 and Figure 20 show the compressive strength of each specimen and the average compressive strength obtained for 7, 14, and 28 days in three dosages. The compressive strength of the residue-modified samples was 10–15% lower than the standard mixture, varying with the replacement percentage and curing time.
The compressive strength results were higher than those obtained in the study by Varas and Areche [8], but lower than those reported by Ahmed et al. [4]. However, all obtained compressive strength values are suitable for structural use.
According to Salem et al. and Kammoun and Trabelsi, cited by Fonseca et al. [12], the decrease in the compressive strength of composites can be attributed to several factors, among them: the increase in the air content, the low mechanical strength of these materials, and the increase in porosity in the matrix or lower adhesion of fiber/matrix.

4. Conclusions

Based on the analysis of the results, the following conclusions were reached:
  • In the exploratory tests, the study evaluated residues from orange peel, corn cob, corn husk, pineapple leaves, and garden grass. Grass yielded the highest compressive strength in mortar.
  • Substituting sand with 0.21% grass residue increased the mortar’s compressive strength by 7.4%. For grass contents up to 1.2%, compressive strength remained stable, but declined when grass content exceeded 1.2%.
  • Concrete workability increased with higher proportions of sand replaced by grass waste, ranging from 11% to 28%,. However, according to what was observed, this could be reduced with better water dosage control, as the waste is added in a saturated form.
  • The unit weight of the modified mixtures was comparable to that of the standard mixture for both 5% and 10% substitution levels.
  • The setting time was slightly increased in the 5% substitution mixture but significantly increased in the 10% substitution mixture compared to the standard mix.
  • Based on the results, up to 137 kg of natural sand per 1 m3 of mortar and 90 kg per 1 m3 of concrete can be replaced with grass residue.
  • For both concrete mix designs, compressive strengths of up to 27 MPa were achieved, supporting the feasibility of using up to 10% grass substitution in structural applications.
  • Using grass as a substitute for natural fine aggregate, with a fineness modulus of 2.84 and a curing time of 28 days, is a viable and sustainable option.
According to the results, it is possible to reduce both the time and energy used in the drying process of the grass, all while achieving the necessary compressive strength for structural applications. However, further testing is needed to evaluate resistance to other stresses, particularly tensile and flexural strength, as well as long-term behavior under different exposure conditions. Furthermore, due to the nature of these materials, it is considered that more studies should be carried out to better understand the relationship between the microscopic characteristics of the waste and the physical and mechanical behavior of the mortars and concretes incorporating it. Testing should not be limited to those materials typically used in construction.

Author Contributions

Conceptualization, I.M.; methodology, I.M.; software, J.M.; Validation, I.M.; Formal analysis, I.M., C.V., C.R. and L.S.; Investigation, I.M., C.V., C.R., L.S., A.T. and J.M., resources, C.R., L.S., I.M., C.V. and A.T.; data curation, I.M.; writing—Original draft preparation, I.M.; review and editing, A.T.; visualization, J.M.; supervision, I.M.; project administration, I.M.; funding acquisition, I.M. All authors have read and agreed to the published version of the manuscript.
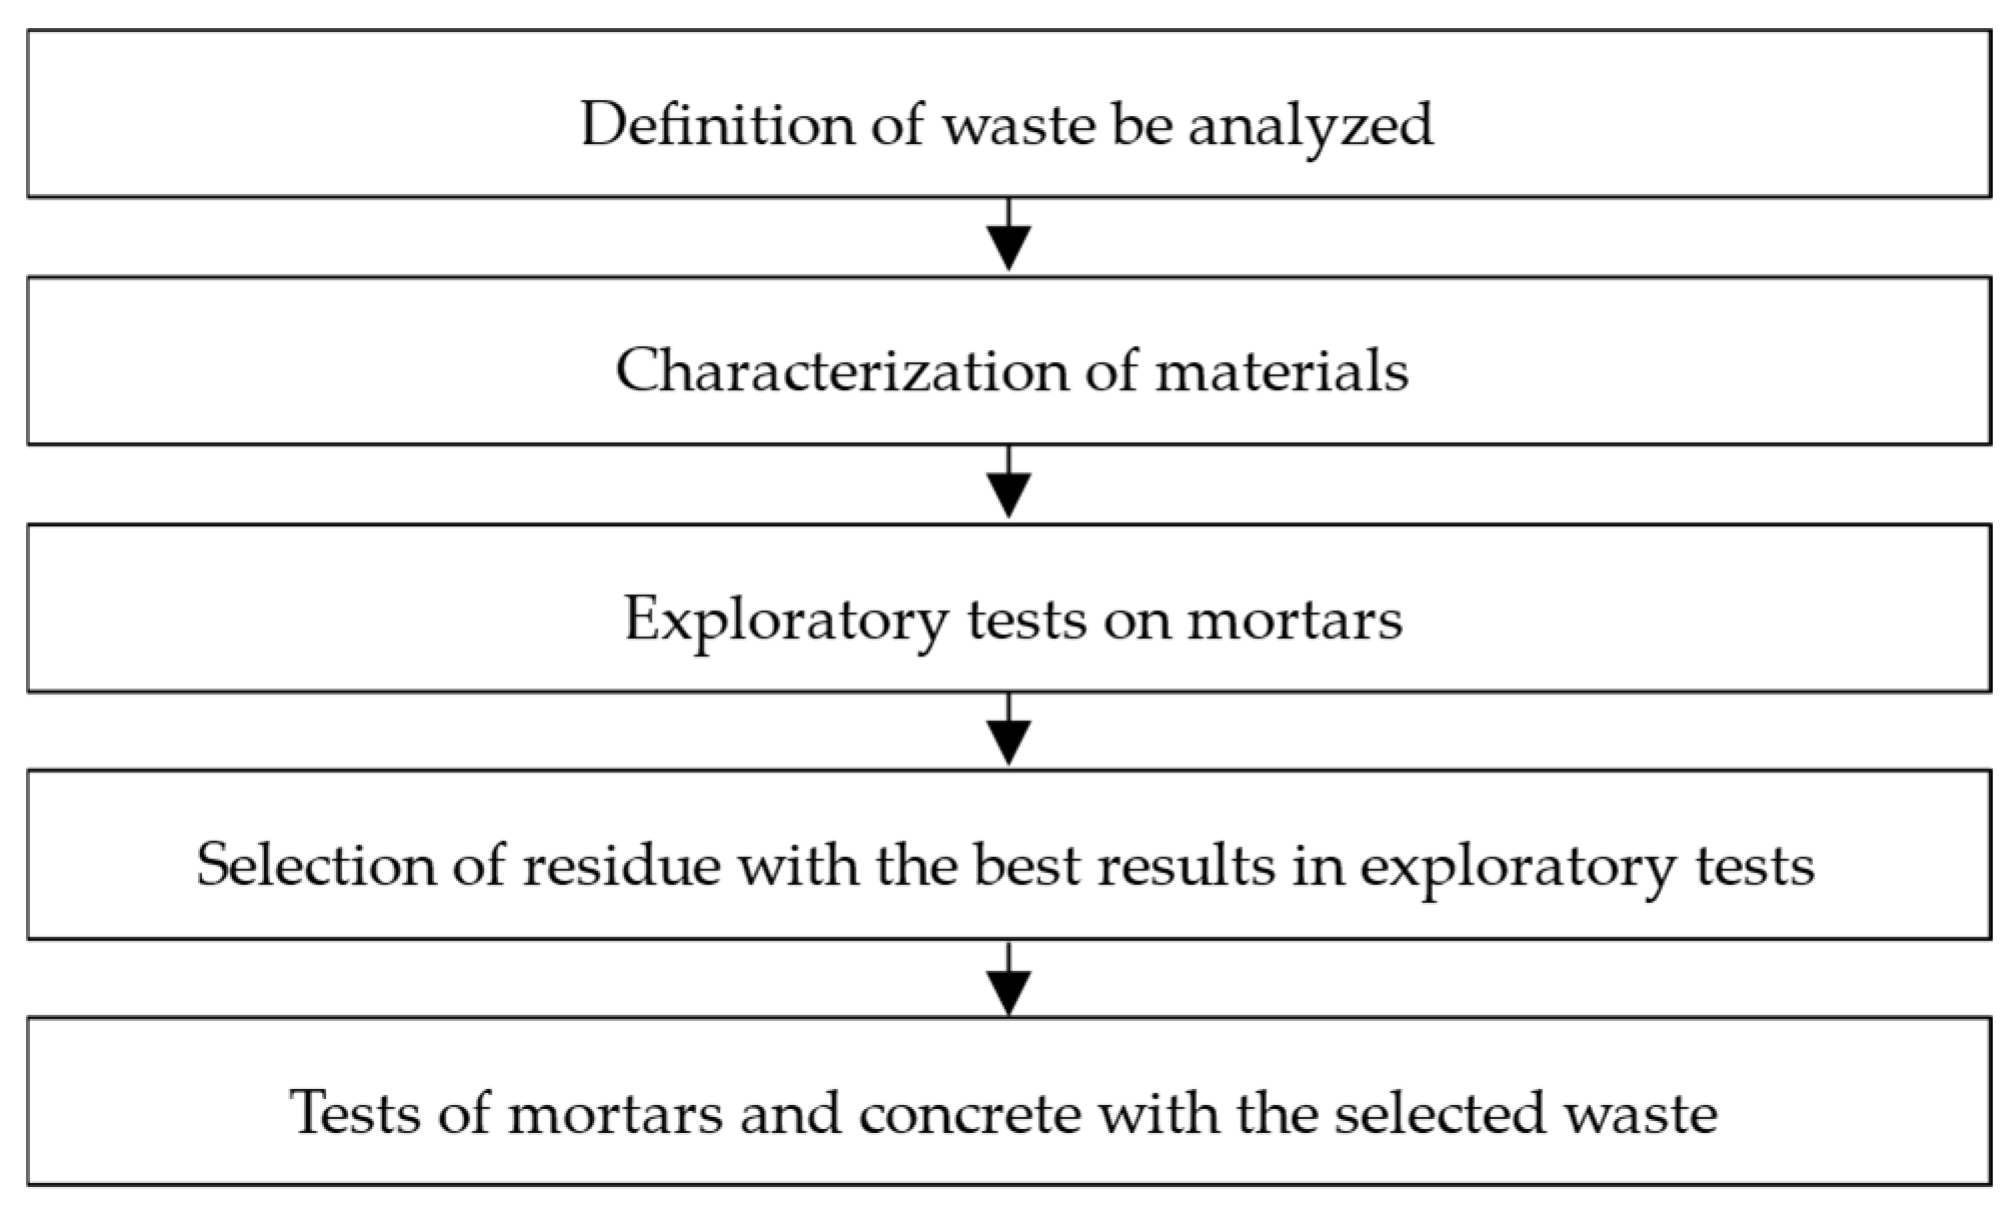
Funding

This research was funded by Research Vice-Rectorate of the National Engineering University, Lima, Peru, under project code FIC-PFR-32-2023.

Data Availability Statement

Additional data will be available upon request.

Acknowledgments

We acknowledge to the Chemistry Laboratory and the Materials Testing Laboratory of the Faculty of Civil Engineering, as well as the Center for the Development of Advanced Materials and Nanotechnology—CEMAT and the Research and Certification Laboratory—LABICER of the Faculty of Sciences for their support.

Conflicts of Interest

The authors declare no conflicts of interest.

References

  1. Paruthi, S.; Khan, A.H.; Kumar, A.; Kumar, F.; Hasan, M.A.; Magbool, H.M.; Manzar, M.S. Sustainable Cement Replacement Using Waste Eggshells: A Review on Mechanical Properties of Eggshell Concrete and Strength Prediction Using Artificial Neural Network. Case Stud. Constr. Mater. 2023, 18, e02160. [Google Scholar] [CrossRef]
  2. Wu, N.; Ji, T.; Huang, P.; Fu, T.; Zheng, X.; Xu, Q. Use of Sugar Cane Bagasse Ash in Ultra-High Performance Concrete (UHPC) as Cement Replacement. Constr. Build. Mater. 2022, 317, 125881. [Google Scholar] [CrossRef]
  3. Henry, C.S.; Lynam, J.G. Embodied Energy of Rice Husk Ash for Sustainable Cement Production. Case Stud. Chem. Environ. Eng. 2020, 2, 100004. [Google Scholar] [CrossRef]
  4. Ahmed, W.; Khushnood, R.A.; Memon, S.A.; Ahmad, S.; Baloch, W.L.; Usman, M. Effective Use of Sawdust for the Production of Eco-Friendly and Thermal-Energy Efficient Normal Weight and Lightweight Concretes with Tailored Fracture Properties. J. Clean. Prod. 2018, 184, 1016–1027. [Google Scholar] [CrossRef]
  5. Vilchez Vela, B.; Vela, G.O.B.V.; Carlos Asesor, R.; Reyes, M.I.C.; Janet, L. Diseño de Concreto con Adición de Fibras secas de Maíz para Habilitaciones en el Distrito de Villa María del Triunfo Año 2019. Bachelor’s Thesis, Ricardo Palma University, Lima, Peru, 2019. [Google Scholar]
  6. Bocanegra, C. Sustitución de 5 y 10% de Cemento Por Ceniza de Tusa de Maíz en la Resistencia a la Compresión de un Mortero. Bachelor’s thesis, San Pedro University, Ancash, Peru, 2018. [Google Scholar]
  7. Ydrogo Perez, B.; Raymundo, C.; Pico, R.; Antonio, Á. Elaboración de Concreto Incorporando Puzolana de Mazorca de Maíz y Aserrín Calcinado como Sustituto Parcial del Cemento. Bachelor’s thesis, Señor de Sipán University, Lambayeque, Peru, 2023. [Google Scholar]
  8. Varas Ramírez, J.B.; Areche García, J.N. Comportamiento Mecánico Del Adoquín de Hormigón Adicionando Residuos Orgánicos Del Maíz. Dom. Cienc. 2021, 7, 148–168. [Google Scholar] [CrossRef]
  9. Mujumdar, A.S.; Devahastin, S. Fundamental Principles of Drying; Exergex: Brossard, QC, Canada, 2020; pp. 1–22. [Google Scholar]
  10. Richter Reis, F.; Marques, C.; de Moraes, A.C.S.; Masson, M.L. Trends in Quality Assessment and Drying Methods Used for Fruits and Vegetables. Food Control 2022, 142, 109254. [Google Scholar] [CrossRef]
  11. Karam, M.C.; Petit, J.; Zimmer, D.; Baudelaire Djantou, E.; Scher, J. Effects of Drying and Grinding in Production of Fruit and Vegetable Powders: A Review. J. Food Eng. 2016, 188, w/c 32–49. [Google Scholar] [CrossRef]
  12. Fonseca, R.P.D.; Rocha, J.C.; Cheriaf, M. Influence of Different Types of Treatments on Amazonian Vegetable Fibers on the Performance of Mortars Based on Portland Cement, Metakaolin and Fly Ash. Mater. Res. 2021, 24, e20210320. [Google Scholar] [CrossRef]
  13. ASTM C150-07; Standard Specification for Portland Cement. ASTM International: West Conshohocken, PA, USA, 2012.
  14. ASTM C 136-06; Standard Test Method for Sieve Analysis of Fine and Coarse Aggregates. ASTM International: West Conshohocken, PA, USA, 2006.
  15. ASTM C29/C29M-23; Standard Test Method for Bulk Density (“Unit Weight”) and Voids in Aggregate. ASTM International: West Conshohocken, PA, USA, 2023.
  16. ASTM C128-04; Standard Test Method for Density, Relative Density (Specific Gravity), and Absorption. ASTM International: West Conshohocken, PA, USA, 2004.
  17. ASTM C-566-19; Standard Test Method for Total Evaporable Moisture Content of Aggregate by Drying. ASTM International: West Conshohocken, PA, USA, 2019.
  18. ASTM C305-20; Standard Practice for Mechanical Mixing of Hydraulic Cement Pastes and Mortars of Plastic Consistency 1. ASTM International: West Conshohocken, PA, USA, 2020.
  19. ASTM C109/C109M; Standard Test Method for Compressive Strength of Hydraulic Cement Mortars. ASTM International: West Conshohocken, PA, USA, 2021.
  20. ASTM C192/C192M-19; Standard Practice for Making and Curing Concrete Test Specimens in the Laboratory. ASTM International: West Conshohocken, PA, USA, 2019.
  21. ASTM C143/C143M-12; Standard Test Method for Slump of Hydraulic-Cement Concrete. ASTM International: West Conshohocken, PA, USA, 2015.
  22. ASTM C138/C138M—17a; Standard Test Method for Density (Unit Weight), Yield, and Air Content (Gravimetric) of Concrete 1. ASTM International: West Conshohocken, PA, USA, 2017.
  23. ASTM C403/C403M—16; Standard Test Method for Time of Setting of Concrete Mixtures by Penetration Resistance. ASTM International: West Conshohocken, PA, USA, 2016.
  24. ASTM C39/C39M; Standard Test Method for Compressive Strength of Cylindrical Concrete Specimens. ASTM International: West Conshohocken, PA, USA, 2001.
  25. Robles, R.T.; Cano López, M.N.; Anell, J.A. Obtención de Bioetanol a Partir de Pasto Kikuyo (Pennisetum clandestinum). Rev. Iberoam. Cienc. 2018, 5, 1–23. [Google Scholar]
  26. Alomayri, T.; Ali, B. Effect of Plant Fiber Type and Content on the Strength and Durability Performance of High-Strength Concrete. Constr. Build. Mater. 2023, 394, 132166. [Google Scholar] [CrossRef]
  27. Diaz-Flota, O.S.; Yeladaqui-Tello, A.; Jiménez, L.F.; Vega-Azamar, R.E.; Trejo-Arroyo, D.L.; Cruz, J.C.; Gurrola, M.P. Application of Natural Organic Additives in Cement-Based Mixtures: State of the Art. Rev. Int. Investig. Innov. Tecnol. 2023, 60, 67–89. [Google Scholar]
  28. ASTM C31-19; Standard Practice for Making and Curing Concrete Test Specimens in the Field. ASTM International: West Conshohocken, PA, USA, 2019.
Figure 1. The stages of the process.
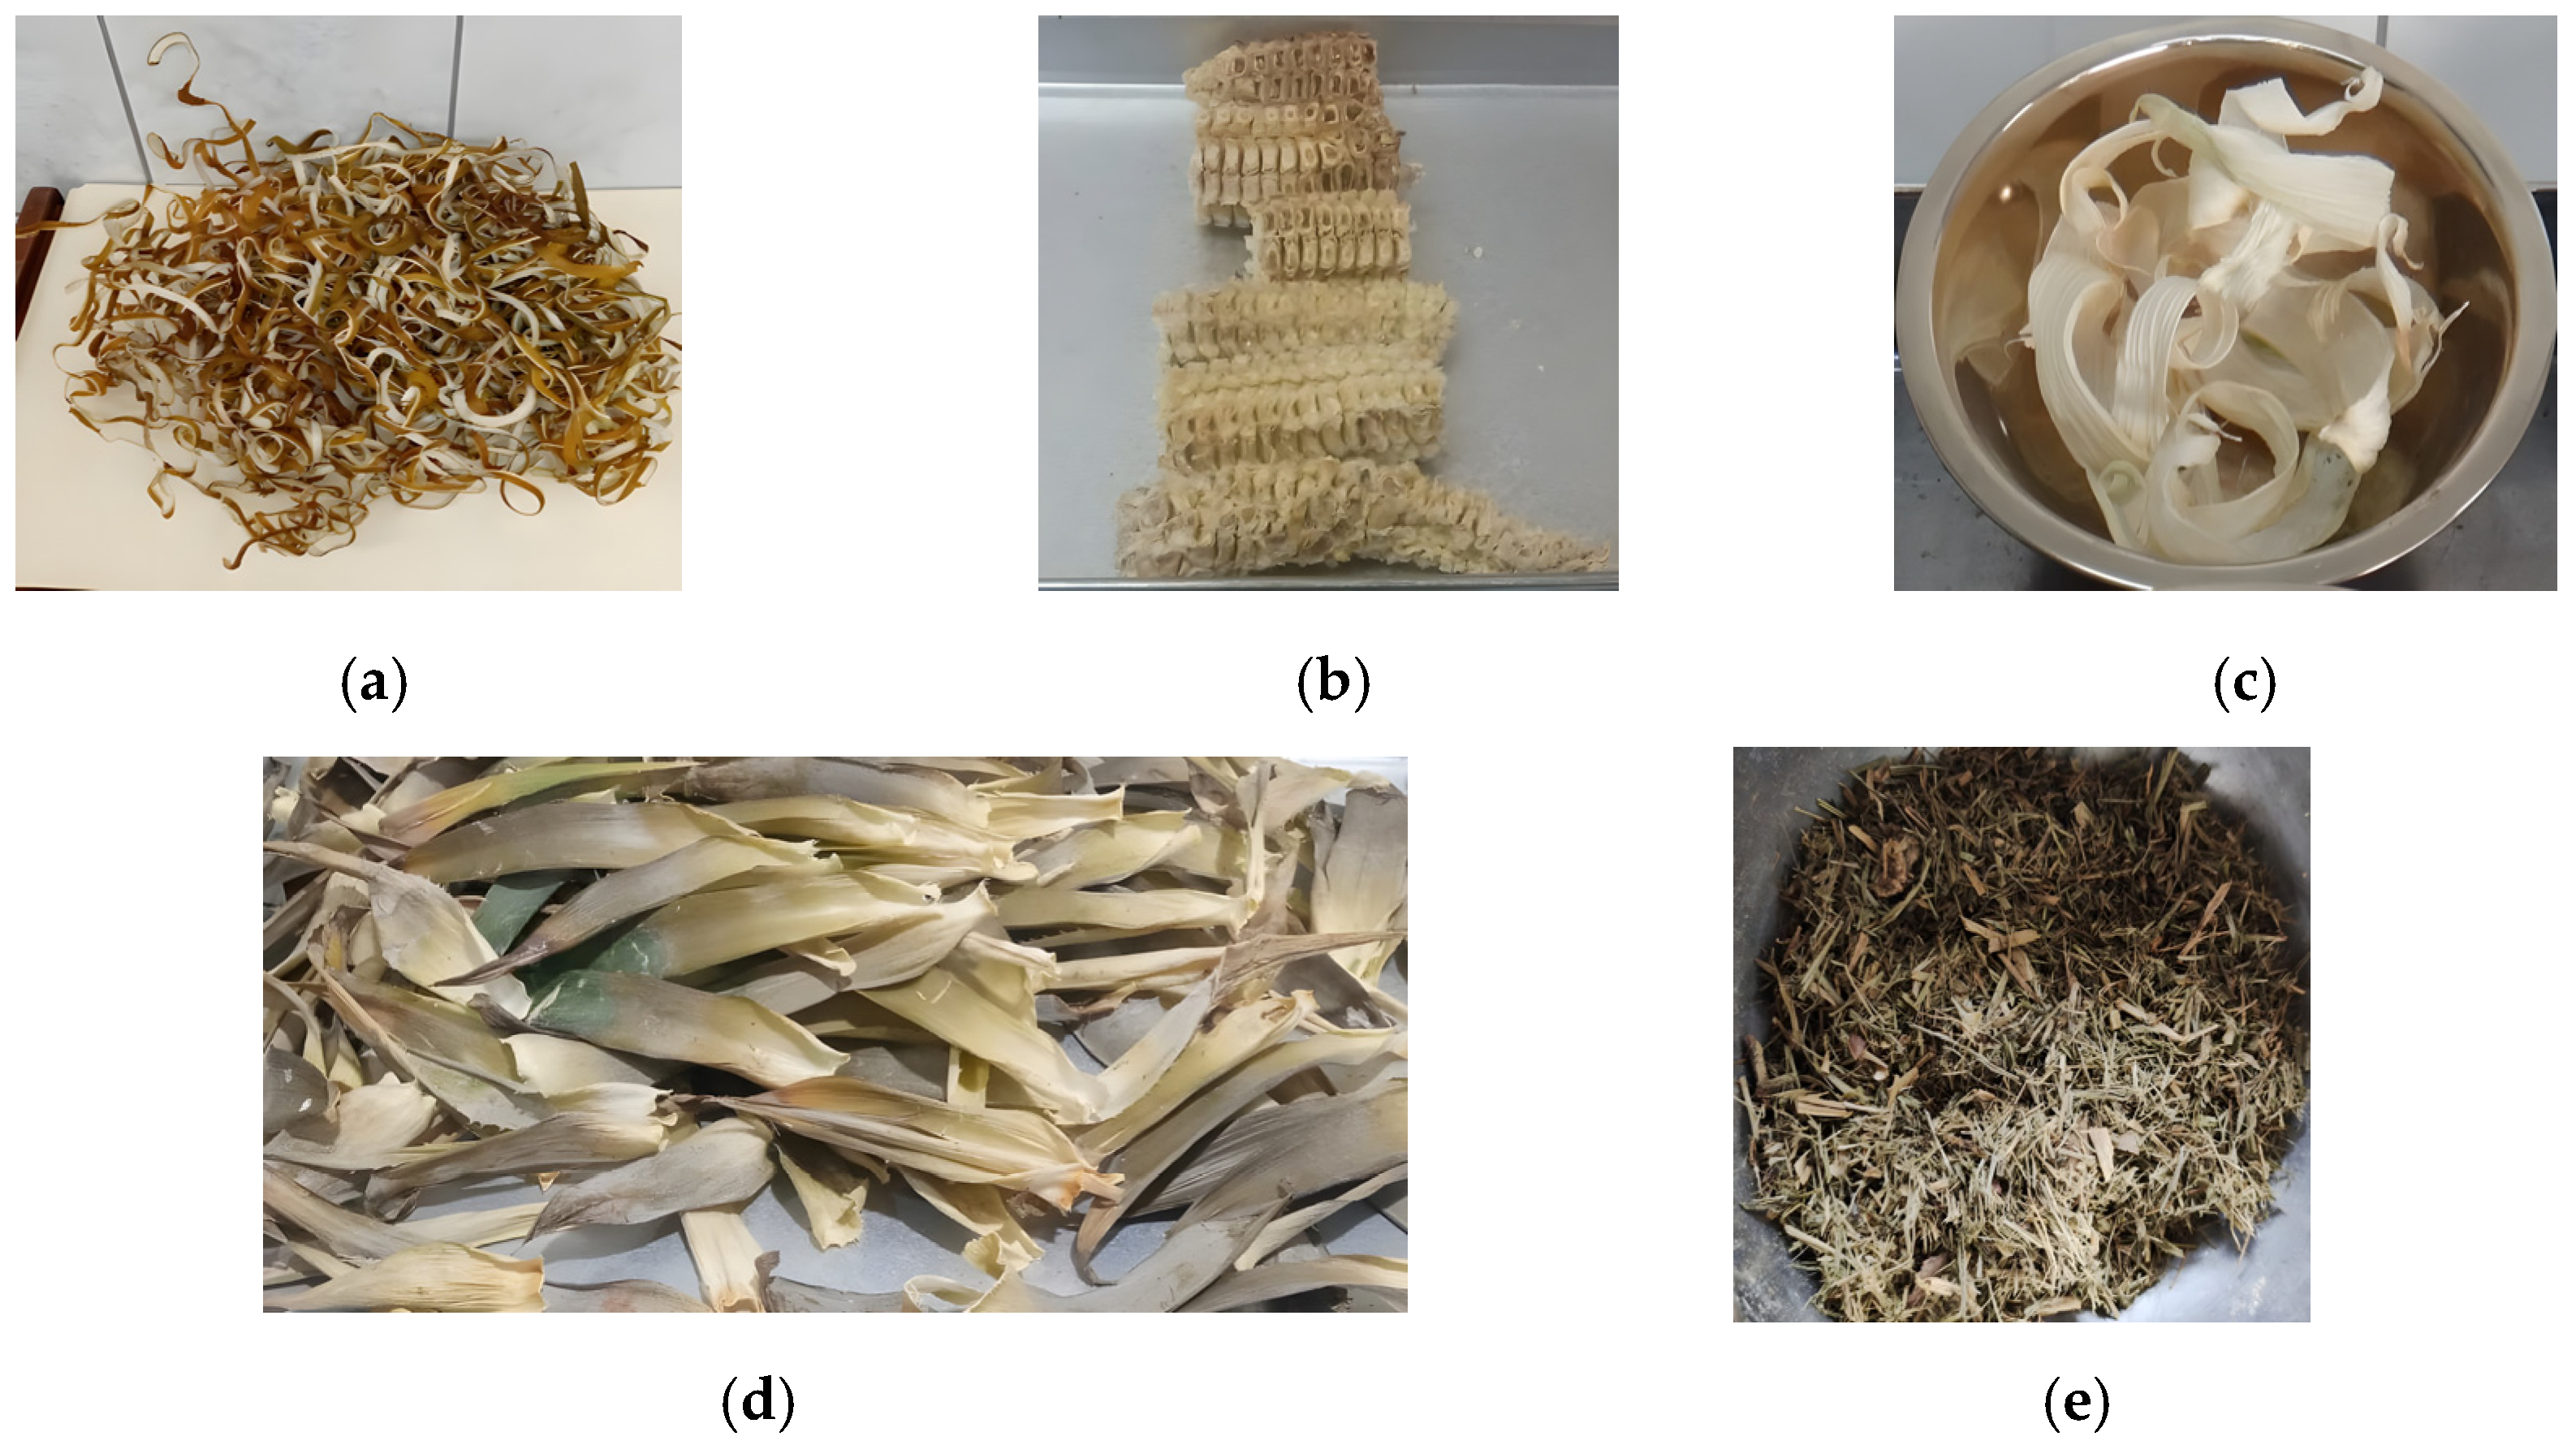
Buildings 15 00870 g001
Figure 2. Dried samples: (a) Orange peel; (b) Corn cob; (c) Corn husk; (d) Pineapple leaf; (e) Grass.
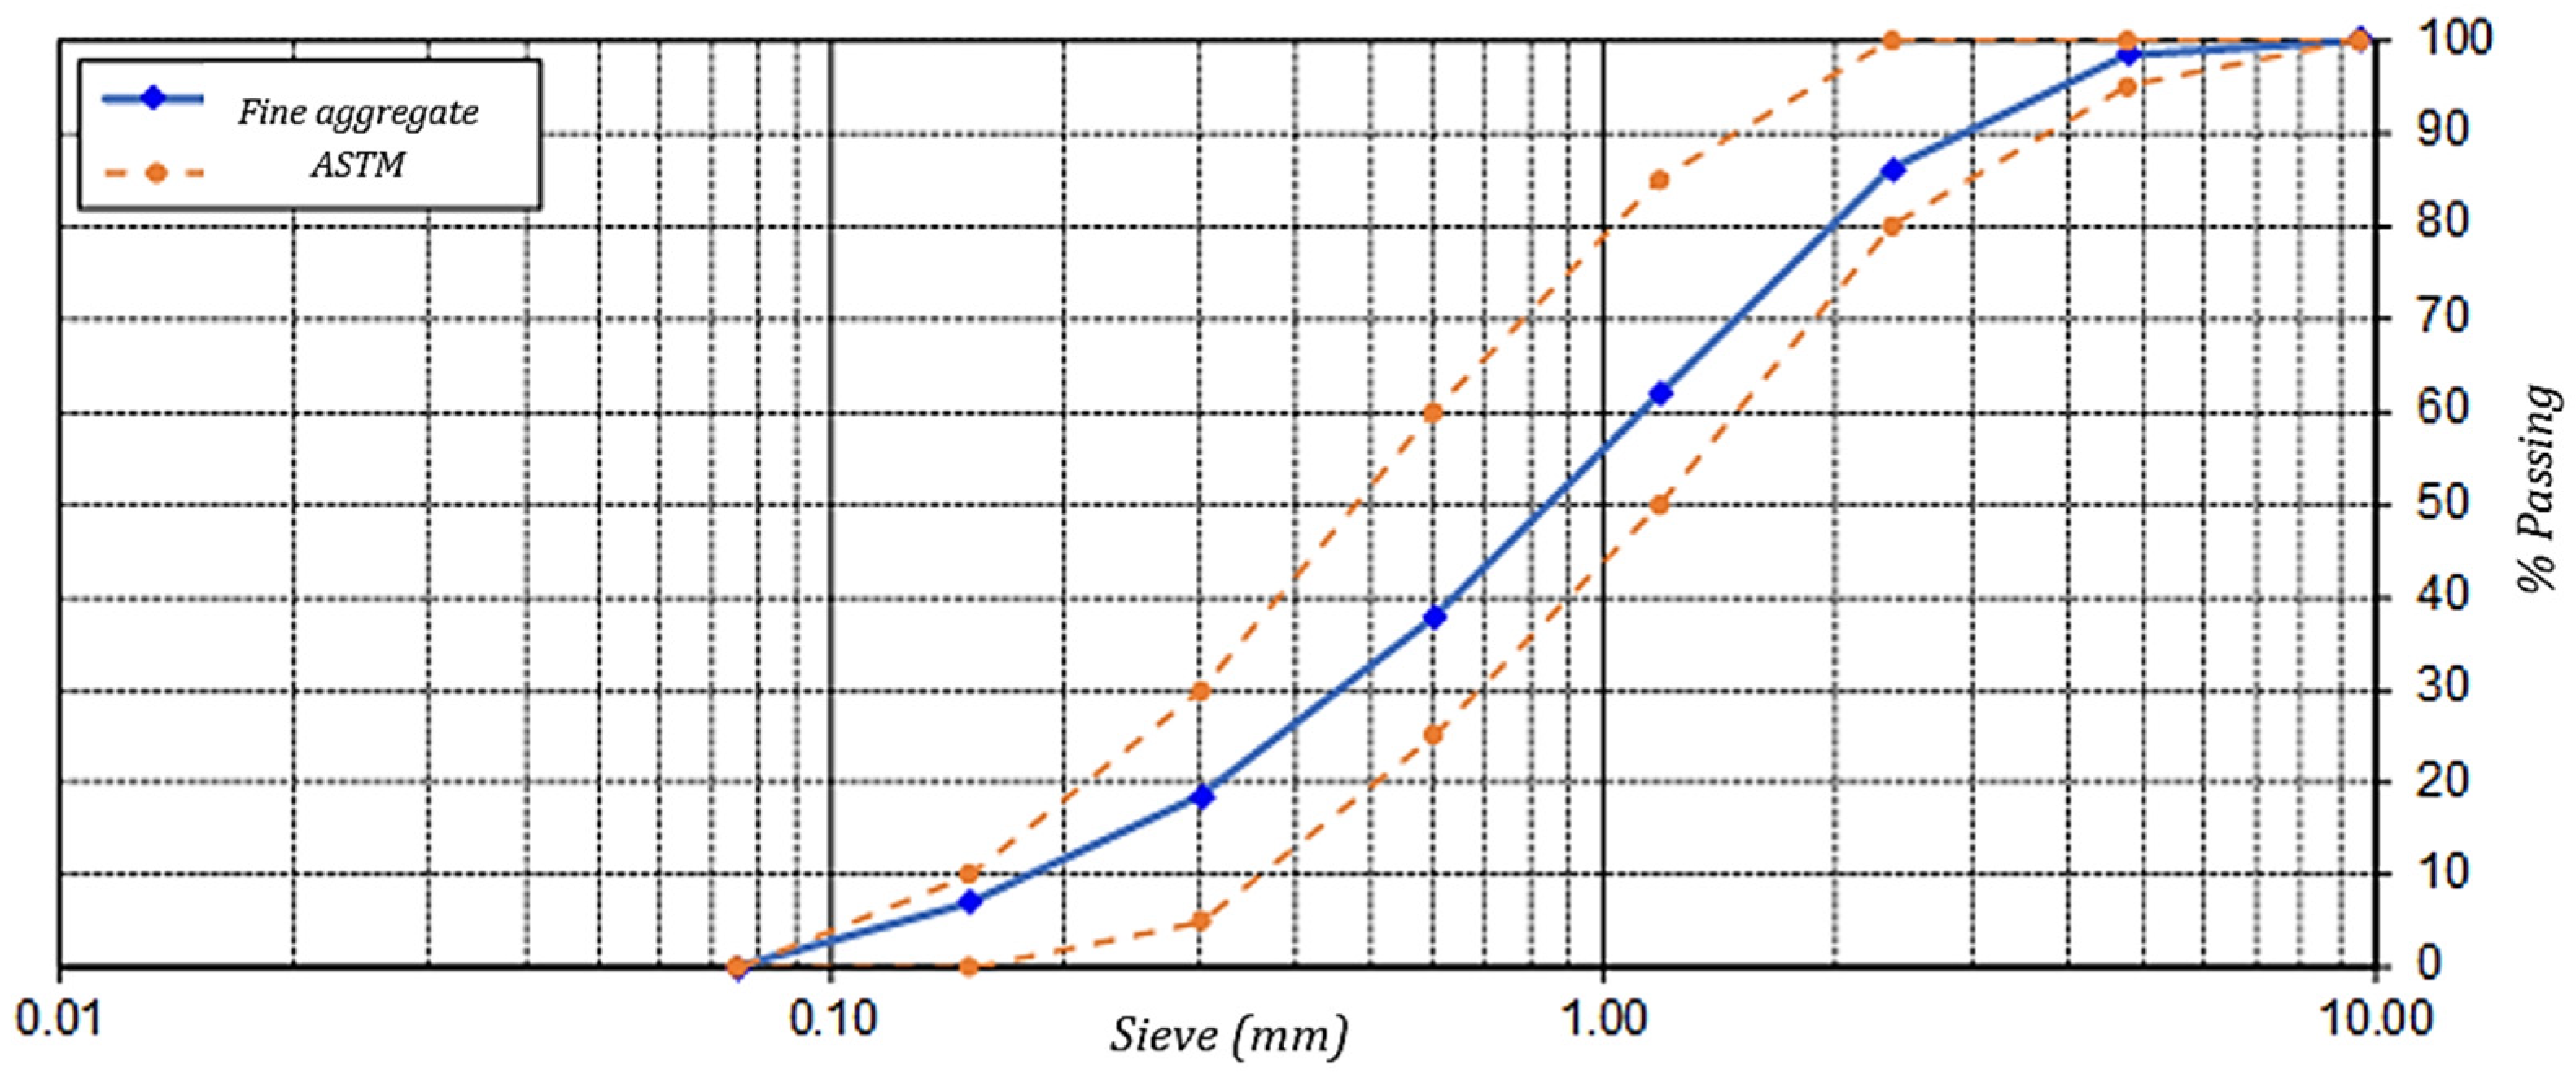
Buildings 15 00870 g002
Figure 3. Granulometric curve of fine aggregates.
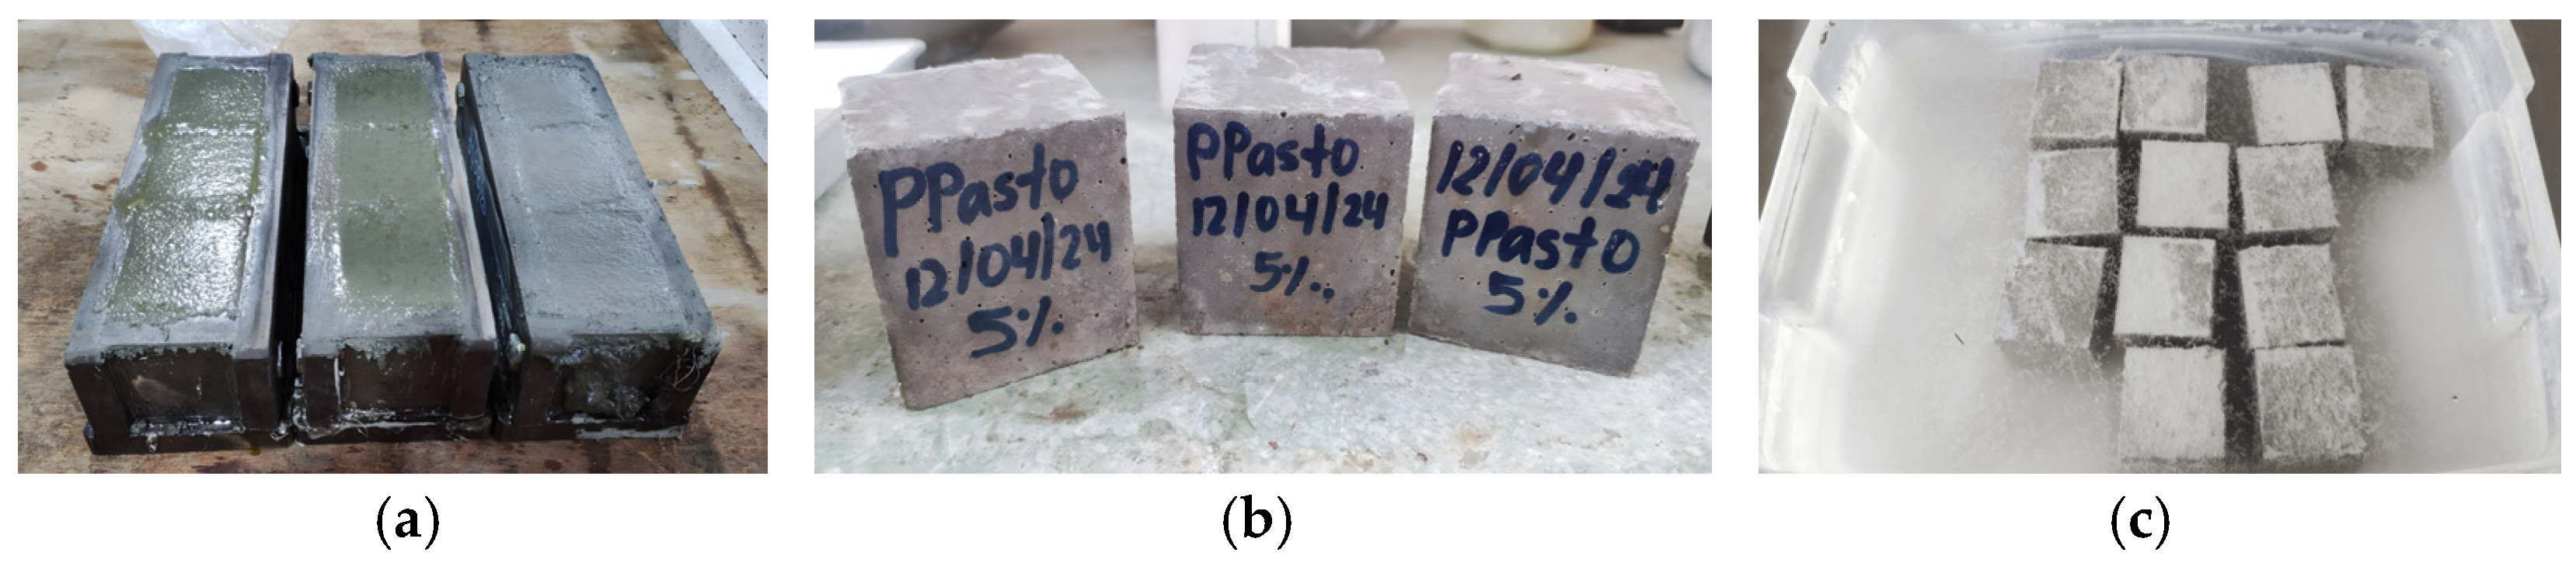
Buildings 15 00870 g003
Figure 4. Mortar-sample-processing sequence: (a) Molding; (b) Demolding; (c) Curing.
Buildings 15 00870 g004
Figure 5. Compressive strength test: (a) Versa-Tester testing machine; (b) Test; (c) Specimen tested.
Buildings 15 00870 g005
Figure 6. Concrete-sample-processing sequence: (a) Molding; (b) Demolding; (c) Curing.
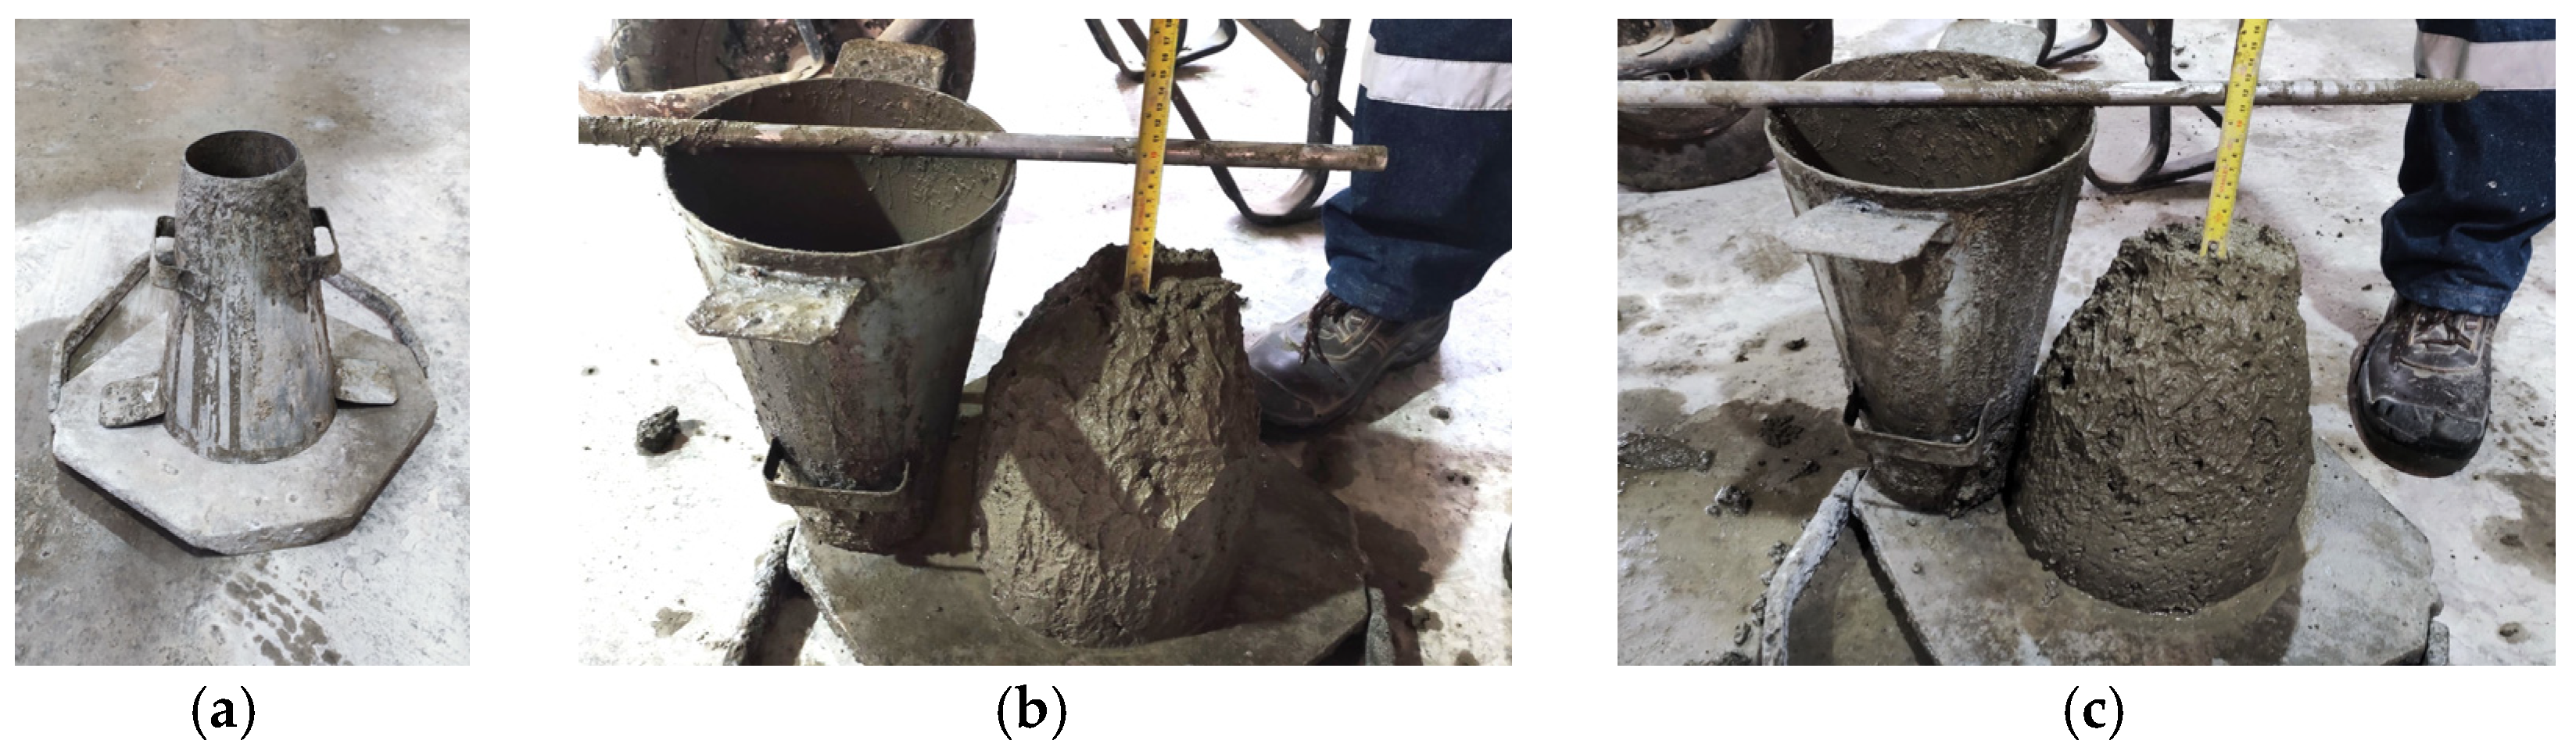
Buildings 15 00870 g006
Figure 7. Concrete slump testing: (a) Concrete Slump Testing Equipment; (b) CG-5%; (c) CG-10%.
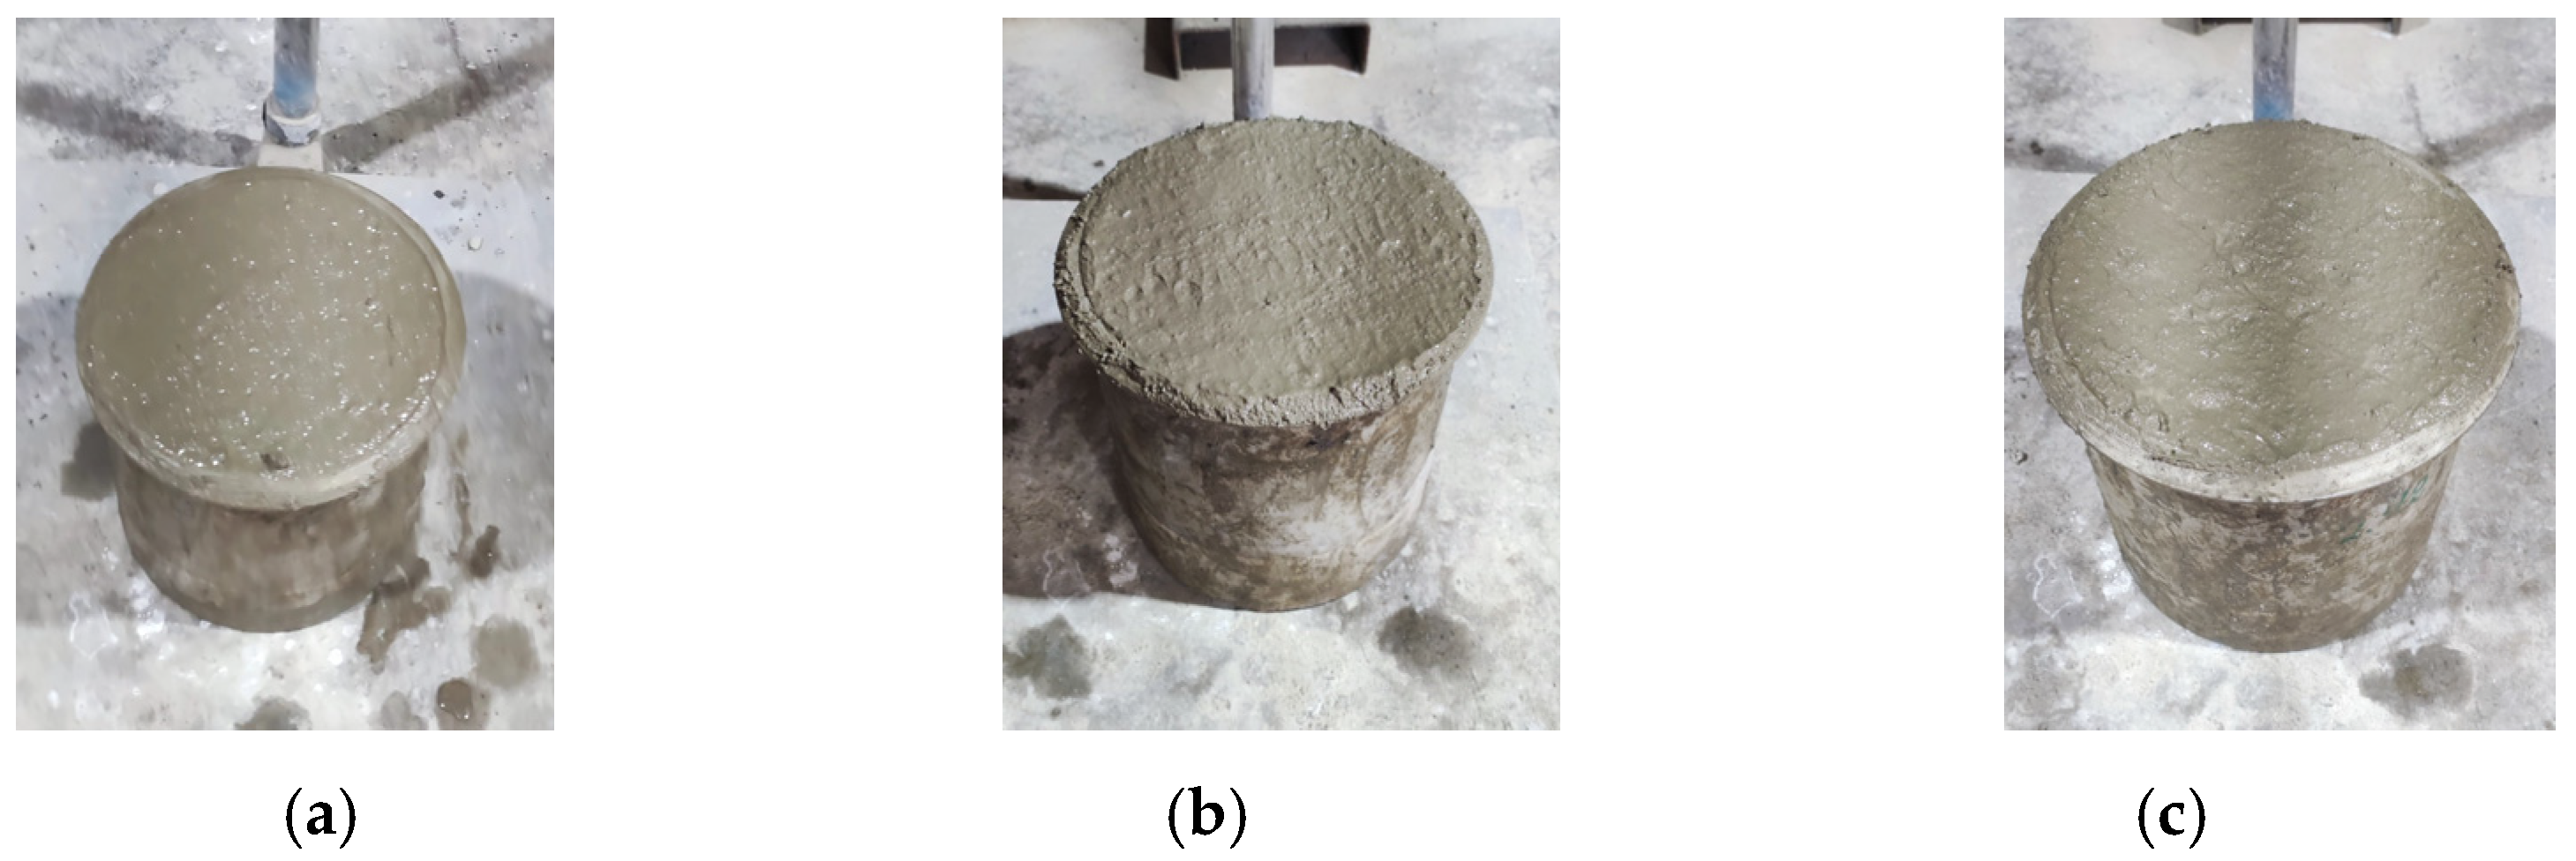
Buildings 15 00870 g007
Figure 8. Concrete unit weights: (a) PC; (b) CG-5%; (c) CG-10%.
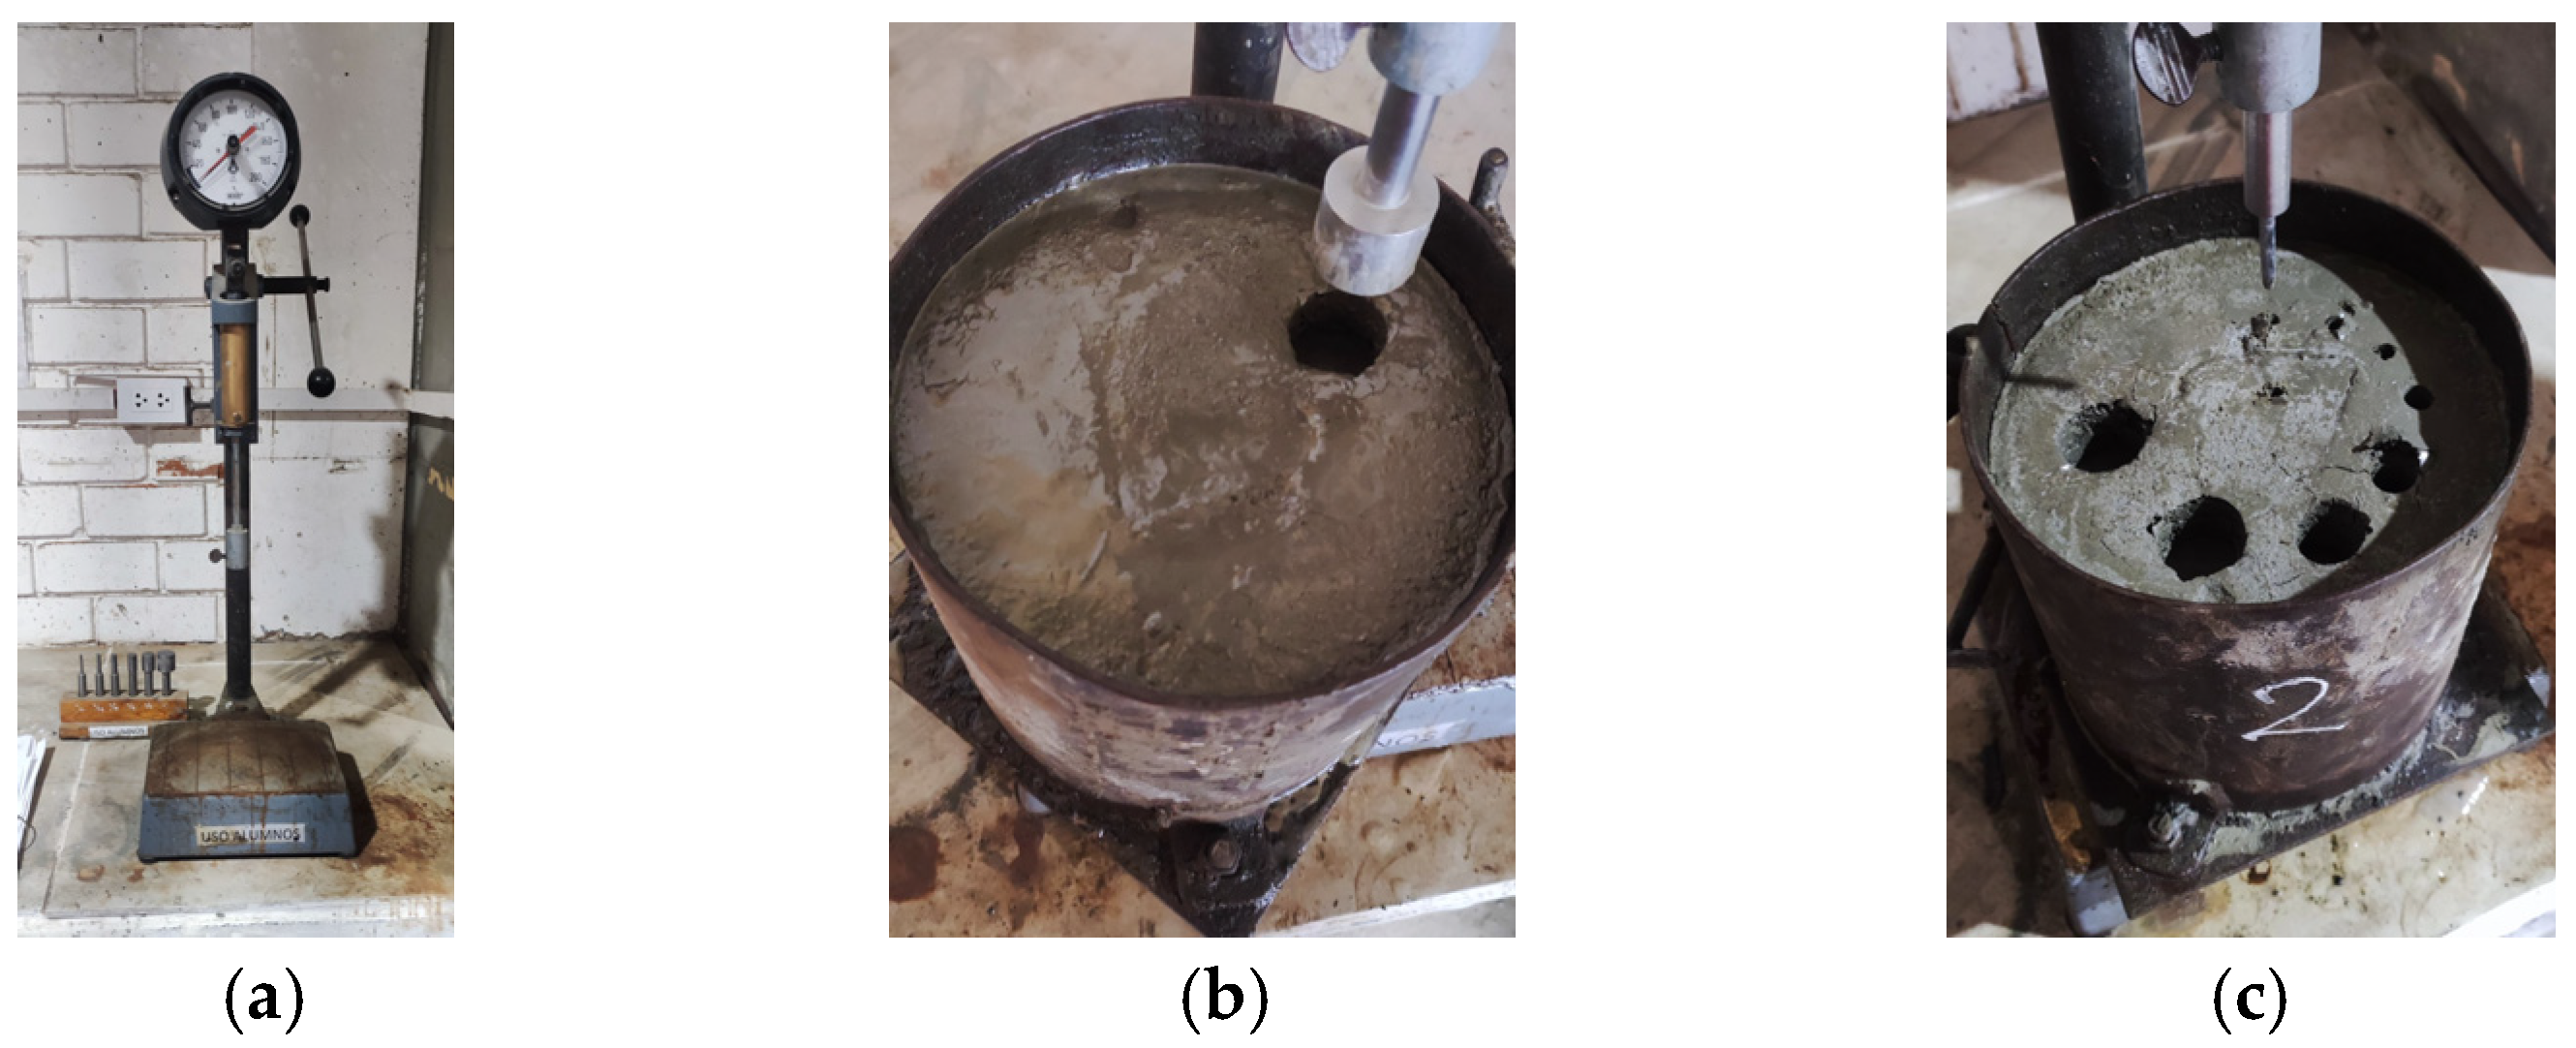
Buildings 15 00870 g008
Figure 9. The setting time for the pattern (PC). (a) Penetrometer; (b) Needle penetration into the concrete; (c) Tested sample.
Buildings 15 00870 g009
Figure 10. Concrete temperature measurement.
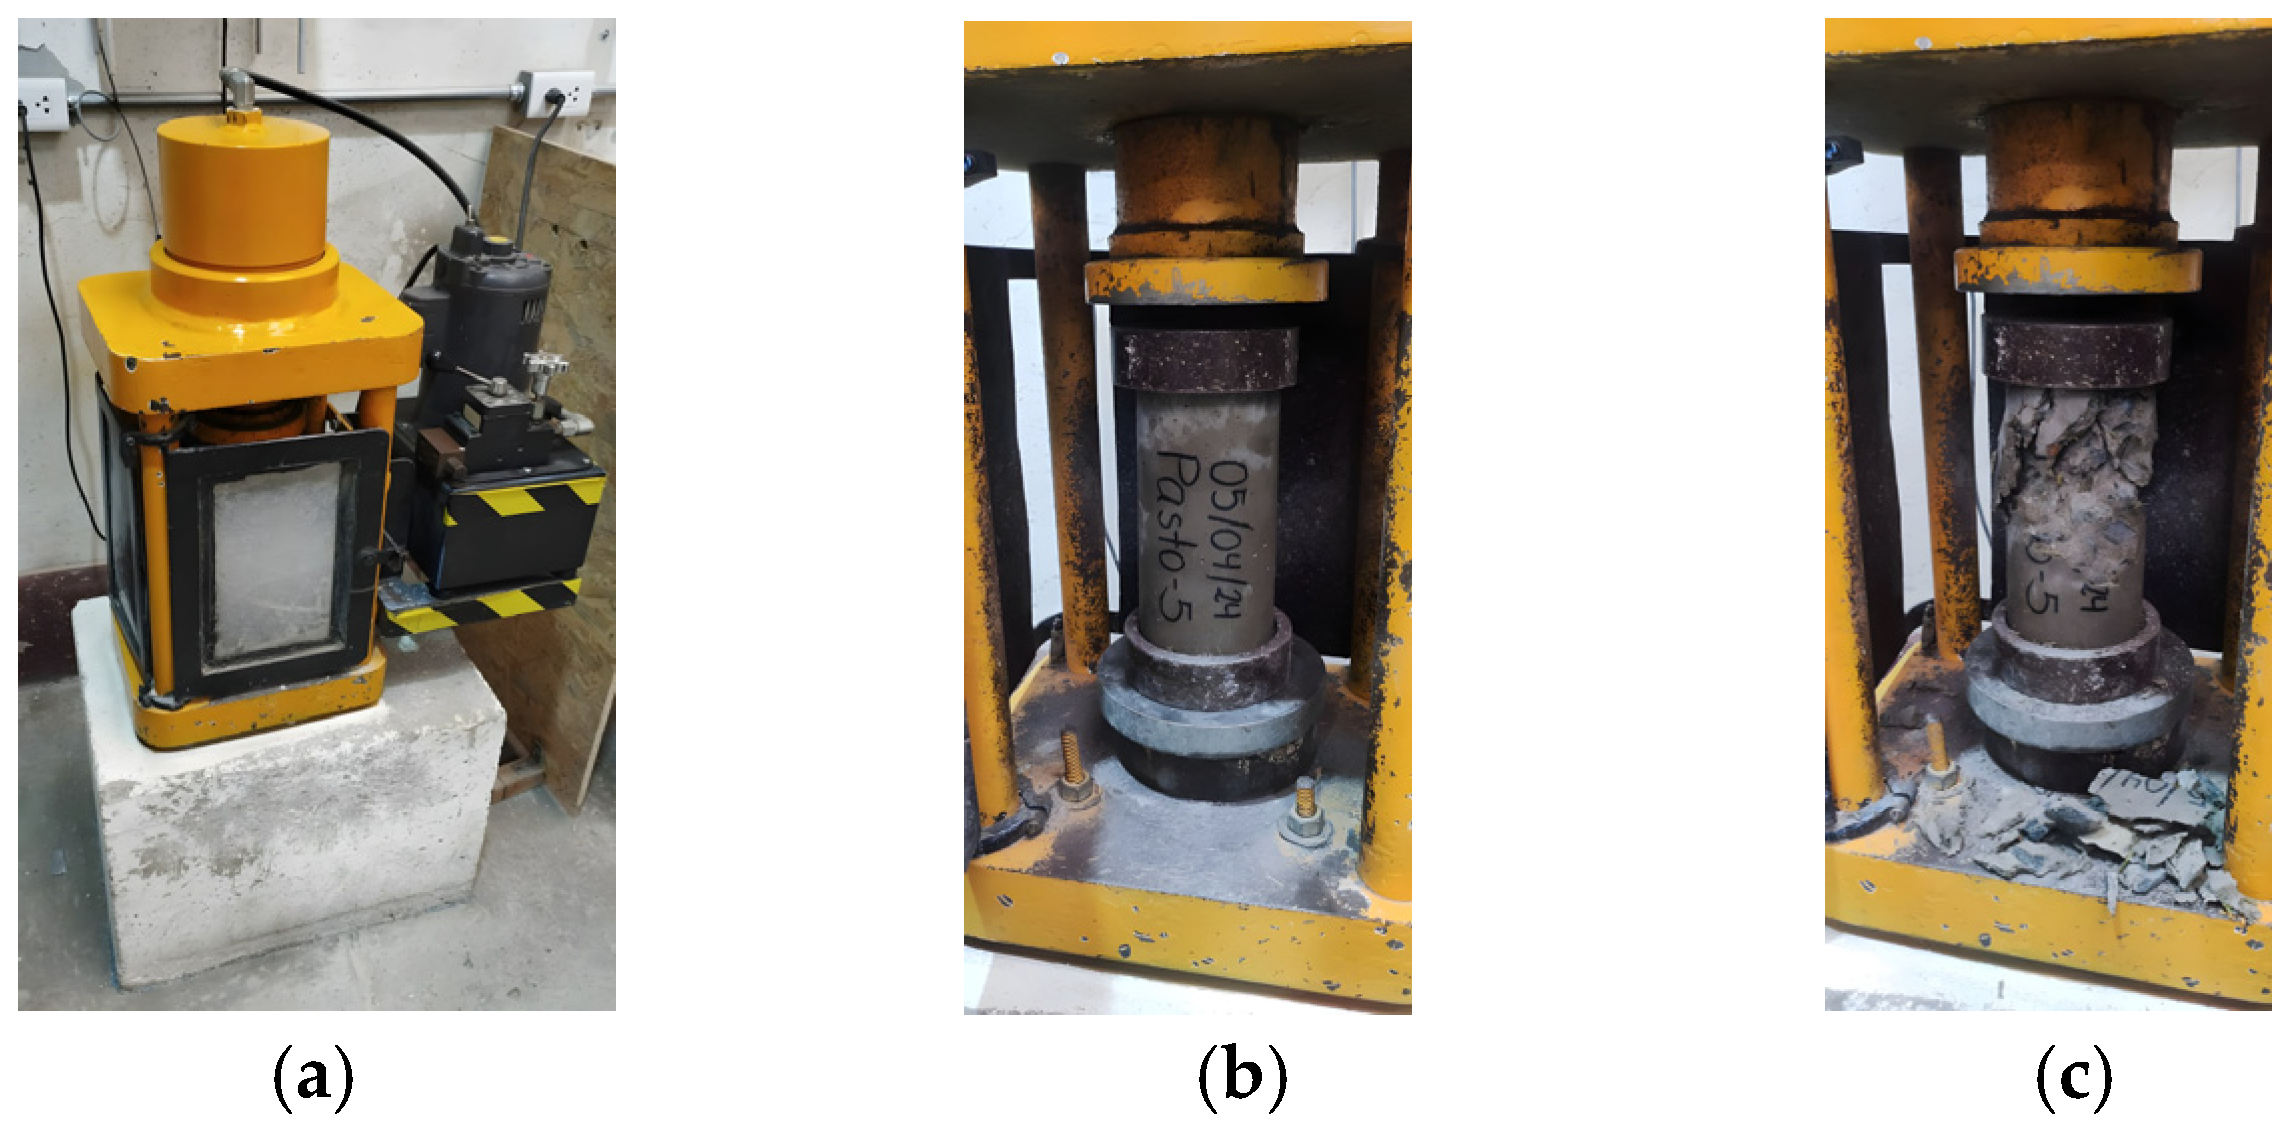
Buildings 15 00870 g010
Figure 11. Compressive strength test. (a) Compression testing machine; (b) Specimen before testing; (c) Specimen after testing.
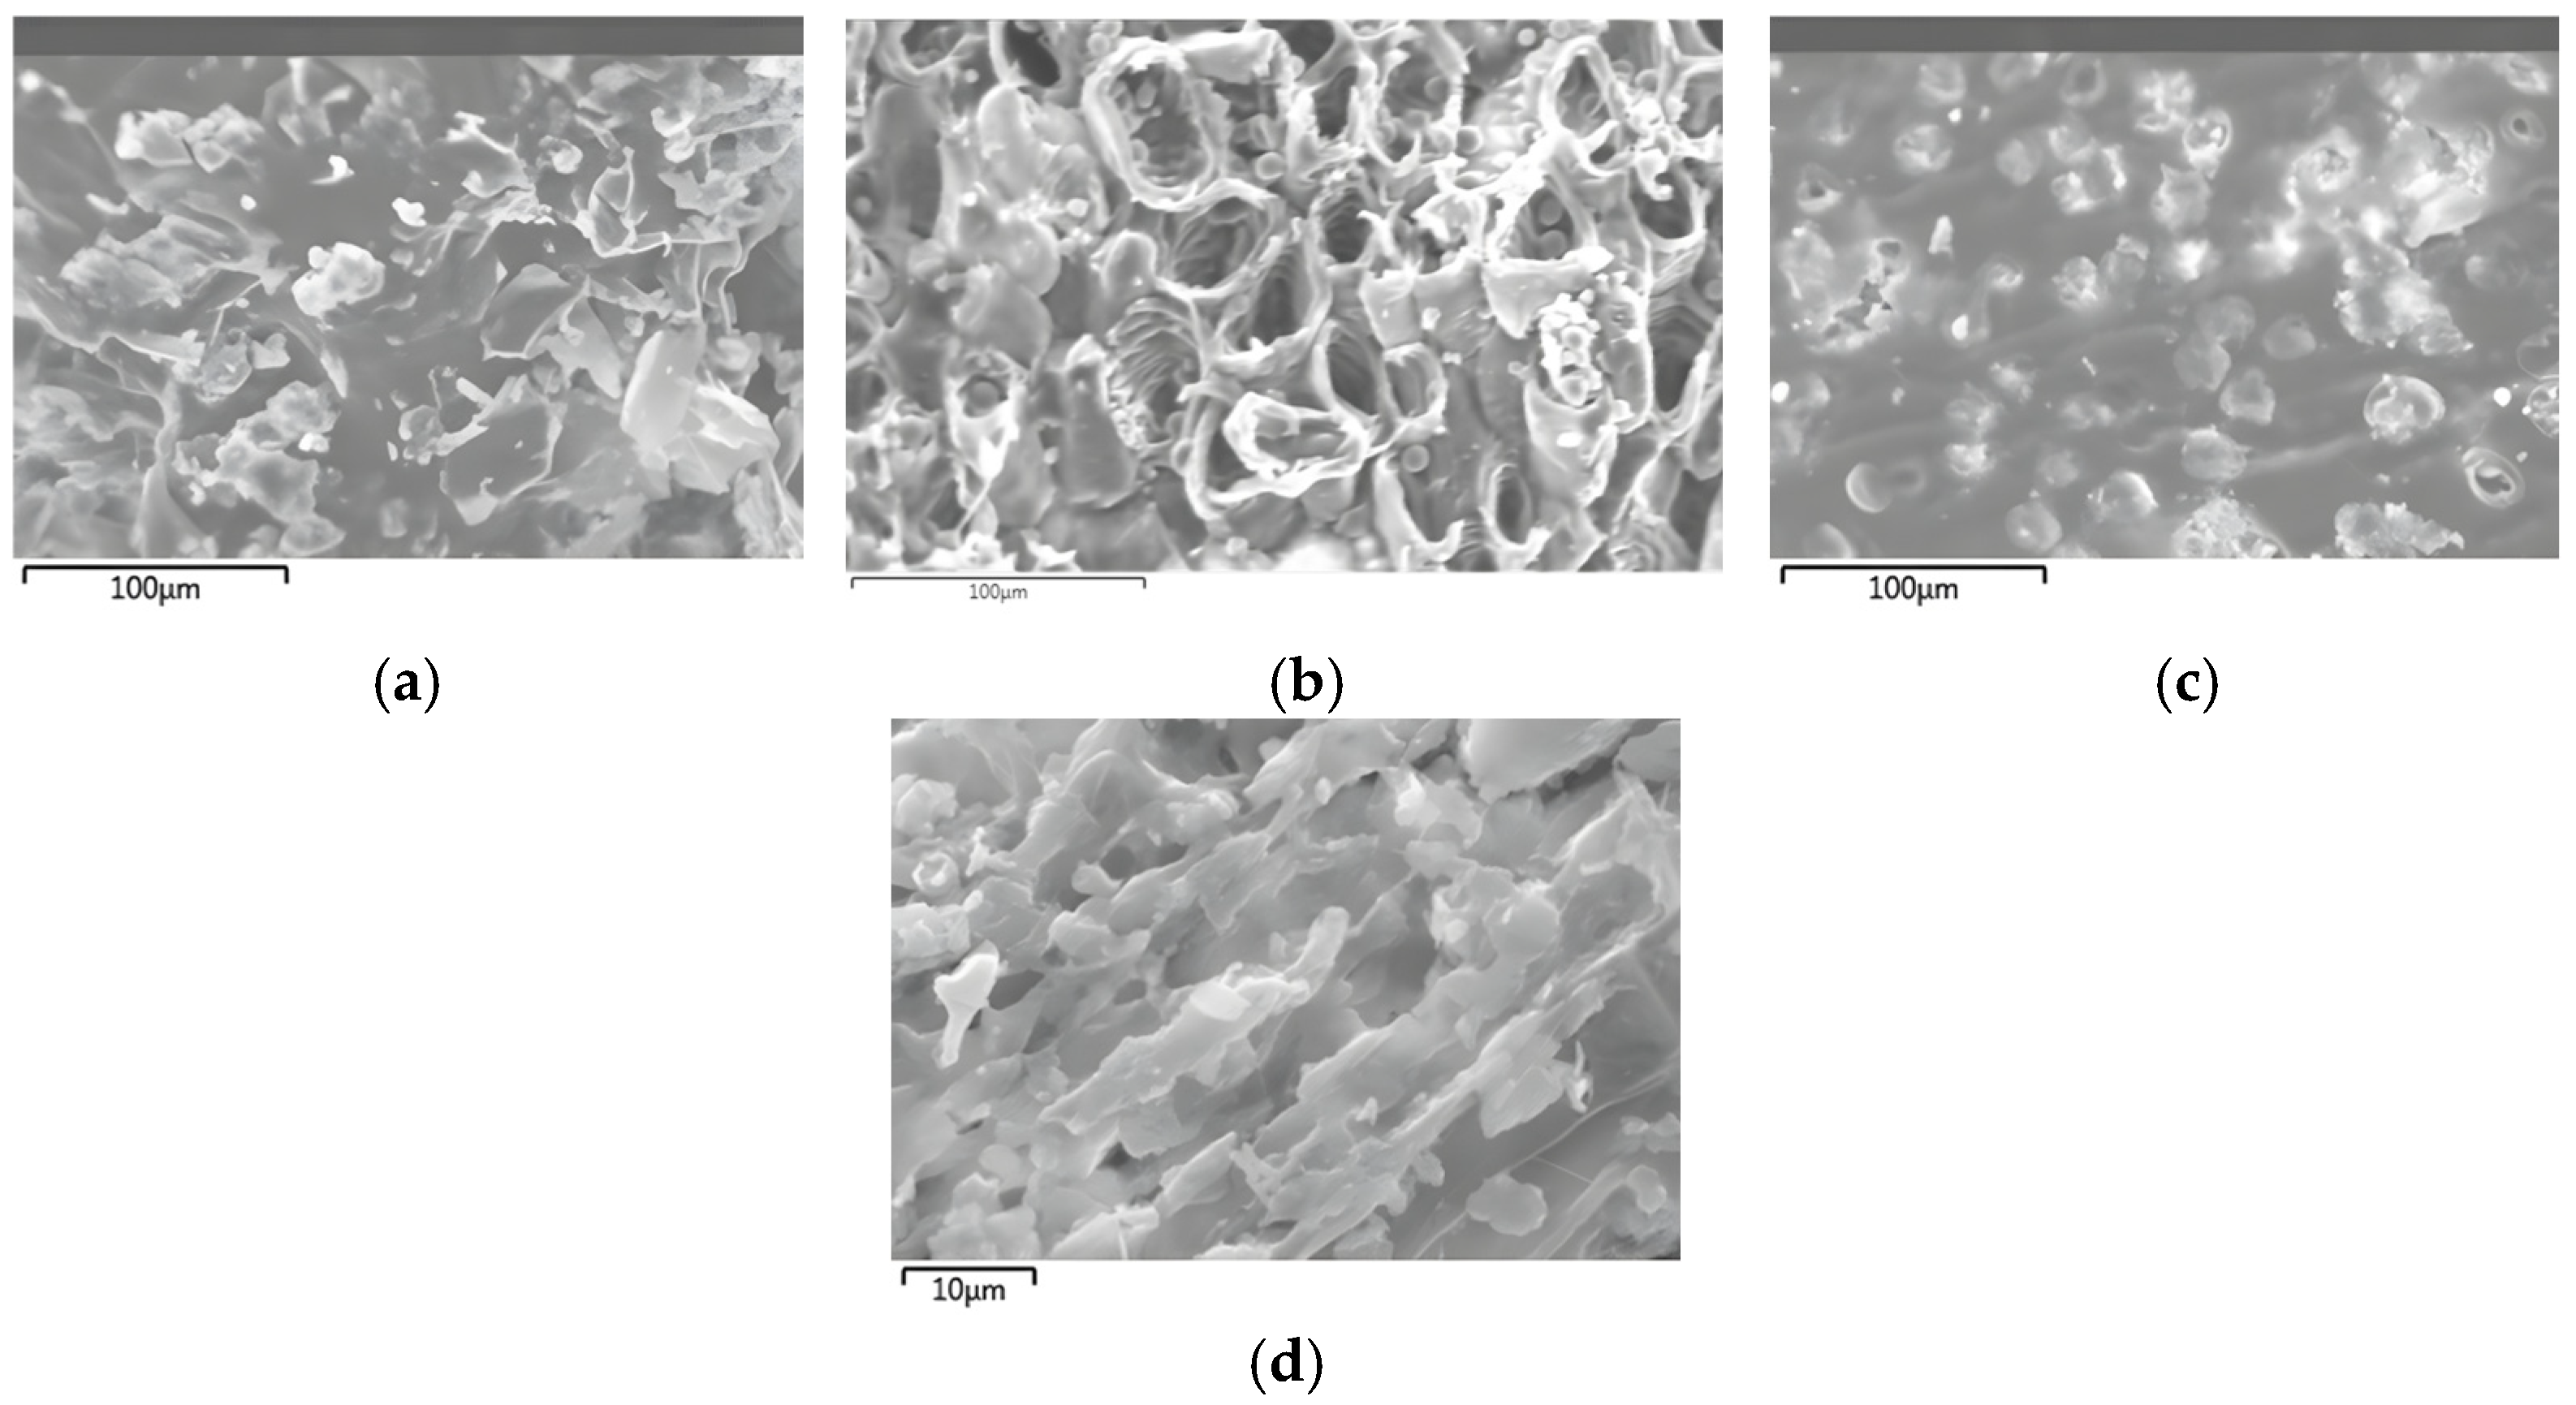
Buildings 15 00870 g011
Figure 12. Microscopic images of samples: (a) Orange peel; (b) Corn cob; (c) Corn husk; (d) Grass.
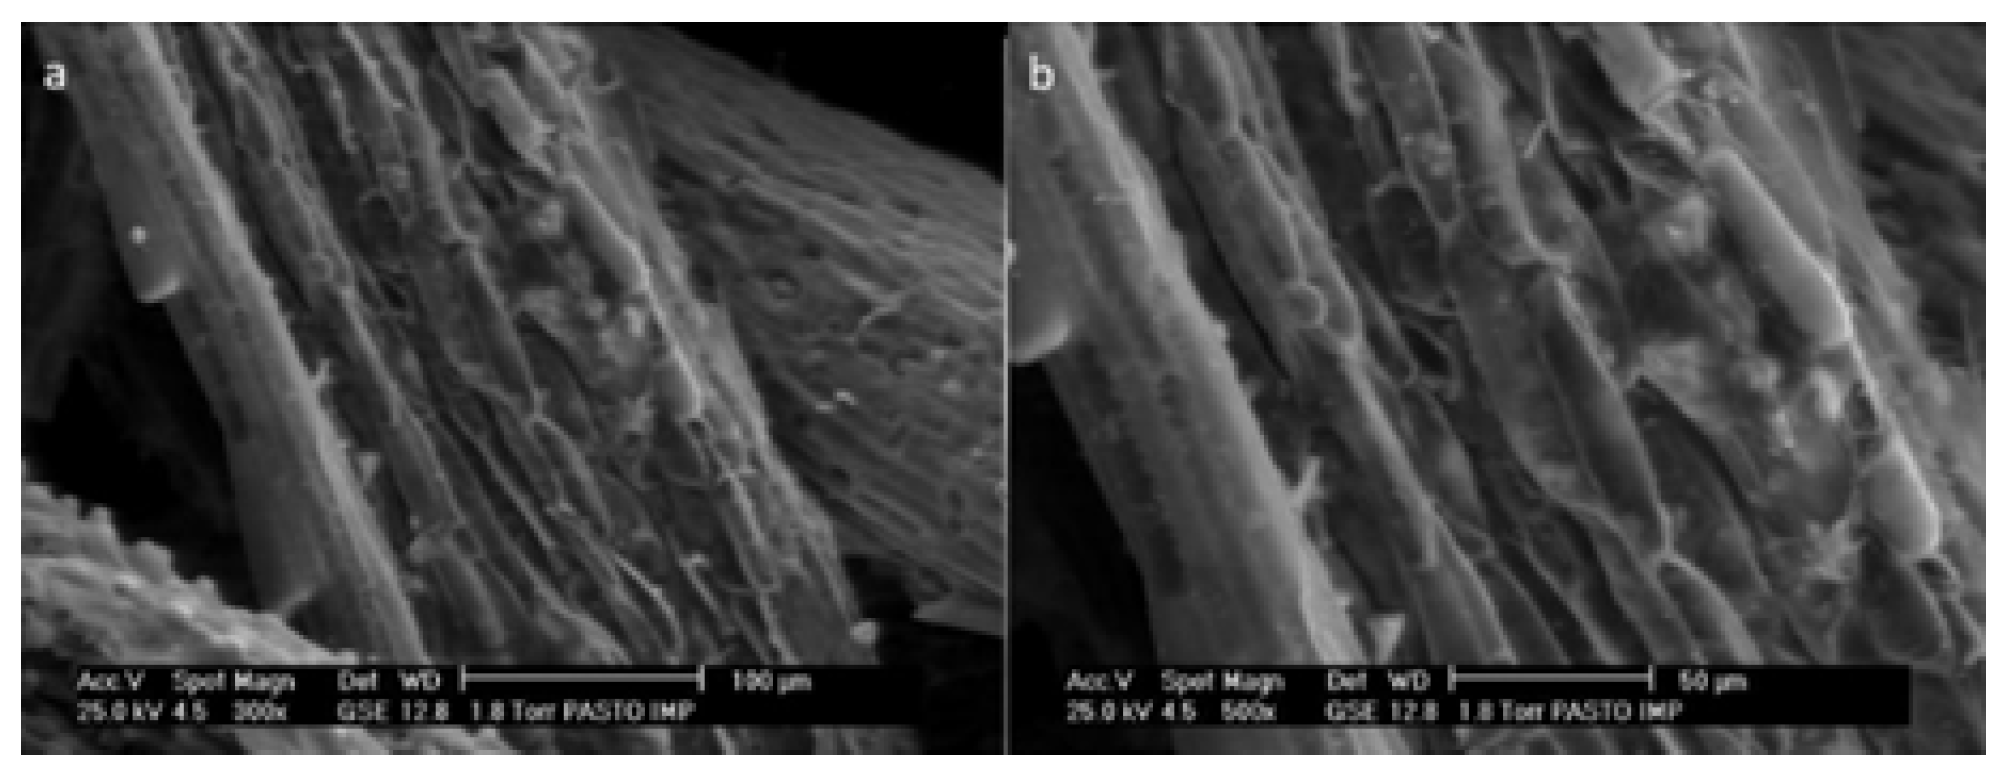
Buildings 15 00870 g012
Figure 13. Epidermis of Kikuyu grass.
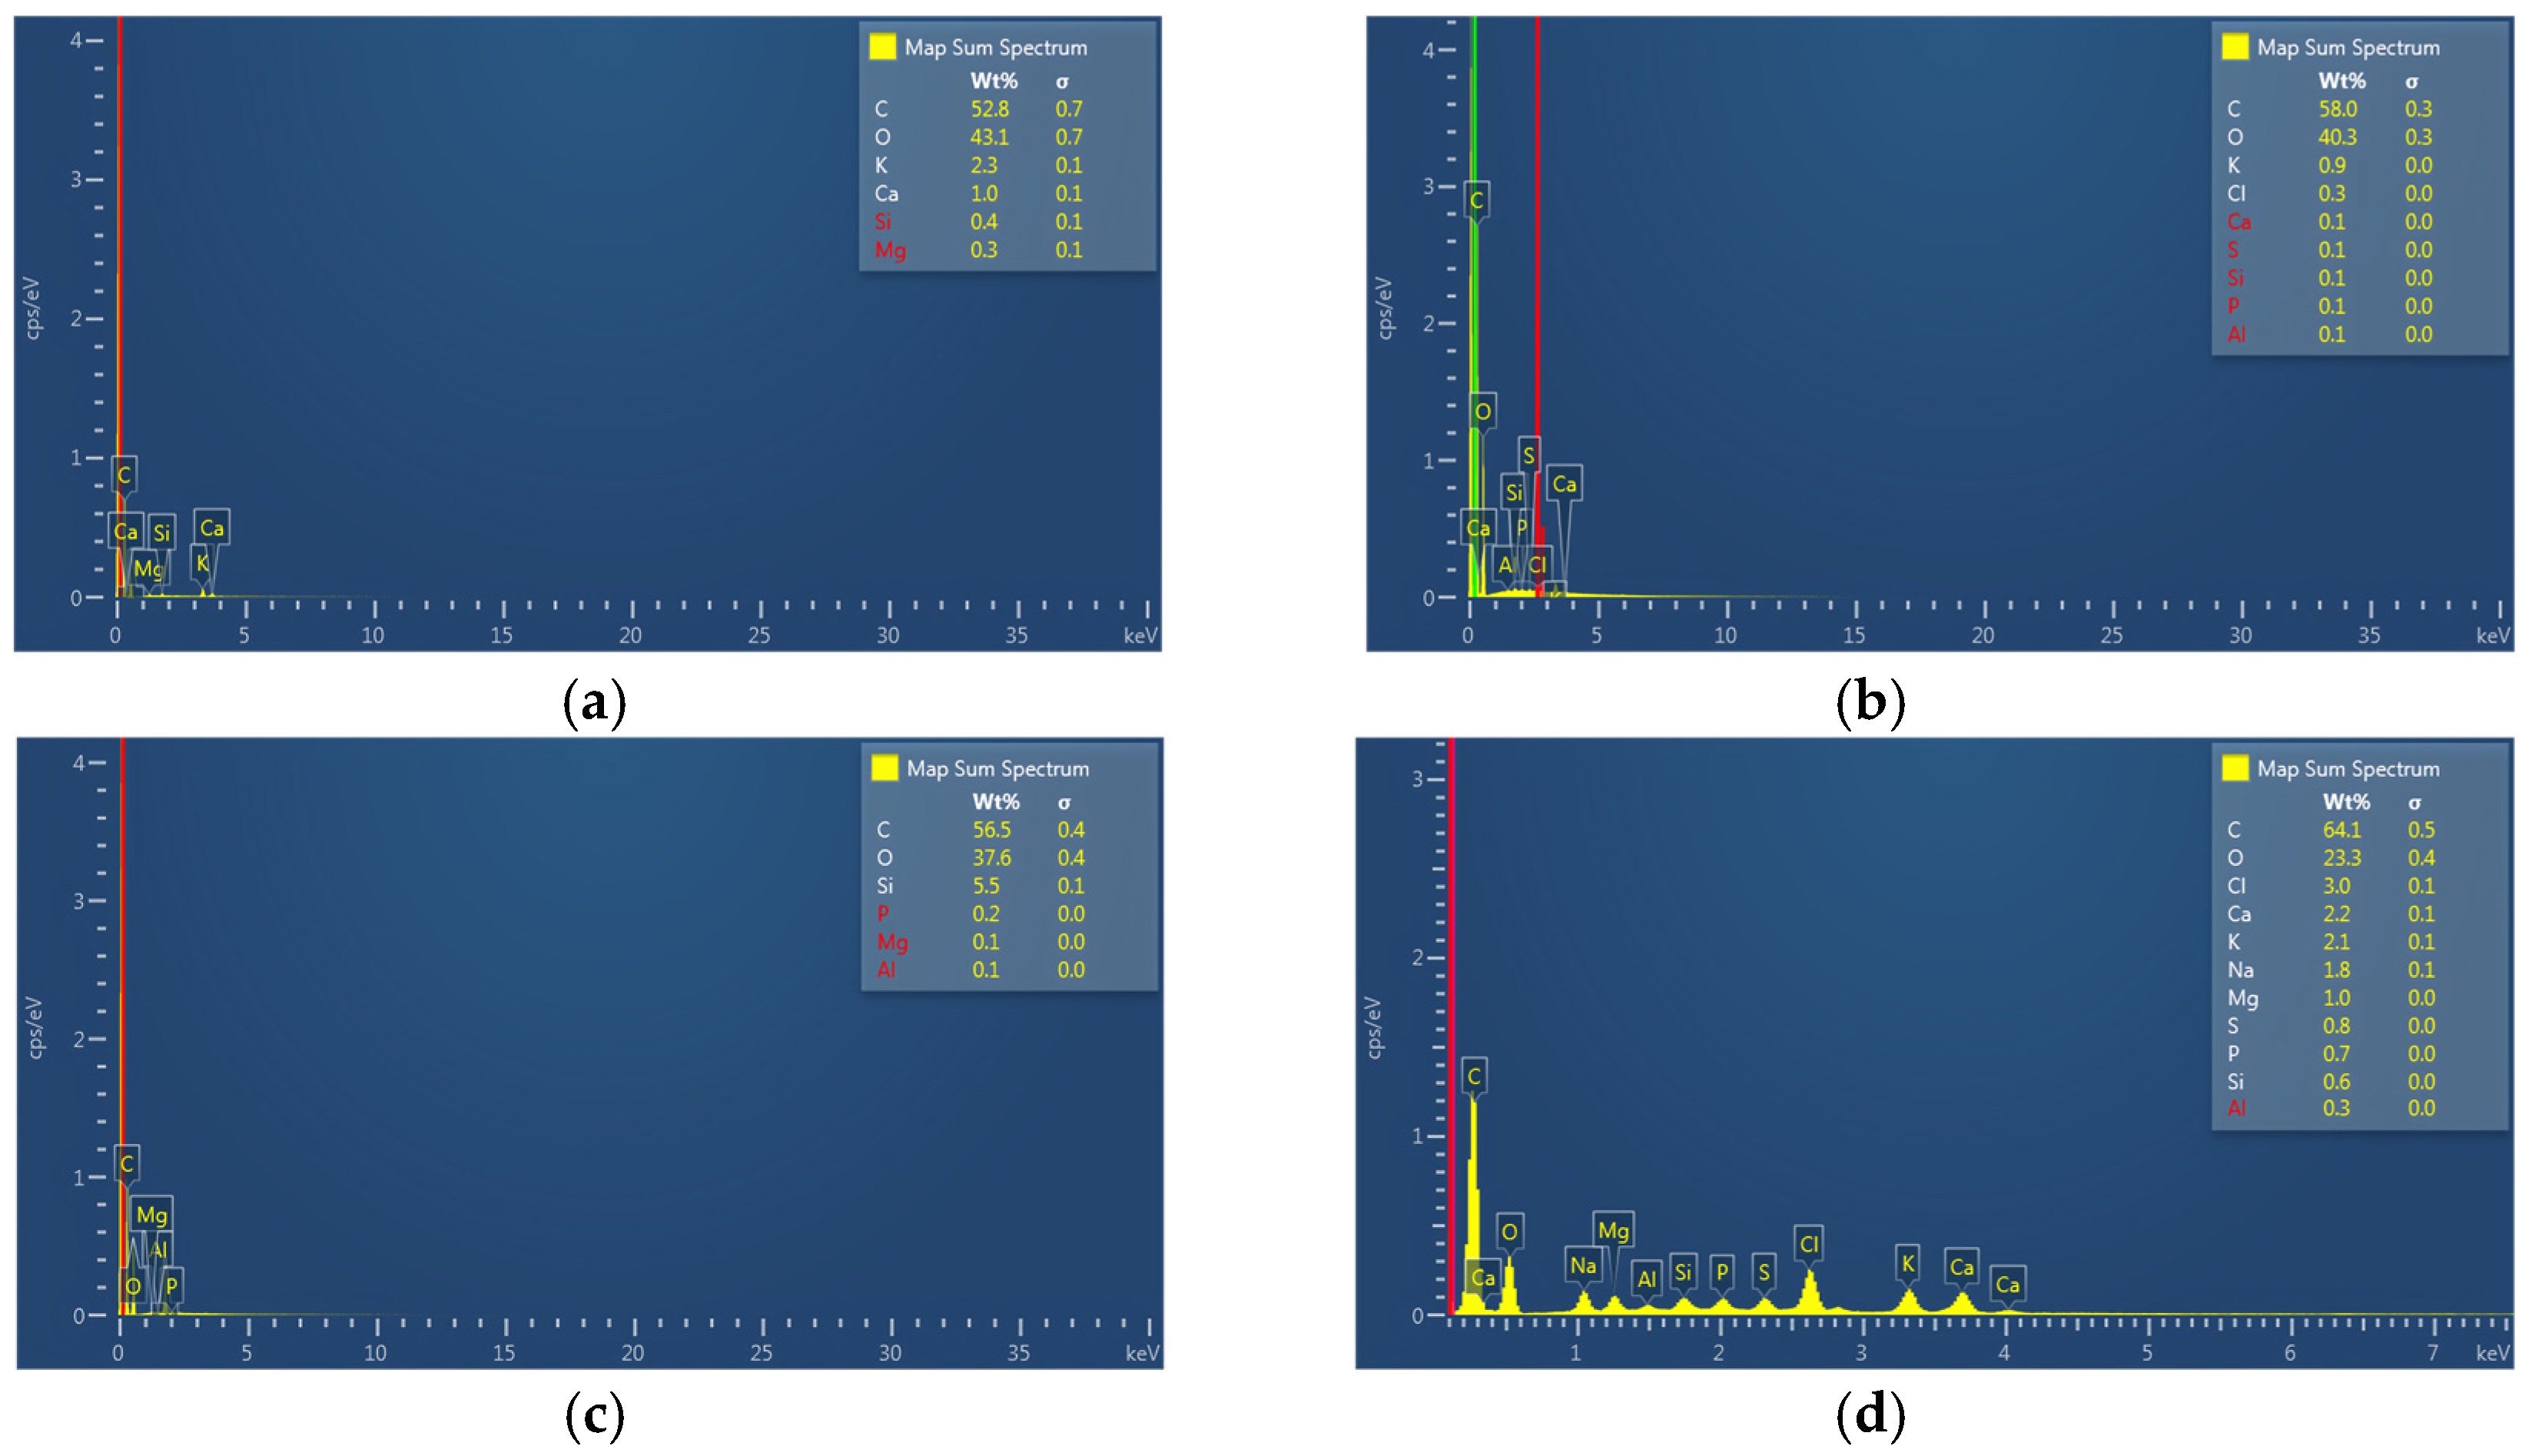
Buildings 15 00870 g013
Figure 14. Diffractogram of samples: (a) Orange peel; (b) Corn cob; (c) Corn husk; (d) Grass.
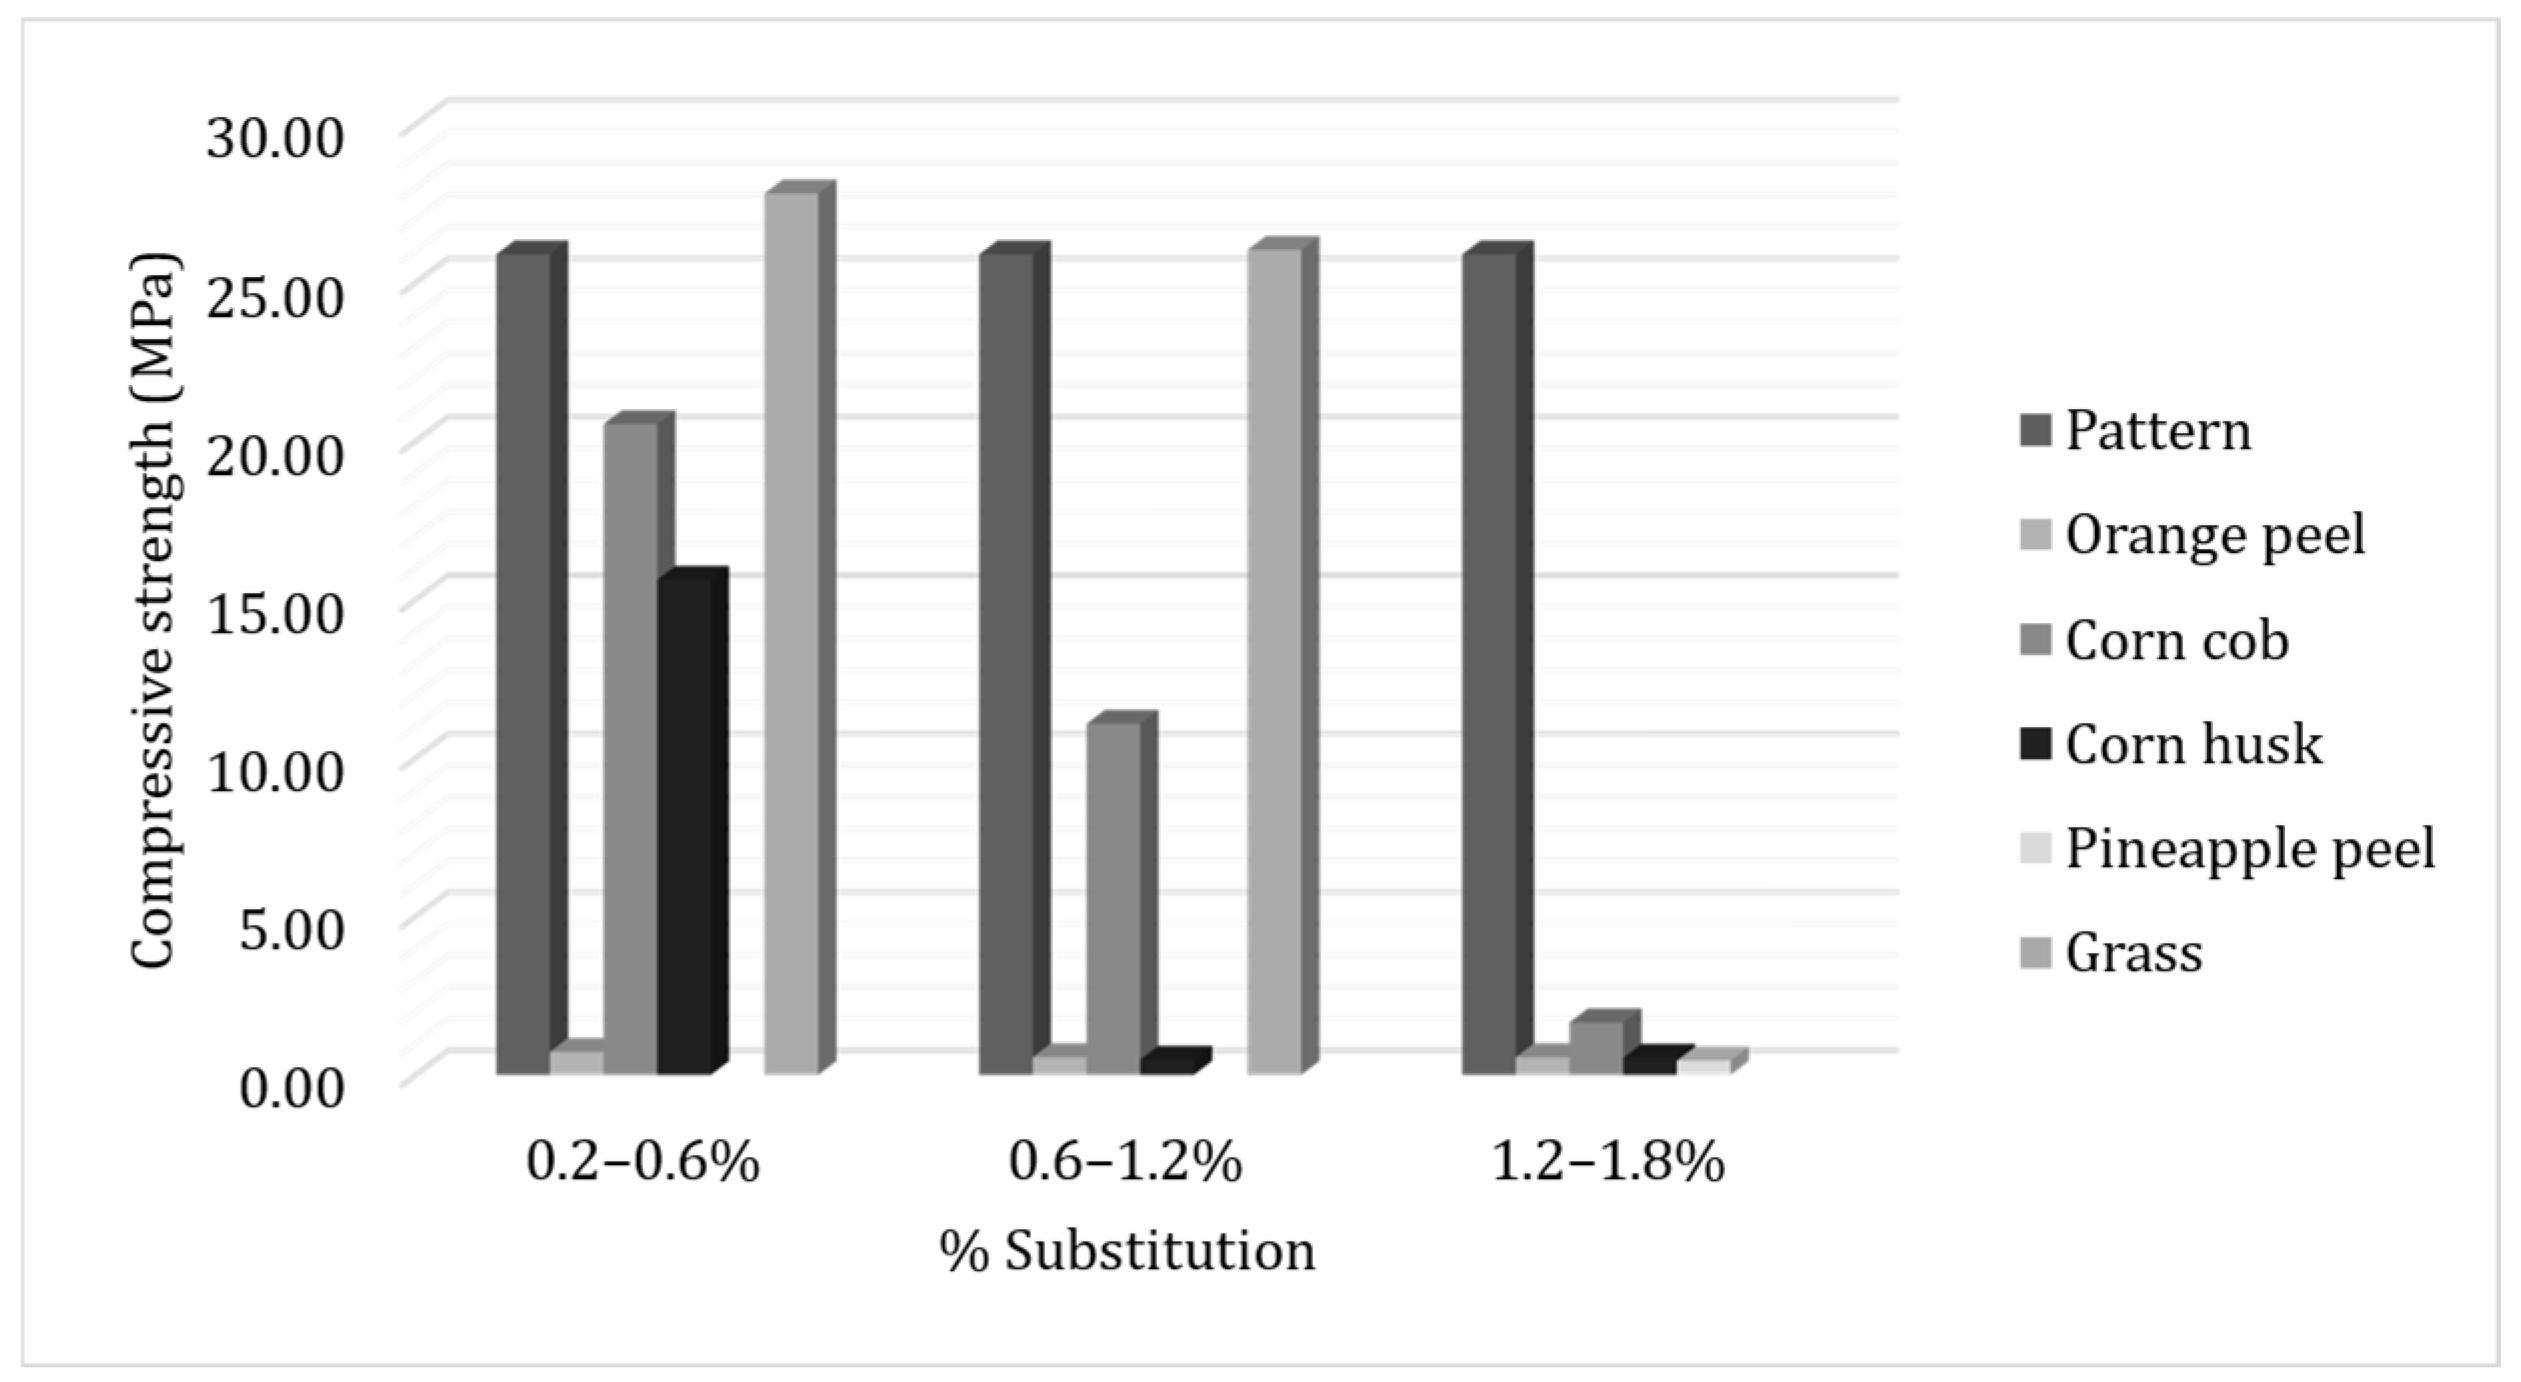
Buildings 15 00870 g014
Figure 15. Graph of the compressive strength in MPa of mortar dosages, at 7 days of curing with different percentages in substitution.
Buildings 15 00870 g015
Figure 16. Graph of the sample’s compressive strength.
Buildings 15 00870 g016
Figure 17. Graph of the compressive strength of the standard mortar (PM) and mortar dosages with grass.
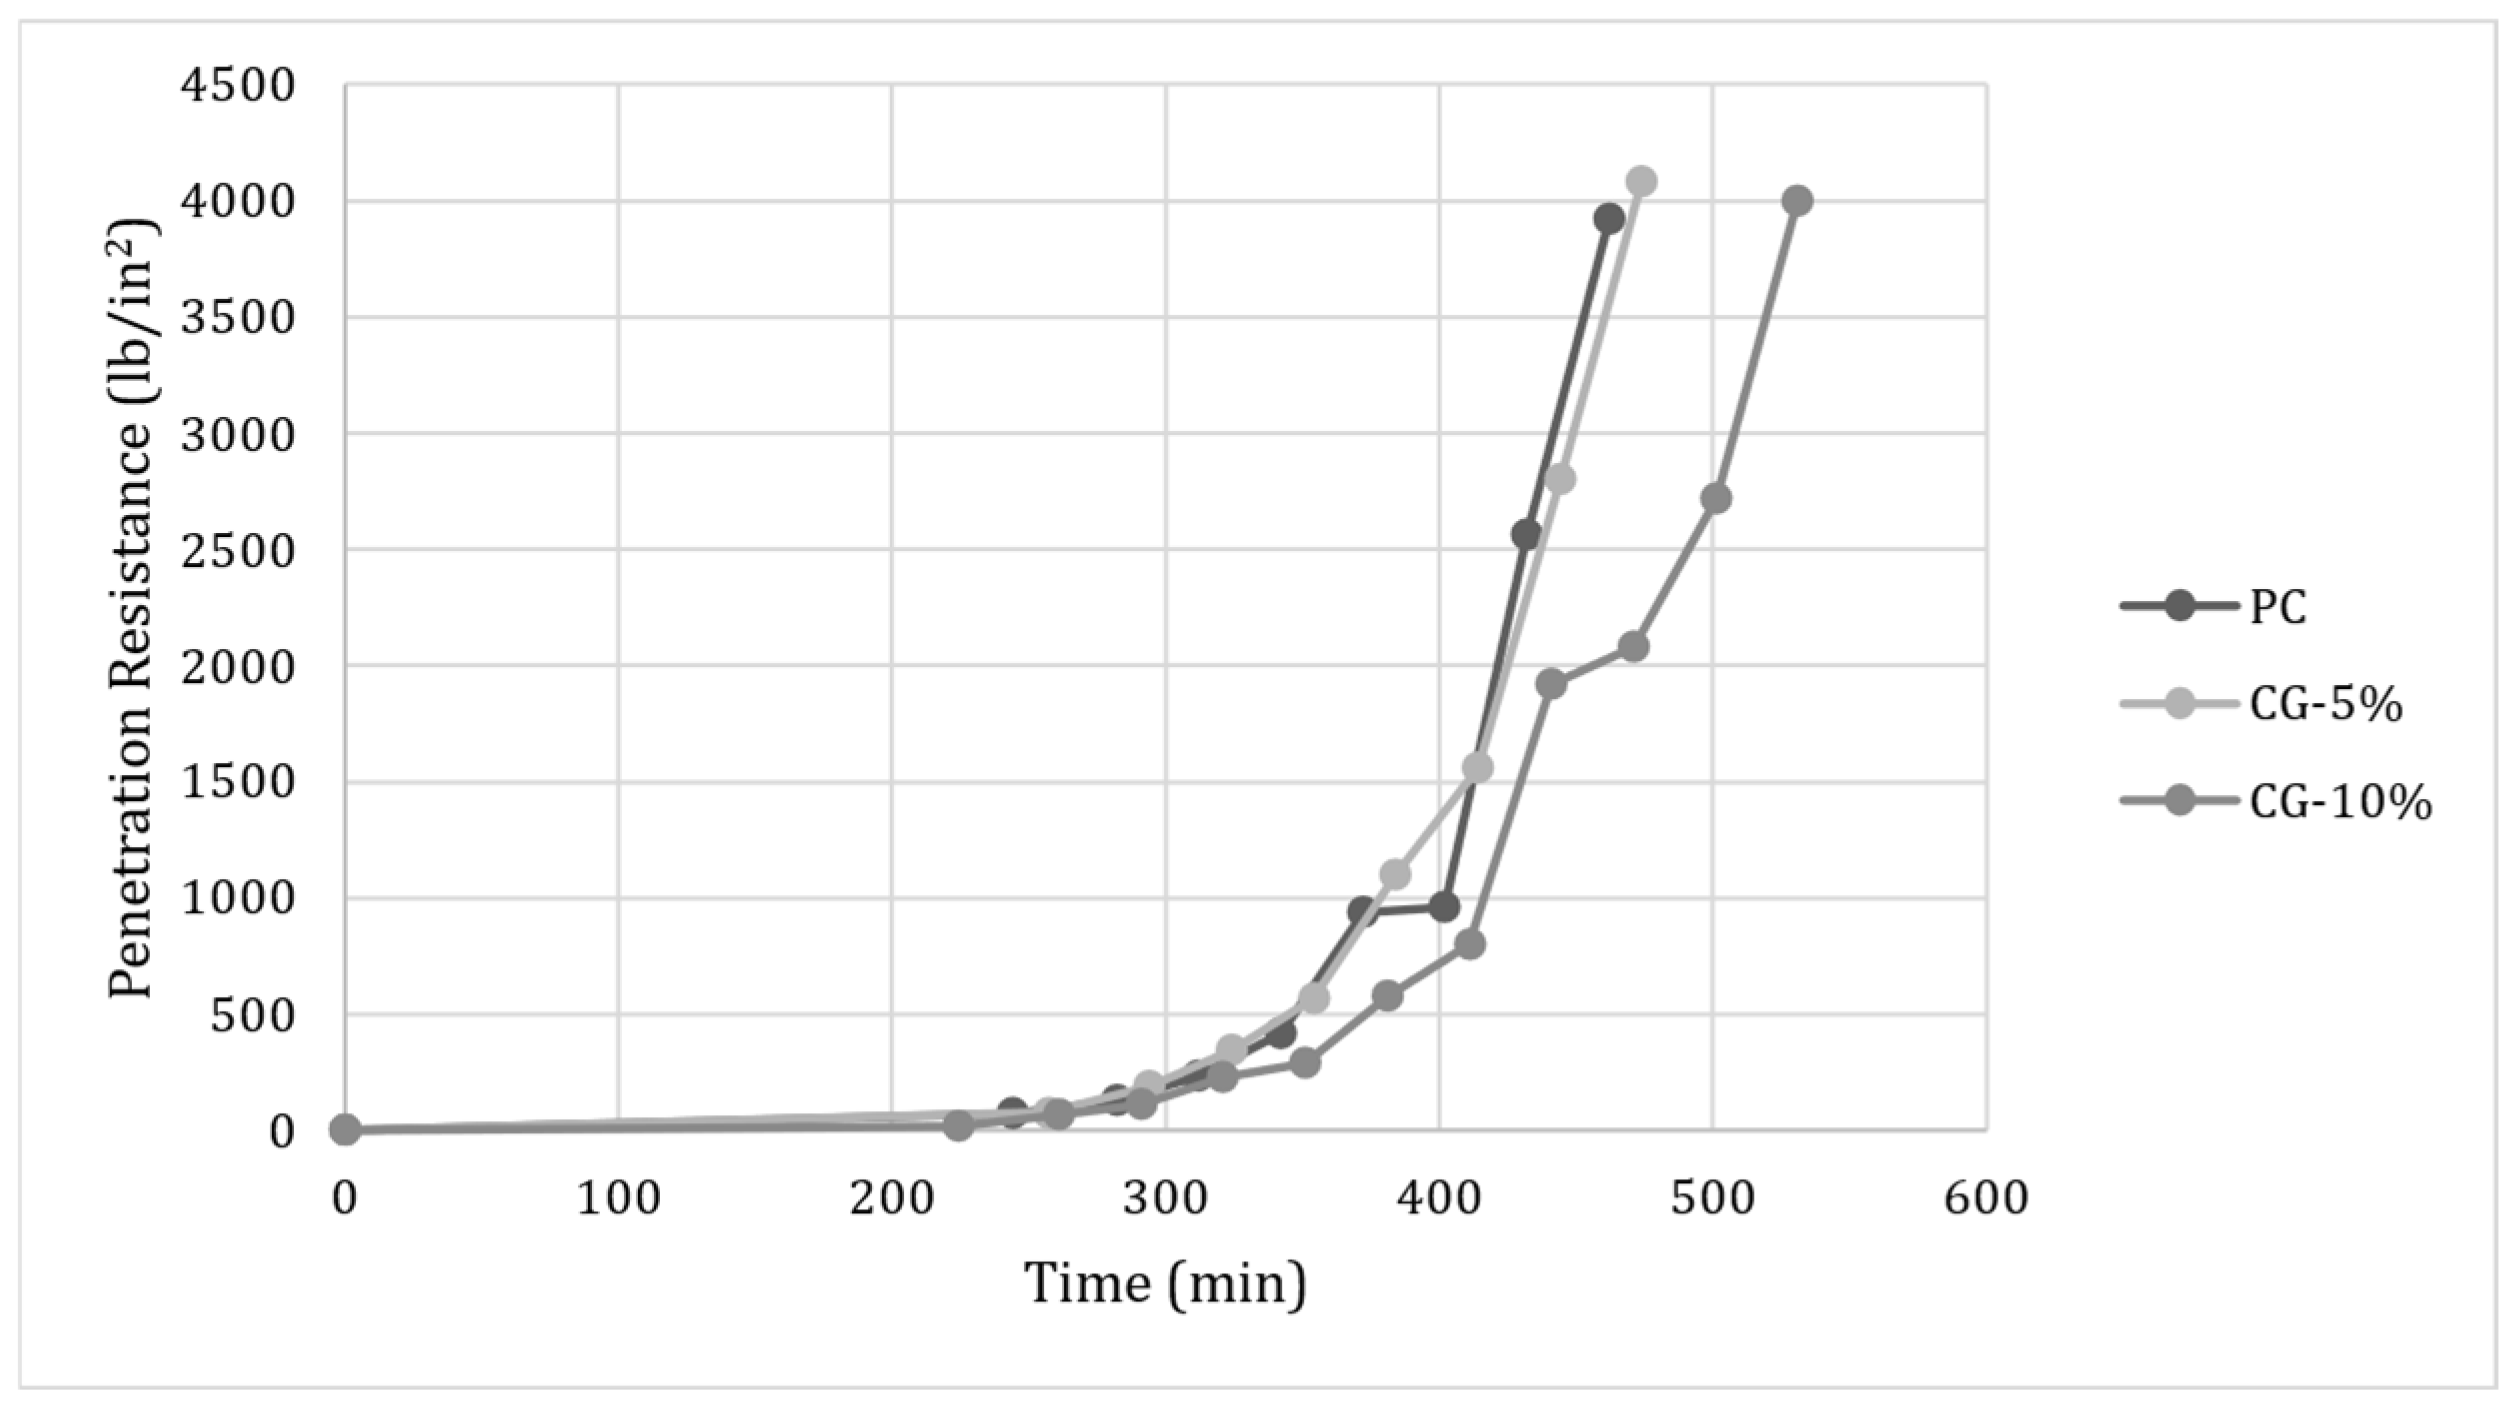
Buildings 15 00870 g017
Figure 18. Setting times for standard concrete (PC), CG-5%, and CG-10%.
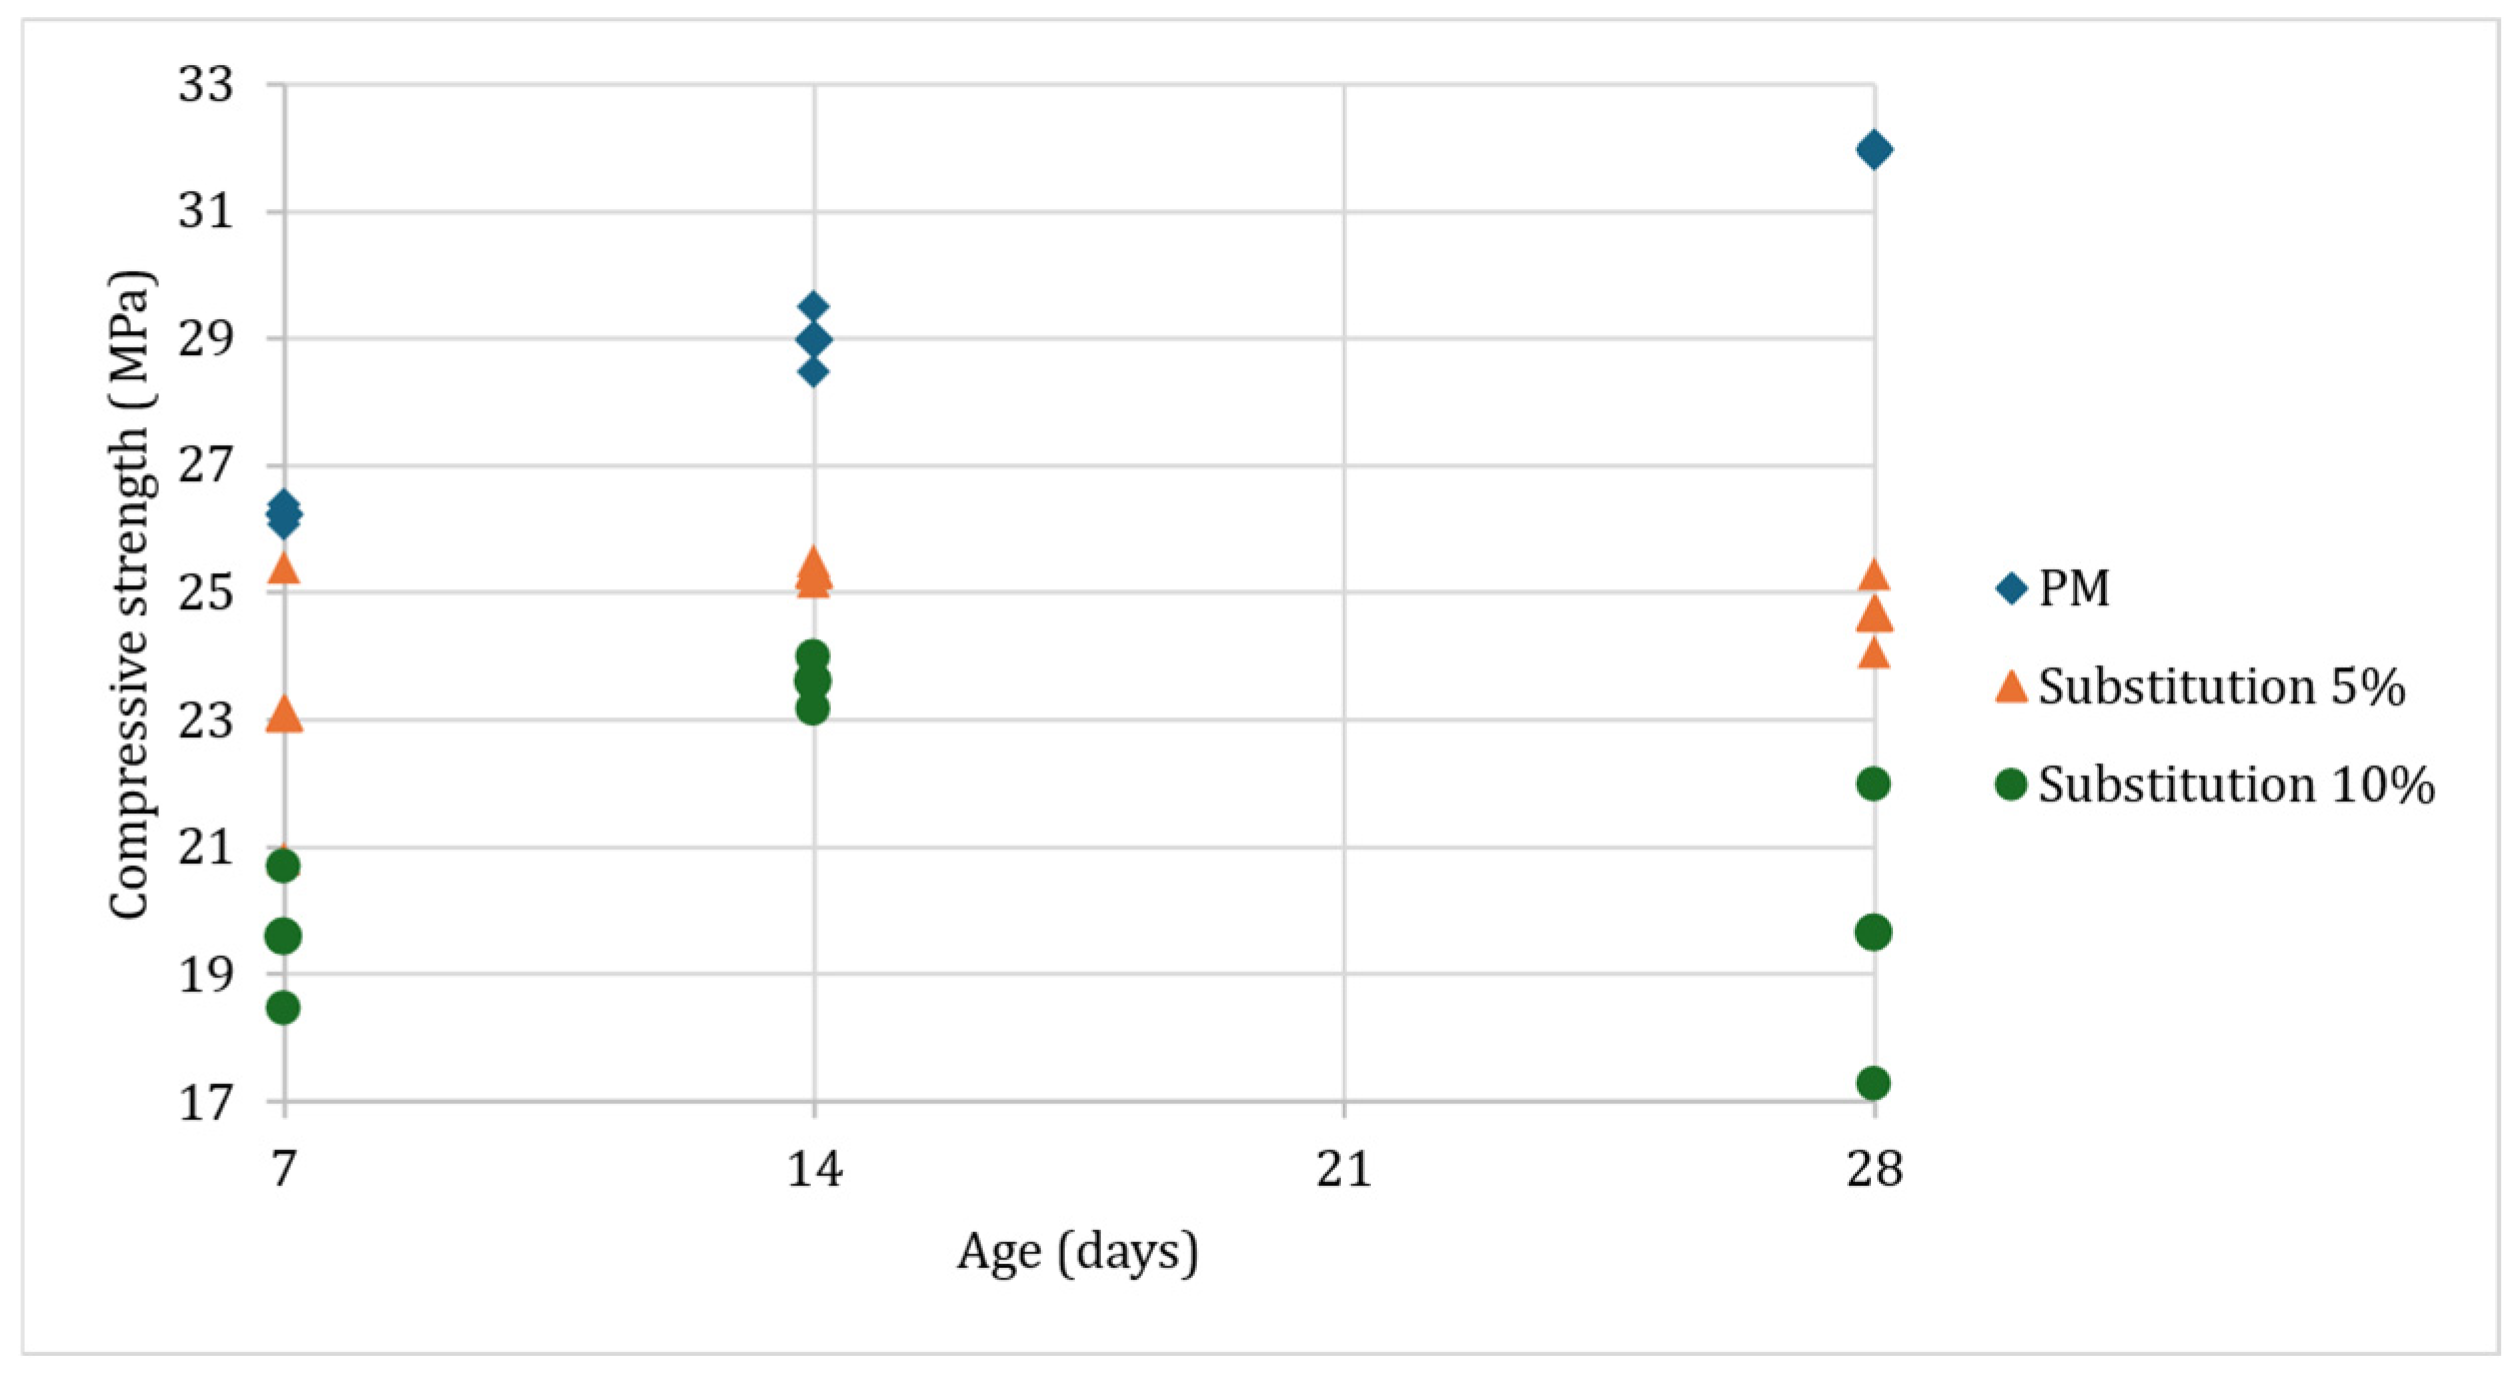
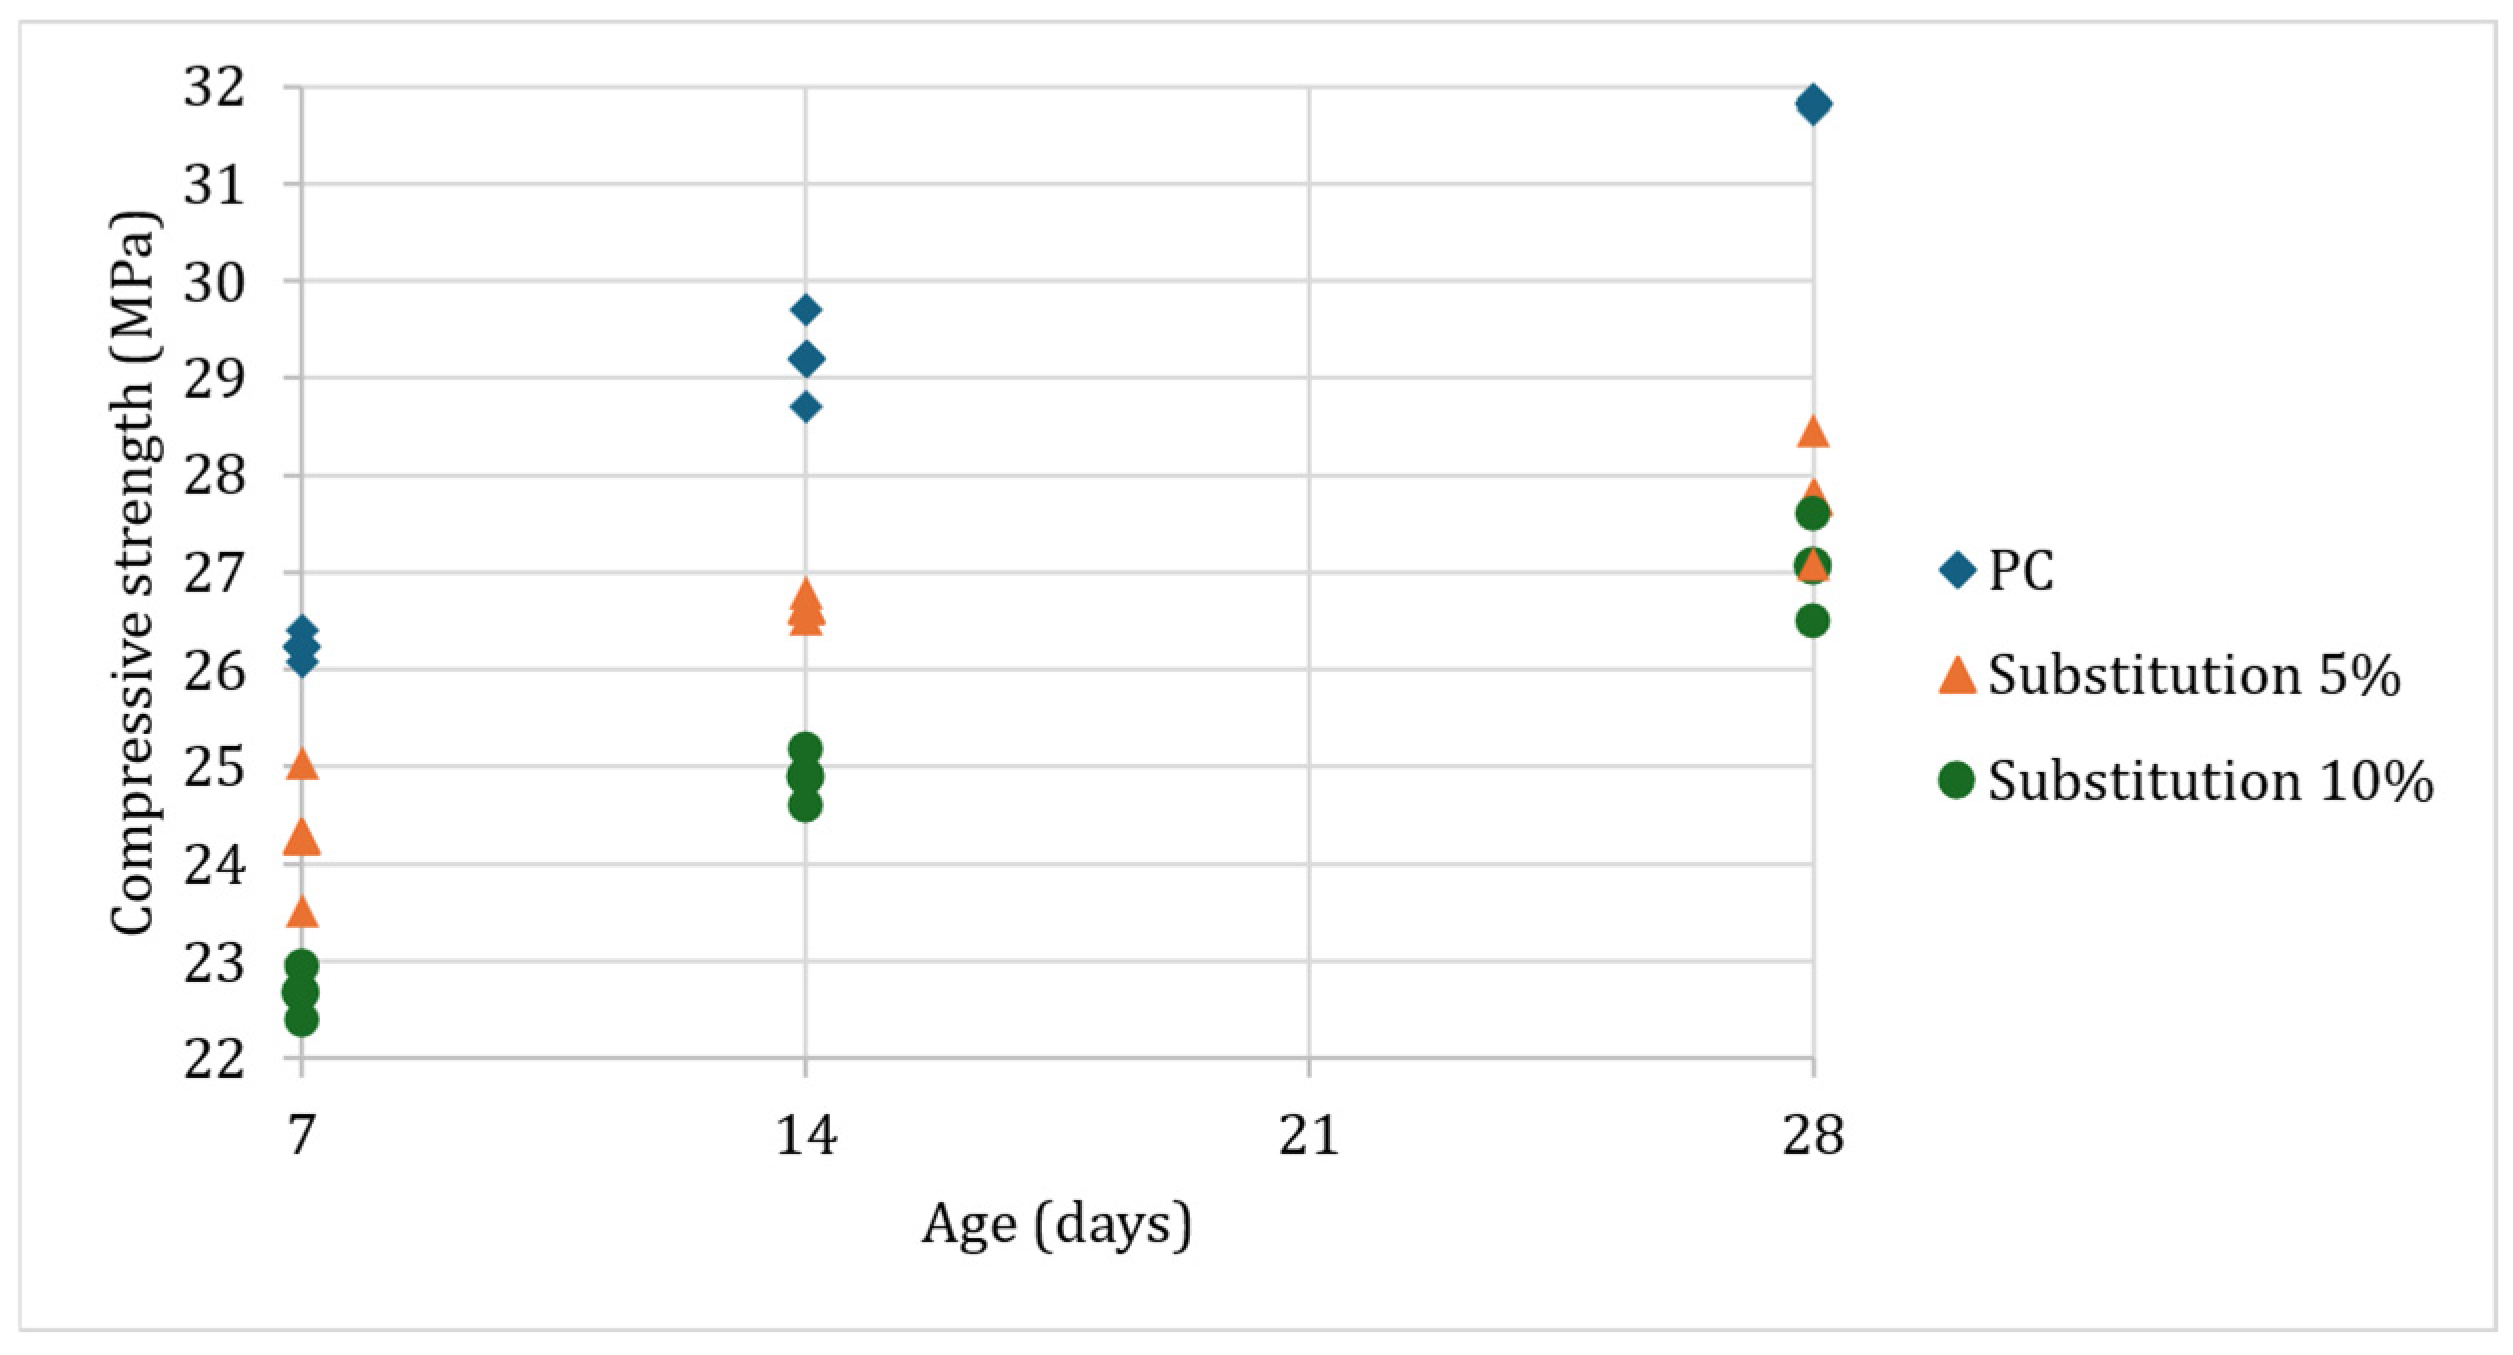
Buildings 15 00870 g018
Figure 19. Graph of the compressive strength.
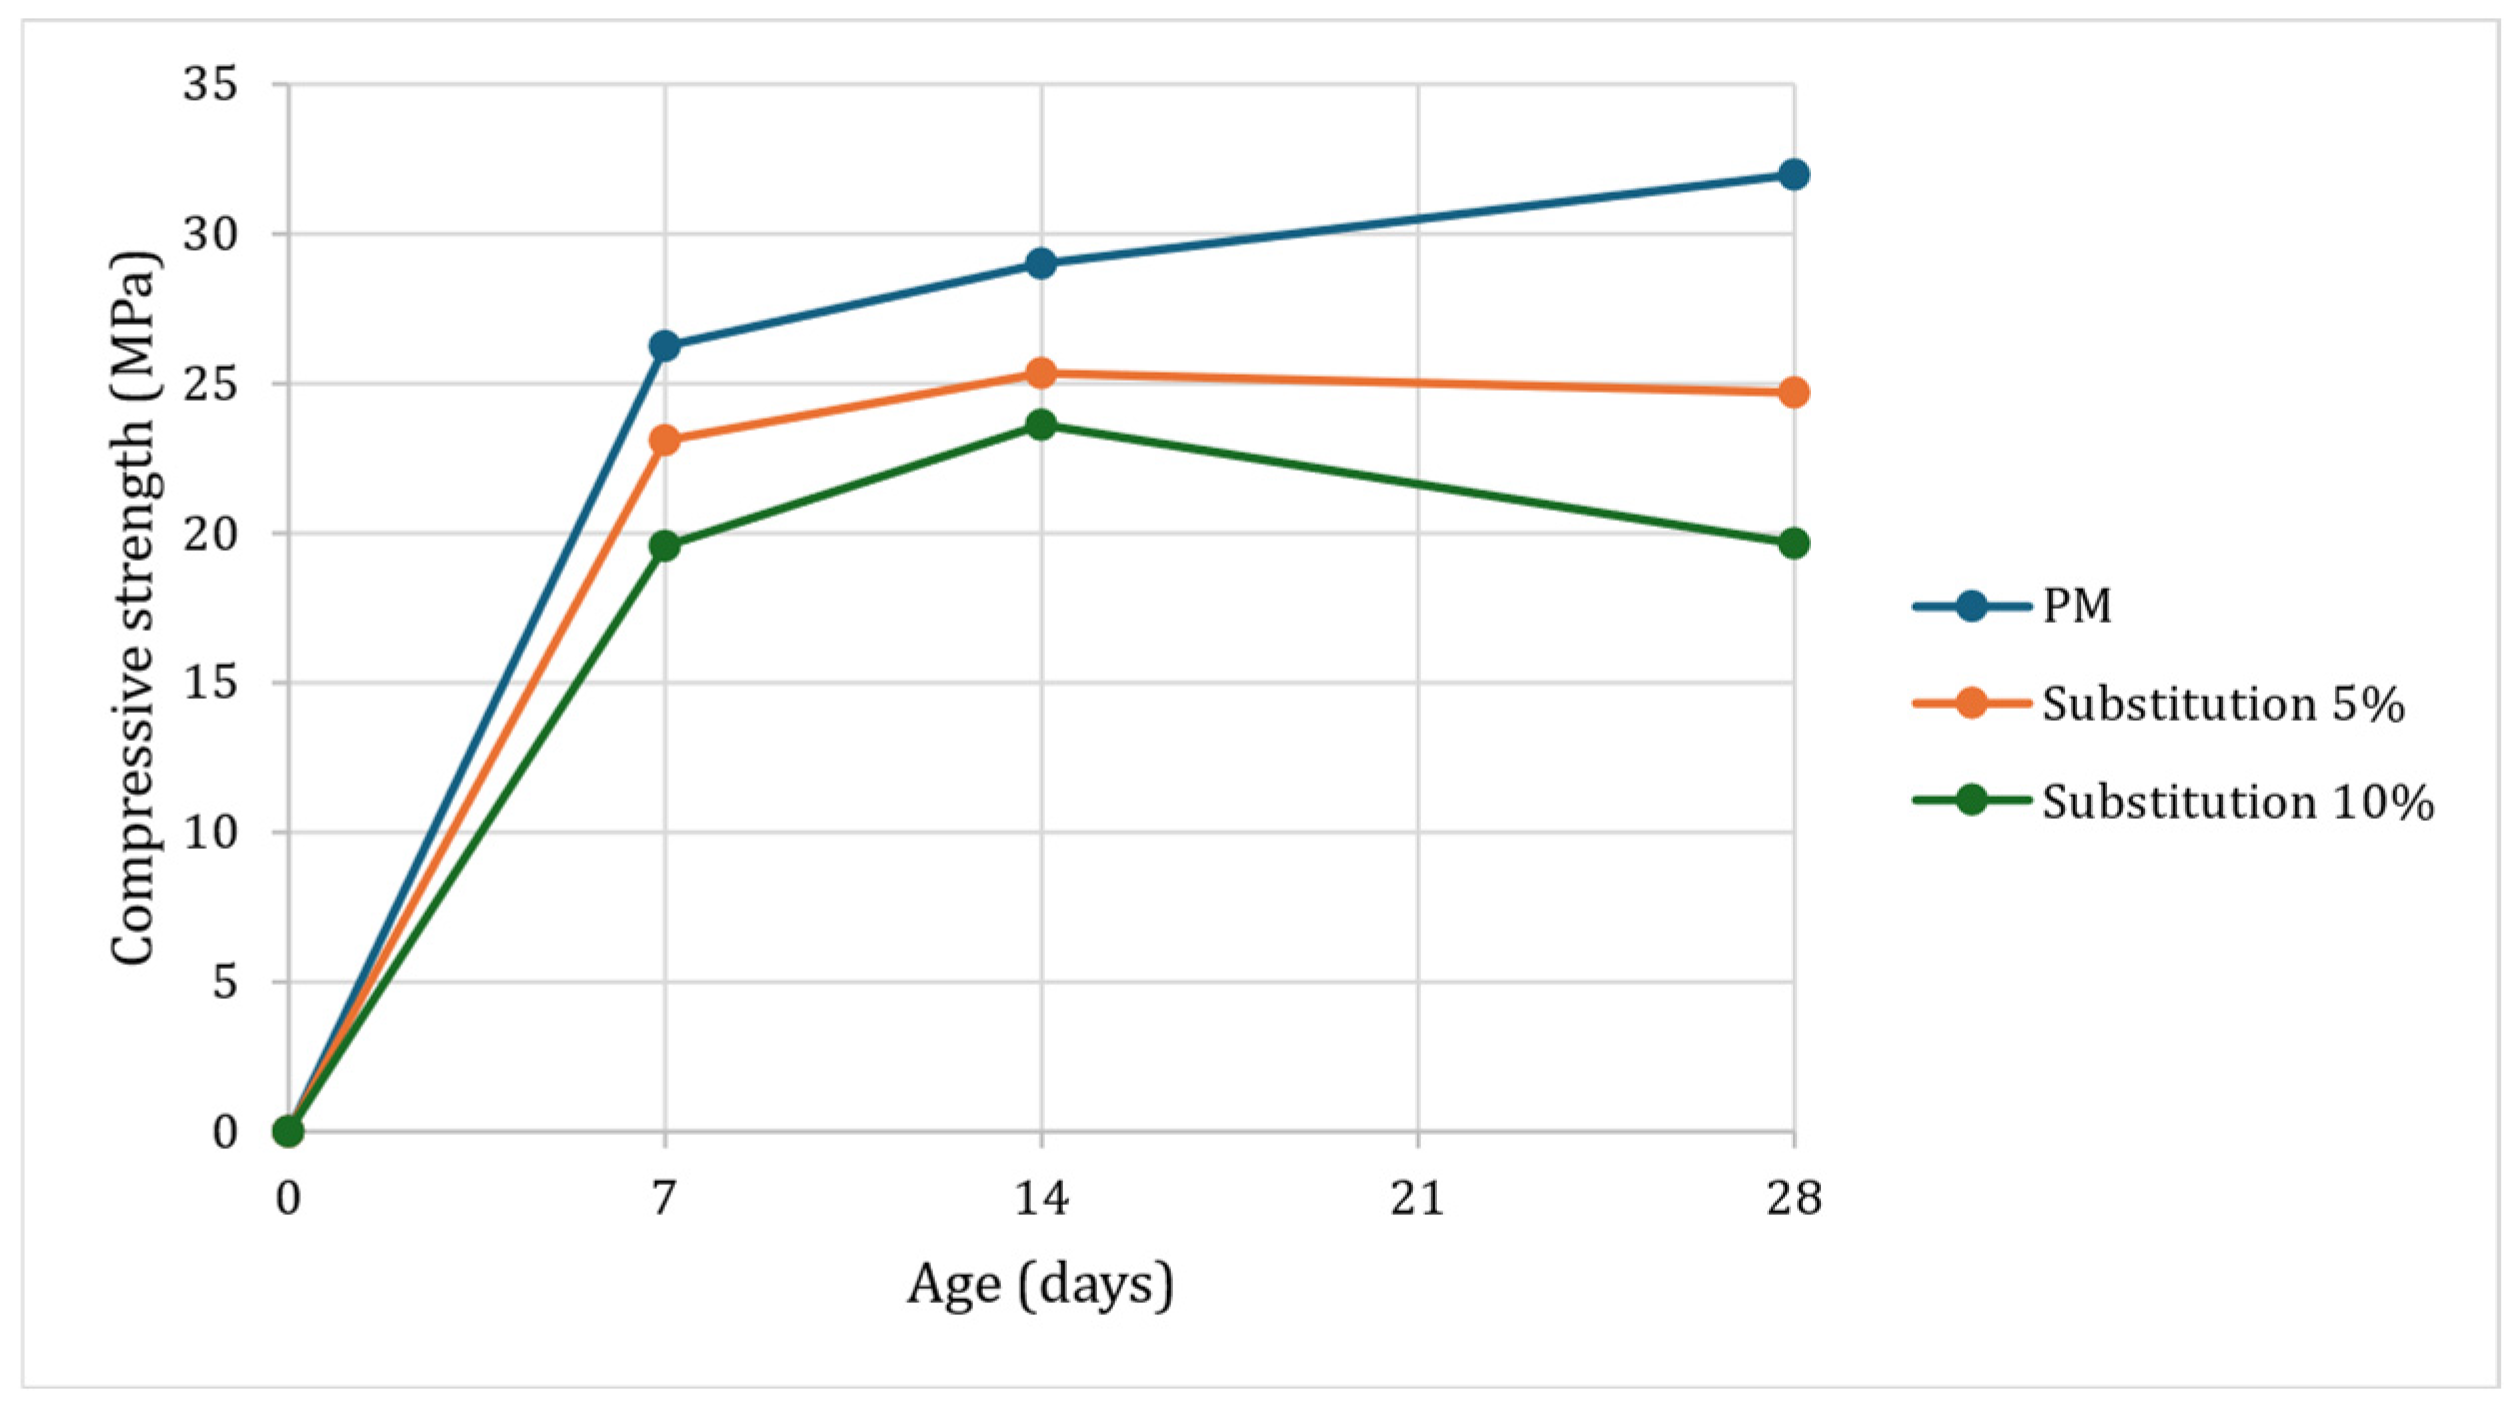
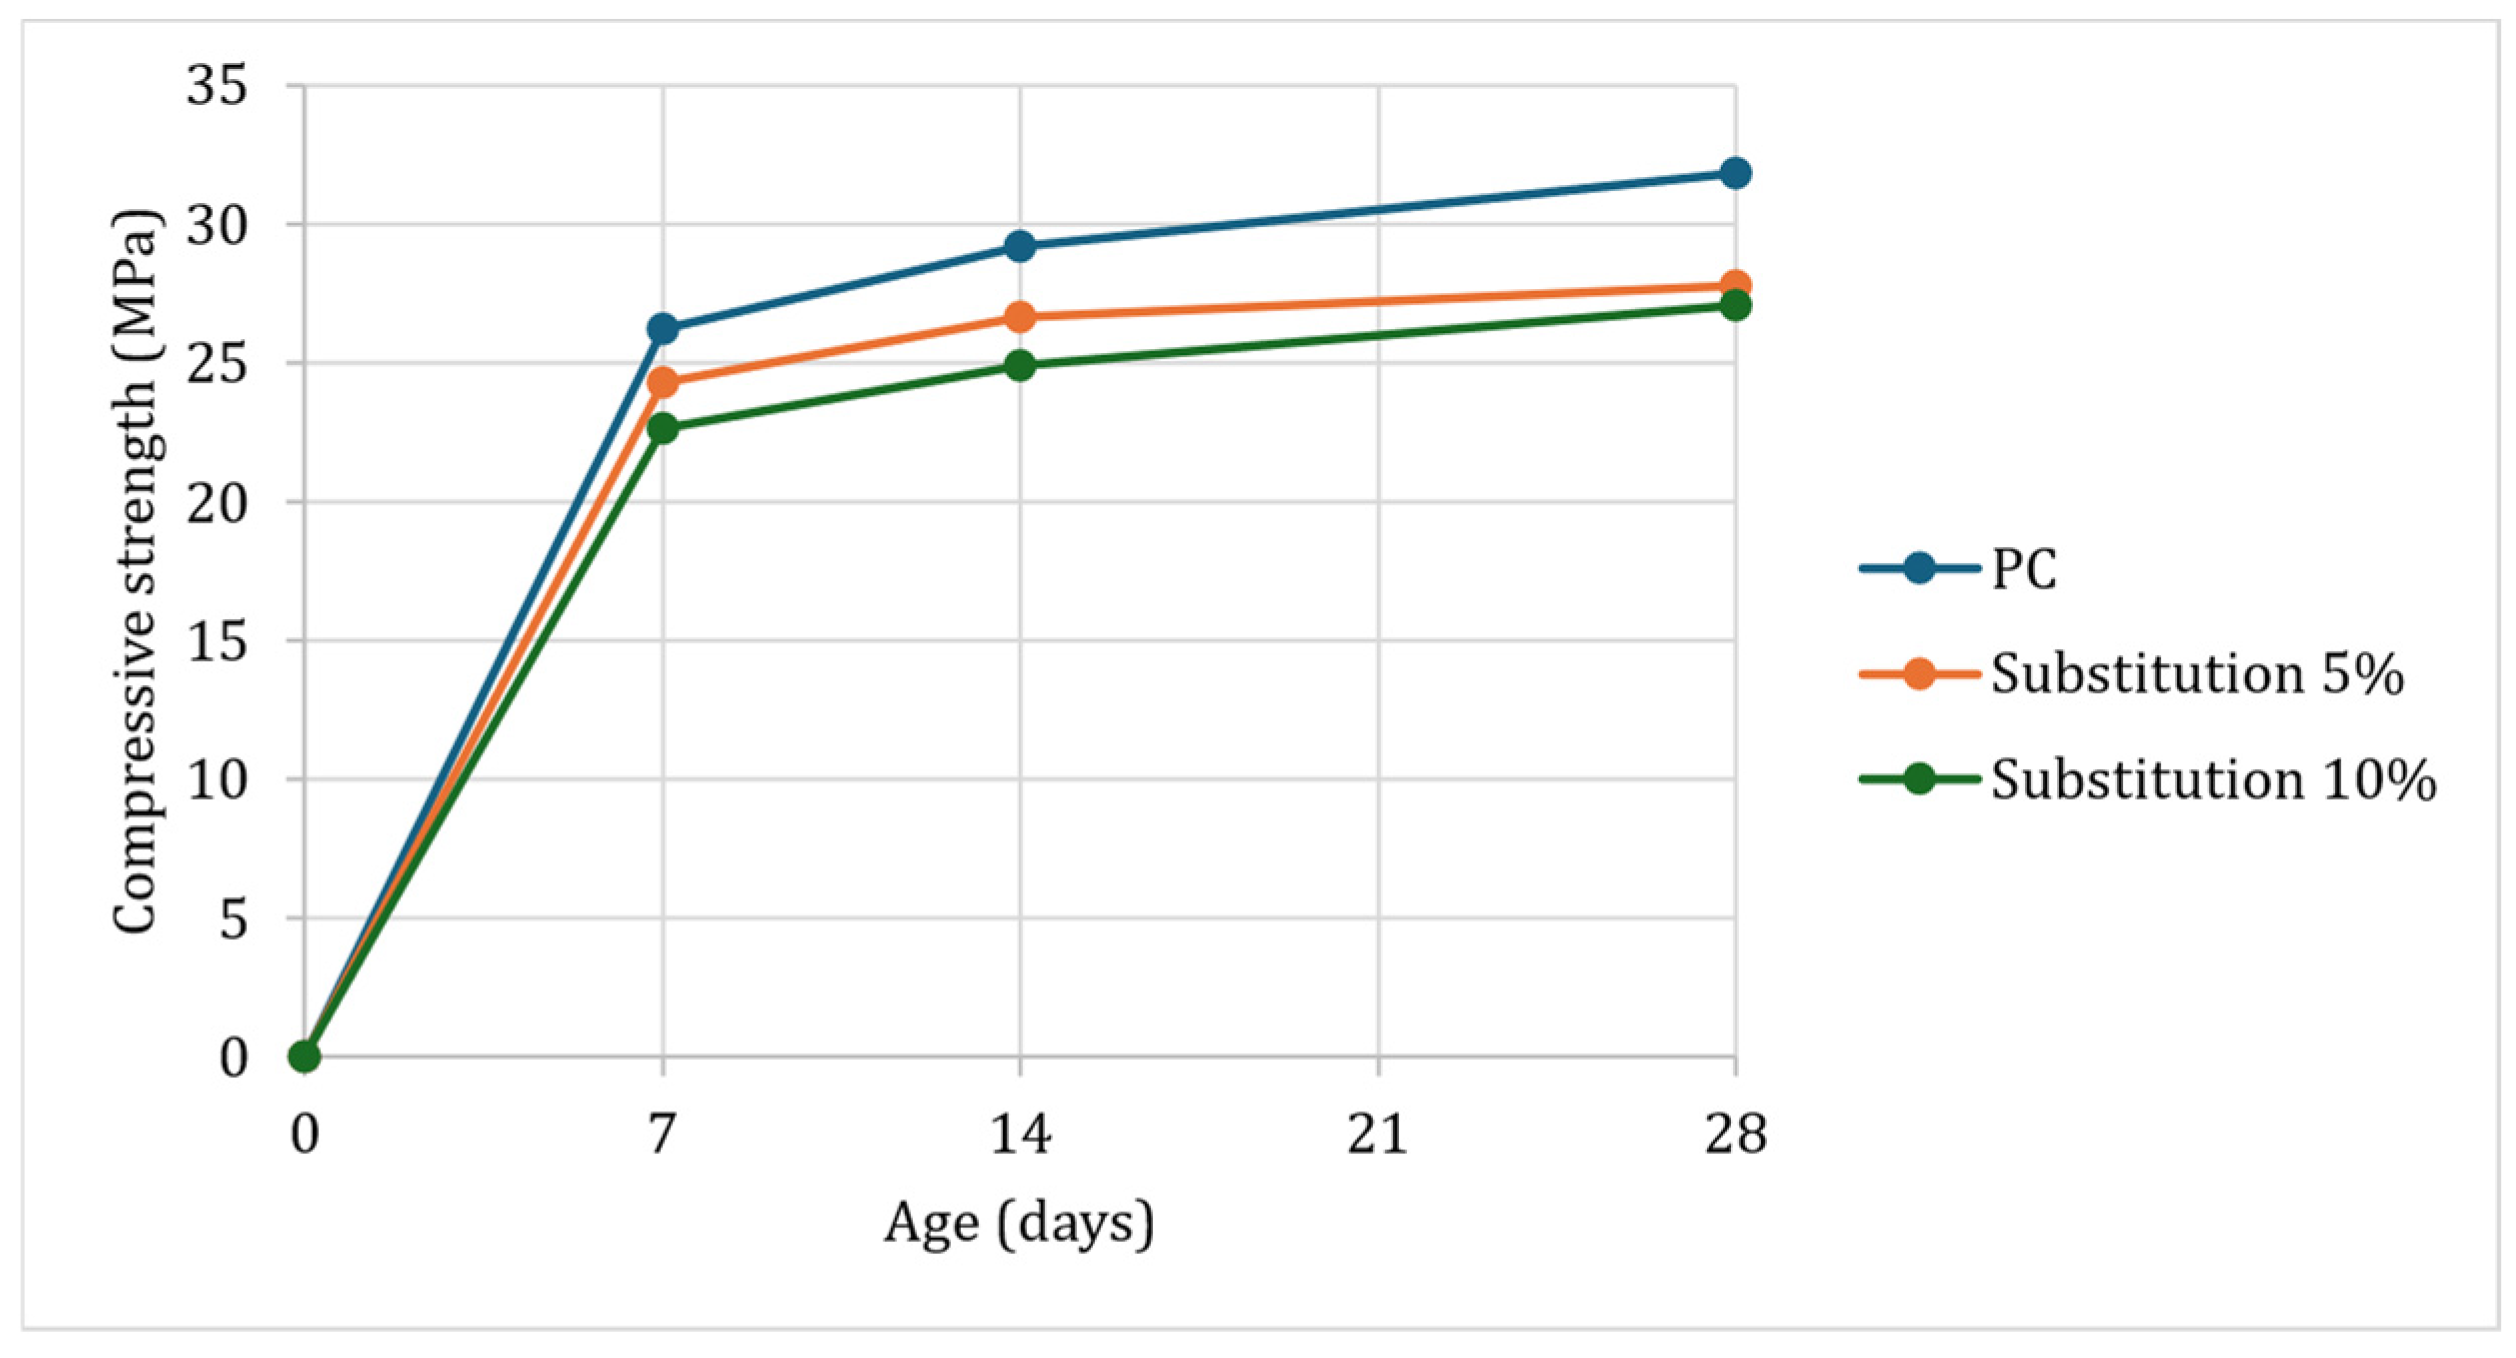
Buildings 15 00870 g019
Figure 20. Graph of the average compressive strength.
Buildings 15 00870 g020
Table 1. Chemical composition of Portland Cement Type I.
NameCompound%
LimeCaO62.5
SilicaSiO221
AluminaAl2O36.5
IronFeO32.5
Free limeCaO0
SulfurSO32
MagnesiumMgO2
AlkalisNa2O + K2O0.5
Loss on ignition-2
Insoluble residue-1
Total-100
Table 2. Physical properties of Portland cement I, adapted from [13].
Physical Requirements%
Air content of mortar, B volume %
Max12
Min---
Fineness, C specific surtace, m2/kg (alternative methods):
Turbidimeter test
Average value, min D160
Average sample, min E150
Average value, max D---
Average value, max E---
Air permeability test
Average value, min D280
Average sample, min E260
Average value, max D---
Average value, max E---
Autoclave expansion, max, %80
Strength, not less than the values shown for the ages
Indicated as follows: G
Compressive strength, MPa (psi):
1 day---
3 days
12.0
7 days(1740)
19.0
28 days(2760)
---
Time of setting; Vicat test: 1
Time of setting, min, not less than45
Time of setting, min, not more than375
D—the average value shall be determined on the last consecutive five samples from a source. E—the value of any one sample shall be the result of a test or average of tests on anyone sample. G—the strength at any specified test age shall be not less than that attained at any previous specified test age.
Table 3. Granulometric analysis of sand.
Sieve #Retained (g)%% Accumulated % Passing
3/8”0.000.000.00100.00
415.502.602.6097.40
860.810.1012.7087.30
16145.6024.3037.0063.00
30154.2025.7062.7037.30
5090.7015.1077.8022.20
10079.7013.3091.108.90
Bottom53.508.90100.000.00
Table 4. Physical properties of sand.
PropertiesUnitFine AggregateMethod
Loose unit weightkg/m31639ASTM C29 [15]
Compacted unit weightkg/m31800ASTM C29 [15]
Specific gravitykg/m32600ASTM C128 [16]
Finesse modulus-2.84ASTM C136 [14]
Absorption%1.21ASTM C128 [16]
Moisture content%1.17ASTM C566 [17]
Table 5. Other properties of coarse aggregate.
PropertiesUnitCoarse AggregateMethod
Loose unit weightkg/m31443ASTM C29 [15]
Compacted unit weight kg/m31558ASTM C29 [15]
Specific gravitykg/m32740ASTM C128 [16]
Finesse modulus-7.40ASTM C136 [14]
Absorption%0.48ASTM C128 [16]
Moisture content%0.32ASTM C566 [17]
Table 6. Mortar dosages with sand substitution with samples in weight between 0.2% and 0.6%.
MaterialUnitPMOrange PeelCorn CobCorn HuskGrass
Cementkg0.500
Water0.315
Sand1.3751.3661.3691.3711.372
Waste00.0090.0060.0040.003
Table 7. Mortar dosages with sand substitution with samples in weight between 0.6% and 1.2%.
MaterialUnitPMOrange PeelCorn CobCorn HuskGrass
Cementkg0.500
Water0.315
Sand1.3751.3581.3631.3661.366
Waste00.0170.0120.0090.009
Table 8. Mortar dosages with sand substitution with samples in weight between 1.2% and 1.8%.
MaterialUnitPMOrange PeelCorn CobCorn HuskPineapple Leaf
Cementkg0.500
Water0.315
Sand1.3751.3501.3581.3541.352
Waste00.0250.0170.0210.023
Table 9. Concrete dosages with sand substitution with grass in volumetric proportions of 5% and 10%.
MaterialUnitPCCG-5%CG-10%
Cement8.70
Water5.00
Fine aggregatekg19.9018.9117.91
Coarse aggregate18.0018.0018.00
Grass00.030.06
Table 10. Classification of samples according to the following taxonomic position.
WasteOrderFamilyGenusSpecie
Orange PeelSapindalesRutaceaeCitrusCitrus aurantium L.
Corn CobPoalesPoaceaeZeaZea mays L.
Corn Husk
Pineapple leafBromeliaceaeAnanasAnanas comosus (L.) Merr.
GrassPoaceaeStenotaphrumStenotaphrum secundatum
Table 11. Elemental analysis—percentage by weight.
Waste% Weight
COClCaKNaMgSPSiAl
Orange Peel52.843.1-1.02.3-0.3--0.4-
Corn Cob58.040.30.30.10.9--0.10.10.10.1
Corn Husk56.537.6----0.1-0.25.50.1
Grass64.123.33.02.22.11.81.00.80.70.60.3
Table 12. Elemental analysis before UV exposure.
Waste% Carbon (C)% Hydrogen (H)% Nitrogen (N)
Orange Peel40.20556.09901.9830
Corn Husk39.35906.11603.7140
Pineapple leaf41.98505.83652.3359
Grass36.01755.24863.7140
Table 13. Cellulose content analysis before UV exposure.
ParameterOrange PeelCorn HuskPineapple LeafGrass
Cellulose34.57%32.47%44.28%33.79%
Table 14. Cellulose content analysis after 7 days UV exposure.
ParameterOrange PeelCorn HuskPineapple LeafGrass
Cellulose33.15%31.58%43.41%32.09%
Table 15. Compressive strength (in MPa) of mortar dosages, at 7 days of curing with different percentages in substitution.
Design 0.2–0.6%0.6–1.2%1.2–1.8%
PatternCompressive strength (MPa)25.8925.8925.89
Orange peelCompressive strength (MPa)/%Pattern0.730.560.56
2.8%2.2%2.2%
Corn cob20.5311.081.65
79.3%42.8%6.4%
Corn husk15.620.480.54
60.3%1.9%2.1%
Pineapple leaf--0.45
--1.7%
Grass27.8126.03-
107.4%100.5%-
Table 16. Compressive strength in MPa between 7 and 28 days of curing of the standard mortar (PM) and mortar dosages with grass in substitution of 5 and 10% of sand volume.
Design7 Days14 Days28 Days
PM26.0828.4832.04
26.2428.9931.97
26.4029.5031.90
Substitution-5%20.8225.1825.30
23.1125.3524.69
25.4025.5224.07
Substitution-10%20.6923.1821.99
19.5723.5919.64
18.4624.0017.28
Table 17. Average compressive strength (in MPa) at 7, 14 and 28 days of curing of the standard mortar (PM) and mortar dosages with grass substitutions of 5 and 10% of sand volume.
Design7 Days14 Days28 Days
PM26.2428.9931.97
Substitution-5%23.1125.3524.69
Substitution-10%19.5723.5919.64
Table 18. Slump of three concrete dosages.
DesignSlump
PC3.5″
CG-5%4″
CG-10%4.5″
Table 19. Volumetric weight of three concrete dosages.
DesignUnit Weight (kg/m3)%/PC
PC2423100
CG-5%240999
CG-10%237798
Table 20. Compressive strength (in MPa) at 7, 14 and 28 days of curing of the standard concrete (PC) and concrete dosages with grass substitution of 5 and 10% of sand volume.
Design7 Days14 Days28 Days
PC26.0828.7031.87
26.2429.2031.82
26.4029.7031.77
Substitution-5%23.5226.5127.08
24.2826.6627.77
25.0326.8028.46
Substitution-10%22.3924.5926.50
22.6624.8927.05
22.9325.1827.60
Table 21. Results of average compression tests, in MPa.
Design 7 Days14 Days28 Days
PC 26.2429.2031.82
Substitution-5%%/Pattern24.2826.6627.77
92.53%91.30%87.27%
Substitution-10%%/Pattern22.6624.8927.05
86.35%85.24%85.01%
Disclaimer/Publisher’s Note: The statements, opinions and data contained in all publications are solely those of the individual author(s) and contributor(s) and not of MDPI and/or the editor(s). MDPI and/or the editor(s) disclaim responsibility for any injury to people or property resulting from any ideas, methods, instructions or products referred to in the content.

