Author Contributions
Conceptualization, I.M.; methodology, I.M.; software, J.M.; Validation, I.M.; Formal analysis, I.M., C.V., C.R. and L.S.; Investigation, I.M., C.V., C.R., L.S., A.T. and J.M., resources, C.R., L.S., I.M., C.V. and A.T.; data curation, I.M.; writing—Original draft preparation, I.M.; review and editing, A.T.; visualization, J.M.; supervision, I.M.; project administration, I.M.; funding acquisition, I.M. All authors have read and agreed to the published version of the manuscript.
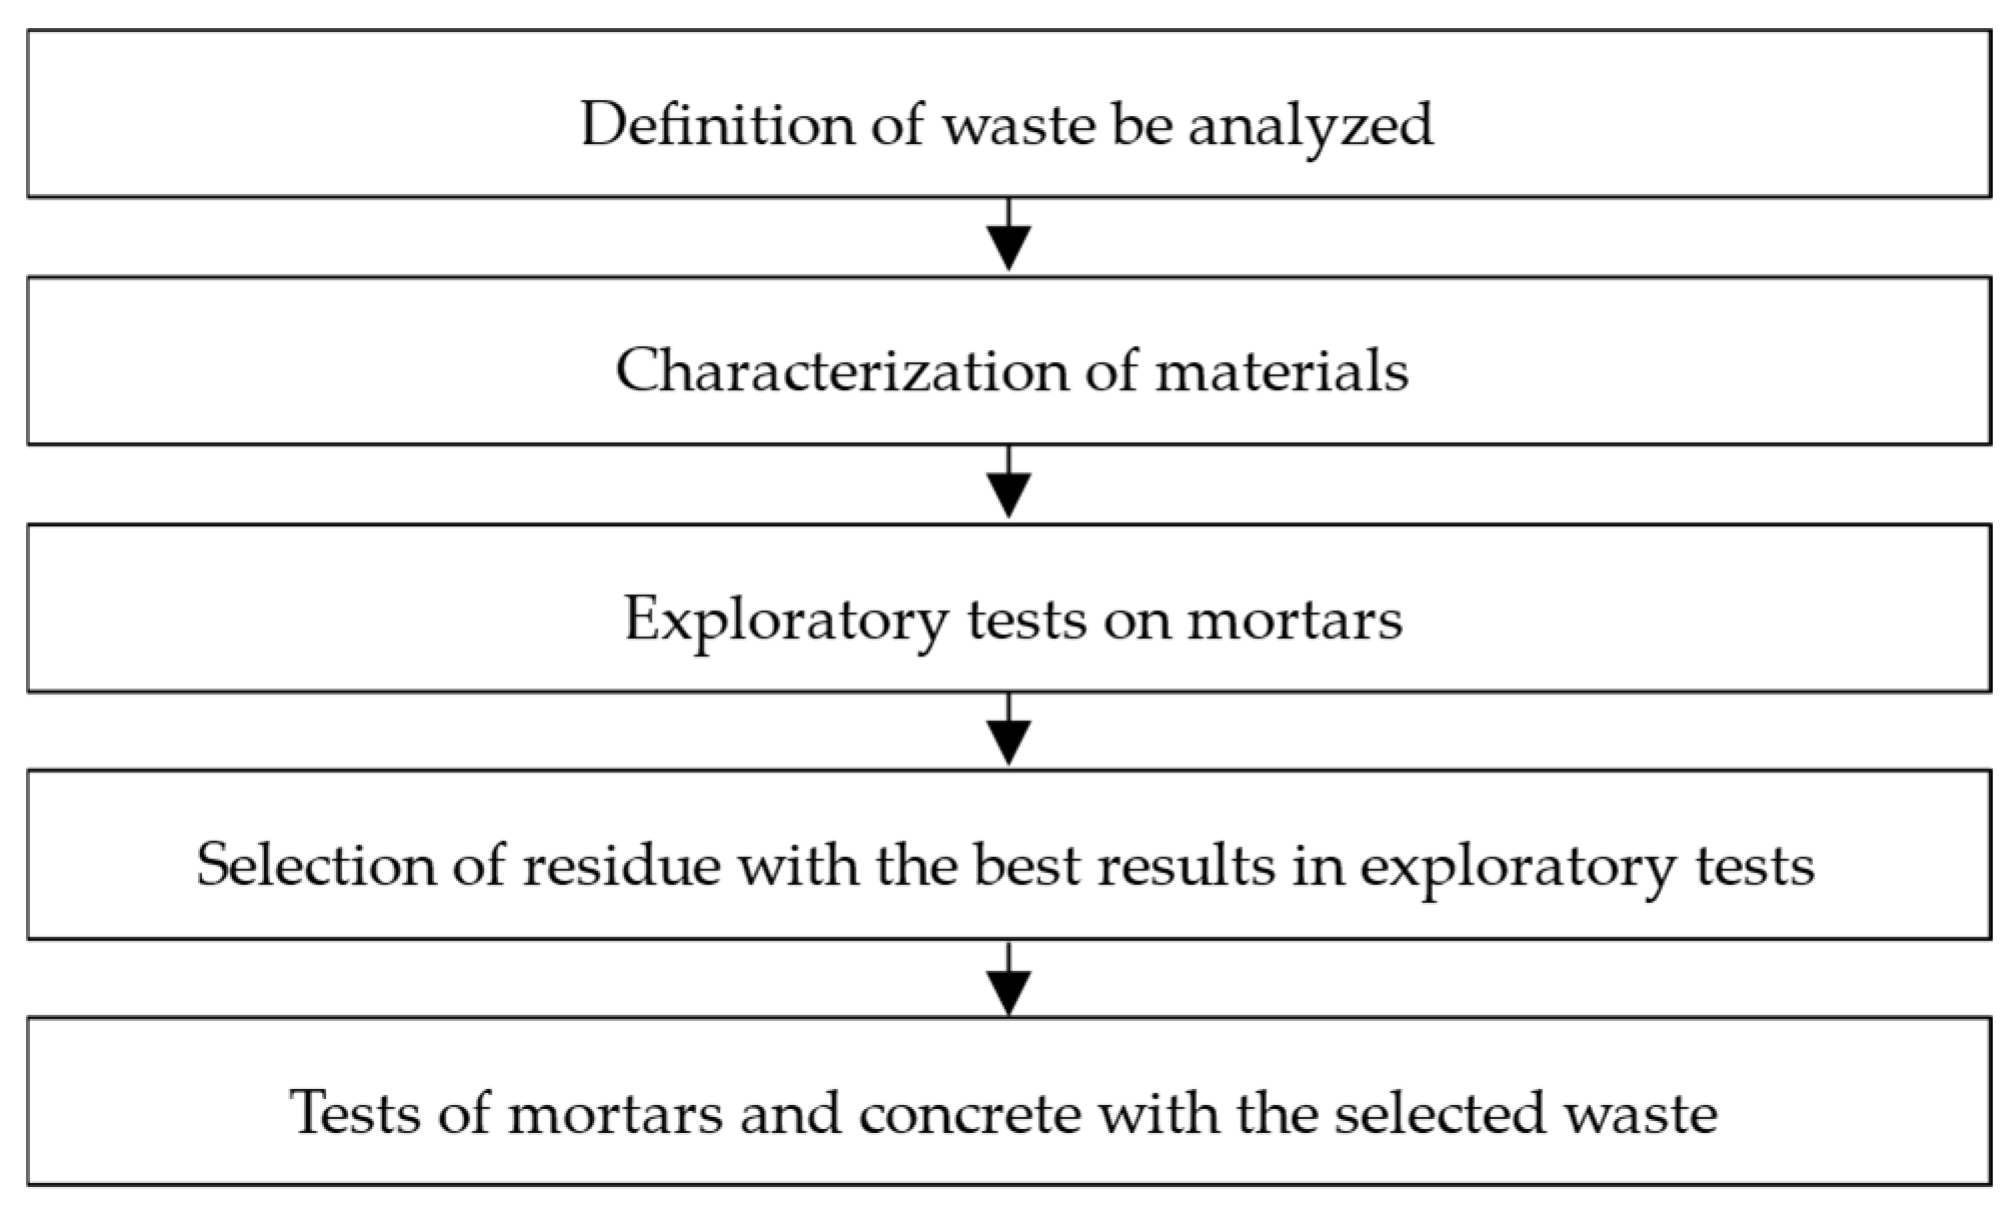
Figure 1.
The stages of the process.
Figure 1.
The stages of the process.
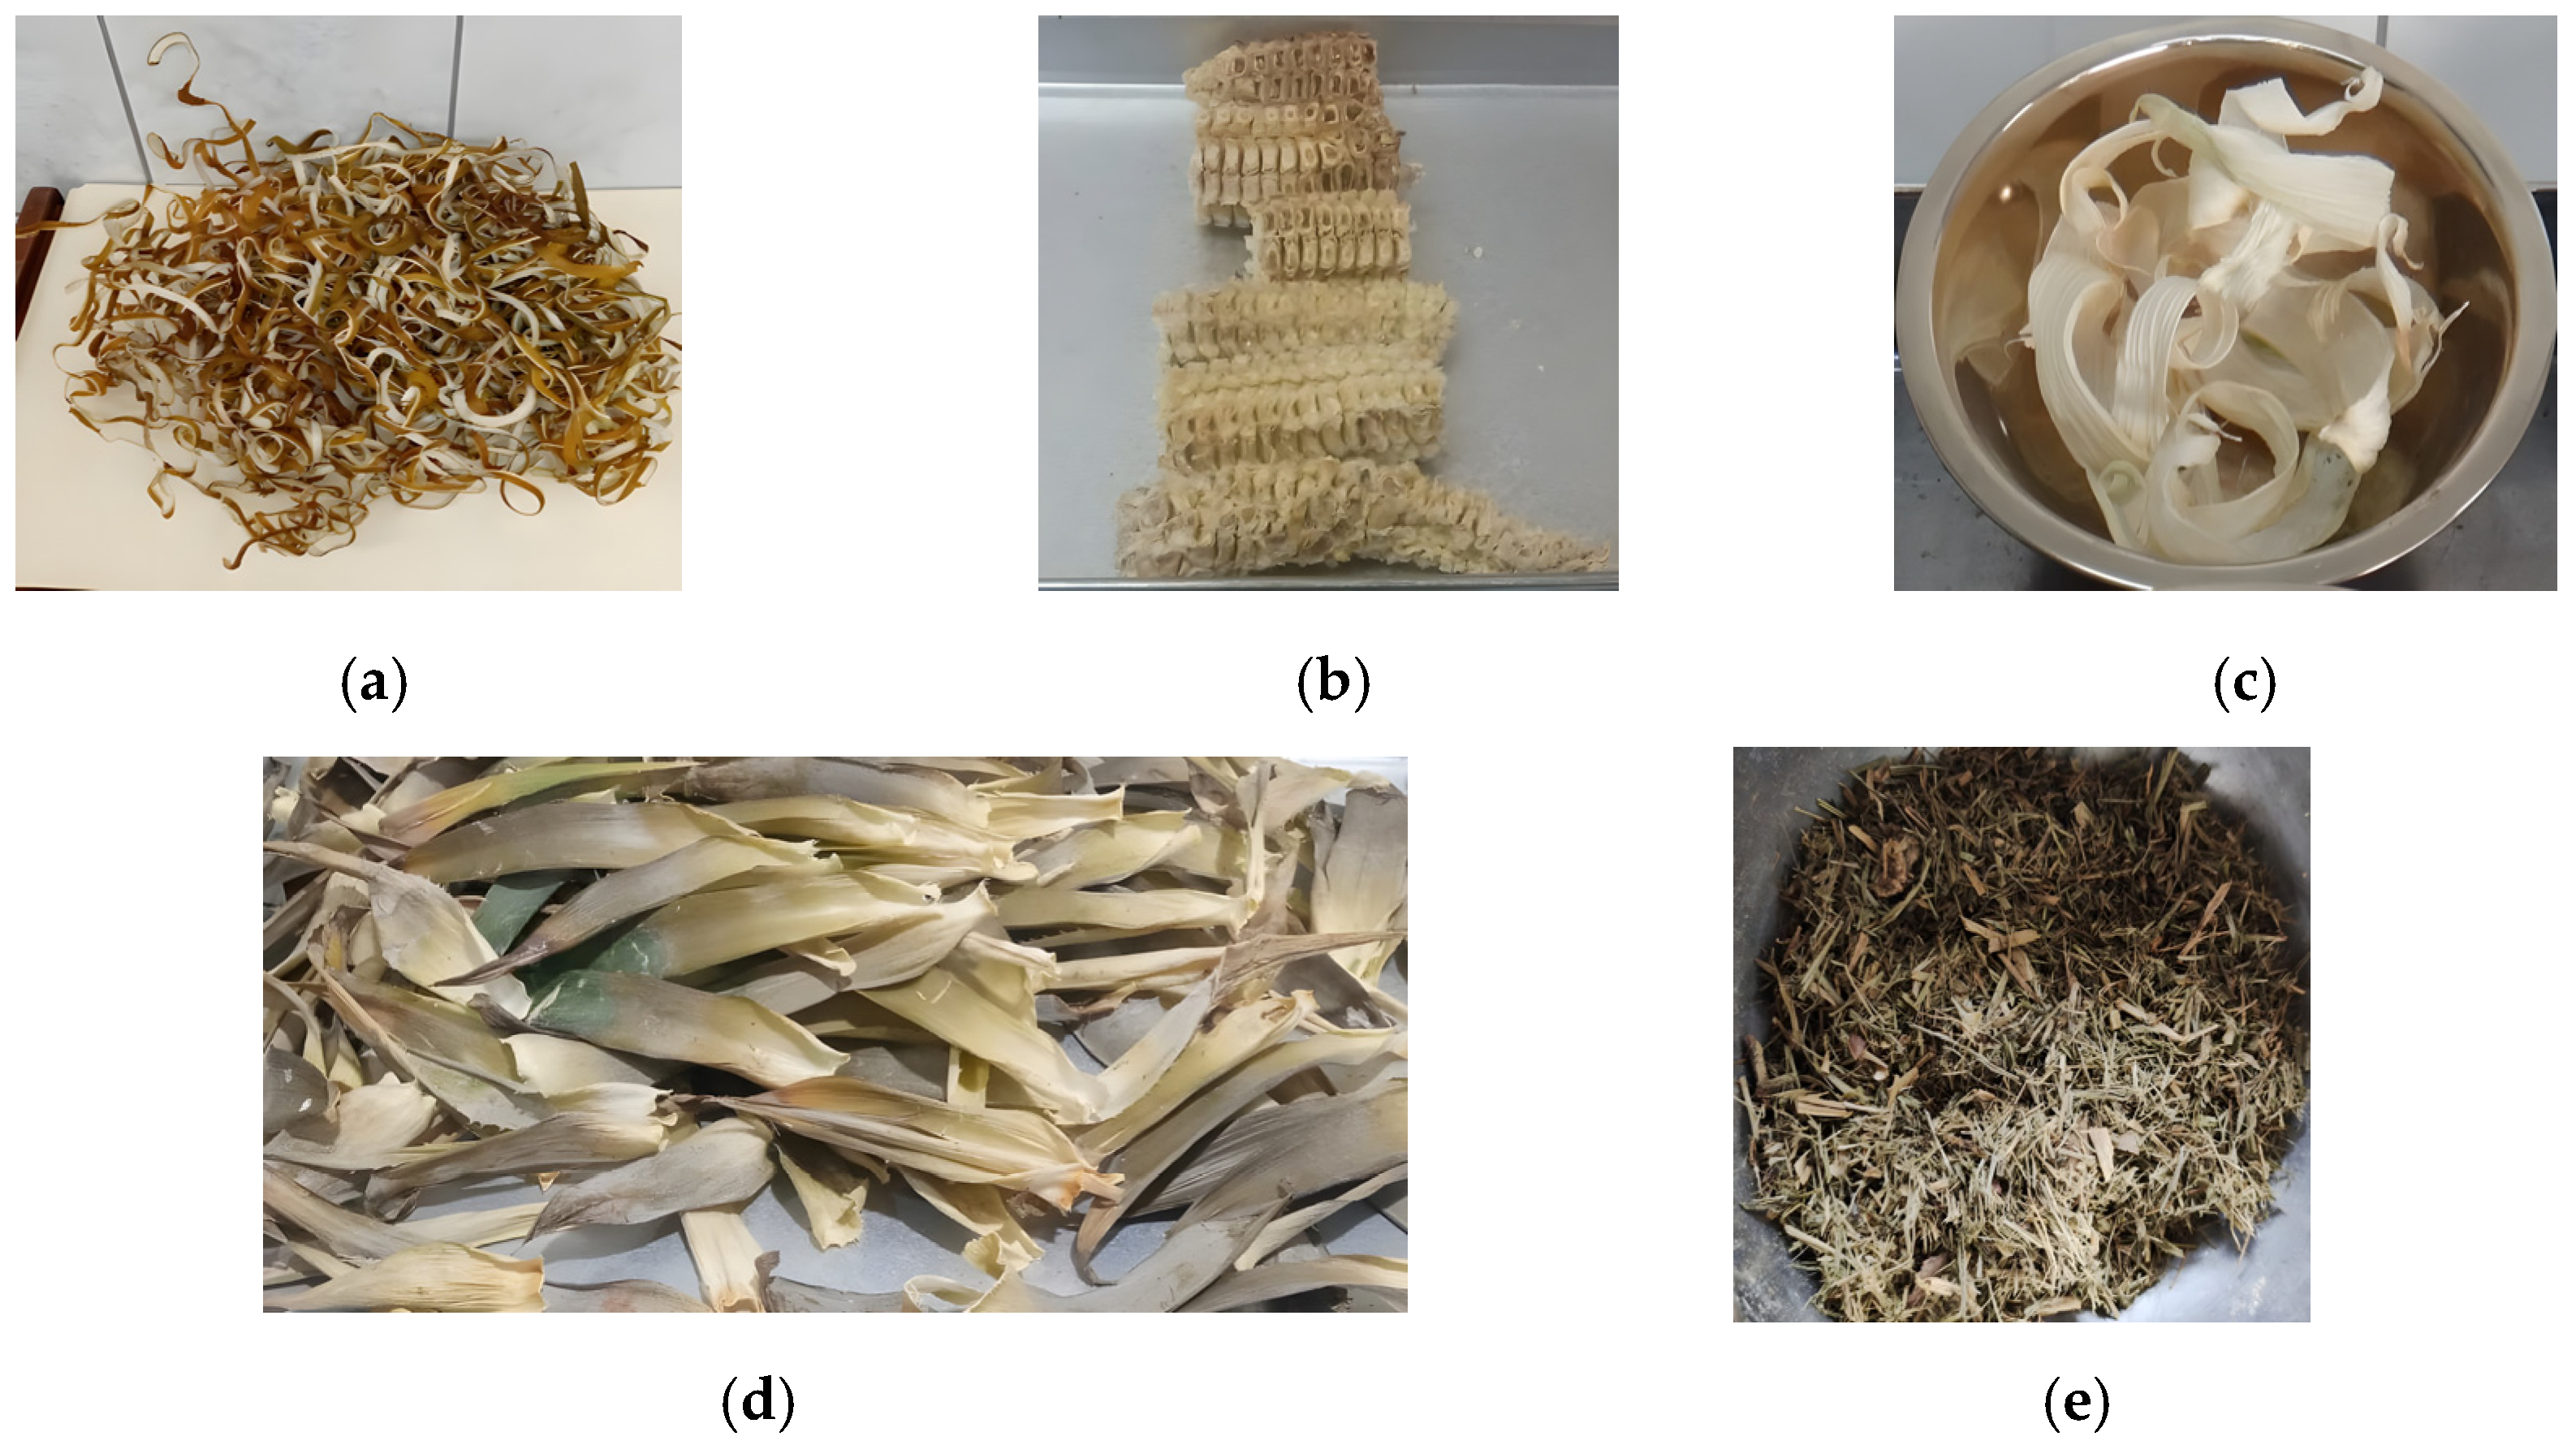
Figure 2.
Dried samples: (a) Orange peel; (b) Corn cob; (c) Corn husk; (d) Pineapple leaf; (e) Grass.
Figure 2.
Dried samples: (a) Orange peel; (b) Corn cob; (c) Corn husk; (d) Pineapple leaf; (e) Grass.
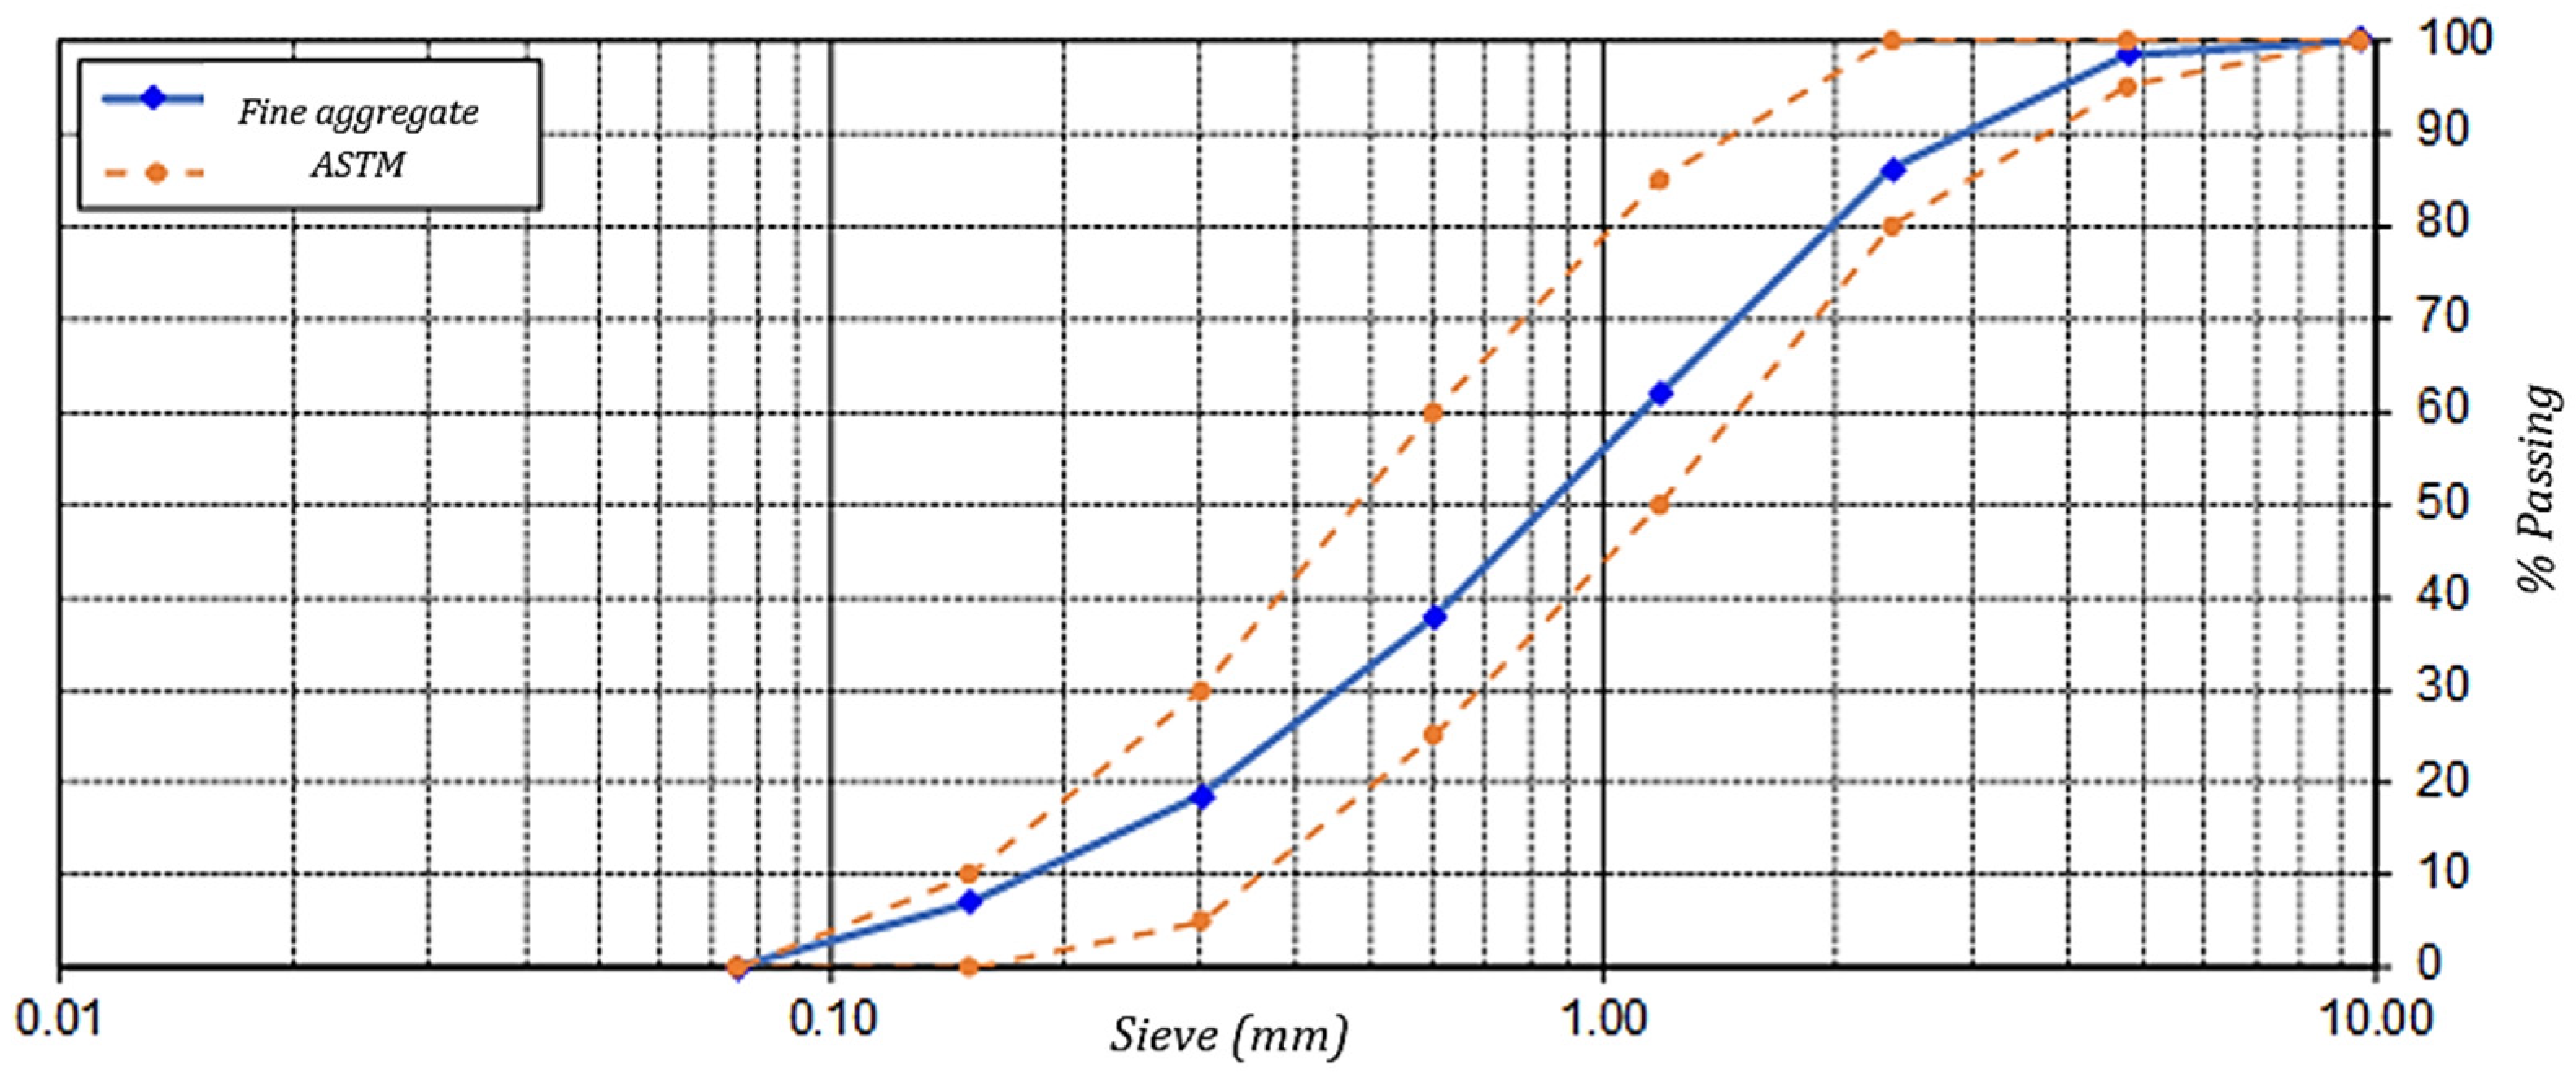
Figure 3.
Granulometric curve of fine aggregates.
Figure 3.
Granulometric curve of fine aggregates.
Figure 4.
Mortar-sample-processing sequence: (a) Molding; (b) Demolding; (c) Curing.
Figure 4.
Mortar-sample-processing sequence: (a) Molding; (b) Demolding; (c) Curing.
Figure 5.
Compressive strength test: (a) Versa-Tester testing machine; (b) Test; (c) Specimen tested.
Figure 5.
Compressive strength test: (a) Versa-Tester testing machine; (b) Test; (c) Specimen tested.
Figure 6.
Concrete-sample-processing sequence: (a) Molding; (b) Demolding; (c) Curing.
Figure 6.
Concrete-sample-processing sequence: (a) Molding; (b) Demolding; (c) Curing.
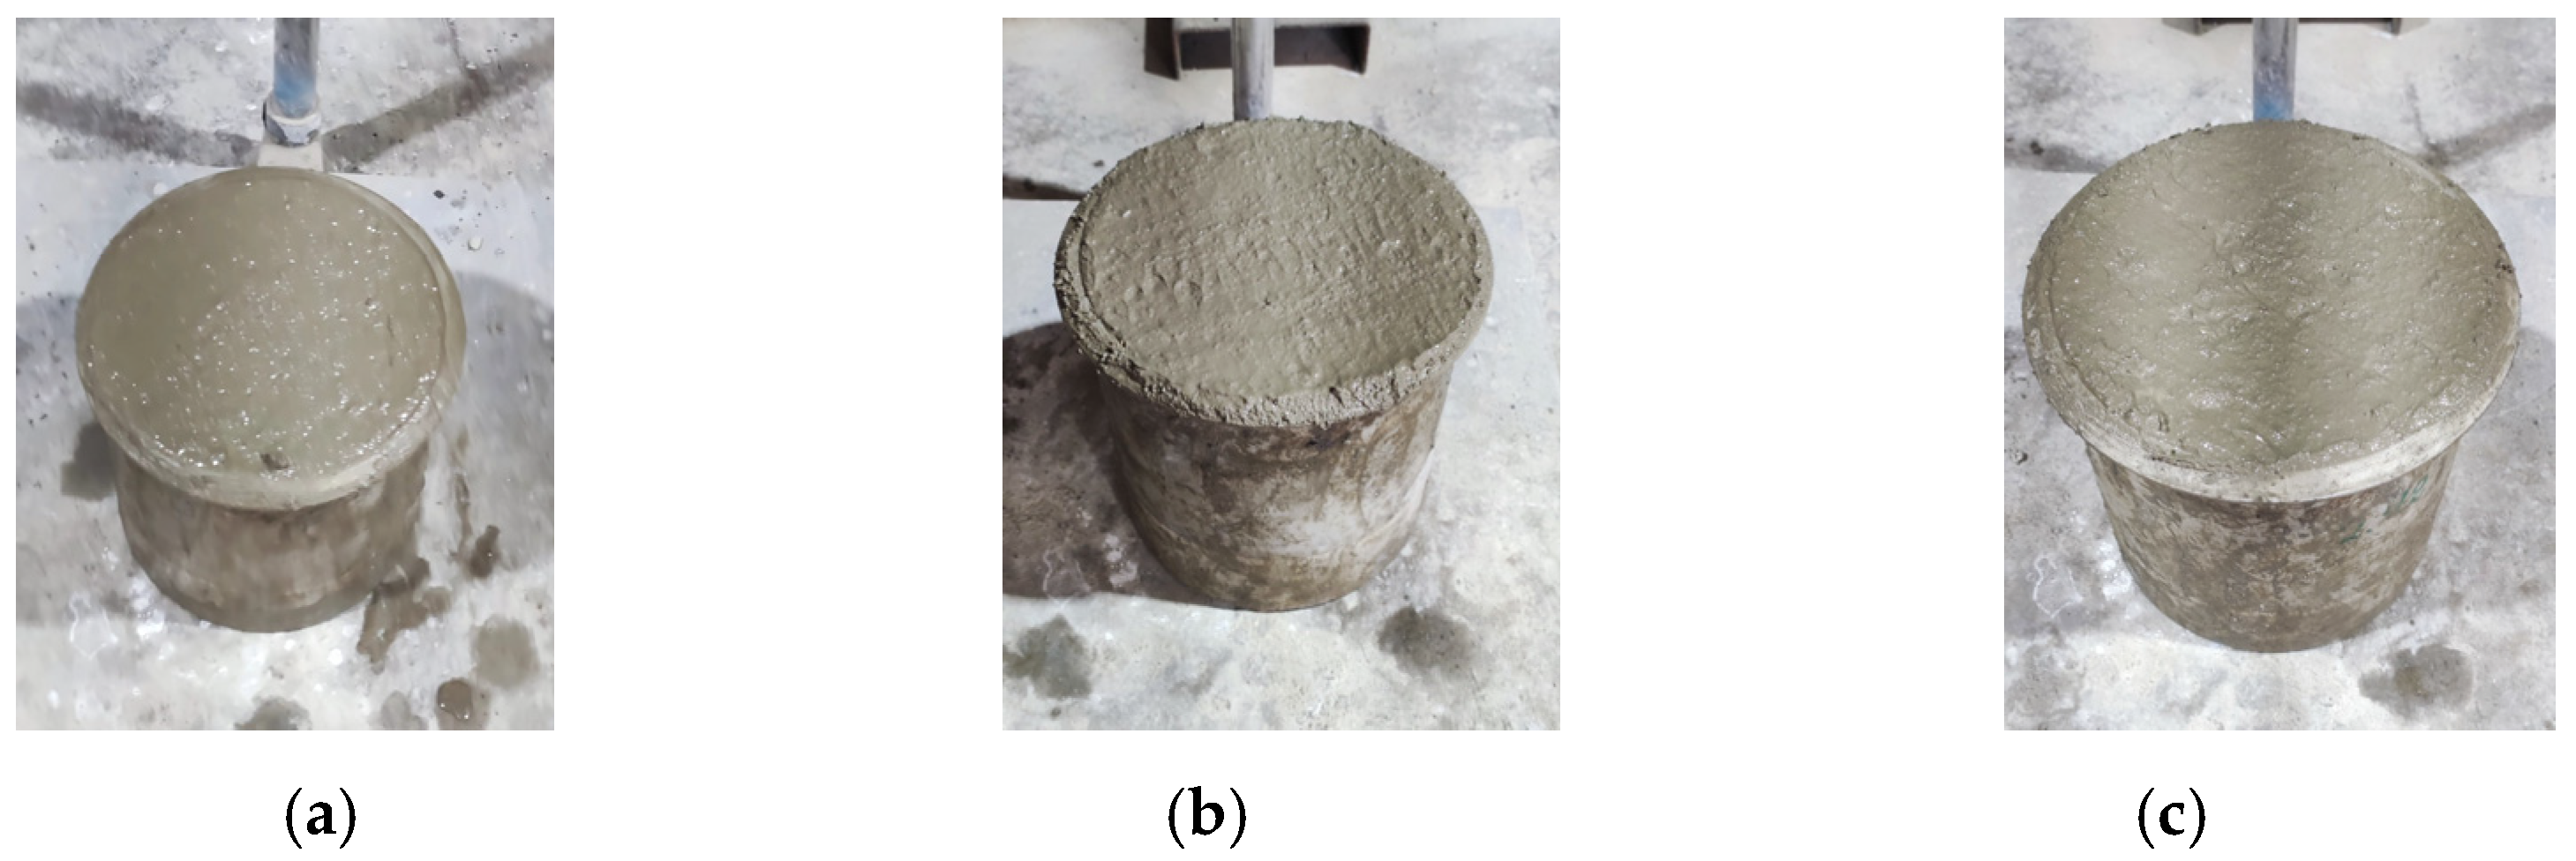
Figure 7.
Concrete slump testing: (a) Concrete Slump Testing Equipment; (b) CG-5%; (c) CG-10%.
Figure 7.
Concrete slump testing: (a) Concrete Slump Testing Equipment; (b) CG-5%; (c) CG-10%.
Figure 8.
Concrete unit weights: (a) PC; (b) CG-5%; (c) CG-10%.
Figure 8.
Concrete unit weights: (a) PC; (b) CG-5%; (c) CG-10%.
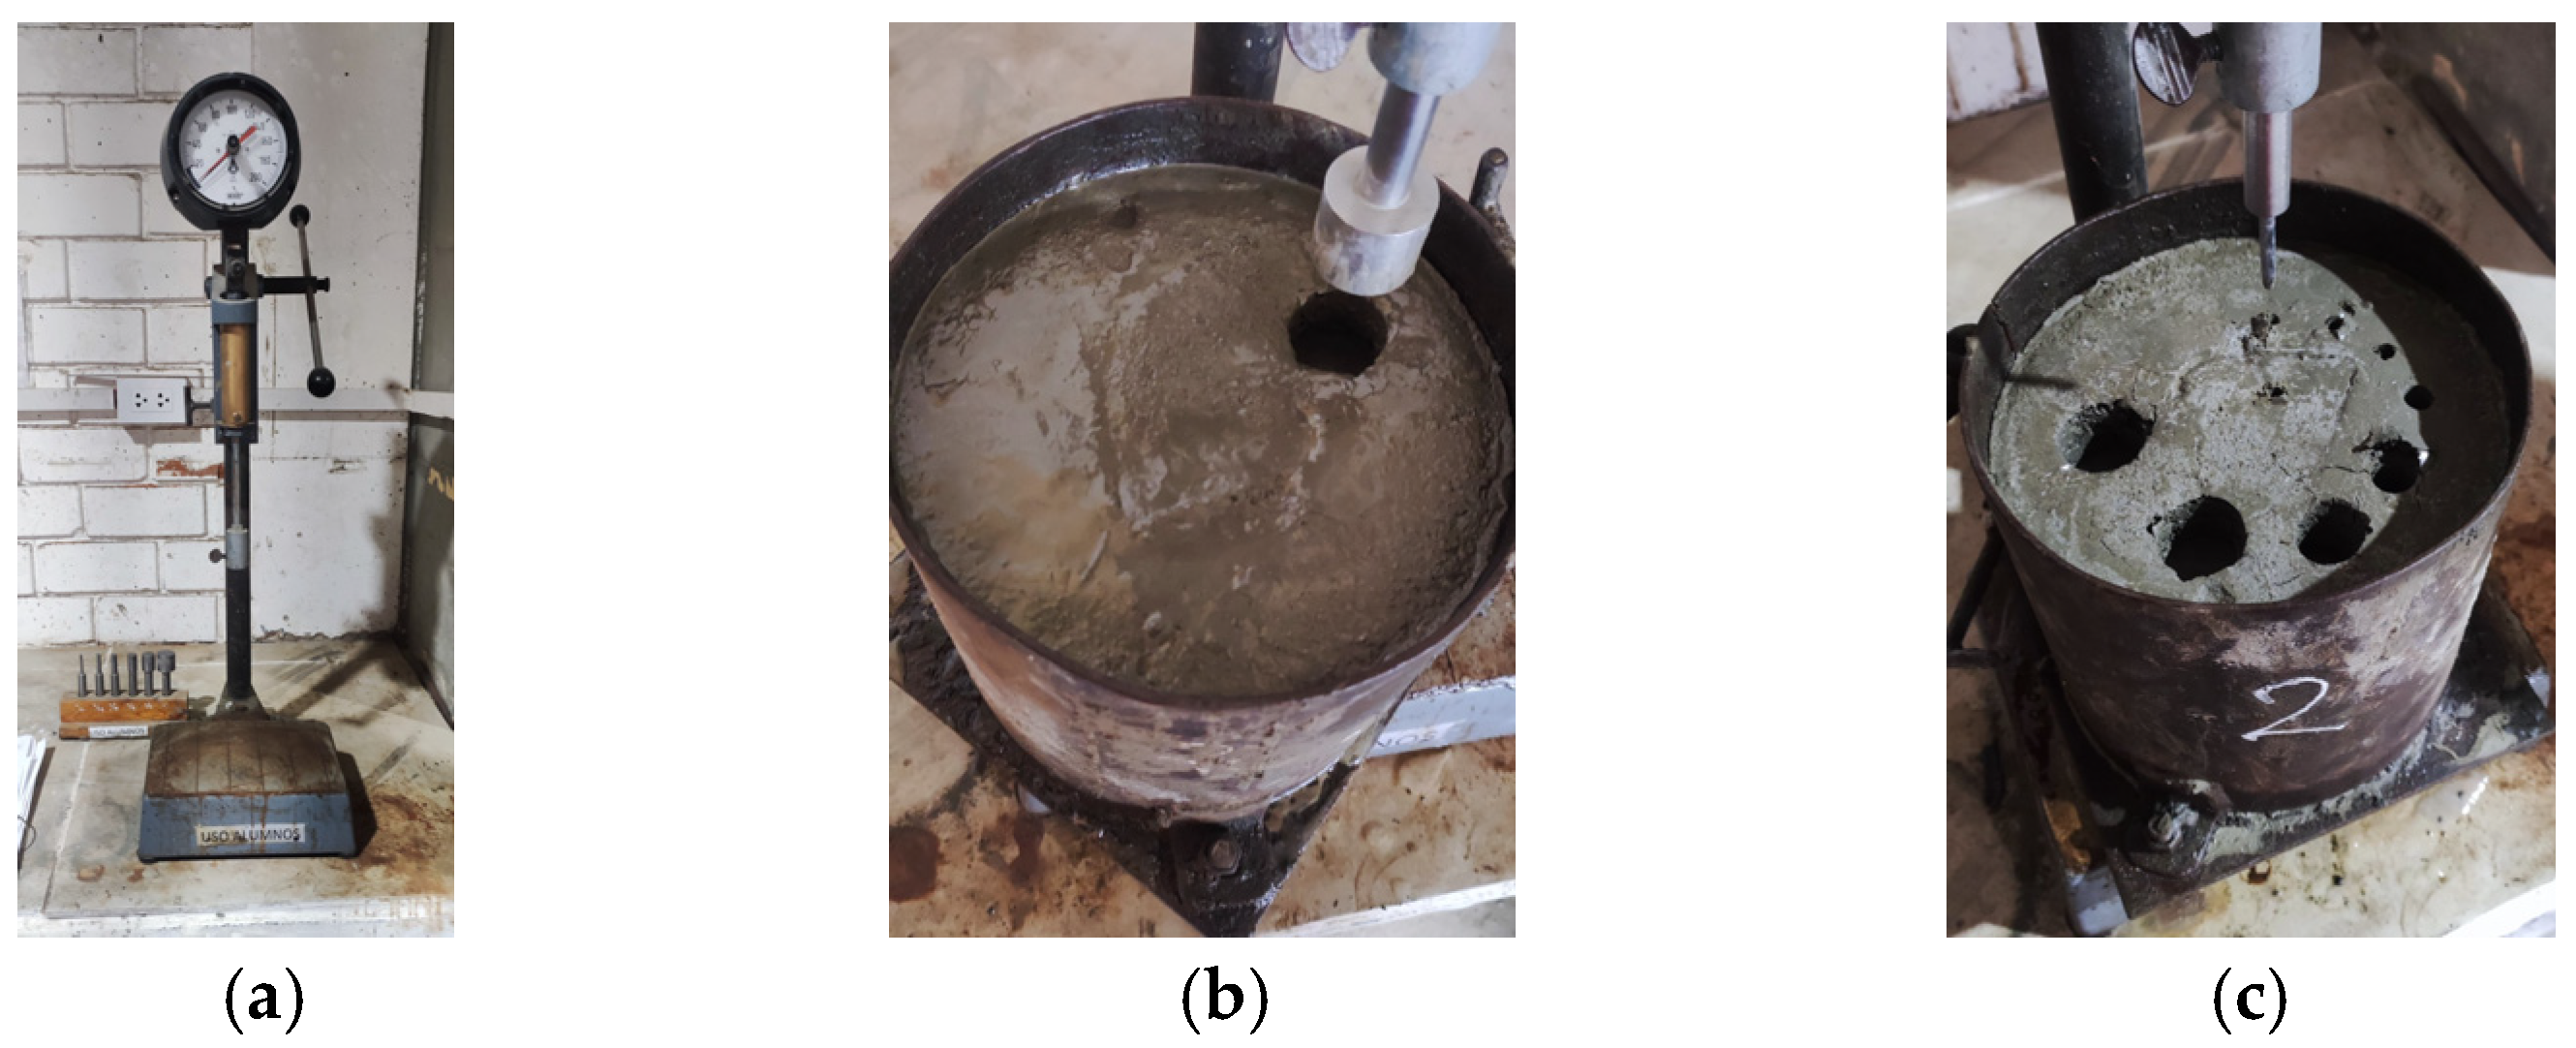
Figure 9.
The setting time for the pattern (PC). (a) Penetrometer; (b) Needle penetration into the concrete; (c) Tested sample.
Figure 9.
The setting time for the pattern (PC). (a) Penetrometer; (b) Needle penetration into the concrete; (c) Tested sample.
Figure 10.
Concrete temperature measurement.
Figure 10.
Concrete temperature measurement.
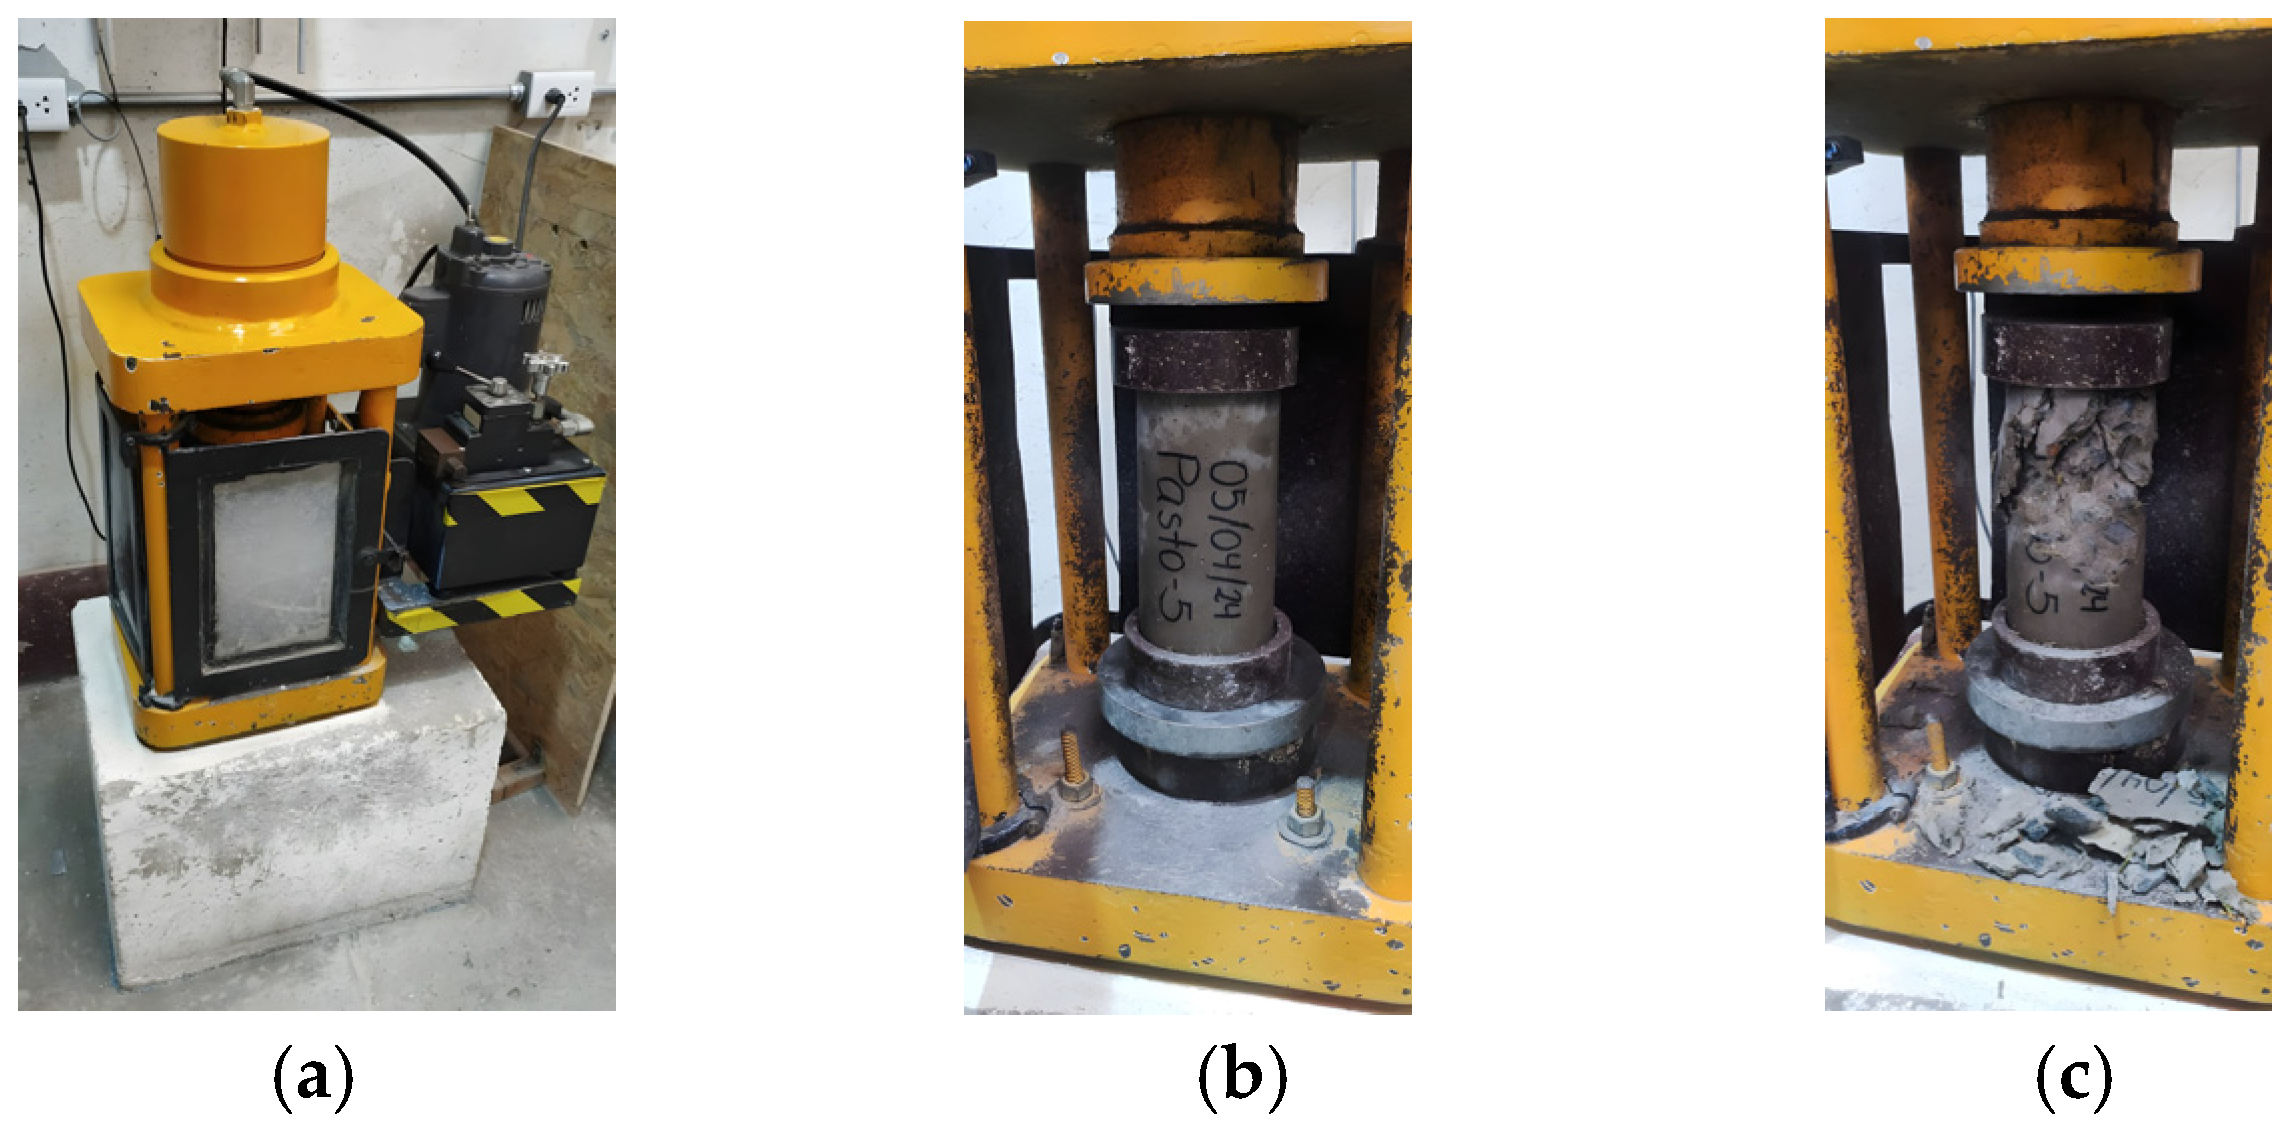
Figure 11.
Compressive strength test. (a) Compression testing machine; (b) Specimen before testing; (c) Specimen after testing.
Figure 11.
Compressive strength test. (a) Compression testing machine; (b) Specimen before testing; (c) Specimen after testing.
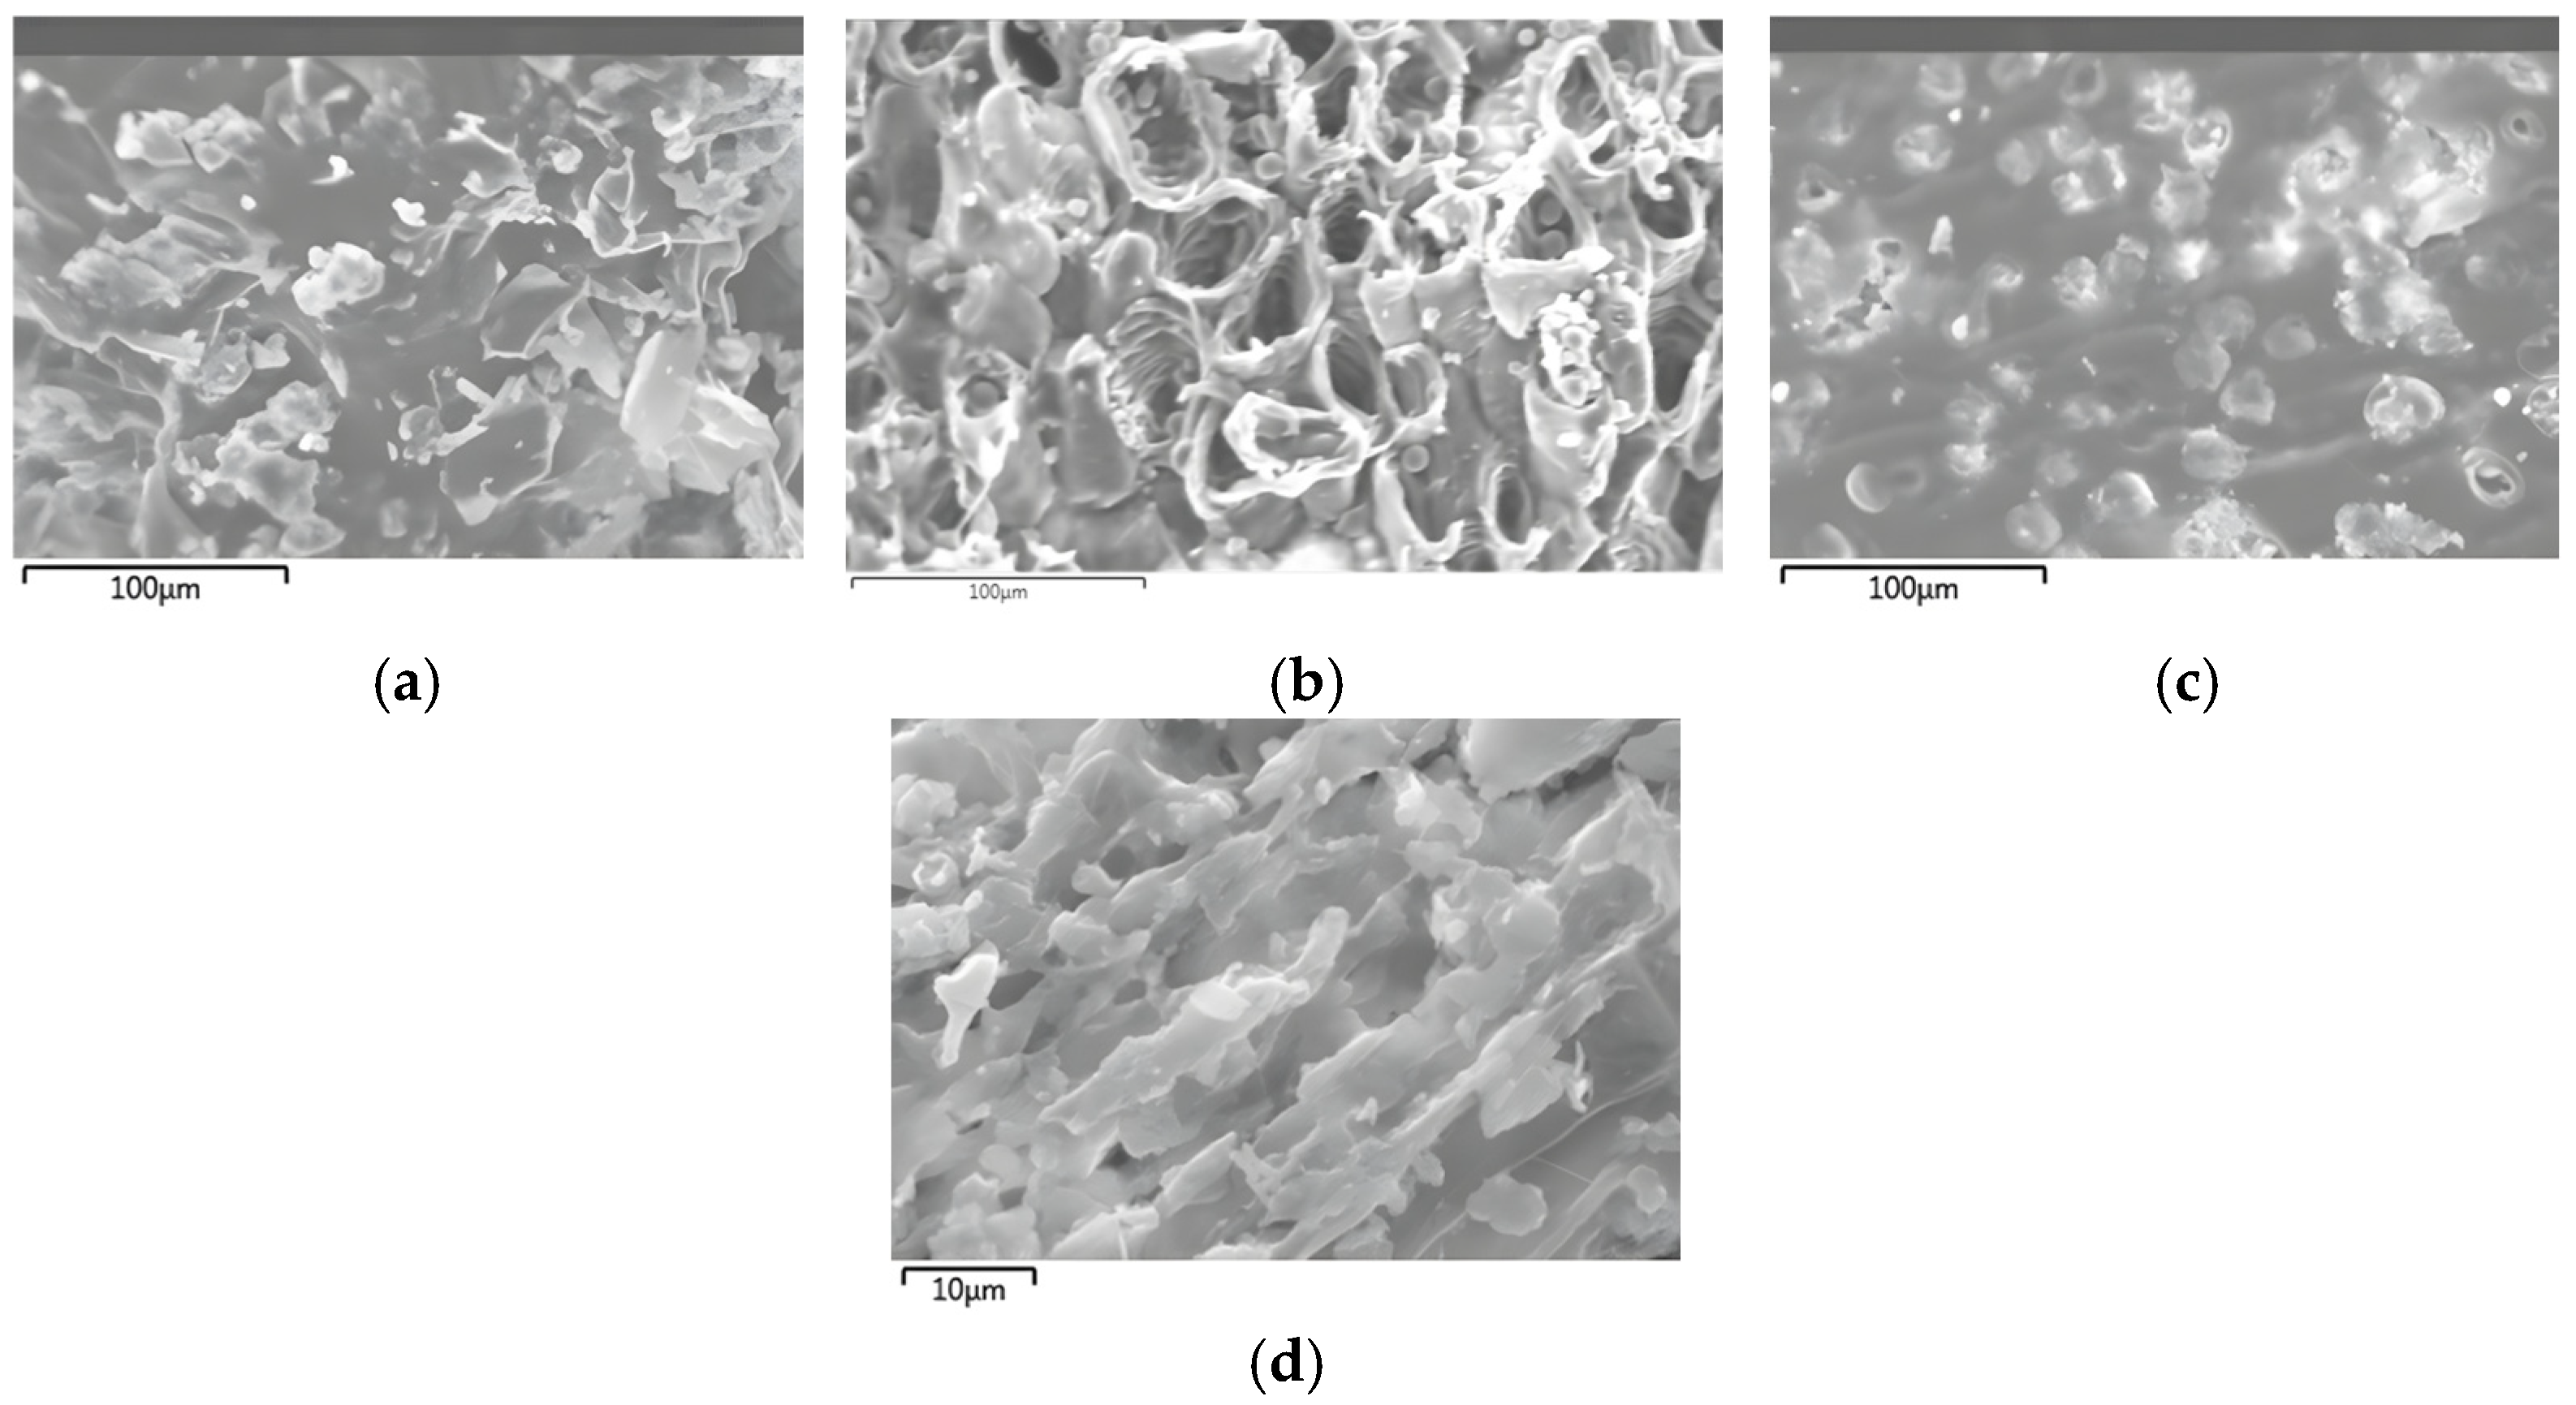
Figure 12.
Microscopic images of samples: (a) Orange peel; (b) Corn cob; (c) Corn husk; (d) Grass.
Figure 12.
Microscopic images of samples: (a) Orange peel; (b) Corn cob; (c) Corn husk; (d) Grass.
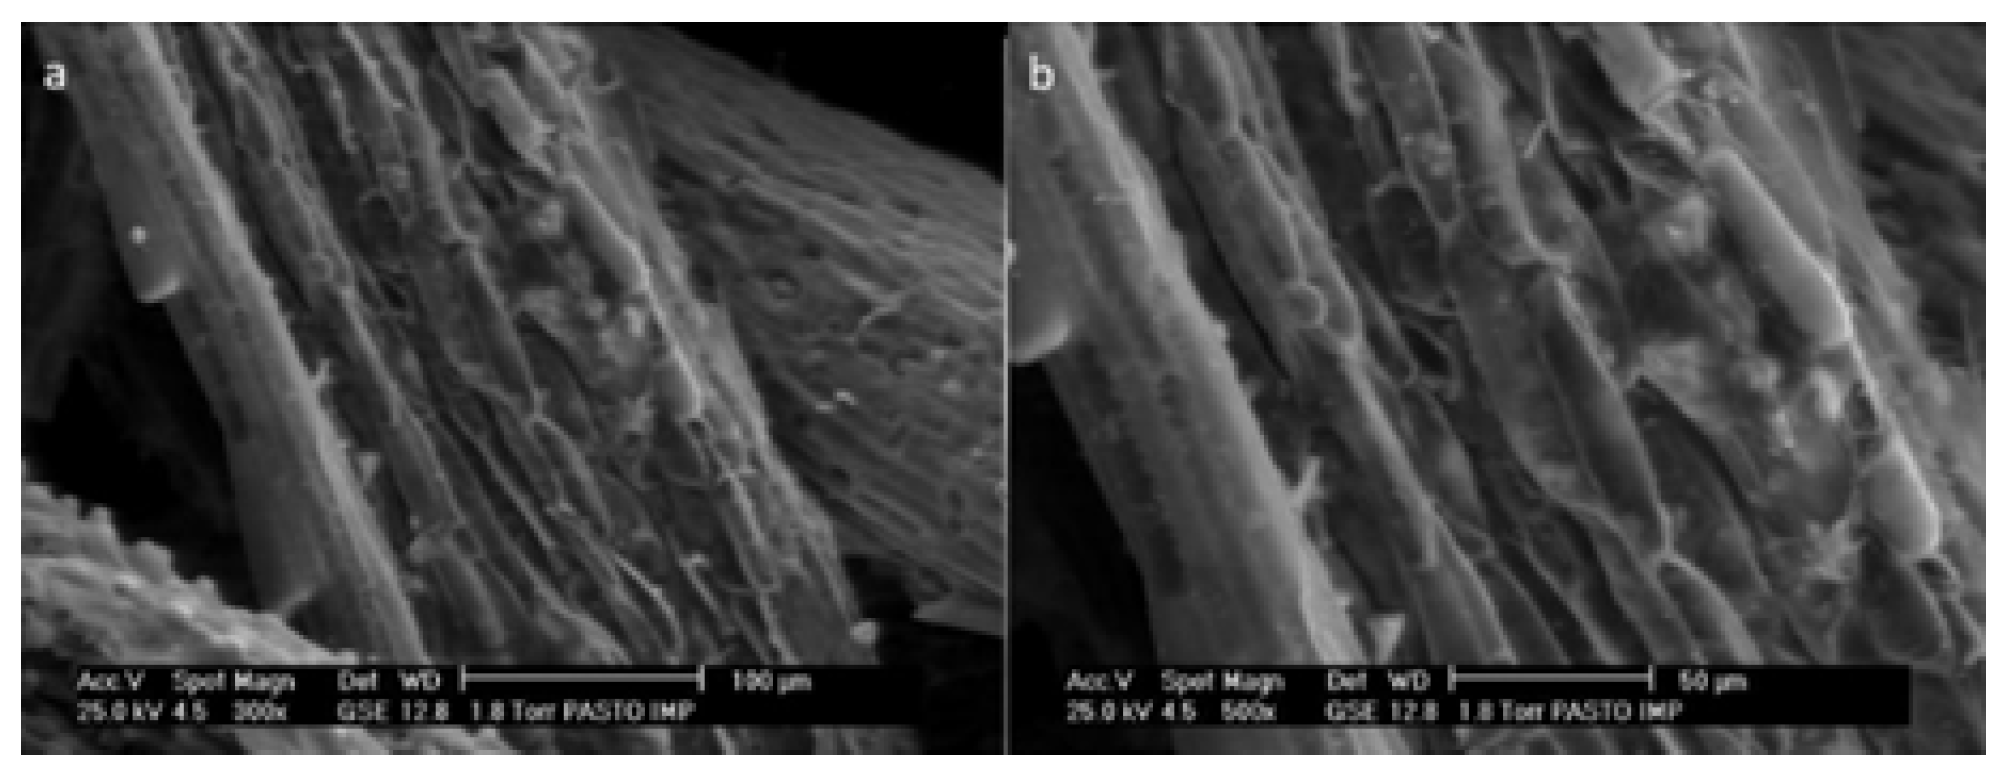
Figure 13.
Epidermis of Kikuyu grass.
Figure 13.
Epidermis of Kikuyu grass.
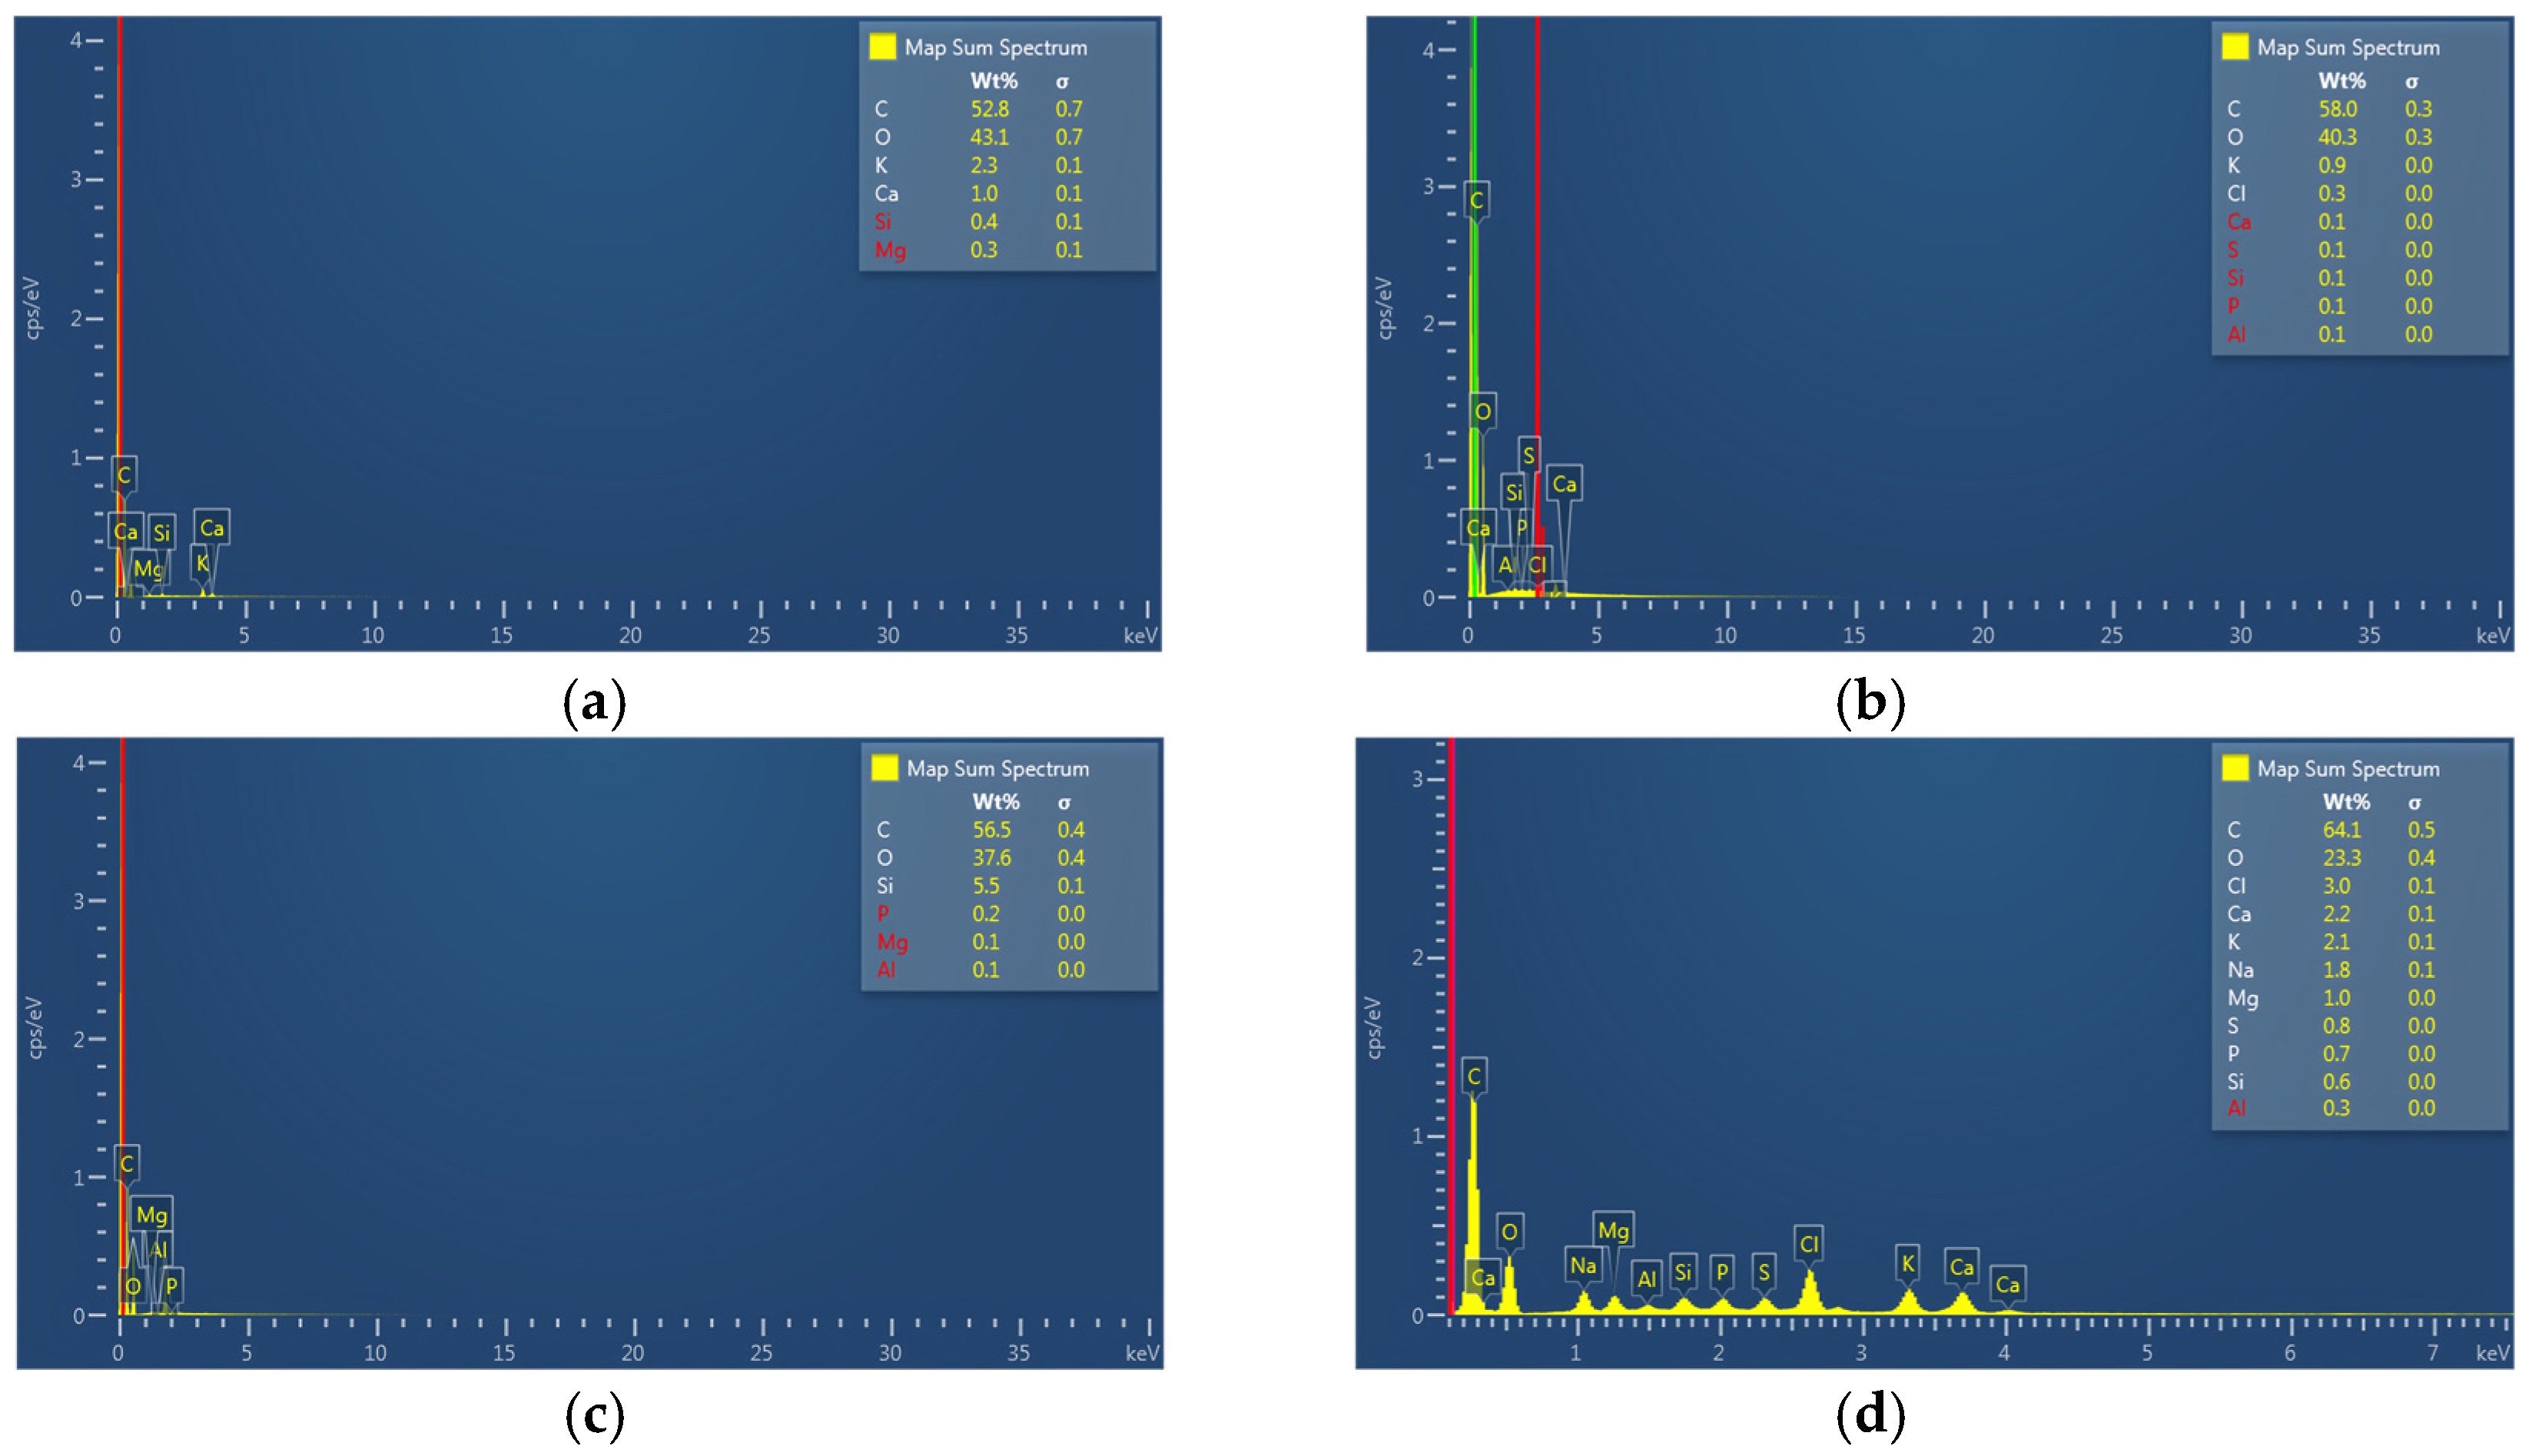
Figure 14.
Diffractogram of samples: (a) Orange peel; (b) Corn cob; (c) Corn husk; (d) Grass.
Figure 14.
Diffractogram of samples: (a) Orange peel; (b) Corn cob; (c) Corn husk; (d) Grass.
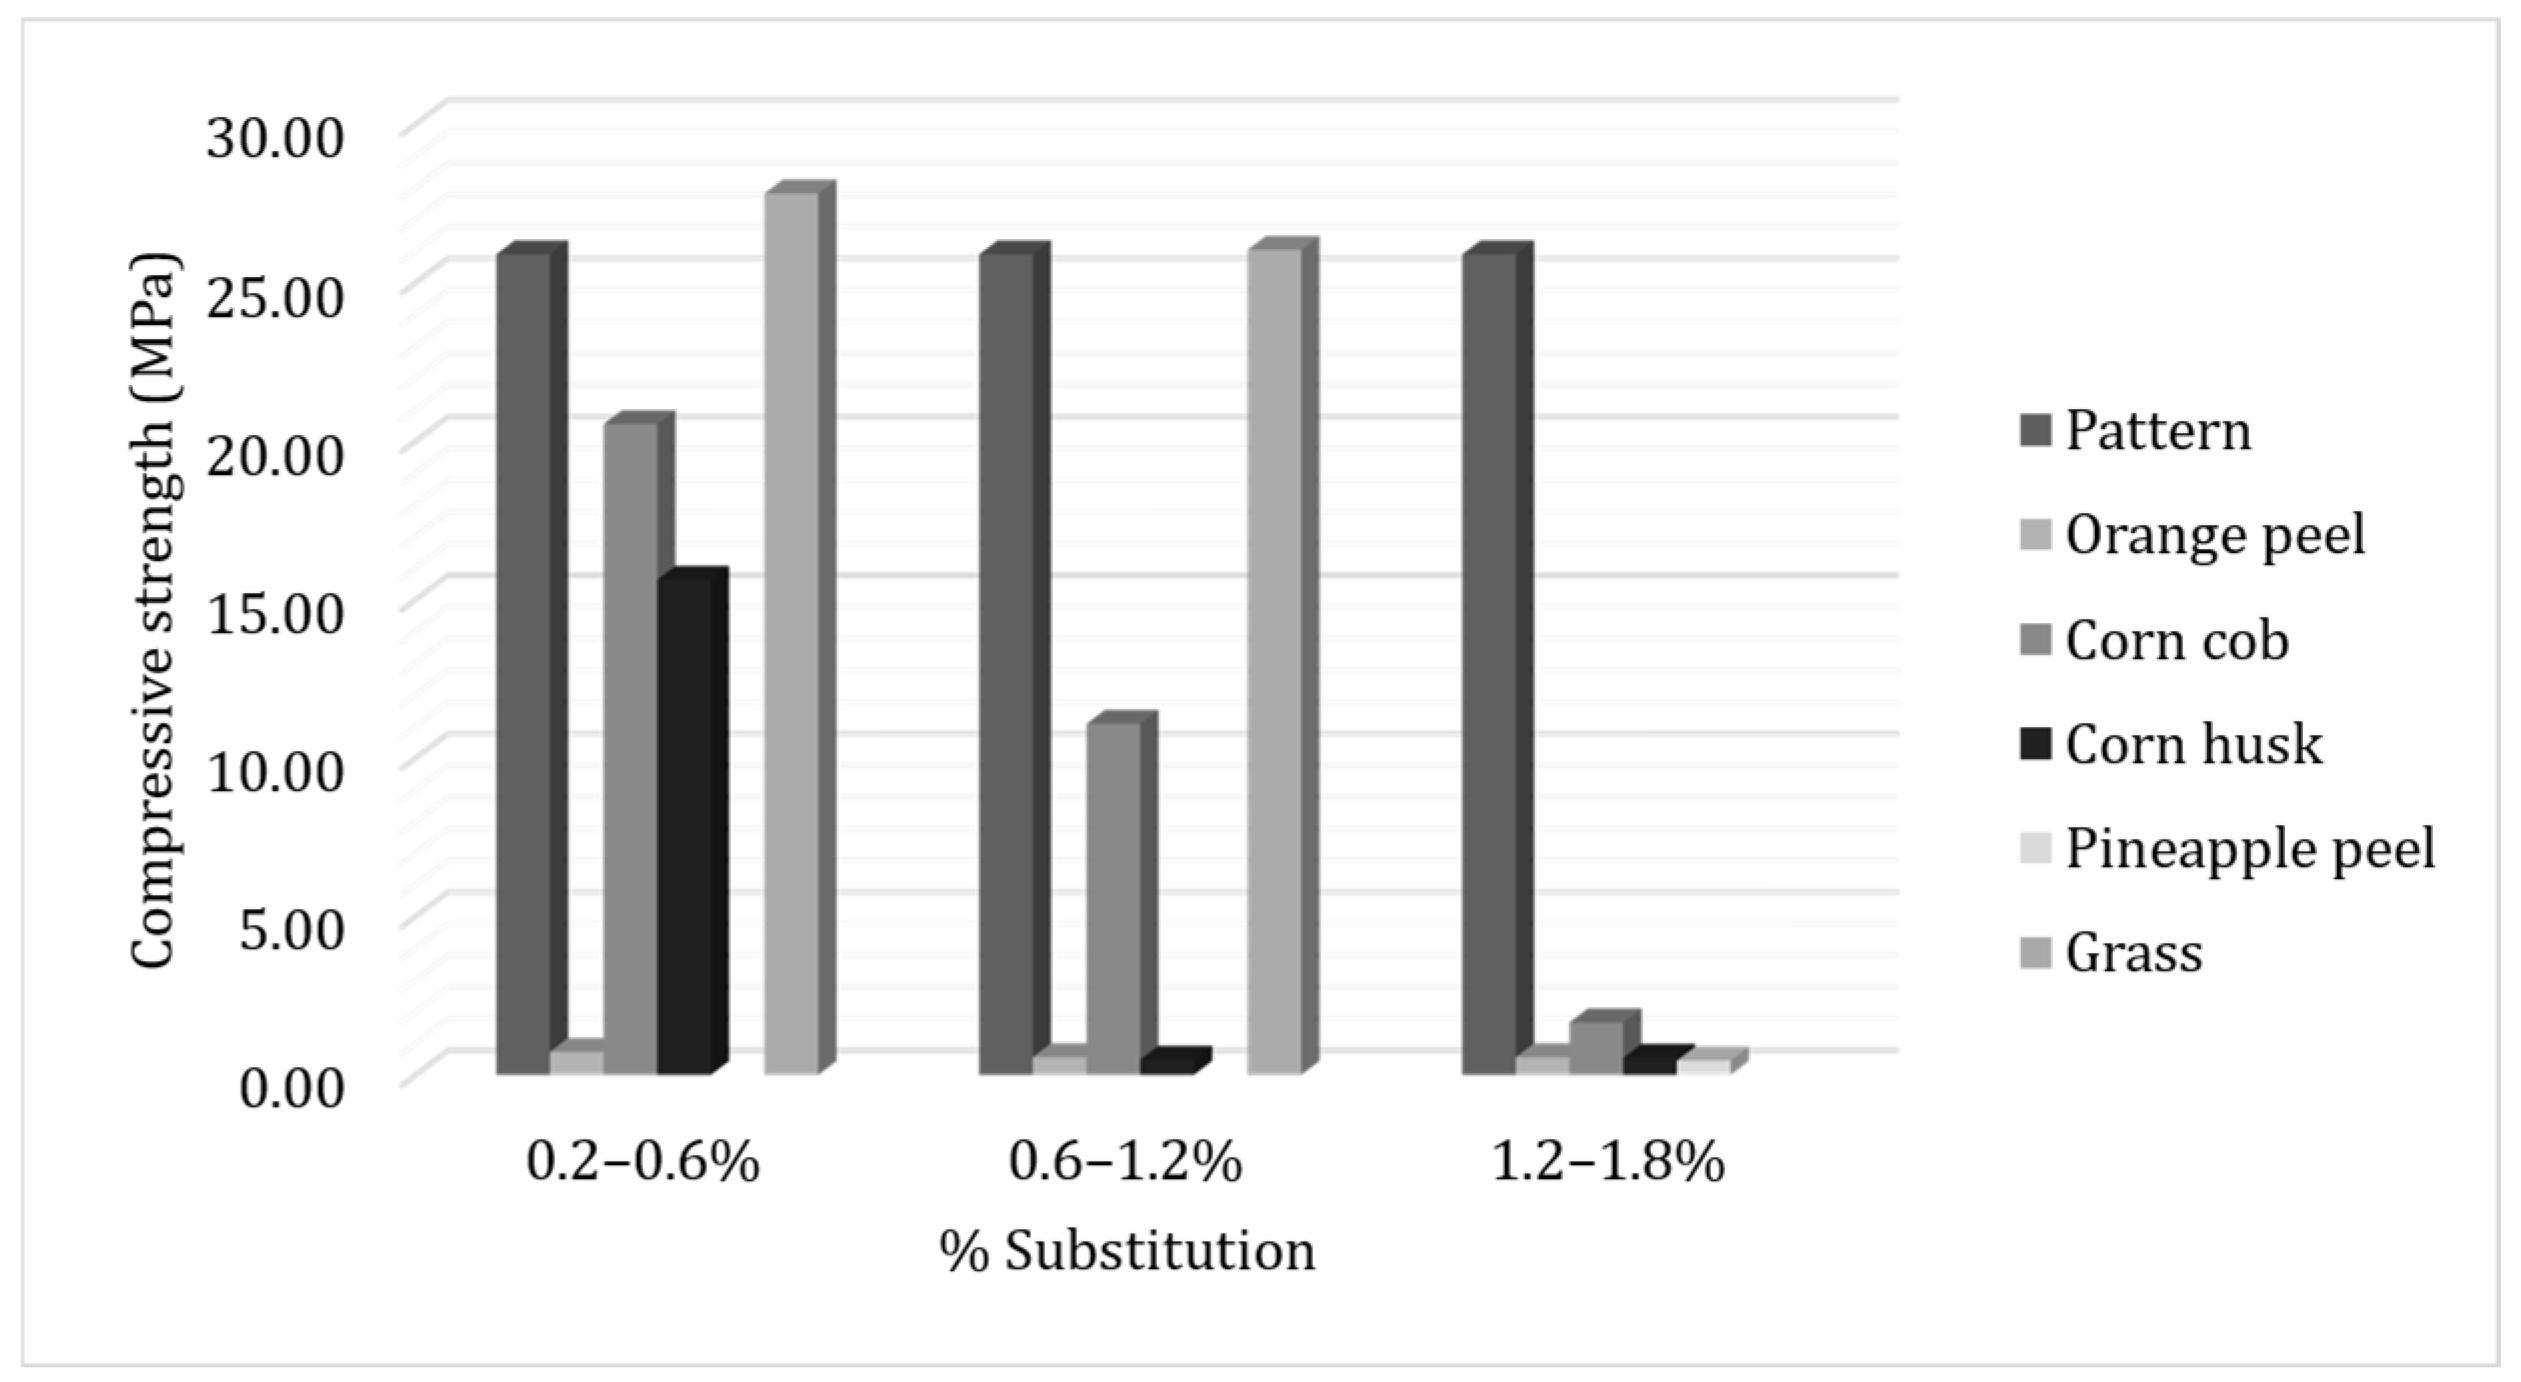
Figure 15.
Graph of the compressive strength in MPa of mortar dosages, at 7 days of curing with different percentages in substitution.
Figure 15.
Graph of the compressive strength in MPa of mortar dosages, at 7 days of curing with different percentages in substitution.
Figure 16.
Graph of the sample’s compressive strength.
Figure 16.
Graph of the sample’s compressive strength.
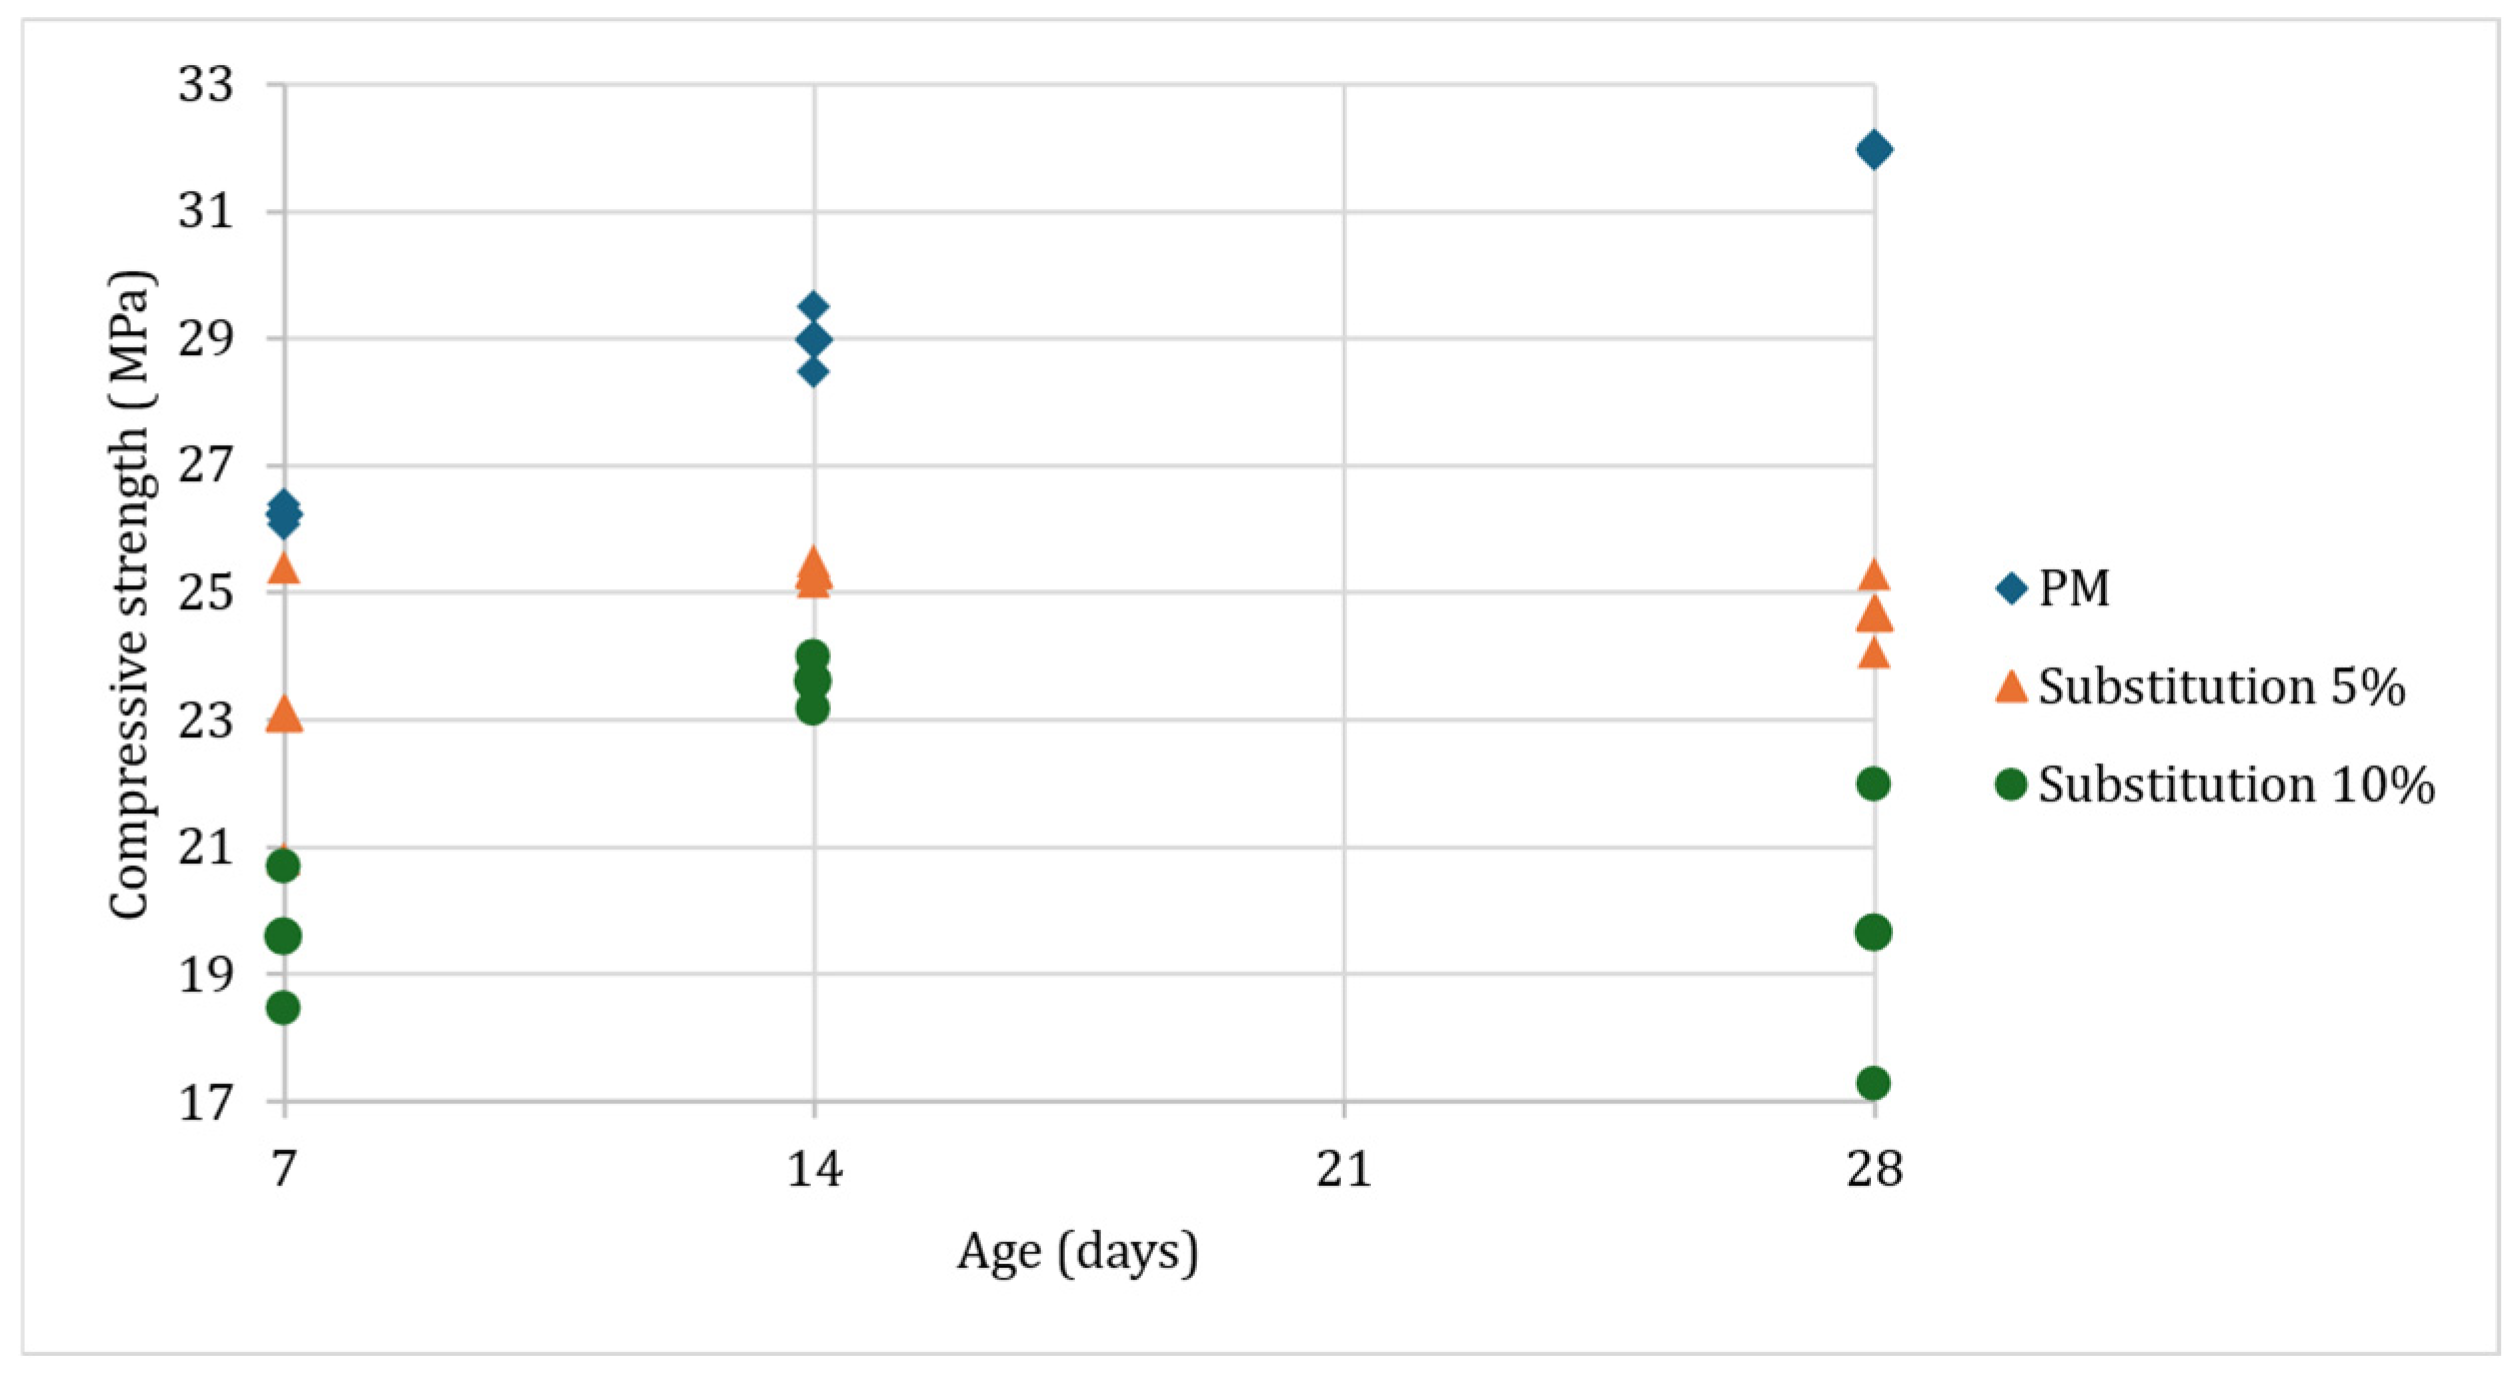
Figure 17.
Graph of the compressive strength of the standard mortar (PM) and mortar dosages with grass.
Figure 17.
Graph of the compressive strength of the standard mortar (PM) and mortar dosages with grass.
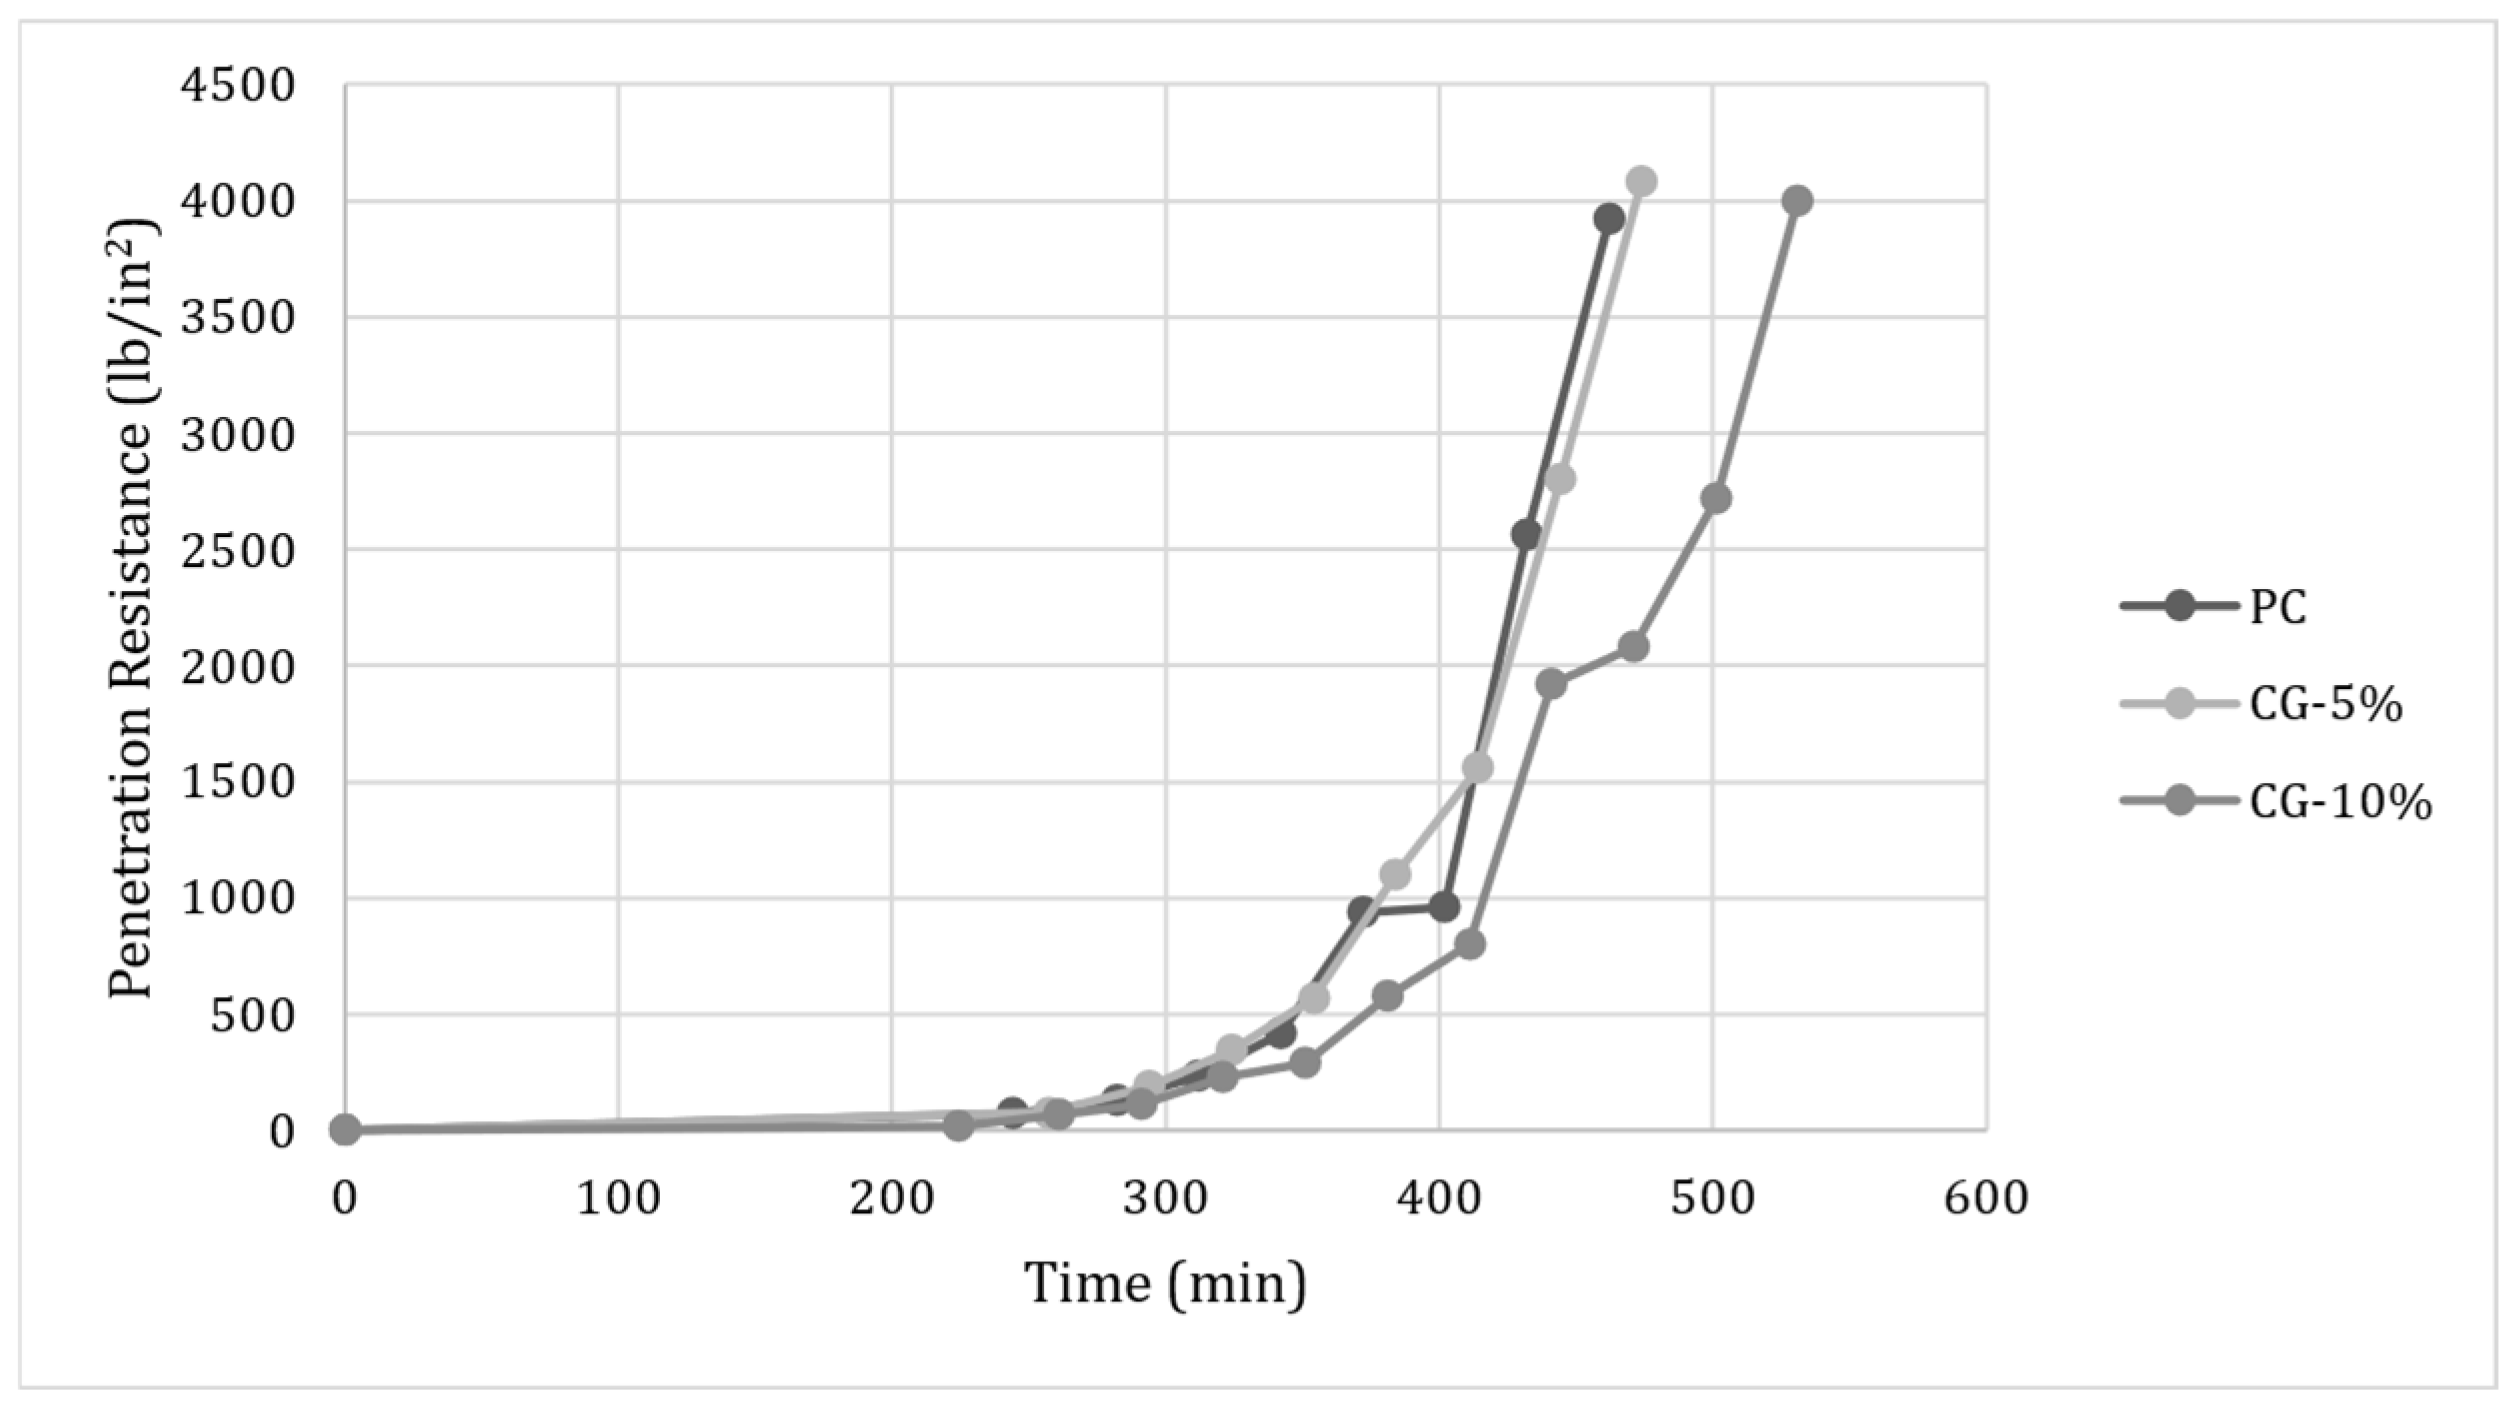
Figure 18.
Setting times for standard concrete (PC), CG-5%, and CG-10%.
Figure 18.
Setting times for standard concrete (PC), CG-5%, and CG-10%.
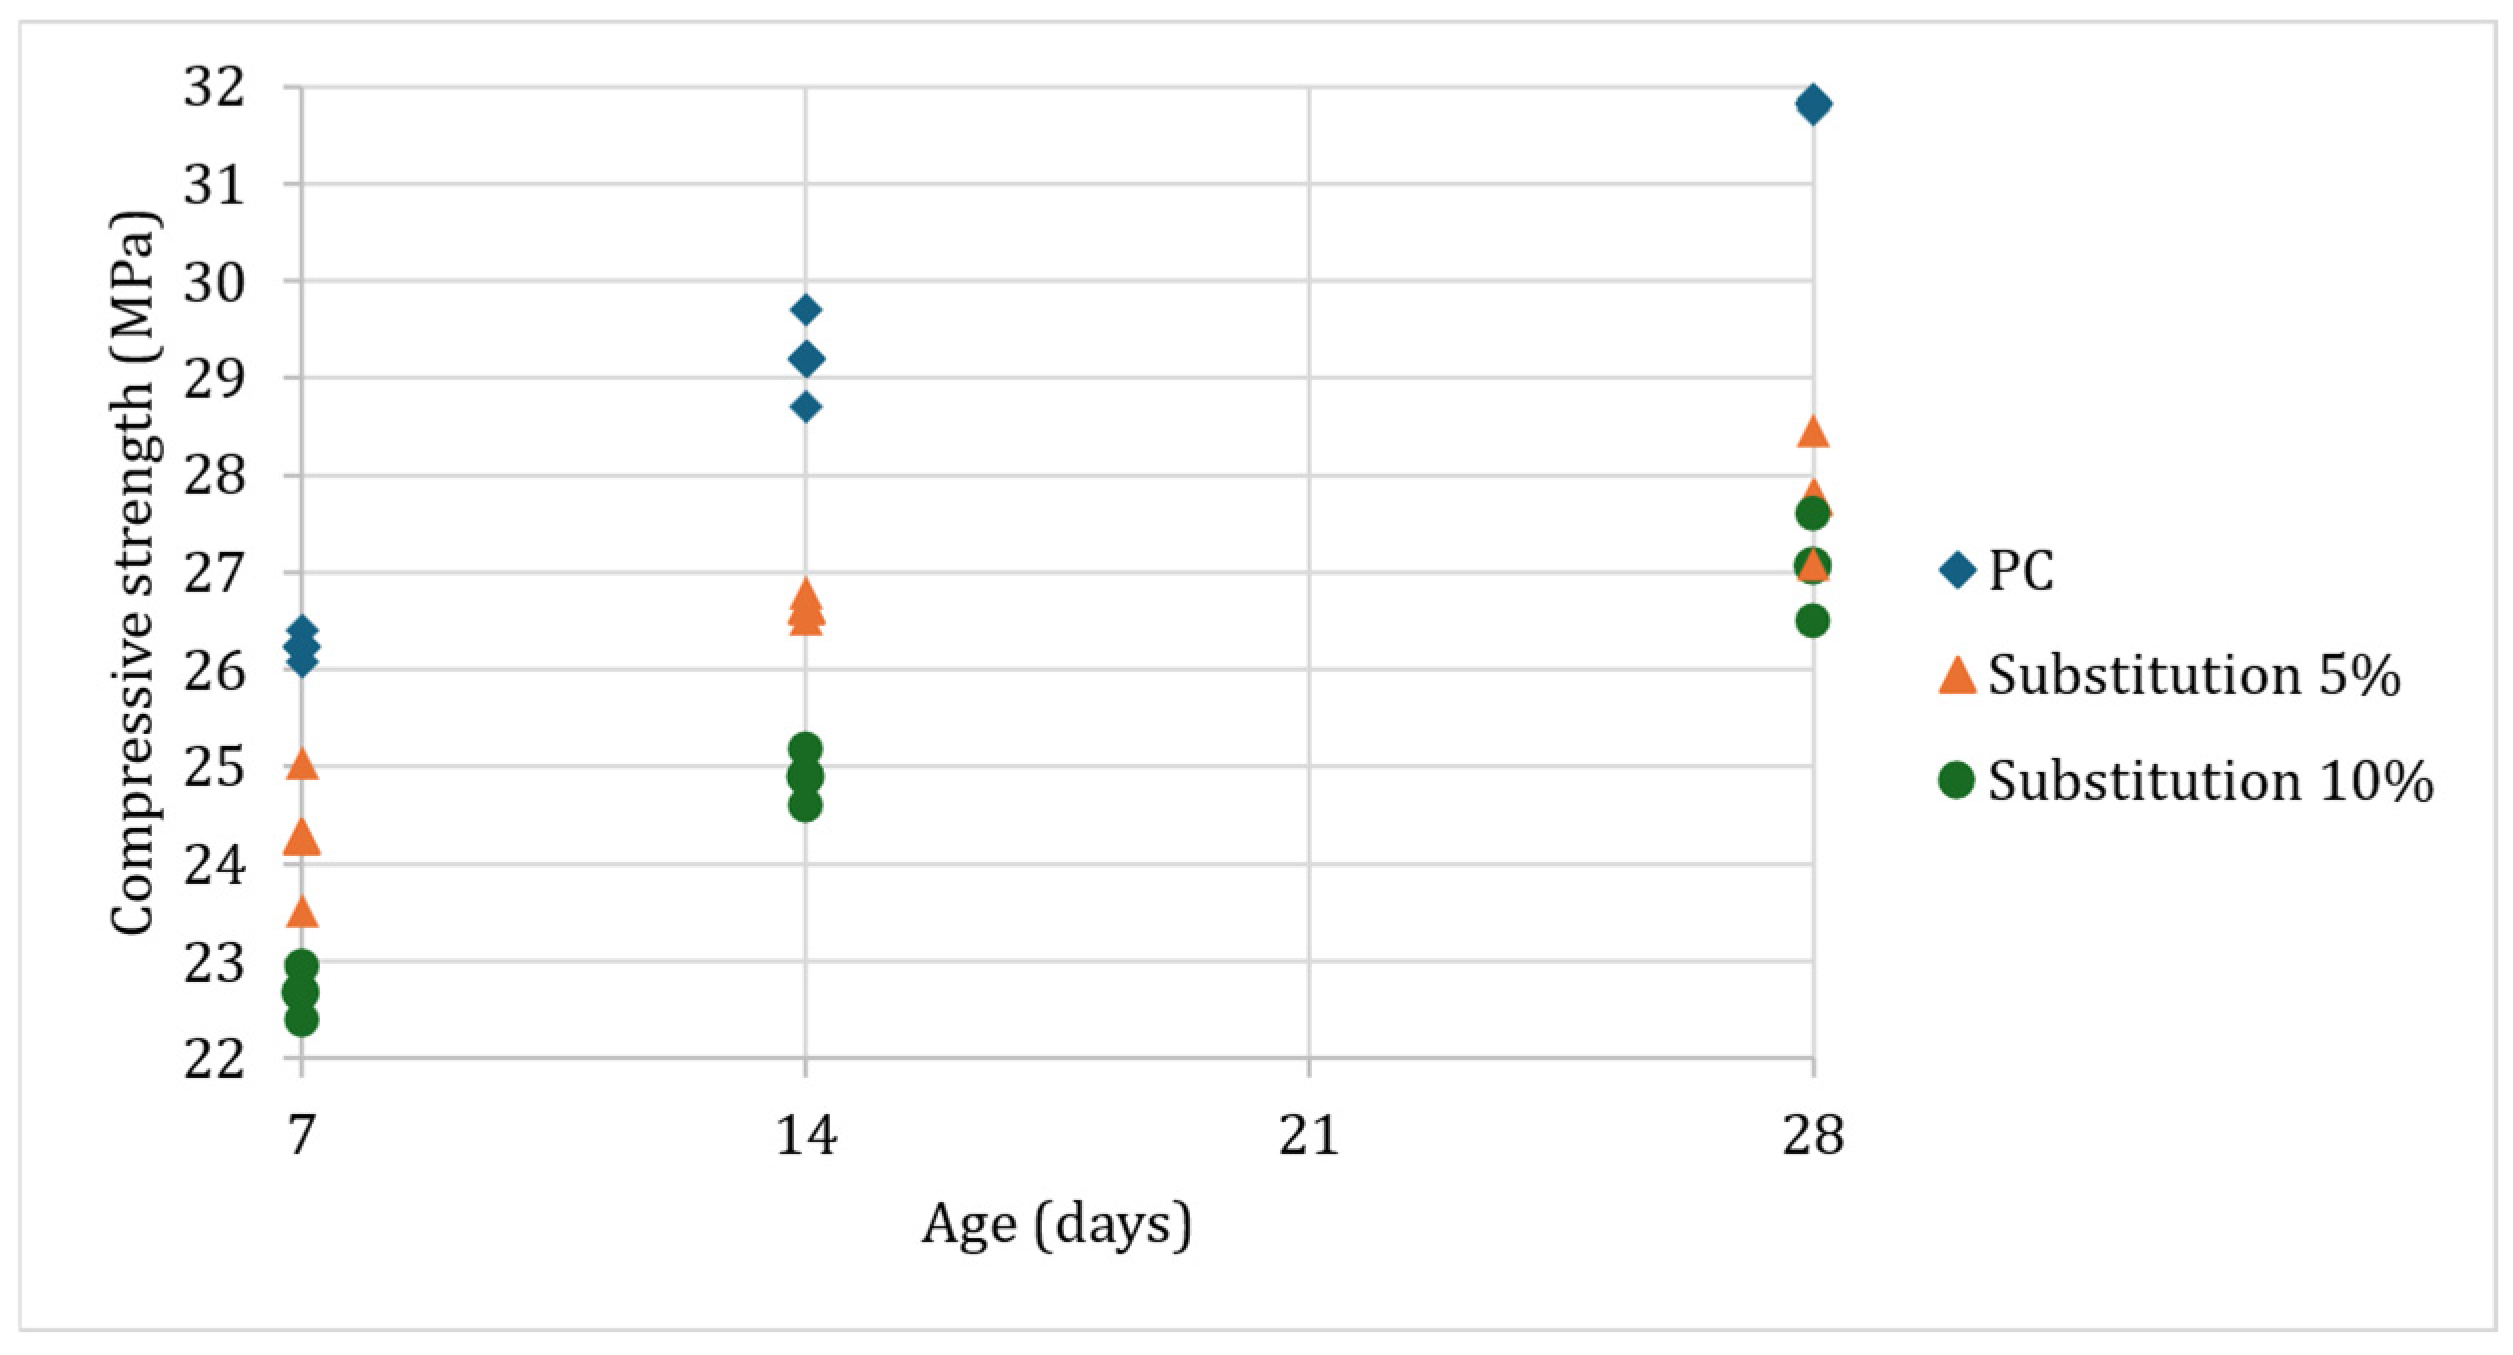
Figure 19.
Graph of the compressive strength.
Figure 19.
Graph of the compressive strength.
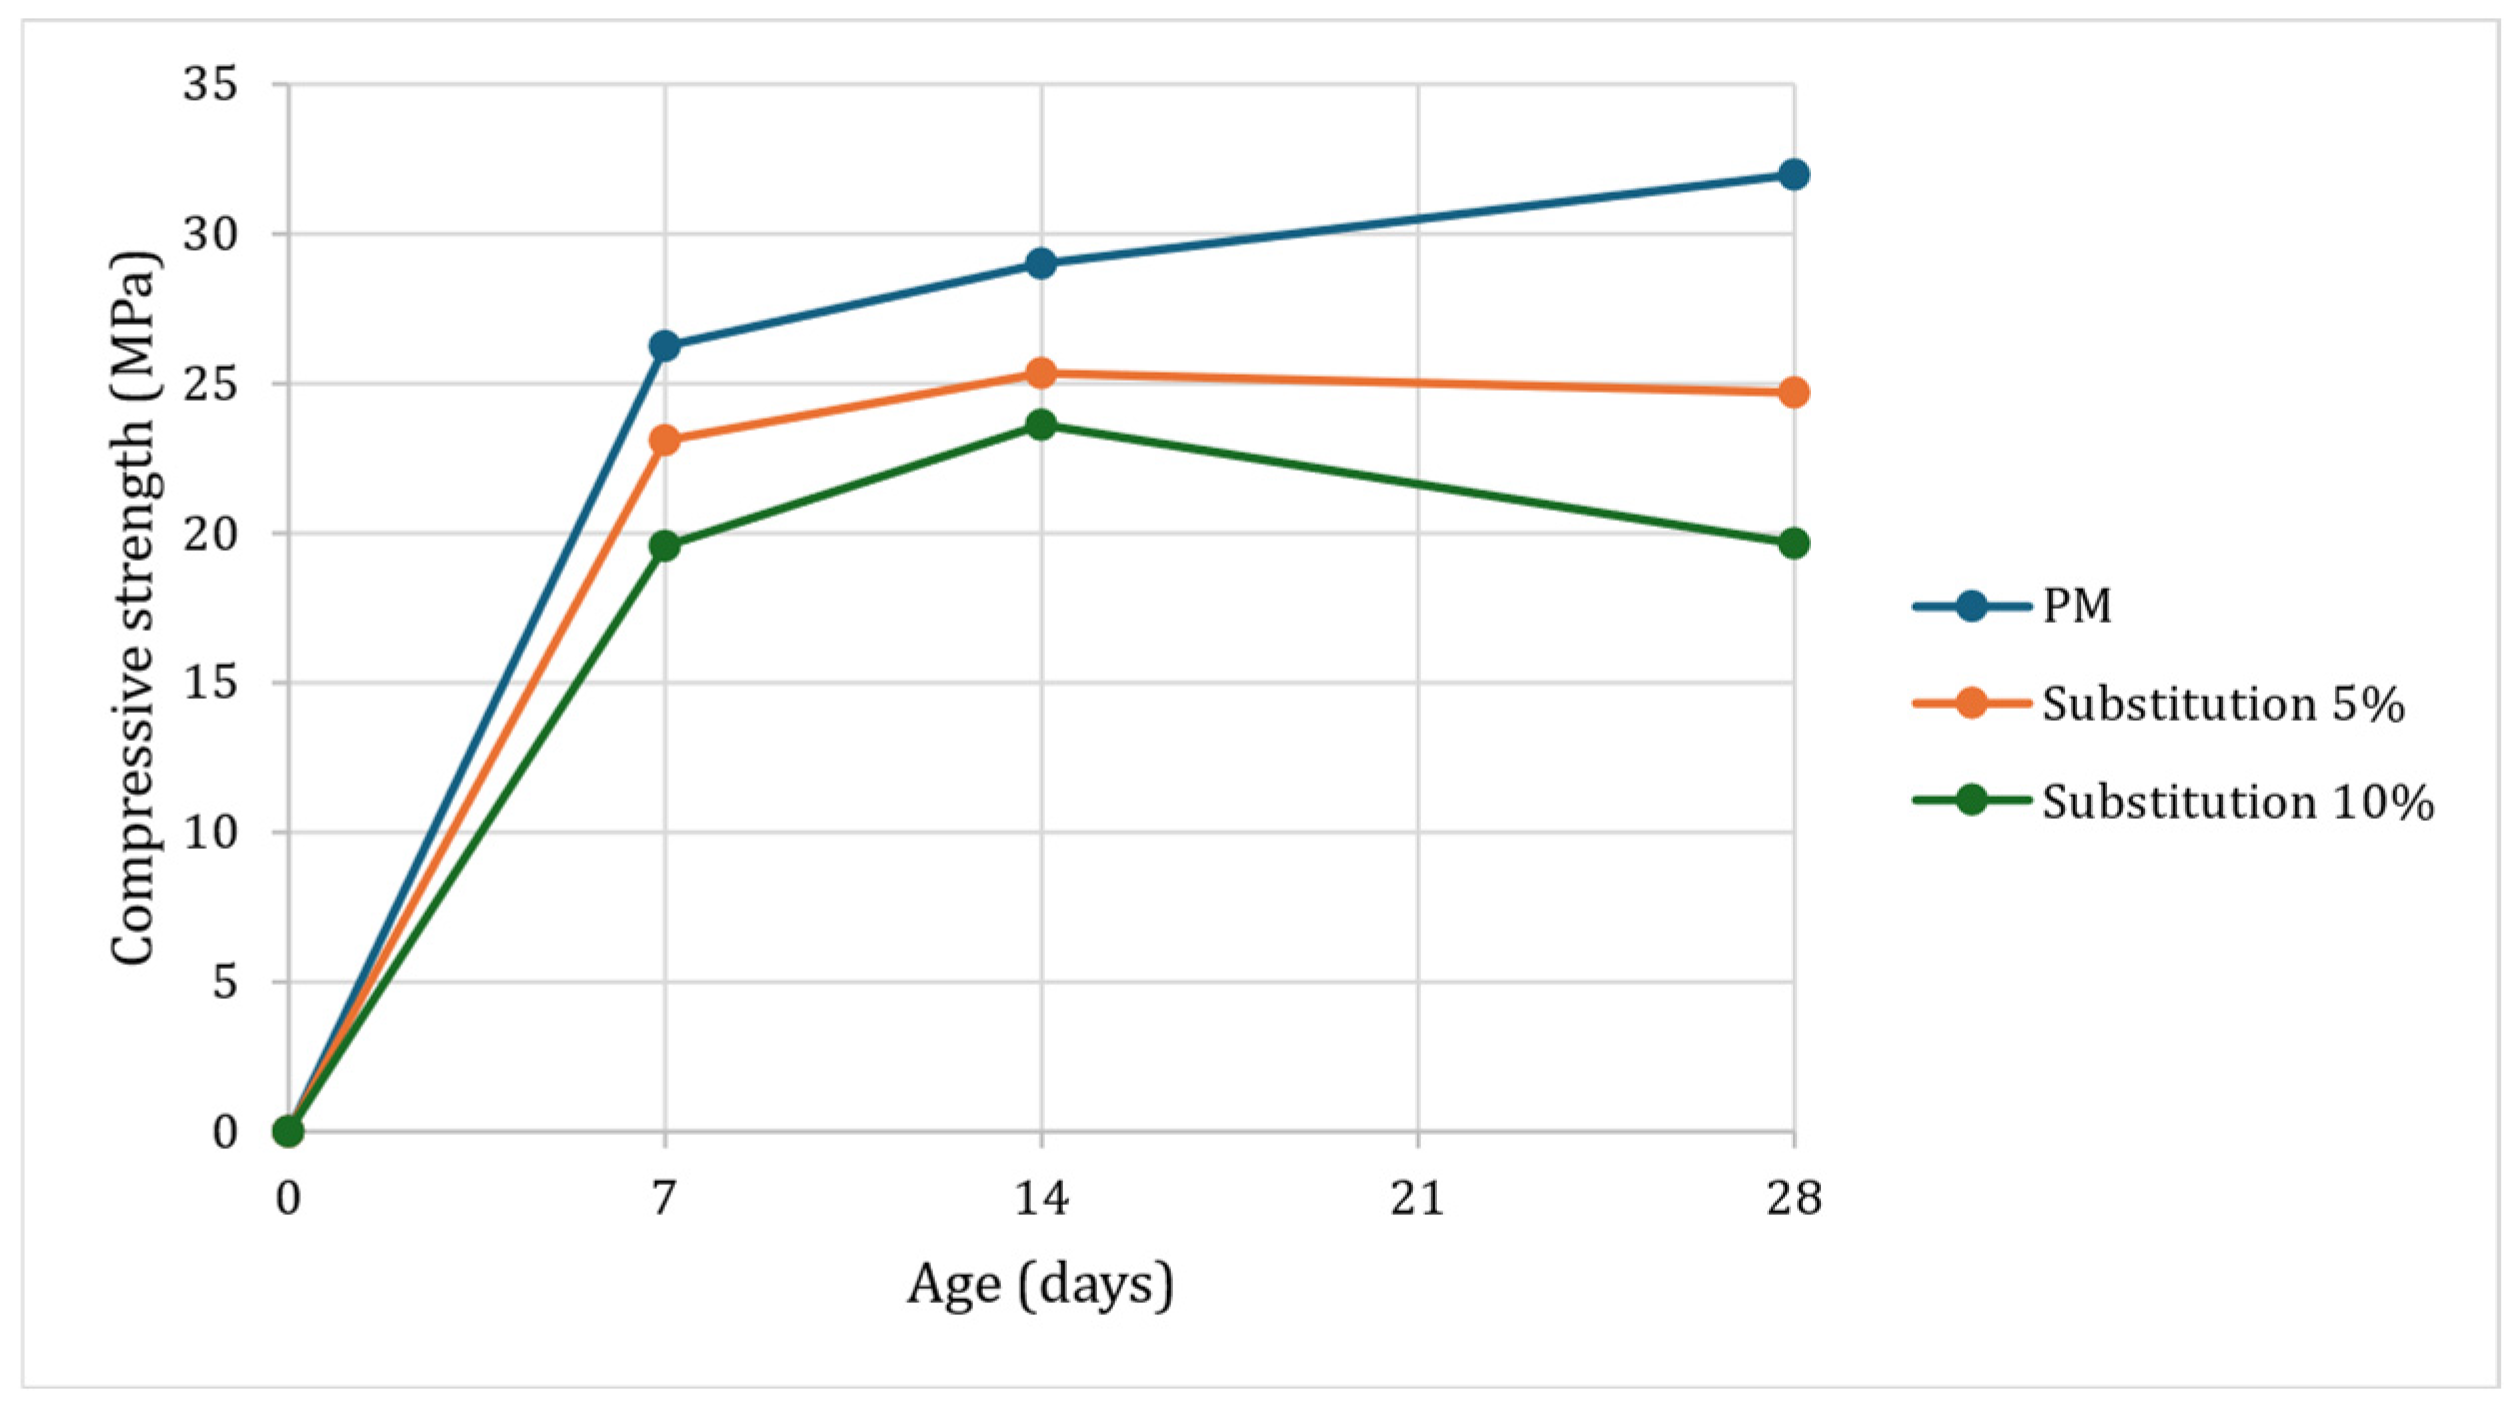
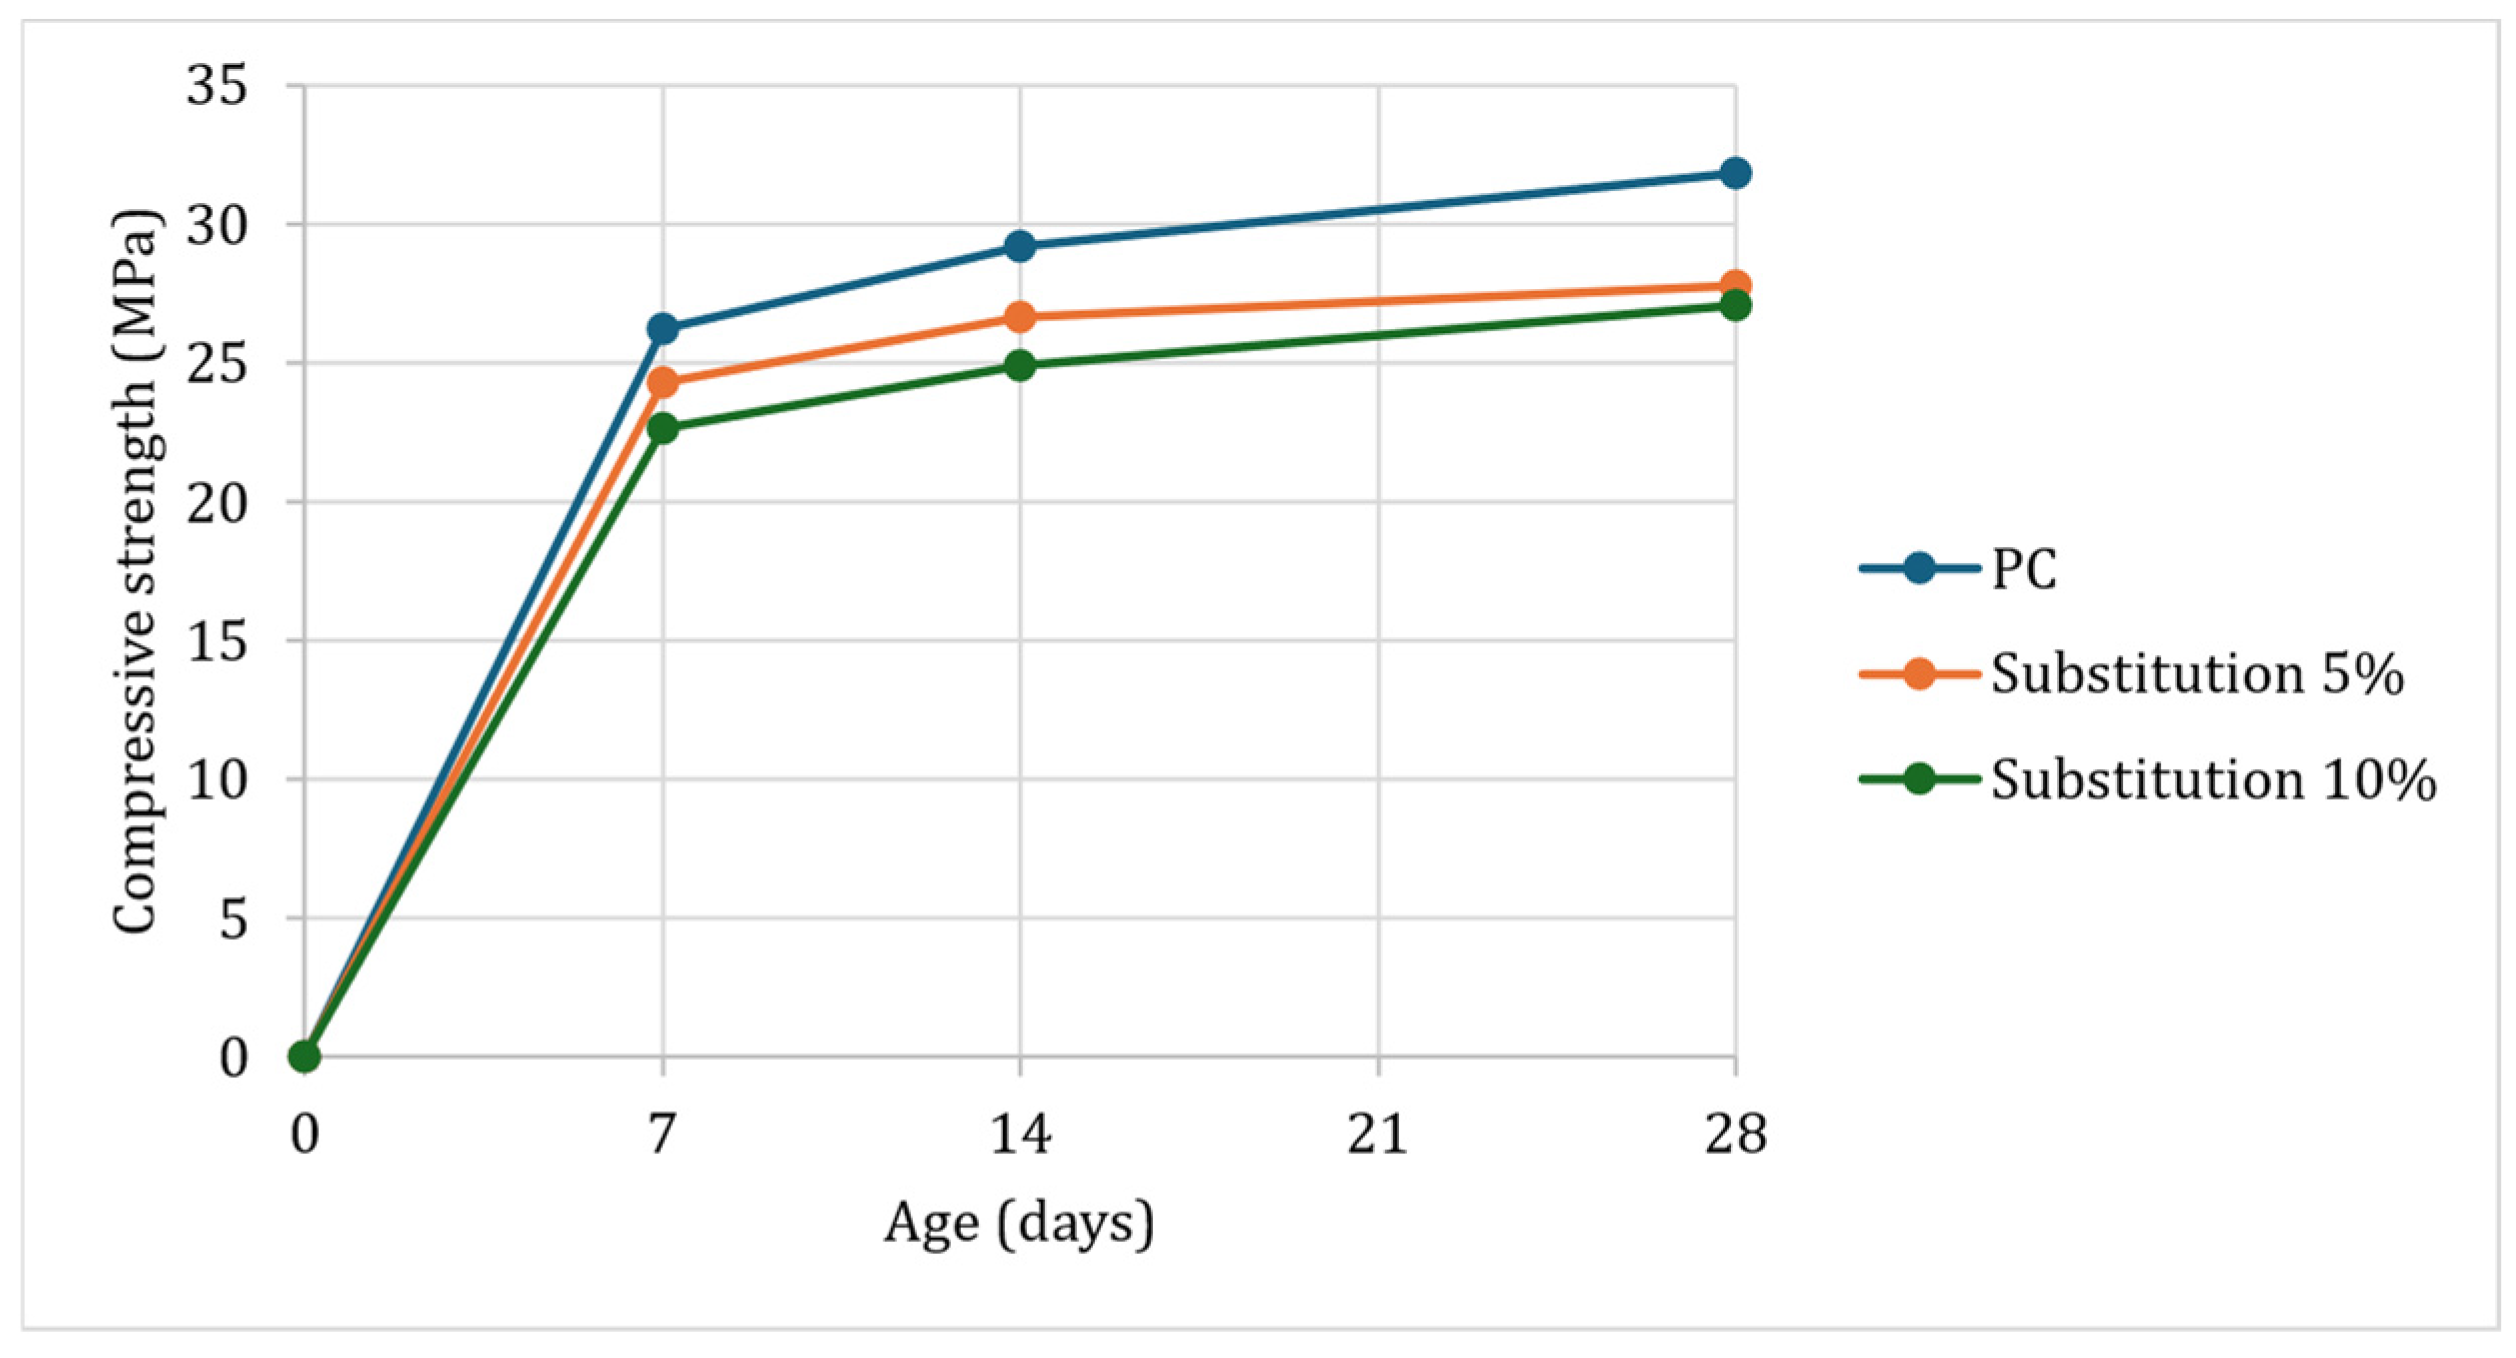
Figure 20.
Graph of the average compressive strength.
Figure 20.
Graph of the average compressive strength.
Table 1.
Chemical composition of Portland Cement Type I.
Table 1.
Chemical composition of Portland Cement Type I.
| Name | Compound | % |
|---|
| Lime | CaO | 62.5 |
| Silica | SiO2 | 21 |
| Alumina | Al2O3 | 6.5 |
| Iron | FeO3 | 2.5 |
| Free lime | CaO | 0 |
| Sulfur | SO3 | 2 |
| Magnesium | MgO | 2 |
| Alkalis | Na2O + K2O | 0.5 |
| Loss on ignition | - | 2 |
| Insoluble residue | - | 1 |
| Total | - | 100 |
Table 2.
Physical properties of Portland cement I, adapted from [
13].
Table 2.
Physical properties of Portland cement I, adapted from [
13].
| Physical Requirements | % |
|---|
| Air content of mortar, B volume % | |
| Max | 12 |
| Min | --- |
| Fineness, C specific surtace, m2/kg (alternative methods): | |
| Turbidimeter test | |
| Average value, min D | 160 |
| Average sample, min E | 150 |
| Average value, max D | --- |
| Average value, max E | --- |
| Air permeability test | |
| Average value, min D | 280 |
| Average sample, min E | 260 |
| Average value, max D | --- |
| Average value, max E | --- |
| Autoclave expansion, max, % | 80 |
| Strength, not less than the values shown for the ages | |
| Indicated as follows: G | |
| Compressive strength, MPa (psi): | |
| 1 day | --- |
| 3 days | |
| | 12.0 |
| 7 days | (1740) |
| | 19.0 |
| 28 days | (2760) |
| | --- |
| Time of setting; Vicat test: 1 | |
| Time of setting, min, not less than | 45 |
| Time of setting, min, not more than | 375 |
Table 3.
Granulometric analysis of sand.
Table 3.
Granulometric analysis of sand.
| Sieve # | Retained (g) | % | % Accumulated | % Passing |
|---|
| 3/8” | 0.00 | 0.00 | 0.00 | 100.00 |
| 4 | 15.50 | 2.60 | 2.60 | 97.40 |
| 8 | 60.8 | 10.10 | 12.70 | 87.30 |
| 16 | 145.60 | 24.30 | 37.00 | 63.00 |
| 30 | 154.20 | 25.70 | 62.70 | 37.30 |
| 50 | 90.70 | 15.10 | 77.80 | 22.20 |
| 100 | 79.70 | 13.30 | 91.10 | 8.90 |
| Bottom | 53.50 | 8.90 | 100.00 | 0.00 |
Table 4.
Physical properties of sand.
Table 4.
Physical properties of sand.
| Properties | Unit | Fine Aggregate | Method |
|---|
| Loose unit weight | kg/m3 | 1639 | ASTM C29 [15] |
| Compacted unit weight | kg/m3 | 1800 | ASTM C29 [15] |
| Specific gravity | kg/m3 | 2600 | ASTM C128 [16] |
| Finesse modulus | - | 2.84 | ASTM C136 [14] |
| Absorption | % | 1.21 | ASTM C128 [16] |
| Moisture content | % | 1.17 | ASTM C566 [17] |
Table 5.
Other properties of coarse aggregate.
Table 5.
Other properties of coarse aggregate.
| Properties | Unit | Coarse Aggregate | Method |
|---|
| Loose unit weight | kg/m3 | 1443 | ASTM C29 [15] |
| Compacted unit weight | kg/m3 | 1558 | ASTM C29 [15] |
| Specific gravity | kg/m3 | 2740 | ASTM C128 [16] |
| Finesse modulus | - | 7.40 | ASTM C136 [14] |
| Absorption | % | 0.48 | ASTM C128 [16] |
| Moisture content | % | 0.32 | ASTM C566 [17] |
Table 6.
Mortar dosages with sand substitution with samples in weight between 0.2% and 0.6%.
Table 6.
Mortar dosages with sand substitution with samples in weight between 0.2% and 0.6%.
| Material | Unit | PM | Orange Peel | Corn Cob | Corn Husk | Grass |
|---|
| Cement | kg | 0.500 |
| Water | 0.315 |
| Sand | 1.375 | 1.366 | 1.369 | 1.371 | 1.372 |
| Waste | 0 | 0.009 | 0.006 | 0.004 | 0.003 |
Table 7.
Mortar dosages with sand substitution with samples in weight between 0.6% and 1.2%.
Table 7.
Mortar dosages with sand substitution with samples in weight between 0.6% and 1.2%.
| Material | Unit | PM | Orange Peel | Corn Cob | Corn Husk | Grass |
|---|
| Cement | kg | 0.500 |
| Water | 0.315 |
| Sand | 1.375 | 1.358 | 1.363 | 1.366 | 1.366 |
| Waste | 0 | 0.017 | 0.012 | 0.009 | 0.009 |
Table 8.
Mortar dosages with sand substitution with samples in weight between 1.2% and 1.8%.
Table 8.
Mortar dosages with sand substitution with samples in weight between 1.2% and 1.8%.
| Material | Unit | PM | Orange Peel | Corn Cob | Corn Husk | Pineapple Leaf |
|---|
| Cement | kg | 0.500 |
| Water | 0.315 |
| Sand | 1.375 | 1.350 | 1.358 | 1.354 | 1.352 |
| Waste | 0 | 0.025 | 0.017 | 0.021 | 0.023 |
Table 9.
Concrete dosages with sand substitution with grass in volumetric proportions of 5% and 10%.
Table 9.
Concrete dosages with sand substitution with grass in volumetric proportions of 5% and 10%.
| Material | Unit | PC | CG-5% | CG-10% |
|---|
| Cement | | | 8.70 | |
| Water | | | 5.00 | |
| Fine aggregate | kg | 19.90 | 18.91 | 17.91 |
| Coarse aggregate | | 18.00 | 18.00 | 18.00 |
| Grass | | 0 | 0.03 | 0.06 |
Table 10.
Classification of samples according to the following taxonomic position.
Table 10.
Classification of samples according to the following taxonomic position.
| Waste | Order | Family | Genus | Specie |
|---|
| Orange Peel | Sapindales | Rutaceae | Citrus | Citrus aurantium L. |
| Corn Cob | Poales | Poaceae | Zea | Zea mays L. |
| Corn Husk |
| Pineapple leaf | Bromeliaceae | Ananas | Ananas comosus (L.) Merr. |
| Grass | Poaceae | Stenotaphrum | Stenotaphrum secundatum |
Table 11.
Elemental analysis—percentage by weight.
Table 11.
Elemental analysis—percentage by weight.
| Waste | % Weight |
|---|
| C | O | Cl | Ca | K | Na | Mg | S | P | Si | Al |
|---|
| Orange Peel | 52.8 | 43.1 | - | 1.0 | 2.3 | - | 0.3 | - | - | 0.4 | - |
| Corn Cob | 58.0 | 40.3 | 0.3 | 0.1 | 0.9 | - | - | 0.1 | 0.1 | 0.1 | 0.1 |
| Corn Husk | 56.5 | 37.6 | - | - | - | - | 0.1 | - | 0.2 | 5.5 | 0.1 |
| Grass | 64.1 | 23.3 | 3.0 | 2.2 | 2.1 | 1.8 | 1.0 | 0.8 | 0.7 | 0.6 | 0.3 |
Table 12.
Elemental analysis before UV exposure.
Table 12.
Elemental analysis before UV exposure.
| Waste | % Carbon (C) | % Hydrogen (H) | % Nitrogen (N) |
|---|
| Orange Peel | 40.2055 | 6.0990 | 1.9830 |
| Corn Husk | 39.3590 | 6.1160 | 3.7140 |
| Pineapple leaf | 41.9850 | 5.8365 | 2.3359 |
| Grass | 36.0175 | 5.2486 | 3.7140 |
Table 13.
Cellulose content analysis before UV exposure.
Table 13.
Cellulose content analysis before UV exposure.
| Parameter | Orange Peel | Corn Husk | Pineapple Leaf | Grass |
|---|
| Cellulose | 34.57% | 32.47% | 44.28% | 33.79% |
Table 14.
Cellulose content analysis after 7 days UV exposure.
Table 14.
Cellulose content analysis after 7 days UV exposure.
| Parameter | Orange Peel | Corn Husk | Pineapple Leaf | Grass |
|---|
| Cellulose | 33.15% | 31.58% | 43.41% | 32.09% |
Table 15.
Compressive strength (in MPa) of mortar dosages, at 7 days of curing with different percentages in substitution.
Table 15.
Compressive strength (in MPa) of mortar dosages, at 7 days of curing with different percentages in substitution.
| Design | | 0.2–0.6% | 0.6–1.2% | 1.2–1.8% |
|---|
| Pattern | Compressive strength (MPa) | 25.89 | 25.89 | 25.89 |
| Orange peel | Compressive strength (MPa)/%Pattern | 0.73 | 0.56 | 0.56 |
| 2.8% | 2.2% | 2.2% |
| Corn cob | 20.53 | 11.08 | 1.65 |
| 79.3% | 42.8% | 6.4% |
| Corn husk | 15.62 | 0.48 | 0.54 |
| 60.3% | 1.9% | 2.1% |
| Pineapple leaf | - | - | 0.45 |
| - | - | 1.7% |
| Grass | 27.81 | 26.03 | - |
| 107.4% | 100.5% | - |
Table 16.
Compressive strength in MPa between 7 and 28 days of curing of the standard mortar (PM) and mortar dosages with grass in substitution of 5 and 10% of sand volume.
Table 16.
Compressive strength in MPa between 7 and 28 days of curing of the standard mortar (PM) and mortar dosages with grass in substitution of 5 and 10% of sand volume.
| Design | 7 Days | 14 Days | 28 Days |
|---|
| PM | 26.08 | 28.48 | 32.04 |
| 26.24 | 28.99 | 31.97 |
| 26.40 | 29.50 | 31.90 |
| Substitution-5% | 20.82 | 25.18 | 25.30 |
| 23.11 | 25.35 | 24.69 |
| 25.40 | 25.52 | 24.07 |
| Substitution-10% | 20.69 | 23.18 | 21.99 |
| 19.57 | 23.59 | 19.64 |
| 18.46 | 24.00 | 17.28 |
Table 17.
Average compressive strength (in MPa) at 7, 14 and 28 days of curing of the standard mortar (PM) and mortar dosages with grass substitutions of 5 and 10% of sand volume.
Table 17.
Average compressive strength (in MPa) at 7, 14 and 28 days of curing of the standard mortar (PM) and mortar dosages with grass substitutions of 5 and 10% of sand volume.
| Design | 7 Days | 14 Days | 28 Days |
|---|
| PM | 26.24 | 28.99 | 31.97 |
| Substitution-5% | 23.11 | 25.35 | 24.69 |
| Substitution-10% | 19.57 | 23.59 | 19.64 |
Table 18.
Slump of three concrete dosages.
Table 18.
Slump of three concrete dosages.
| Design | Slump |
|---|
| PC | 3.5″ |
| CG-5% | 4″ |
| CG-10% | 4.5″ |
Table 19.
Volumetric weight of three concrete dosages.
Table 19.
Volumetric weight of three concrete dosages.
| Design | Unit Weight (kg/m3) | %/PC |
|---|
| PC | 2423 | 100 |
| CG-5% | 2409 | 99 |
| CG-10% | 2377 | 98 |
Table 20.
Compressive strength (in MPa) at 7, 14 and 28 days of curing of the standard concrete (PC) and concrete dosages with grass substitution of 5 and 10% of sand volume.
Table 20.
Compressive strength (in MPa) at 7, 14 and 28 days of curing of the standard concrete (PC) and concrete dosages with grass substitution of 5 and 10% of sand volume.
| Design | 7 Days | 14 Days | 28 Days |
|---|
| PC | 26.08 | 28.70 | 31.87 |
| 26.24 | 29.20 | 31.82 |
| 26.40 | 29.70 | 31.77 |
| Substitution-5% | 23.52 | 26.51 | 27.08 |
| 24.28 | 26.66 | 27.77 |
| 25.03 | 26.80 | 28.46 |
| Substitution-10% | 22.39 | 24.59 | 26.50 |
| 22.66 | 24.89 | 27.05 |
| 22.93 | 25.18 | 27.60 |
Table 21.
Results of average compression tests, in MPa.
Table 21.
Results of average compression tests, in MPa.
| Design | | 7 Days | 14 Days | 28 Days |
|---|
| PC | | 26.24 | 29.20 | 31.82 |
| Substitution-5% | %/Pattern | 24.28 | 26.66 | 27.77 |
| 92.53% | 91.30% | 87.27% |
| Substitution-10% | %/Pattern | 22.66 | 24.89 | 27.05 |
| 86.35% | 85.24% | 85.01% |
