Article

Influence of Test Configuration on the Bond–Slip Behavior of Hooked-End Steel Fibers in Concrete: Quantity, Inclination, and Spacing

by
Jonatas Santana Maia
1,
Ramoel Serafini
1,*,
Maria Luísa Ribeiro Mineiro
2,
Alicia Martinez Batista
1 and
Ronney Rodrigues Agra
3
1
Department of Civil Engineering, São Judas Tadeu University, São Paulo 03166-000, Brazil
2
Department of Structural and Geotechnical Engineering, University of São Paulo, São Paulo 05508-010, Brazil
3
THM Statistical Consulting, São Paulo 01527-050, Brazil
*
Author to whom correspondence should be addressed.
Buildings 2025, 15(6), 868; https://doi.org/10.3390/buildings15060868
Submission received: 19 February 2025 / Revised: 4 March 2025 / Accepted: 6 March 2025 / Published: 11 March 2025

Abstract

The objective of this study is to assess the influence of test configuration on the pullout response of hooked-end steel fibers embedded in a cementitious matrix and to analyze how variations in quantity, inclination, and spacing affect discrete–explicit numerical simulations. The experimental campaign was conducted using dog-bone-shaped specimens with variables of number of fibers (one, two, and four), fiber inclination (0°, 15°, and 30°), and spacing (7 mm and 14 mm), with 133 specimens tested (19 per configuration). The results obtained showed that fiber inclination significantly influences pullout behavior, with higher inclinations (up to 30°) increasing pullout loads (PL1 and PL2 being the maximum pullout and the intermediate pullout load values, respectively) but also leading to fiber rupture in approximately 21% of cases. Closely spaced fibers (7 mm) demonstrated enhanced load transfer compared to wider spacing (14 mm), particularly in setups with multiple fibers. Increasing the number of fibers reduced variability in pullout results, providing more consistent data. Numerical simulations effectively capture fiber–matrix interactions, with load–CMOD curves generally aligning with experimental data. However, discrepancies in the fR1 parameter highlighted the need for further calibration to improve accuracy in modeling early cracking stages. These findings underscore the importance of fiber configuration in optimizing pullout performance and the potential for refining numerical models to better predict post-cracking behavior in steel fiber-reinforced concrete.

1. Introduction

Concrete is a material of paramount importance in civil construction due to its durability, versatility, and cost-effectiveness. In recent decades, there has been a growing trend in the utilization of steel fibers to augment the characteristics of plain concrete. In this context, steel fiber-reinforced concrete (SFRC) has become increasingly important as both a partial and complete alternative to traditional reinforced concrete. This composite material is characterized by the uniform distribution of fibers within the concrete matrix, resulting in improved mechanical characteristics, durability, toughness, and a pseudo-ductile behavior compared to plain concrete [1,2,3]. The post-crack properties of SFRC are predominantly governed by the bond–slip behavior between the steel fibers and the concrete matrix, which dictates the load transfer mechanism and the ability of the composite to sustain stresses after matrix cracking [4]. This bond–slip behavior is influenced by factors such as fiber geometry (e.g., hooked-end, straight, or deformed fibers), surface roughness, and the interfacial transition zone (ITZ) between the fiber and the surrounding cement paste [5,6].
The use of SFRC is notably applicable in scenarios where the substitution of traditional steel bars with fibers yields technical and economic benefits. This is commonly observed in infrastructure projects such as pavements, sanitary pipes, tunnels, and precast elements [7]. Moreover, the adoption of fiber-reinforced concrete has experienced a substantial surge in momentum, largely attributed to the recent release of several guidelines, at first with the publication of the fib Model Code 10 [8] and more recently with the publication of several Brazilian guidelines [9]. The establishment of standards is an important milestone in advancing the application of SFRC, since it eases the incorporation of this material in new projects and fosters the evolution of more robust and resilient infrastructure solutions.
The behavior of steel fiber-reinforced concrete is predominantly regulated by the intricate interplay between the steel fibers and the surrounding matrix. Numerous tests recommended in the existing literature are aimed at evaluating the bond–slip characteristics of steel fibers within the concrete matrix [5,6,10,11,12,13,14]. These methodologies can vary in terms of test setup, specimen shape, loading conditions, and measurement techniques [15]. Moreover, it is worth noting that there is a notable absence of a standardized pullout test method specifically designed to obtain comprehensive bond–slip curves for steel fibers. Hence, divergent findings are reported when comparing different test configurations in terms of pullout response and variability of results.
To reduce the variability of pull-out tests, researchers have conducted tests to evaluate the influence of test variables such as multiple fibers, fiber spacing and inclination. Mineiro [16] carried out pullout tests with one and four fibers, and it was observed that the configuration with four fibers showed a 39% higher pullout response compared to the configuration with a single fiber, along with a significant reduction in result dispersion. Feng et al. [17] also investigated five different pullout setups with different spacings for various quantities and types of fibers, and it was observed that there was a slight reduction in the pullout resistance as the spacing between the fibers decreased. However, it is important to emphasize that the authors have not conducted a statistical analysis to evaluate the significance of the difference between medians. In contrast, Kim and Yoo [18] performed pullout tests with one and four fibers in ultra-high-performance concrete (UHPC), and the results indicated an average reduction of approximately 30% in pullout properties for configurations with multiple fibers compared to single fibers. This means that variables such as the distance between fibers, number of fibers, test configuration, and the physical–mechanical properties of concrete are factors of significant influence on the pullout response.
Another relevant aspect that has been investigated is the influence of the inclination of fibers in the pullout response. Cunha et al. [12] analyzed single-block pullout with single fibers, varying the inclination of the fibers at 0°, 30°, and 60°, and the conclusion drawn was that the maximum increase in pullout load occurred with an inclination of 30°. Lee, Kang, and Kim [13] conducted pullout tests with 32 fibers, spaced 4 mm apart, varying the inclinations of the fibers to 0°, 15°, 30°, 45°, and 60°, and the results indicated that configurations of 30° and 45° yielded the greatest pullout values.
Moreover, the bond–slip parameters derived from pullout tests, such as the bond stress–slip relationship, are important inputs for recently developed discrete–explicit numerical models aimed at simulating SFRC structures [12,16,19]. These models, which combine the discrete representation of steel fibers with explicit numerical methods, rely heavily on accurate bond–slip parameters to predict the structural response of SFRC elements under different loads and boundary conditions. Therefore, the pullout test acts as a critical link between laboratory experimentation and advanced numerical simulations, enhancing the design capability, precision, and reliability of such models.
Despite numerous studies on the bond–slip behavior of hooked-end steel fibers, a comprehensive analysis considering the combined effects of fiber quantity, inclination, and spacing remains limited. Existing research often isolates these parameters, leading to inconsistencies in reported results and a lack of standardized evaluation methods. Additionally, while numerical models have been developed to simulate SFRC behavior, their accuracy depends on reliable bond–slip input parameters. By addressing these gaps, this study provides experimental data that capture the interaction between multiple variables and integrates these findings into a numerical model, enhancing its predictive capability and contributing to more robust SFRC design approaches.
In this context, the objective of this study is to assess the influence of test configuration on the pullout response of hooked-end steel fibers and verify its influence on the outcomes of discrete–explicit numerical simulations. This type of fiber was chosen because it is the most common type used in the field. The main variables evaluated experimentally were the number of fibers (one, two, and four), inclination of fibers (0°, 15°, and 30°), and the spacing between fibers (7 mm and 14 mm), totaling 133 dogbone-shaped specimens. The results were statistically analyzed, contributing to the acquisition of more consistent and reliable responses. The load–slip curves obtained from the pullout tests were used as input data for the fiber–matrix interface in numerical simulations of three-point bending tests and the post-cracking parameters derived were compared to experimental data.
The findings of this study pave the way for the proposition of a standardized pullout test to characterize the bond–slip behavior of hooked-end steel fibers to be used in recently developed discrete–explicit numerical models in the literature. Hence, this study addresses the gap in the literature by providing a comprehensive analysis of the combined effects of fiber quantity, inclination, and spacing on the bond–slip behavior of hooked-end steel fibers, integrating these findings into a validated numerical model. The results contribute to the development of standardized pullout tests and improved numerical simulations, offering a robust framework for optimizing the design of steel fiber-reinforced concrete in engineering applications.

2. Materials and Methods

In this study, the bond–slip response of hooked-end steel fibers was evaluated considering various test setup configurations; the variables of interest were the inclination (0°, 15°, 30°), number of fibers (1, 2, 4), and fiber spacing (7 and 14 mm). The pullout tests were conducted based on the double-block configuration, which is commonly employed in the literature [5,14,20]. Based on the experimental results, a refined statistical analysis was conducted using the Wilcoxon rank-sum test (Mann–Whitney U test), the non-parametric Kruskal–Wallis test, and the Nemenyi test. A total of 133 dogbone-shaped specimens were produced, and 19 specimens for each configuration were evaluated.

2.1. Material Properties

The cementitious material used in this study was Portland Cement CEM I 52.5R (São Paulo, Brazil) as a binder. River sand and artificial sand were used as fine aggregates to enhance particle packing. A polycarboxylate-based superplasticizer, GCP ADVA-Cast 525 (São Paulo, Brazil), was employed to improve the workability and fluidity of the mix. The particle size of the fine aggregates was determined through mechanical sieving, while the grain size distribution of cement powder was determined by means of the Dynamic Light Scattering (DLS) technique. Table 1 shows the results of d10, d50, d90, and fineness modulus (FM) for the grained materials employed in this study. Hooked-end steel fibers, namely Dramix 3D 80/60-BG (São Paulo, Brazil), were employed in this study. Table 2 shows the manufacturer’s technical specifications for the steel fibers employed in this study.

2.2. Composition and Preparation of the Mortar

Table 3 shows the dosage employed for the mortar produced in this study. The mix design was chosen since it is representative of the production of segmental lining rings for the construction of Subway Line 6 in São Paulo, Brazil [20,21,22]. The mortar employed in this study presented a water/cement ratio of 0.38, a spreading value of 145 mm by means of the mini-conical slump flow test, and compressive strength of 46.5 (±1.4) MPa obtained by testing five cylindrical specimens of ⌀ 50 mm × 100 mm. The mortar mixture was fabricated at room temperature (25 °C ± 1) using the Metal Cairo AG-5 mixer (São Paulo, Brazil), which has a total capacity of 5 L. The mixing procedure was based on the procedure proposed by Dantas et al. [23] for a homogeneous distribution of grained particles in the mix. The procedure is summarized as follows: firstly, the fine aggregates and all the water were added, and a 90 s period allowed for granular material moistening. After this period, the aggregates were mixed with water only at low–high–low speeds, each for 30 s. Subsequently, the cement was added, and the mixture was conducted at low–high–low speeds for the same duration. Finally, the entire superplasticizer was added to the mortar, and the mixing process was repeated at low–high–low speeds for 30 s each.

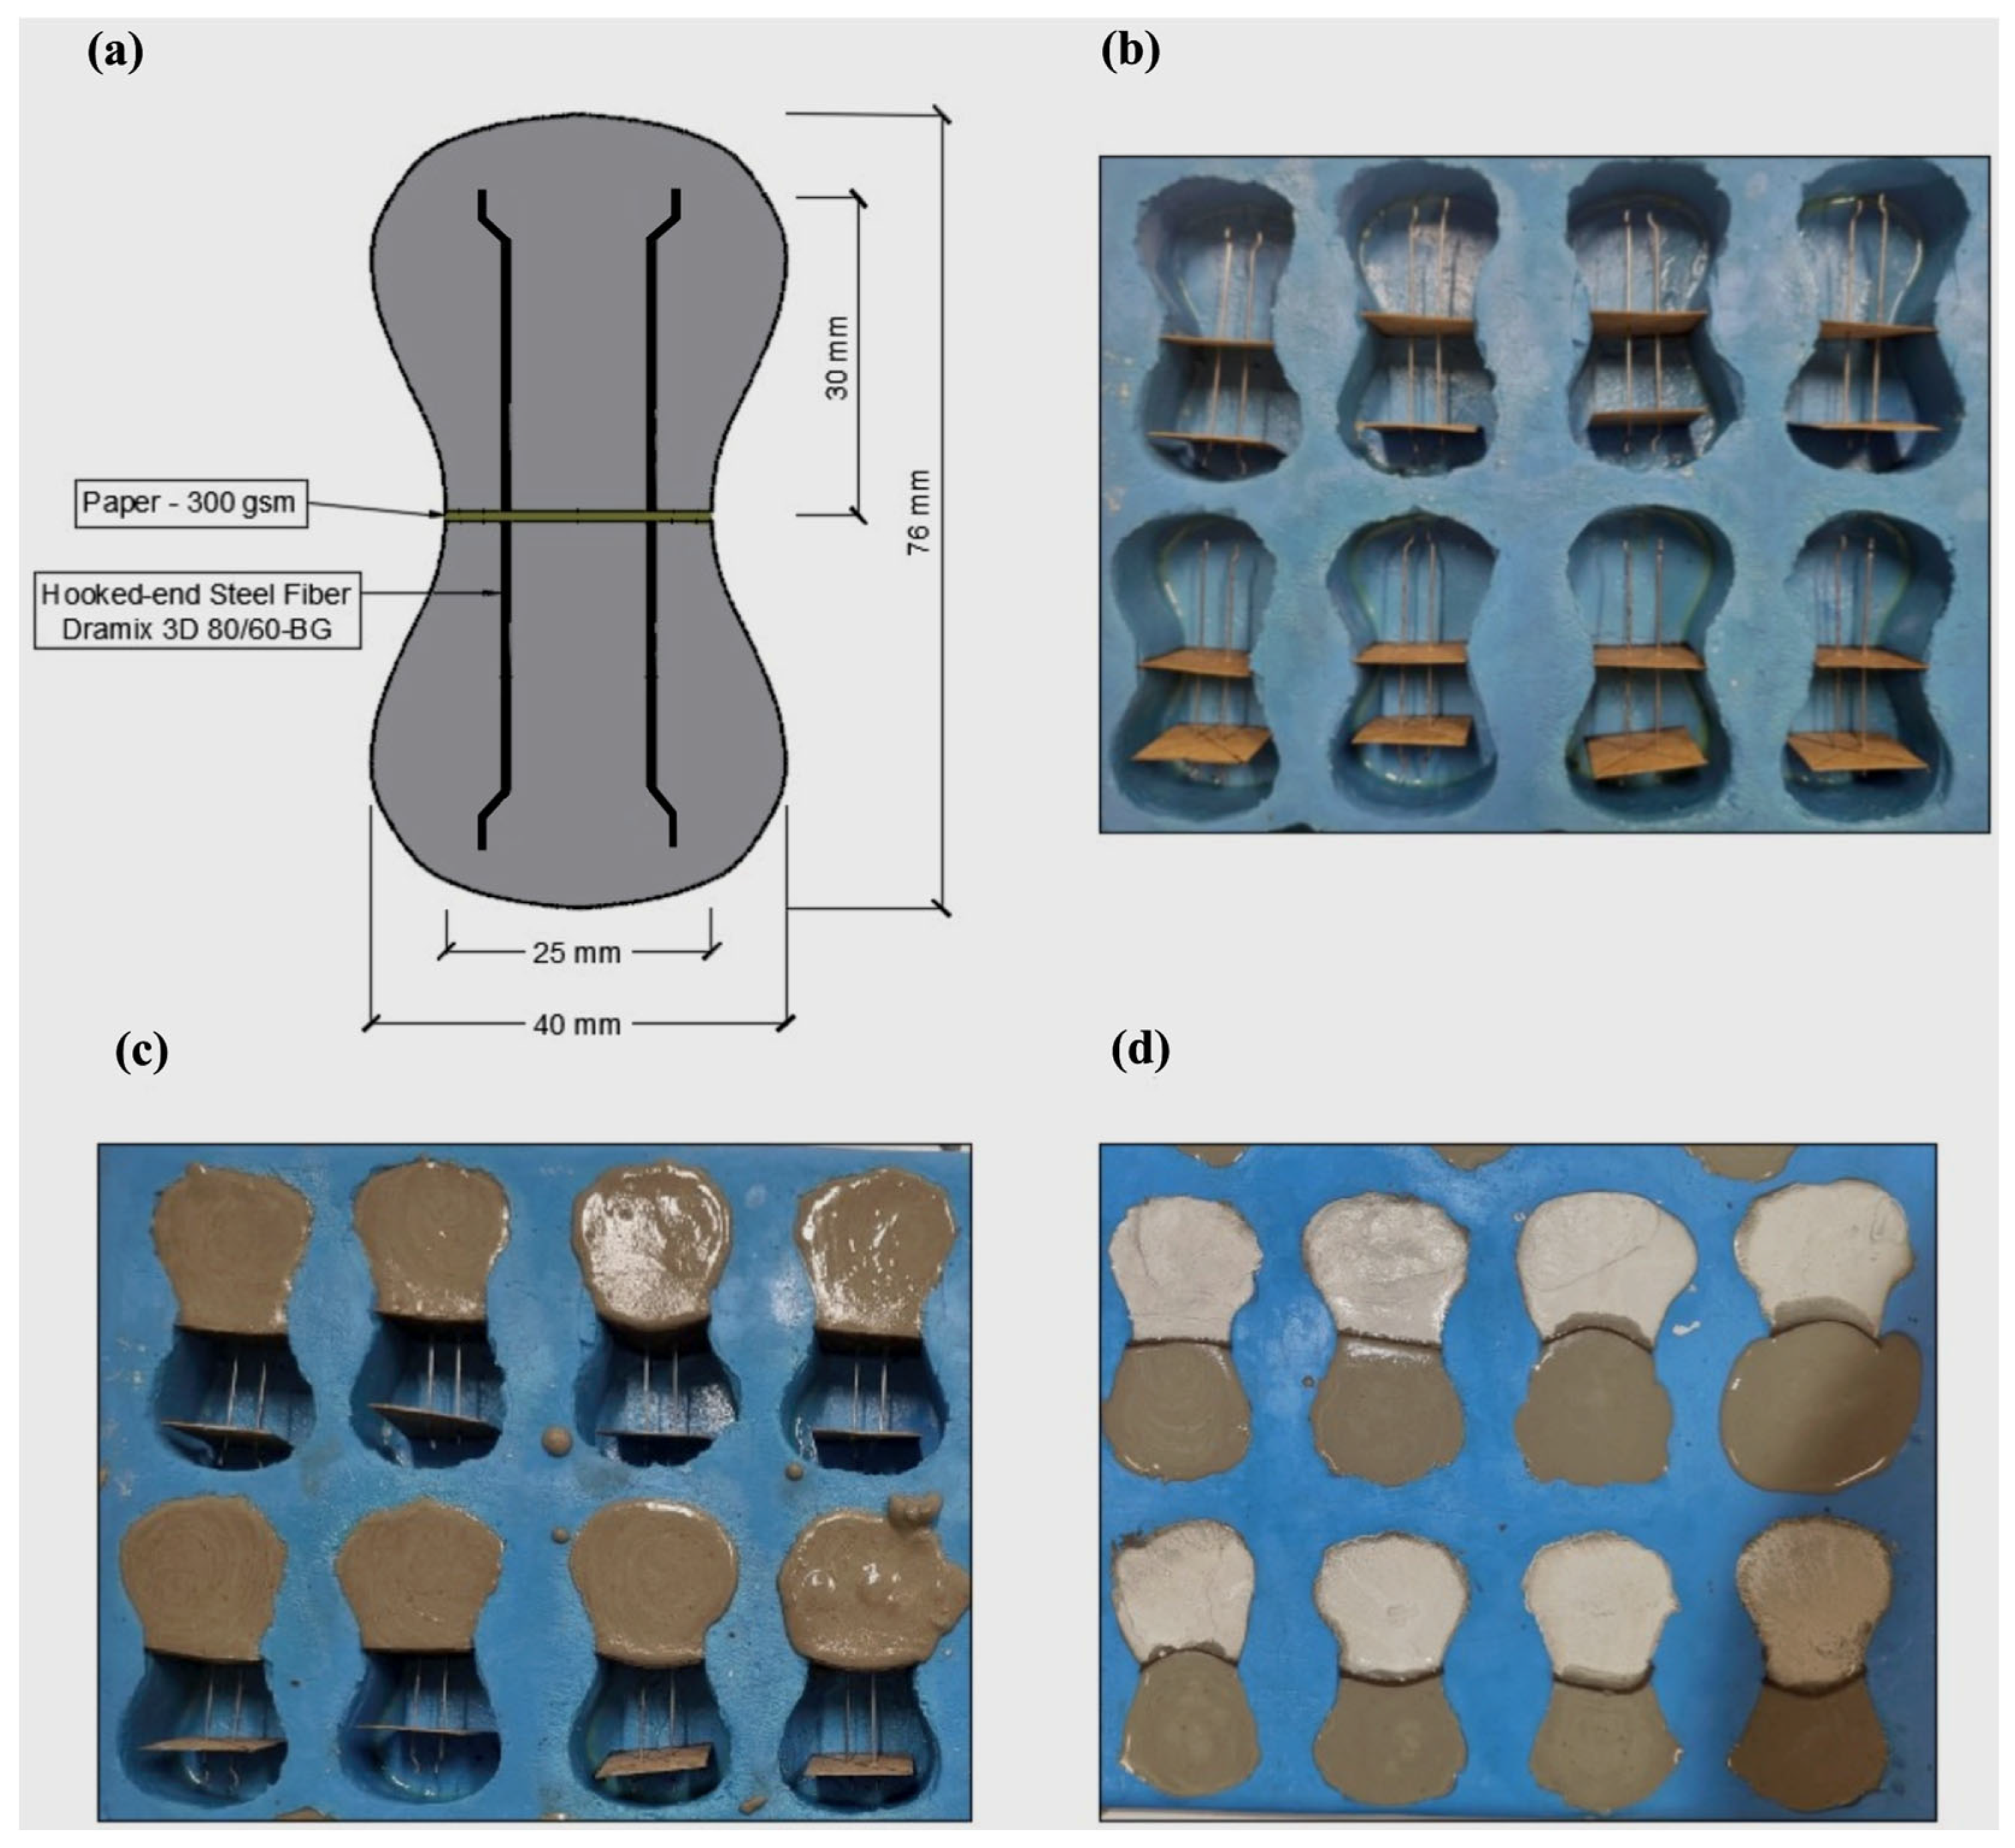
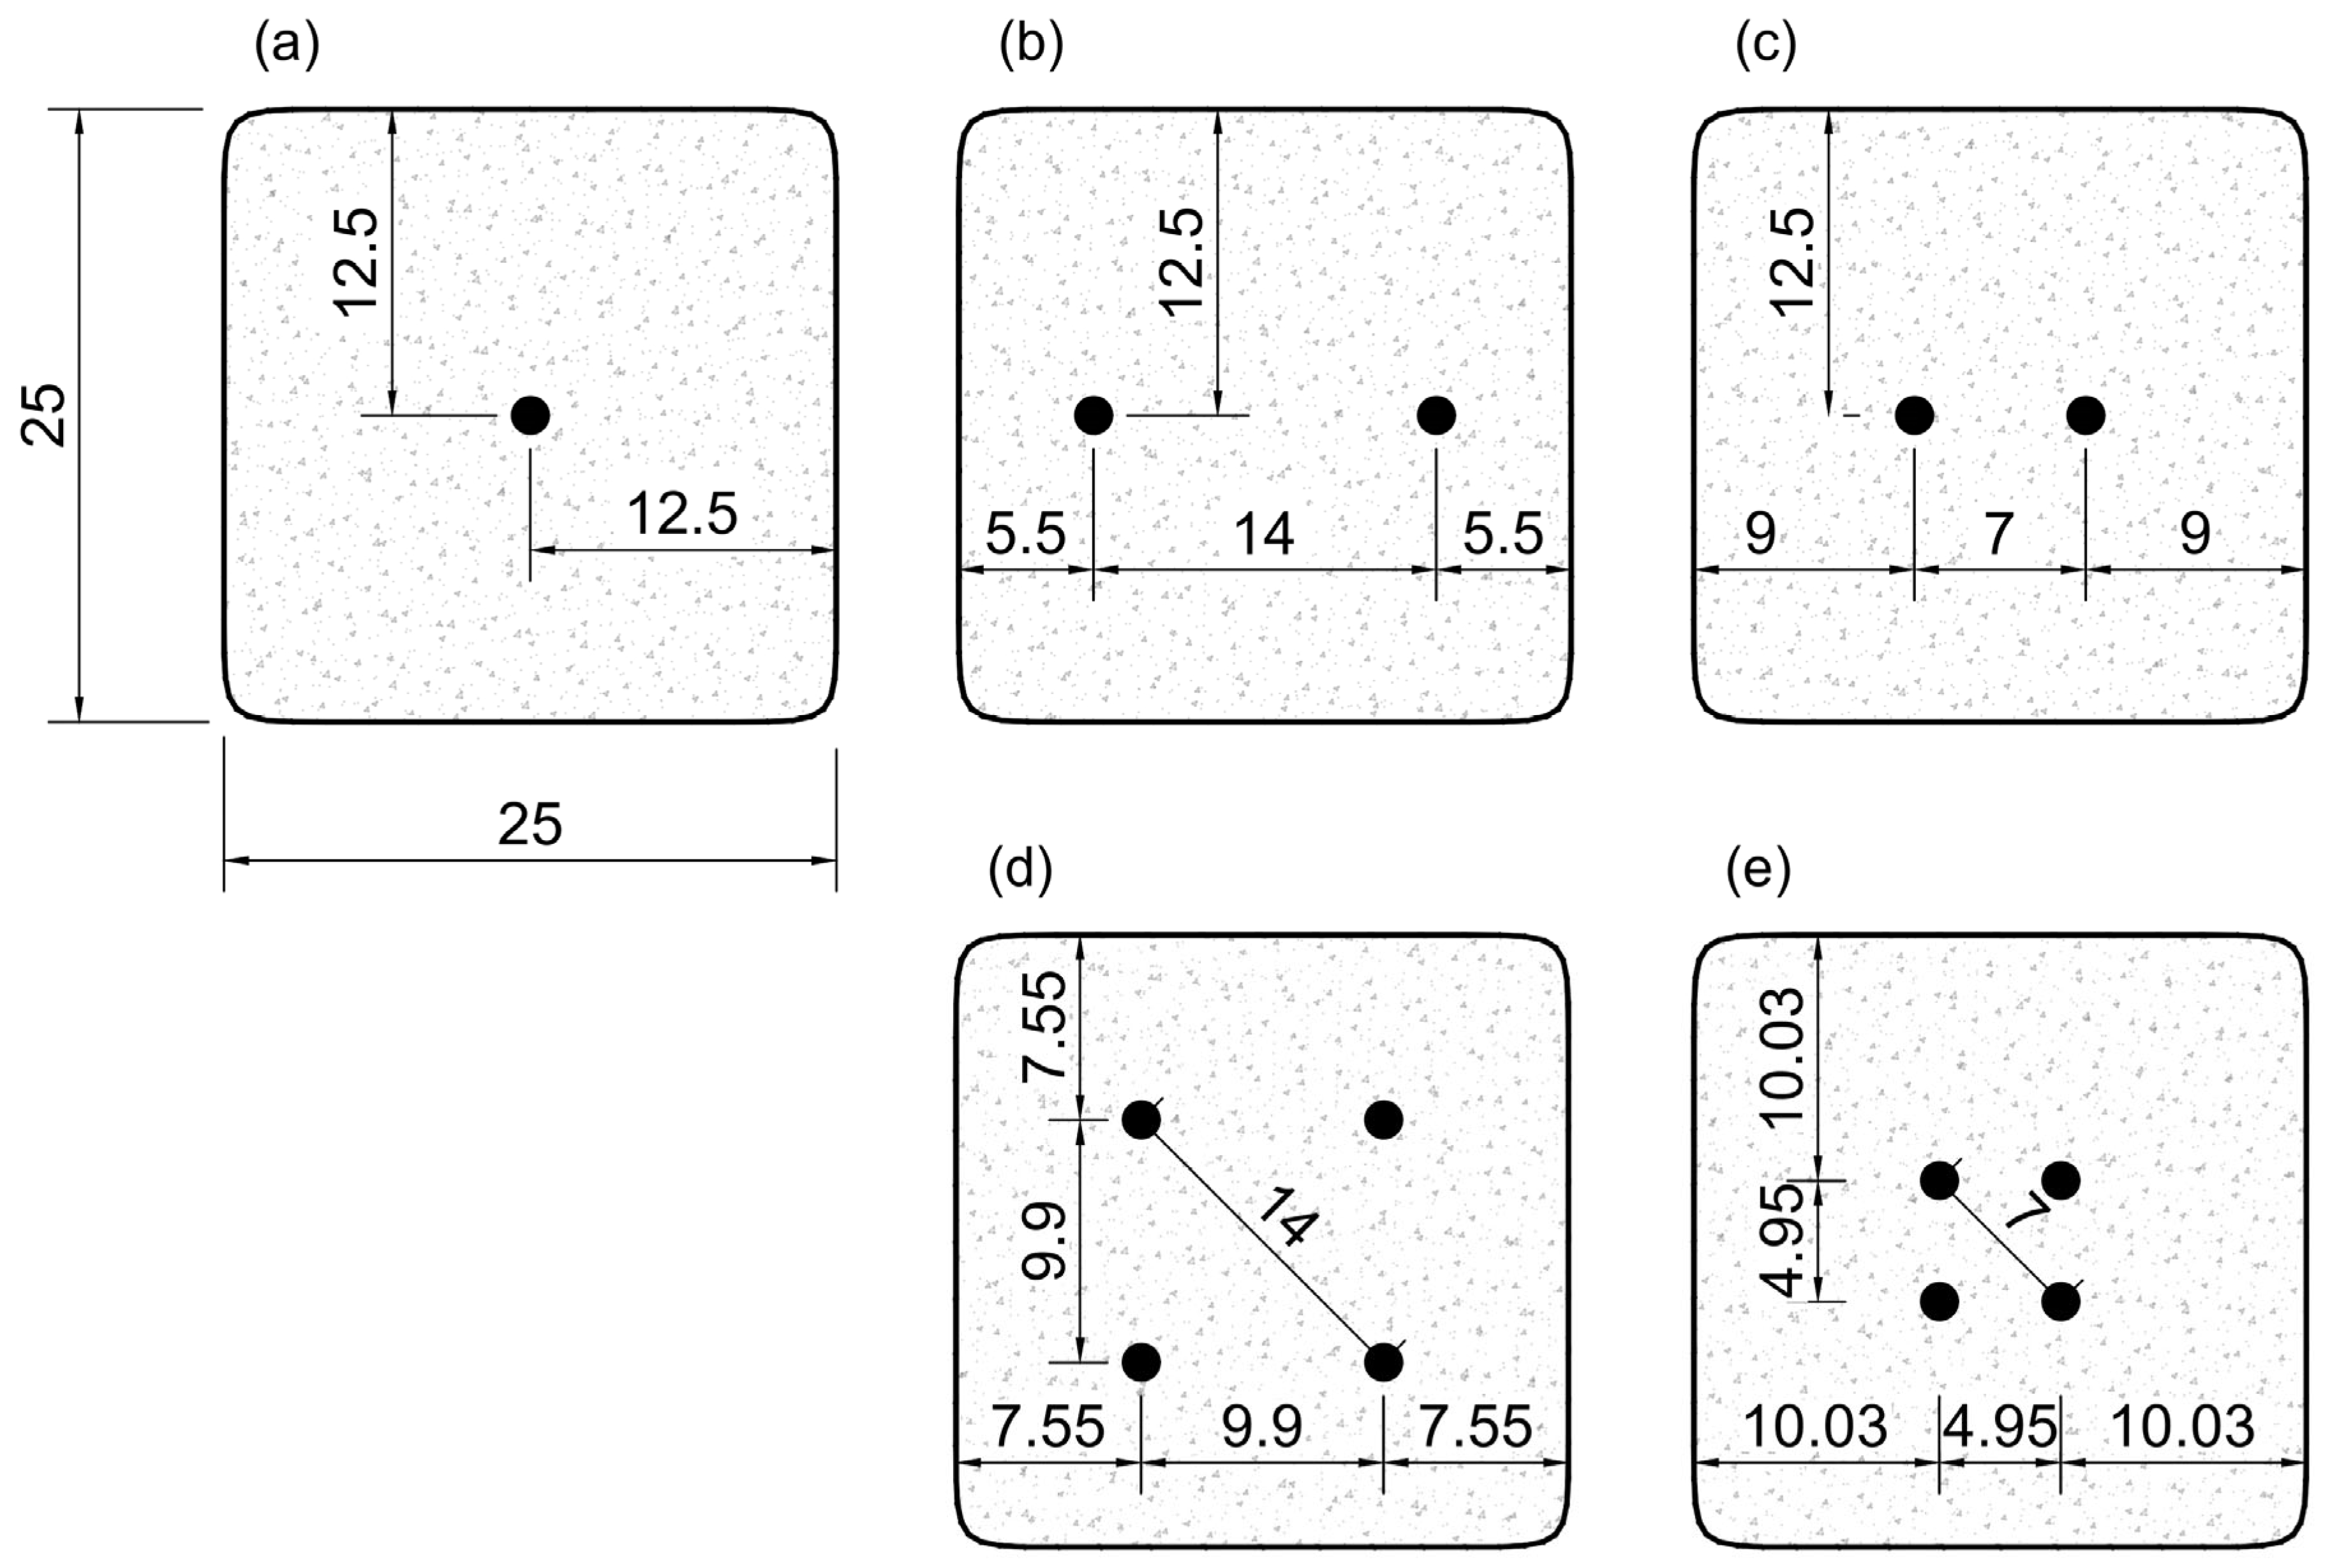
2.3. Casting of the Pullout Specimens

Figure 1 illustrates the molding procedure for the pullout specimens. The casting procedure began by placing two papers of 300 g/m2 and approximately 1 mm in thickness to guarantee the appropriate position of the steel fibers in the dog-bones (see Figure 1a,b). This procedure had the objective of avoiding fiber rotation or displacement inside the mold during casting. After securing the configurations, the produced mortar was cast inside one half of the mold (Figure 1c). The embedded length was double-checked on the empty side of the mold and, after 24 h, the auxiliary fixation paper was removed, and the other half of the specimen was cast with the produced mortar (Figure 2d). The test specimens were sealed with a protective plastic film for 24 h and then stored in a humid chamber until they were completely removed from the molds. Lastly, the pullout specimens were cured for 64 days in saturated conditions. For all the configurations tested, the embedded length of L = 30 mm was adopted, representative of half of the total fibers’ length.
Figure 2 illustrates the single and multiple fiber configurations evaluated in this study. The study configurations were based on three setups with different numbers of fibers employed in the test (i.e., 1, 2, and 4 fibers). Additionally, the distance between the fibers was evaluated at predefined distances of 14 mm and 7 mm for cases with 2 and 4 fibers. The spacing between fibers of 14 mm and 7 mm are representative of fiber contents of 20 kg/m3 and 80 kg/m3, respectively, which are commonly employed in the industry [2,5]. These spacings were determined considering the fibers’ physical properties and a homogeneous and equidistant distribution in concrete, as presented by Kim and Yoo [18]. These fiber contents are commonly employed in structural applications related to tunneling infrastructure [22,24]. These pullout test configurations were reproduced on 300 g/m2 papers and employed as fixation frames for the production of dogbone-shaped specimens. Each pullout group was identified by the number of fibers and the distance between fibers. For example, F2S7 represents the group with 2 fibers and fiber spacing of 7 mm, while F1S0 stands for the group of specimens containing a single fiber. Table 4 summarizes the groups of specimens employed in this study.

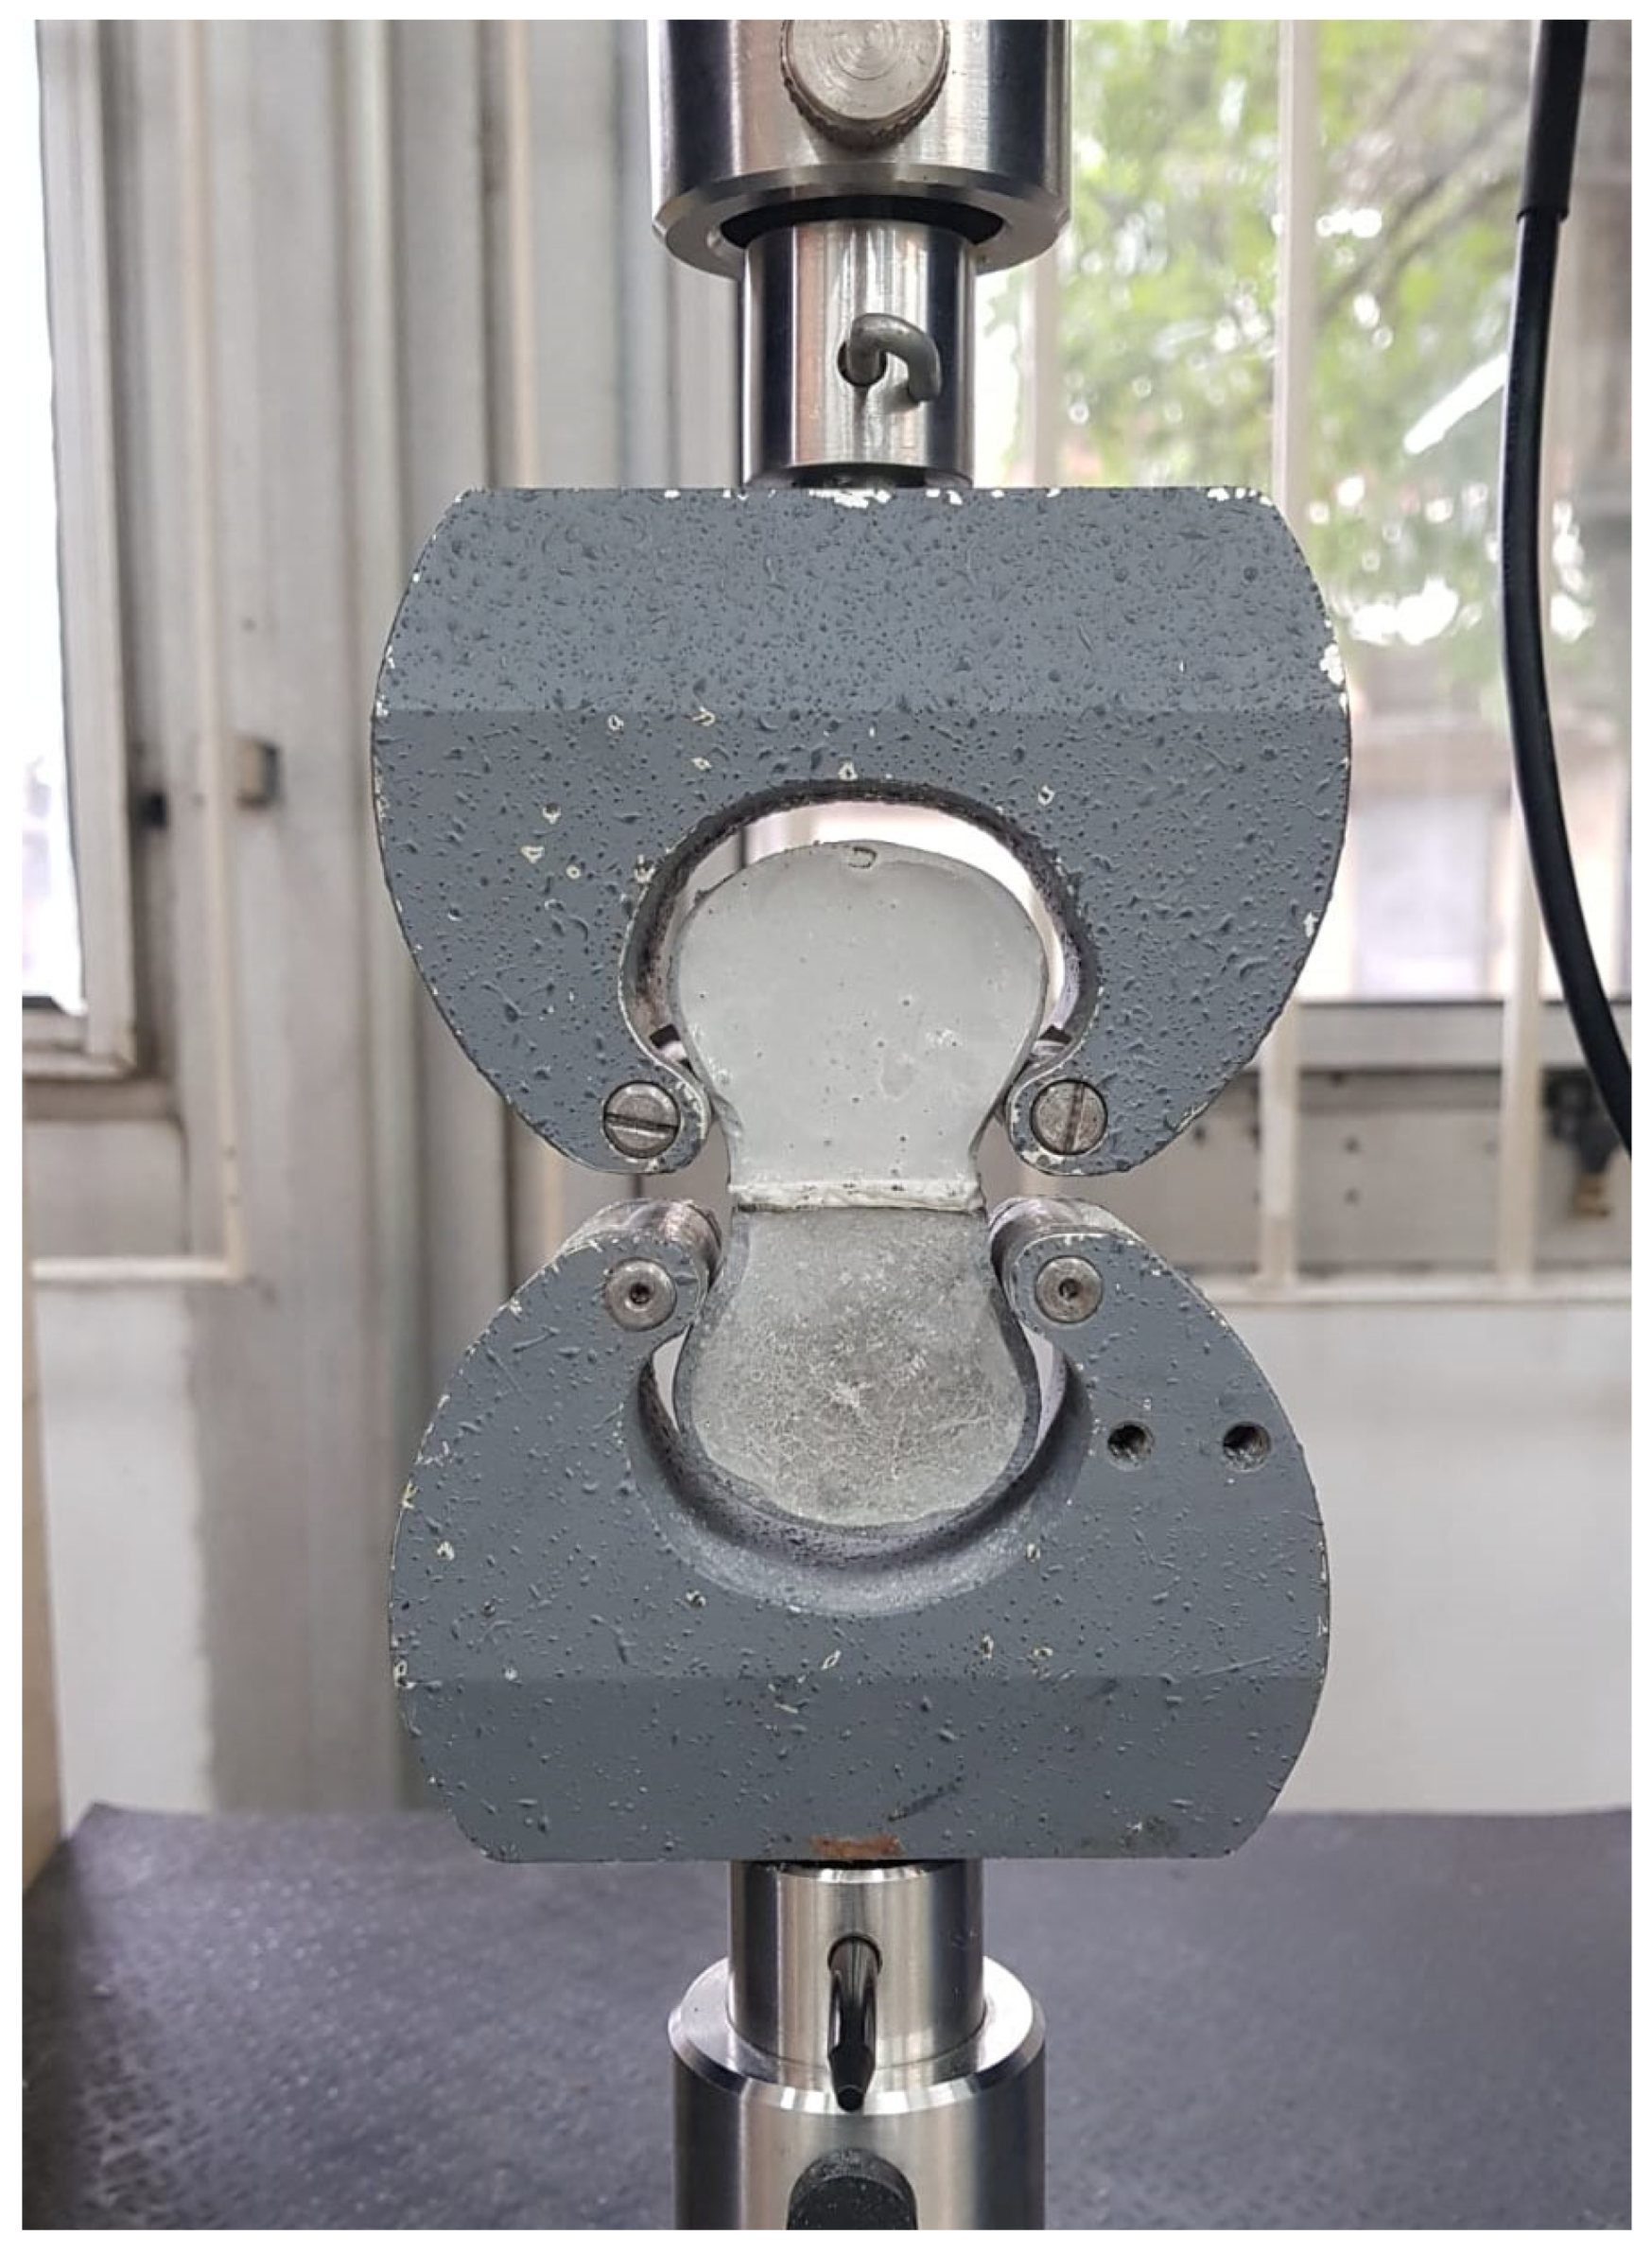
2.4. Testing of the Pullout Specimens

Figure 3 illustrates the pullout test conducted in this study. The double-block pullout tests were conducted using an electromechanical EMIC DL 10,000 (São Paulo, Brazil) testing machine using a load cell with a maximum load capacity of 10 kN and precision of 1N. The test was performed at a loading rate of 1.0 mm/min, as commonly employed in [16,25]. The analysis was conducted considering PL1, PL2, and PL3 parameters as representative of fiber pullout behavior, as presented in the work of Serafini et al. [5] and summarized for the convenience of the reader (see Figure 4). The PL1 parameter represents the maximum pullout load; PL2 represents the intermediate pullout load; and PL3 represents the friction load between the straightened fiber and the cementitious matrix. The maximum value of the load–displacement curve was considered representative of PL1. A fixed displacement value of 3.5 mm was employed to determine PL2 for all configurations, with the exception of F1S0 30°, in which the intermediate pullout occurred at ~4.0 mm. Lastly, a fixed displacement value of 8.0 mm was employed to determine the PL3 values. The piston displacement values were used in this study.
Moreover, all the experimental pullout results were normalized to be representative of a single fiber pullout test by dividing the pullout curves by the number of resisting fibers in the section. This normalization was required to make a valid comparison between the variables evaluated in this study, as well as to enable comparisons with the current literature results. Lastly, the pullout test was interrupted before the complete pullout of the fiber occurred. This was adopted since the failure design criteria (CMOD = 2.5 mm) was achieved for smaller crack openings than the embedded length employed in this study (i.e., L = 30 mm). Lastly, the analysis of the pullout test results was conducted considering the variables of fiber spacing and number of fibers employed in the test.

2.5. Statistical Analysis

The difference in pullout loads among the samples were statistically evaluated using a non-parametric approach employing the Wilcoxon rank-sum test [26]. Additionally, for the groups with 1 fiber and varying inclinations (i.e., 0°, 15°, and 30°), the data comparability was assessed by means of the non-parametric Kruskal–Wallis test [27]. In cases where a statistically significant difference was identified, the Nemenyi test [28] was conducted to analyze the significance of the difference between pairs of values. The results were presented in terms of medians, and the spread was discussed in relation to the interquartile range (IQR). The analysis was conducted considering that a statistically significant difference is indicated when the p-value is <5%, which is a common parameter used to evaluate precast fiber reinforced concrete.

3. Experimental Results

This section presents the results obtained from the experimental program conducted in this study. Furthermore, an analysis is carried out considering the statistical significance of the results and their implications in the field of fiber-reinforced concrete technology.

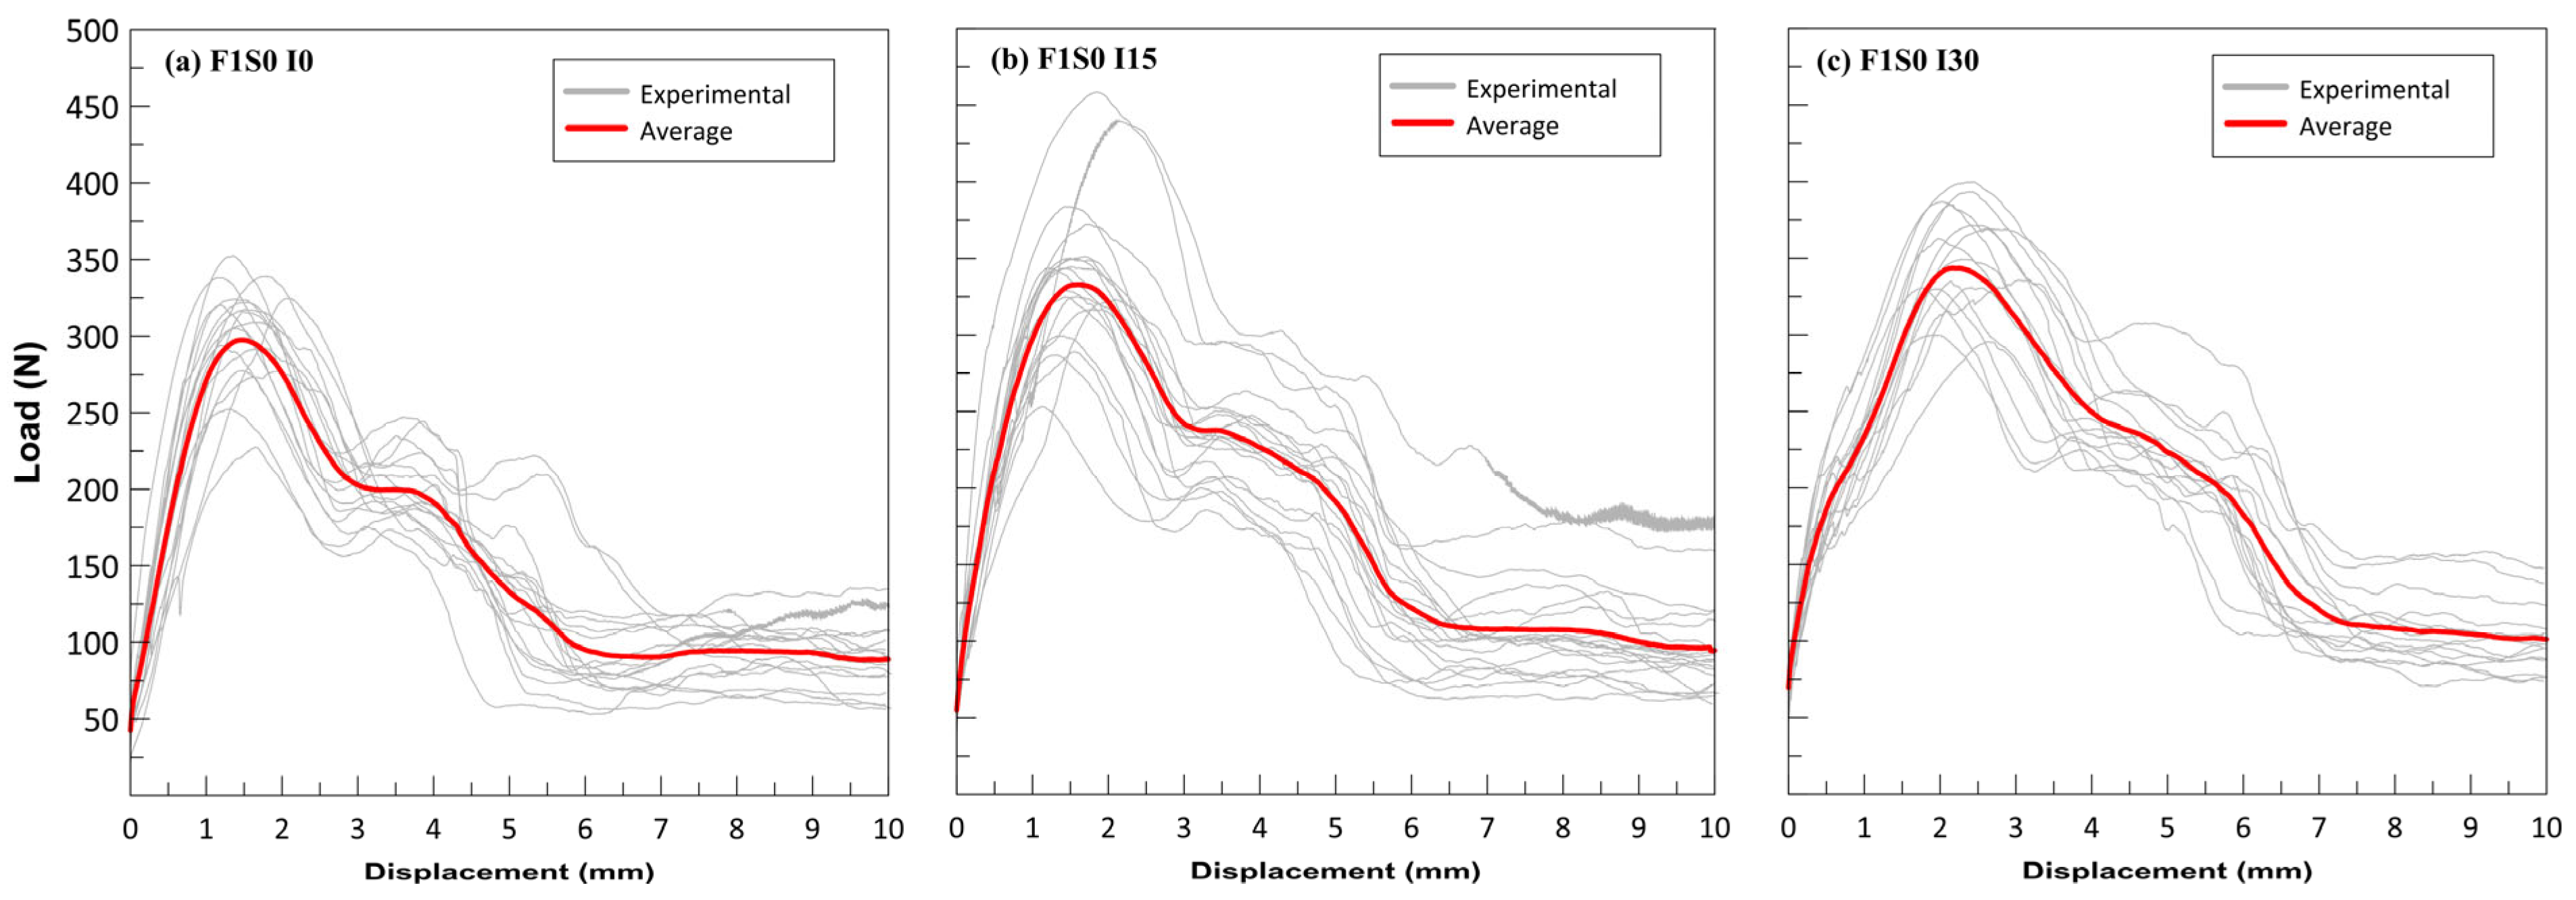
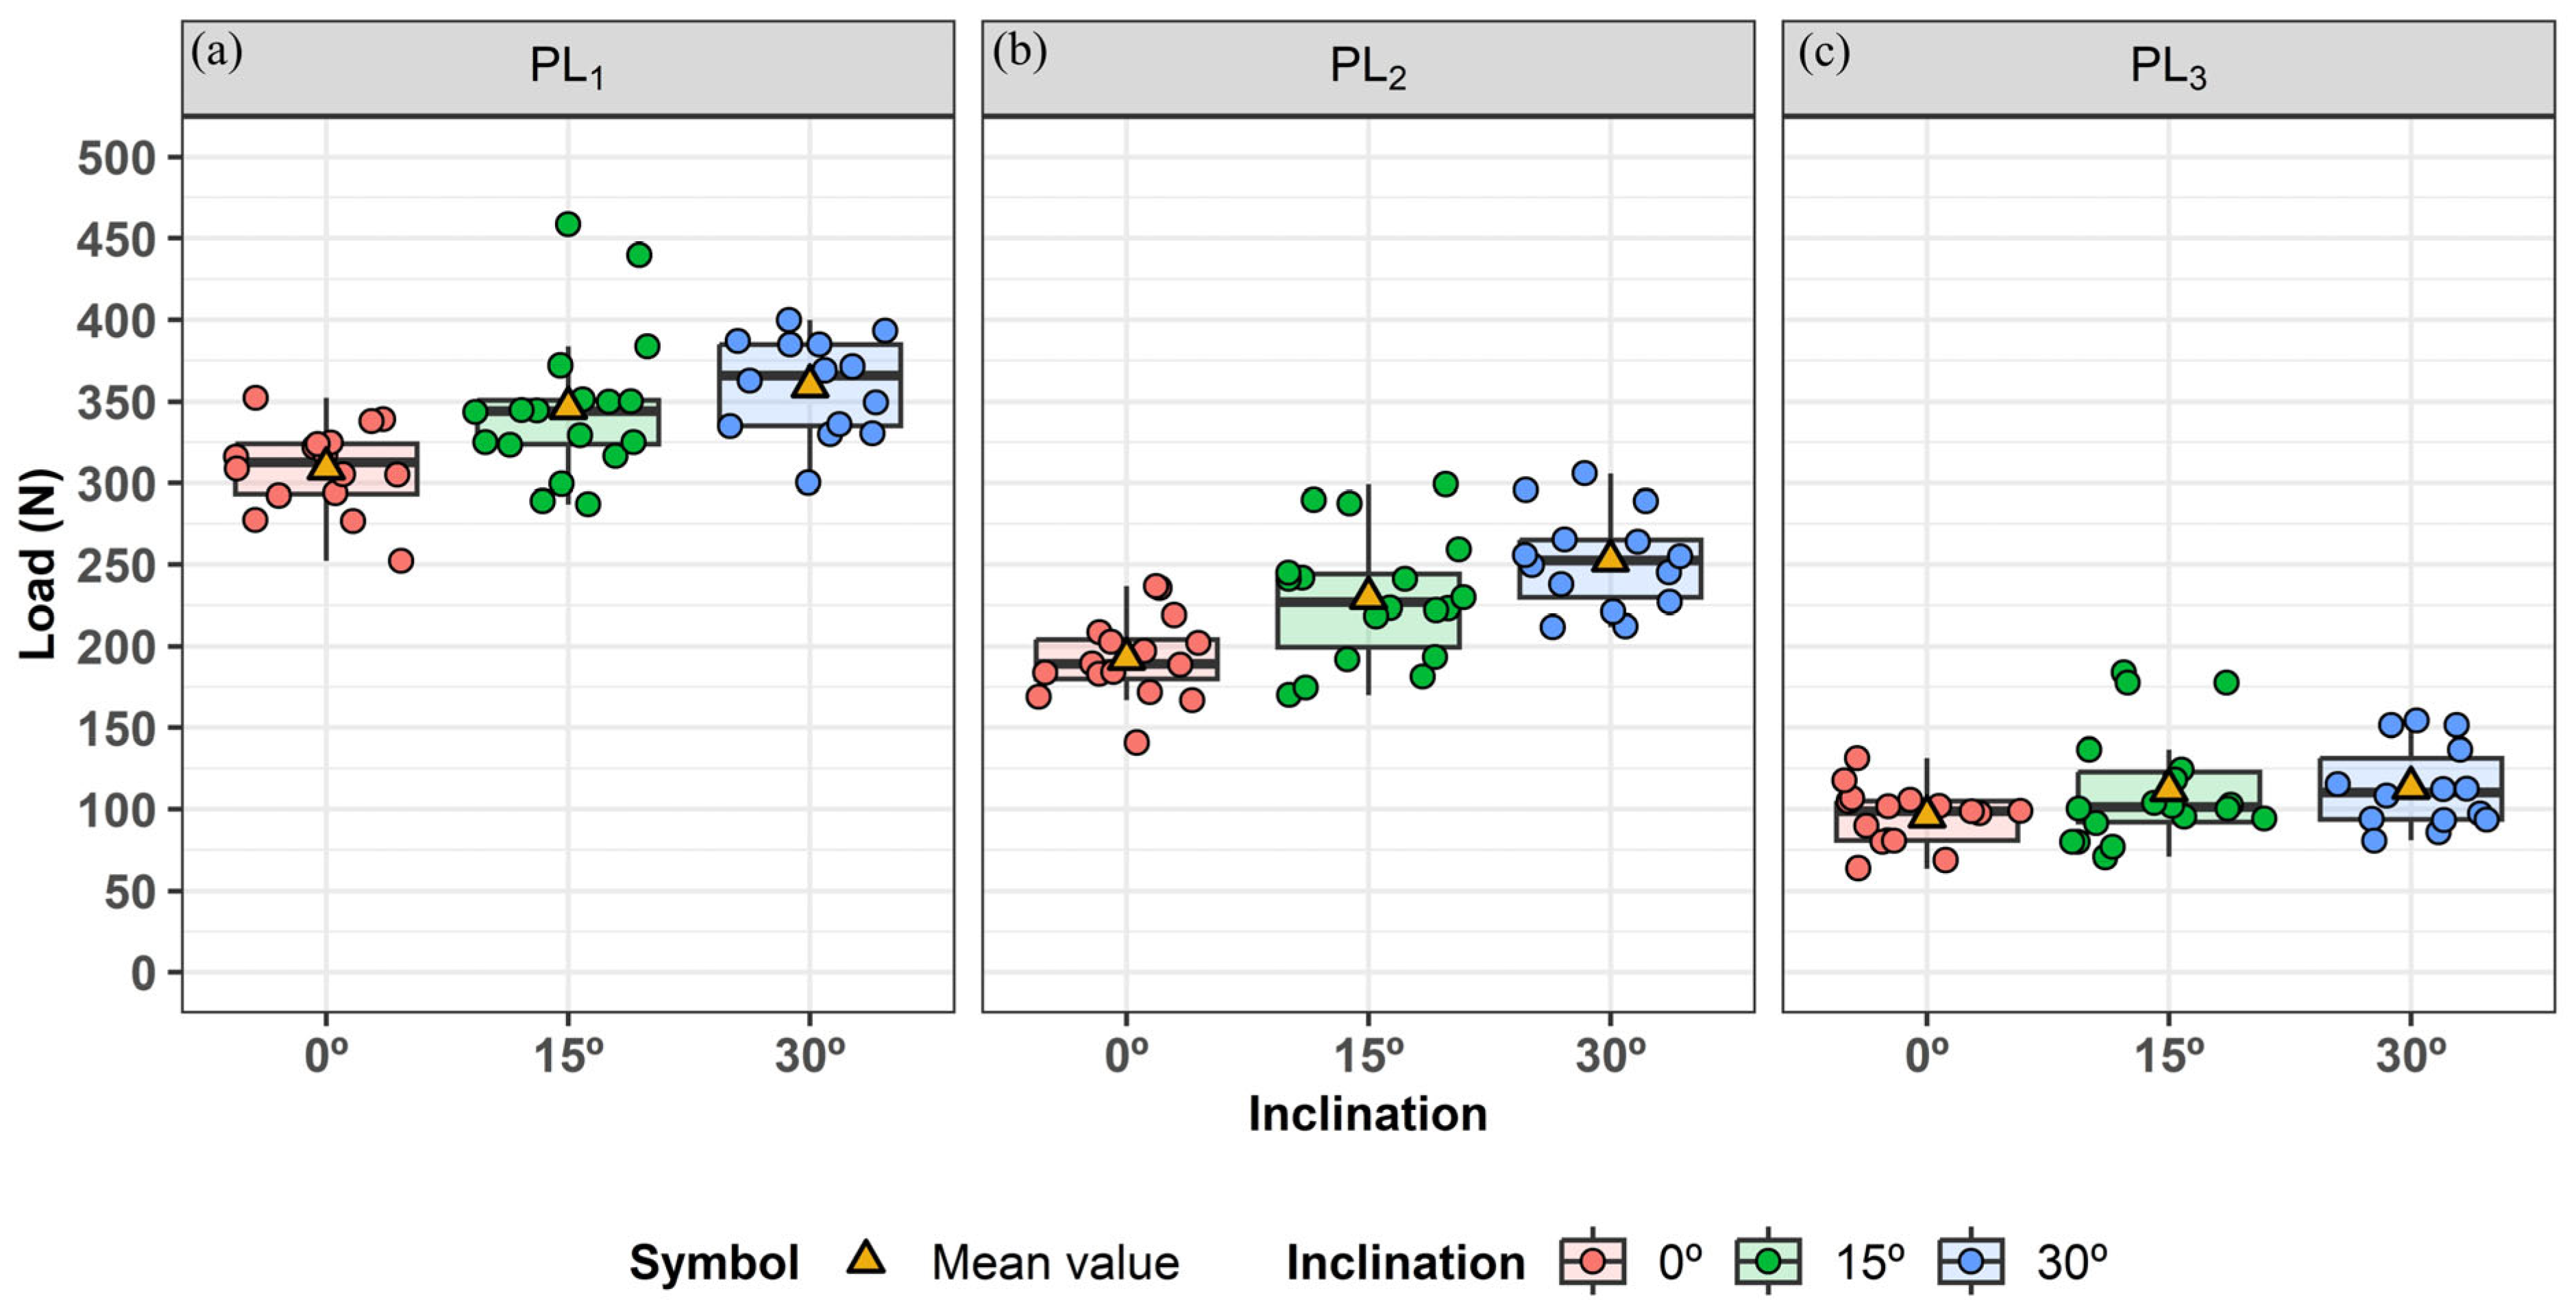
3.1. Influence of Fiber Inclination

Figure 5 shows the full spectrum of experimental curves and average curves obtained for each variable. Figure 6 illustrates the median load values as a function of parameters PL1, PL2, and PL3 considering different inclinations. The inclination of fibers at angles of 15° and 30° resulted in an increase in parameter PL1 of approximately 10.1% and 17.1%, respectively, compared to the reference group (no inclination). For parameter PL2, load increments of approximately 20.0% and 33.6% were achieved when compared to the reference group. Furthermore, the statistical analysis demonstrated that the increment caused by fiber inclination is statistically significant (p-value < 0.05) for both parameters PL1 and PL2 when compared to the reference. It is also important to remark that the steel fibers ruptured for approximately 21% of the test specimens, with fibers inclined at 30° before the complete occurrence of pullout, which indicates that the stress values generated along the fiber during the pullout exceeded its tensile strength, which is in line with the literature results [29]. Thus, a clear influence of fiber inclination on the values of parameters PL1 and PL2 can be observed, which may be associated with the straightening and bending of the fiber near the crack tip.
When analyzing parameter PL3, it can be noted that the increase in the median value was approximately 2.5% and 11.7% for inclinations of 15° and 30°, respectively, when compared to the reference group. However, the median increases did not reach a level of significance sufficient to be considered statistically distinct from the reference value (p-value = 0.28). The non-significance of the result for PL3 may be correlated to the predominance of kinetic friction in this stage of fiber pullout, with the fiber having straightened hooks and greater alignment perpendicular to the fracture plane. Moreover, the reduced influence of straightening and bending of the fiber near the crack tip may contribute to the non-significance of results when compared to control specimens at this stage. Thus, these results are in line with the conclusions reached by Cunha et al. [12] and Lee, Kang, and Kim [13], who showed an improvement in the pullout load as the inclination increased, with the maximum increase occurring in the configuration with the fibers inclined at 30°.

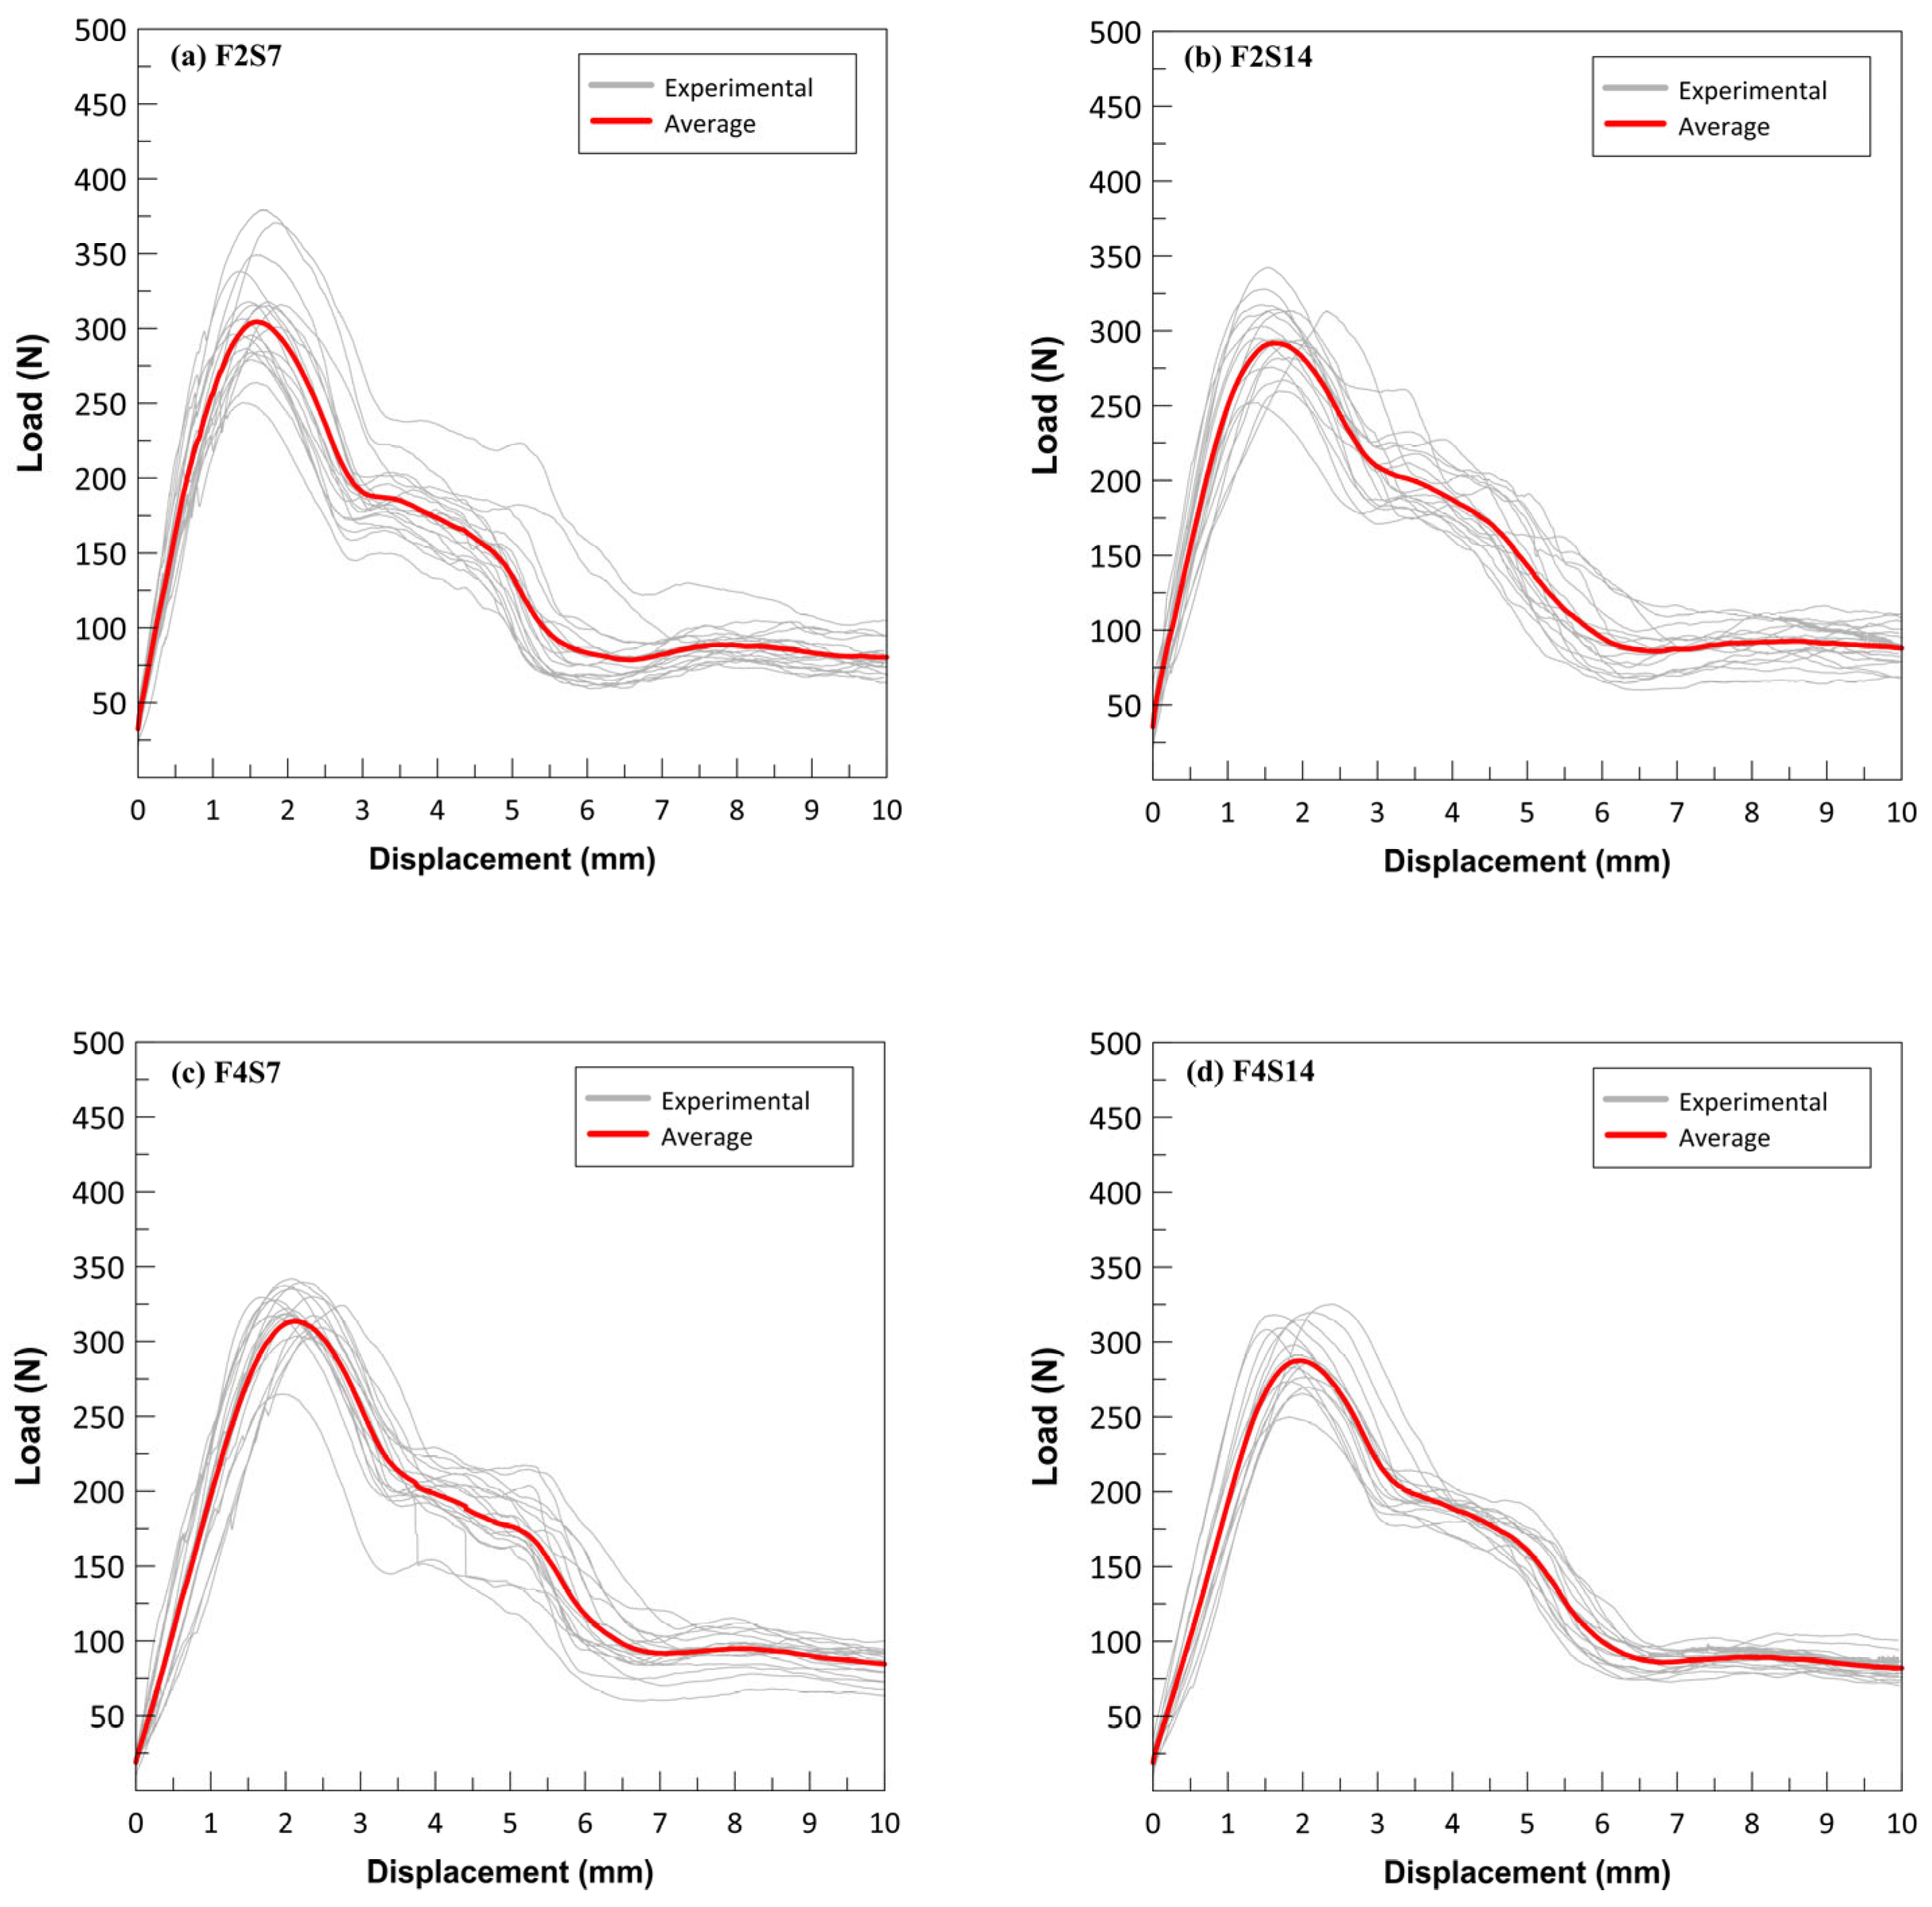
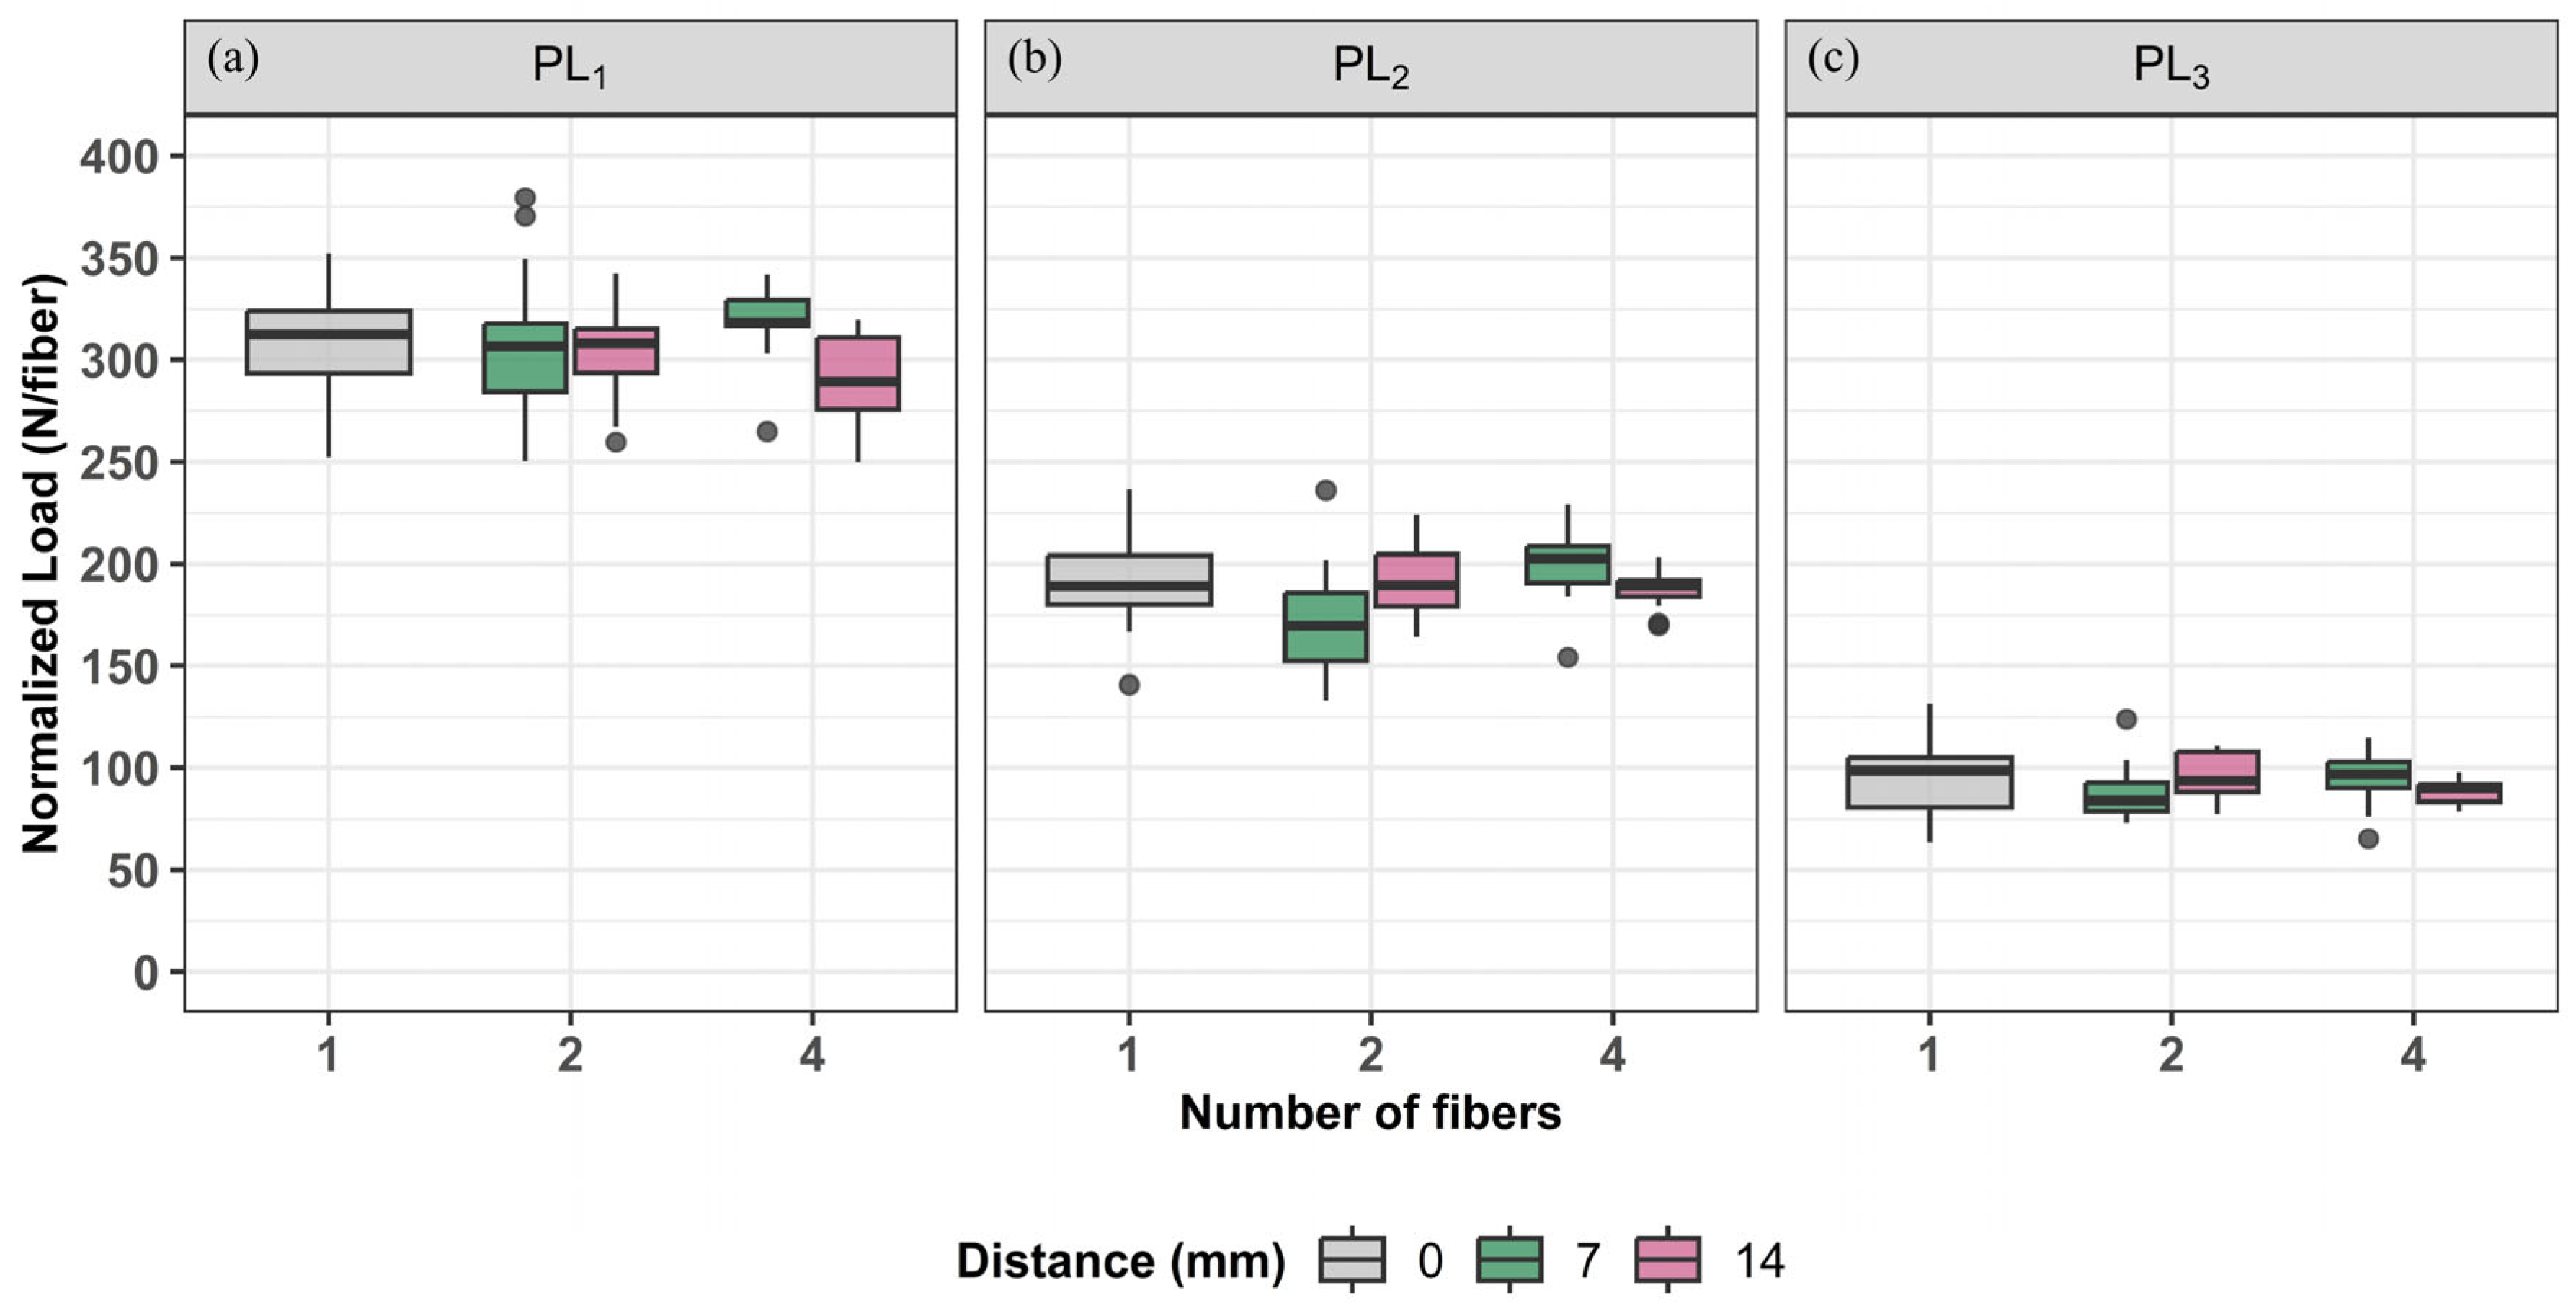
3.2. Influence of Fiber Spacing and Number of Fibers

Figure 7 shows the full spectrum of experimental curves and average curves obtained for each variable. Figure 8 illustrates the pullout load results as a function of the number of fibers and spacing for PL1, PL2, and PL3. The results in terms of PL1, PL2, and PL3 for the F2S7, F2S14, F4S7, and F4S14 groups were not statistically different from the result obtained by the F1S0 group. These results show that the increase in the number of fibers did not influence the pullout results when compared to a single fiber test, independently of fiber of the spacings evaluated in this study (7 mm and 14 mm). Although no statistically significant difference was found, the literature results show a significant pullout load difference for setups with one and four fibers when spacing was lower than 4.25 mm [16,18,30]. Additionally, the increase in the number of fibers reduced the IQR of the results, which means that increasing the number of fibers also reduces the scattering of results. This reduced dispersion with the increased number of fibers is in line with the literature results [16].
The PL1 results obtained in the F4S7 setup were 9.2% greater than those obtained by the F4S14 setup. For PL2, the pullout load results obtained in the F4S7 setup were 8.5% greater than those obtained by the F2S7 setup. Therefore, these results suggest that employing a setup with closely spaced fibers may increase the pullout load. The hypothesis for this occurrence is that the fibers adjacent to the ones being pulled out are acting as reinforcements for the surrounding matrix during the pullout test in closely packed fiber setups. This may occur because the fibers are not commonly mobilized on the same side of the dogbone-shaped specimen, as reported by Mineiro [30]. A few studies in the literature verified that employing a test setup with multiple fibers that are extremely close can interfere in the pullout response [16,18,30]. Hence, the results obtained showed that employing a configuration with multiple fibers and a fiber spacing of 14 mm may mitigate the superposition effects caused by closely packed fibers. This resulted in a more representative response of the actual pullout behavior, while also providing benefits related to the reduced dispersion caused by employing more fibers in the pullout test (see Figure 7).

4. Numerical Analysis

To bridge the gap between experimental tests and predictive simulations in the design process of SFRC, the pullout test results obtained under various configurations, as detailed in the previous sections, were used as input data to define the fiber–matrix interface parameters in a numerical framework. This model was applied to simulate three-point bending tests (3-PBTs), conducted according to EN 14,651 guidelines [31], which serve as an important tool for evaluating and optimizing the structural performance of SFRC elements. The simulation results were then compared to experimental data.
Addressing the challenge of accurately representing fiber–matrix interactions, several numerical models have been proposed in the literature in recent years. Among them, multiscale models with discrete fiber representations stand out for their ability to capture the presence and behavior of steel fibers using various strategies. Such approaches include adapting constitutive models for discrete crack formulations [32], applying forces to a background mesh [33,34], or explicitly representing fibers as linear elements through embedded techniques [19,35,36,37,38]. This latter method is also employed in the numerical simulations in this study.
The multiscale numerical model adopted is based on the framework developed by Bitencourt Jr. et al. [19], previously applied in various research efforts involving simulations of SFRC elements [16,39,40,41]. In this model, the interaction between steel fibers and the cementitious matrix is given through coupling finite elements (CFEs). As illustrated in Figure 9, the concrete is modeled using three-noded triangular finite elements, while the steel fibers are represented as two-noded truss elements. The CFEs are represented as four-noded triangular elements that ensure the compatibility of displacements between these non-matching meshes, enabling the explicit representation of the fiber–matrix interaction, through an appropriate adherence law.
The bond–slip law, which can be derived from experimental pullout data, governs the interaction forces between the fiber nodes and the surrounding matrix elements. The CFE technique introduces an additional coupling node at the interface, enabling the simulation of relative slip while maintaining computational efficiency. This technique avoids introducing unnecessary degrees of freedom, making it possible to analyze structures with a large number of fibers without compromising performance [16,19,39,40].
This model effectively captures the anchorage effects of hooked-end fibers by allowing the bond–slip law to vary along the fiber’s length, as demonstrated by Mineiro et al. [16]. Different bond–slip laws are applied to the central fiber regions and the hooked ends, with the bond stress (τ) assumed to be constant at the interface around a coupling node. The resulting force is influenced by the arithmetic mean of the distances between the evaluated node and its adjacent nodes on the fiber. This calibration accounts for the mechanical anchorage provided by the hooks, which create a mechanical interlock that enhances pullout resistance [4].

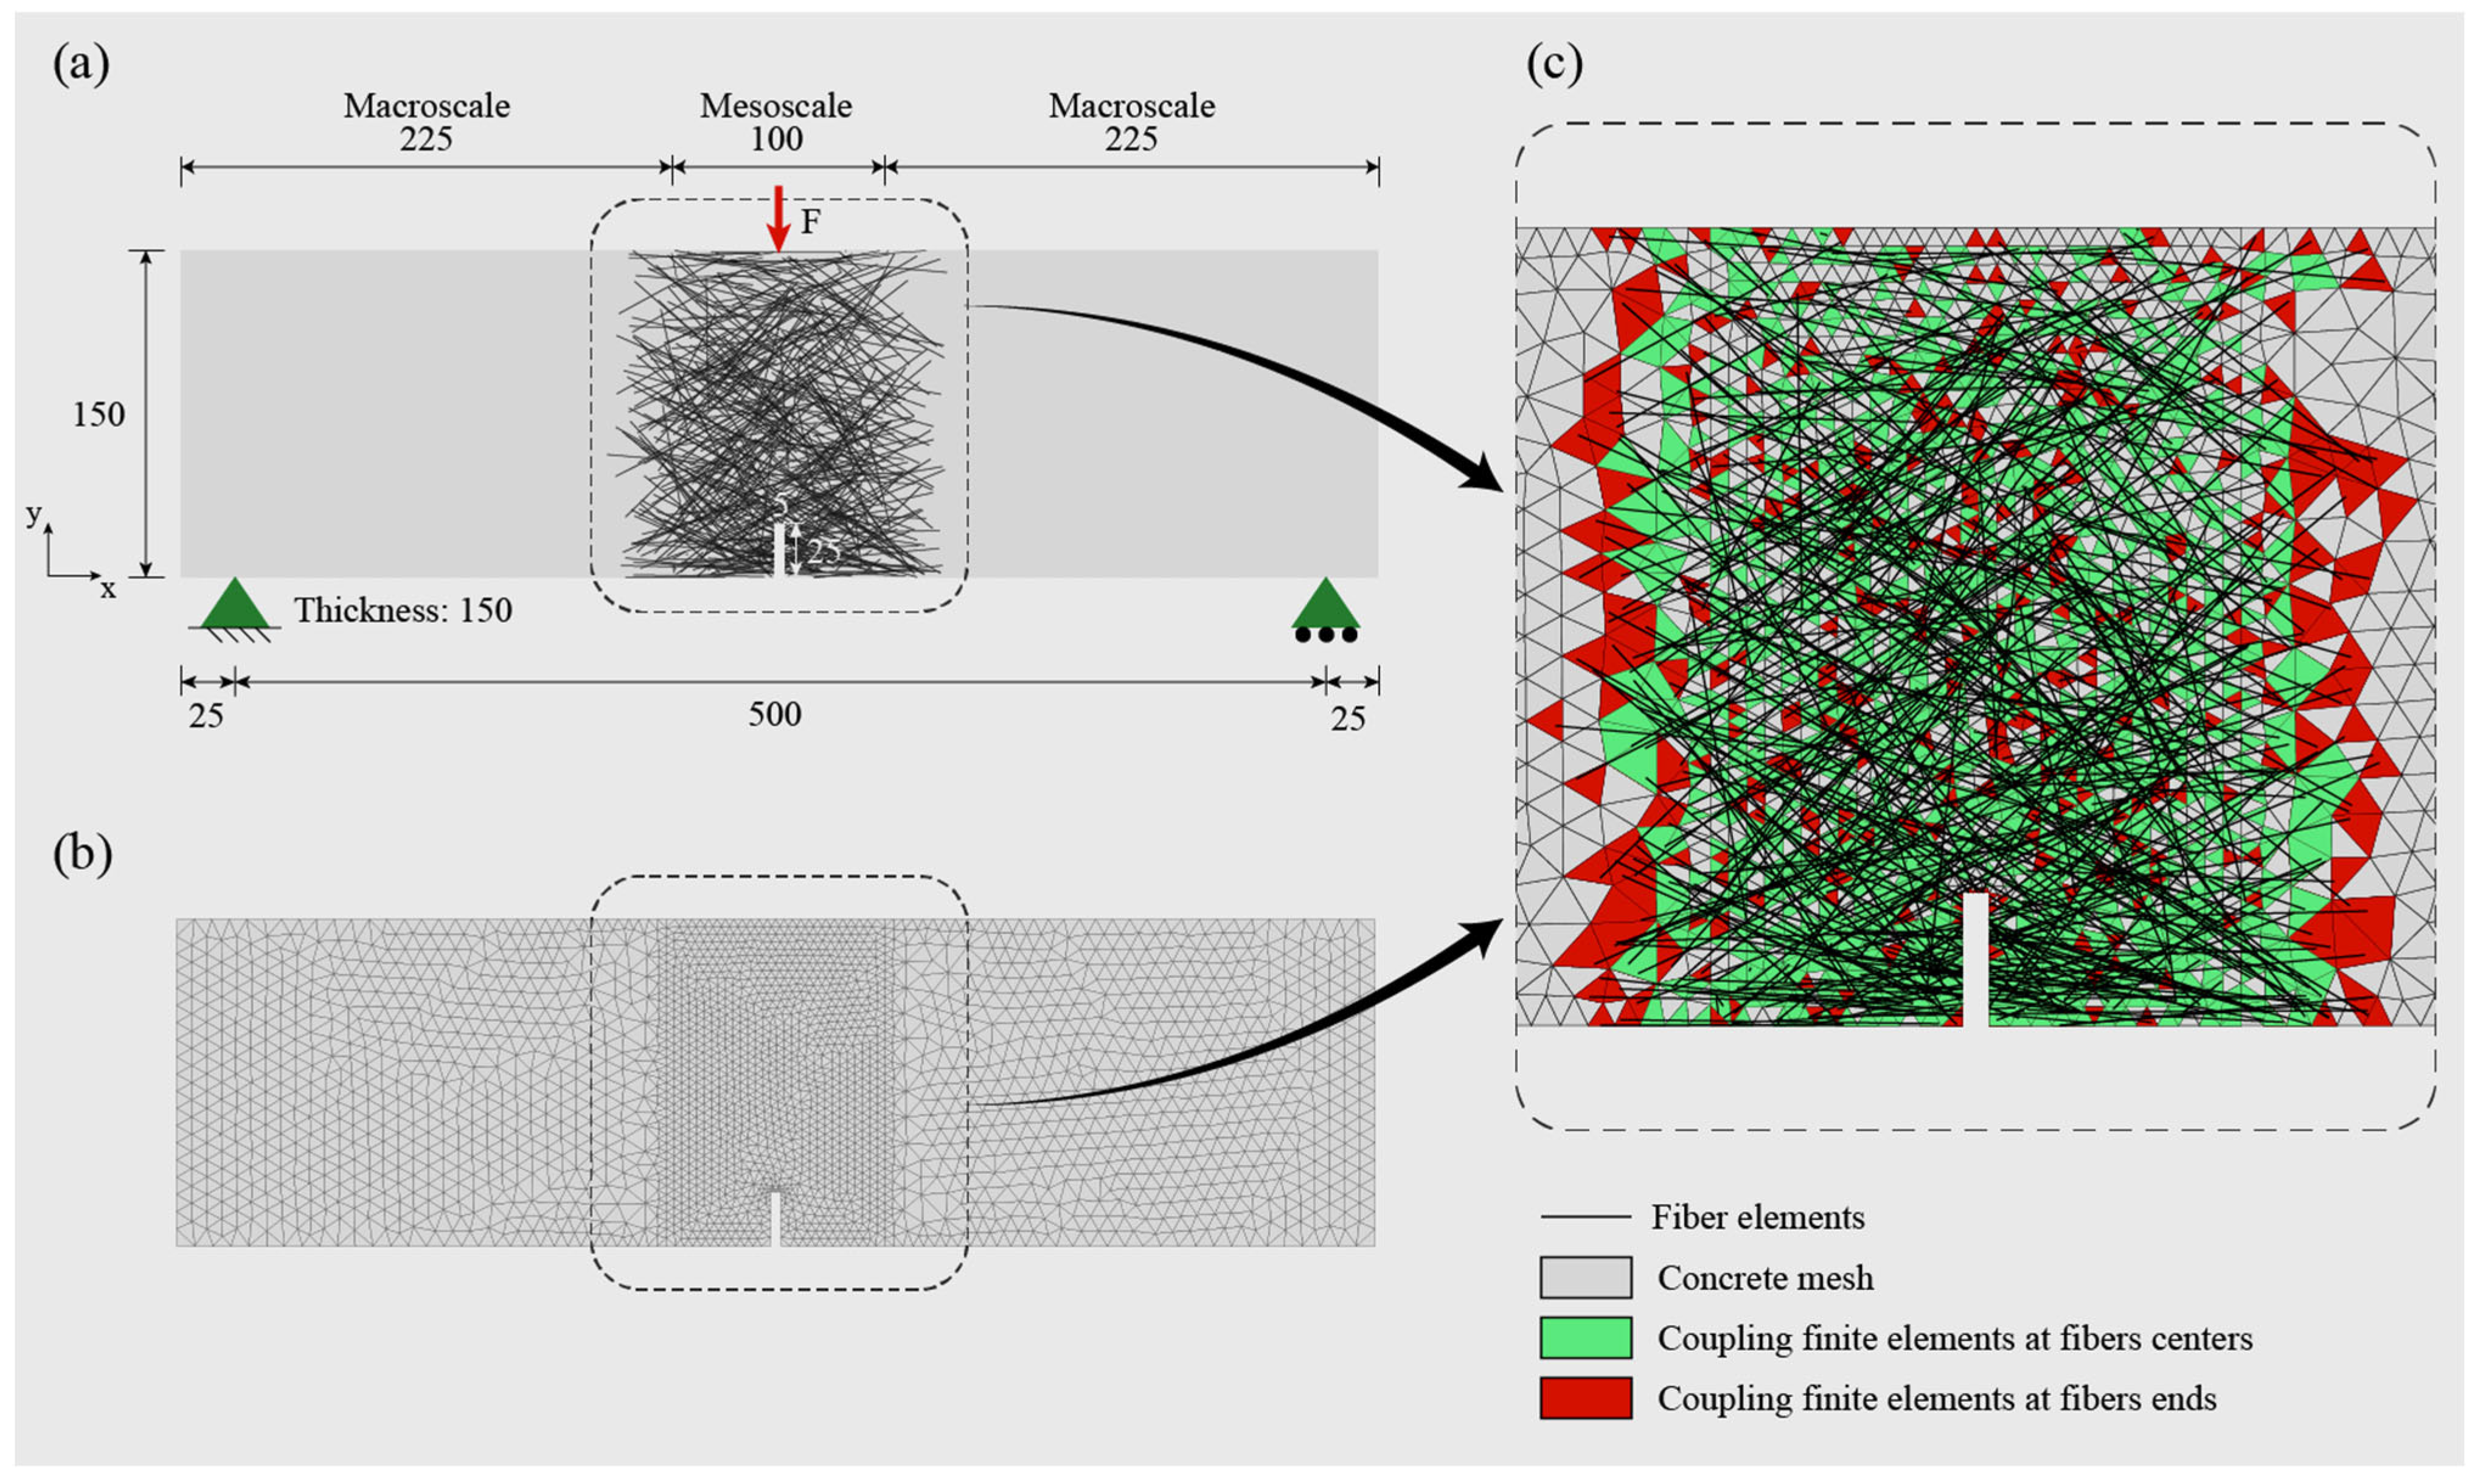
4.1. Three-Point Bending Test Simulations Setups

Figure 10 illustrates the configuration of the simulated three-point bending tests (3-PBTs). Since cracking is certain to occur in the central region of the specimen due to the notch, the simulations are optimized by considering fibers exclusively in this area. Additionally, the matrix mesh in the central region is refined, with triangular elements having a maximum side length of 4 mm to ensure both accurate stress distribution and the presence of distinct coupling finite elements for each fiber node. The simulations are based on experimental tests carried out on four specimens at the Laboratory of Structures and Structural Materials at the University of São Paulo. The tests used a mean fiber dosage of 41.4 kg/m3, corresponding to a volume fraction of 0.53%, and provided key input parameters for the simulations.
Preprocessing steps, including the assignment of geometry and material properties, the setup of boundary conditions, and the generation of meshes, are conducted using GiD 17 software. Fiber distribution is generated in 3D and projected on the plane with an algorithm for multiscale numerical analysis developed by Silva and Bitencourt Jr. [41], which incorporates a non-uniform random distribution that accounts for vertical fiber segregation. Numerical analysis is executed in MATLAB R2024b, where coupling finite elements (CFEs) are implemented to simulate fiber–matrix interactions. The results are then processed and visualized in GiD. Details regarding the number of loading steps, the mesh configurations used, and the number of fibers in the fracture region are presented in Table 5. Each fiber was divided into five truss elements.
The concrete is modeled using the two-variable damage model proposed by Cervera, Oliver, and Manzoli [42], based on Continuum Damage Mechanics Theory. This model captures material degradation due to crack propagation, reducing stiffness and effective resistant area as cracks and voids develop. It accounts for distinct material behaviors under tension and compression, and an implicit–explicit (IMPL-EX) integration scheme is employed to ensure numerical convergence [43]. The mechanical characterization of the concrete is summarized in Table 6, based on the compressive strength obtained from the pullout tests. The remaining material properties were calculated following the recommendations of the fib Model Code 10 [44], including the Young’s modulus, which was adjusted by a reduction factor of 0.9 to better represent the behavior of concrete under service conditions. For compressive parameters, values previously used in mesoscale simulations [16,39] were adopted. The compressive strength measured in the referenced 3-PBTs was 41.4 MPa, within the same range as the values obtained in the pullout tests.
In the model, the fibers are represented by a one-dimensional elastoplastic model. It consists of a linear elastic phase, characterized by a slope equal to the elastic modulus (E_f) in the stress–strain relationship, followed by a phase of permanent plastic deformation that begins once the yield stress (fy) is reached. The behavior in the plastic phase is typically characterized as hardening (H > 0), perfectly plastic (H = 0), or softening (H < 0), as detailed by Simo and Hughes [45]. The geometric characteristics and mechanical properties of the steel fibers are presented in Table 2, provided in Section 2.1.
The fiber–matrix interface employs a three-phase bond–slip model based on the pullout test results for different configurations, considering maximum bond stress (τmax), residual stress (τf), and corresponding slip parameters s1 e s2, following the equation
τ s = τ m a x s s 1 α i f     s s 1 τ m a x τ m a x τ f s s 1 s 2 s 1 i f     s 1 s s 2 τ f i f   s s 2
The bond stresses are determined by dividing the pullout load by the surface area of the fiber in contact with the concrete. The parameters used in the analysis are presented in Table 7, considering the influence area of the hooked-end regions. For this central part, where the adherence is governed mainly by friction, the values were based on those reported for smooth fibers by Mineiro et al. [16]. The slip values at the fiber ends discount the slip already accounted for at the peak in the central region, and the s1 parameter is adjusted to half of s1 to more accurately represent fiber detachment occurring prior to concrete cracking, which is also conducted in the literature [5].
Considering the significant influence of fiber orientation on the performance of SFRCC members, the results of complementary inductive tests conducted on cube-shaped specimens are also included in the analysis. These tests, utilizing circular coils connected to an Agilent 4263B LCR meter, provide essential data on fiber orientation, presented in Table 8, where Ci represents the relative fiber contribution along each axis (x, y, or z). The parameters are calculated based on the formulation developed by Cavalaro et al. [46], and the data reveal that the fiber contribution in the horizontal direction (x-axis) is significantly higher than in the other directions. This fiber distribution is incorporated into the simulations to ensure an accurate representation.

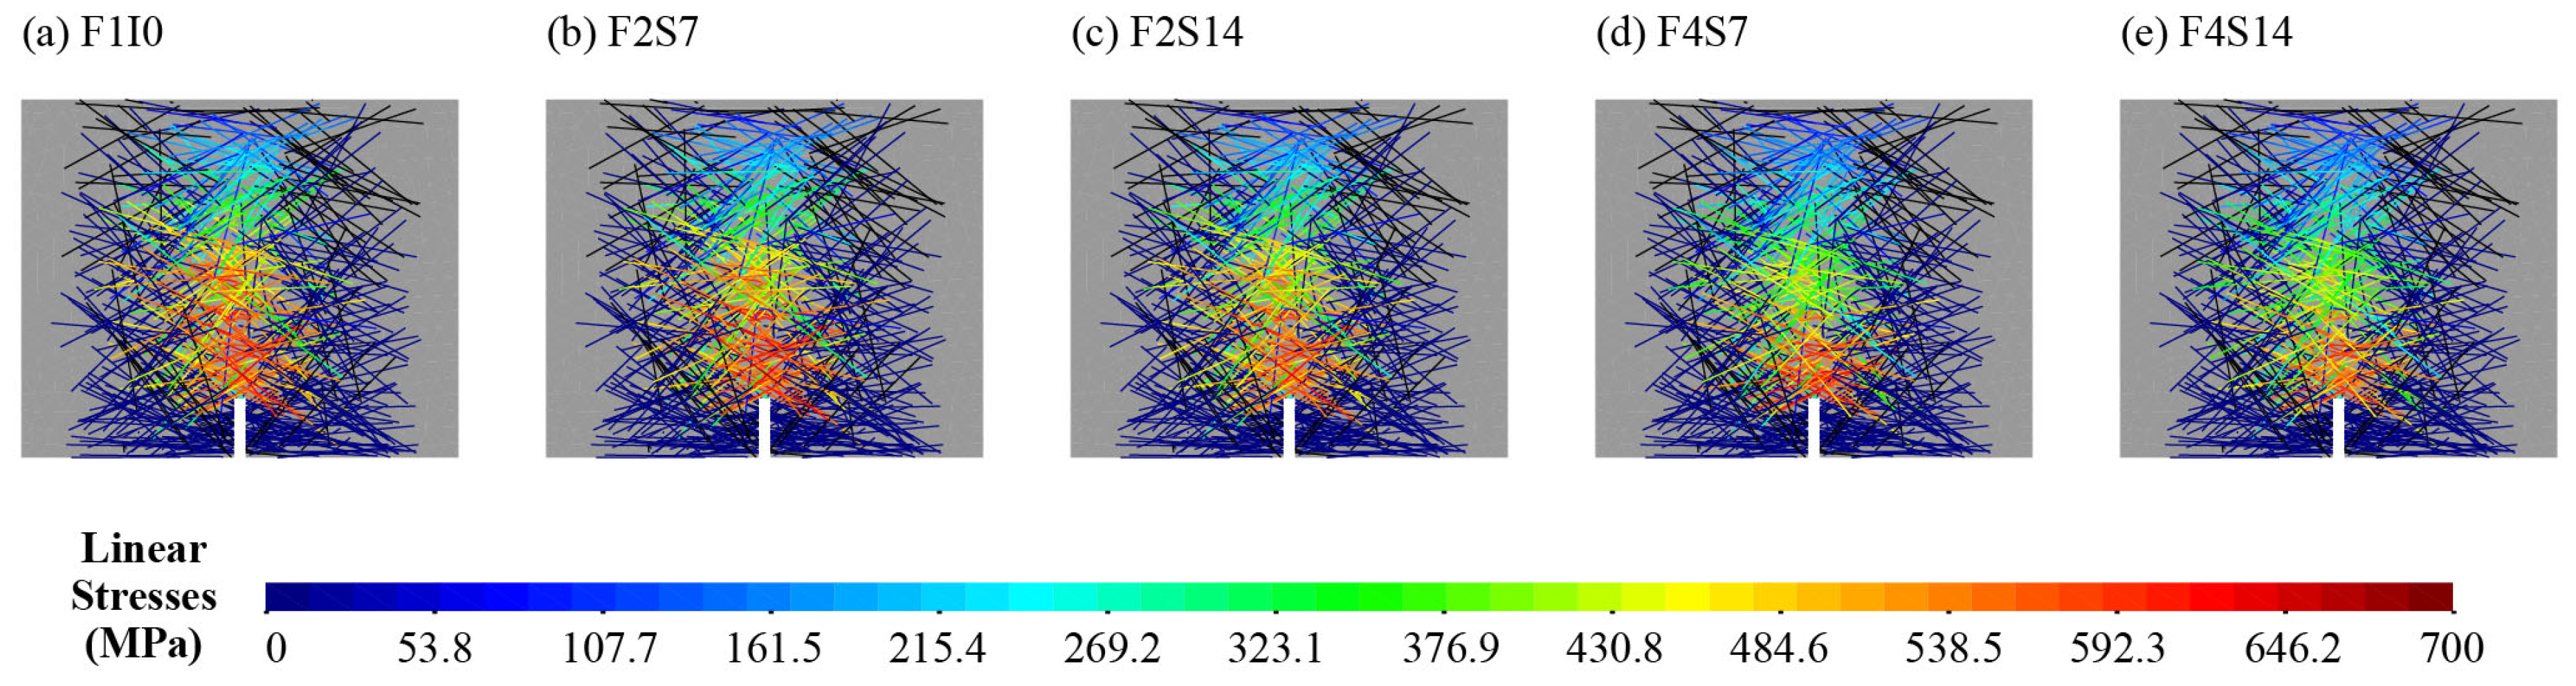
4.2. Mesoscale Simulation Analysis

Figure 11 displays the load versus crack mouth opening displacement (CMOD) curves from the simulations using different interface inputs, compared to the laboratory tests. Although the peak and residual pullout loads were similar for the different setups, the slip values at which these loads occur influenced the structural response in the 3-PBTs.
As observed, the highest post-cracking loads were obtained for the bond–slip law based on the pullout test results of F1I0, while the lowest post-cracking loads corresponded to the parameters of F4S14. Regarding the peak pullout load (i.e., PL1), the F4S7 group presented the highest value; however, this was not reflected in the post-cracking behavior of the 3-PBTs. The results indicate a stronger correlation with the residual pullout load PL3 than with the peak pullout loads discussed in Section 3.2, as F1I0 also exhibited the highest residual pullout load, while F4S14 showed the lowest. Still, pullout loads are not the only factors to consider. For instance, F4S7 presented the second-highest residual pullout load, but it led to the second-lowest post-cracking load in the 3-PBT simulations. The responses suggest that the slip parameter also has a substantial effect on the structural behavior.
The parameters fL, fR1, and fR3, defined in the EN 14,651 standard [31], represent specific load values that are used to characterize the post-cracking behavior of SFRC in terms of residual flexural tensile strength. In the simulations, the variables fL and fR3, respectively, associated with the limit of proportionality and a CMOD of 2.5 mm, were closely aligned to the experimental range of values for all interface configurations. The variation in fR3 loads obtained through simulations was 12% between the highest and lowest results, compared to 20% in the experimental tests. However, fR1, corresponding to a CMOD of 0.5 mm, did not behave as expected. This difference appears to originate from how fiber slippage is initiated in the simulations, and one of the possible reasons for the delayed rise in the load vs. CMOD curve after cracking is the limited accuracy in capturing fiber slippage during the pullout tests.
The stresses in the fiber elements for a CMOD of 2.5 mm are presented in Figure 12 for the different bond–slip relations. The highest stresses are attained in the simulations using the F2S7 interface parameters, reaching 673.18 MPa. In contrast, the lowest values are observed for the F4S14 interface parameters, with a maximum of 630.13 MPa. The stress distributions for F1I0, F2S14, and F4S7 were very similar, with the maximum level differing by less than 1%.
The Results and Discussion show the notable effects of the interface parameters in the stress distribution and post-cracking behavior of SFRC elements. Nevertheless, most parts of the load vs. CMOD curves from the different simulations remained within the envelope of the experimental data, indicating that all the bond–slip laws derived from the pullout tests are applicable. The discrepancies observed for the fR1 parameter, however, highlight the need for further calibration and adjustment in the laboratory tests and numerical model, especially in portraying fiber slippage and the initiation of residual resistance. This refining could increase the model reliability and accuracy in predicting post-cracking behavior, contributing to a more effective parametrization of SFRC elements for engineering applications and reducing the need for extensive experimental tests.
The experimental and numerical findings of this study provide a comprehensive understanding of the bond–slip behavior of hooked-end steel fibers in cementitious matrices, particularly under varying test configurations. The results align with and expand upon previous research, while addressing gaps in the literature regarding the combined effects of fiber quantity, inclination, and spacing. This section discusses the implications of the findings, compares them with existing studies, identifies limitations, and elaborates on the practical applications of the validated numerical model for the construction industry.

5. Discussion

The influence of fiber inclination on pullout behavior observed in this study is consistent with findings from Cunha et al. [12] and Lee, Kang, and Kim [13], who reported increased pullout loads for inclined fibers, with maximum performance at 30° inclination. However, this study extends these findings by demonstrating that the influence of inclination diminishes at higher pullout stages (e.g., PL3), where kinetic friction dominates. This observation underscores the importance of considering the entire pullout process rather than focusing solely on peak loads.
Regarding fiber spacing and quantity, the results contrast with some previous studies. For instance, Mineiro et al. [16] observed a 39% increase in pullout load for configurations with four fibers compared to single-fiber setups, while Kim and Yoo [18] reported a 30% reduction in pullout properties for multiple fibers in ultra-high-performance concrete (UHPC). In this study, no statistically significant differences were found between single-fiber and multiple-fiber setups, suggesting that fiber spacing and matrix properties play a critical role in determining pullout behavior. It is important to note that the fiber spacings employed in this study (7 mm and 14 mm) are more representative of conventional concrete applications, whereas ultra-high-performance concrete (UHPC) typically utilizes significantly smaller fiber spacings due to its denser matrix and enhanced mechanical properties. The reduced variability in results with increased fiber count, however, aligns with Mineiro et al. [16], highlighting the benefits of using multiple fibers for more consistent experimental outcomes.
The numerical simulations further validate the applicability of bond–slip laws derived from pullout tests in predicting the post-cracking behavior of SFRC elements. While the load–CMOD curves from simulations generally fall within the experimental envelope, discrepancies in the fR1 parameter suggest that early-stage fiber slippage is not fully captured by the current model. This limitation highlights the need for further refinement in both experimental and numerical approaches to better represent the initiation of residual resistance.
Regarding the practical applications and industry implications, the validated numerical model developed in this study represents a significant advancement in the simulation of SFRC structural behavior. By accurately capturing fiber–matrix interactions and post-cracking performance, the model can be employed to simulate the structural behavior of SFRC elements in practice, such as beams, slabs, pavements, and tunnel linings. This capability has profound implications for the construction industry, as it can significantly reduce the costs associated with extensive experimental campaigns. For instance, engineers can use the model to optimize fiber content, distribution, and orientation for specific applications, minimizing material waste and ensuring structural performance without the need for repetitive physical testing.
The model’s ability to simulate three-point bending tests (3-PBTs) and predict post-cracking parameters (e.g., fR1, fR3) provides a powerful tool for designing SFRC elements in compliance with international standards [44]. This is particularly relevant for infrastructure projects where SFRC is used as a replacement for traditional reinforced concrete, such as in precast elements, industrial floors, and sanitary pipes. By reducing reliance on experimental testing, the model can accelerate the design process, enabling faster project delivery and cost savings. Furthermore, the model can be adapted to simulate more complex structural systems, which makes it a valuable resource for engineers and researchers seeking to explore innovative applications of SFRC in modern construction. For example, the model could be used to evaluate the performance of SFRC in extreme loading conditions, such as blast or impact scenarios, where experimental testing is often impractical or prohibitively expensive.
The integration of the numerical model into engineering practice also opens new possibilities for parametric studies and optimization. By varying input parameters such as fiber type, matrix composition, and loading conditions, engineers can identify optimal configurations for specific applications, enhancing both performance and cost-effectiveness. Additionally, the model can be coupled with machine learning algorithms to further refine predictions and automate the design process, paving the way for data-driven decision-making in the construction industry.
To achieve this goal, future research should focus on expanding the experimental program to include a wider range of fiber types, matrix compositions, and loading conditions. Investigating the long-term performance of SFRC under cyclic and environmental loads would provide valuable insights for durability-based design. Additionally, refining the numerical model to better capture early-stage fiber slippage and incorporating advanced techniques such as machine learning for parameter optimization could enhance its predictive accuracy and applicability.

6. Conclusions

This study aimed to assess the influence of test configuration on the pullout response of hooked-end steel fibers and analyze how variations in test configuration affect the outcomes of numerical simulations. Based on the experimental and numerical analyses conducted, the following conclusions can be drawn:
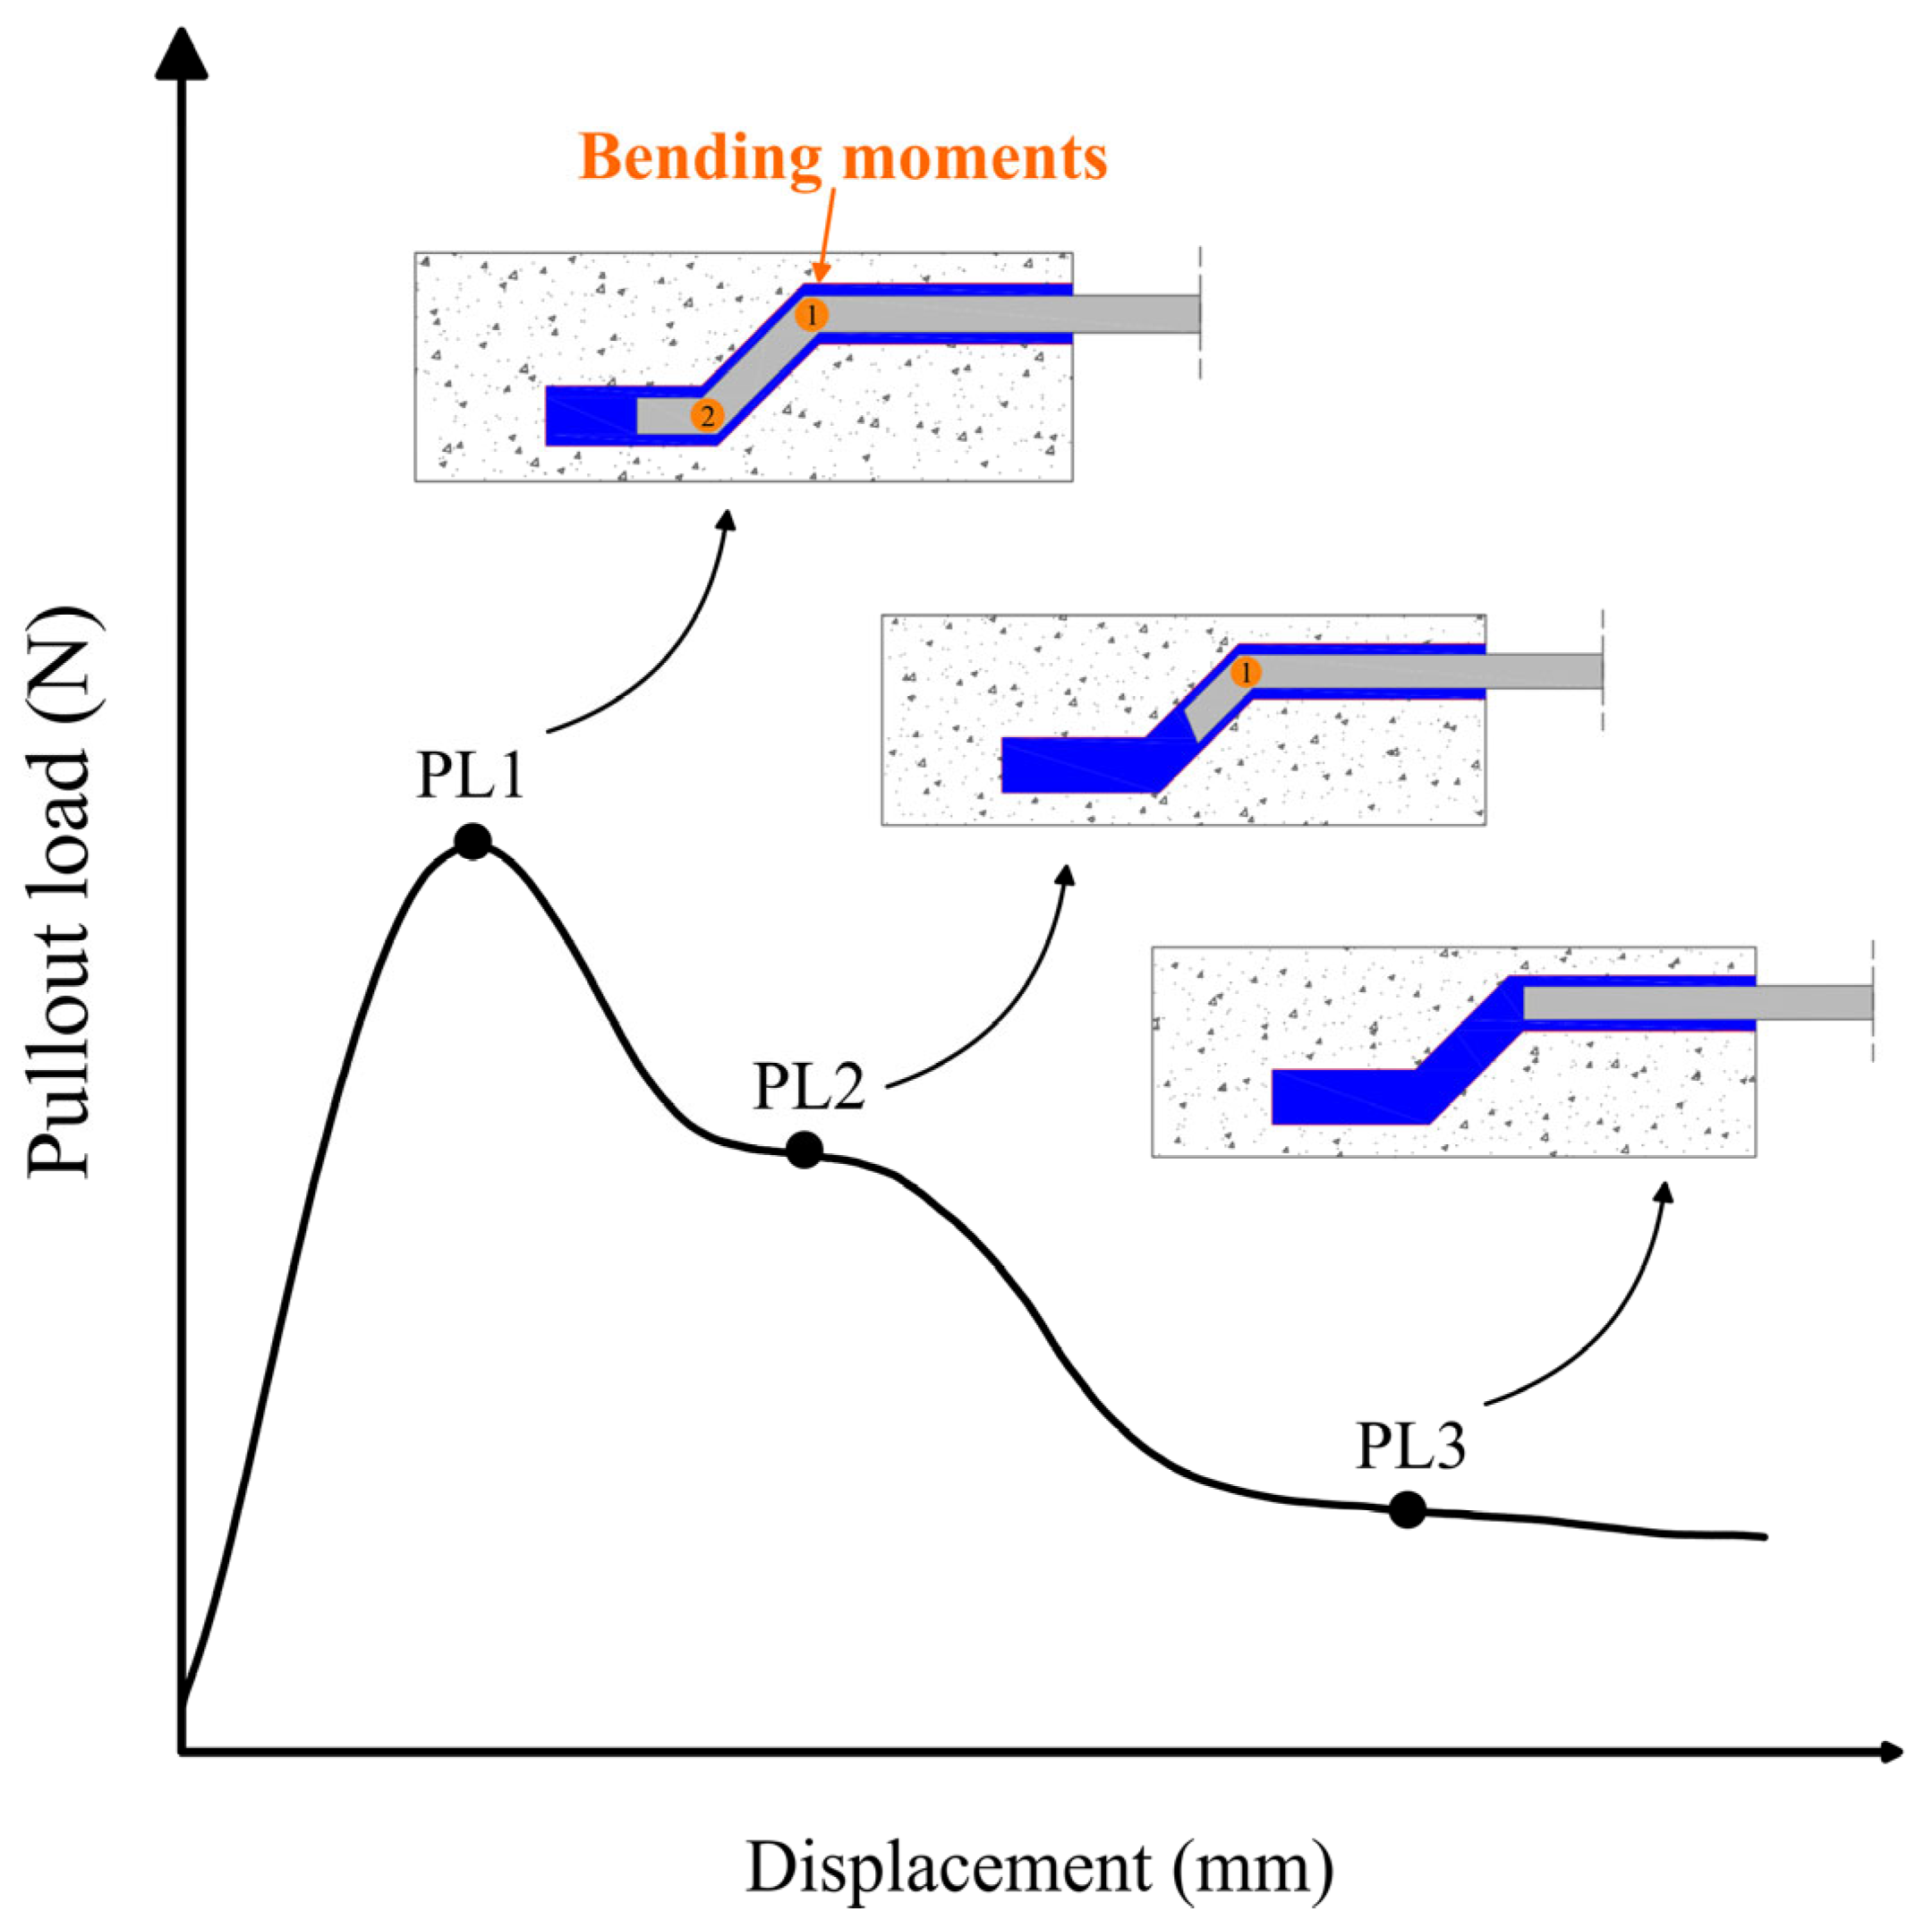
  • The pullout loads for parameters PL1 and PL2 exhibited a clear and direct increase with fiber inclination, whereas the changes observed for PL3 were not statistically significant with varying fiber angles. This suggests that the influence of fiber inclination becomes less pronounced at higher stages of pullout, where kinetic friction predominates. At 30° inclination, approximately 21% of the test specimens experienced fiber rupture before the completion of pullout, suggesting that the stress generated during pullout exceeded the tensile strength of the fibers for higher inclinations.
  • For setups with varying fiber numbers and spacings (F2S7, F2S14, F4S7, F4S14), no significant differences were observed in pullout loads for PL1, PL2, and PL3 compared to the single-fiber setup (F1S0), indicating that fiber count does not notably affect pullout behavior. However, higher fiber counts reduced the interquartile range (IQR), suggesting less variability. The F4S7 setup, with closer fiber spacing, showed higher pullout loads for PL1 and PL2 than F4S14 (p < 0.05), implying that closely spaced fibers may enhance load transfer by reinforcing the surrounding matrix during the pullout process.
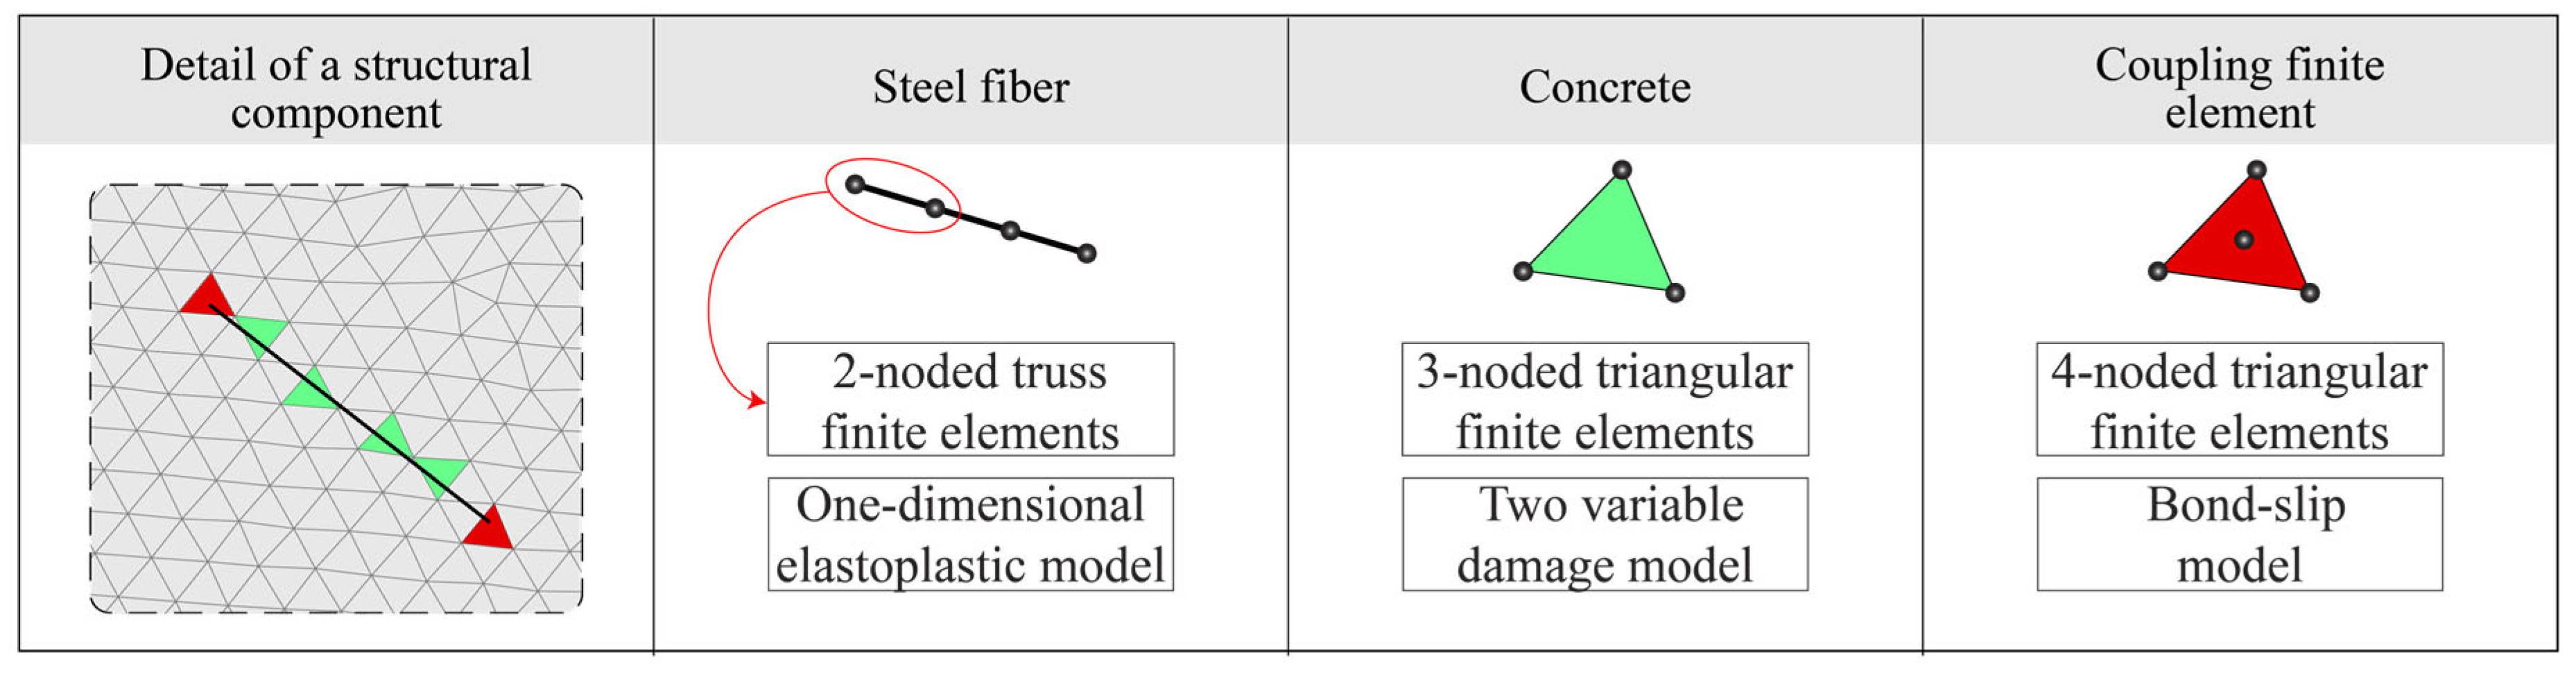
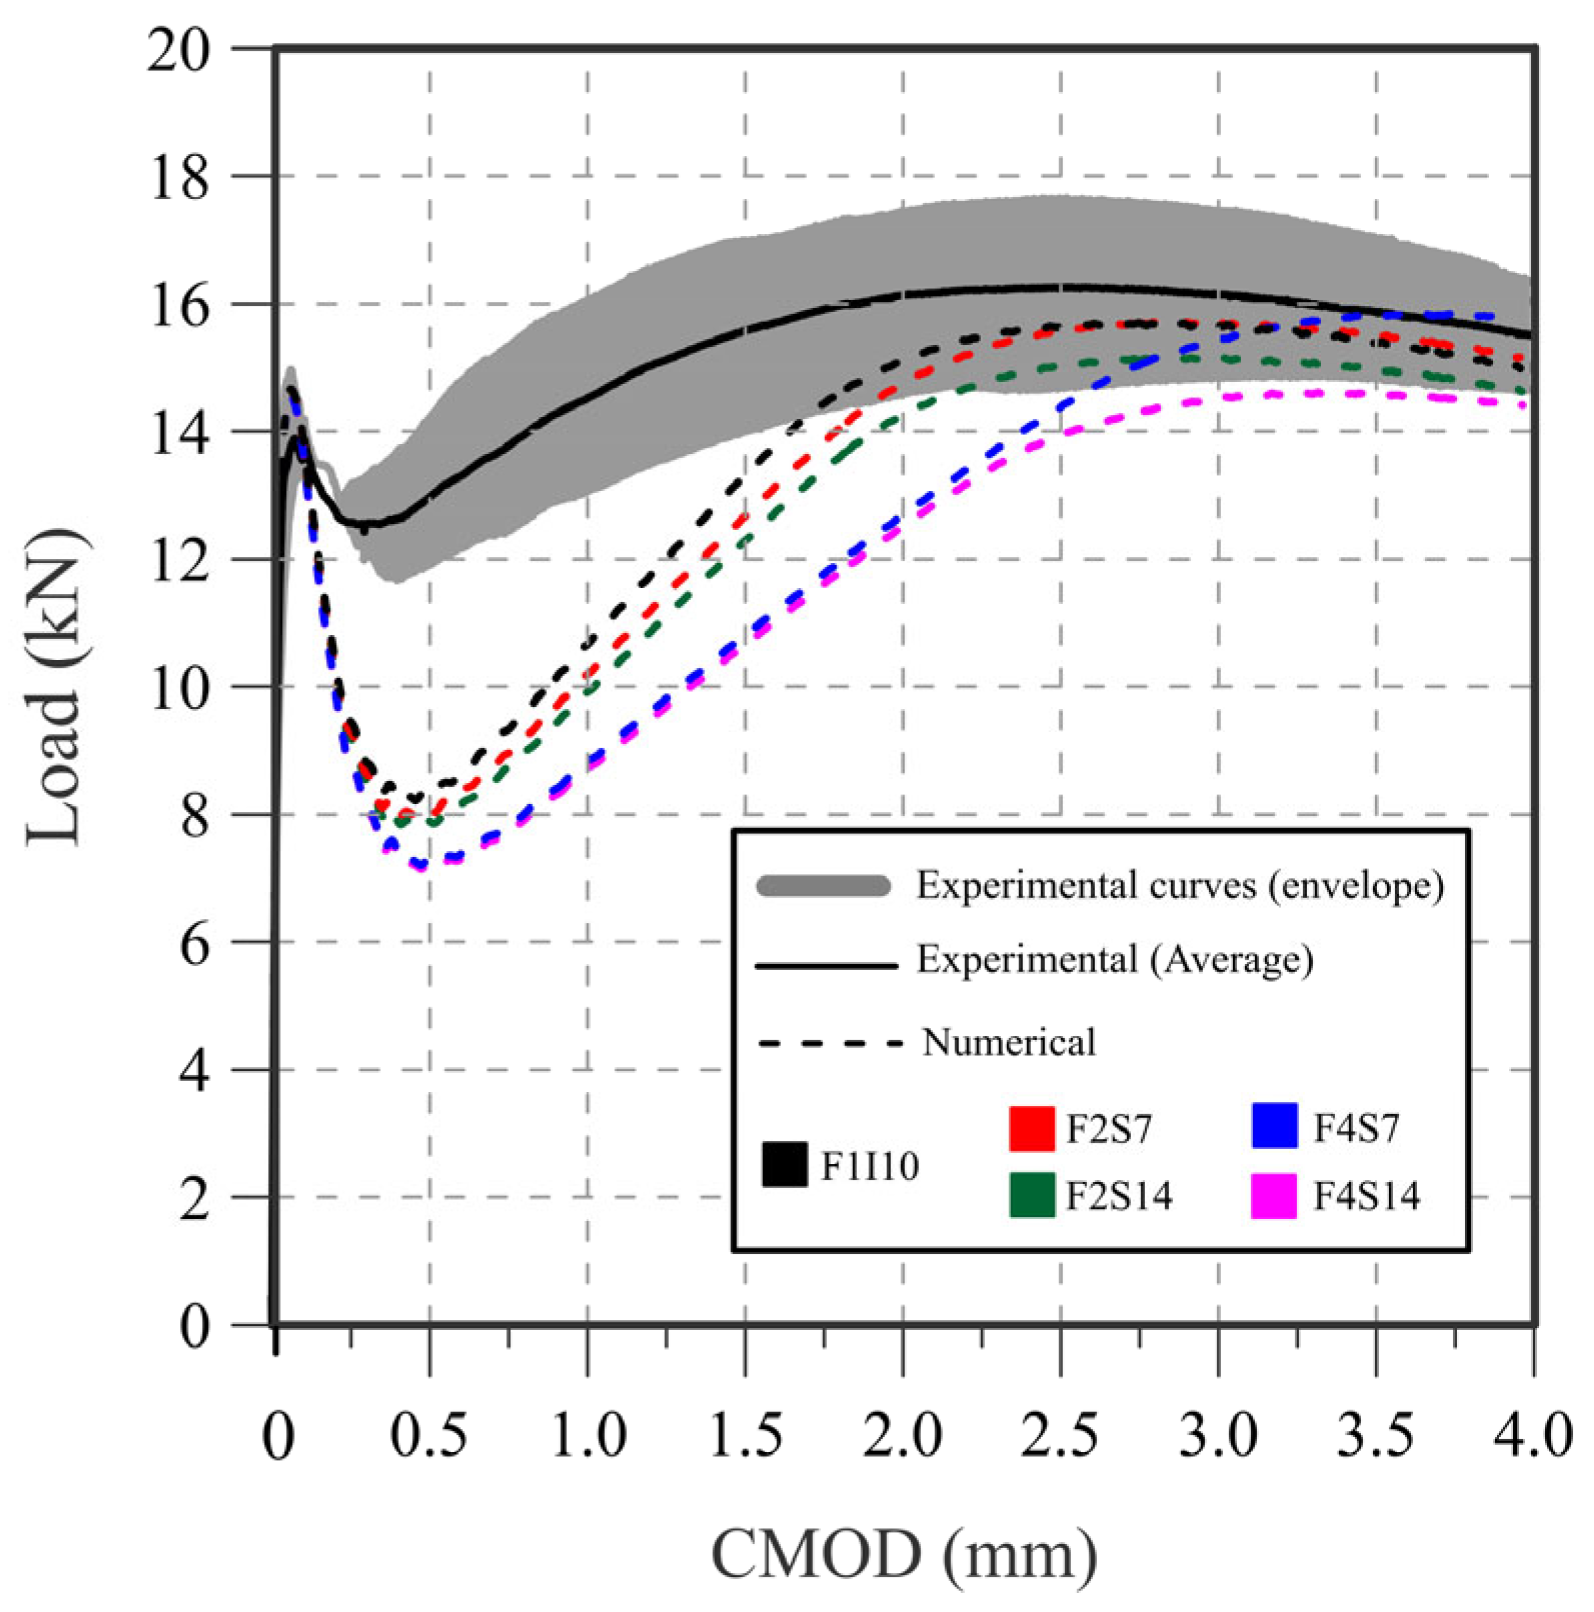
  • The pullout test results were used to calibrate a multiscale numerical model simulating fiber–matrix interactions in three-point bending tests (3-PBTs). The model effectively captured the anchorage effects of hooked-end fibers, with simulation results generally matching experimental data. The post-cracking load response was influenced by bond–slip law parameters from pullout tests. While the overall load–displacement behavior was consistent, discrepancies in the fR1 parameter highlighted the need for model refinement, particularly in capturing fiber slippage early in cracking. In terms of the fR3 parameter, the numerical results seemed consistent with the average experimental curves.
Therefore, this study enhances our understanding of factors affecting the pullout response of hooked-end steel fibers, such as fiber inclination, spacing, and count. The developed numerical model offers insights into fiber–matrix interactions but requires further refinement, especially in capturing fiber slippage. The findings emphasize the importance of test configuration for reliable data in SFRC design. Future research should focus on refining numerical models and exploring fiber orientation effects in more complex structural scenarios.

Author Contributions

J.S.M.: conceptualization, investigation, formal analysis, data curation, writing—original draft, writing—review and editing, and visualization; R.S.: conceptualization, investigation, formal analysis, resources, writing—original draft, writing—review and editing, supervision, project administration, and funding acquisition; M.L.R.M.: methodology, software, formal analysis support, writing—original draft, and writing—review and editing; A.M.B.: investigation, validation, and writing—review and editing; R.R.A.: formal analysis support, writing—review and editing, and funding acquisition. All authors have read and agreed to the published version of the manuscript.

Funding

This study was supported by the São Paulo Research Foundation (FAPESP) under grant #2022/14045-5 (Ramoel Serafini).

Data Availability Statement

The raw data supporting the conclusions of this article will be made available by the authors on request.

Acknowledgments

The authors express their gratitude to the University of São Paulo, São Judas Tadeu University, and Ânima Institute for their institutional support. Special thanks are extended to MSc. Tiago H. Marum for the valuable technical discussions regarding statistical analysis.

Conflicts of Interest

Ronney Rodrigues Agra was employed by the company THM Statistical Consulting. The remaining authors declare that the research was conducted in the absence of any commercial or financial relationships that could be construed as a potential conflict of interest.

References

  1. di Prisco, M.; Plizzari, G.; Vandewalle, L. Fibre Reinforced Concrete: New Design Perspectives. Mater. Struct. 2009, 42, 1261–1281. [Google Scholar] [CrossRef]
  2. de la Fuente, A.; Blanco, A.; Armengou, J.; Aguado, A. Sustainability Based-Approach to Determine the Concrete Type and Reinforcement Configuration of TBM Tunnels Linings. Case Study: Extension Line to Barcelona Airport T1. Tunn. Undergr. Space Technol. 2017, 61, 179–188. [Google Scholar] [CrossRef]
  3. dos Anjos Coronel, S.; Serafini, R.; Rambo, D.A.S.; Salvador, R.P.; Bitencourt, L.A.G. Effect of DEWS Test Simplification on the Design Post-Crack Parameters of Steel Fiber Reinforced Concrete with Different Fiber Contents. Constr. Build. Mater. 2025, 470, 140584. [Google Scholar] [CrossRef]
  4. Abdallah, S.; Fan, M.; Rees, D.W.A. Bonding Mechanisms and Strength of Steel Fiber–Reinforced Cementitious Composites: Overview. J. Mater. Civ. Eng. 2018, 30, 04018001. [Google Scholar] [CrossRef]
  5. Serafini, R.; Agra, R.R.; Bitencourt, L.A.G.; de la Fuente, A.; de Figueiredo, A.D. Bond-Slip Response of Steel Fibers after Exposure to Elevated Temperatures: Experimental Program and Design-Oriented Constitutive Equation. Compos. Struct. 2021, 255, 112916. [Google Scholar] [CrossRef]
  6. Naaman, A.E.; Najm, H. Bond-Slip Mechanisms of Steel Fibers in Concrete. ACI Mater. J. 1991, 88, 135–145. [Google Scholar]
  7. de Figueiredo, A.D.; Monte, R.; Bitencourt, L.A.G., Jr. Concreto Com Fibras. In Concreto: Ciência e Tecnologia; Tutikian, B., Pacheco, F., Isaía, G., Battagi, I., Eds.; Arte Interativa: São Paulo, Brazil, 2022; Volume II, pp. 1523–1560. [Google Scholar]
  8. Federation Internationale du Beton. Model Code for Concrete Structures 2010; Ernst & Sohn: Berlin, Germany, 2013; p. 434. ISBN 978-3-433-03061-5. [Google Scholar]
  9. ABNT NBR 16935; Projeto de Estruturas de Concreto Reforçado Com Fibras—Procedimento. Brazilian National Standards Organization: Rio de Janeiro, Brazil, 2021.
  10. Bentur, A.; Mindess, S. Fibre Reinforced Cementitious Composites, 2nd ed.; Bentur, A., Mindess, S., Eds.; Taylor & Francis: New York, NY, USA, 2007. [Google Scholar]
  11. Wille, K.; Naaman, A.E. Pullout Behavior of High-Strength Steel Fibers Embedded in Ultra-High-Performance Concrete. ACI Mater. J. 2012, 109, 479–488. [Google Scholar] [CrossRef]
  12. Cunha, V.M.C.F.; Barros, J.A.O.; Sena-Cruz, J.M. Pullout Behavior of Steel Fibers in Self-Compacting Concrete. J. Mater. Civ. Eng. 2010, 22, 1–9. [Google Scholar] [CrossRef]
  13. Lee, Y.; Kang, S.T.; Kim, J.K. Pullout Behavior of Inclined Steel Fiber in an Ultra-High Strength Cementitious Matrix. Constr. Build. Mater. 2010, 24, 2030–2041. [Google Scholar] [CrossRef]
  14. Abdallah, S.; Fan, M.; Cashell, K.A. Bond-Slip Behaviour of Steel Fibres in Concrete after Exposure to Elevated Temperatures. Constr. Build. Mater. 2017, 140, 542–551. [Google Scholar] [CrossRef]
  15. Naaman, A.E. Fiber Reinforced Concrete: Five Decades of Progress. In Proceedings of the 4th Brazilian Conference on Composite Materials, Rio de Janeiro, Brazil, 22–25 July 2018; pp. 35–56. [Google Scholar]
  16. Mineiro, M.L.R.; Monte, R.; Manzoli, O.L.; Bitencourt, L.A.G. An Integrated Experimental and Multiscale Numerical Methodology for Modeling Pullout of Hooked-End Steel Fiber from Cementitious Matrix. Constr. Build. Mater. 2022, 344, 128215. [Google Scholar] [CrossRef]
  17. Feng, H.; Sheikh, M.N.; Hadi, M.N.S.; Feng, L.; Gao, D.; Zhao, J. Pullout Behaviour of Different Types of Steel Fibres Embedded in Magnesium Phosphate Cementitious Matrix. Int. J. Concr. Struct. Mater. 2019, 13, 33. [Google Scholar] [CrossRef]
  18. Kim, J.-J.; Yoo, D.-Y. Effects of Fiber Shape and Distance on the Pullout Behavior of Steel Fibers Embedded in Ultra-High-Performance Concrete. Cem. Concr. Compos. 2019, 103, 213–223. [Google Scholar] [CrossRef]
  19. Bitencourt, L.A.G.; Manzoli, O.L.; Bittencourt, T.N.; Vecchio, F.J. Numerical Modeling of Steel Fiber Reinforced Concrete with a Discrete and Explicit Representation of Steel Fibers. Int. J. Solids Struct. 2019, 159, 171–190. [Google Scholar] [CrossRef]
  20. Serafini, R.; Santos, F.P.; Agra, R.R.; De la Fuente, A.; Figueiredo, A.D. de Effect of Specimen Shape on the Compressive Parameters of Steel Fiber Reinforced Concrete after Temperature Exposure. J. Urban Technol. Sustain. 2018, 1, 10–20. [Google Scholar] [CrossRef]
  21. Agra, R.R.; Serafini, R.; de Figueiredo, A.D. Effect of High Temperature on the Mechanical Properties of Concrete Reinforced with Different Fiber Contents. Constr. Build. Mater. 2021, 301, 124242. [Google Scholar] [CrossRef]
  22. Serafini, R.; de La Fuente, A.; de Figueiredo, A.D. Assessment of the Post-Fire Residual Bearing Capacity of FRC and Hybrid RC-FRC Tunnel Sections Considering Thermal Spalling. Mater. Struct. 2021, 54, 219. [Google Scholar] [CrossRef]
  23. Dantas, S.R.A.; Serafini, R.; de Oliveira Romano, R.C.; Vittorino, F.; Loh, K. Influence of Polypropylene Microfibers (PPMF) Dispersion Procedure on Fresh and Hardened Rendering Mortar Properties. Ambiente Construído 2020, 20, 7–23. [Google Scholar] [CrossRef]
  24. de la Fuente, A.; Pujadas, P.; Blanco, A.; Aguado, A. Experiences in Barcelona with the Use of Fibres in Segmental Linings. Tunn. Undergr. Space Technol. 2012, 27, 60–71. [Google Scholar] [CrossRef]
  25. Abdallah, S.M. Bonding Mechanisms and Strength of Hooked-End Steel Fibre Reinforced Cementitious Composites. Ph.D. Thesis, Brunel University London, London, UK, 2017. [Google Scholar]
  26. Bussab, W.; Morettin, P.A. Estatística Básica; Saraivauni, Ed.; Saraivauni: São Paulo, Brazil, 2017; ISBN 9788547220228. [Google Scholar]
  27. Kruskal, W.H.; Wallis, W.A. Use of Ranks in One-Criterion Variance Analysis. J. Am. Stat. Assoc. 1952, 47, 583–621. [Google Scholar] [CrossRef]
  28. Nemenyi, P. Distribution-Free Multiple Comparisons; Princeton University: Princeton, NJ, USA, 1963. [Google Scholar]
  29. Li, H.; Liu, F.; Li, Y.; Li, X.; Pan, Y.; Liu, C. Effects of Fiber Spacing and Inclination on the Pull-out Behaviors of Arc-Shaped Fibers in Brittle SIFCON Matrix. Constr. Build. Mater. 2024, 419, 135381. [Google Scholar] [CrossRef]
  30. Mineiro, M.L.R. Comportamento Ao Arrancamento de Fibras de Aço: Ensaios Experimentais, Previsões Analíticas e Modelagem Numérica. Master’s Thesis, Universidade de São Paulo, São Paulo, Brazil, 2022. [Google Scholar]
  31. EN 14651; Test Method for Metallic Fibred Concrete—Measuring the Flexural Tensile Strength (Limit of Proportionality (LOP), Residual). British Standards Institution: London, UK, 2007; p. 19. [CrossRef]
  32. Etse, G.; Caggiano, A.; Vrech, S. Multiscale Failure Analysis of Fiber Reinforced Concrete Based on a Discrete Crack Model. Int. J. Fract. 2012, 178, 131–146. [Google Scholar] [CrossRef]
  33. Radtke, F.K.F.; Simone, A.; Sluys, L.J. A Partition of Unity Finite Element Method for Simulating Non-linear Debonding and Matrix Failure in Thin Fibre Composites. Int. J. Numer. Methods Eng. 2011, 86, 453–476. [Google Scholar] [CrossRef]
  34. Radtke, F.K.F.; Simone, A.; Sluys, L.J. A Computational Model for Failure Analysis of Fibre Reinforced Concrete with Discrete Treatment of Fibres. Eng. Fract. Mech. 2010, 77, 597–620. [Google Scholar] [CrossRef]
  35. Buttignol, T.E.T.; dos Santos, A.C.; Bitencourt, L.A.G. 3D DEWS Digital Parametric Modeling and Manufacturing for Obtaining the Post-Cracking Parameters of SFRC. Constr. Build. Mater. 2024, 428, 136326. [Google Scholar] [CrossRef]
  36. Cunha, V.M.C.F.; Barros, J.A.O.; Sena-Cruz, J.M. An Integrated Approach for Modelling the Tensile Behaviour of Steel Fibre Reinforced Self-Compacting Concrete. Cem. Concr. Res. 2011, 41, 64–76. [Google Scholar] [CrossRef]
  37. Cunha, V.M.C.F.; Barros, J.A.O.; Sena-Cruz, J.M. A Finite Element Model with Discrete Embedded Elements for Fibre Reinforced Composites. Comput. Struct. 2012, 94–95, 22–33. [Google Scholar] [CrossRef]
  38. Carvalho, M.R.; Barros, J.A.O.; Zhang, Y.; Dias-da-Costa, D. A Computational Model for Simulation of Steel Fibre Reinforced Concrete with Explicit Fibres and Cracks. Comput. Methods Appl. Mech. Eng. 2020, 363, 112879. [Google Scholar] [CrossRef]
  39. Trindade, Y.T.; Bitencourt, L.A.G., Jr.; Monte, R.; de Figueiredo, A.D.; Manzoli, O.L. Design of SFRC Members Aided by a Multiscale Model: Part I—Predicting the Post-Cracking Parameters. Compos. Struct. 2020, 241, 112078. [Google Scholar] [CrossRef]
  40. Trindade, Y.T.; Bitencourt, L.A.G., Jr.; Manzoli, O.L. Design of SFRC Members Aided by a Multiscale Model: Part II—Predicting the Behavior of RC-SFRC Beams. Compos. Struct. 2020, 241, 112079. [Google Scholar] [CrossRef]
  41. da Silva, A.P.; Bitencourt, L.A.G., Jr. An Algorithm for Distribution of Short Fibers in Multiscale Numerical Analysis. In Proceedings of the XLII Ibero-Latin American Congress on Computational Methods in Engineering (CILAMCE), Rio de Janeiro, Brazil, 9–12 November 2021. [Google Scholar]
  42. Cervera, M.; Oliver, J.; Manzoli, O. A Rate-Dependent Isotropic Damage Model for the Seismic Analysis of Concrete Dams. Earthq. Eng. Struct. Dyn. 1996, 25, 987–1010. [Google Scholar] [CrossRef]
  43. Prazeres, P.G.C.; Bitencourt, L.A.G.; Bittencourt, T.N.; Manzoli, O.L. A Modified Implicit–Explicit Integration Scheme: An Application to Elastoplasticity Problems. J. Braz. Soc. Mech. Sci. Eng. 2016, 38, 151–161. [Google Scholar] [CrossRef]
  44. Federation Internationale du Beton. Model Code for Concrete Structures 2020; Federation Internationale du Beton: Lausanne, Switzerland, 2024; p. 434. Available online: https://fib-international.org/publications/fib-bulletins/fib-model-code-2020-detail.html (accessed on 1 March 2025).
  45. Simo, J.; Hugles, T. Computational Inelasticity; Springer: New York, NY, USA, 1998; Volume 7, ISBN 0-387-97520-9. [Google Scholar]
  46. Cavalaro, S.H.P.; López, R.; Torrents, J.M.; Aguado, A. Improved Assessment of Fibre Content and Orientation with Inductive Method in SFRC. Mater. Struct. 2015, 48, 1859–1873. [Google Scholar] [CrossRef]
Figure 1. Casting procedure: (a) molding setup; (b) fixation of the appropriate configuration for casting; (c) casting of one half of the mold; and (d) casting of the other half of the mold.
Buildings 15 00868 g001
Figure 2. Pullout test configurations: (a) single fiber (F1S0); (b) 2 fibers with 14 mm spacing (F2S14); (c) 2 fibers with 7 mm spacing (F2S7); (d) 4 fibers with 14 mm diagonal spacing (F4S14); and (e) 4 fibers with 7 mm diagonal spacing (F4S7).
Buildings 15 00868 g002
Figure 3. Pullout test conducted in this study.
Buildings 15 00868 g003
Figure 4. Identification of PL1, PL2, and PL3 and the pullout stages represented.
Buildings 15 00868 g004
Figure 5. Experimental and average load–displacement curves for (a) F1S0 I0°, (b) F1S0 I15°, and (c) F1S0 I30° setups.
Buildings 15 00868 g005
Figure 6. Pullout load results as a function of fiber inclination for (a) PL1; (b) PL2; and (c) PL3.
Buildings 15 00868 g006
Figure 7. Experimental and average load–displacement curves for (a) F2S7, (b) F2S14, (c) F4S7, and (d) F4S14 setups.
Buildings 15 00868 g007
Figure 8. Pullout load results as a function of number of fibers and spacing for (a) PL1; (b) PL2; and (c) PL3.
Buildings 15 00868 g008
Figure 9. Numerical modeling using coupling finite elements (CFEs).
Buildings 15 00868 g009
Figure 10. Numerical model employed for the simulations of the 3-PBTs: (a) geometrical properties, boundary conditions, and load application; (b) concrete mesh; and (c) coupling finite elements generated.
Buildings 15 00868 g010
Figure 11. Load vs. CMOD curves: comparison between numerical and experimental responses.
Buildings 15 00868 g011
Figure 12. Stress distribution in fiber elements at CMOD = 2.5 mm for (a) F1I0, (b) F2S7, (c) F2S14, (d) F4S7, and (e) F4S14 interface parameters.
Buildings 15 00868 g012
Table 1. Results of d10, d50, d90, and fineness modulus (FM) for the grained materials employed in this study.
Materialsd10d50d90FM
Cement CEM I 52.5R0.150.270.58
Siliceous river sand0.070.803.701.39
Artificial granite sand0.9513.4035.002.76
Table 2. Manufacturer’s technical specifications for the steel fibers employed in this study.
Characteristicd10
Length (mm)60
Diameter (mm)0.75
Aspect ratio (l/d)80
Specific weight (kg/m3)7850
Tensile strength (MPa)1225
Young’s modulus (GPa)210
Table 3. Dosage employed for the mortar produced in this study.
MaterialsDosage (kg/m3)
Cement CEM I 52.5R751
Water289
Siliceous river sand705
Artificial granite sand471
Superplasticizer5.25
Table 4. Summary of the groups of specimens employed in this study.
IdentificationNumber of FibersSpacing (mm)Inclination (in °)
F1S0 I01N.A. *0
F1S0 I151N.A. *15
F1S0 I301N.A. *30
F2S7270
F2S142140
F4S7470
F4S144140
* N.A. = not applicable.
Table 5. Characteristics of the analysis and meshes.
Number of Load StepsTruss Elements (Fibers)3-Noded
Triangular
Elements
(Concrete)
4-Noded
Triangular
Elements (CFEs)
Fibers Crossing the Fracture
Section
10,000256547453074168
Table 6. Mechanical properties of the concrete used in the three-point bending tests.
Compressive Strength
(MPa)
Tensile Strength
(MPa)
Young’s
Modulus (GPa)
Poisson’s
Ratio (-)
Fracture
Energy
(N/mm)
Compressive Parameters
46.502.3929.250.200.146A = 1.00
B = 0.89
Table 7. Input parameters for the fiber–matrix interface in the numerical analyses.
ParametersCentral
Region
FI10F2S7F2S14F4S7F4S17
τmax (MPa)0.5319.4719.7418.9320.5118.57
τf (MPa)0.345.344.895.125.204.88
s1 (mm)0.180.570.640.640.920.82
s2 (mm)1.295.275.245.245.425.32
Table 8. Fiber orientation obtained from inductive tests.
Fiber Content (kg/m3)CxCyCz
41.44 ± 3.270.515 ± 0.0100.286 ± 0.0080.199 ± 0.003
Disclaimer/Publisher’s Note: The statements, opinions and data contained in all publications are solely those of the individual author(s) and contributor(s) and not of MDPI and/or the editor(s). MDPI and/or the editor(s) disclaim responsibility for any injury to people or property resulting from any ideas, methods, instructions or products referred to in the content.

