Article

Mechanism of Strength Degradation of Fiber-Reinforced Soil Under Freeze–Thaw Conditions

1
School of Civil Engineering, Yancheng Institute of Technology, Yancheng 224005, China
2
School of Civil, Environmental Engineering and Geography Science, Ningbo University, Ningbo 315211, China
*
Author to whom correspondence should be addressed.
Buildings 2025, 15(6), 842; https://doi.org/10.3390/buildings15060842
Submission received: 11 February 2025 / Revised: 26 February 2025 / Accepted: 3 March 2025 / Published: 7 March 2025
(This article belongs to the Special Issue Application of Experiment and Simulation Techniques in Engineering)

Abstract

:
Understanding the mechanism of strength degradation in fiber-reinforced soils under freeze–thaw conditions is critical for expanding their engineering applications. In this study, shear tests were conducted on fiber-reinforced soil subjected to 0, 1, 5, 10, 20, and 30 freeze–thaw cycles to investigate variations in shear strength. The mechanisms driving these variations were analyzed through soil shear tests, fiber tensile tests, and fiber pull-out tests, all conducted under identical freeze–thaw conditions. The results indicated that fiber inclusion significantly enhances the shear strength of soils exposed to freeze–thaw cycles. However, the shear strength decreases exponentially as the number of cycles increases. The strength of fiber-reinforced soil is primarily due to the soil strength, fiber strength, and strength of the fiber–soil interface. All three components exhibit an exponential reduction under freeze–thaw conditions, contributing to the overall exponential decrease in the strength of fiber-reinforced soil.

1. Introduction

In northern China, northern Canada, Siberia, and other regions around the world, short-term and seasonal freeze–thaw phenomena are common. When temperatures drop below 0 °C, the pore water within the soil freezes into ice, which subsequently melts as temperatures rise. This cyclic freezing and thawing process causes irreversible changes to the soil microstructure, such as triggering particle disintegration [1,2], enlarging the pores [3,4,5], and altering pore structure [3,6], leading to shrinkage, deformation, and subsidence [6,7,8,9]. Such structural alterations result in irreversible damage to engineered structures built on the soil, including cracking and uneven settlement, which pose significant risks to life and property [10,11,12,13]. Therefore, the implementation of engineering reinforcement measures is critically important.
To address the aforementioned issues, several effective and reliable reinforcement methods, such as the addition of cement, lime, synthetic fibers, and natural fibers, have been reported to improve the mechanical properties of frozen–thawed soils [14,15,16,17,18,19,20,21,22]. Natural fibers, including straw, jute, bagasse, hair, and chicken feather fibers, are widely used to reinforce frozen–thawed soils due to their abundant availability, cost-effectiveness, and eco-friendly properties [23,24,25,26]. A variety of tests, such as unconfined compressive strength, shear strength, tensile strength, and California bearing ratio tests, have been conducted on natural fiber-reinforced frozen–thawed soils, demonstrating excellent reinforcement effects [24,26,27,28,29].
The strength of natural fiber-reinforced soil primarily consists of soil strength, fiber strength, and fiber–soil interface strength [9,30]. The mechanism of strength variation in natural fiber-reinforced frozen–thawed soils can be analyzed through these three components. The variation in soil strength under freeze–thaw cycles has been extensively studied [2,7,8,10]. During the freeze–thaw cycle, the pore water in the soil undergoes phase changes due to fluctuations in temperature. As liquid water freezes into solid ice, the growth of ice crystals increases in volume and exerts pressure on the surrounding soil particles. This process disrupts the bonds between soil particles, leading to displacement, breakage, or deformation, and ultimately reducing soil strength [1,6,18]. However, research on the variations in the natural fiber strength and fiber–soil interface strength under freeze–thaw conditions is limited. Consequently, the degradation mechanism of fiber-reinforced soil strength is not yet fully understood.
This study investigates the degradation mechanism of cotton straw fiber-reinforced soil strength subjected to freeze–thaw cycles. A series of shear tests were conducted on cotton straw fiber-reinforced soil after different numbers of freeze–thaw cycles. The variation in shear strength was analyzed through soil shear tests, fiber tensile tests, and fiber pull-out tests. The findings of this study establish a foundation for the engineering application of straw fiber-reinforced freeze–thaw soils.

2. Strength Behavior of Fiber-Reinforced Soil Under Freeze–Thaw Cycles

2.1. Experimental Materials

The soil used in this study was obtained from a construction pit in Yancheng City, China. The retrieved soil was air-dried and sieved through a 2 mm mesh. A series of laboratory tests were conducted to determine the basic physical and chemical properties of the soil, as shown in Table 1. The optimum water content and maximum dry density were 23.04% and 1.57 g/cm3, respectively. The reinforcement material used in this study was cotton straw fiber, supplied by the Surui Agricultural Products Factory from Lianyungang City, Jiangsu Province, China. The physical and mechanical properties of the cotton straw fiber are listed in Table 2. The fiber had an average diameter of 0.1 mm and an average length of 12 mm. The cellulose, hemicellulose, and lignin contents of the cotton straw fiber were determined using washing methods and were found to be 37.54%, 19.23%, and 25.15%, respectively.

2.2. Experimental Procedures

Cotton straw fibers were incorporated into the soil in quantities of 0.1%, 0.2%, and 0.4% according to the dry weight of the soil. All samples, with a diameter of 61.8 mm and a height of 20 mm, were compacted at their respective optimum water content and maximum dry density. The specific procedures for each sample are outlined below (GB/T 50123-1999) [31]: First, the specified quantity of fiber was incrementally mixed into the soil to ensure thorough and uniform distribution. Second, the fiber–soil mixture was sprayed with a measured amount of water and mixed thoroughly. The prepared fiber–soil–water mixture was then placed in plastic containers for 24 h to ensure a uniform water distribution. Third, the mixture was placed into the mold in three layers, each of which was compacted to the desired density. After compacting each layer, the surface was roughened before adding and compacting the next layer. Finally, the samples were covered with a plastic layer immediately following their removal from the mold to prevent the evaporation of water.
The prepared samples were initially placed in a constant-temperature freezing chamber at −20 °C for 12 h, followed by being transferred to a thawing chamber at 20 °C for an additional 12 h. These temperatures were previously used in other studies, and a 12 h duration was chosen to ensure the samples were fully frozen or thawed [6,13]. This process constituted one freeze–thaw cycle [6,32]. The samples were subjected to 0, 1, 5, 10, 20, and 30 freeze–thaw cycles. After reaching the required number of cycles, shear tests were conducted. The shear rate was set at 1.2 mm/min, with vertical loads of 50, 100, 150, and 200 kPa applied. The peak stress observed in the stress–strain curves was considered to be the shear strength. In cases where no distinct peak was observed, the stress at 6.4% strain on the stress–strain curves was used as the shear strength (GB/T 50123-1999) [31]. Three replicate samples were prepared, and the mean value was adopted as the test result.

3. Results and Discussion

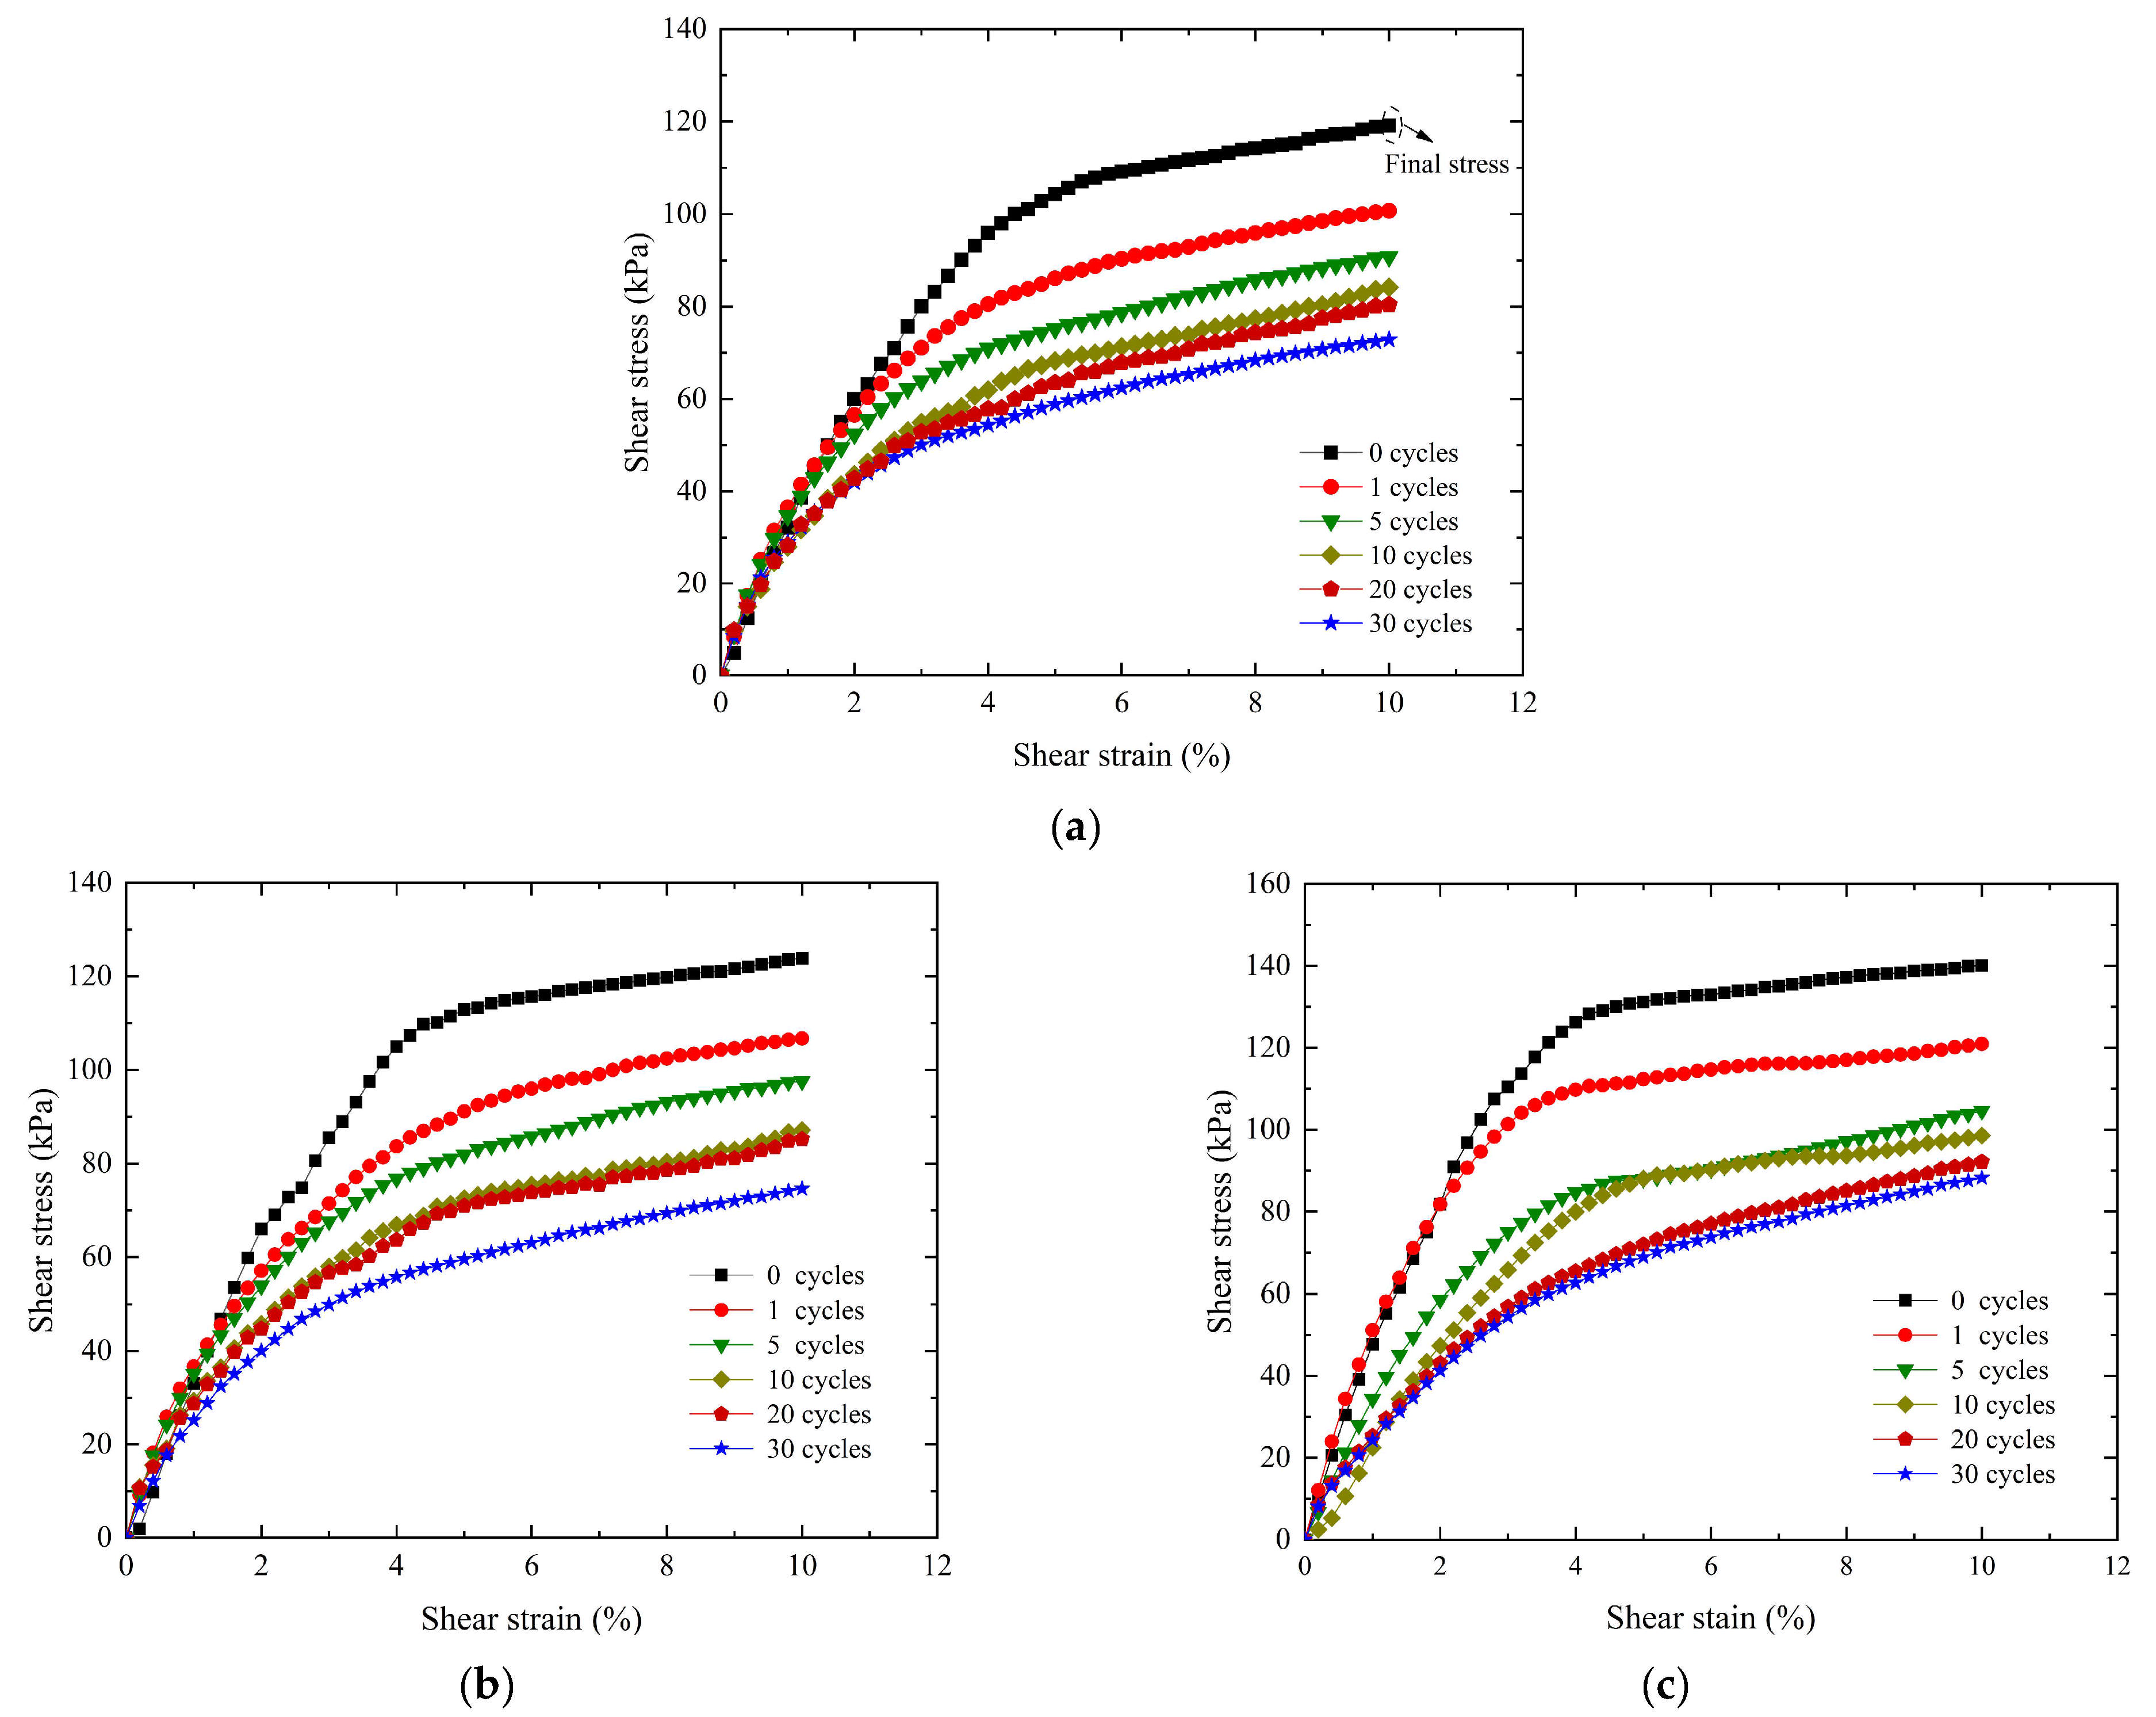
3.1. Stress–Strain Curves
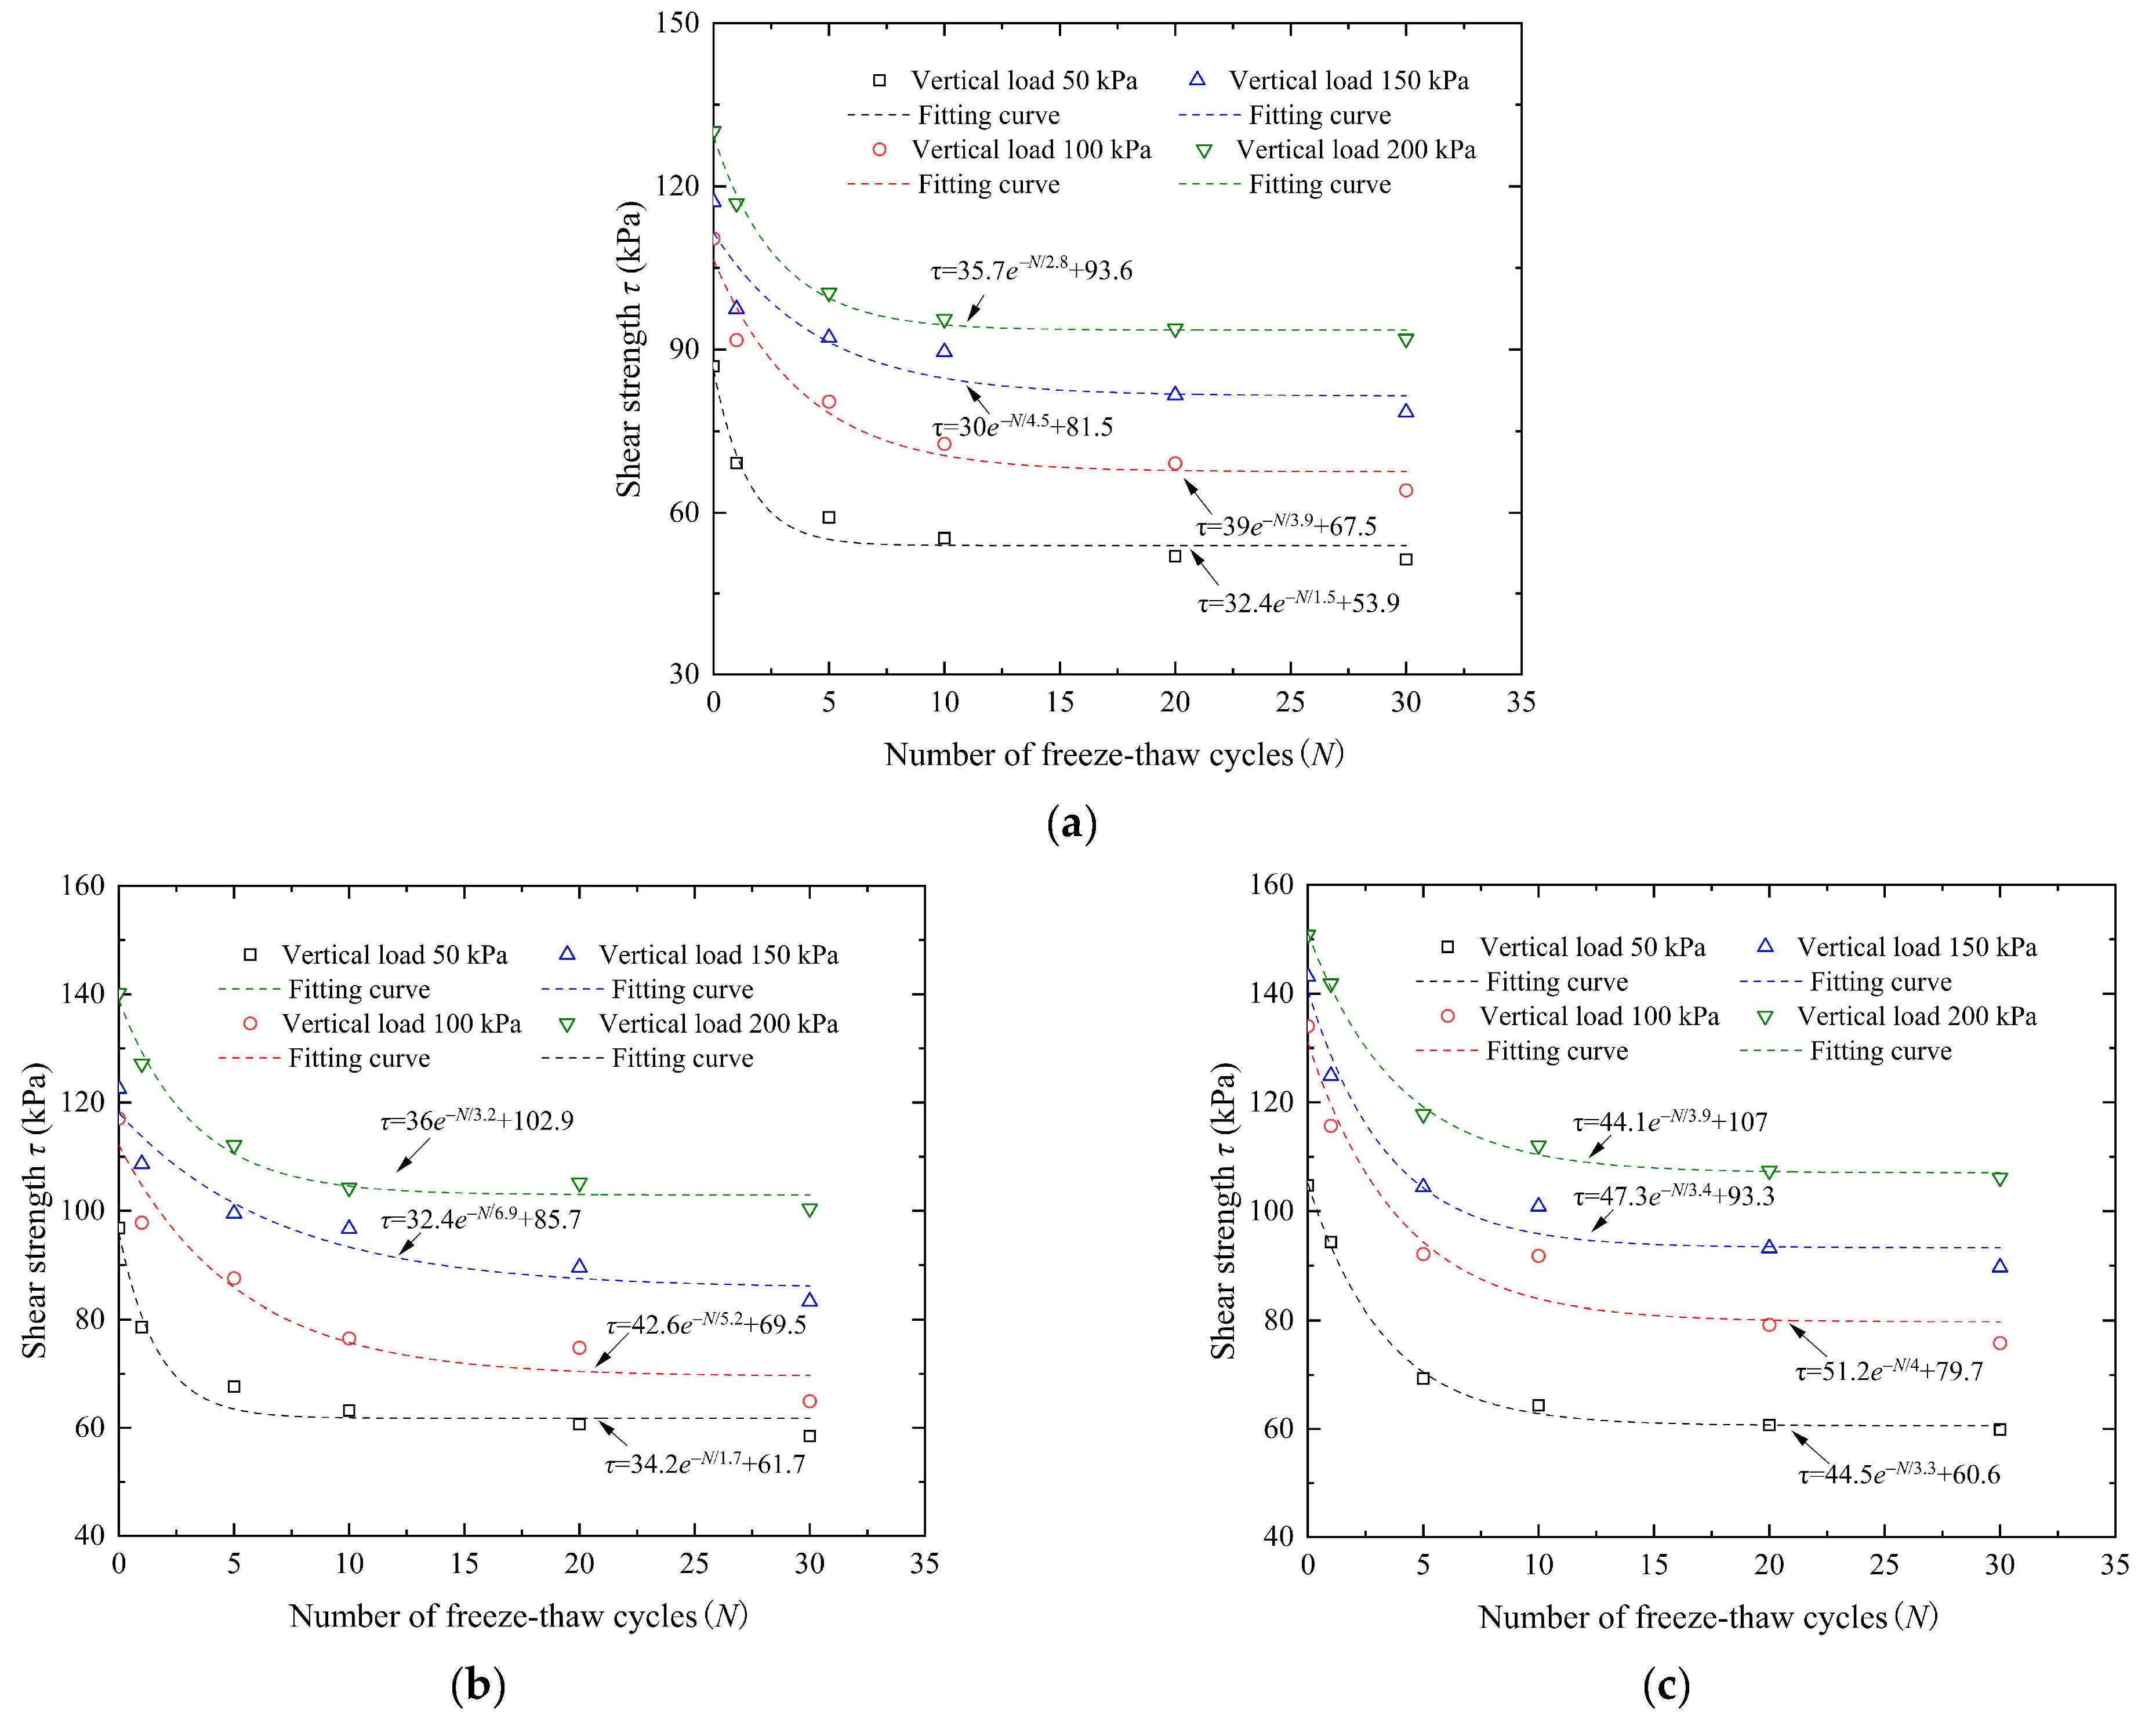
To investigate the effect of freeze–thaw cycles on the shear strength of fiber-reinforced soil, stress–strain curves were plotted. As an example, the stress–strain curves for fiber-reinforced soil under a vertical load of 100 kPa are shown in Figure 1. For the samples with 0.1% fiber content, the stress increases with strain, indicating clear strain-hardening behavior. As shown in Figure 1c, partial freeze–thaw cycles exhibit transient stiffness anomalies within the small-strain range. For instance, the curve corresponding to 10 cycles shows reduced stiffness during the initial phase. However, as strain increases, the curve gradually trends return to normal. This phenomenon may be attributed to factors such as microstructural adjustments in the soil, stress redistribution during the initial loading phase of the specimen, or localized fiber reinforcement effects. Similar observations have been reported in studies on freeze–thaw soils [9,32]. The stress at the end of the test (final stress–strain points) is considered as the final stress. The final stresses of the samples subjected to 0, 1, 5, 10, 20, and 30 freeze–thaw cycles are 119.07, 100.72, 90.76, 84.19, 80.43, and 72.84 kPa, respectively. An increase in the number of freeze–thaw cycles has a negative effect on the final stresses, with a reduction of approximately 38.82% after 30 cycles.
For the samples with 0.2% and 0.4% fiber content, a notable strain-hardening phenomenon is also observed. The final stresses of the samples with 0.2% fiber content subjected to 0, 1, 5, 10, 20, and 30 freeze–thaw cycles are approximately 123.86, 106.73, 97.55, 87.14, 85.20, and 74.60 kPa, respectively. The final stresses of the samples with 0.4% fiber content subjected to the same cycles are approximately 140.08, 120.95, 104.59, 98.55, 92.16, and 88.26 kPa, respectively. The final stresses decrease with an increasing number of freeze–thaw cycles. After 30 freeze–thaw cycles, the final stresses of the samples with 0.2% and 0.4% fiber content increase by 2.42% and 21.17%, respectively, compared to the samples with 0.1% fiber content. This indicates that fiber incorporation effectively enhances the shear strength and frost resistance of the soil, with frost resistance improving as the fiber content increases.

3.2. Shear Strength

The stress at 6.4% strain on the stress–strain curves is regarded as the shear strength (GB/T 50123-1999) [31]. Figure 2 illustrates the variation in the shear strength of fiber-reinforced soil under freeze–thaw conditions. The shear strength of the samples is influenced by the applied vertical load, with an observed increase in strength as the vertical load increases. A rapid decrease in shear strength is observed during the first five freeze–thaw cycles, after which the rate of decrease slows between the fifth and tenth cycles. After 10 freeze–thaw cycles, the shear strength tends to stabilize. Similar trends have been reported by Roustaei et al. [6] and Orakoglu and Liu [27]. The shear strength of the fiber-reinforced soil has an exponential decrease with the number of freeze–thaw cycles, which can be described by the following semiempirical equation:
τ = a   e N / b + c
where τ is the shear strength of the samples; N is the number of freeze–thaw cycles; a, b, and c are the fitting parameters that govern the variation in the shear strength versus the number of freeze–thaw cycles curves. However, due to the limited number of tests in this study, the relationship between the values of the fitting parameters a, b, and c is not numerically quantified. Equation (1) is used to fit the results from different studies, with the corresponding fitting parameters listed in Table 3. The fitting coefficient exhibits a strong correlation (R2 > 0.9). This indicates that the equation can effectively fit different soil types and fibers, demonstrating its reliability. With a limited number of freeze–thaw tests, Equation (1) can be derived and applied to predict the shear strength of fiber-reinforced soils under any number of freeze–thaw cycles, offering significant practical advantages.

4. Degradation Mechanism of Fiber-Reinforced Soil Strength Under Freeze–Thaw Conditions

The strength of fiber-reinforced soil primarily consists of soil strength, fiber strength and the strength of the fiber–soil interface [9,30]. This section examines the variations in soil strength, fiber strength, and fiber–soil interface strength after different numbers of freeze–thaw cycles. The objective is to investigate the degradation mechanism of straw fiber-reinforced soil strength under freeze–thaw conditions, as illustrated in Figure 3.

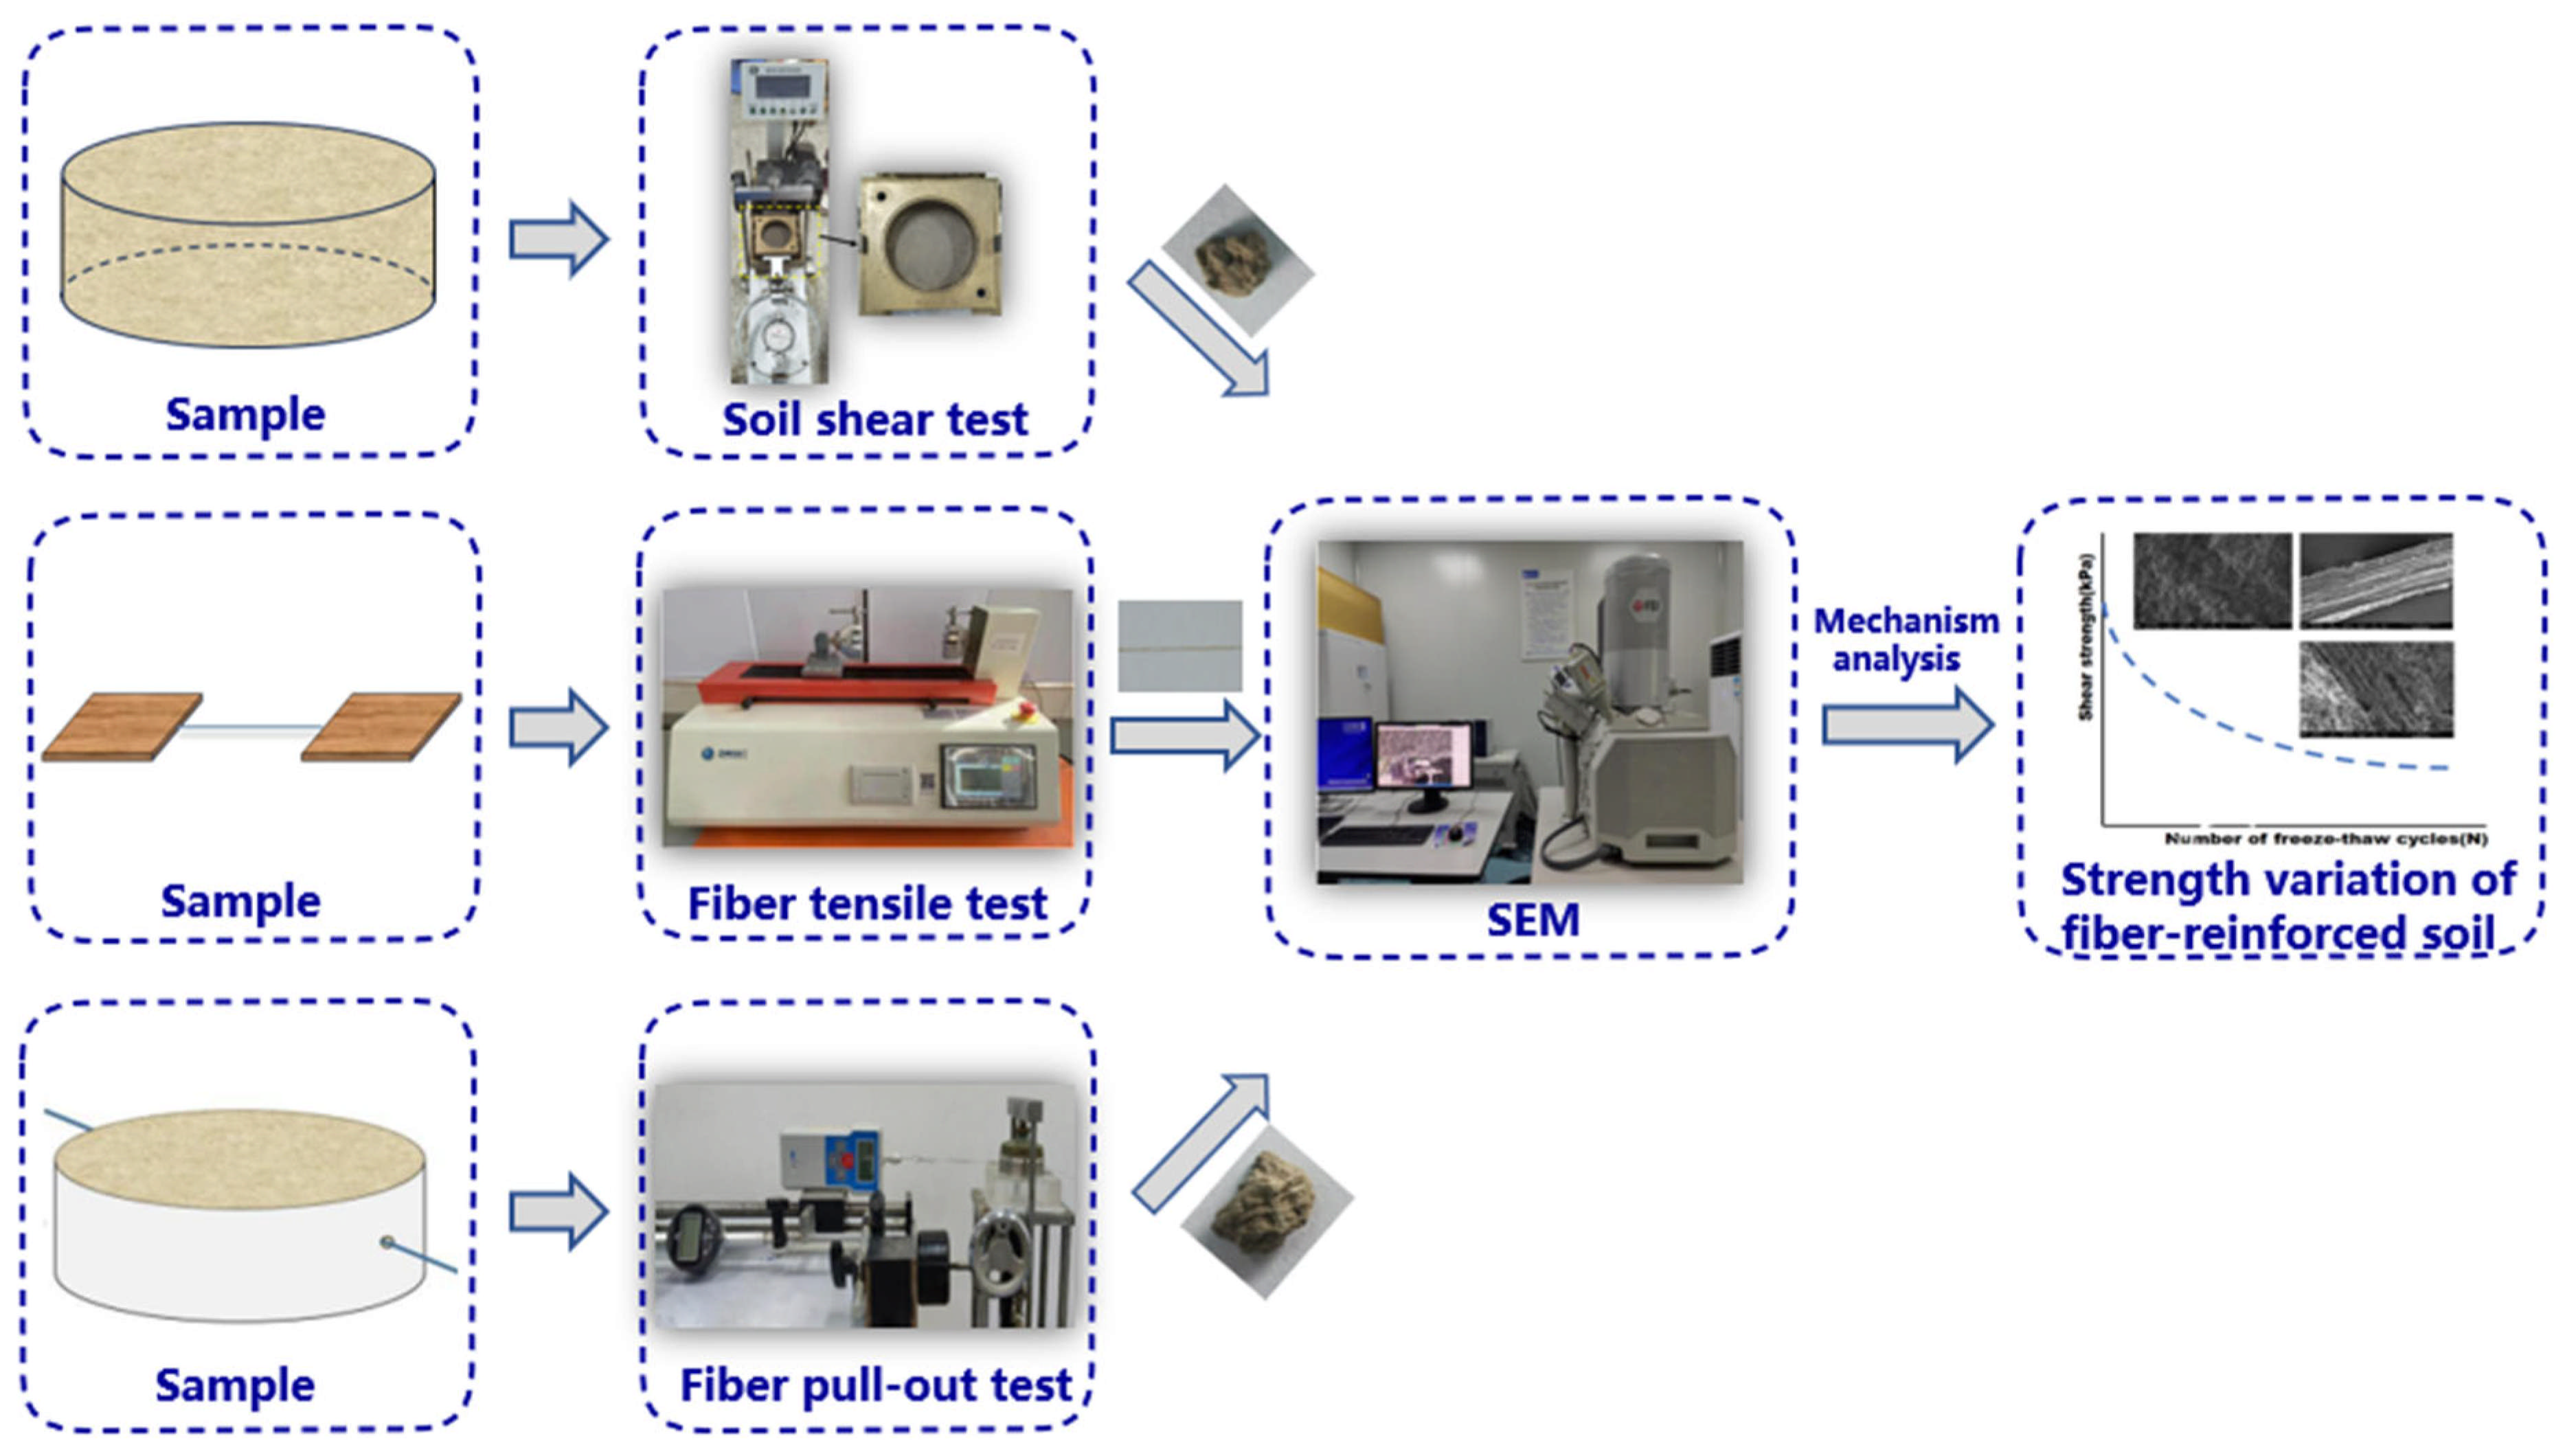
4.1. Experimental Methods

(1)
Soil shear tests
Soil samples with a diameter of 61.8 mm and a height of 20 mm were compacted at the optimum water content and maximum dry density (GB/T 50123-1999) [31]. Subsequently, 0, 1, 5, 10, 20, and 30 freeze–thaw cycles were applied. Once the designated number of freeze–thaw cycles was completed, shear tests were performed. The detailed procedures are described in Section 2.2.
(2)
Fiber tensile tests
A 50 mm length fiber was embedded in the soil at its optimum water content and maximum dry density. The samples were covered with a plastic layer throughout the freeze–thaw cycles. After completing the cycles, the fiber was meticulously extracted from the soil, and its surface was cleaned for tensile testing. Subsequently, the fiber was affixed between two wooden boards using epoxy resin, with 20 mm exposed in the center (Figure 3). The prepared samples were then placed in a tensile testing machine, and a tensile force was applied at a constant rate of 1 mm/min until failure (ASTM D3822-07) [35]. Each test was repeated 10 times for self-calibration.
(3)
Fiber pull-out tests
The sample preparation method for the fiber pull-out test was as follows: half of the soil, at optimum water content, was placed in the mold and compacted to maximum dry density. A length of straw fiber measuring 100 mm was positioned on the surface of the soil and threaded through 1 mm holes situated on opposing sides of the mold. The remaining half of the soil was then added to the mold and compacted. Subsequently, the prepared samples were then subjected to various freeze–thaw cycles. After these cycles, the samples were placed in the pull-out test apparatus. A pulling force was applied to the fiber while the sliding table moved at a constant rate of 1 mm/min until the fiber–soil interface failed. The detailed procedures for the fiber pull-out test are described in Liu et al. [9] and Sun [36].

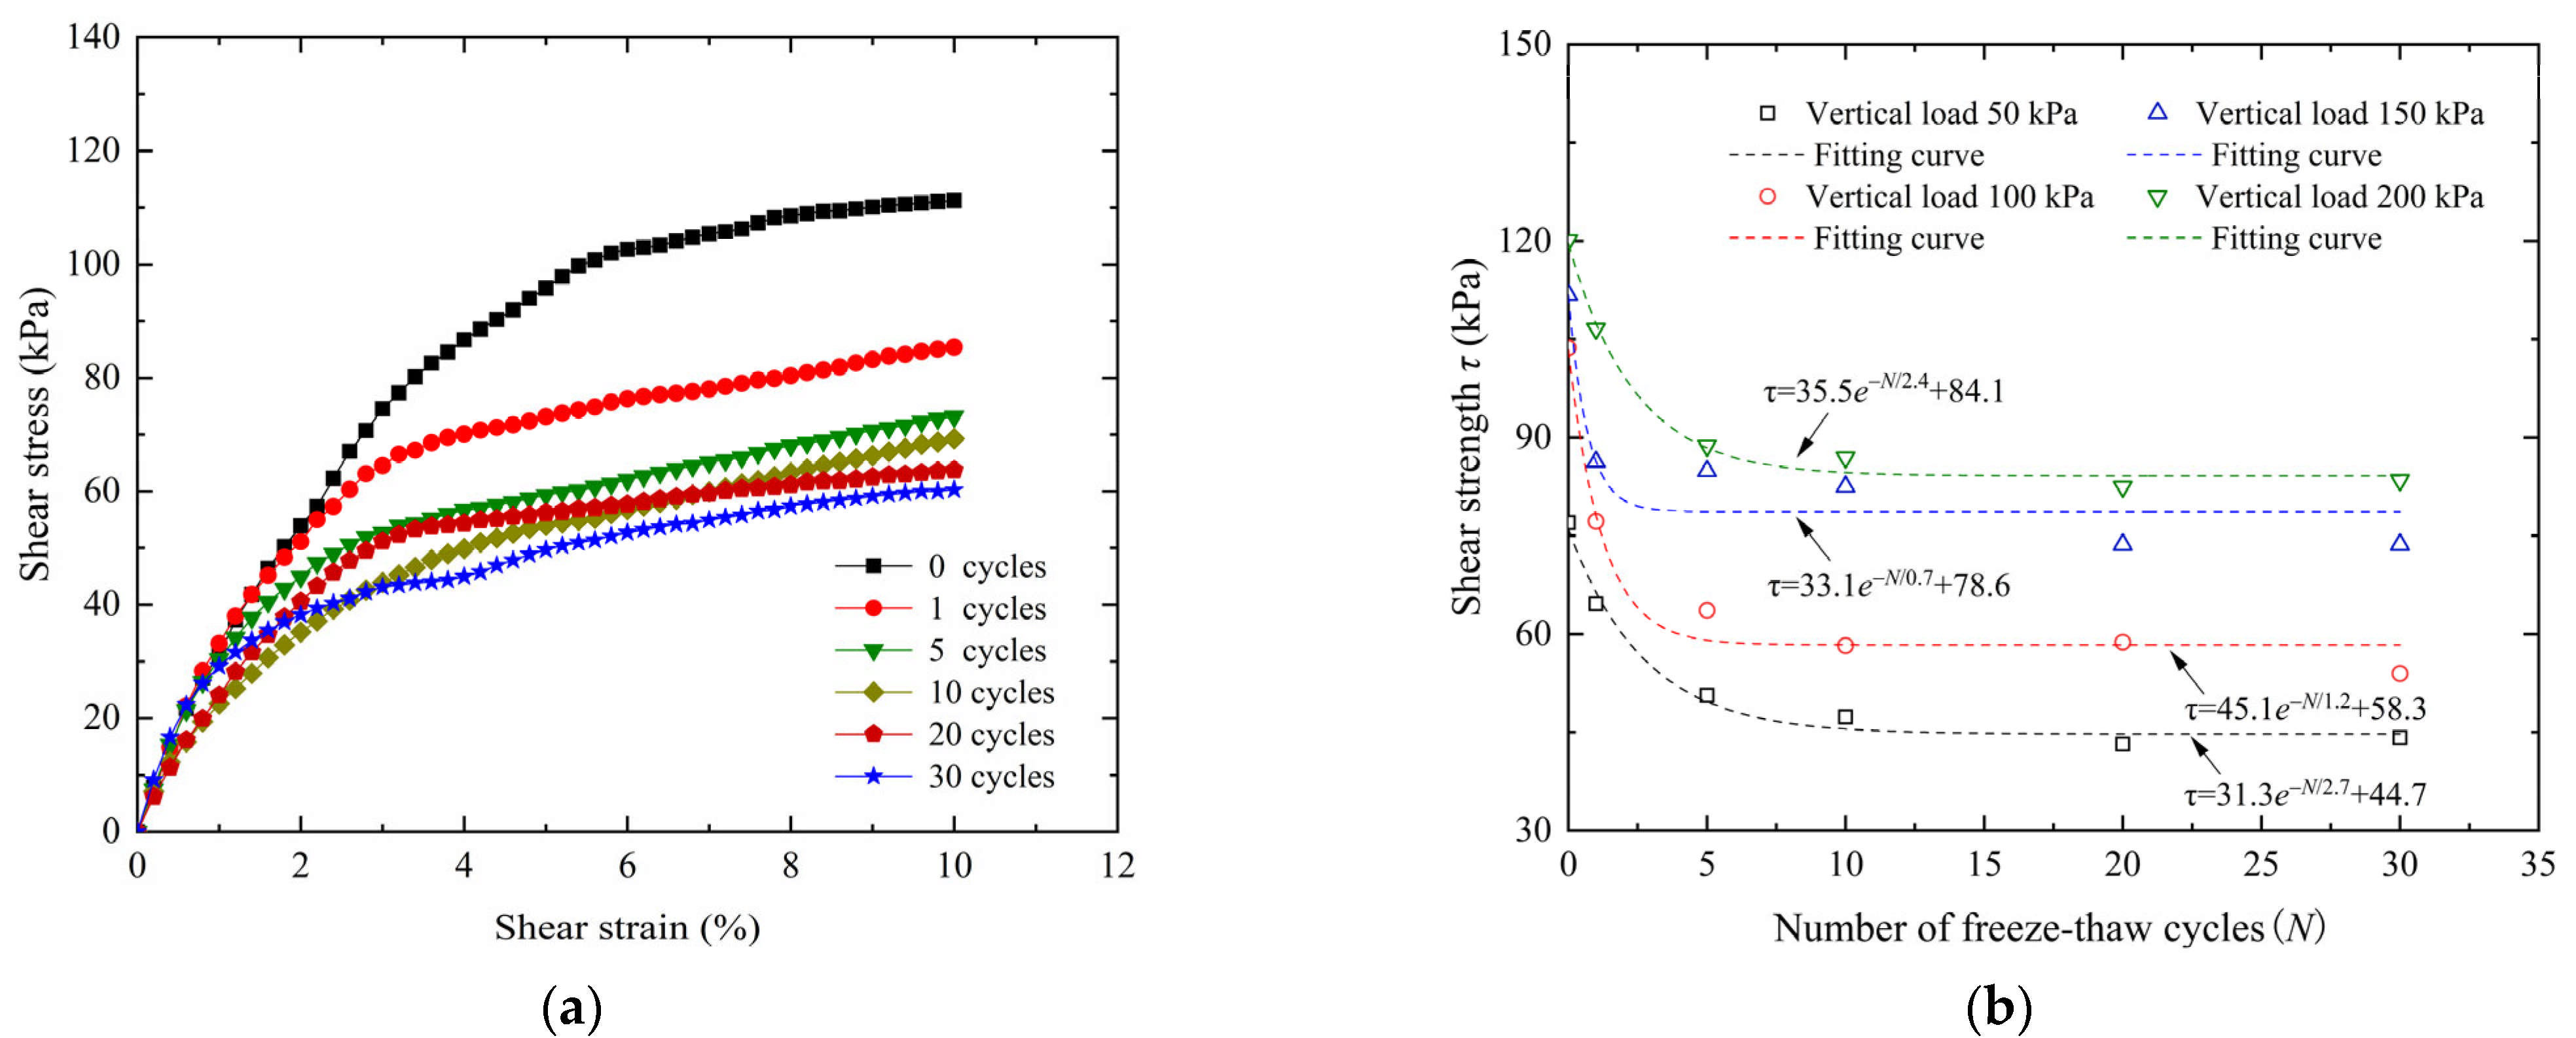
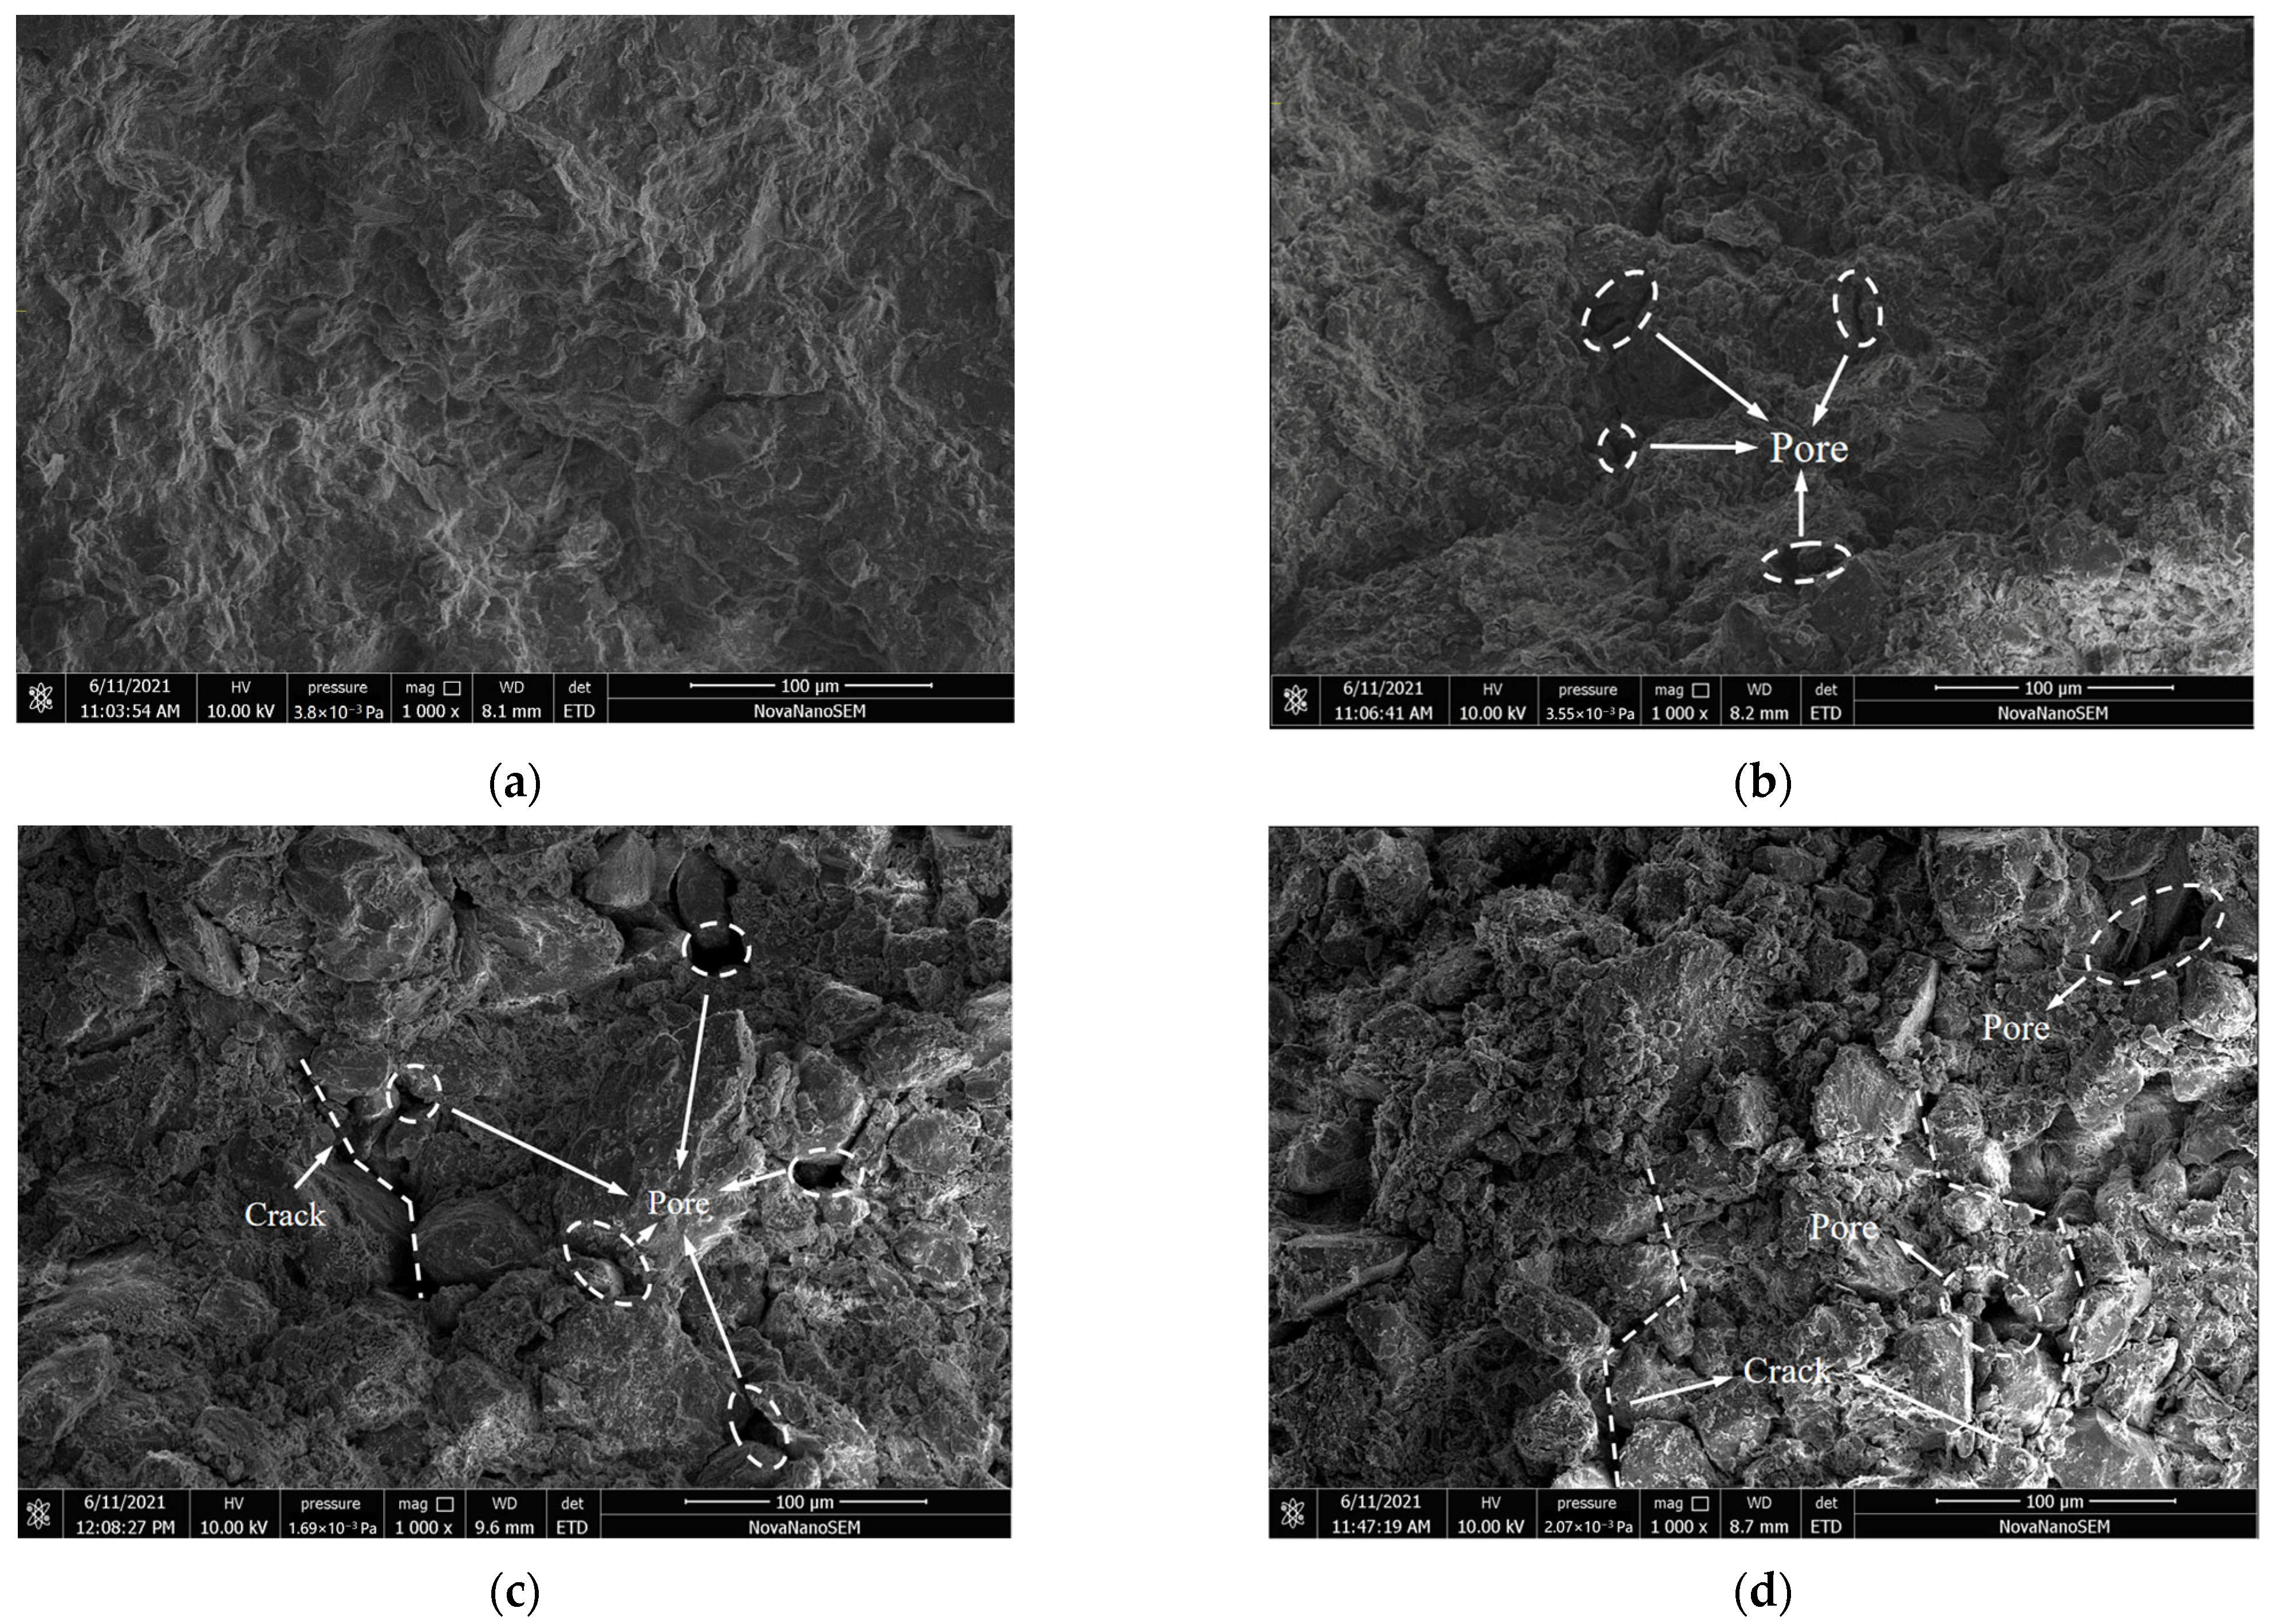
4.2. Shear Strength of Soil Subjected to Freeze–Thaw Cycles

Figure 4a illustrates the stress–strain curves of soil under freeze–thaw cycles. The curves exhibit pronounced strain-hardening behavior, which is consistent with the behavior observed for fiber-reinforced soil (Figure 1). The final stresses of the soil subjected to 0, 1, 5, 10, 20, and 30 freeze–thaw cycles are approximately 111.25, 85.39, 73.19, 69.30, 63.75, and 60.31 kPa, respectively. The final stress of the soil decreases with increasing number of freeze–thaw cycles. Moreover, after 30 freeze–thaw cycles, the final stresses of fiber-reinforced soil with 0.1%, 0.2%, and 0.4% fiber contents increase by 20.77%, 23.69%, and 46.34%, respectively, compared to those of the unreinforced soil. This further indicates that the incorporation of fibers effectively enhances the strength and frost resistance of the soil subjected to freeze–thaw cycles. Figure 4b illustrates the shear strength curve of the soil subjected to freeze–thaw cycles. The shear strength decreases notably with an increasing number of freeze–thaw cycles, initially exhibiting a sharp decline followed by a more gradual decrease. This trend is evident as an exponential decrease, as indicated by Equation (1). According to Equation (1), it is estimated that the shear strength of soil samples with 0, 0.1%, 0.2%, and 0.4% fiber content under 100 kPa are approximately 103.4, 106.5, 112.1, and 130.9 kPa when the number of freeze–thaw cycles tends to infinity, respectively. The ultimate strengths are quite similar after approximately 52, 141, 150, and 155 cycles for the soil samples with 0, 0.1, 0.2, and 0.4% fiber contents.
Figure 5 shows SEM images of the soil after 0, 5, 10, and 30 freeze–thaw cycles. Prior to freezing and thawing, the soil structure is relatively compact (Figure 5a). After 5 freeze–thaw cycles, the soil exhibits the emergence of a few pores (Figure 5b). By the 10th cycle, an increase in the size of the pores between the soil particles is observed, accompanied by the emergence of cracks and a notable reduction in soil compactness (Figure 5c). Following 30 cycles, the number of pores and cracks continues to increase. The soil contains fewer large particles and more smaller ones, and the number of overhead pores also rises. The contact mode between soil particles shifts from an initial face-to-face and line-to-face arrangement to point-to-face and point-to-point contact (Figure 5d). This phenomenon is attributed to the formation of ice within the soil during the freezing process, which leads to the expansion and enlargement of pores, thereby increasing the pore area ratio [6,7]. The aforementioned observations indicate a degradation of the structural integrity of the soil under freeze–thaw conditions, which ultimately results in a reduction in shear strength.

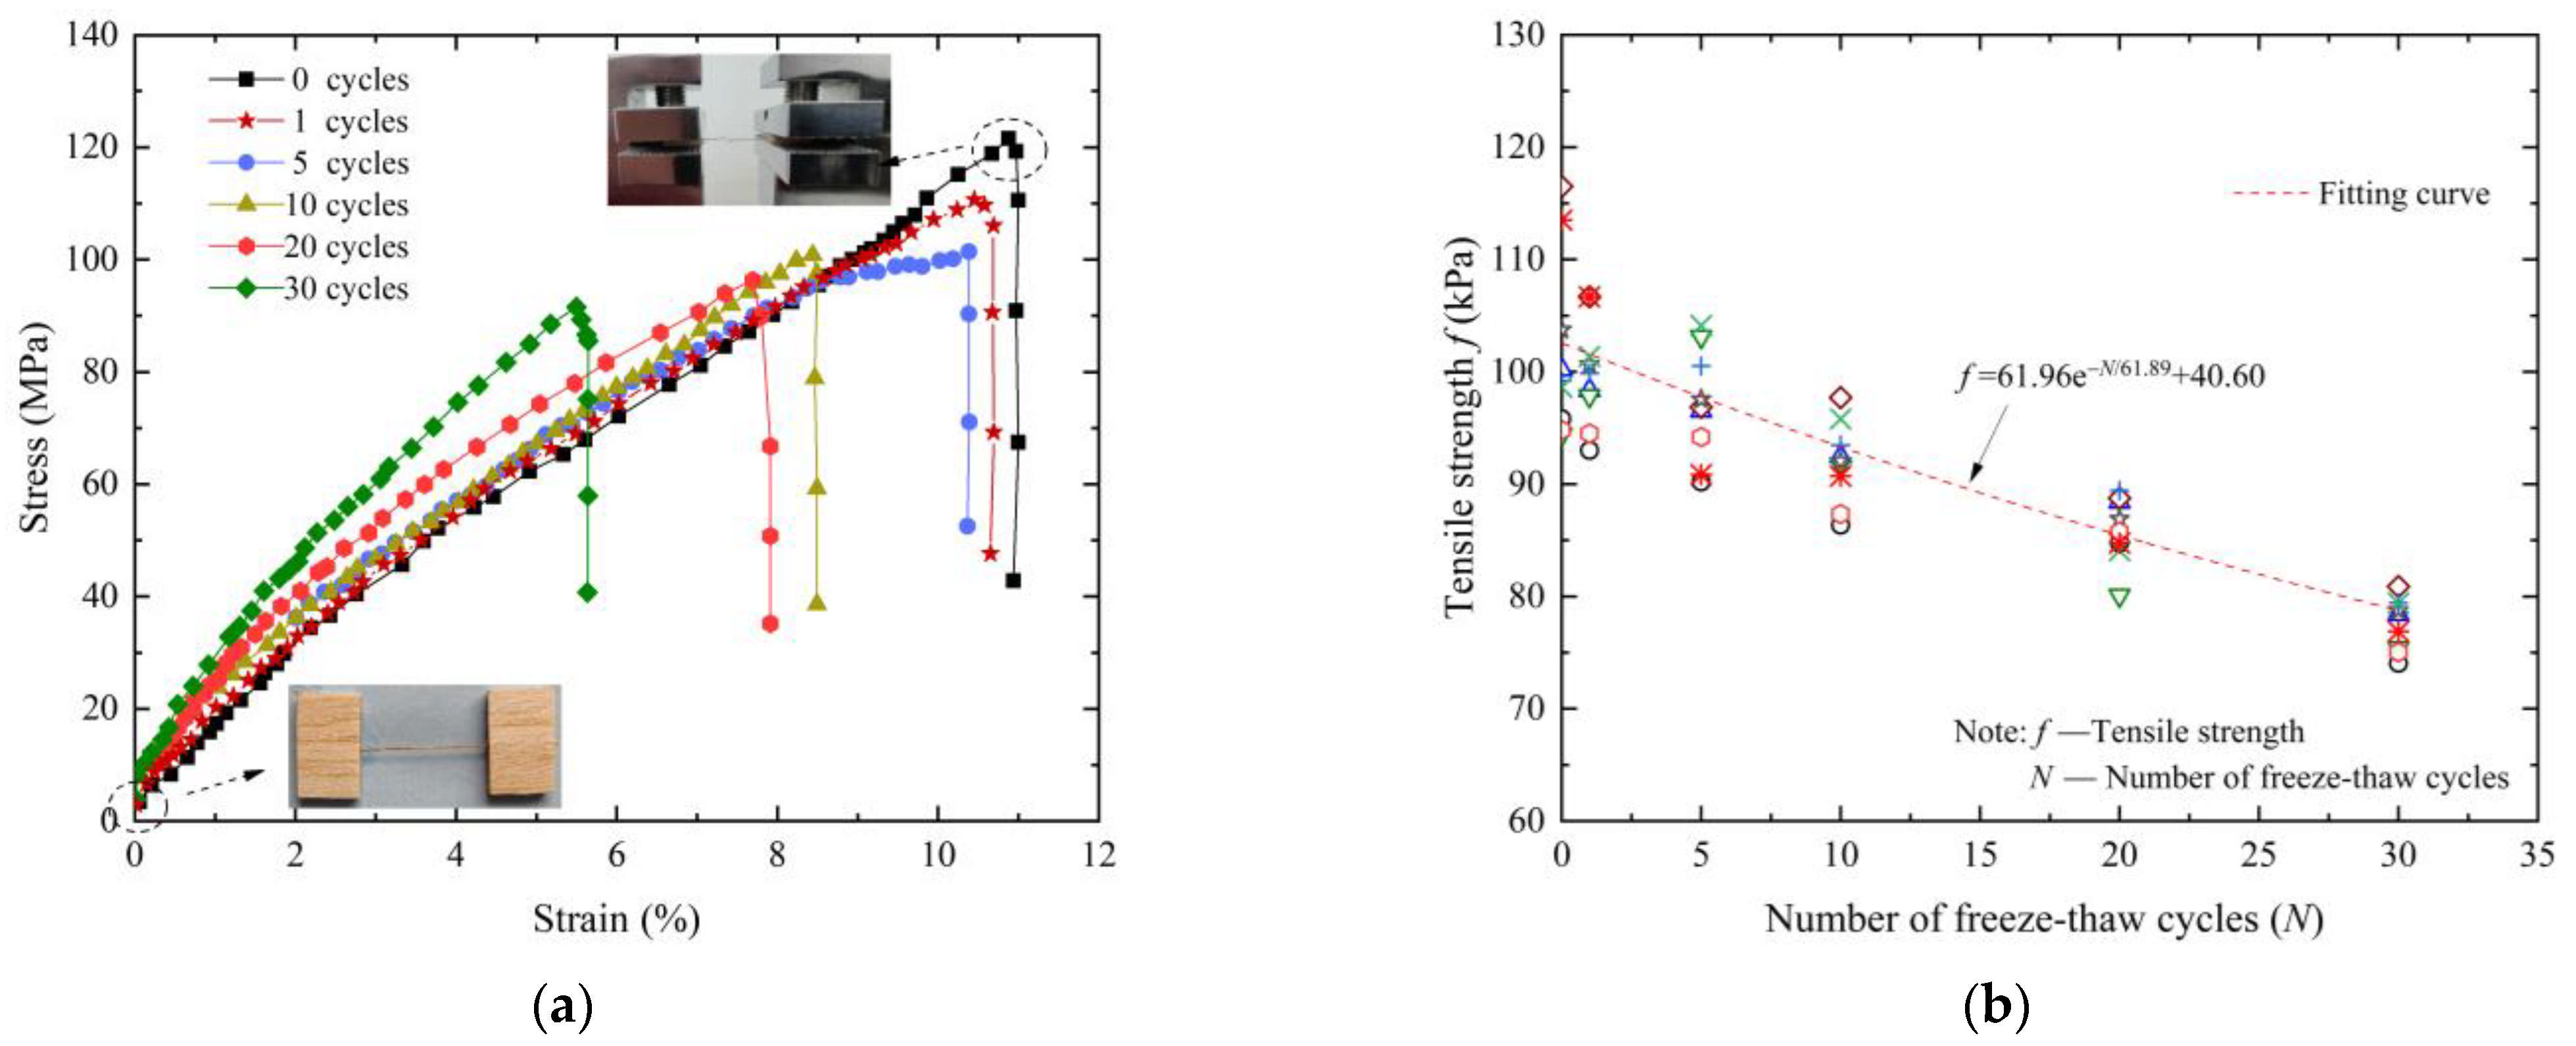
4.3. Tensile Strength of Fiber Subjected to Freeze–Thaw Cycles

Figure 6a depicts the stress–strain behavior of cotton straw fiber under freeze–thaw conditions. In the absence of freeze–thaw cycles, the stress increases linearly with strain until reaching a peak value, after which it decreases almost linearly. The curve exhibits linear elastic fracture with no evident yielding throughout the tensile process. The fracture of the cotton straw fiber, shown in Figure 6a, indicates brittle failure, with the fiber breaking abruptly once the tensile stress exceeds its capacity. These findings align with those of Yzombard et al. [37]. Additionally, the stress–strain curves for fibers subjected to 1, 5, 10, 20, and 30 freeze–thaw cycles also demonstrate linear elastic fracture behavior, which is consistent with the curve for fibers unaffected by freeze–thaw cycles. These findings indicate that freeze–thaw cycles do not influence the tensile failure mode of cotton straw fiber.
The tensile test results are shown in Figure 6b. The average tensile strength of fibers before the freeze–thaw cycles is 103.39 MPa, which is higher than the 60.73 MPa and 78.4 MPa reported by Lin [38] and Yzombard et al. [37], respectively, for cotton straw fibers. These discrepancies can be attributed to the differences in the cotton straw varieties, growing regions, fiber preparation methods, and gauge lengths used in tensile tests [36,38]. The average tensile strengths of fibers after 1, 5, 10, 20, and 30 freeze–thaw cycles are 100.63, 97.50, 92.67, 86.53, and 78.33 MPa, respectively, which are 2.67%, 5.70%, 10.37%, 16.31%, and 24.24% lower than those of the fibers before the freeze–thaw cycles. The tensile strength of the cotton straw fibers initially decreases and then stabilizes with increasing freeze–thaw cycles, following a clear exponential decrease.
Figure 7 shows SEM images of cotton straw fiber after 0, 5, 10, and 30 freeze–thaw cycles. As illustrated in Figure 7a, the surface of the fiber exhibits a smooth and flat appearance, with no visible cracks or shallow grooves. As a natural plant fiber, cotton straw may contain surface impurities such as wax and pectin. The cellulose, hemicellulose, and lignin contents of the cotton straw fiber were determined by washing methods and were found to be 37.54%, 19.23%, and 25.15%, respectively. Figure 7b shows the fiber surface after five freeze–thaw cycles, demonstrating no discernible alterations in comparison to Figure 7a. However, after 10 freeze–thaw cycles, the fiber surface becomes rough and uneven, and small pores begin to appear (Figure 7c). After 30 freeze–thaw cycles, the fiber displays evident indications of degradation, including increased surface roughness, the emergence of cracks, and the breakdown of the complex structure constituted by cellulose, hemicellulose, lignin, pectin, and wax. This degradation process results in the disruption of the original smooth and orderly long-chain structure of the fiber, leading to the tearing and continuous erosion of both the surface and interior. Consequently, the fiber develops a multitude of grooves, cracks, and holes, which markedly affect its mechanical properties (Figure 7d). Following 30 freeze–thaw cycles, the cellulose, hemicellulose, and lignin contents decrease to 33.39%, 15.85%, and 22.44%, respectively, representing reductions of 4.15%, 3.38%, and 2.71%, respectively, compared to those of the fibers without freeze–thaw cycles. Since the mechanical properties of natural fibers are primarily influenced by their composition, these alterations are in alignment with the observed reduction in tensile strength (Figure 6).
The three-dimensional network structure formed by fibers plays a crucial role in influencing the strength of fiber-reinforced soil [9,39]. When shear stress is applied, the fibers within the soil are subjected to tensile forces. The tensile stress that the fibers can withstand depends on the bonding strength and frictional force between the soil particles and the fiber surface. These forces partially restrict the relative sliding between fibers and soil. A network of randomly distributed fibers forms an enhanced structure that interlocks the soil particles and constrains their movement, thereby improving the overall integrity and strength of the fiber-reinforced soil (Figure 8). However, the tensile strength of fiber decreases exponentially with an increasing the number of freeze–thaw cycles (Figure 6b). This reduction substantially weakens the capacity of the three-dimensional fiber network to resist stress, which significantly affects the strength of fiber-reinforced soil under freeze–thaw conditions.

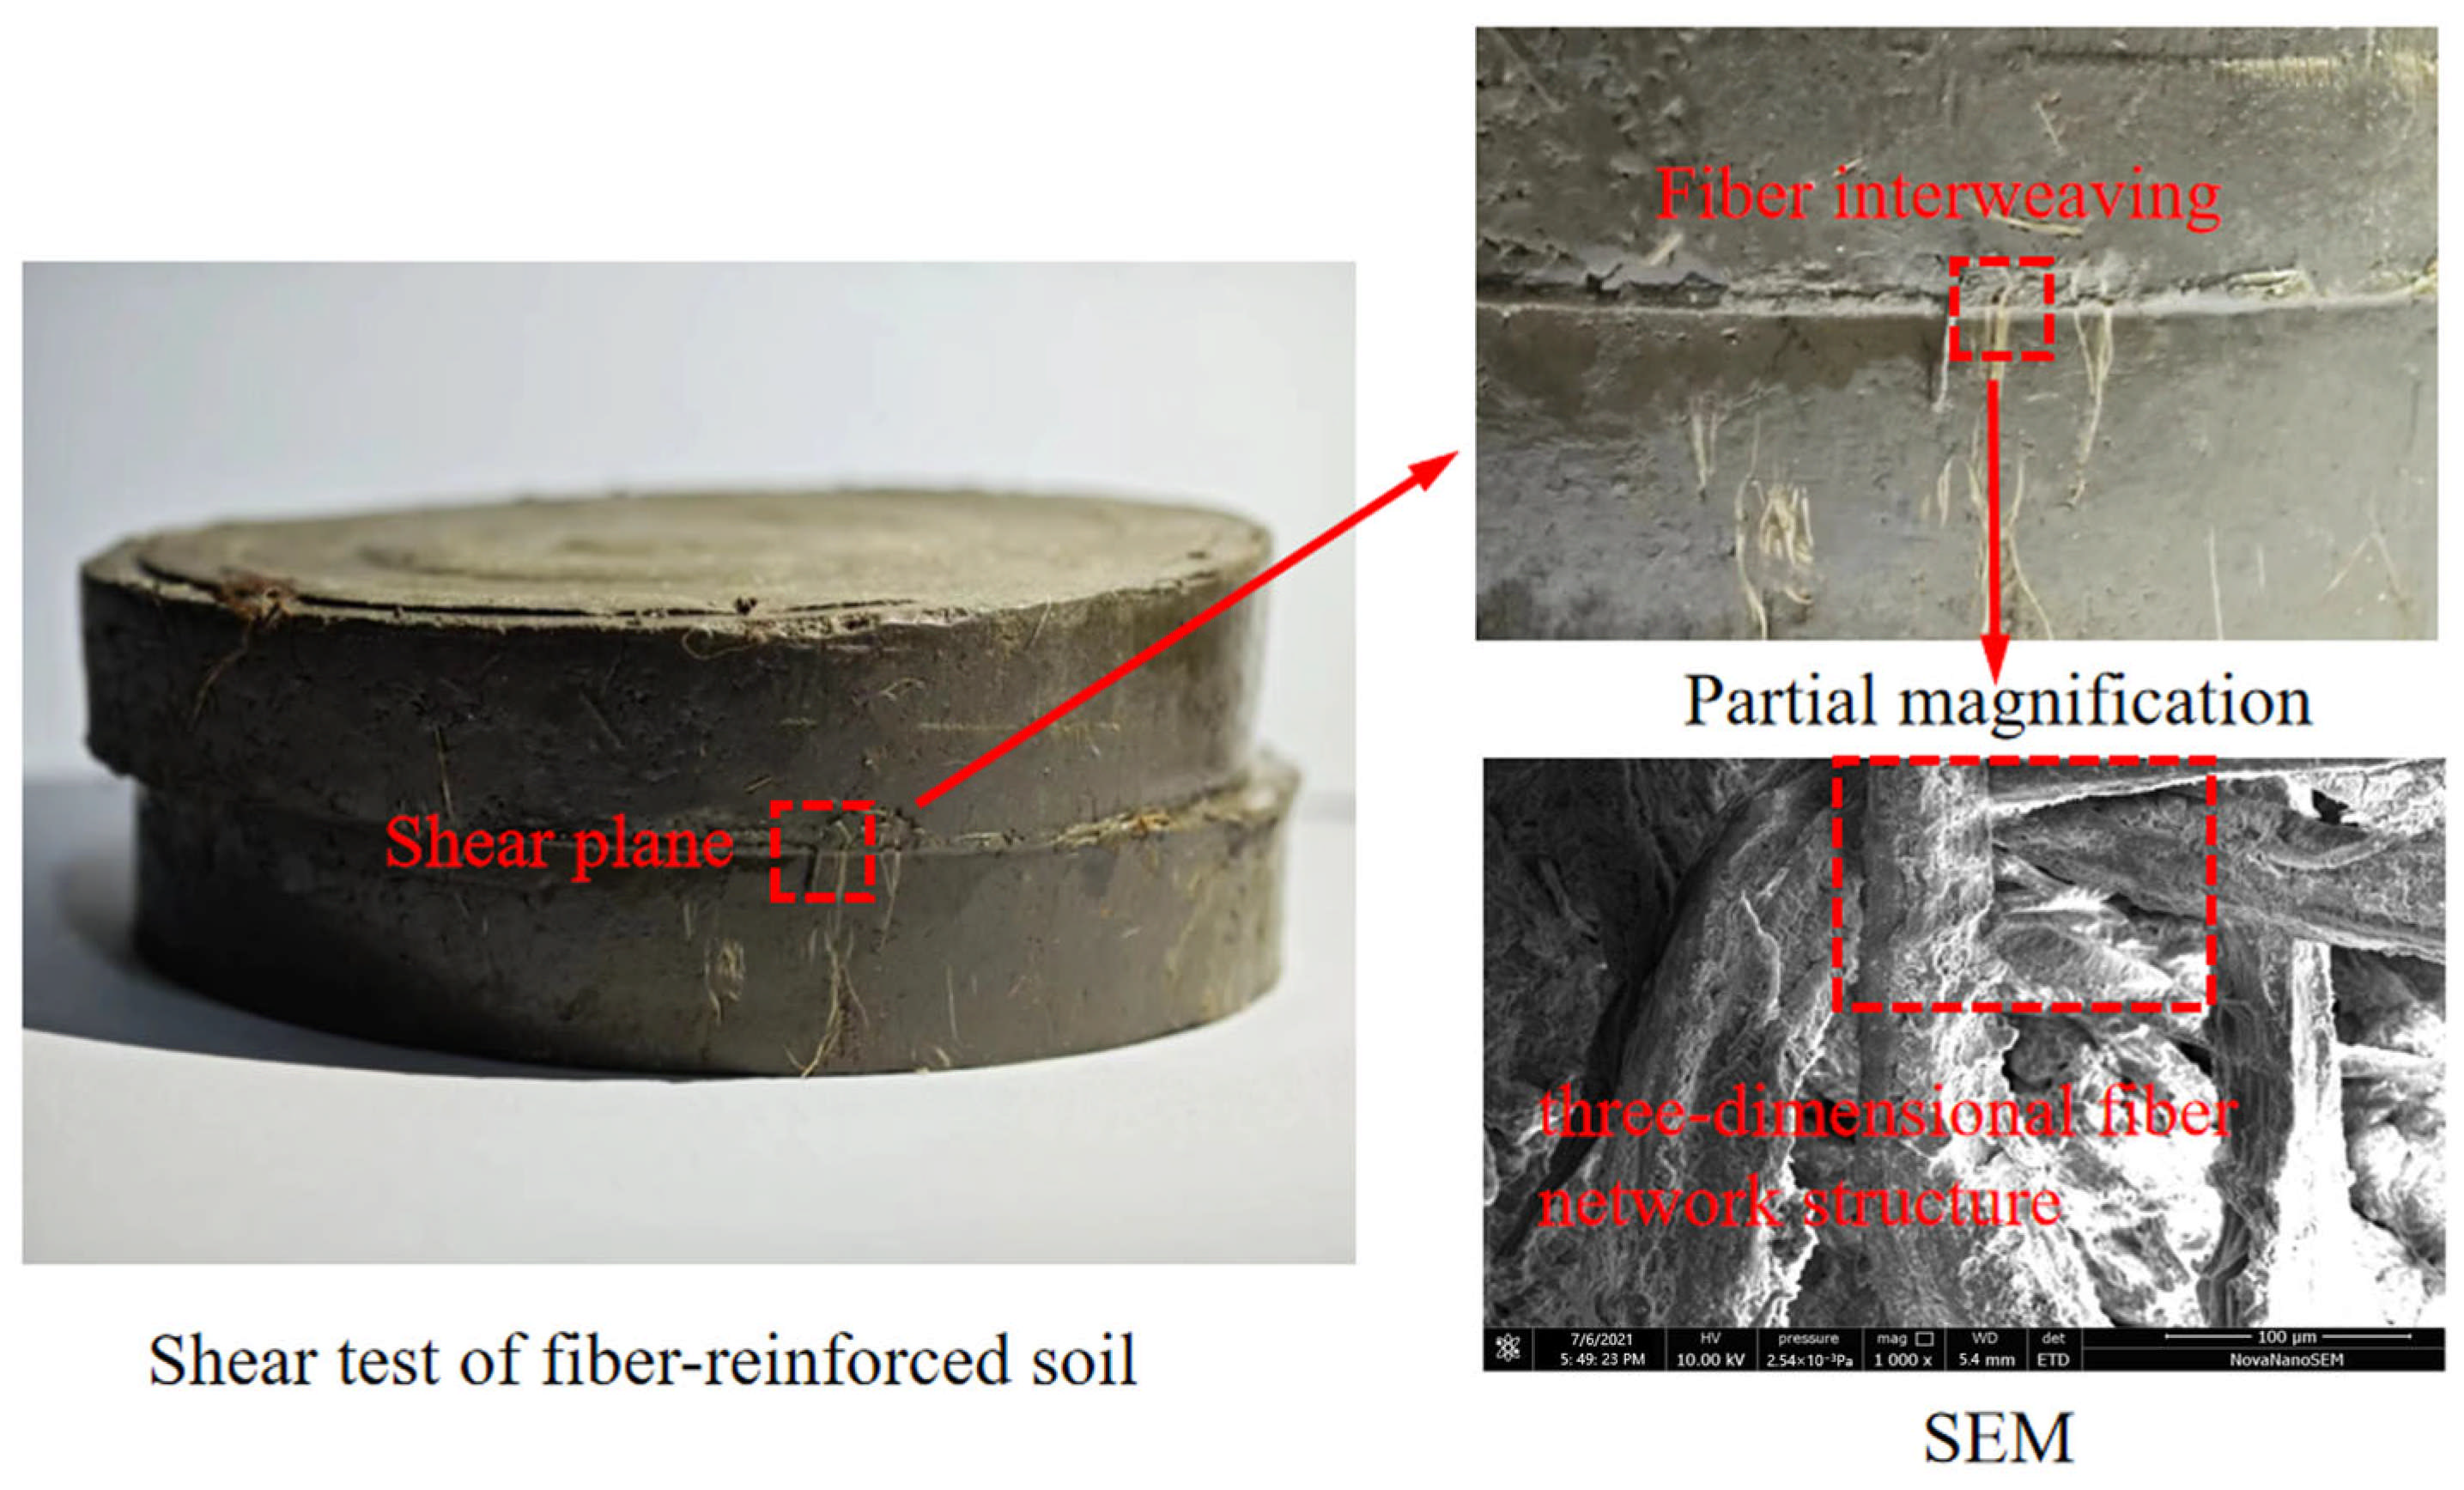
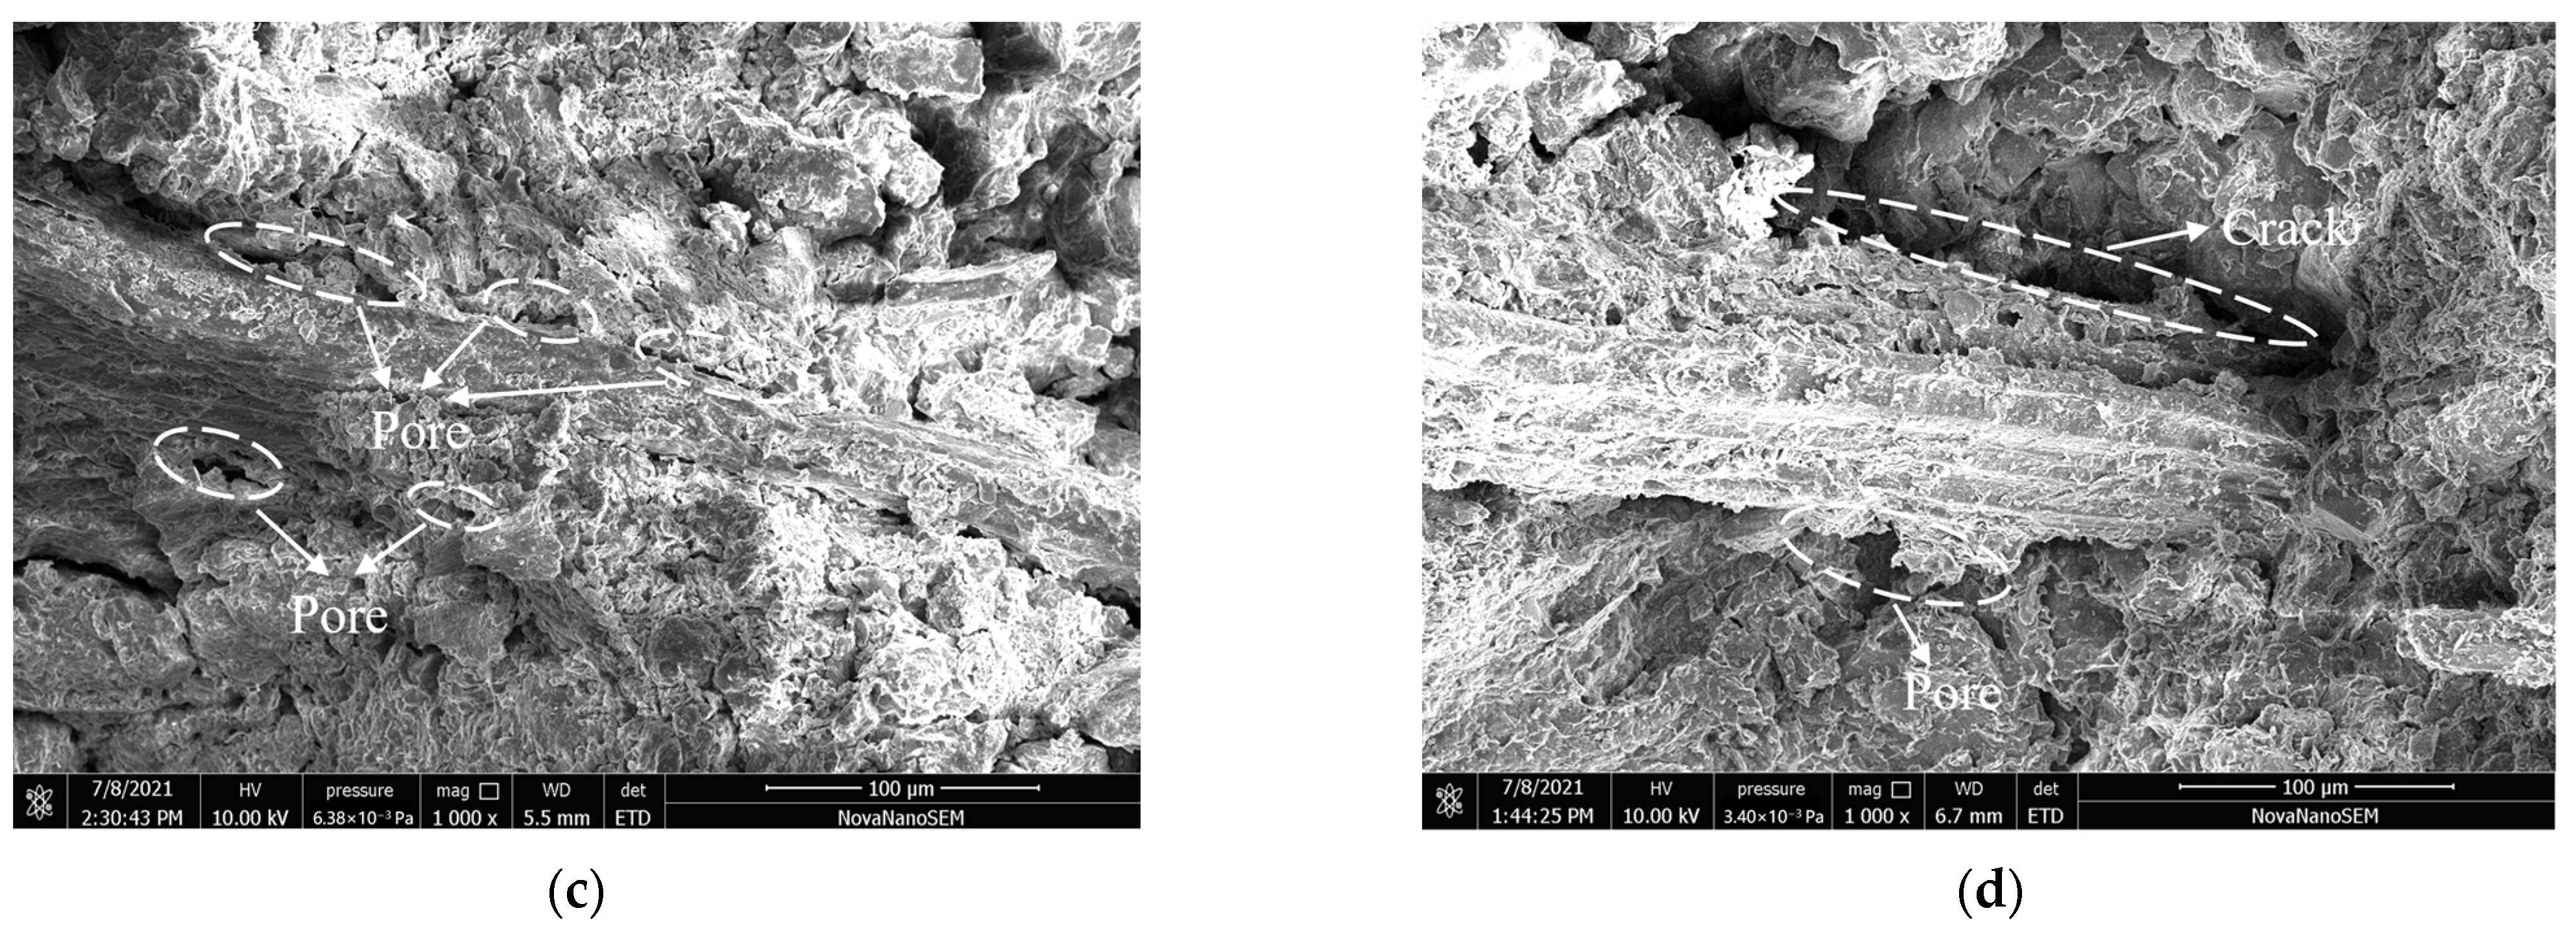
4.4. Interfacial Strength of Fiber–Soil Subjected to Freeze–Thaw Cycles

Figure 9a shows the stress–strain curves from fiber pull-out tests under freeze–thaw cycles. In the absence of freeze–thaw cycles, the pull-out process can be divided into three distinct stages. In the first stage, stress increases almost linearly with strain until it reaches a peak, indicating no relative sliding between the fiber and soil. During this stage, adhesion and friction forces act between the fiber and soil particles. In the second stage, the fiber–soil interface begins to detach, resulting in relative sliding and a subsequent decrease in stress. Prior to reaching its peak stress, the fiber undergoes elastic deformation, thereby storing strain energy at the interface. Once peak stress is reached, shear failure occurs at the interface, leading to the gradual detachment of the fiber and the release of the stored strain energy. In the third stage, the stress stabilizes as strain continues to increase, with sliding friction becoming the dominant force at the fiber–soil interface. The results of the fiber pull-out tests are in accordance with those previously reported by Tang et al. [39] and Zhu et al. [40]. The stress–strain curves for fiber pull-out tests subjected to 1, 5, 10, 20, and 30 freeze–thaw cycles are almost identical, indicating that freeze–thaw cycles do not significantly alter the fiber pull-out failure pattern. Figure 9b illustrates the variation in interfacial strength of fiber–soil subjected to freeze–thaw cycles. Under a vertical load of 50 kPa, the interfacial strengths after 1, 5, 10, 20, and 30 freeze–thaw cycles are 71.81, 56.21, 50.00, 47.65, and 47.53 kPa, respectively, representing decreases of 16.90%, 34.95%, 42.13%, 44.85%, and 44.99% compared to samples that did not undergo freeze–thaw cycles. The interfacial strength initially decreases and subsequently reaches stabilization as the number of freeze–thaw cycles increases. A similar pattern is evident when the vertical loads are 100, 150, and 200 kPa.
Figure 10 shows SEM images of the fiber–soil interface after 0, 5, 10, and 30 freeze–thaw cycles. When no freeze–thaw cycles are applied, the fibers are tightly wrapped by the surrounding soil, with close contact between the fibers and soil particles (Figure 10a). After 5 freeze–thaw cycles, the interface displays a tendency towards loosening, accompanied by the formation of additional pores, which may be indicative of structural damage (Figure 10b). By the 10th cycle, both the length and width of the pores between the fibers and soil particles increase, and small holes develop (Figure 10c). After 30 cycles, the soil exhibits considerable loosening, with the expansion of small holes into larger cavities and the formation of cracks (Figure 10d). This loosening process reduces the contact area between the fibers and the surrounding soil, significantly weakening the fiber–soil interface strength. The fiber pull-out test results demonstrate an exponential decay in interface strength following freeze–thaw cycles (Figure 9b). The loosening of the soil reduces the contact area between the fiber surface and soil particles, leading to a decrease in the normal stress exerted by the soil on the fiber. This, in turn, reduces the adhesion and internal friction angle between the fiber and soil, requiring less force to pull out the fiber, which results in a reduction in the interface strength.

5. Discussion

Natural fiber reinforcement technology enhances soil strength and improves its resistance to environmental impacts, particularly freeze–thaw cycles. Historical engineering practices, as exemplified by the Great Wall of China, Mesopotamian earth embankments, and the Roman Londinium port, demonstrate the incorporation of reeds, wheat straw, or rice straw to enhance soil mechanical properties. In contemporary remote regions, stabilized soil composites with enhanced mechanical strength have been successfully fabricated by incorporating natural fibers into earthen matrices [41]. These cases convincingly demonstrate that fiber reinforcement technology can effectively withstand environmental impacts.
This paper systematically analyzes the shear strength characteristics of fiber-reinforced soil under freeze–thaw cycles, revealing that its strength variation follows an exponential decay pattern. A semi-empirical equation is proposed to describe this behavior. When applied to test data from polypropylene fiber-reinforced soil experiments by Roustaei et al. [6] and glass fiber-reinforced soil experiments by Orakoglu and Liu [27], the proposed equation demonstrated a strong fit, with determination coefficients R2 > 0.9. Consequently, the equation is applicable to strength prediction for soils with varying fiber types and soil properties, providing a theoretical foundation for long-term strength assessment in cold-region engineering.
It should be noted that the proposed equation has been derived based on single freeze–thaw cycle conditions in laboratory settings. Practical engineering environments, however, may involve more complex multi-field coupling effects, such as variations in moisture content, which could challenge the equation’s predictive accuracy. Therefore, future research should focus on integrating multi-factor coupling mechanisms to enhance the equation’s applicability in complex freeze–thaw scenarios.

6. Conclusions

This study comprehensively investigates the mechanisms of strength degradation in straw fiber-reinforced soil subjected to freeze–thaw cycles. A series of tests, including fiber-reinforced soil shear tests, soil shear tests, fiber tensile tests, and fiber pull-out tests, were conducted after 0, 1, 5, 10, 20, and 30 freeze–thaw cycles. The main conclusions are as follows:
(1)
The incorporation of 0.1–0.4% cotton straw fibers into freeze–thaw soil enhances its shear strength by 4.67% to 57.58%, with the degree of improvement positively correlated with the fiber content.
(2)
The shear strength of fiber-reinforced soil decreases exponentially with an increasing number of freeze–thaw cycles under constant load conditions, which can be described by a semiempirical equation developed to estimate the strength.
(3)
SEM reveals that the formation of pores or cracks in the soil, fiber, and fiber–soil interface leads to strength degradation when subjected to freeze–thaw cycles. The strength of the soil, fiber, and fiber–soil interface decreases exponentially with the number of freeze–thaw cycles, significantly contributing to the exponential decrease in the shear strength of the fiber-reinforced soil.
This paper investigates cotton straw fiber-reinforced freeze–thaw soils and proposes an exponential decay equation to support engineering applications. Future research should focus on comparing various natural fibers under freeze–thaw cycles to identify optimal reinforcement materials and fiber content. Additionally, dynamic environmental factors, such as temperature gradients and moisture content variations, should be considered to evaluate degradation prediction models under long-term coupled multi-factor freeze–thaw effects. Once these patterns are clarified, a database of attenuation coefficients can be established. This database can be built using regional data, including soil properties, freeze–thaw cycle frequencies, and minimum temperatures. In practical applications, customized engineering solutions can be developed by analyzing this database through big data techniques, while considering specific project characteristics such as soil composition. This approach enables a precise determination of optimal fiber types and incorporation ratios, thereby improving the efficiency and effectiveness of engineering practices.

Author Contributions

X.Y.: conceptualization; investigation; funding acquisition. X.W.: methodology; data curation. P.Z.: conceptualization; writing—original draft. C.L.: writing—review & editing. C.Q.: supervision, validation. Z.C.: supervision; conceptualization. All authors have read and agreed to the published version of the manuscript.

Funding

This study is supported by Jiangsu Provincial University-Industrial Research Collaboration Project (BY20221035), Qinglan Project of Jiangsu, and National Natural Science Foundation of China (51778556).

Data Availability Statement

Data will be made available on request.

Conflicts of Interest

The authors declare no conflicts of interest.

References

  1. Hansson, K.; Lundin, L.-C. Equifinality and sensitivity in freezing and thawing simulations of laboratory and in situ data. Cold Reg. Sci. Technol. 2006, 44, 20–37. [Google Scholar] [CrossRef]
  2. Özgan, E.; Serin, S.; Ertürk, S.; Vural, I. Effects of freezing and thawing cycles on the engineering properties of soils. Soil Mech. Found. Eng. 2015, 52, 95–99. [Google Scholar] [CrossRef]
  3. Zhang, Y.; Bing, H.; Yang, C.S. Influences of freeze-thaw cycles on mechanical properties of silty clay based on SEM and MIP test. Chin. J. Rock Mech. Eng. 2015, 34 (Suppl. S1), 3597–3603. (In Chinese) [Google Scholar]
  4. Viklander, P. Permeability and volume changes in till due to cyclic freeze/thaw. Can. Geotech. J. 1998, 35, 471–477. [Google Scholar] [CrossRef]
  5. Xu, J.; Ren, J.; Wang, Z.; Wang, S.; Yuan, J. Strength behaviors and meso-structural characters of loess after freeze-thaw. Cold Reg. Sci. Technol. 2018, 148, 104–120. [Google Scholar] [CrossRef]
  6. Roustaei, M.; Eslami, A.; Ghazavi, M. Effects of freeze–thaw cycles on a fiber reinforced fine grained soil in relation to geotechnical parameters. Cold Reg. Sci. Technol. 2015, 120, 127–137. [Google Scholar] [CrossRef]
  7. Qi, J.; Vermeer, P.A.; Cheng, G. A review of the influence of freeze-thaw cycles on soil geotechnical properties. Permafr. Periglac. Process. 2006, 17, 245–252. [Google Scholar] [CrossRef]
  8. Lu, Z.; Xian, S.; Yao, H.; Fang, R.; She, J. Influence of freeze-thaw cycles in the presence of a supplementary water supply on mechanical properties of compacted soil. Cold Reg. Sci. Technol. 2019, 157, 42–52. [Google Scholar] [CrossRef]
  9. Liu, C.; Lv, Y.; Yu, X.; Wu, X. Effects of freeze-thaw cycles on the unconfined compressive strength of straw fiber-reinforced soil. Geotext. Geomembr. 2020, 48, 581–590. [Google Scholar] [CrossRef]
  10. Hohmann-Porebska, M. Microfabric effects in frozen clays in relation to geotechnical parameters. Appl. Clay Sci. 2002, 21, 77–87. [Google Scholar] [CrossRef]
  11. Xiang, B.; Liu, E.; Yang, L. Influences of freezing–thawing actions on mechanical properties of soils and stress and deformation of soil slope in cold regions. Sci. Rep. 2022, 12, 5387. [Google Scholar] [CrossRef]
  12. Yang, A.; Yang, S.; Zhong, X.; Zhang, X. Mechanical properties and structural evolution of sludge-cured lightweight soils subjected to freeze-thaw cycles. KSCE J. Civ. Eng. 2022, 26, 4478–4488. [Google Scholar] [CrossRef]
  13. Zhang, L.; Hu, Z.; Li, H.; She, H.; Wang, X.; Han, X.; Yang, X. Mechanical Properties and Mesostructure Evolution of Fibre-Reinforced Loess under Freeze-Thaw Cycles. Adv. Civ. Eng. 2023, 2023, 3847003. [Google Scholar] [CrossRef]
  14. Yetimoglu, T.; Salbas, O. A study on shear strength of sands reinforced with randomly distributed discrete fibers. Geotext. Geomembr. 2003, 21, 103–110. [Google Scholar] [CrossRef]
  15. Hao, Y.; Cheng, L.; Hao, H.; Shahin, M.A. Enhancing fiber/matrix bonding in polypropylene fiber reinforced cementitious composites by microbially induced calcite precipitation pre-treatment. Cem. Concr. Compos. 2018, 88, 1–7. [Google Scholar] [CrossRef]
  16. Ma, Z.; Xing, Z.; Zhao, Y.; Hu, Y. Dynamic Strength Characteristics of Cement-Improved Silty Clay under the Effect of Freeze-Thaw Cycles. Sustainability 2023, 15, 3333. [Google Scholar] [CrossRef]
  17. Jia, Y.; Liu, Y.; Chen, J. Comparison of solidification characteristics between polymer-cured and bio-cured fly ash in the laboratory. Polymers 2023, 15, 1107. [Google Scholar] [CrossRef]
  18. Xu, G.; Han, Q.; Geng, W.; Yin, J.; Liu, L. Evaluation of fiber reinforcement on the strength behaviors of dredging slurry cemented at high water content. Soils Found. 2023, 63, 101264. [Google Scholar] [CrossRef]
  19. Shalchian, M.M.; Arabani, M. Application of plant-derived fibers in soil reinforcement on experimental, numerical, and case study scales: A review. Bull. Eng. Geol. Environ. 2023, 82, 19. [Google Scholar] [CrossRef]
  20. Wang, D.-L.; Tang, C.-S.; Pan, X.-H.; Liu, B.; Shi, B. Coupling effect of fiber reinforcement and MICP stabilization on the tensile behavior of calcareous sand. Eng. Geol. 2023, 317, 107090. [Google Scholar] [CrossRef]
  21. Su, X.; Yu, L.; Chen, J.; Li, H.; Liu, Q.; Zhang, H.; Liu, T. Mechanical properties and microstructure of SWGA-BF improved rock muck discharged from slurry shield tunnels. Constr. Build. Mater. 2023, 409, 133969. [Google Scholar] [CrossRef]
  22. Salimi, M.; Payan, M.; Hosseinpour, I.; Arabani, M.; Ranjbar, P.Z. Effect of glass fiber (GF) on the mechanical properties and freeze-thaw (F-T) durability of lime-nanoclay (NC)-stabilized marl clayey soil. Constr. Build. Mater. 2024, 416, 135227. [Google Scholar] [CrossRef]
  23. Güllü, H.; Khudir, A. Effect of freeze–thaw cycles on unconfined compressive strength of fine-grained soil treated with jute fiber, steel fiber and lime. Cold Reg. Sci. Technol. 2014, 106, 55–65. [Google Scholar] [CrossRef]
  24. Dang, L.C.; Fatahi, B.; Khabbaz, H. Behaviour of expansive soils stabilized with hydrated lime and bagasse fibres. Procedia Eng. 2016, 143, 658–665. [Google Scholar] [CrossRef]
  25. Zaimoğlu, A.Ş.; Akbulut, R.K.; Arasan, S. Effect of freeze-thaw cycles on strength behavior of compacted chicken quill-clay composite in undrained loading. J. Nat. Fibers 2016, 13, 299–308. [Google Scholar] [CrossRef]
  26. Yarbaşi, N. Effect of freezing-thawing on clayey soils reinforced with human hair fibers. J. Nat. Fibers 2020, 17, 921–931. [Google Scholar] [CrossRef]
  27. Orakoglu, M.E.; Liu, J. Effect of freeze-thaw cycles on triaxial strength properties of fiber-reinforced clayey soil. KSCE J. Civ. Eng. 2017, 21, 2128–2140. [Google Scholar] [CrossRef]
  28. Tang, Q.; Shi, P.; Zhang, Y.; Liu, W.; Chen, L. Strength and Deformation Properties of Fiber and Cement Reinforced Heavy Metal-Contaminated Synthetic Soils. Adv. Mater. Sci. Eng. 2019, 2019, 5746315. [Google Scholar] [CrossRef]
  29. Jiang, D.; An, P.; Cui, S.; Sun, S.; Zhang, J.; Tuo, T. Effect of modification methods of wheat straw fibers on water absorbency and mechanical properties of wheat straw fiber cement-based composites. Adv. Mater. Sci. Eng. 2020, 2020, 5031025. [Google Scholar] [CrossRef]
  30. Yang, Y.; Shi, J.; Qian, X. Effect of temperature on internal shear strength mechanism of needle-punched GCL. Sustainability 2021, 13, 4585. [Google Scholar] [CrossRef]
  31. GB/T 50123-1999; Standard for Soil Test Method. Ministry of Construction: Beijing, China, 1999.
  32. Kravchenko, E.; Liu, J.; Niu, W.; Zhang, S. Performance of clay soil reinforced with fibers subjected to freeze-thaw cycles. Cold Reg. Sci. Technol. 2018, 153, 18–24. [Google Scholar] [CrossRef]
  33. Chen, C.; Guo, W.; Ren, Y.X. Properties and microscopic analysis of lignin fiber-reinforced soils under freeze-thaw cycles. Chin. J. Geotech. Eng. 2020, 42 (Suppl. S2), 135–140. (In Chinese) [Google Scholar]
  34. Gao, Z.; Zhong, X.; Ma, H.; Liu, F.; Ma, J.; Wang, Q. Effect of freeze-thaw cycles on shear strength properties of loess reinforced with lignin fiber. Geofluids 2022, 2022, 8685553. [Google Scholar] [CrossRef]
  35. ASTM D3822-07; Standard Test Method for Tensile Properties of Single Textile Fibers. ASTM International: West Conshohocken, PA, USA, 2007.
  36. Sun, M.R. Study on Mechanical Property of Straw Fiber Reforced Soil in Different Environment. Master’s Thesis, AnHui University of Science and Technology, Huainan, China, 2022. (In Chinese). [Google Scholar]
  37. Yzombard, A.; Gordon, S.G.; Miao, M. Morphology and tensile properties of bast fibers extracted from cotton stalks. Text. Res. J. 2014, 84, 303–311. [Google Scholar] [CrossRef]
  38. Lin, T. The Study on Properties of Cotton Stalk Fibre and Composites. Ph.D. Thesis, Chinese Academy of Forestry, Beijing, China, 2012. (In Chinese). [Google Scholar]
  39. Tang, C.S.; Shi, B.; Zhao, L.Z. Interfacial shear strength of fiber reinforced soil. Geotext. Geomembr. 2010, 28, 54–62. [Google Scholar] [CrossRef]
  40. Zhu, H.H.; Zhang, C.C.; Tang, C.S.; Shi, B.; Wang, B.J. Modeling the pullout behavior of short fiber in reinforced soil. Geotext. Geomembr. 2014, 42, 329–338. [Google Scholar] [CrossRef]
  41. Liu, B.S.; Tang, C.S.; Li, J.; Wang, D.Y.; Zhu, K.; Tang, W. Research progress on engineering properties of fiber-reinforced soils. J. Eng. Geol. 2013, 21, 540–547. (In Chinese) [Google Scholar]
Figure 1. Stress–strain curves of fiber-reinforced soil subjected to freeze–thaw cycles under a vertical load of 100 kPa with fiber contents of (a) 0.1%, (b) 0.2%, and (c) 0.4%.
Buildings 15 00842 g001
Figure 2. Variation in shear strength under freeze–thaw cycles with fiber contents of (a) 0.1%, (b) 0.2%, and (c) 0.4%.
Buildings 15 00842 g002
Figure 3. Mechanisms of shear strength degradation in straw fiber-reinforced soil under freeze–thaw conditions.
Buildings 15 00842 g003
Figure 4. Variation in shear strength of soil subjected to freeze–thaw cycles (a) stress–strain curves; (b) shear strength curves.
Buildings 15 00842 g004
Figure 5. Microscopic structure of soil after the (a) 0th, (b) 5th, (c) 10th, and (d) 30th freeze–thaw cycles.
Buildings 15 00842 g005
Figure 6. Variation in tensile strength of fibers subjected to freeze–thaw cycles: (a) stress–strain curves; (b) tensile strength curves.
Buildings 15 00842 g006
Figure 7. SEM images of straw fiber after the (a) 0th, (b) 5th, (c) 10th, and (d) 30th freeze–thaw cycles.
Buildings 15 00842 g007
Figure 8. Three-dimensional fiber network structure of fiber-reinforced soil.
Buildings 15 00842 g008
Figure 9. Variation in interfacial strength of fiber–soil subjected to freeze–thaw cycles: (a) stress–strain curves; (b) interfacial strength curves.
Buildings 15 00842 g009
Figure 10. SEM images of fiber–soil interface after the (a) 0th, (b) 5th, (c) 10th, and (d) 30th freeze–thaw cycles.
Buildings 15 00842 g010aBuildings 15 00842 g010b
Table 1. Physical and mechanical properties of soil.
Natural
Water Content
Liquid LimitPlastic LimitSpecific GravityOptimum
Water Content
Maximum
Dry Density
Organic
Matter Content
%%% %g/cm3%
38.0057.7522.902.7223.041.572.93
Table 2. Physical and mechanical properties of cotton straw fiber.
LengthDiameterTensile StrengthDensityElongationModulus of Elasticity
mmmmMPag/cm3%MPa
12.000.10103.391.507.00–8.005500.00
Table 3. Fitting parameters for shear strength under freeze–thaw conditions.
AuthorSoilFiber TypeFreeze–Thaw CyclesFiber ContentVertical LoadabcR2
Roustaei et al. [6]Fine grained soilPolypropylene fiber91.5%30447.2−4.9728.90.998
90389.8−3.4990.00.939
Chen et al. [33]Soft clayLignin fiber90.7%30075.2−0.8503.90.910
Gao et al. [34]LoessLignin Fiber101.5%8020.0−0.4438.20.977
3.0%8041.9−0.1455.20.955
Orakoglu and Liu [27]ClayGlass fiber100.5%100836.8−5.5375.70.920
Basalt fiber100.5%100975.8−6.1270.40.991
Disclaimer/Publisher’s Note: The statements, opinions and data contained in all publications are solely those of the individual author(s) and contributor(s) and not of MDPI and/or the editor(s). MDPI and/or the editor(s) disclaim responsibility for any injury to people or property resulting from any ideas, methods, instructions or products referred to in the content.

