Article

Study on Eccentric Compression Behavior of Precast Stratified Concrete Composite Column with Inserted Steel Tube

Key Laboratory of Building Structural Retrofitting and Underground Space of Ministry of Education, School of Civil Engineering, Shandong Jianzhu University, Jinan 250101, China
*
Author to whom correspondence should be addressed.
Buildings 2025, 15(5), 826; https://doi.org/10.3390/buildings15050826
Submission received: 9 February 2025 / Revised: 28 February 2025 / Accepted: 4 March 2025 / Published: 5 March 2025
(This article belongs to the Section Building Structures)

Abstract

:
In order to improve the technical economy of steel-reinforced concrete structures and to promote the development of prefabricated concrete structures, a new type of partial precast steel-reinforced concrete column (precast stratified concrete composite column with inserted steel tube, PSCCST column) was proposed and studied in this paper. Six PSCCST column specimens were tested to investigate their behavior under eccentric loading. The failure state, ultimate bearing capacities, load–strain relationship, as well as load-deflection curves were emphatically investigated. The failure modes of the PSCCST columns under eccentric compression and corresponding bearing capacity Nu calculation methods were proposed based on experimental research and analysis. The results of the study indicated that there are three main failure modes, which are compressive-type failure mode, total-yield-type failure mode, and tensile-type failure mode. The first two modes are preferable due to their more effective material utilization. The Nu of the PSCCST column was found to decrease obviously with the increase of eccentricity e. The deformation capacity denoted by the horizontal lateral deflection corresponding to Nu increased with the increase of e. Moreover, the proposed Nu calculation methods were proven to have high accuracy by the comparison with the experimental results (the average ratio of the calculated values to the experimental values was 0.95).

1. Introduction

To further enhance the technical and economic efficiency of buildings, various composite components and structures have emerged based on conventional steel structures and concrete structures [1,2]. Steel-reinforced concrete (SRC) structures can offer the benefits of both pure steel and reinforced concrete structures simultaneously [3,4,5]. In order to achieve better construction efficiency and save labor, precast concrete structures have emerged and been developed as the times require. Precast steel-reinforced concrete (PSRC) structures have attracted much attention regarding the present development trend of prefabricated concrete structures. However, the complex construction procedure and less reliable connection quality of components in ordinary PSRC structures have created a barrier to the actual application [6]. The excessive weight of prefabricated components also causes difficulties in hoisting and transportation. Therefore, partially precast steel-reinforced concrete structures may be a more reasonable solution. A centrifugally formed hollow-core precast column with multi-interlocking spirals and cast-in-place core-filled concrete has been proposed [7]. In addition, two kinds of partially precast steel-reinforced concrete columns (PPSRC column and HPSRC column) have been developed [8,9].
It is worth noting that most of the existing partially precast steel-reinforced concrete columns adopt relatively complex forms of steel sections or stirrups. Moreover, they do not take advantage of the potential differences in material selection between precast concrete and cast-in-place concrete. Therefore, an innovative partially precast steel-reinforced concrete column—precast stratified concrete composite column with inserted steel tube (PSCCST column)—was proposed in this paper. The PSCCST column includes a precast part with a reinforcement cage, square steel tube, and post-cast concrete part, as shown in Figure 1. The precast part with the reinforcement cage and hollow hole can be completed in the factory and then transported to the construction site. Subsequently, the square steel tube with a simple cross-sectional form can be inserted into the vertical hole, and then the concrete can be poured between the outer wall of the steel tube and the inner wall of the precast concrete part. The square steel tube simultaneously serves to connect the upper and lower columns. The precast part with the hollow hole can be applied as the formwork for casting post-cast concrete on site, which can reduce the labor and workload markedly. In addition, the precast part and post-cast concrete part usually differ in concrete type and grade. The post-cast part usually employs expansive concrete and has a higher concrete strength grade than the precast part.
As vertical load-bearing component, the combination of axial load and bending moment load (eccentric load), is the basic load type of the PSCCST column. The mechanical performance of the PSCCST column under eccentric load is of particular concern.
Research on the mechanical properties of the ordinary section forms of SRC columns (H-shaped steel, cross-shaped steel, or circular steel tube) under eccentric load were first developed [10,11]. Subsequently, research on the bearing capacity of SRC columns with uncommon section forms was proposed. For example, a study was carried out on square section columns with circular steel tubes (filled with concrete internally and wrapped with concrete externally) to investigate the mechanical performance under eccentric load [12]. For SRC columns with asymmetric section steel, specialized research was carried out to explore the influence of section steel eccentricity on the bearing capacity, and then a bearing capacity calculation manner, with the concept of changing the asymmetric section into a symmetric section, was put forward [13]. Aiming at a kind of partially prefabricated steel-reinforced concrete (PPSRC) column consisting of a precast part and a cast-in-place part, the effects of eccentric distance, cast-in-place concrete strength, and shear studs on the bearing capacity were studied, and the bearing capacity calculation method was proposed [14]. For the bearing capacity of square hollow steel-reinforced concrete columns, a kind of calculation method based on superposition principle was established using the results of the experiment and finite element analysis [15]. For the steel-reinforced concrete columns with octagonal sections and square hollows, the behavior under eccentric compressive load was studied, and then the bearing capacity calculation equations were established based on the principle of limit equilibrium [16]. Aiming at L-shaped steel-reinforced concrete columns, after being subjected to high temperature, eccentric compression bearing capacity was specifically studied [17]. However, the existing literature on the eccentric bearing capacity of SRC columns is not very suitable for PSCCST columns, given the distinctions in their section forms and steel types.
For the design codes related to steel-reinforced concrete columns, such as ACI Code-318 [18], ASCE/SEI 41 [19], and CEB-FIP Model Code 90 [20], the calculation method for the eccentric bearing capacity of steel-reinforced concrete columns can cover square steel tubes in theory, but they do not take into account when there are two different types of concrete on the cross-section.
Therefore, for PSCCST columns, the eccentric bearing capacity calculation method has yet to be developed. A comprehensive study was conducted to explore the mechanical behavior of PSCCST columns under eccentric loading, using a combination of theoretical analysis and experimental testing. Finally, a corresponding calculation method for the bearing capacity of PSCCST columns was proposed. Based on the structural descriptions and calculation formulas presented in this paper, researchers in this field can obtain technical references for further innovation. Practitioners in the industry are expected to select this type of PSCCST column for actual engineering projects and be able to conduct reasonable designs quickly.

2. Experimental Programs

A diagram of the PSCCST column section under eccentric load (axial force N and bending moment M) is shown in Figure 2.
The dimensions and parameters of the PSCCST column are illustrated in Figure 2. h1 is the height of the precast part. h2 is the height of the post-cast concrete part. h3 is the height of the square steel tube. The widths of the precast concrete part, post-cast concrete part, and steel tube are represented by b1, b2, and b3, respectively, while t1, t2, and t3 indicate the vertical thickness of each part. The horizontal thickness of the precast part is denoted by t′1. The horizontal thickness of the post-cast concrete part is denoted by t′2. The distance from the action point of the lower reinforcement bars to the lower edge of the whole section is represented by as, and h0 is the effective height of the section, with h1 = h0as. Additionally, the vertical distance from the neutral axis to the upper edge of the whole section is denoted by xc. The compression zone of the section is located above the neutral axis. The tensile zone of the section is located below the neutral axis.
In addition, the upper side of the steel tube is known as the upper flange, the lower side is the lower flange, the left side is the left web, and the right side is the right web.

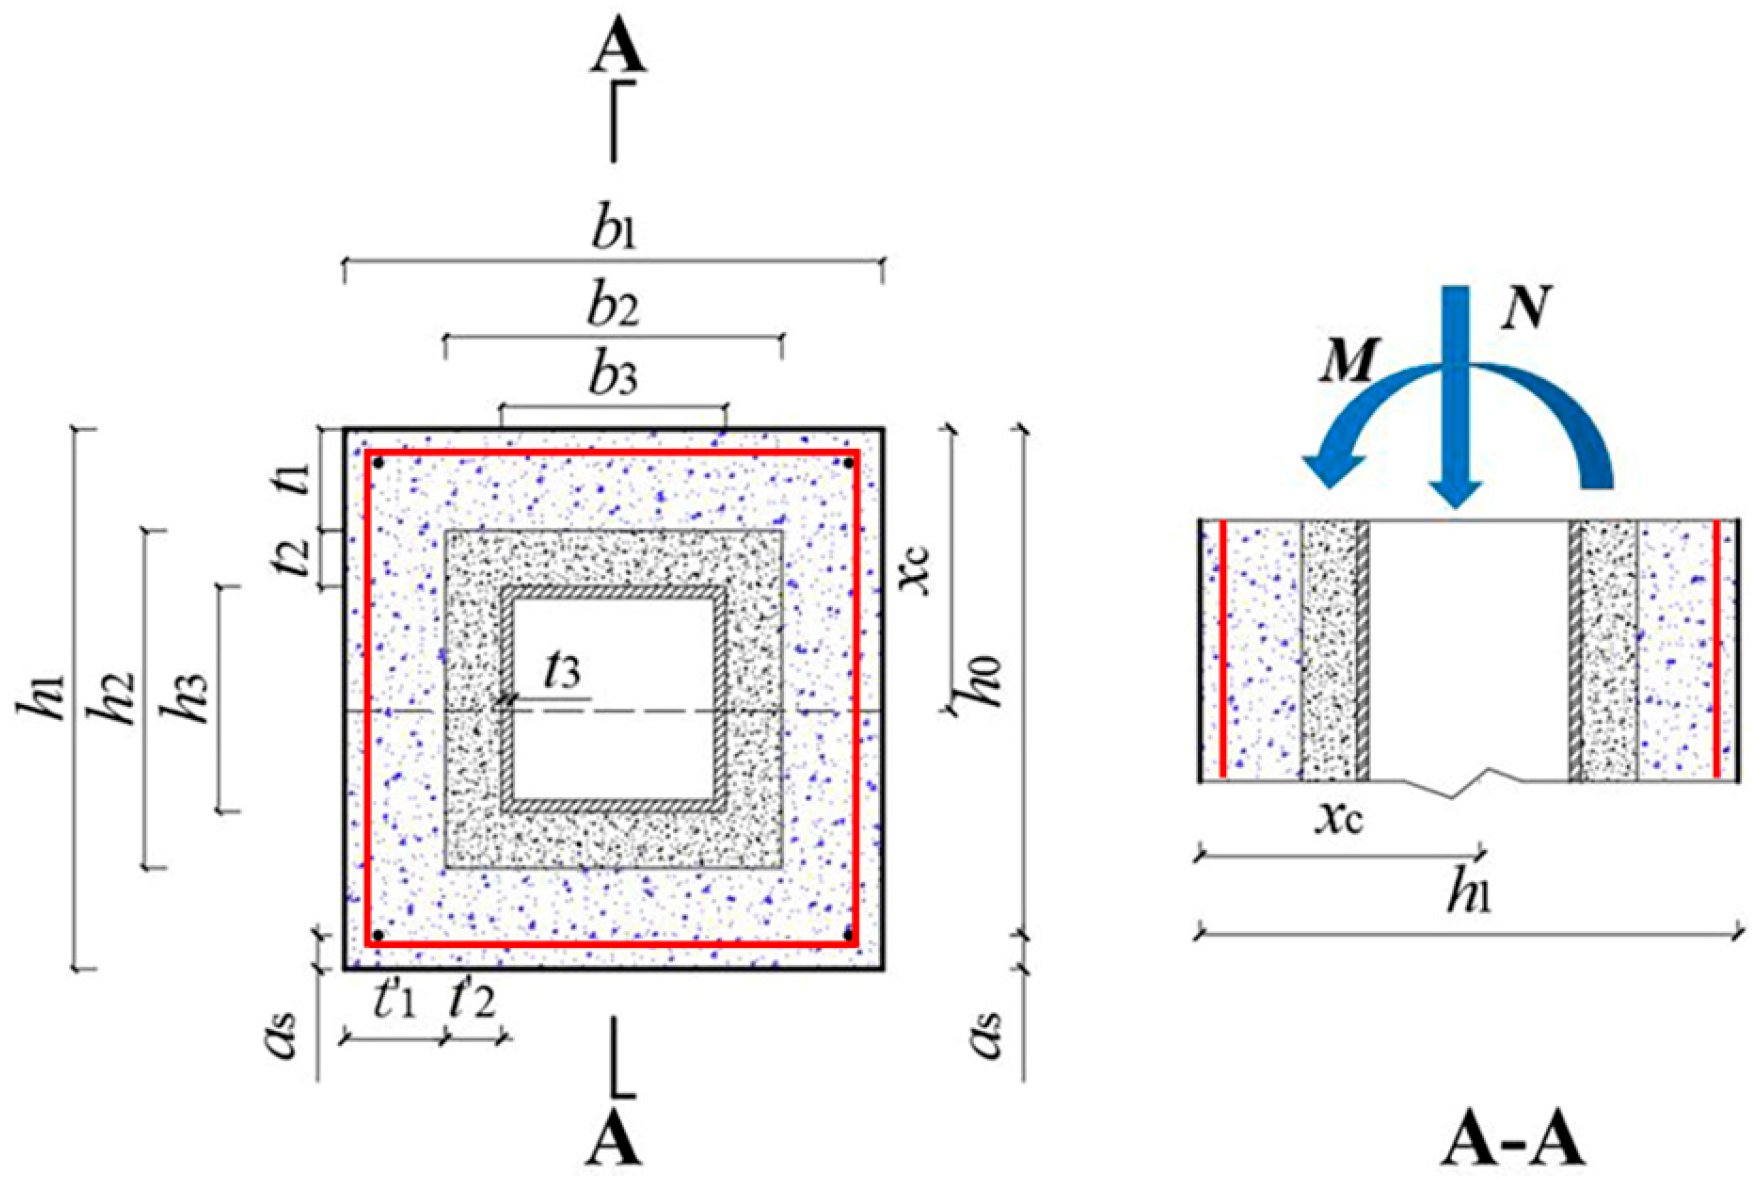
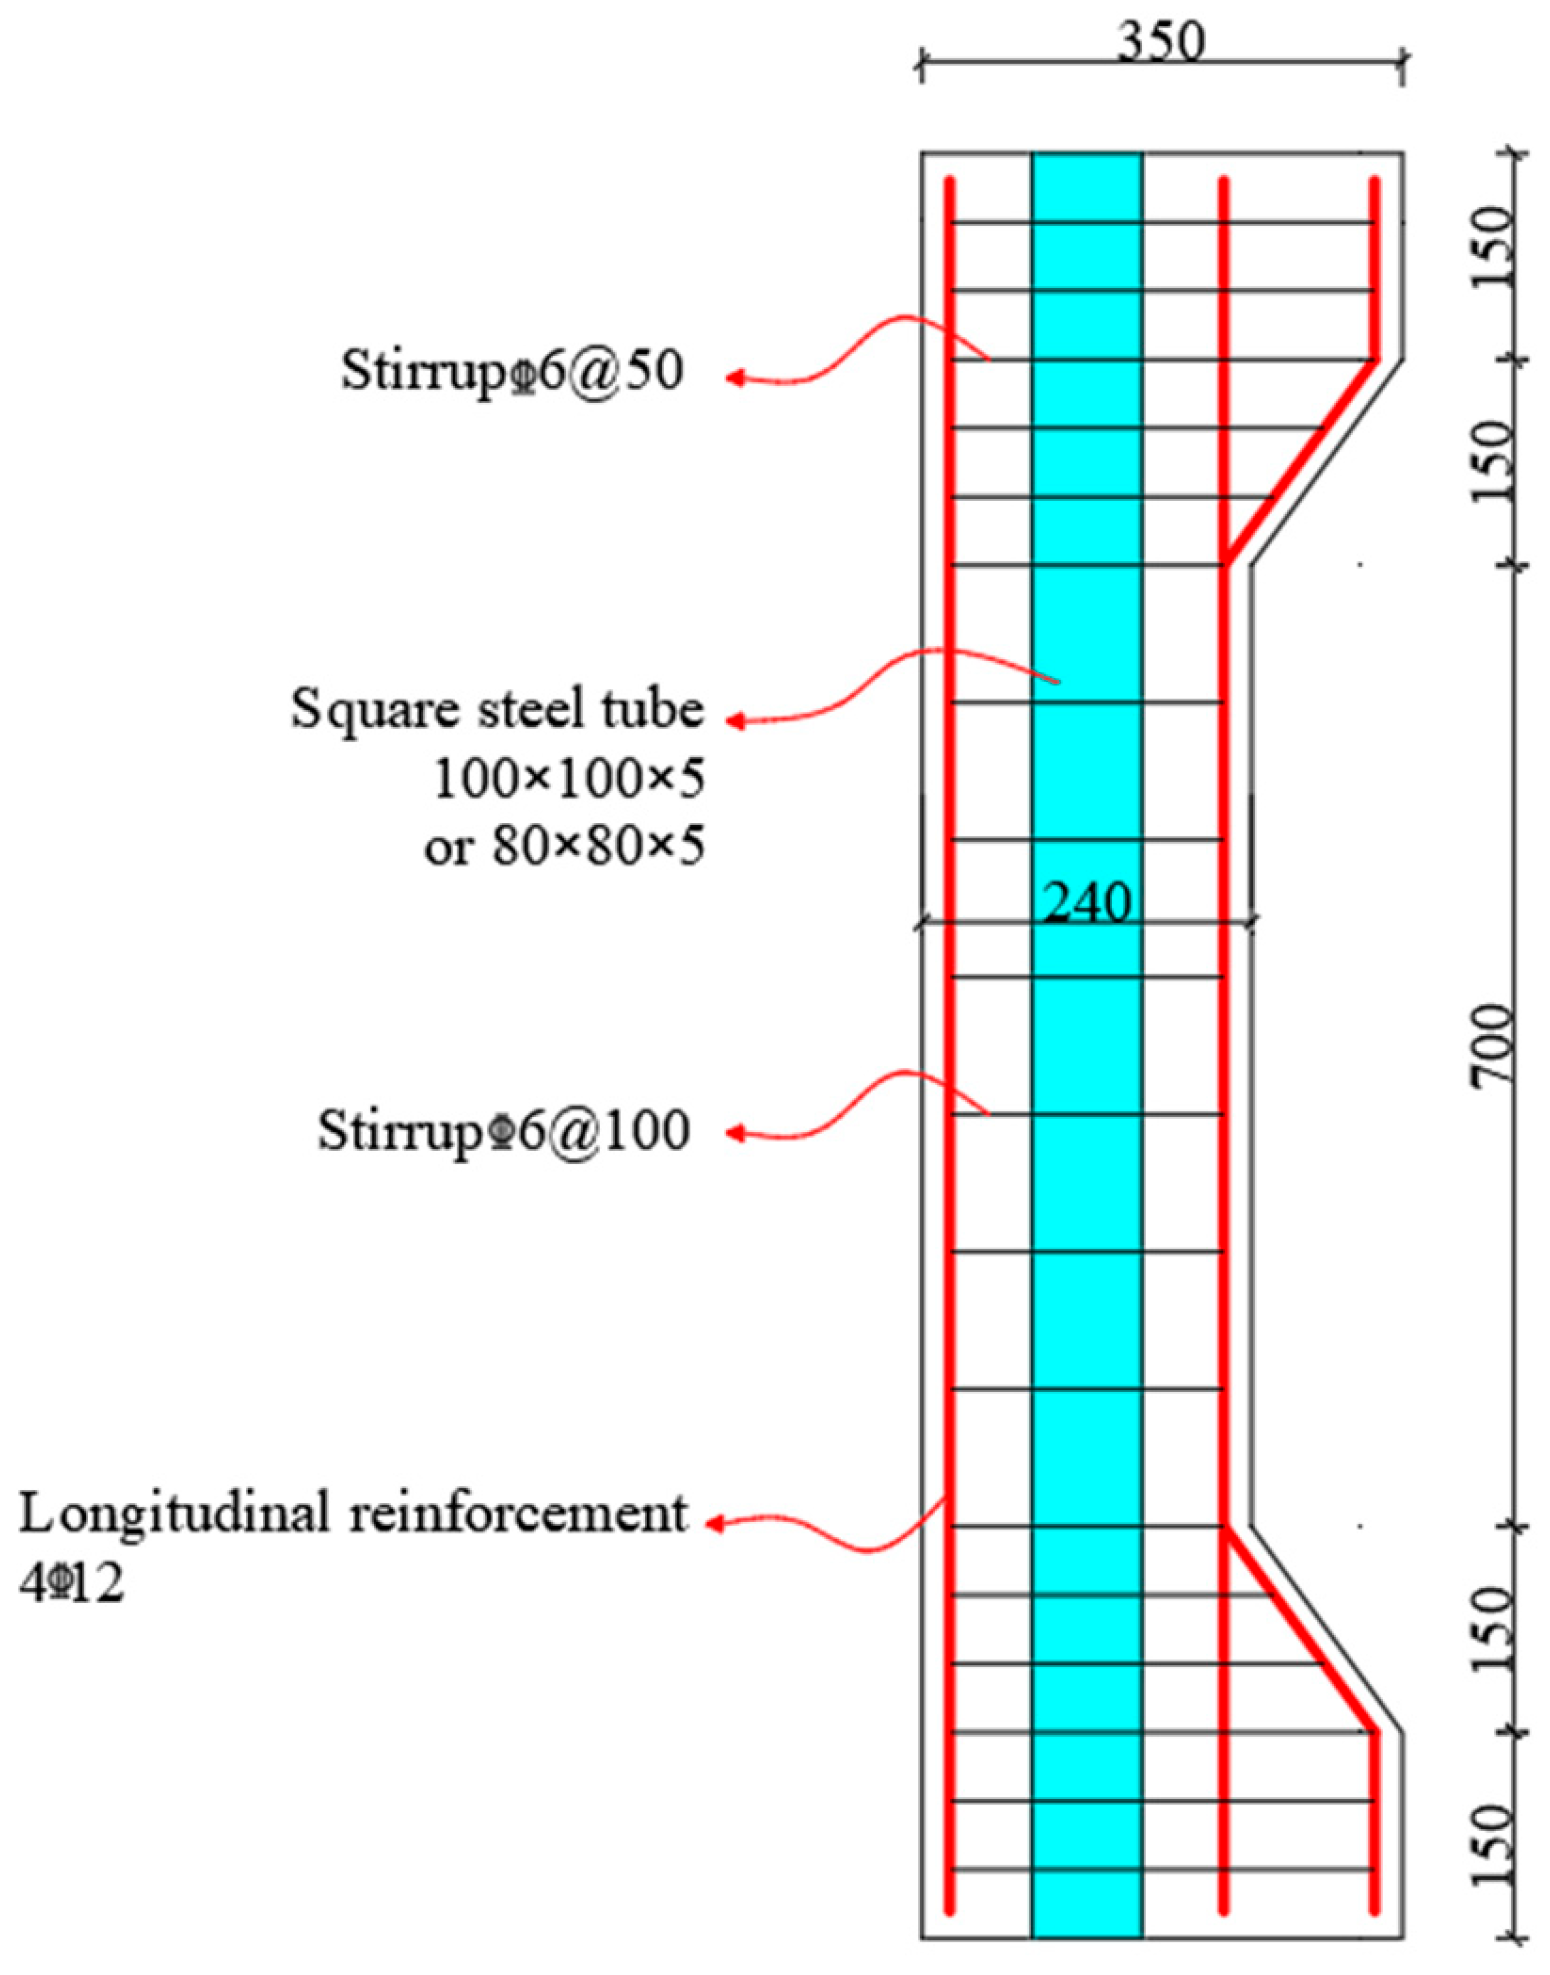
2.1. Specimens and Material

The experimental program encompassed six identically dimensioned PSCCST column specimens. Taking into account the commonly used wall thickness dimensions and the requirements of the modular system, the cross-sectional dimension was measured as 240 mm × 240 mm. To prevent the premature failure of end portions of specimens, enlarged heads were disposed near the two ends. The total height of the specimens was 1300 mm, among which the effective height of the PSCCST column was 700 mm. The ratio of the effective height of the PSCCST columns to the height of their cross-sections was less than 4, and they can be considered short columns [21]. Based on the cross-sectional dimensions of the specimens and the current commonly used square steel tube models, two types of square steel tubes with side lengths of 100 mm and 80 mm, respectively, were selected. For the six test specimens, three of them used steel tubes with a side length of 80 mm, and the other three used steel tubes with a side length of 100 mm. The wall thickness of all steel tubes was 5 mm. The strength grade Q235 was selected because it is the most commonly used strength grade in the construction field. In the precast part of each specimen, four HRB400 longitudinal reinforcement bars, with a diameter of 12 mm and HRB400 stirrups with a diameter of 6 mm and a spacing of 100 mm, were used to form the reinforcement cages. For both enlarged heads of the specimens, smaller stirrup spacing (50 mm) was employed internally. The protective layer had a thickness of 15 mm, resulting in as =27 mm. Details of the specimens are depicted in Figure 3.
For three specimens using square steel tubes with a side length of 80 mm, the minimum value of the load eccentricity e0 was set as 20 mm, which corresponds to a situation in which the eccentric compression is not very obvious. Then, the values of e0 were increased at intervals of 110 mm and 70 mm, respectively, corresponding to the situation in which the eccentric compression gradually increases. For three specimens using square steel tubes with a side length of 100 mm, the minimum value of the load eccentricity e0 was set as 40 mm, which corresponds to the situation in which the eccentric compression is not very obvious. Then, the values of e0 were also increased at intervals of 110 mm and 70 mm, respectively, corresponding to the situation in which the eccentric compression gradually increases. A complete list of information about the specimens is shown in Table 1.
The construction of each specimen can be divided into two main steps: Firstly, the reinforcement cage and formwork of the precast part were prepared, and then concrete was poured to form the precast part. Secondly, a steel tube was placed in the hollow part inside the specimen after removing the formwork, and then post-cast concrete was poured to fill the gap between the precast part and the steel tube.
The concrete strength grade of the precast part is C30 and the strength grade of the post-cast part is C40. The mix proportion design is shown in Table 2.
There is an expansive amount of agent in the post-cast concrete, and the dosage is 40 kg/m3. After 28 d of curing, the main mechanical properties of the precast concrete and post-cast concrete were obtained. For precast concrete, the compressive strength average value is 39.03 MPa (cube crushing strength), flexural strength average value is 4.22 MPa, tensile strength average value is 2.16 MPa, and elastic modulus Ec is 30,000 MPa. For post-cast concrete, the compressive strength average value is 46.98 MPa (cube crushing strength), flexural strength average value is 5.06 MPa, tensile strength average value is 2.46 MPa, and elastic modulus Ec is 32,500 MPa. The material performance indicators meet the requirements of the GB 50010-2010 Concrete structure design code [22].
Tensile tests were carried out for the HRB400 reinforcement bars and Q235 steel tube to determine the main mechanical properties. For the HRB400 reinforcement bars, the yield strength is 413 MPa, ultimate tensile strength is 611 MPa, and the elongation is 18.8%. The elastic modulus Es is 209,237 MPa. The material performance indicators meet the requirements of the GB 1499.2-2024 [23]. For the Q235 steel tube, the yield strength is 253 MPa, ultimate tensile strength is 405 MPa, and the elongation is 27.4%. The elastic modulus Es is 201,000 MPa. The material performance indicators meet the requirements of the GB/T 8162-2018 [24].

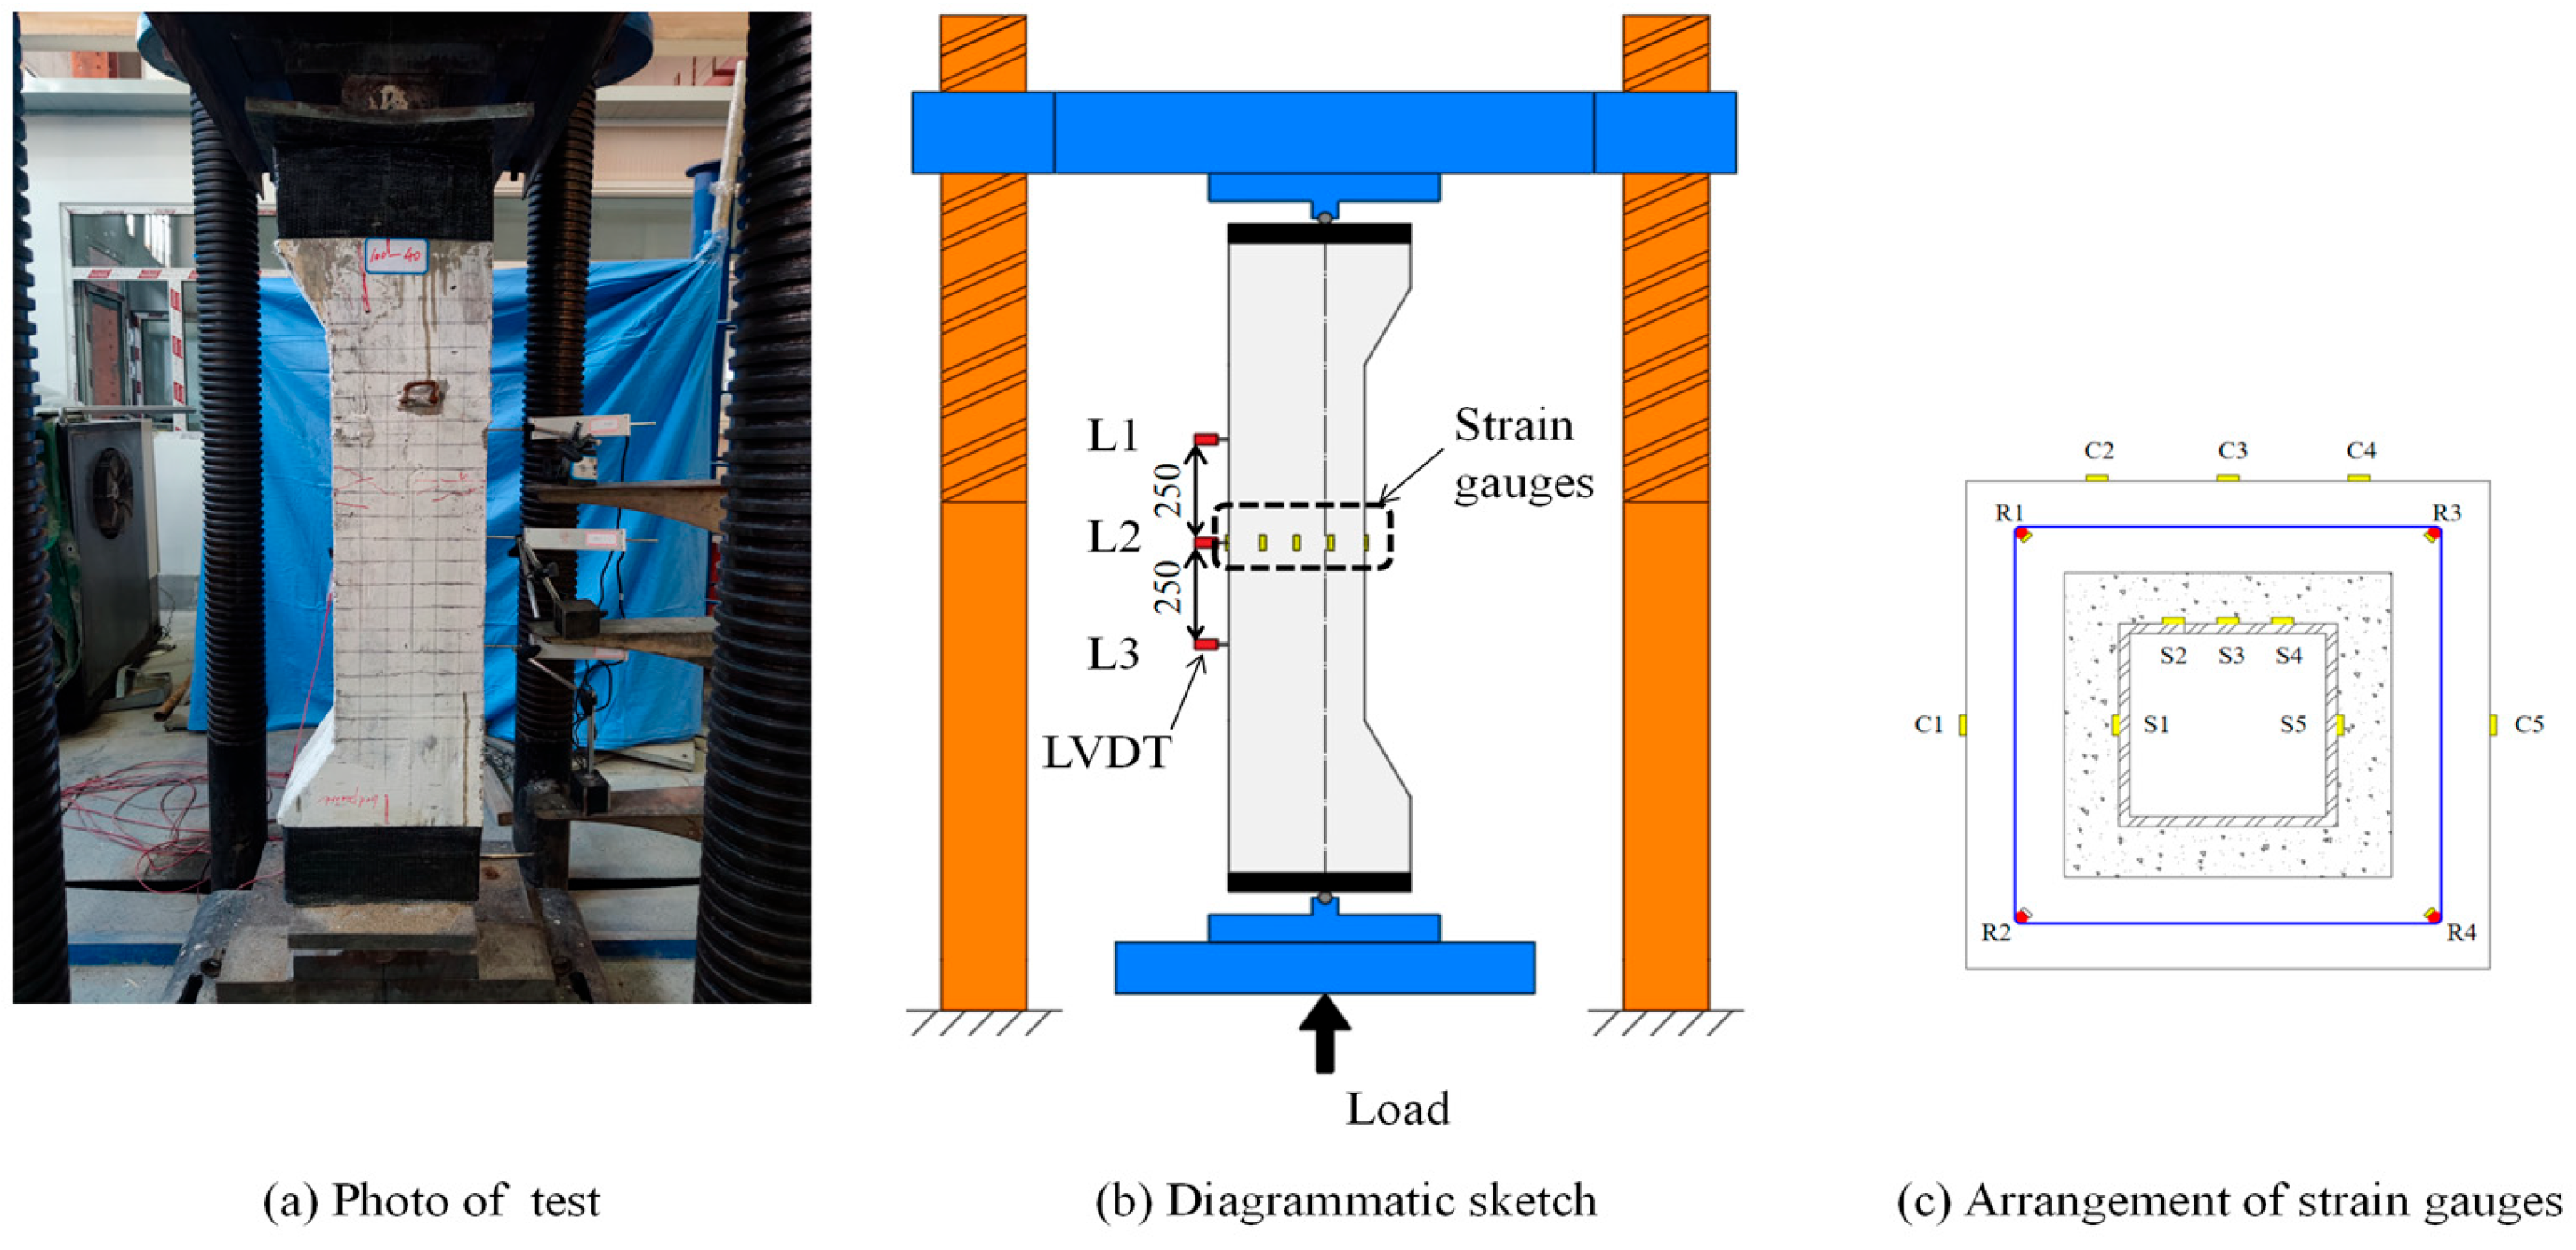
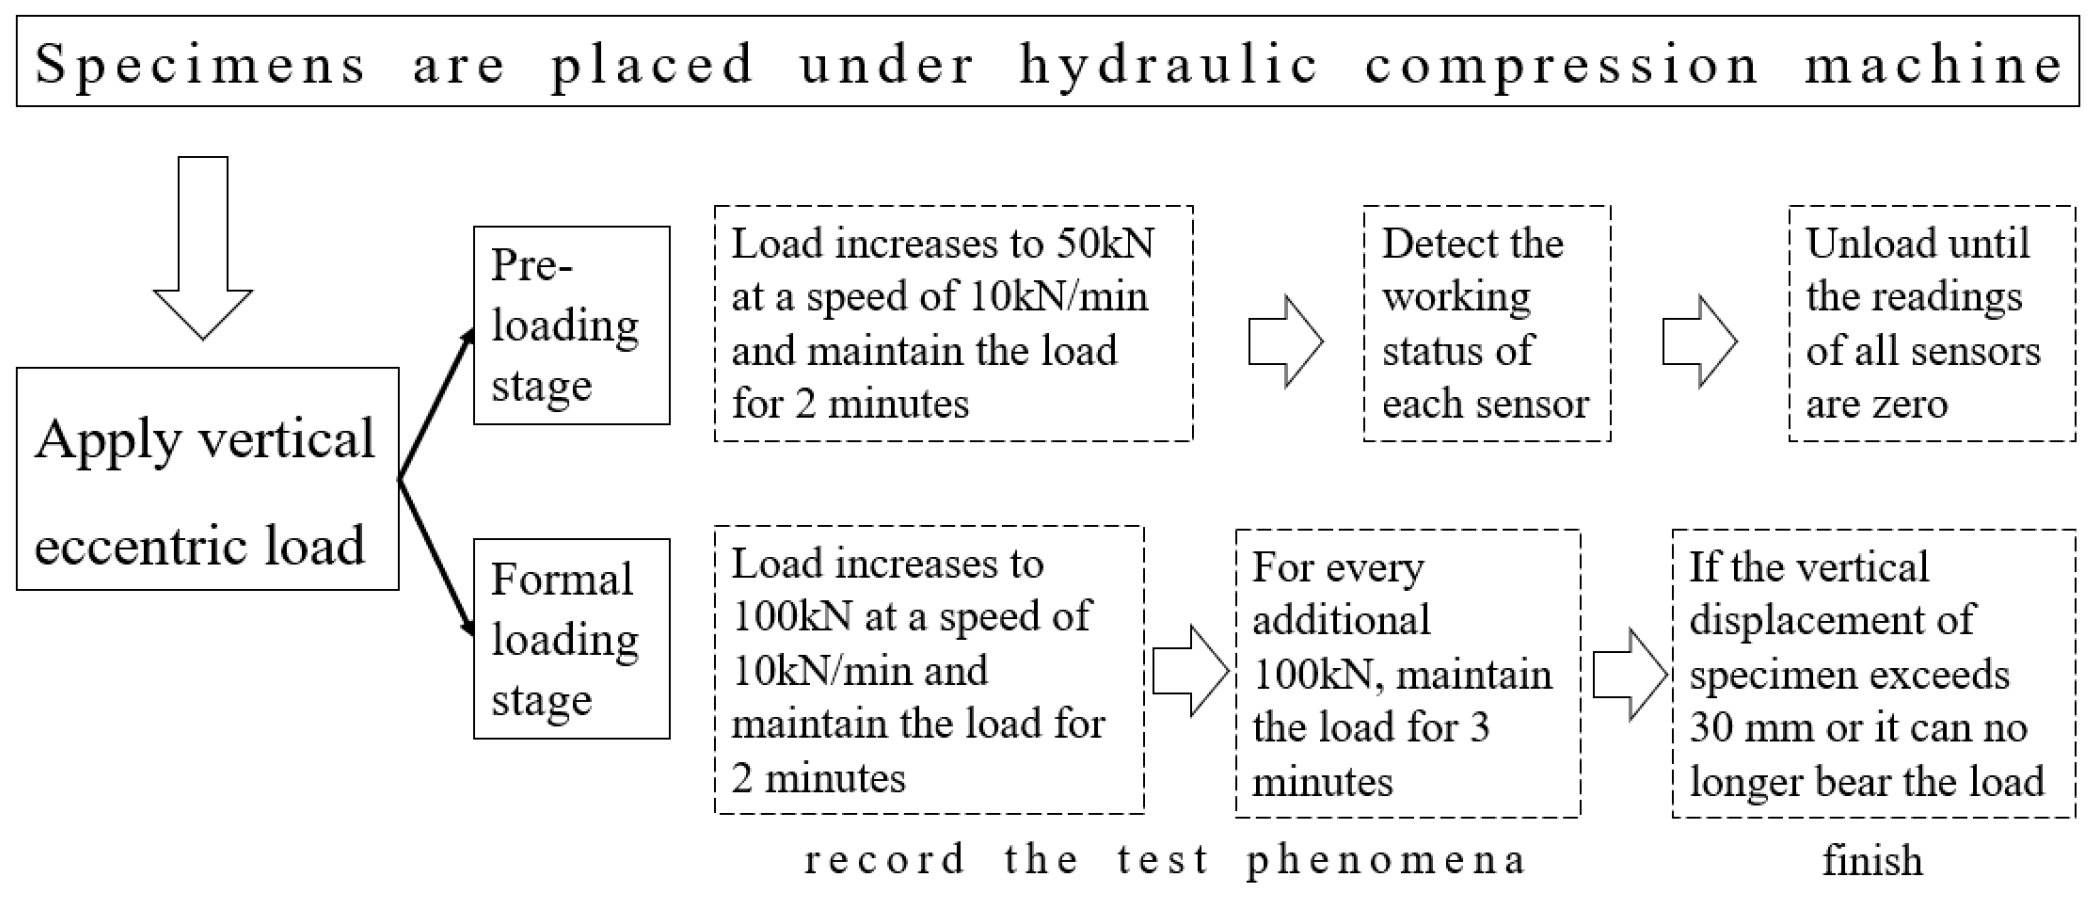
2.2. Test Setup and Measuring Instrumentation

Specimens were placed under a hydraulic compression machine with a capacity of 5000 kN (capacity shown in Figure 4a). For both ends of the specimens, carbon fiber cloth (150 mm wide) was employed externally to prevent the premature failure of the loading process. Moreover, 20 mm thick steel plates were installed at the ends of the specimens before the loading test, which can further reduce the possibility of premature damage. The vertical load was directly applied to the steel plate at the bottom of the specimen by the pin-ended installation on the hydraulic compression machine and was finally transmitted to the eccentric loading point of the column. To achieve the same eccentricity at both ends of the column, the pinned end installed on the top of the column should be aligned up and down with the pin end at the bottom of the column shown in Figure 4b. The setting of the pinned ends prevents the load output of the hydraulic compression machine from generating bending moments on the specimen to ensure that the test process conforms to the set working conditions. The structure of the pinned end is realized by a round steel bar with a diameter of 50 mm.
Three displacement sensors, LVDTs (L1-L3), were installed along the longitudinal direction of the specimen (mid-height, upper quarter height, and lower quarter height) to measure the lateral deflections during loading. The vertical displacement of the specimens is automatically recorded by the testing machine. The arrangement of LVDTs can also be shown in Figure 4b.
The strain status of the specimen during loading was obtained by strain gauges glued onto corresponding positions. All the strain gauges were arranged on the mid-height section of the specimens, as shown in Figure 4b. The specific positions of the strain gauges can be seen in Figure 4c, with four strain gauges (R1–R4) placed on the surface of each longitudinal bar, five strain gauges (S1–S5) placed on the surface of the steel tube, and five strain gauges (C1–C5) positioned on the concrete surface.
According to the predicted ultimate bearing capacity of the test specimens, taking the loading cycle into consideration and referring to previous studies [15,16], the loading speed was determined to be 10 kN/min. A sketch of the loading test frame and load application method is shown in Figure 5.

3. Test Results and Discussion

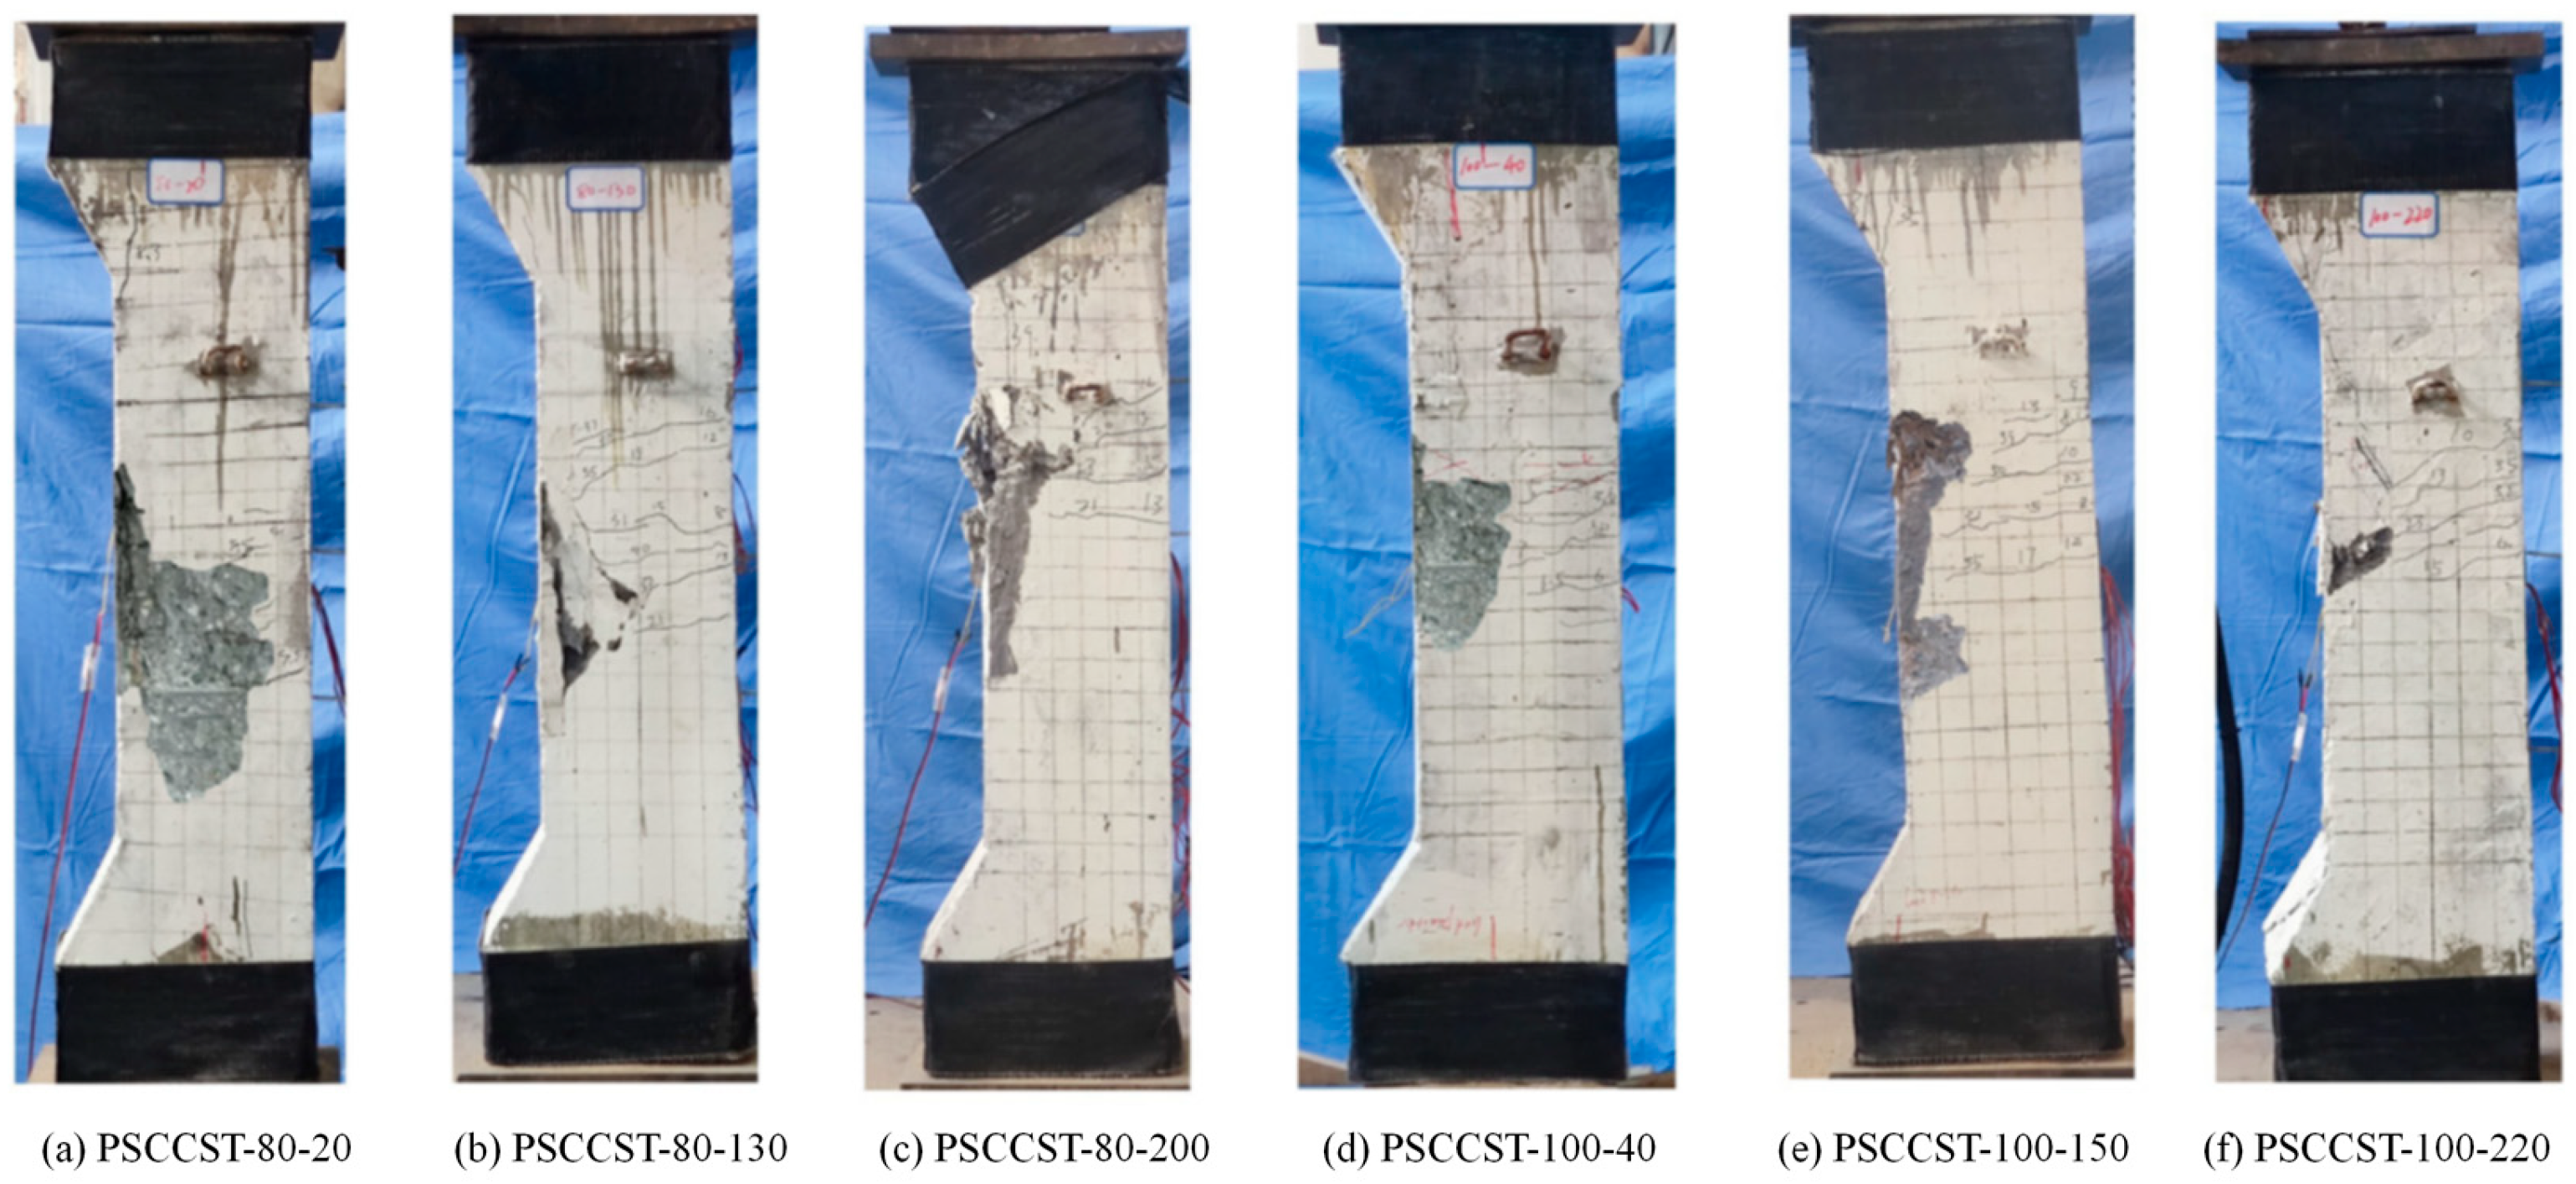
3.1. Crack Propagation and Failure State

  • PSCCST-80-20 specimen:
During the initial loading process, the specimen was in an elastic working state and there were no surface cracks. When the loading value reached 947 kN, the mass concrete fell off, the load rapidly dropped, and the test was stopped. At the end of the test, the width of the fallen concrete was approximately 120 mm, and the stirrup had leaked out. Therefore, 947 kN can be seen as the value of Nu (ultimate bearing capacity) for this specimen.
In addition, when the load value reached approximately 64% of the ultimate bearing capacity (Nu), the horizontal micro crack appeared near the mid-height of the column. Then, the crack slowly extended towards the compression side, accompanied by the emergence of new micro cracks. When the load value reached approximately 0.85Nu, micro vertical cracks gradually appeared in the compression zone near the mid-height of the column and slowly extended to both ends of the column. When the load value reached 0.95Nu, the concrete at the corner of the compression zone in the column began to bulge. At the time of final failure, the reinforcement bars had leaked out.
2.
PSCCST-80-130 specimen:
When the loading value reached 443 kN, large pieces of concrete fell, the load dropped rapidly, and the test stopped. Therefore, 443 kN can be seen as the value of Nu for this specimen.
When the load value reached 0.20Nu, micro horizontal cracks gradually emerged on the tension side near the mid-height of the column and slowly extended towards the compression side. When the load value reached 0.45Nu, vertical cracks emerged in the compression zone of the mid-height of the column. Subsequently, the width of the vertical cracks rapidly increased, and the concrete in the corner of the compression zone bulged. Immediately afterwards, the concrete began to fall off in the bulge area, leading to large blocks of concrete falling and a rapid drop in load.
3.
PSCCST-80-200 specimen:
When the applied load value reached 258 kN, large fragments of concrete fell off the specimen, resulting in a rapid drop in the applied load and termination of the test. Therefore, 258 kN can be seen as the value of Nu for this specimen. The failure characteristics of PSCCST-80-200 exhibited similarities to those of PSCCST-80-130.
When the load value reached 0.08Nu, micro horizontal cracks gradually appeared on the tension side near the mid-height of the specimen and slowly extended towards the compression side. When the load value reached 0.21Nu, vertical cracks appeared in the compression zone of the mid-height of the specimen. Subsequently, the width of the vertical cracks increased. With the further development of the vertical cracks, the concrete in the corner of the compression zone began to bulge. Shortly thereafter, the concrete began to fall off at the bulge area. The test was terminated as a result of the rapid decrease in load after large blocks of concrete fell.
4.
PSCCST-100-40 specimen:
When the applied load value reached 916 kN, large pieces of concrete detached, resulting in an abrupt drop in the load and the cessation of the test. Therefore, 916 kN can be seen as the value of Nu for this specimen. The failure state is similar to that of the PSCCST-80-20 specimen.
When the load value reached 0.40Nu, a horizontal micro crack appeared near the mid-height of the column, which then slowly extended towards the compression side, accompanied by the emergence of new micro cracks. When the load value reached approximately 0.60Nu, micro vertical cracks gradually emerged in the compression zone near the mid-height of the specimen and extended slowly towards both ends of the specimen. The corner of the compression zone in the column began to bulge. Ultimately, the reinforcement bars leaked out at the time of final failure.
5.
PSCCST-100-150 specimen:
When the load value reached 410 kN, large pieces of concrete fell, the load dropped rapidly, and the test stopped. Therefore, 410 kN can be seen as the value of Nu for this specimen. The failure characteristics are similar to those of the PSCCST-80-130 specimen.
When the load value reached 0.17Nu, the specimen began to exhibit small horizontal cracks on the tension side near the mid-height of the specimen, which gradually extended towards the compression side. When the load value reached 0.75Nu, vertical cracks appeared in the compression zone of the mid-height of the specimen. These cracks quickly widened, causing the concrete in the corner of the compression zone to bulge. Eventually, large blocks of concrete rapidly dropped, leading to the final failure of the specimen.
6.
PSCCST-100-220 specimen:
When the load value reached 256 kN, large pieces of concrete fell, the load dropped rapidly, and the test stopped. Therefore, 256 kN can be seen as the value of Nu for this specimen. The failure characteristics are similar to those of the PSCCST-80-200 specimen.
When the load value reached 0.10Nu, small horizontal cracks developed on the tension side near the mid-height of the specimen and gradually propagated towards the compression side. When the load value reached approximately 0.20Nu, the emergence of vertical cracks in the mid-height compression zone was observed. The width of these cracks increased as the load increased, leading to bulging of the concrete in the corner of the compression zone. Subsequently, the concrete began to fall off at the bulge area, ultimately resulting in the failure of the column, with large blocks of concrete falling and the applied load rapidly decreasing.
The final failure state of all specimens can be seen in Figure 6.
During the entire loading process, no obvious slip occurred on the surface between the steel tubes and the post-cast concrete in all specimens, indicating that the steel tubes and the concrete maintained good cooperative working performance.

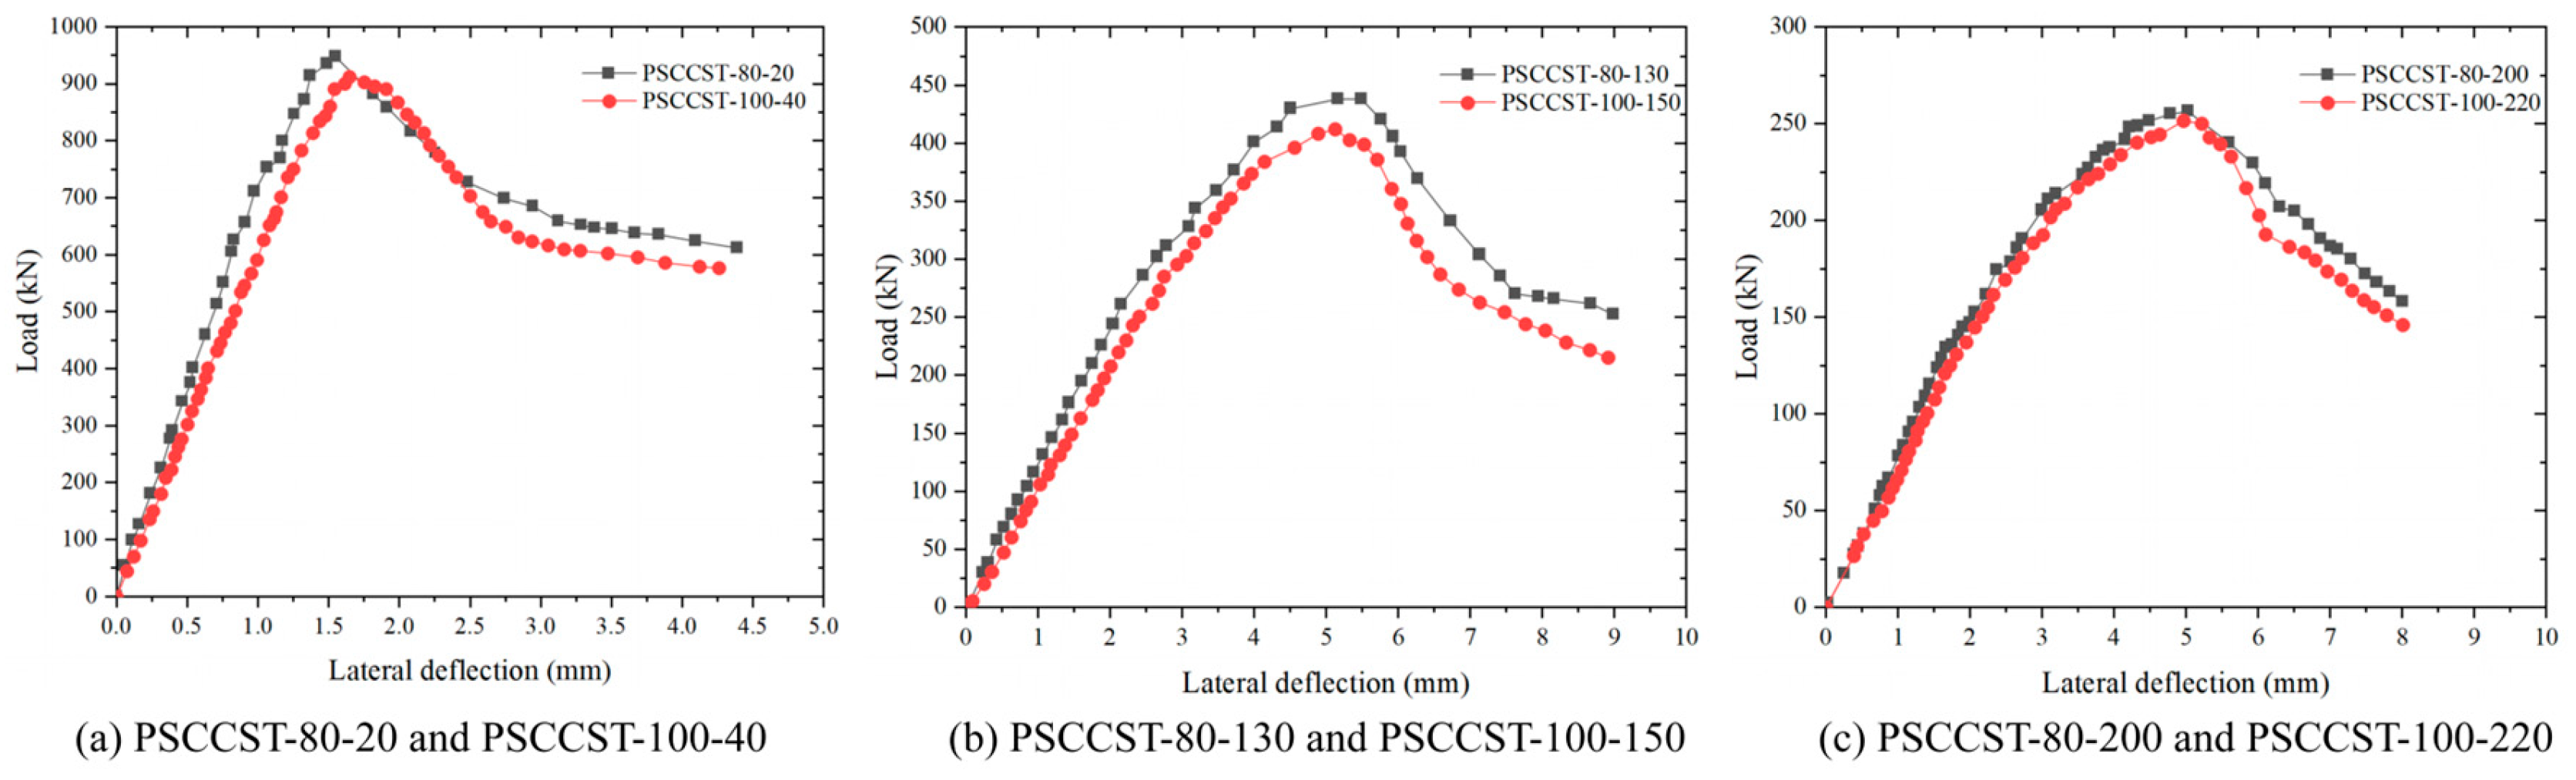
3.2. Ultimate Bearing Capacity of Specimens

The test value of the ultimate bearing capacity Nu for each specimen is referred to as Nt, which is listed in Table 3.
For PSCCST-80-20, PSCCST-80-130, and PSCCST-80-200, with an 80 mm side-length steel tube, when the eccentricity changed from 20 mm to 130 mm and from 130 mm to 200 mm, the corresponding ultimate load decreased by 74% and 41%. For PSCCST-100-40, PSCCST-100-150, and PSCCST-100-220, when the eccentricity changed from 40 mm to 150 mm and from 150 mm to 220 mm, the corresponding ultimate load decreased by 68% and 38%. The degree of eccentricity during loading had a significant impact on the bearing capacity of the specimens.

3.3. Load-Strain Relationships

Strain data in the mid-height section of the concrete surface and steel tube for each specimen corresponding to each load level were recorded automatically by the strain acquisition system. The concrete strain and steel tube strain distribution statuses of the mid-height section during the loading process are presented in Figure 7 and Figure 8, respectively.
For the PSCCST-80 specimens, the comparison of strain distributions at ultimate load (1.0Nu) for different eccentricities can be found by examining the first curve on the left in Figure 7a–c. As the eccentricity increases, the average slope of the curve decreases. In addition, the value of the cross-sectional height corresponding to the neutral axis (where the strain is 0) shows a tendency to gradually increase. In particular, when the eccentricity increases from 20 mm to 130 mm, the variation range is quite obvious. For PSCCST-100 specimens, these two comparative analysis results of strain distribution scenarios still hold true according to the first curve on the left in Figure 7d–f.
For the steel tube of PSCCST-80-20 and PSCCST-100-40, the strain curves of the steel tube can be seen in Figure 8a,d, which reveal that the steel tubes of these two specimens were subjected to full-section compression during loading. In addition, from the strain collected data, when the load value reached approximately 0.50Nu, the compression strain of the upper flange of the steel tube had reached 0.0012, while that of the lower flange was 0.00038, indicating that the upper flange had yielded. When the load reached 0.58Nu, the compression of the longitudinal bars also yielded. Prior to reaching 1.0Nu, the compression of the lower flange and the lower tensile longitudinal reinforcement bars had not yet yielded. In addition, from the section height corresponding to the curve’s intersection point, it can be seen that the neutral axis was located in the lower precast part.
For the steel tube of PSCCST-80-130 and PSCCST-100-150, strain curves of the steel tube can be seen in Figure 8b,e. In the process of loading, the upper flange was under compression, and the lower flange was under tension. When the load reached 0.63Nu, the upper compression reinforcement yielded, while the lower tensile longitudinal reinforcement yielded at 0.74Nu. When the load reached 0.90Nu, the strain of the upper flange in compression was 0.0012, indicating that the upper flange had yielded, while that of the lower flange was 0.00108. When the Nu was reached, the upper flange had just attained the yield strength, while the lower flange had already yielded (the tensile strain of the lower flange was slightly higher than the yield strain).
For the steel tube of PSCCST-80-200 and PSCCST-100-220, strain curves of the steel tube can be seen in Figure 8c,f. The upper flange was under compression, and the lower flange was under tension. The lower tensile longitudinal reinforcement bars and the upper compressive longitudinal reinforcement bars yielded at 0.65Nu and 0.68Nu, respectively. The lower flange under tension and the upper flange under compression yielded at 0.73Nu and 0.94Nu, respectively.

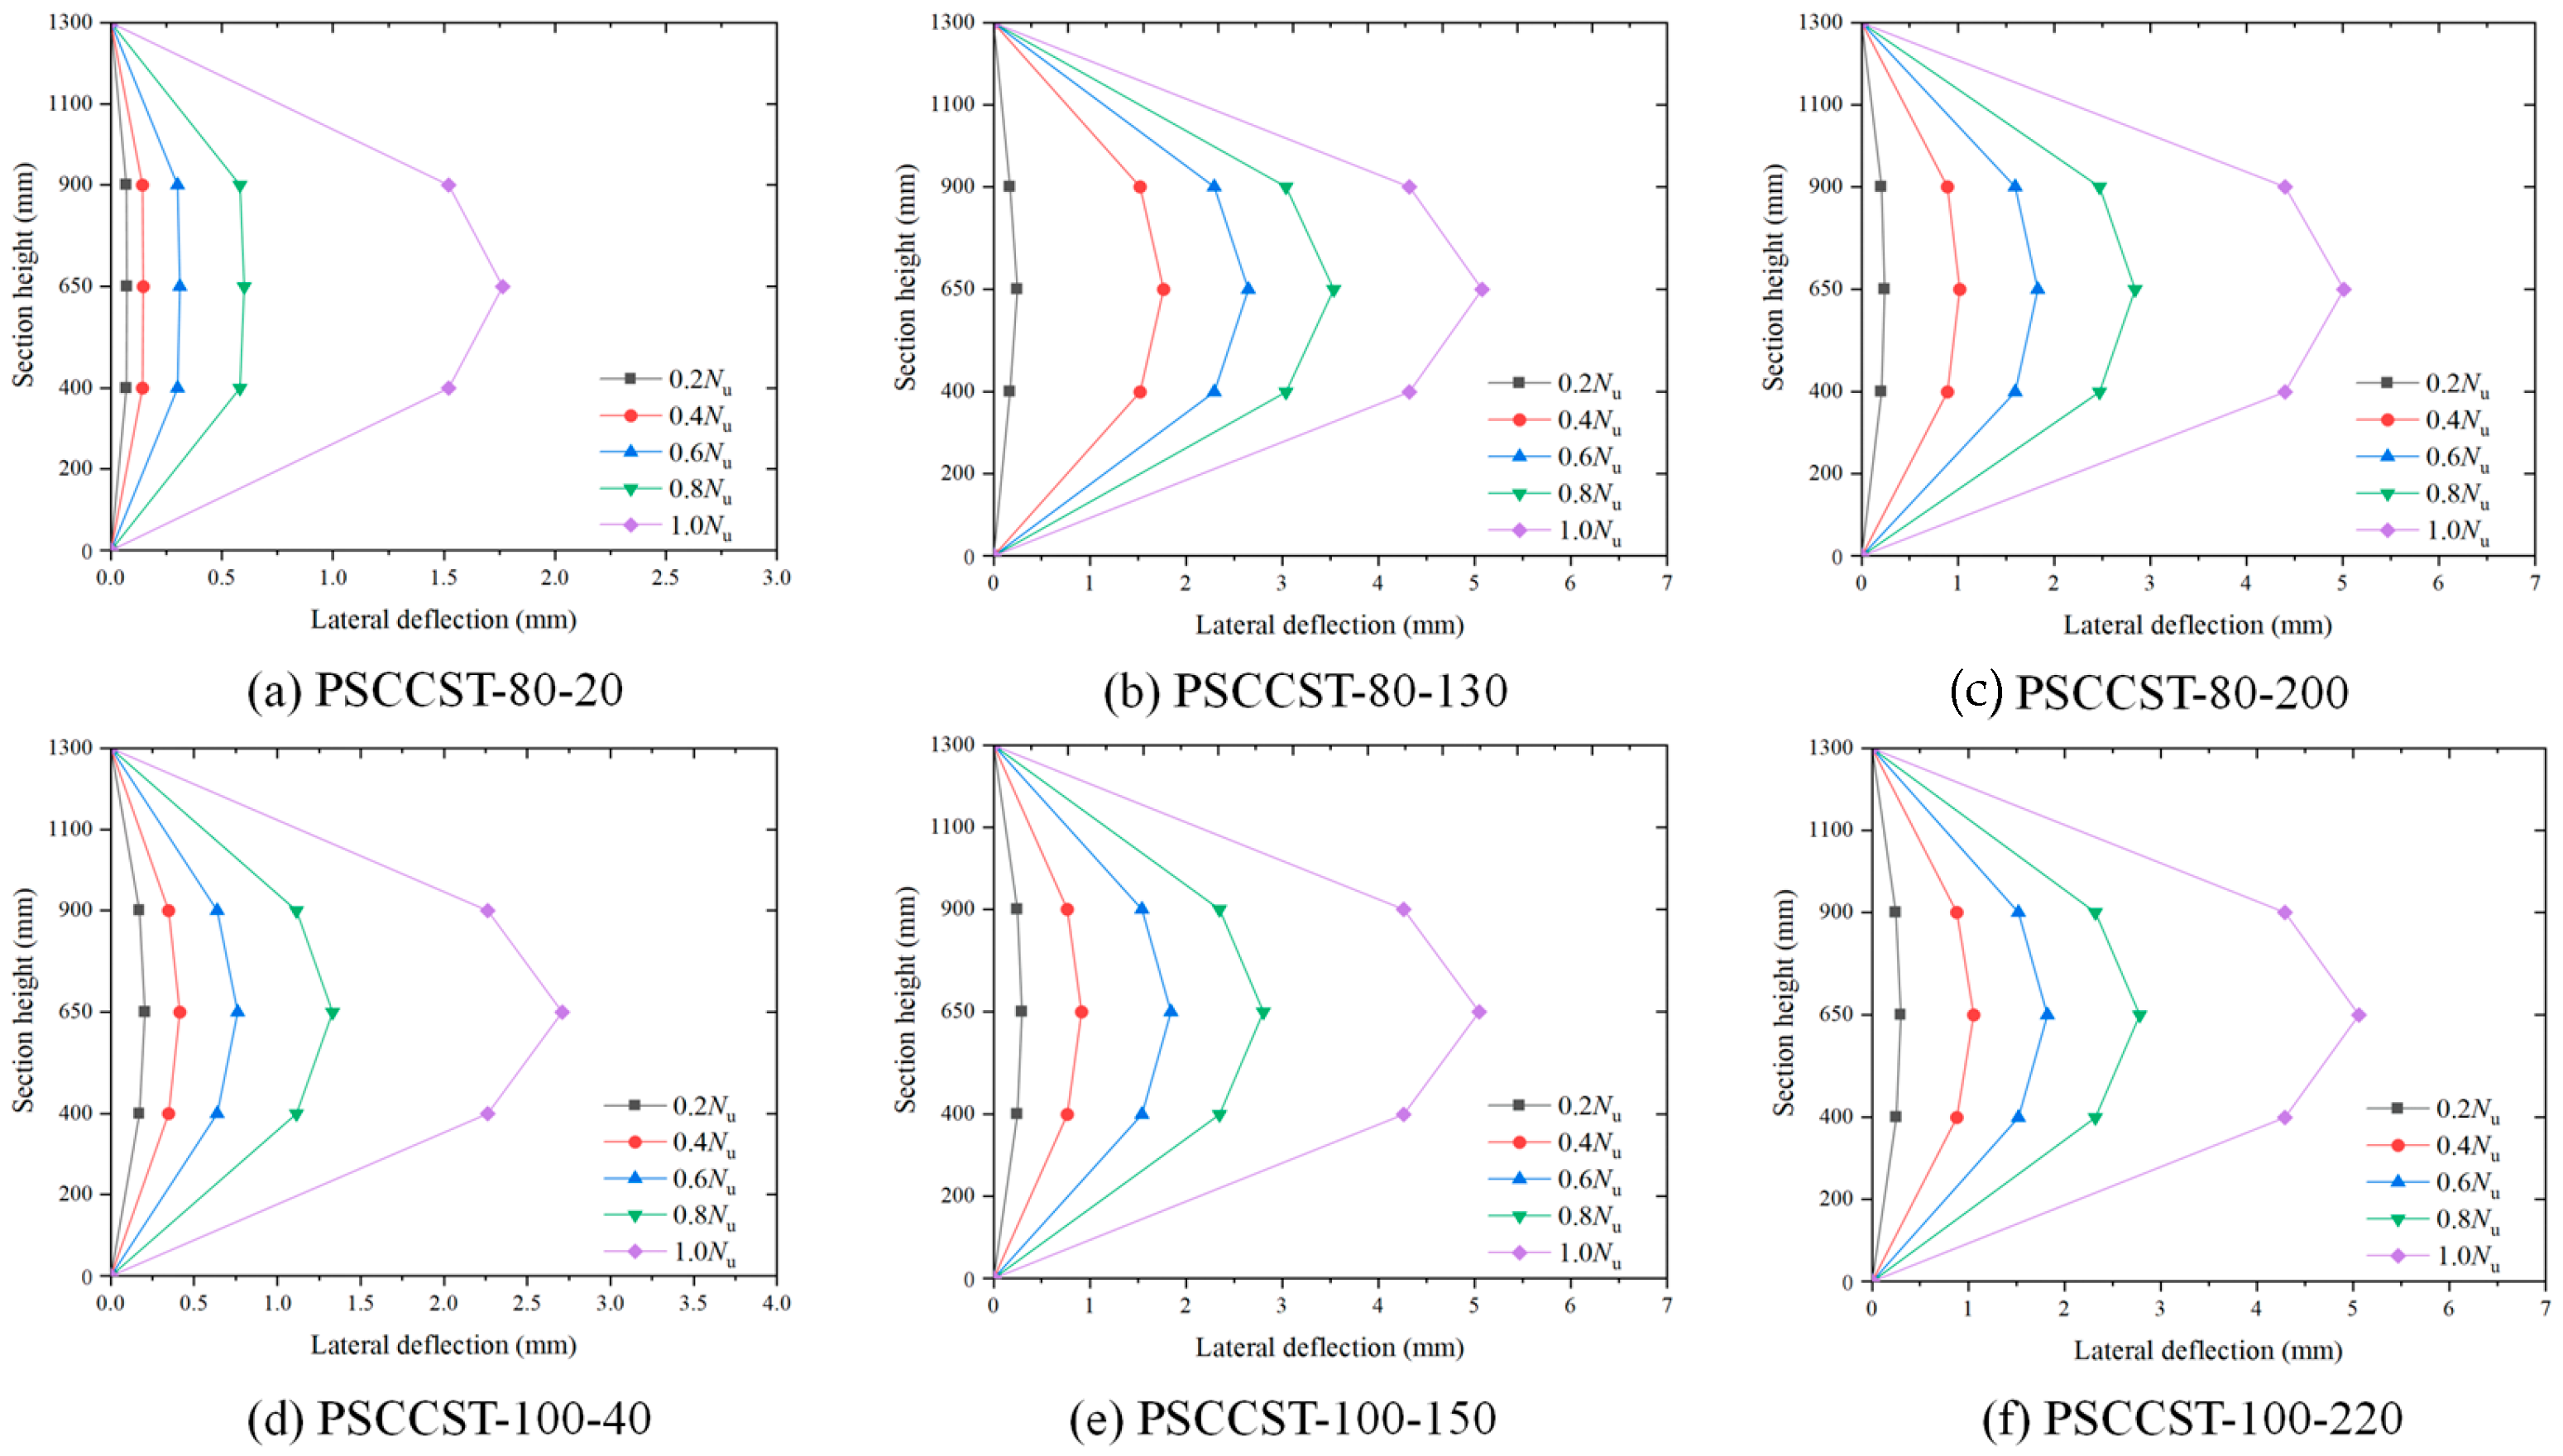
3.4. Load-Deflection Relationships

Figure 9 presents the lateral deflections at different load levels for all specimens. It can be observed that all the specimens exhibited good ductile performance during the loading process. The lateral deflections of the specimens are symmetrically distributed about the mid-height section, with the largest deflection occurring in the mid-height section and decreasing continuously towards the top and bottom of the specimen. In addition, before the loading value reached 0.8Nu, the increase in lateral deflection was approximately linearly related to the increase in load. Upon reaching 0.8Nu, gradual concrete peeling occurred, leading to a reduction in specimen stiffness and a rapid increase in lateral deflection.
Figure 10 shows the relationship curves between the vertical axial load and mid-height section lateral deflection of all the specimens under the eccentric load. For the PSCCST-100-150 specimen, the value of e/h = 0.625 ≈ 0.6. Therefore, the vertical load-lateral displacement curve (the red curve in Figure 10b) can be compared with Figure 7c in Reference [14] (corresponding to an e/h value of 0.6). Through comparison, it can be found that the shape characteristics of the red curve in Figure 10b are completely consistent with the curves in Figure 7c [14], which proves that the deformation characteristics of the specimens obtained in this experiment are accurate and reasonable.
It can be seen that the slope of the rising curve decreased continuously with the increase of eccentricity. This decrease in slope was caused by the decrease in the elastic modulus of the section due to the decrease in the area of concrete in the compression zone as eccentricity increased. Moreover, the value of the ultimate load decreased as the eccentricity increased.
In addition, as a kind of vertical load-lateral displacement curve, Figure 10 also shows the ductility characteristics of the PSCCST column. In the initial stage of each load-lateral displacement curve (when the column is in an elastic state), the vertical load and the lateral displacement are basically in a linear relationship, with no obvious plastic deformation; thus, the ductility has not been significantly reflected. When the load continues to increase and the PSCCST columns enter the elastoplastic stage, the curves begin to deviate from linearity. As the lateral displacement further increases, the growth of the load gradually slows down, which indicates that the PSCCST columns start to exhibit plastic deformation, and the plastic deformation accumulates continuously. The six curves in Figure 10 all have a relatively long transition section in the elastoplastic stage instead of a sudden drop, suggesting that each column can still maintain a certain bearing capacity under large deformations, indicating that the PSCCST columns have good ductility. It is worth noting that, as the eccentricity increases, this manifestation of ductility becomes more and more obvious. After each curve reaches the peak load, due to the good ductility of each PSCCST column, the curves do not drop sharply but have a relatively gentle descending section, which means that the PSCCST columns can still bear a certain vertical load and continue to produce large deformations after failure.

3.5. Summary of Failure Type

It is found that the load eccentricity has a great effect on the failure characteristics of specimens, as the height of the compression zone (xc) varies greatly under different eccentricities. The failure characteristics of six specimens can be distinguished into three different types.

3.5.1. Failure Type 1

For specimens PSCCST-80-20 and PSCCST-100-40, the whole section of the steel tube was under compression, and the failure characteristics were similar. When the concrete in the compression zone was crushed, the specimen failed. At this time, the upper flange yielded because of the compression, while the lower flange did not yield under compression, accompanied by partial webs that yielded under compression. In addition, the upper longitudinal reinforcement bars also yielded under compression, while the lower longitudinal reinforcement bars did not yield under tension. This kind of failure characteristic implies that the material properties were utilized relatively fully, and it can be considered to occur in the actual engineering design.

3.5.2. Failure Type 2

For specimens PSCCST-80-130 and PSCCST-100-150, the upper flange was under compression, and the lower flange was under tension, indicating that the neutral axis was within the range of the steel tube’s webs. The failure characteristics of these two specimens were similar, with a simultaneous occurrence of the edge crushing in the concrete compression zone and yielding of lower flange under tension. In this type of failure, there are both large compression and tension regions on the cross-section, and the material properties cannot be fully utilized in the area close to the neutral axis. The specific state of each part of the normal section can be shown in Table 4.

3.5.3. Failure Type 3

For specimens PSCCST-80-200 and PSCCST-100-220, the neutral axis was found to be located in the web region of the steel tube. The failure characteristics of these two specimens were similar to failure type 2, but with some differences. Prior to failure, the upper and lower flanges of the steel tube experienced compression and tensile yielding, respectively. Furthermore, the webs in the tension zone had reached the yield only partially. The webs in the compression zone may yield only partially. For this type of failure, the degree of the full utilization of the material properties is greater than that of failure type 2.

3.6. Failure Mode Deduction

The failure characteristics of specimens with different eccentricities are different, which can be deduced into two kinds of failure modes (compressive-type failure mode; total-yield-type failure mode) based on the extended analysis of failure types.

3.6.1. Compressive-Type Failure Mode

  • Further extended analysis based on failure type 1
According to the characteristics of failure type 1 and the corresponding strain distribution data shown in Figure 7, failure type 1 belongs to the case where the neutral axis is located within the lower precast part and above the lower longitudinal reinforcement bars, which satisfies the condition h2 + t1xc < h0. The position of the neutral axis and the strain expression of each main part can be seen in Figure 11.
In the analysis of extensibility, when the neutral axis is located at or below the centroid of the lower longitudinal reinforcement bars (h0xc < h1), the lower longitudinal reinforcement bars will be under compression, or the stress value is zero. The position of the neutral axis and the strain expression of each main part are illustrated in Figure 12.
Obviously, the section failure characteristics in this case are very close to failure type 1. The difference is only that the lower longitudinal reinforcement bars are compressed rather than tensioned (unable to achieve compressive yield).
2.
Extended analysis of failure type 2
According to the characteristics of failure type 2 and the corresponding strain distribution data shown in Figure 7, the neutral axis is situated in the web region of the steel tube in failure type 2. The upper flange yielded under compression, while the lower flange just yielded under tension. xt represents the distance between the neutral axis and the upper edge of the concrete.
In the analysis of extensibility, this failure type can be regarded as a situation in which the neutral axis is located in the web region of the steel tube (xtxc < h3 + t1 + t2). When xtxc < h3 + t1 + t2, the upper flange tube belongs to the compressed area, while the lower flange belongs to the tension area. The position of the neutral axis and the strain expression of each main part are illustrated in Figure 13.
According to Figure 13, the upper flange yielded under compression, while the lower flange did not yield and remained under tension. Additionally, the upper longitudinal reinforcement bars yielded under compression, while the lower longitudinal reinforcement bars yielded under tension.
3.
Further extended analysis based on failure type 1 and 2
It should be noted that there is another area, the lower post-cast part, that lies between the lower precast part and the lower flange of the steel tube. Therefore, the case in which the neutral axis appears in the lower post-cast part (h3 + t1 + t2xc < h2 + t1) should be considered as another extended analysis.
In this situation, the whole section of the steel tube is under compression. The position of the neutral axis and the strain expression of each main part are shown in Figure 14.
Based on failure type 1 and 2, the possible failure characteristics of this situation can be inferred from Figure 14. Specifically, the concrete at the edge of the compression zone was crushed. Both the upper flange and the upper longitudinal reinforcement bars yielded under compression. On the other hand, the lower flange of the steel tube was either under compression without yielding, or the stress was at zero. Additionally, the lower longitudinal reinforcement bars were under tension and could have reached yielding.
4.
Compressive-type failure mode deduction
In summary, there are four kinds of similar failure characteristics corresponding to the four kinds of neutral axis positions shown above. These four kinds of failure characteristics have some common points; therefore, they can be attributed to one failure mode (compressive-type failure mode). In this failure mode, the concrete at the edge of the compression zone is crushed, while the upper flange of the steel tube and partial webs in the compression zone have already yielded under compression. The lower flange may either be under compression (not yield) or be under tension (possibly reach yield), depending on the location of the neutral axis. In addition, the upper longitudinal rebars yield under compression, and the lower longitudinal rebars may be under compression or tension, possibly yielding under tension.
According to the order of xc values from largest to smallest and the area in which the neutral axis is located, these four kinds of similar failure characteristics can be classified into three cases, which varies with different load eccentricities: Case 1 (the neutral axis is located in the lower precast part, h2 + t1xc < h1); Case 2 (the neutral axis is located in the lower post-cast part, h3 + t1 + t2xc < h2 + t1); Case 3 (the neutral axis is located in the middle steel tube web, xtxc < h3 + t1 + t2). In detail, Case 1 includes two sub-cases: Sub-case 1 (the neutral axis is located at or below the centroid of the lower longitudinal reinforcement bars, h0xc < h1); Sub-case 2 (the neutral axis appears above the lower longitudinal reinforcement bars, h2 + t1xc < h0).

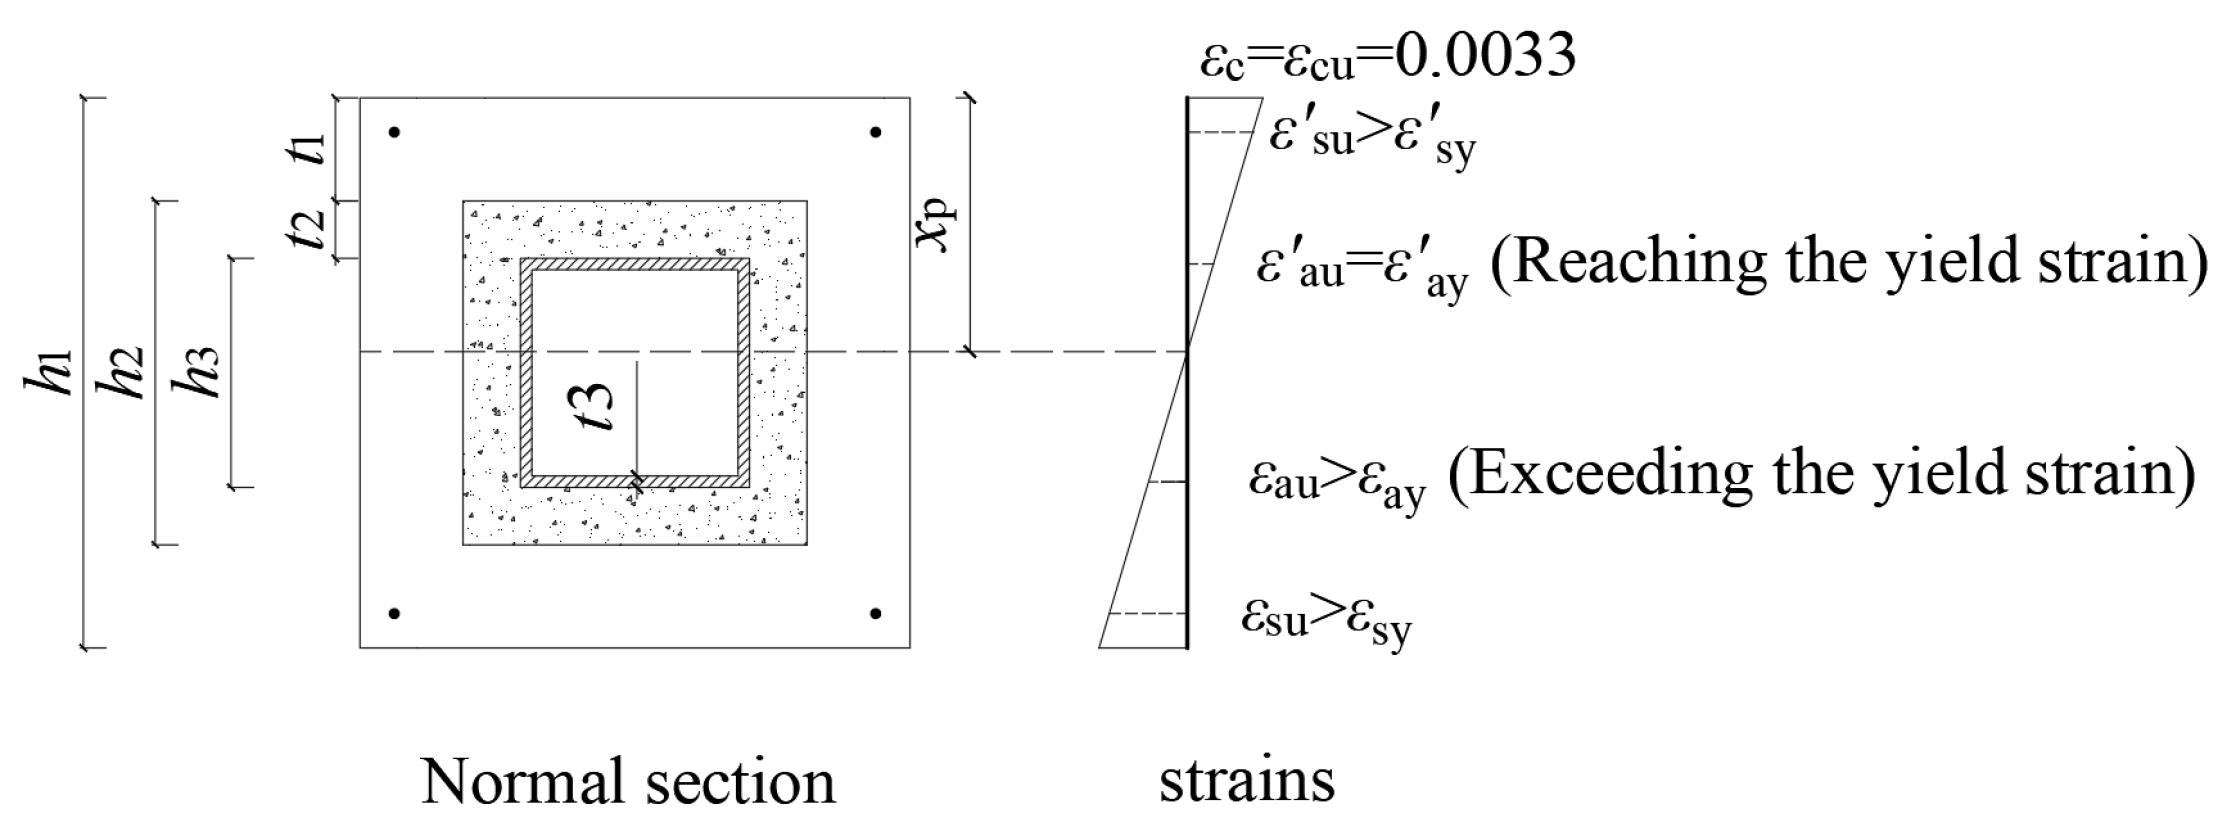
3.6.2. Total-Yield-Type Failure Mode

Similarly, the failure type of the PSCCST-80-200 and PSCCST-100-220 specimens (failure type 3) can also be regarded as having larger load eccentricity values than the compressive-type failure mode. Based on the observation that the lower flange of the steel tube underwent yielding in tension, while the upper flange experienced yielding in compression, this specific failure mode can be referred to as total-yield-type failure mode. It should be noted that, in this failure mode, the upper longitudinal reinforcement bars yield under compression, while the lower longitudinal reinforcement bars yield under tension.
Note: It can be found that failure type 2 is the boundary state between compressive-type failure mode and total-yield-type failure mode.

4. Calculation Methods of Eccentric Compression Bearing Capacity

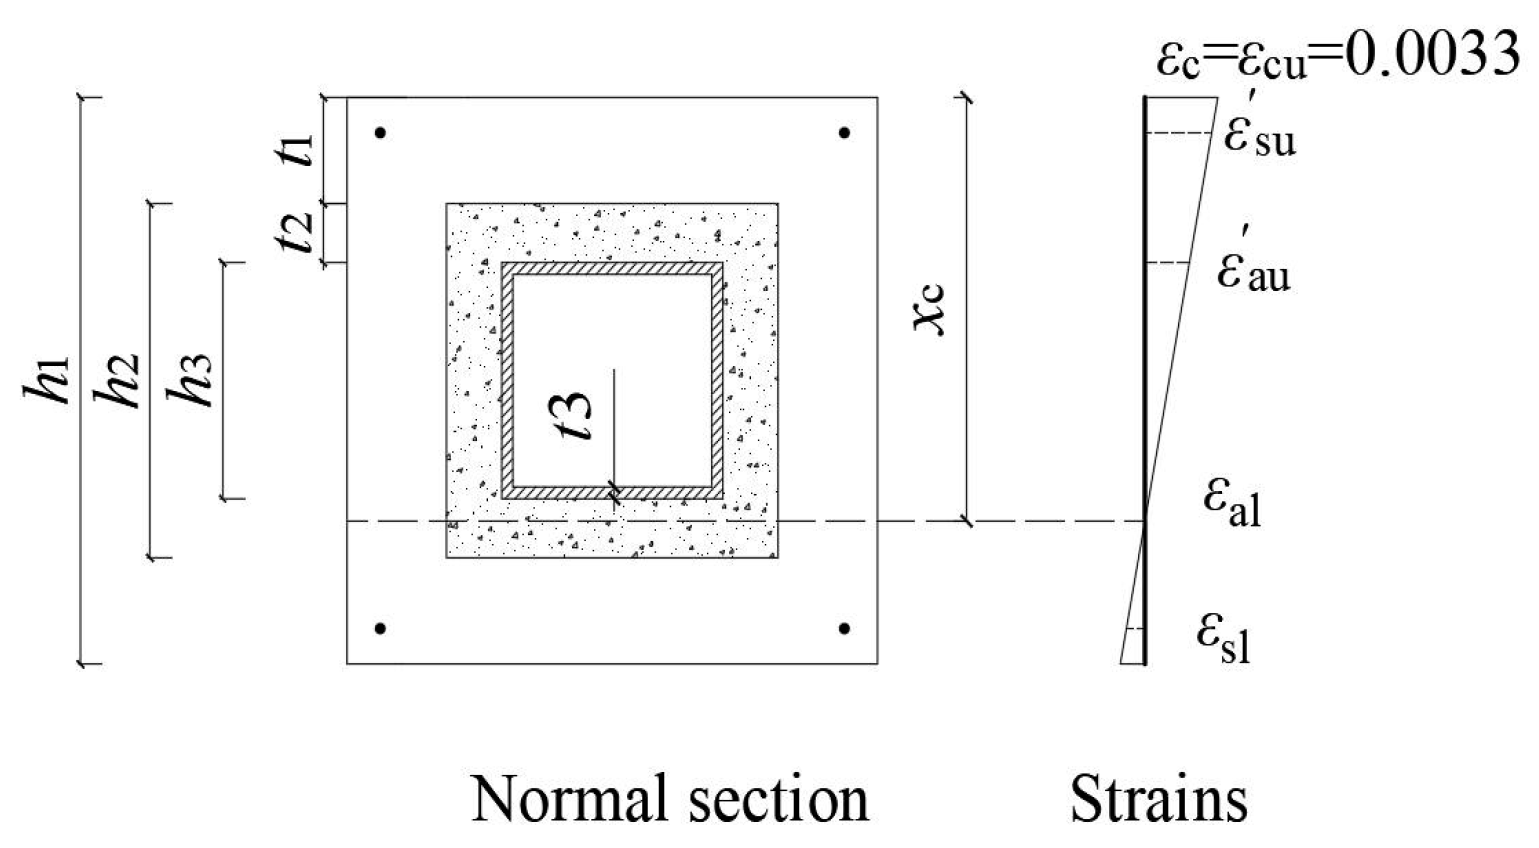
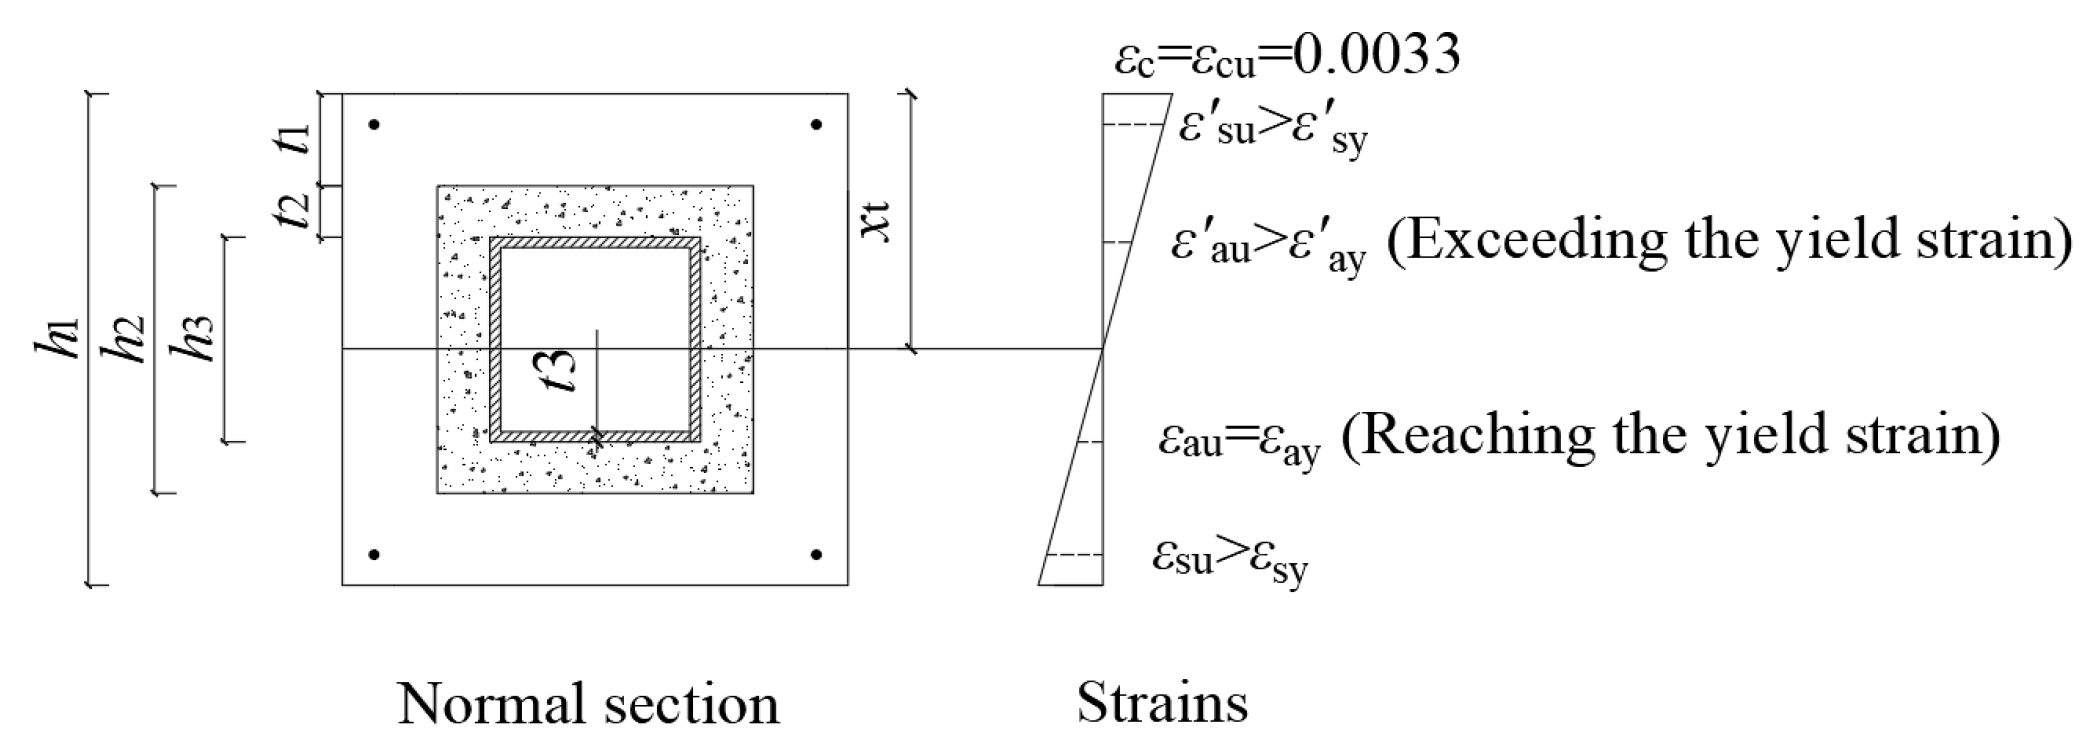
4.1. Basic Assumptions

To establish a theoretical analysis method and balance the simplicity of the calculation process with the accuracy of the results, the following assumptions have been proposed:
Considering that the tensile strength of concrete is relatively low, and the working condition of eccentric compression is being studied here, the tensile strength of concrete can be neglected during calculations. Of course, for some failure modes, where the tension zone in the cross-section appears, this assumption may slightly affect the calculation of the bearing capacity.
For the precast and post-cast concrete parts, stress in the section of the compressive zone, σc, can be obtained based on the corresponding strain value εc and the constitutive relationship under uniaxial compression (Equation (1)) (GB 50010-2010 Concrete structure design code [22]), as follows:
σ c = f c 1 1 ε c ε 0 n ε c ε 0 f c ε 0 < ε c ε cu
where fc is the design value of axial compressive strength. fc includes fc1 (for the precast concrete) and fc2 (for the post-cast concrete). n is the coefficient, which is calculated by the following Equation (2):
n = 2 1 60 f cu , k 50 2.0
where fcu,k is the standard value of concrete axial compressive strength. n = 2 is suitable for concrete whose strength grade is not greater than C50, including the strength range of the concrete in the PSCCST column.
ε0 is the concrete strain corresponding to the situation when the compressive stress reaches fc, which can be calculated by the following Formula (3):
ε 0 = 0.002 + 0.5 × f cu , k 50 × 10 5 0.002
ε0 = 0.002 is suitable for concrete whose strength grade is not greater than C50, including the strength range of the concrete in PSCCST column.
εcu is the ultimate compressive strain of concrete, calculated by Formula (4).
ε cu = 0.0033 f cu , k 50 × 10 5 0.0033
εcu = 0.0033 is suitable for concrete whose strength grade is not greater than C50, including the strength range of the concrete in the PSCCST column.
For steel tubes, the tensile yield strength (fa) is equal to the compressive yield strength (fa). Similarly, for the longitudinal reinforcement bars, the tensile yield strength (fy) is equal to the compressive yield strength (fy). Additionally, the elasticity modulus of tension and compression for steel tube and longitudinal reinforcement bars are equal (Ea = Ea; Es = Es).
It can be found, from Figure 7 and Figure 8, that the strain data distribution status along the eccentric direction of the mid-height section basically conforms to the linear law. According to this experiment phenomenon and the relevant literature [25,26], the normal section of PSCCST columns can also employ the ‘plane section assumption’.
According to the failure modes mentioned above, the edge of the concrete compression zone undergoes crushing, resulting in a strain of ɛc = εcu = 0.0033 in this region. As a result, if we assume that x denotes the distance from any fiber to the neutral axis in a normal section and ɛ(x) represents the corresponding strain of this fiber, then ɛ(x) = 0.0033x/xc.
The stress function of the concrete can then be obtained from Equation (1), as shown in the following Equation (5):
σ c x = f c 1 1 1.65 x x c 2 x 0.6061 x c f c 0.6061 x c < x x c
x ≤ 0.06061xc is obtained from ɛ(x) = 0.0033x/xcɛ0 = 0.002.
For the precast concrete, the stress functions can be denoted as σ1(x). For the post-cast concrete, the stress functions can be denoted as σ2(x). An example of strain state and the stress of the concrete in the normal section of the PSCCST column are shown in Figure 15.
σ1(x) and σ2(x) can be obtained from Equations (6) and (7).
σ 1 x = f c 1 1 1 1.65 x x c 2 x 0.6061 x c f c 1 0.6061 x c < x x c
σ 2 x = f c 2 1 1 1.65 x x c 2 x 0.6061 x c f c 2 0.6061 x c < x x c
The calculation eccentricity e is employed to take into account the impact of the second-order effect (under the action of eccentric vertical loads, the PSCCST column will experience lateral deflection, which in turn induces additional bending moments and reduces its load–bearing capacity).
In the design of reinforced concrete columns and ordinary SRC columns, the second-order effect is usually considered by adopting a moment magnification factor [27,28,29] or eccentricity increase factor η [30]. Eccentricity increase factor η is employed in this paper, and then, the calculation eccentricity e can be obtained by multiplying the initial eccentricity e0 (e0 = M/N) with η.
The value of η can be obtained from the following Equations (8)–(10):
η = 1 + 1 1400 e 0 / b l 0 b
K 1 = 3 e 0 b 1
K 2 = 1.15 l 0 b 1
where l0 is the calculation length of the PSCCST column; b is the section width of the PSCCST column, b1 = b in this paper; K1 is the correction factor, considering the influence of eccentricity, and it takes the value of 1 when K1 > 1; K2 is the correction factor considering the influence of the slenderness ratio, and it takes the value of 1 when K2 > 1.

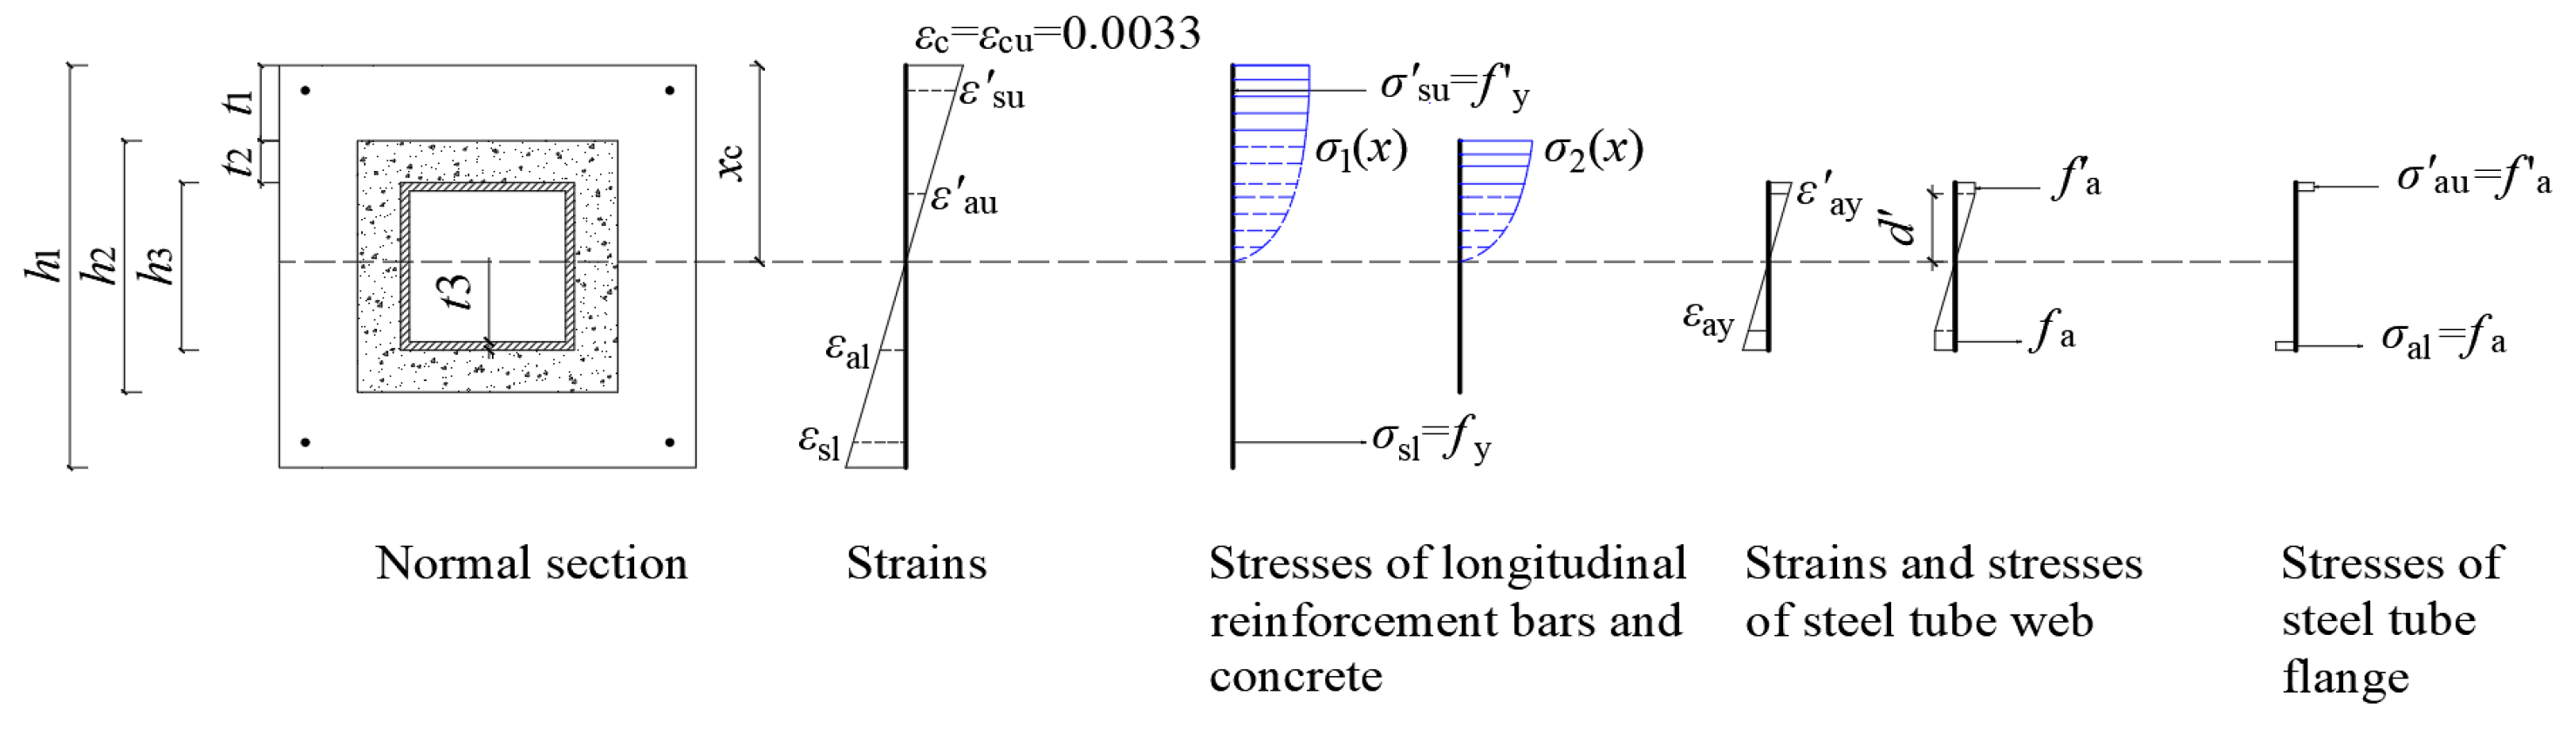
4.2. Establishment of Equations

Based on the basic assumptions, the bearing capacity calculation equations for compressive-type failure mode and total-yield-type failure mode can be established according to the balance requirement (axial force balance and the bending moment balance).

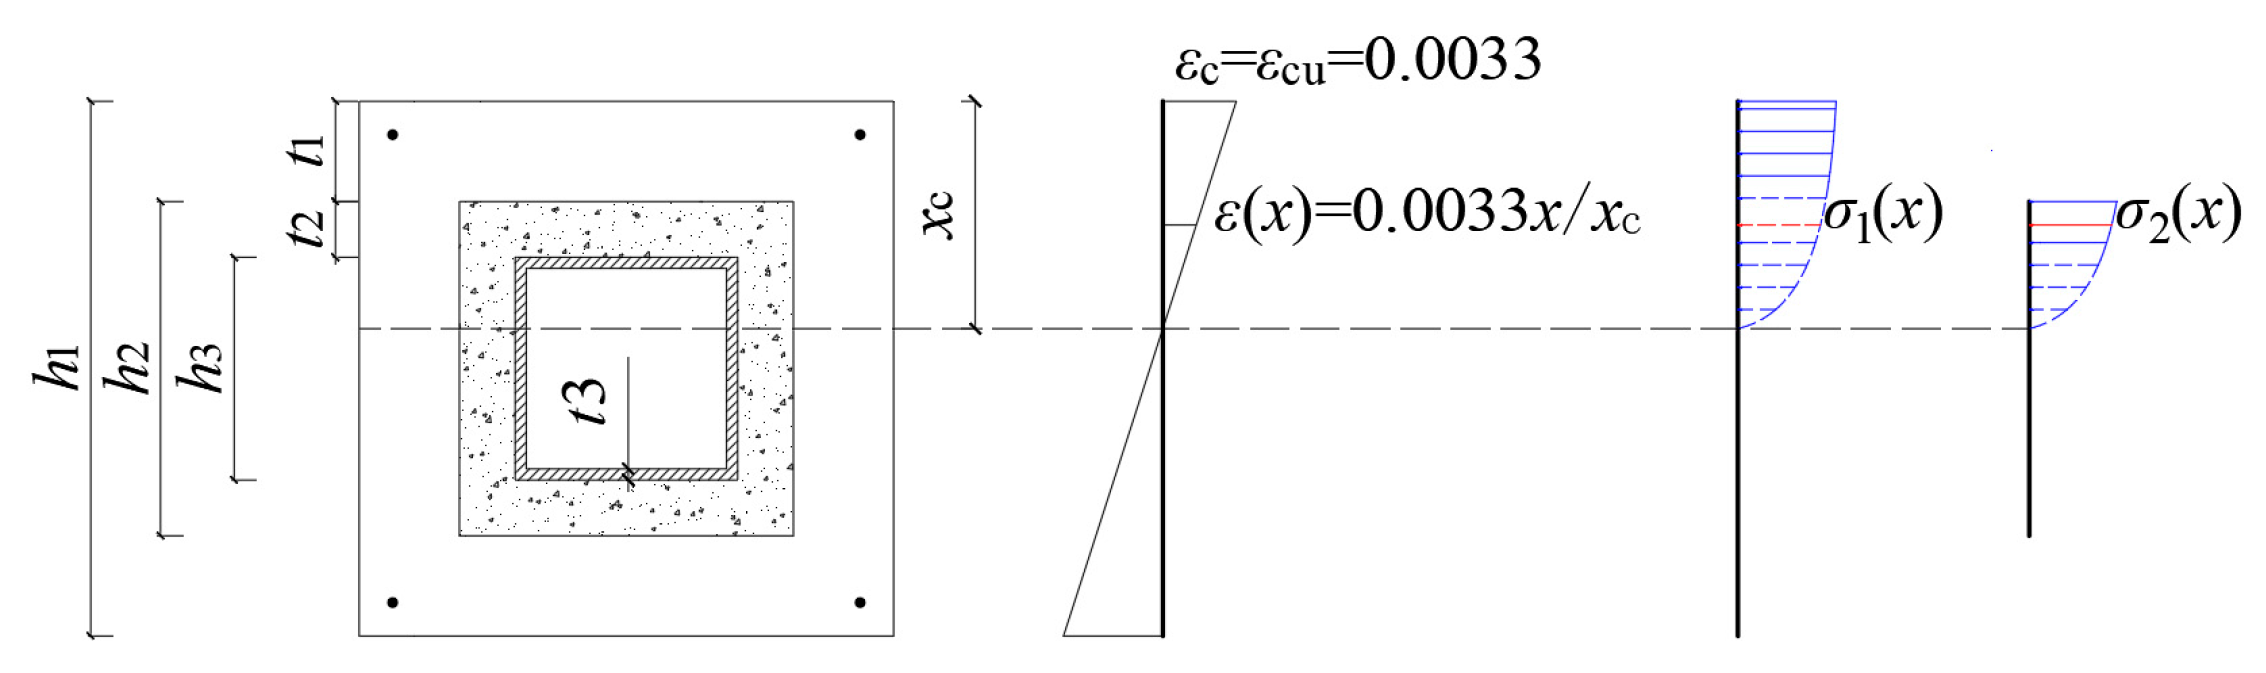
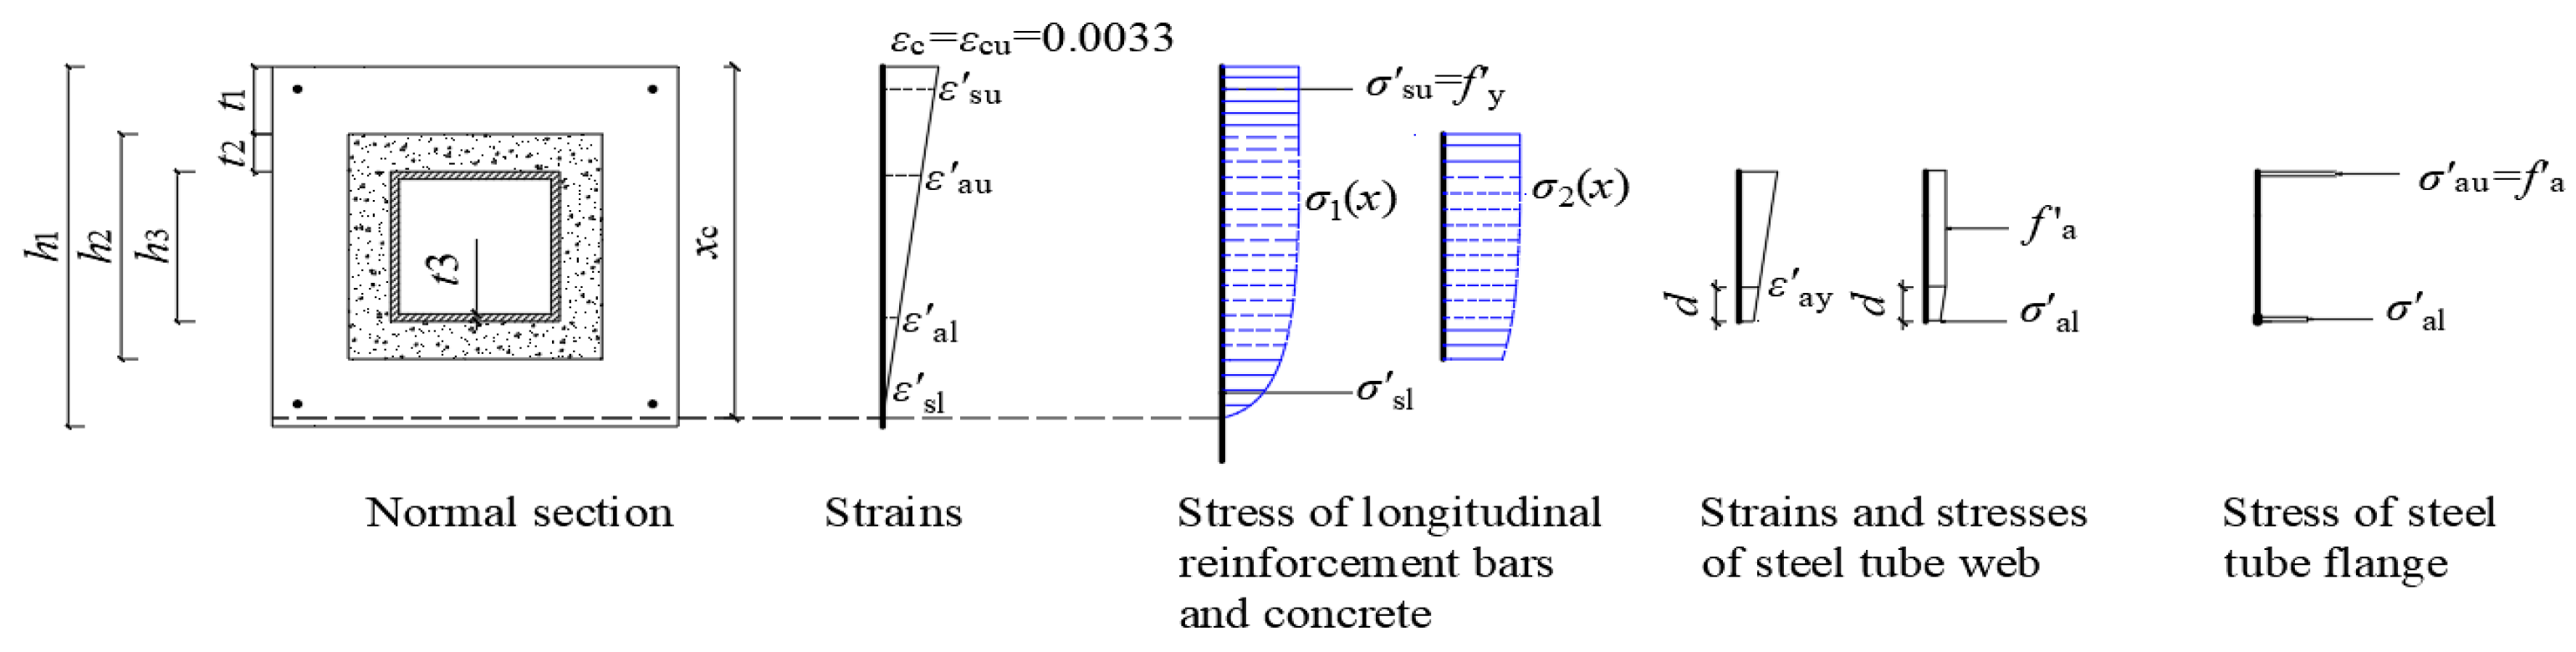
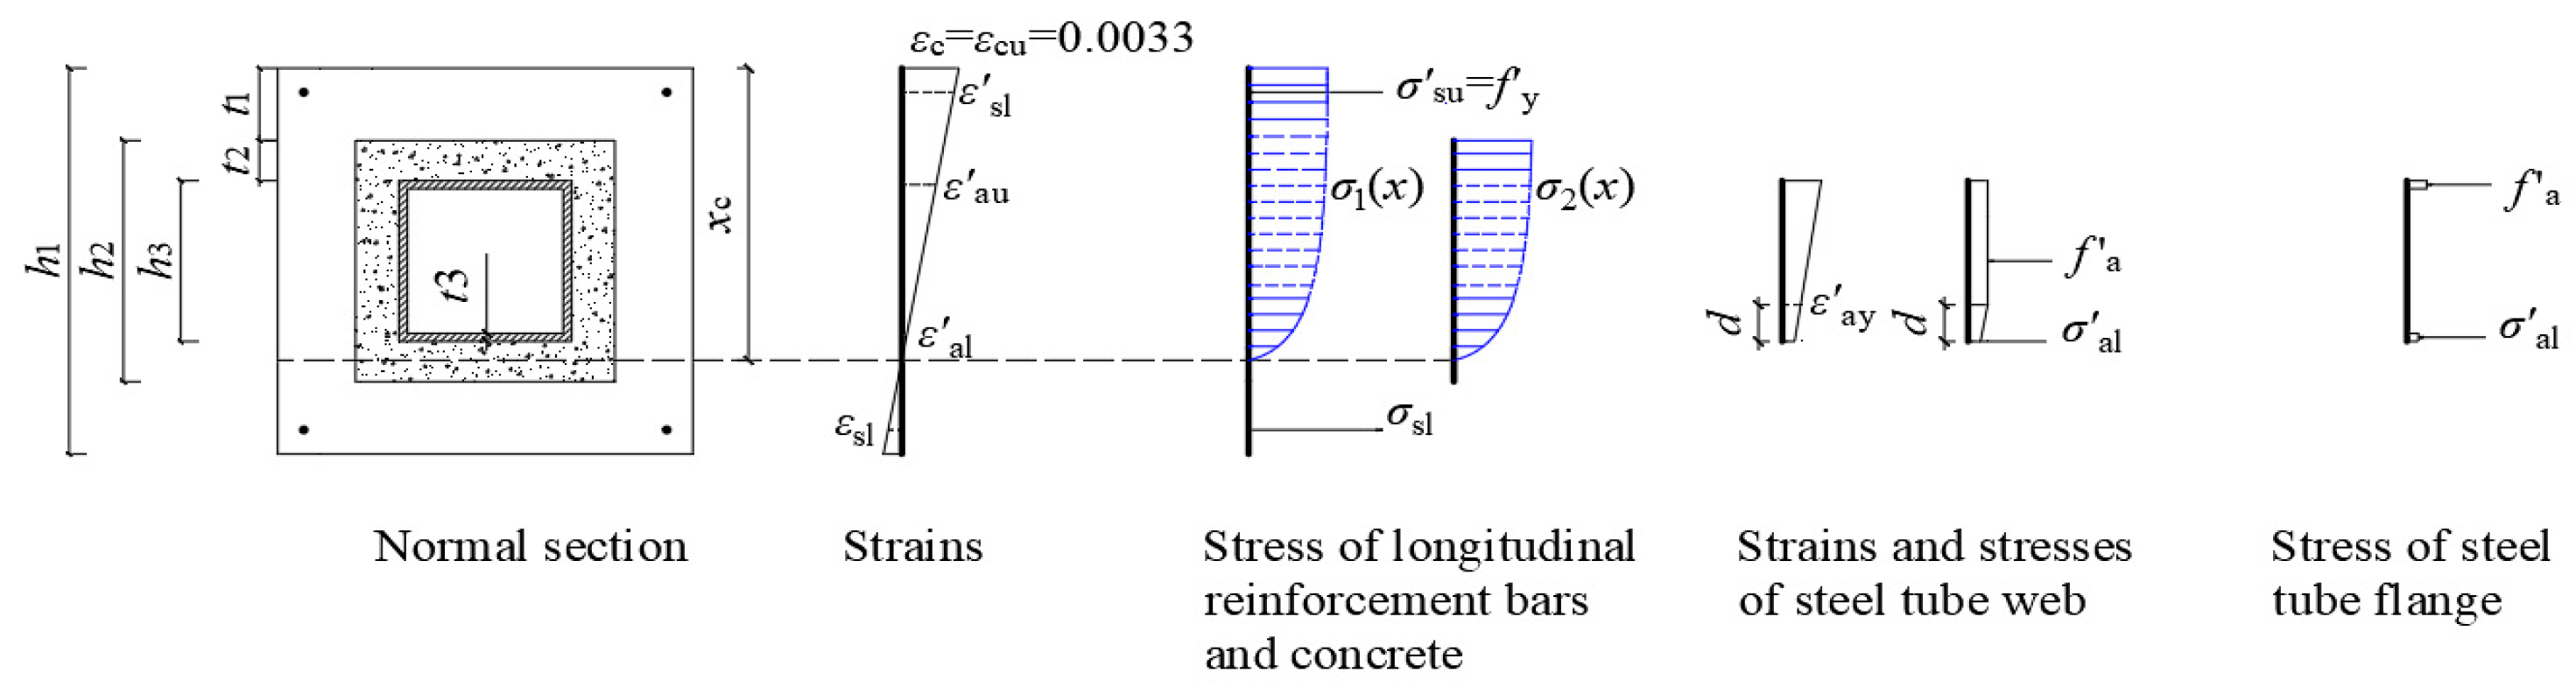
4.2.1. Calculation Equations for Compressive-Type Failure Mode

  • Case 1 (the neutral axis appears in the lower precast part, h2 + t1xc < h1)
In Case 1, the lower longitudinal reinforcement bars may be compressed or tensioned, resulting in different calculation formulas. It is mainly divided into Sub-case 1 and Sub-case 2, which were introduced in Section 3.6.1 above.
(a)
Sub-case 1 (h0xc < h1):
In Sub-case 1, the neutral axis appears at or below the centroid of the lower longitudinal reinforcement bars, which satisfies the condition h0xc < h1. The lower longitudinal reinforcement bars are subject to compressive stress, or the stress value may be zero. The stress and strain status of the normal section are illustrated in Figure 16.
σ′su is the compression stress of the upper longitudinal reinforcement bars.
ε′ay is the compressive yield strain of the steel tube.
d is the height of the unyielding web above the lower flange of the steel tube. According to the plane section assumption, d can be obtained by Equation (11).
x c h 3 + t 1 + t 2 + d x c = ε ay ε cu d = x c ε ay 0.0033 ( x c h 3 t 1 t 2 ) 0.0033
σ′al is the stress of lower flange of the steel tube, which can be obtained by Equation (12) based on the plane section assumption and the stress–strain relationship of the steel tube.
x c h 3 t 1 t 2 x c = ε al ε cu ε al = 0.0033 x c h 3 t 1 t 2 x c σ al = 0.0033 E a x c h 3 t 1 t 2 x c
Note: If σ′al > fa, which means that the material has yielded under compression, σ′al = fa.
σ′sl is the stress of the lower longitudinal reinforcement bars (compression stress or stress is zero), which can be obtained by Equation (13) based on the plane section assumption and stress–strain relationship of the reinforcement bars.
x c h 0 x c = ε sl ε cu ε sl = 0.0033 ( x c h 0 ) x c σ sl = 0.0033 E s ( x c h 0 ) x c
Based on Figure 16, the eccentric load capacity N and eccentricity e can be calculated by Equations (14) and (15), which are obtained from the axial force balance and the bending moment balance condition.
N = b 1 0 x c σ 1 x d x b 2 x c t 1 h 2 x c t 1 σ 1 x d x + b 2 x c h 2 t 1 x c t 1 σ 2 x d x b 3 x c t 1 h 3 t 2 x c t 1 t 2 σ 2 x d x + f y A s + σ sl A s + f a b 3 t 3 + σ al b 3 t 3 + 2 t 3 f a h 3 d + f a + σ al t 3 d
N ( e h 1 2 + x c ) = b 1 0 x c σ 1 x x d x b 2 x c t 1 h 2 x c t 1 σ 1 x x d x + b 2 x c h 2 t 1 x c t 1 σ 2 x x d x b 3 x c t 1 h 3 t 2 x c t 1 t 2 σ 2 x x d x + f y A s ( x c a s ) + σ sl A s ( x c h 0 ) + f a b 3 t 3 x c t 1 t 2 + σ al b 3 t 3 x c t 1 + t 2 + h 3 + 2 t 3 f a + σ al d d 3 2 σ al + f a σ al + f a + x c t 1 t 2 h 3 + 2 t 3 f a h 3 d x c t 1 t 2 h 3 d 2
It is worth noting that the actual eccentricity of this case is small, and the component is close to the axial compression state; thus, it is not discussed as a key point.
(b)
Sub-case 2 (h2 + t1xc < h0):
In Sub-case 2, the neutral axis appears above the lower longitudinal reinforcement bars, which satisfies the condition h2 + t1xc < h0. The stress and strain statuses of the normal section are presented in Figure 17.
In Figure 17, d can also be obtained by Equation (11) according to the plane section assumption, while σ′al can also be obtained by Equation (12). σsl is the stress of lower longitudinal reinforcement bars (tensile stress), which can be obtained by Equation (16) according to the plane section assumption and stress–strain relationship of reinforcement bars. If σsl > fy, which means that the material has yielded under tension, then σsl = fy.
h 0 x c h 0 = ε sl ε cu ε sl = 0.0033 ( h 0 x c ) h 0 σ sl = 0.0033 E s ( h 0 x c ) h 0
Based on Figure 17, load capacity N and eccentricity e can also be obtained by Equations (17) and (18), which are also obtained from the axial force balance and the bending moment balance condition.
N = b 1 0 x c σ 1 x d x b 2 x c t 1 h 2 x c t 1 σ 1 x d x + b 2 x c h 2 t 1 x c t 1 σ 2 x d x b 3 x c t 1 h 3 t 2 x c t 1 t 2 σ 2 x d x + f y A s σ sl A s + f a b 3 t 3 σ al b 3 t 3 + 2 t 3 f a h 3 d + 2 t 3 f a + σ al d
N ( e h 1 2 + x c ) = b 1 0 x c σ 1 x x d x b 2 x c t 1 h 2 x c t 1 σ 1 x x d x + b 2 x c h 2 t 1 x c t 1 σ 2 x x d x b 3 x c t 1 h 3 t 2 x c t 1 t 2 σ 2 x x d x + f y A s ( x c a s ) + σ sl A s ( h 0 x c ) + f a b 3 t 3 x c t 1 t 2 + σ al b 3 t 3 x c t 1 + t 2 + h 3 + 2 t 3 f a + σ al d d 3 2 σ al + f a σ a + f a + x c t 1 t 2 h 3 + 2 t 3 f a h 3 d x c t 1 t 2 h 3 d 2
2.
Case 2 (the neutral axis appears in the lower post-cast part, h3 + t1 + t2xc < h2 + t1)
When the central axis is located in the post-cast concrete (h3 + t1 + t2xc < h2 + t1), and the strain and stress statuses of the normal section are shown in Figure 18.
In Figure 18, d also represents the height of the unyielding web above the lower flange, which can also be calculated by Equation (11). σ′al and σsl can also be calculated by Equations (12) and (16), respectively. Load capacity N can then be obtained by combining Equations (19) and (20), which are derived from the axial force balance and bending moment balance in the normal section.
N = b 1 0 x c σ 1 x d x b 2 0 x c t 1 σ 1 x d x + b 2 0 x c t 1 σ 2 x d x b 3 x c t 1 t 2 h 3 x c t 1 t 2 σ 2 x d x + f y A s σ sl A s + f a b 3 t 3 σ al b 3 t 3 + 2 t 3 f a h 3 d + t 3 f a σ al d
N ( e h 1 2 + x c ) = b 1 0 x c σ 1 x x d x b 2 0 x c t 1 σ 1 x x d x + b 2 0 x c t 1 σ 2 x x d x b 3 x c t 1 t 2 h 3 x c t 1 t 2 σ 2 x x d x + f y A s ( x c a s ) + σ sl A s ( h 0 x c ) + f a b 3 t 3 x c t 1 t 2 + σ al b 3 t 3 x c h 1 t 1 t 2 + t 3 f a + σ al d 3 2 σ al + f a σ al + f a + x c t 1 t 2 h 3 d + 2 t 3 f a h 3 d x c t 1 t 2 h 3 d 2
3.
Case 3 (the neutral axis appears in the middle steel tube web, xtxc < h3 + t1 + t2)
The neutral axis is situated in the web region of the steel tube, and the stress and strain statuses of the normal section are shown in Figure 19.
d′ represents the height of the unyielding web above the neutral axis. According to the plane section assumption, d′ can be calculated by Equation (21).
d x c = ε ay ε cu d = x c ε ay 0.0033
The lower flange stress is tensile stress in this case, which is recorded as σal and can be calculated by Equation (22). σsl can also be calculated by Equation (16).
h 3 + t 1 + t 2 x c x c = ε al ε cu ε al = 0.0033 h 3 + t 1 + t 2 x c x c σ al = 0.0033 E a h 3 + t 1 + t 2 x c x c
Based on Figure 19, load capacity N can be calculated by combining Equations (23) and (24), which are obtained from the axial force balance and bending moment balance requirement.
N = b 1 0 x c σ 1 x d x b 2 0 x c t 1 σ 1 x d x + b 2 0 x c t 1 σ 2 x d x b 3 0 x c t 1 t 2 σ 2 x d x + f y A s σ sl A s + f a σ al b 3 t 3 + t 3 f a d t 3 σ al t 1 + t 2 + h 3 x c + 2 t 3 f a x c t 1 t 2 d
N ( e h 1 2 + x c ) = b 1 0 x c σ 1 x x d x b 2 0 x c t 1 σ 1 x x d x + b 2 0 x c t 1 σ 2 x x d x b 3 0 x c t 1 t 2 σ 2 x x d x + f y A s ( x c a s ) + σ sl A s ( h 0 x c ) + f a b 3 t 3 x c t 1 t 2 + σ al b 3 t 3 t 1 + t 2 + h 3 x c + 2 3 t 3 f a d 2 + 2 3 t 3 σ al t 1 + t 2 + h 3 x c 2 + t 3 f a x c t 1 t 2 d 2
According to the plane section assumption, the strain diagram obtained for the limit state of this failure mode is shown in Figure 20.
εsy and ε′sy refer to the tensile yield strain and compressive yield strain of the reinforcement bars. HRB400-grade bars are generally employed, with a design yield strength of 360 MPa and a corresponding yield strain of 0.00175. Therefore, εsy = ε′sy = 0.00175.
εay is the tensile yield strain of the steel tube. ε′ay is the compressive yield strain of the steel tube. A Q235 steel tube is generally employed, with a design yield strength of 215 MPa and a corresponding yield strain of 0.00104. Therefore, εay =ε′ay = 0.00104.
Note: “<” indicates that the yield strain has not been reached; “>” indicates that the yield strain has been reached.
According to the linear relationship of the strain (Figure 20), xt can be calculated by the following Equation (25):
x t = ε cu ε cu + ε ay h 3 + t 1 + t 2

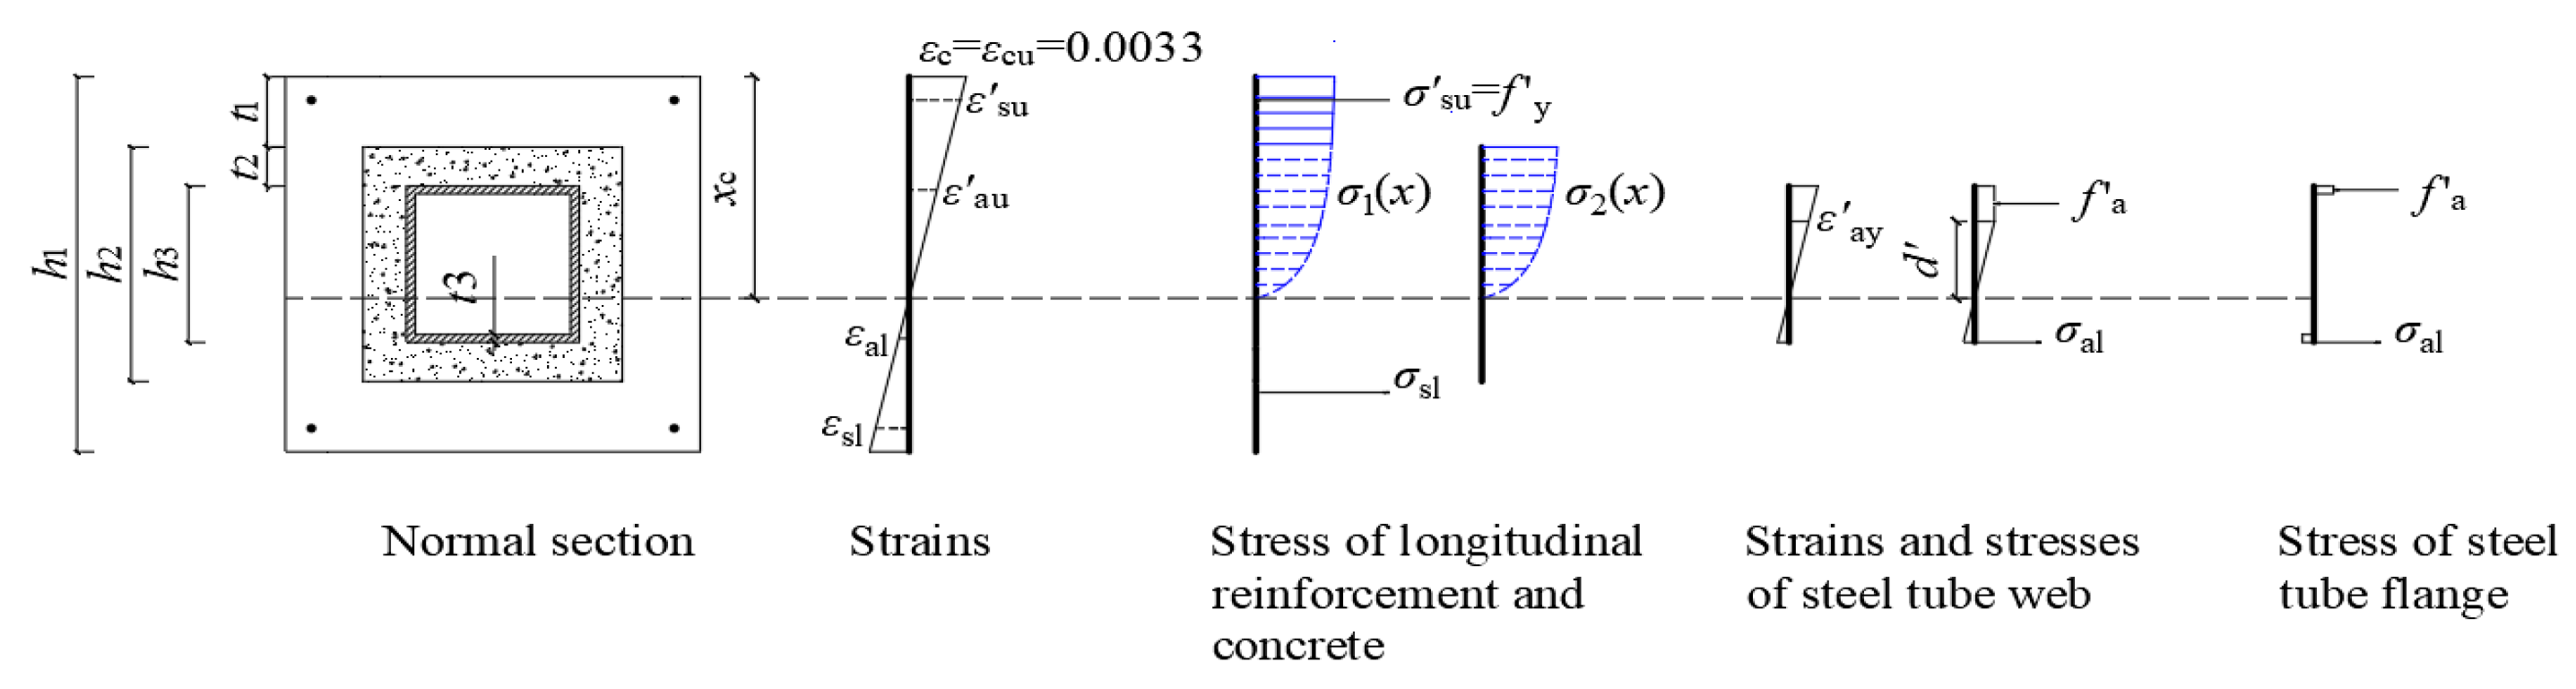
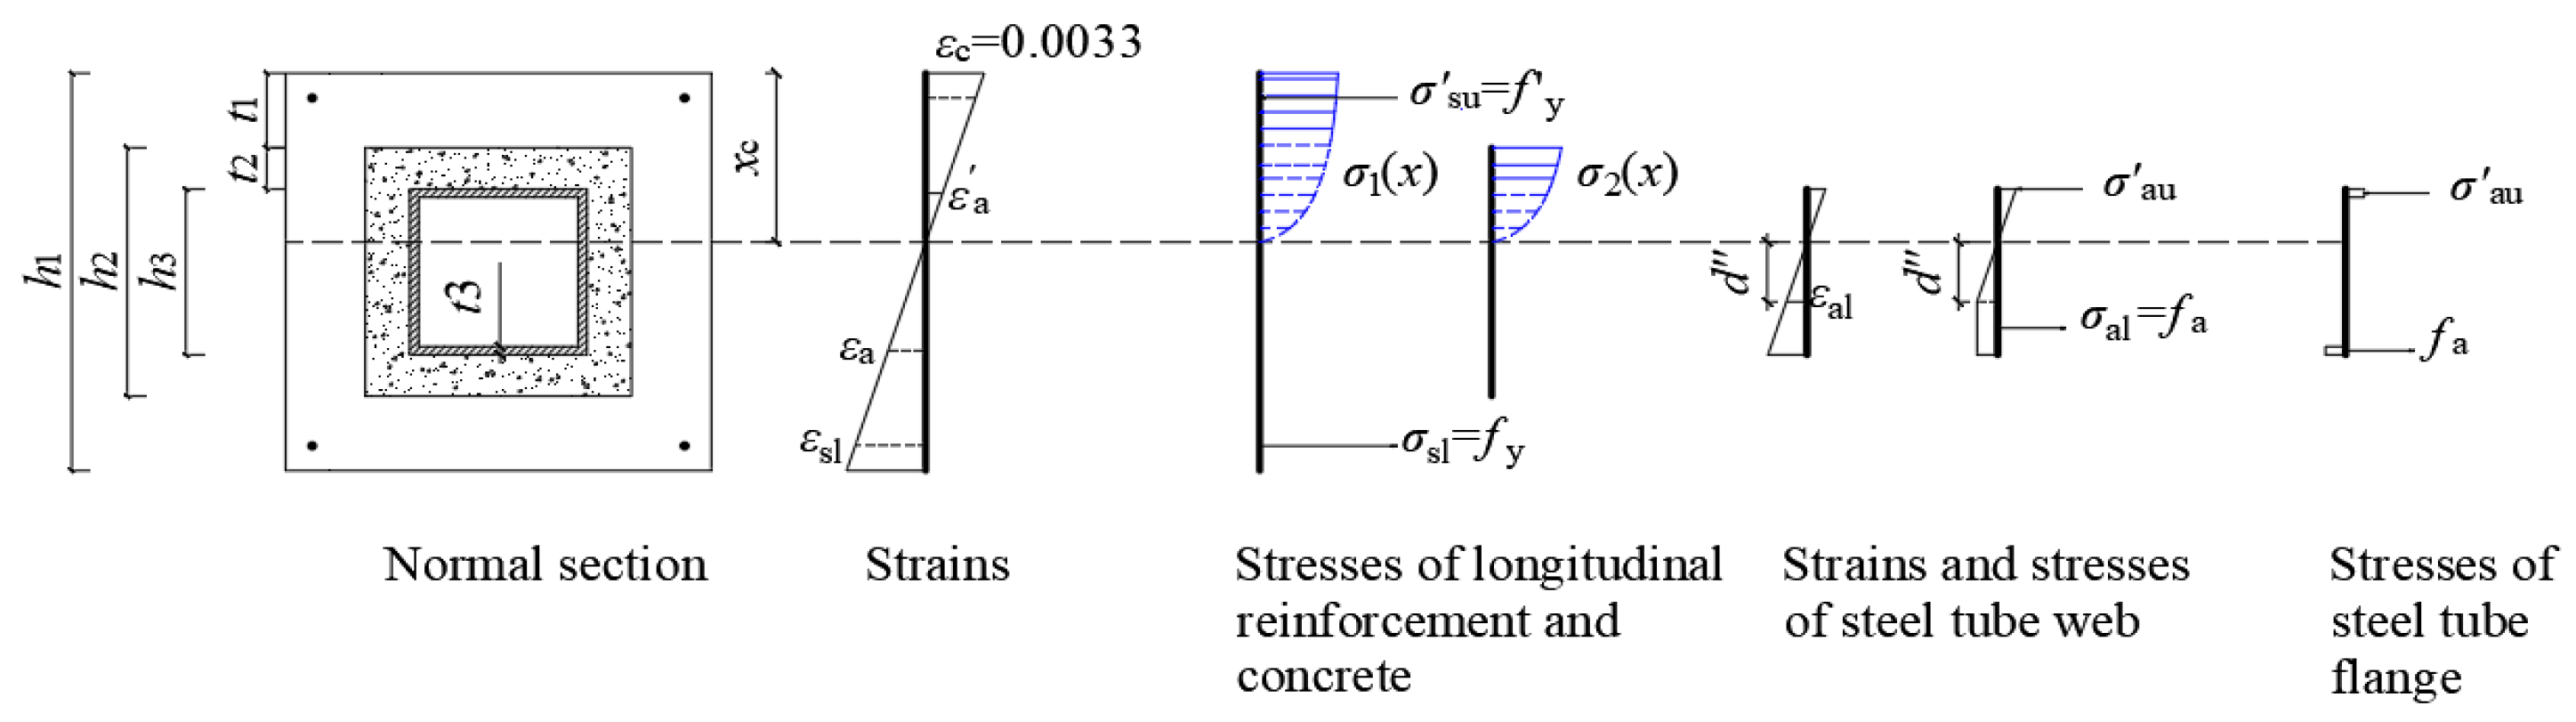
4.2.2. Calculation Equations for Total-Yield-Type Failure Mode

The strain and stress of the normal section in the total-yield-type failure mode can be seen in Figure 21.
d′ also represents the unyielding steel tube web height above the neutral axis. d′ can be obtained by Equation (21).
Equations (26) and (27) can be established based on the requirement of axial force balance and bending moment balance.
N = b 1 0 x c σ 1 x d x b 2 0 x c t 1 σ 1 x d x + b 2 0 x c t 1 σ 2 x d x b 3 0 x c t 1 t 2 σ 2 x d x + 2 t 3 f a 2 x c 2 t 1 2 t 2 h 3
N ( e h 1 2 + x c ) = b 1 0 x c σ 1 x x d x b 2 0 x c t 1 σ 1 x x d x + b 2 0 x c t 1 σ 2 x x d x b 3 0 x c t 1 t 2 σ 2 x x d x + f y A s ( h 1 2 a s ) + f a b 3 t 3 h 3 + 4 3 t 3 f a d 2 + t 3 f a x c t 1 t 2 t 3 2 d 2 + 2 t 3 f a t 1 + t 2 + h 3 t 3 x c d 2
According to the main characteristics of the total-yield-type failure mode, with the further upward movement of the neutral axis, there will be a situation where the upper flange is yielded because of compression and the concrete is crushed at the same time, which can be considered the limit state of the total-yield-type failure mode. For this limit state, the neutral axis height can be denoted by xp. The neutral axis height xc of the total-yield-type failure mode should satisfy xpxc < xt. Based on the plane section assumption, a diagram of the strain status for this limit state could be obtained and is shown in Figure 22.
xp can be calculated based on the linear relationship law of the strain presented by Figure 22.
x p = t 1 + t 2 1 ε ay ε cu

4.3. Verification of Calculation Methods

4.3.1. PSCCST-100-X Specimens

Based on the derivation process of the calculation equations, the relevant parameters corresponding to the two limit states (for the compressive-type failure mode and the total-yield-type failure mode) can be obtained. The value of e0 corresponding to the limit state of the compressive-type failure mode is 150 mm. The value of e0 corresponding to the limit state of the total-yield-type failure mode is 238 mm. Therefore, it can be concluded that the specimens with e0 values of 40 mm, 150 mm, and 220 mm correspond to compression failure, limit state, and total yield failure, respectively, which is consistent with the test results. The calculated bearing capacity Nc for each PSCCST-100-X specimen can be obtained, and the comparison of the calculated value Nc and test value Nt is listed in Table 5.
Obviously, these calculated values are very close to the corresponding experimental values, with an average ratio of 0.95 (standard deviation is 0.0047), which is within the allowable error range in practice.

4.3.2. PSCCST-80-X Specimens

Through calculation, the values of e0 corresponding to the limit state of the compressive-type failure mode are determined to be 130 mm. Similarly, the values of e0 corresponding to the limit state of the total-yield-type failure mode are determined to be 215 mm. Therefore, it can be concluded that the specimens with e0 values of 40 mm, 150 mm, and 220 mm correspond to compression failure, limit state, and total yield failure, respectively, which is consistent with the test results.
The calculated bearing capacity Nc for each PSCCST-80-X specimen can also be obtained, and the comparison of the calculated value Nc and test value Nt is listed in Table 6.
Obviously, these calculated values are also very close to the corresponding experimental values, with an average ratio of 0.95 (standard deviation is 0.0125), which is also within the allowable error range in practice.

4.4. Error Analysis Between Nc and Nt

In addition to the previous basic assumptions, another factor causing the error between Nc and Nt is that the cast-in-place concrete in the compression zone is confined by the external precast concrete part and the internal square steel tube.
Different from the confinement effect experienced by the concrete inside the ordinary concrete-filled steel tube, the cast-in-place concrete here is only fully in compression under some failure modes. Moreover, the confinement effect of the external precast concrete layer is significantly weaker than that of the steel tube. Therefore, the influence of this effect on the bearing capacity is not very remarkable.

4.5. Sensitivity Analysis of Calculation Methods

It is necessary to analyze the sensitivity of the calculated equations to the parameters, as they involve a relatively large number of parameters. By analyzing the equations in Section 4.2, it can be seen that, for each parameter related to the material properties, there is no need to consider its variability. They are all directly taken as the design values during the calculation process. The external dimensions of the specimen are also directly taken as the design values during the calculation process, and there is no need to consider their variability. The dimensions of the section of steel have no variability. Due to construction errors, the thickness of the prefabricated concrete layer, the thickness of the cast-in-place concrete layer, and the actual value of as may vary. Furthermore, it can be concluded that there is no need to consider the variability of fc, d′, σc1, or σc2 either. Therefore, the influence of these four parameters, including b2, t1, t2, and as, on the calculation result of the bearing capacity should be considered.
When referring to the relevant Codes T/CCES 30–2022 [31] and GB 50204–2015 [32], the deviation rate of b2, t1, and t2 is taken as ±5%, and the deviation amount of as is taken as ±5 mm.
The calculated bearing capacity value is denoted after considering the deviation rate of the parameter values as Nc′. By taking the equations for the total-yield-type failure mode (Equations (26) and (27)) and specimen PSCCST-80-200 as an example, the parameter sensitivity analysis is shown in Table 7:
It can be seen that each value of Nc’/Nt is very close to 0.95. The average value of Nc’/Nt is 0.951. This result indicates that the variability of each parameter has a very small impact on the calculation result of the bearing capacity.

4.6. Comparison with Another Method

The structure of the PSCCST column has some similarities with a partially prefabricated steel-reinforced concrete (PPSRC) column [14]. Therefore, the calculation method for the eccentric compression bearing capacity provided in this literature is selected for comparison.
For the PSCCST-80-200 and PSCCST-100-220 specimens, the failure type (total-yield-type failure mode) corresponds to the ‘tensile-controlled failure’ in this literature. Therefore, the bearing capacity Nc2 should be calculated by using the equations listed in Section 4.2.1 [14]. For the other four specimens, the failure types correspond to the ‘compression-controlled failure’ in this literature. Therefore, the bearing capacity Nc2 should be calculated by using the equations listed in Section 4.2.2 [14]. In order to apply the equations and simplify the calculation process, the cross-section of the square steel tube is equivalently treated as an I-shaped cross-section (keeping the two flanges unchanged and combining the left and right webs into one web). The comparison between Nc and Nc2 is shown in Table 8.
It can be seen that the degree of deviation between Nc and Nc2 is slightly greater than that between Nc and Nt. However, the values of Nc and Nc2 are of the same order of magnitude, and the numerical values of their highest digits are the same. The main reason for this kind of deviation is that the two calculation methods each have their own simplified assumptions, and at the same time, the cross-sectional structures of the two types of columns are not exactly the same.
The comparison results indicate that the calculation method proposed in this paper is reasonable.

5. Further Expanded Analysis

As the eccentricity increases, the area of the compression zone decreases, and the height of the compression zone (xc) constantly changes, leading to varying internal force states of each part. However, for larger eccentricities, the normal section is primarily under tension (including the whole section of the steel tube), as depicted in Figure 23. In this case, the concrete in the normal section is unable to effectively perform its function due to the tensile state. Additionally, there may be a relative slip and poor cooperative performance between the outer edge of the steel tube and the surrounding concrete. Therefore, it is recommended that, when conducting the actual engineering design, this kind of working condition should be avoided. The minimum value of e corresponding to this working condition is noted as eb, where the compression zone just starts from the upper edge of the upper flange of the steel tube. Therefore, the partial section of the steel tube under tension for the PSCCST columns should be focused on, and the corresponding e conforms to 0 < e < eb.

5.1. Tensile-Type Failure Mode

According to the strain change law of the steel tube within the compressive-type failure mode and total-yield-type failure mode with respect to eccentricity, it can be extrapolated that an additional failure mode may occur at higher eccentricity levels than the total-yield-type failure mode. Specifically, the lower flange has yielded because of tension, while the upper flange remains under compression without yielding. This new failure mode can be referred to as the tension failure mode, and the strain status of the normal section in its limit state can be seen in Figure 24. The upper flange experiences zero stress, while the lower flange yields because of tension. Additionally, the upper reinforcement rebars yield because of compression, whereas the lower longitudinal rebars yield in tension. The corresponding neutral axis height is denoted as xn = t1 + t2. The neutral axis height xc for this kind of tensile-type failure mode should satisfy xnxc < xp.
It can be found that the calculated eccentricity e of the normal section in this limit state is exactly eb.

5.2. Calculation Equations for Tensile-Type Failure Mode

The stress and strain status can be seen in Figure 25.
The height of the unyielding steel tube web below the neutral axis is denoted by d″, which can be obtained by the following Equation (29):
d x c = ε ay ε cu d = x c ε ay 0.0033
The upper flange stress is compression stress σau, which can also be obtained by the following Equation (30):
x c t 1 t 2 x c = ε au ε cu ε au = 0.0033 x c t 1 t 2 x c σ au = 0.0033 E a x c t 1 t 2 x c
Note: for the limit state of this mode, the value of σ′au is zero because xc = t1 + t2.
According to Figure 25, Equation (31) can be established according to the axial force balance of the section.
N = b 1 0 x c σ 1 x d x b 2 0 x c t 1 σ 1 x d x + b 2 0 x c t 1 σ 2 x d x b 3 0 x c t 1 t 2 σ 2 x d x + f y A s f y A s f a b 3 t 3 + σ au b 3 t 3 + t 3 σ au x c t 1 t 2 t 3 2 t 3 f a d 2 t 3 f a t 1 + t 2 + h 3 x c d
Equation (32) can be established according to the bending moment balance of the section.
N ( e h 1 2 + x c ) = b 1 0 x c σ 1 x x d x b 2 0 x c t 1 σ 1 x x d x + b 2 0 x c t 1 σ 2 x x d x b 3 0 x c t 1 t 2 σ 2 x x d x f y A s ( h 0 2 a s ) + σ au b 3 t 3 x c t 1 t 2 + f a b 3 t 3 t 1 + t 2 + h 3 x c + 2 3 t 3 σ au x c t 1 t 2 2 + f a d 2 + t w f a t 1 + t 2 + h 3 x c 2 d 2

6. Conclusions

To further simplify the construction and improve the processing convenience of the partially precast steel reinforced concrete column, the PSCCST column was proposed and its eccentric bearing capacity was studied in this paper. The following conclusions can be drawn:
  • There are three typical failure modes, including the compressive-type failure mode, total-yield-type failure mode, and tensile-type failure mode, which are primarily dependent on the eccentricity e. As e increased, there was a noticeable decrease in the ultimate eccentric compression capacity of the PSCCST column Nu.
  • The PSCCST column has good ductility. With the increase of e, the horizontal lateral deflection corresponding to Nu increased, indicating that the deformation capacity increased.
  • A set of calculation formulas for predicting Nu was proposed, which can serve as the design basis for the PSCCST column.
  • PSCCST columns can be employed as new vertical load-bearing components in various structural systems, especially in prefabricated concrete structure systems.
In conclusion, the research results of this study can promote the practical implementation of the PSCCST column. However, there are still some aspects of performance research that need to be carried out in the future. Some examples of these are the confinement effect of the cast-in-place concrete in the compression zone induced by the external precast concrete and the internal square steel tube (especially for the compressive-type failure mode); the performance of the PSCCST columns under cyclic loading; and their performance after long-term use.

Author Contributions

Conceptualization, Y.W. (Yilin Wang); methodology, Y.W. (Yilin Wang) and S.M. (Shikun Ma); software, S.M.; validation, S.M. and S.W. (Shunyao Wang); formal analysis, Y.W. and S.M.; investigation, S.M.; resources, Y.W.; data curation, S.M. and S.W.; writing—original draft preparation, S.W.; writing—review and editing, Y.W.; visualization, S.M.; supervision, Y.W.; project administration, Y.W.; funding acquisition, Y.W. All authors have read and agreed to the published version of the manuscript.

Funding

This work was funded by the National Natural Science Foundation of China under grant number 51608311 and the Program for Changjiang Scholars and Innovative Research Team in University of China under grant number IRT13075.

Data Availability Statement

Data are contained within the article.

Acknowledgments

The authors wish to express their appreciation and gratitude to the anonymous reviewers and editors for their insightful comments and suggestions for improving the paper’s quality.

Conflicts of Interest

The authors declare no conflicts of interest.

References

  1. Chinnasamy, Y.; Joanna, P.S.; Kothanda, K.; Gurupatham, B.G.A.; Roy, K. Behavior of Pultruded Glass-Fiber-Reinforced Polymer Beam-Columns Infilled with Engineered Cementitious Composites under Cyclic Loading. J. Compos. Sci. 2022, 6, 338. [Google Scholar] [CrossRef]
  2. Samuel, J.; Nair, S.R.; Joanna, P.S.; Gurupatham, B.G.A.; Roy, K.; Lim, J.B.P. Composite Cold-Formed Steel Beams with Diagonal Rebars for Earthquake-Resistant Buildings. Materials 2023, 16, 3002. [Google Scholar] [CrossRef] [PubMed]
  3. Reena, G.C.; Gurupatham, A.G.B.; Tsavdaridis, D.K. Column Link Behavior in Eccentrically Braced Composite 3-Dimensional Frames. Buildings 2023, 13, 2970. [Google Scholar] [CrossRef]
  4. Wu, X.M.; Shi, Y.L.; Zheng, L.; Wang, W.D. Performance of rectangular SRCFST stub columns under long-term loading and preload on steel tube. Structures 2024, 61, 106110. [Google Scholar] [CrossRef]
  5. Ji, S.H.; Wang, W.D.; Shi, Y.L.; Zheng, L. Residual compressive behaviour and CFRP strengthening of SRCFST columns after combined damage of fire and lateral impact. Thin-Walled Struct. 2025, 207, 112756. [Google Scholar] [CrossRef]
  6. Wang, S.Y.; Wang, Y.L.; Sheng, D.P.; Wang, Y. Study on new prefabricated reinforced concrete structure technology based on fault-tolerant design. Buildings 2022, 12, 814. [Google Scholar] [CrossRef]
  7. Hwang, J.H.; Lee, D.H.; Oh, J.Y.; Choi, S.H.; Kim, K.S.; Seo, S.Y. Seismic performances of centrifugally-formed hollow-core precast columns with multi-interlocking spirals. Steel Compos. Struct. 2016, 20, 1259–1274. [Google Scholar] [CrossRef]
  8. Xue, Y.; Yang, Y.; Yu, Y. Cyclic behavior of partially precast steel reinforced concrete short columns: Experiment and theoretical analysis. Eng. Struct. 2019, 199, 109658. [Google Scholar] [CrossRef]
  9. Yang, Y.; Chen, Y.; Zhang, J.T.; Xue, Y.C.; Liu, R.Y.; Yu, Y.L. Experimental investigation on shear capacity of partially prefabricated steel reinforced concrete columns. Steel Compos. Struct. 2018, 28, 73–82. [Google Scholar] [CrossRef]
  10. Zhang, B.J.; Xie, Y.T.; Wang, S.Y.; Feng, J.P.; Gao, Y.; Wang, Y. Eccentric bearing capacity of steel reinforced reactive powder concrete columns after high temperature exposure. Case Stud. Constr. Mat. 2023, 19, e02648. [Google Scholar] [CrossRef]
  11. Morteza, N.; Mohsen, A.; Mahdi, N. Effect of concrete confinement level on load-bearing capacity of steel-reinforced concrete (SRC) columns under eccentric loading: Experiment and FEA model. Structures 2022, 35, 202–213. [Google Scholar] [CrossRef]
  12. An, Y.; Han, L. Behaviour of concrete-encased CFST columns under combined compression and bending. J. Constr. Steel. Res. 2014, 101, 314–330. [Google Scholar] [CrossRef]
  13. Lai, B.; Liew, J.Y.R.; Li, S. Finite element analysis of concrete-encased steel composite columns with off-center steel section. In Proceedings of the 12th International Conference on ‘Advances in Steel-Concrete Composite Structures’, Valencia, Spain, 27–29 June 2018. [Google Scholar] [CrossRef]
  14. Yang, Y.; Chen, Y.; Zhang, W.; Feng, S.Q. Behavior of partially precast steel reinforced concrete columns under eccentric loading. Eng. Struct. 2019, 197, 109429. [Google Scholar] [CrossRef]
  15. Ren, Q.; Ding, J.; Wang, Q.; Lou, H.Q. Behavior of slender square hollow steel-reinforced concrete columns under eccentric compression. J. Build. Eng. 2021, 43, 103133. [Google Scholar] [CrossRef]
  16. Wang, R.; Han, L.H.; Lam, D. Behaviour of octagonal steel-reinforced concrete box columns under compressive load. Mag. Concr. Res. 2018, 70, 838–855. [Google Scholar] [CrossRef]
  17. Wang, Y.; Wang, X.; Li, G.Q. Residual strength of L-shaped steel reinforced concrete columns after exposure to high temperatures. KSCE J. Civ. Eng. 2021, 25, 1369–1384. [Google Scholar] [CrossRef]
  18. ACI 318-19; Building Code Requirements for Structural Concrete (ACI 318-19) and Commentary. American Concrete Institute: Farmington Hills, MI, USA, 2019.
  19. ASCE/SEI 41-17; Seismic Evaluation and Retrofit of Existing Buildings. Structural Engineering Institute: Reston, VA, USA; American Society of Civil Engineers: Reston, VA, USA, 2017.
  20. CEB-FIP Model Code 90; Design Code. Comité Euro-International du Béton (CEB): Lausanne, Switzerland; Fédération Internationale de la Précontrainte (FIP): Lausanne, Switzerland; Thomas Telford Services Ltd.: Westminster, UK, 1993.
  21. JGJ 138-2016; Code for Design of Composite Structures. Ministry of Housing and Urban-Rural Development (MOHURD): Beijing, China; China Architecture Publishing & Media Co., Ltd.: Beijing, China, 2016. (In Chinese)
  22. GB 50010-2010; Code for Design of Concrete Structures. Ministry of Housing and Urban-Rural Development (MOHURD): Beijing, China; China Architecture Publishing & Media Co., Ltd.: Beijing, China, 2010. (In Chinese)
  23. GB 1499.2-2024; Steel for the Reinforcement of Concrete—Part 2: Hot Rolled Ribbed Bars. China Standards Press: Beijing, China, 2024. (In Chinese)
  24. GB/T 8162-2018; Seamless Steel Tubes for Structural Purposes. China Standards Press: Beijing, China, 2018. (In Chinese)
  25. Wang, F.; Young, B.; Gardner, L. Testing and numerical modelling of circular CFDST normal sections with stainless steel outer tubes in bending. Eng. Struct. 2021, 247, 113170. [Google Scholar] [CrossRef]
  26. Ahmed, M.; Liang, Q.Q.; Patel, V.I.; Hadi, M.N.S. Behavior of eccentrically loaded double circular steel tubular short columns filled with concrete. Eng. Struct. 2019, 201, 109790. [Google Scholar] [CrossRef]
  27. Cao, B.; Zhu, L.; Jiang, X.T.; Wang, C.S. An investigation of compression bearing capacity of concrete-filled rectangular stainless steel tubular columns under axial load and eccentric axial load. Sustainability 2022, 14, 8946. [Google Scholar] [CrossRef]
  28. Chen, Z.P.; Liao, H.; Zhou, J.; Ye, P. Eccentric compression behavior of reinforced recycled aggregate concrete columns after exposure to elevated temperatures: Experimental and numerical study. Structures 2022, 43, 959–976. [Google Scholar] [CrossRef]
  29. Ma, H.; Chen, Y.C.; Bai, H.Y.; Zhao, Y.L. Eccentric compression performance of composite columns composed of RAC-filled circular steel tube and profile steel. Eng. Struct. 2019, 201, 109778. [Google Scholar] [CrossRef]
  30. Zhu, X.H. Behavior of Hollow Steel Reinforced Concrete Columns Under Eccentric Compression. Master’s Thesis, Xi’an University of Architecture and Technology, Xi’an, China, 2015. (In Chinese). [Google Scholar]
  31. T/CCES 30–2022; Standard for Tolerances for Precast Concrete Components. China Architecture Publishing & Media Co., Ltd.: Beijing, China, 2022. (In Chinese)
  32. GB 50204–2015; Code for Acceptance of Construction Quality of Concrete Structures. Ministry of Housing and Urban-Rural Development (MOHURD): Beijing, China; China Architecture Publishing & Media Co., Ltd.: Beijing, China, 2015. (In Chinese)
Figure 1. Schematic diagram of the PSCCST column.
Buildings 15 00826 g001
Figure 2. Section diagram of the PSCCST column under eccentric load.
Buildings 15 00826 g002
Figure 3. Schematic of the specimen.
Buildings 15 00826 g003
Figure 4. Layout of the loading device and measuring instruments.
Buildings 15 00826 g004
Figure 5. Sketch of the loading test frame and load application method.
Buildings 15 00826 g005
Figure 6. Final failure state of all specimens.
Buildings 15 00826 g006
Figure 7. Concrete strain distribution status.
Buildings 15 00826 g007
Figure 8. Steel tube strain distribution status.
Buildings 15 00826 g008
Figure 9. Lateral deflections at different load levels for all specimens.
Buildings 15 00826 g009
Figure 10. Vertical axial load versus lateral deflection of the mid-height section.
Buildings 15 00826 g010
Figure 11. Position of the neutral axis and the strain expression of each main part when h2 + t1xc < h0. εc is the concrete strain (under compression); εcu is the ultimate compressive strain of concrete, and εcu = 0.0033 is suitable for concrete, whose strength grade is not greater than C50, including the strength range of the concrete in the PSCCST columns; εsu is the compression strain of the upper longitudinal reinforcement bars; εsl is the tensile strain of the lower reinforcement bars; εau is the compression strain of the upper flange; ε′al is the compression strain of the lower flange.
Buildings 15 00826 g011
Figure 12. The neutral axis and strain expression of each main part when h0xc < h1. εsl is the compression strain of the lower longitudinal reinforcement bars.
Buildings 15 00826 g012
Figure 13. Position of the neutral axis and the strain expression of each main part when xtxc < h3 + t1 + t2. εal represents the tensile strain of the steel tube lower flange.
Buildings 15 00826 g013
Figure 14. The neutral axis and strain expression of each main part when h3 + t1 + t2xc < h2 + t1.
Buildings 15 00826 g014
Figure 15. Example of the strain and stress state of the normal section according to the plane section assumption.
Buildings 15 00826 g015
Figure 16. The stress and strain status of the normal section for Sub-case 1.
Buildings 15 00826 g016
Figure 17. The stress and strain statuses of the normal section (h2 + t1xc < h0).
Buildings 15 00826 g017
Figure 18. Strain and stress statuses of the normal section when h3 + t1 + t2xc< h2 + t1.
Buildings 15 00826 g018
Figure 19. Strain and stress of the normal section when xtxc < h3 + t1 + t2.
Buildings 15 00826 g019
Figure 20. Strain diagram of the limit state.
Buildings 15 00826 g020
Figure 21. The strain and stress of the normal section in the total-yield-type failure mode.
Buildings 15 00826 g021
Figure 22. Strain diagram of the limit state for the total-yield-type failure mode.
Buildings 15 00826 g022
Figure 23. Schematic diagram of the whole section of the steel tube under tension.
Buildings 15 00826 g023
Figure 24. Strain diagram of the limit state of the tensile-type failure mode.
Buildings 15 00826 g024
Figure 25. Strain and stress status of the tensile-type failure mode.
Buildings 15 00826 g025
Table 1. Complete list of information of all the specimens.
Specimen No.Size of Precast Concrete PartSize of Post-Cast Concrete PartSize of Steel TubeLoad Eccentricity e0 (mm)
h1 × b1
(mm × mm)
t1 = t1
(mm)
as
(mm)
h2 × b2
(mm × mm)
t2 = t2
(mm)
h3 × b3
(mm × mm)
t3
(mm)
PSCCST-80-20240 × 2404527150 × 1503580 × 80520
PSSCT-80-130240 × 2404527150 × 1503580 × 805130
PSCCST-80-200240 × 2404527150 × 1503580 × 805200
PSCCST-100-40240 × 2404527150 × 15025100 × 100540
PSCCST-100-150240 × 2404527150 × 15025100 × 1005150
PSCCST-100-220240 × 2404527150 × 15025100 × 1005220
Note: The naming rule of the specimens can be explained by the example of PSCCST-80-X: 80 denotes the side length of the square steel tube; X represents the value of e0.
Table 2. Mix proportion design of the concrete (unit: kg/m3).
Concrte GradeWaterCementFly AshMineral FinesSandAggregateSuperplasticizer
C3017023080708899251.8
C4017028070608829181.8
Table 3. Values of Nt for each specimen.
SpecimenEccentricity e0 (mm)Test Value of Nt (kN)
PSCCST-80-2020 mm947
PSCCST-80-130130 mm443
PSCCST-80-200200 mm258
PSCCST-100-4040 mm916
PSCCST-100-150150 mm410
PSCCST-100-220220 mm256
Table 4. The specific state of each part of the normal section for failure type 2.
Edge of Concrete Compression ZoneLower Flange of Steel TubeUpper Flange of Steel TubeWeb of Steel TubeLongitudinal Reinforcement Bars
In Tension ZoneIn Compression Zone
CrushedJust yield under tensionYield under compressionThe webs contain compression and tension zones, with partial webs in the compression zone yield.YieldYield
Table 5. Nc and Nt for the PSCCST-100-X specimens.
SpecimenEccentricity e0
(mm)
ηEccentricity e = ηe0
(mm)
Failure ModeCalculated Value of Nc (kN)Test Value of Nt (kN)Nc/Nt
PSCCST-100-40401.0542compression failure (Case 1)8719160.95
PSCCST-100-1501501.03154compression failure (Case 3)3934100.96
PSCCST-100-2202201.02224total yield failure2422560.95
Table 6. Nc and Nt of the PSCCST-80-X specimens.
Specimen No.Eccentricity e0
(mm)
ηEccentricity e = ηe0
(mm)
Failure ModeCalculated Value of Nc (kN)Test Value of Nt (kN)Nc/Nt
PSCCST-80-2020 mm1.0521compression failure (Case 1)8859470.93
PSCCST-80-130130 mm1.03144compression failure (Case 3)4274430.96
PSCCST-80-200200 mm1.02204total yield failure2462580.95
Table 7. Parameter sensitivity analysis.
ParameterDeviation Rate/AmountParameter Value (mm)Nc′ (kN)Nc′/Nt
b2−5%142.5246.1320.954
b2+5%157.5244.0680.946
t1−5%42.75247.4220.959
t1+5%47.25243.5520.944
t2−5%33.25246.9060.957
t2+5%36.75243.8100.945
as−5 mm22245.3580.951
as+5 mm32244.8420.949
Table 8. Comparison between Nc and Nc2.
SpecimenPSCCST-80-20PSCCST-100-40PSCCST-80-130PSCCST-100-150PSCCST-80-200PSCCST-100-220
Nc885871427393246242
Nc2821824405371230222
Nc2/Nc0.9280.9460.9490.9440.9350.917
Disclaimer/Publisher’s Note: The statements, opinions and data contained in all publications are solely those of the individual author(s) and contributor(s) and not of MDPI and/or the editor(s). MDPI and/or the editor(s) disclaim responsibility for any injury to people or property resulting from any ideas, methods, instructions or products referred to in the content.

