Article

Interfacial Bond Behavior of Clay Brick Masonry Strengthened with CFRP

School of Architecture and Urban Planning, Yunnan University, Kunming 650504, China
*
Author to whom correspondence should be addressed.
Buildings 2025, 15(5), 809; https://doi.org/10.3390/buildings15050809
Submission received: 12 February 2025 / Revised: 26 February 2025 / Accepted: 1 March 2025 / Published: 3 March 2025
(This article belongs to the Special Issue Low-Carbon and Green Materials in Construction—2nd Edition)

Abstract

This study investigates the interfacial bond behavior of clay brick masonry strengthened with carbon fiber-reinforced polymer (CFRP) through single-side shear tests. Two specimen types (single bricks and masonry prisms) were tested under varying parameters, including bond length, bond width, mortar joints, and end anchorage. Experimental results revealed cohesive failure within the masonry substrate as the dominant failure mode. Mortar joints reduced bond strength by 12.1–24.6% and disrupted stress distribution, leading to discontinuous load–displacement curves and multiple strain peaks in CFRP sheets. Increasing bond width enhanced bond capacity by 16.3–75.4%, with greater improvements observed in single bricks compared with prisms. Bond capacity initially increased with bond length but plateaued (≤10% increase) beyond the effective bond length threshold. End anchorage provided limited enhancement (<14%). A semi-theoretical model incorporating a brick–mortar area proportion coefficient (χ) and energy release rate was proposed, demonstrating close alignment with experimental results. The findings highlight the critical influence of mortar joints and provide a refined framework for predicting interfacial bond strength in CFRP-reinforced masonry systems.

1. Introduction

Building disrepair, aging of building materials, earthquakes, and other natural disasters pose potential hazards to the durability and normal use of masonry buildings. To mitigate these hidden dangers, it is essential to strengthen such structures. FRP (fiber-reinforced polymer) reinforcement technology offers strong operability and convenient construction, which can improve the brittleness of masonry structures and enhance their integrity. Regardless of whether it concerns components or entire structures [1,2,3,4,5,6,7,8,9,10,11,12,13,14,15,16], the reinforcement effects of FRP-reinforced technology have been effectively validated for both undamaged and pre-damaged [4,7,8] conditions, and for in-plane and out-of-plane [10,14,16] performance. The critical aspect of FRP reinforcement is to ensure the effective bond performance between FRP and brick masonry. Therefore, it is imperative to study the bond property and stress distribution at the interface between the fiber and the masonry base to accurately predict the interfacial bond capacity of reinforced building structures.
The bonding performance between FRP and masonry can be primarily categorized into two aspects: tensile and shear properties. Currently, the majority of research efforts have focused on the latter [17,18]. Vaculik et al. [18] conducted a comprehensive review and analysis of existing experimental studies on the bonding between FRP and substrate and suggested that the single-lap test demonstrated superior performance compared with the double-lap test. Olivito et al. [19] studied the shear performance of FRP-reinforced masonry bricks, taking into account the effects of brick type, fiber type, fiber width, and bond length. Gentilini et al. [20] analyzed the bonding properties of various composite materials to sintered clay brick substrates using shear and pull-out tests. Ceronia et al. [21] investigated the impact of various fiber materials (BFRP, CFRP, and GFRP) on the bonding properties of different substrates (tuff and clay brick) and examined the peel load calculation formula. CFRP offers superior tensile strength and stiffness, making it ideal for high-load scenarios, while GFRP and BFRP provide cost-effective alternatives with moderate strength [22]. Thermoplastic composites (e.g., polypropylene-based FRP) enable recyclability, whereas thermosetting resins (e.g., epoxy) ensure durable adhesion [23]. Ma et al. [24] selected three commonly used blocks as the substrate and determined the bonding behavior between FRP and the substrate. Reboul et al. [25] reinforced clay brick masonry with three kinds of FRP composite materials, conducted shear bond tests on the specimens, and analyzed the strengthening performance of combining bio-based epoxy resin with three different fibers. Furthermore, numerical analyses of bond behavior between masonry and FRPs have been carried out [26,27,28]. In addition to different substrates and FRP, many scholars have also analyzed the degradation effect of the environment on interface properties [29,30,31]. End anchorage systems, such as U-wraps or mechanical spikes, mitigate premature debonding by redistributing stress concentrations at the loaded end [32].
Based on experimental studies, a large number of strength models of the FRP–masonry interface have been proposed [19,24,33,34,35]. Mansouri et al. [33] utilized GEP (genetic expression programming) technology to forecast the bond strength of FRP-reinforced masonry members. Kashyap et al. [34] proposed stick–slip constitutive models and design formulas for maximum debonding load. Carozzi et al. [35] introduced a calculation model for bond strength based on fracture energy and incorporated a correction coefficient to account for the influence of bond length and width on bond strength. Due to the discrete characteristics of masonry structure, the applicability of various strength models is not particularly satisfactory. Some studies [36,37,38] highlight the critical role of interfacial fracture energy and substrate heterogeneity in bond behavior. For instance, Rabi et al. demonstrated that energy-based models better capture debonding in composite-material-strengthened systems [36], while they emphasized the influence of substrate porosity on bond strength [37].
When using FRP to strengthen masonry structures, it is important to consider the presence of the mortar joint to accurately predict interfacial fracture energy and bond capacity [39,40]. However, the existing research findings remain inconsistent. Freddi and Sacco [41] adopted a new interface model to simulate the stripping process and concluded that the stiffness and strength of the mortar joint contribute to reducing interface stress and stripping load. However, some scholars argue that the mortar joint provides an additional bond resistance mechanism, leading to a slight increase in peel load and effective bond length [21,40]. Carloni and Focacci [42] utilized the energy balance method and determined that the shear stress in the FRP–mortar interface is lower than that in the FRP–brick interface. Mazzotti and Murgo [43] suggested that the presence of a weak mortar joint could hinder stress transfer to the next brick and proposed further investigation into how strengthening the mortar joint might alter the debonding mechanism. Sassoni et al. [39] showed that disregarding the presence of mortar joints and solely focusing on the mechanical properties of bricks could result in significant inaccuracies when estimating the debonding force. Ghiassi et al. [44] observed that a poor-quality mortar can result in a considerable decrease in bond strength. Focacci and Carloni [45] found that the effective length of the FRP–brick interface is influenced by the size of the bricks and mortar joints.
While existing studies have explored the bond behavior of FRP–masonry interfaces, the influence of mortar joints, a critical yet understudied factor, has not been systematically analyzed. Previous models [35] often neglect the discontinuous stress transfer caused by mortar joints, leading to inaccurate predictions of bond capacity. Ceroni et al. [21] investigated the role of mortar joints in FRP debonding but focused on tuff substrates. Sassoni et al. [39] only emphasized mortar joint effects qualitatively. This study bridges this gap by comprehensively evaluating the role of mortar joints through single-side shear tests on both single bricks and masonry prisms. Furthermore, we propose a novel semi-theoretical model incorporating a brick–mortar area proportion coefficient (χ) and energy release rate, which significantly improves the accuracy of bond strength predictions. These advancements provide critical insights for optimizing FRP reinforcement designs in real-world masonry structures, particularly those with weak mortar joints, and establish a foundation for future studies on hybrid masonry systems.

2. Experimental

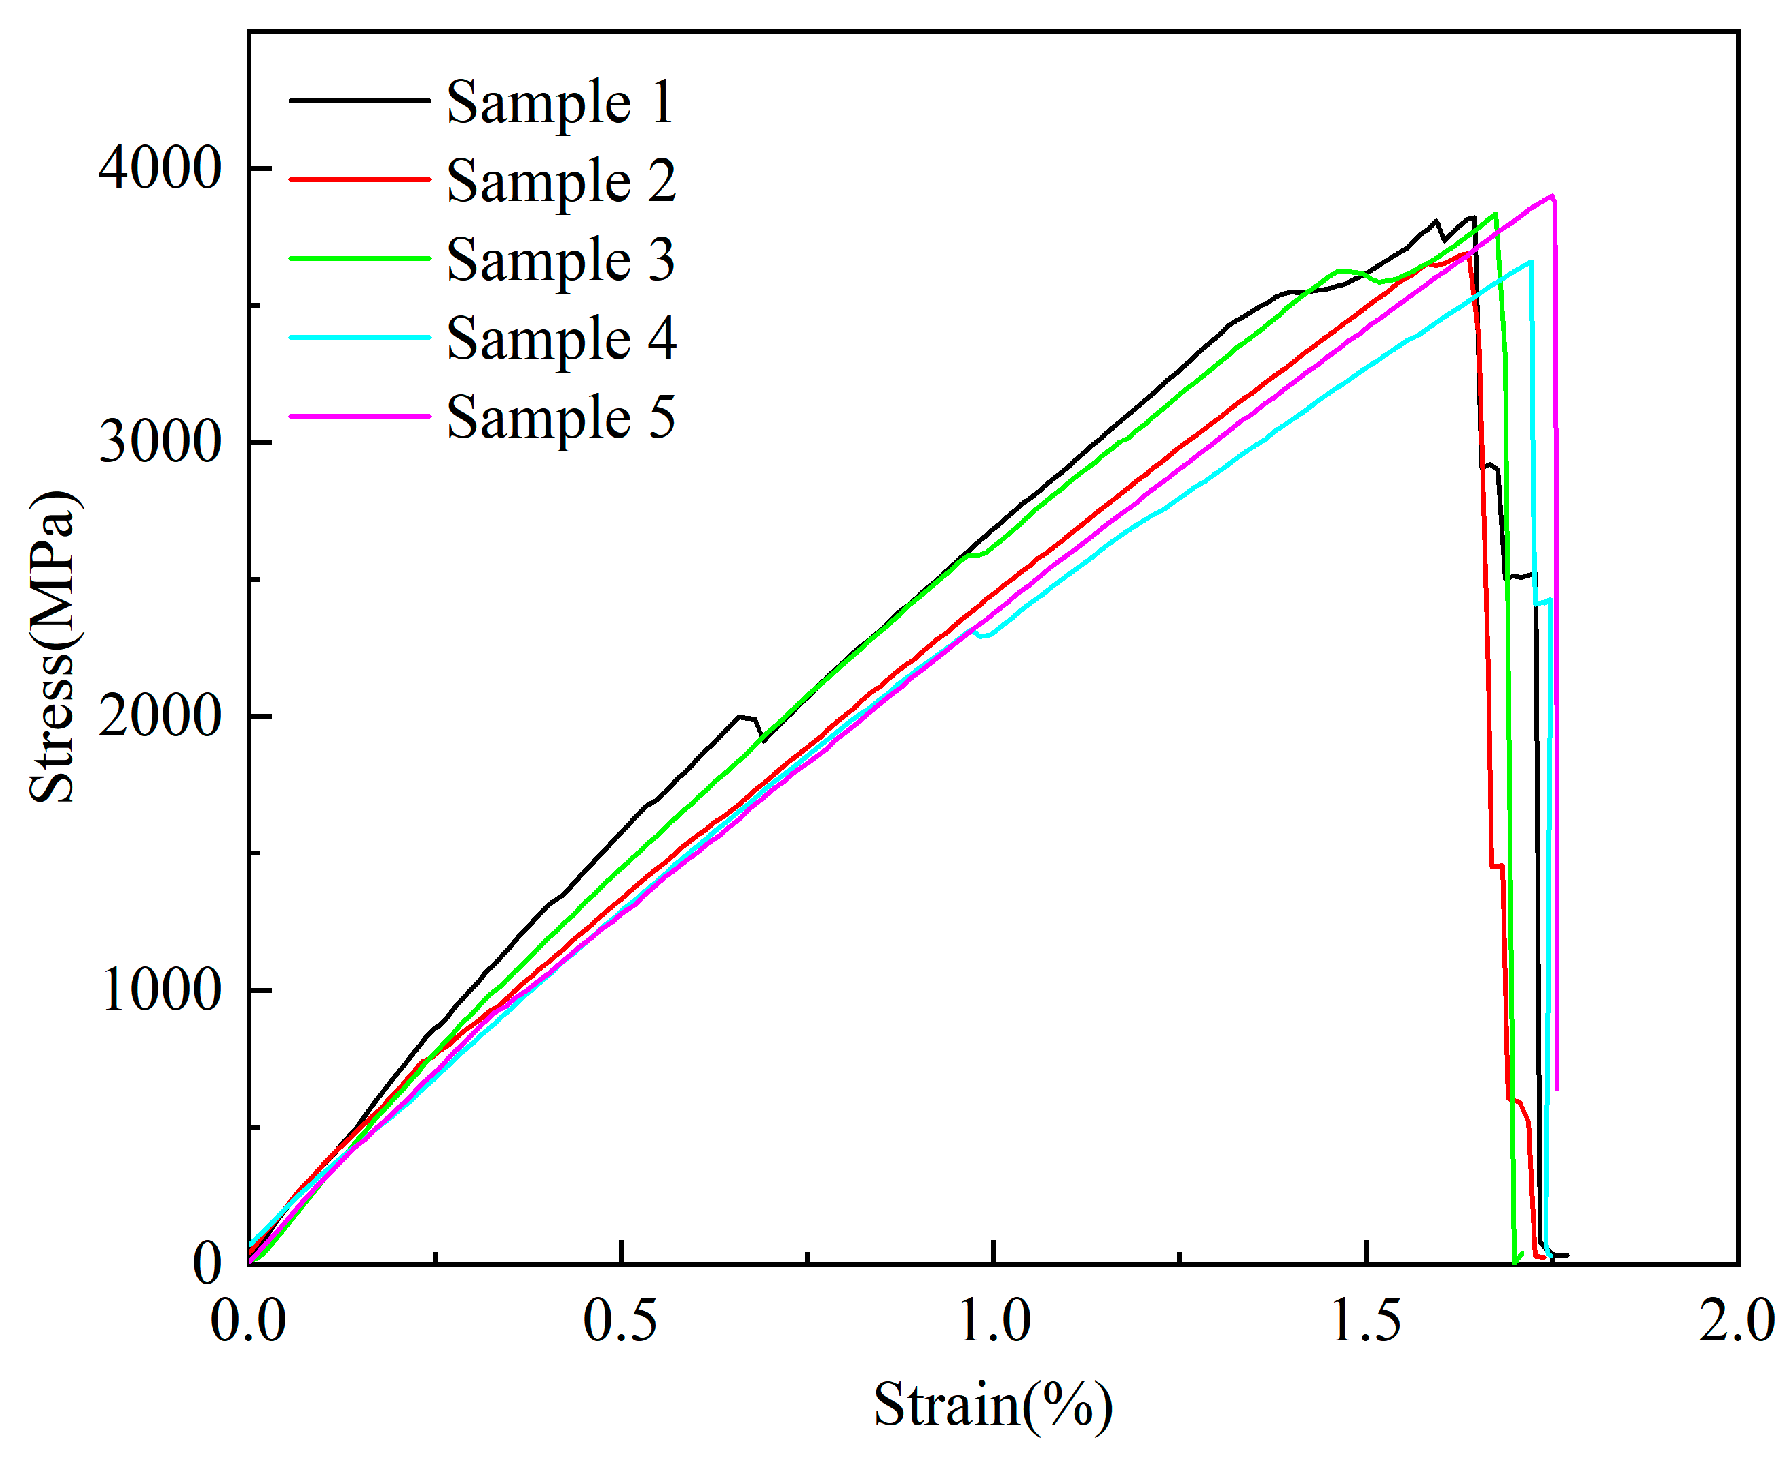
2.1. Material Properties

Sintered solid clay bricks (240 × 115 × 53 mm) with strength grade MU10 defined in GB50003-2011 [46] were used in the test. According to GB/T 2542-2012 [47], the tested average values of compressive strength, f1, and elastic modulus, E m , of ten bricks are 12.8 MPa and 7828 MPa, respectively, and the corresponding coefficients of variation are 3.3% and 1.2%, respectively. In this study, the masonry prisms were constructed with cast-in-place cement mortar with a thickness of 10 mm. P.O 32.5 ordinary Portland cement (OPC) specified in GB175-2023 [48] was employed. The sand had a fineness modulus of 2.1 and a nominal maximum size of 0.45 mm, followed by JGJ52-2006 [49]. The mix proportion (cement/fine sand/water) was 220:1400:315. According to JGJ/T 70-2009 [50], the compressive strength, f2, of cement mortar at 28 days was 6.3 MPa, with a coefficient of variation of 1.2% by testing three mortar samples (70.7 × 70.7 × 70.7 mm). The compressive strength of the masonry prism was calculated according to the equations in GB50003-2011 [46]: f m = 0.78 f 2 0.5 ( 1 + 0.07 f 1 ) , and the value was 4.0 MPa.
The unidirectional continuous CFRP sheet used in the study was CFS-I-300, featuring a fiber weight of 300 g/m2 and a thickness of 0.111 mm. This first-class carbon fiber cloth is manufactured by Shanghai Duanjun Company (Shanghai, China). The mechanical properties listed in Table 1 were obtained by testing five CFRP samples with a width of 25 mm and a length of 250 mm according to ASTM D3039/D3039M-17 [51]. Figure 1 displays the tensile stress–strain curves of the CFRP samples.
The adhesive included an epoxy resin (bisphenol A type E-51; Guangdong Chenfang Adhesive Products Co., Shenzhen, China) and a curing agent (W93; Kunshan Jiulimei Electronic Maerials Co., Kunshan, China). The epoxy resin and curing agent were mixed at a ratio of 100:30 by weight. The mechanical properties of the adhesive listed in Table 1 were determined by the uniaxial tensile test. Three tensile specimens were prepared and tested by ASTM D638-22 [52]. The detailed dimension is shown in Figure 2.

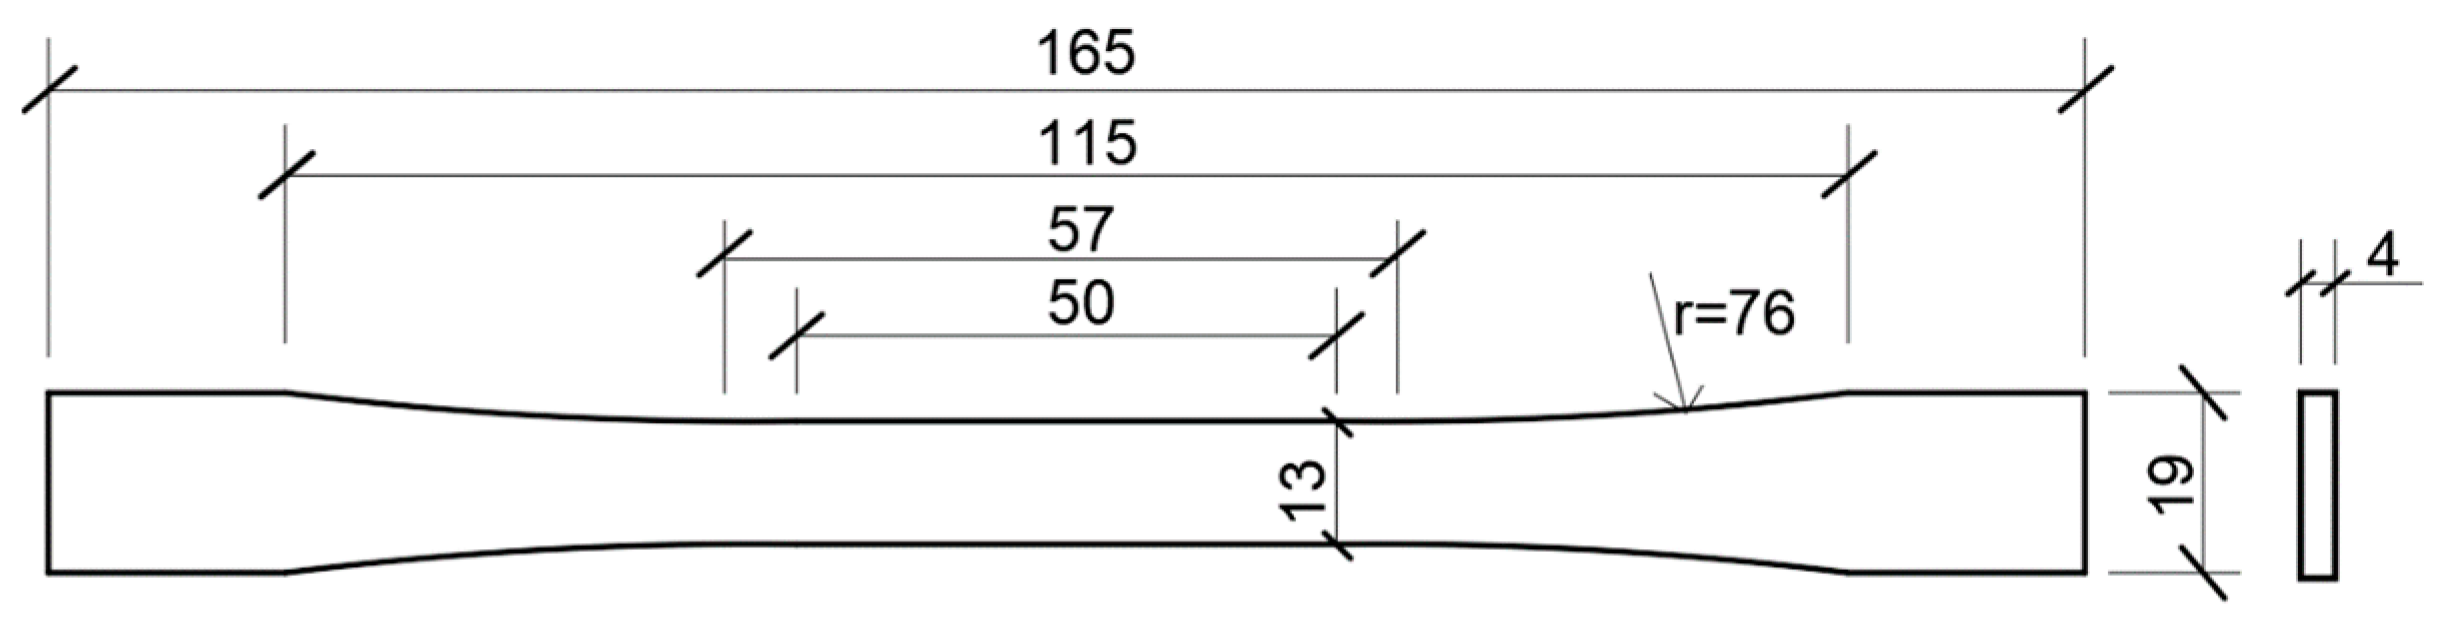
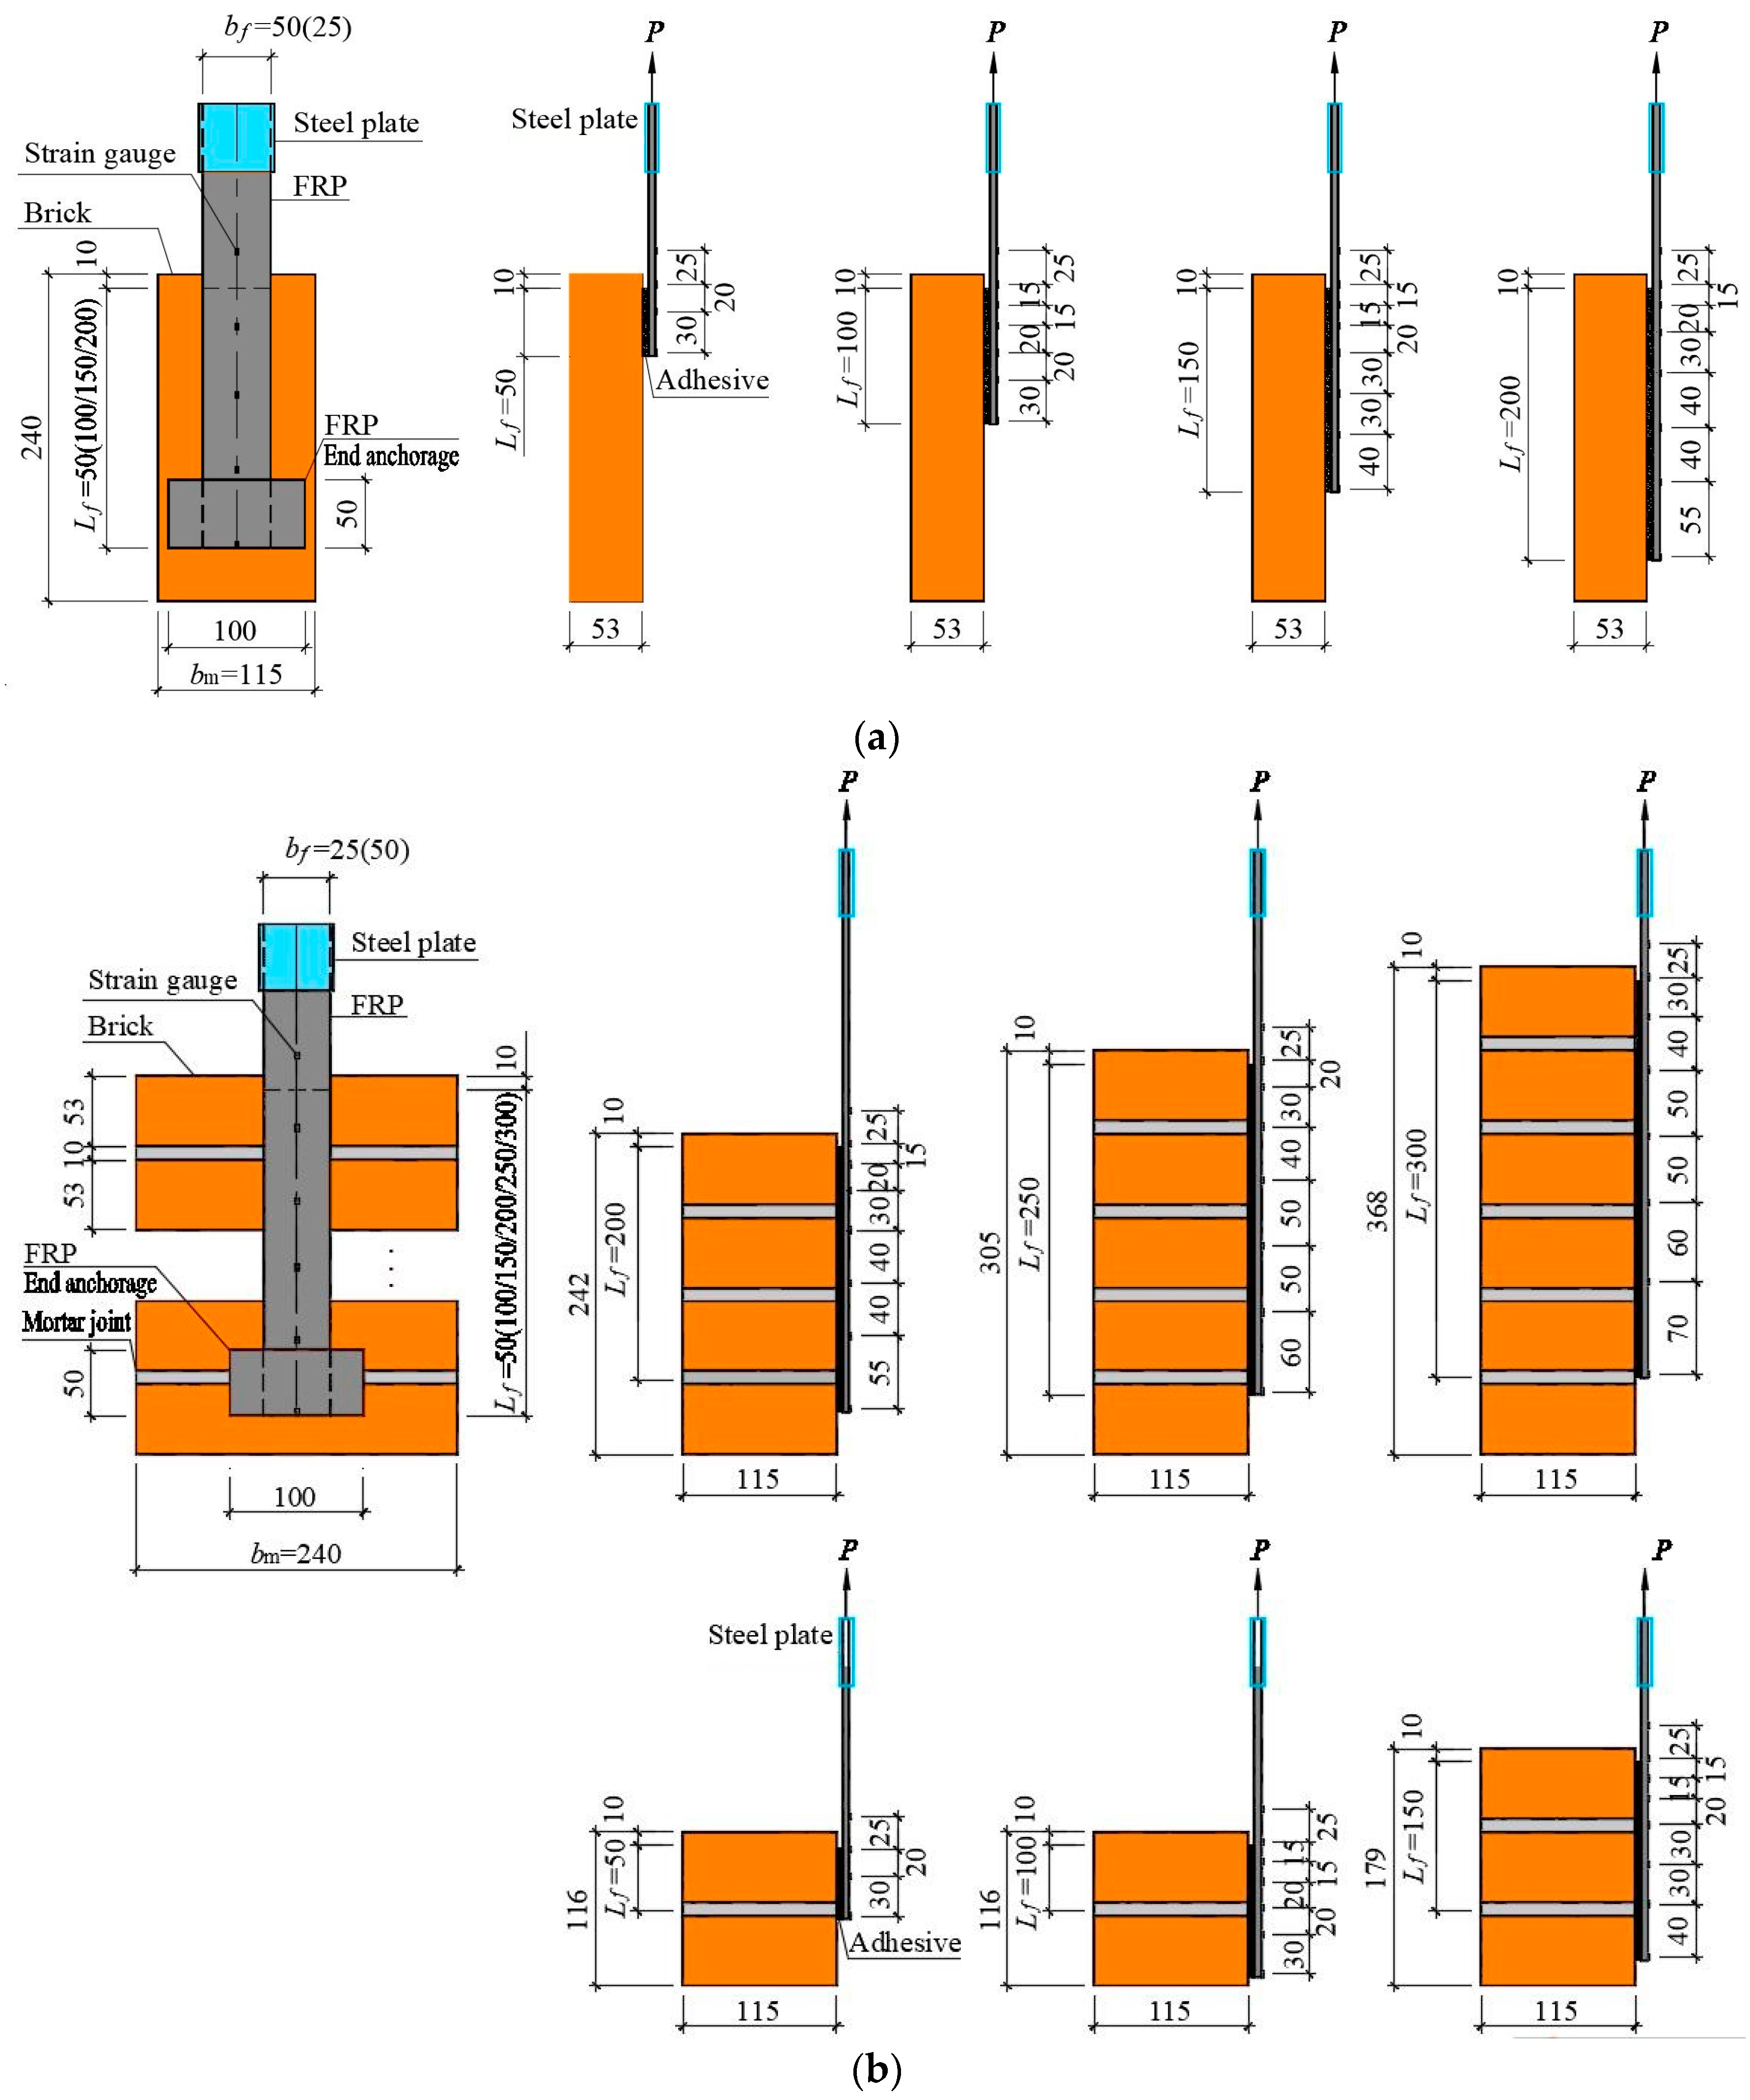
2.2. Specimen Fabrication
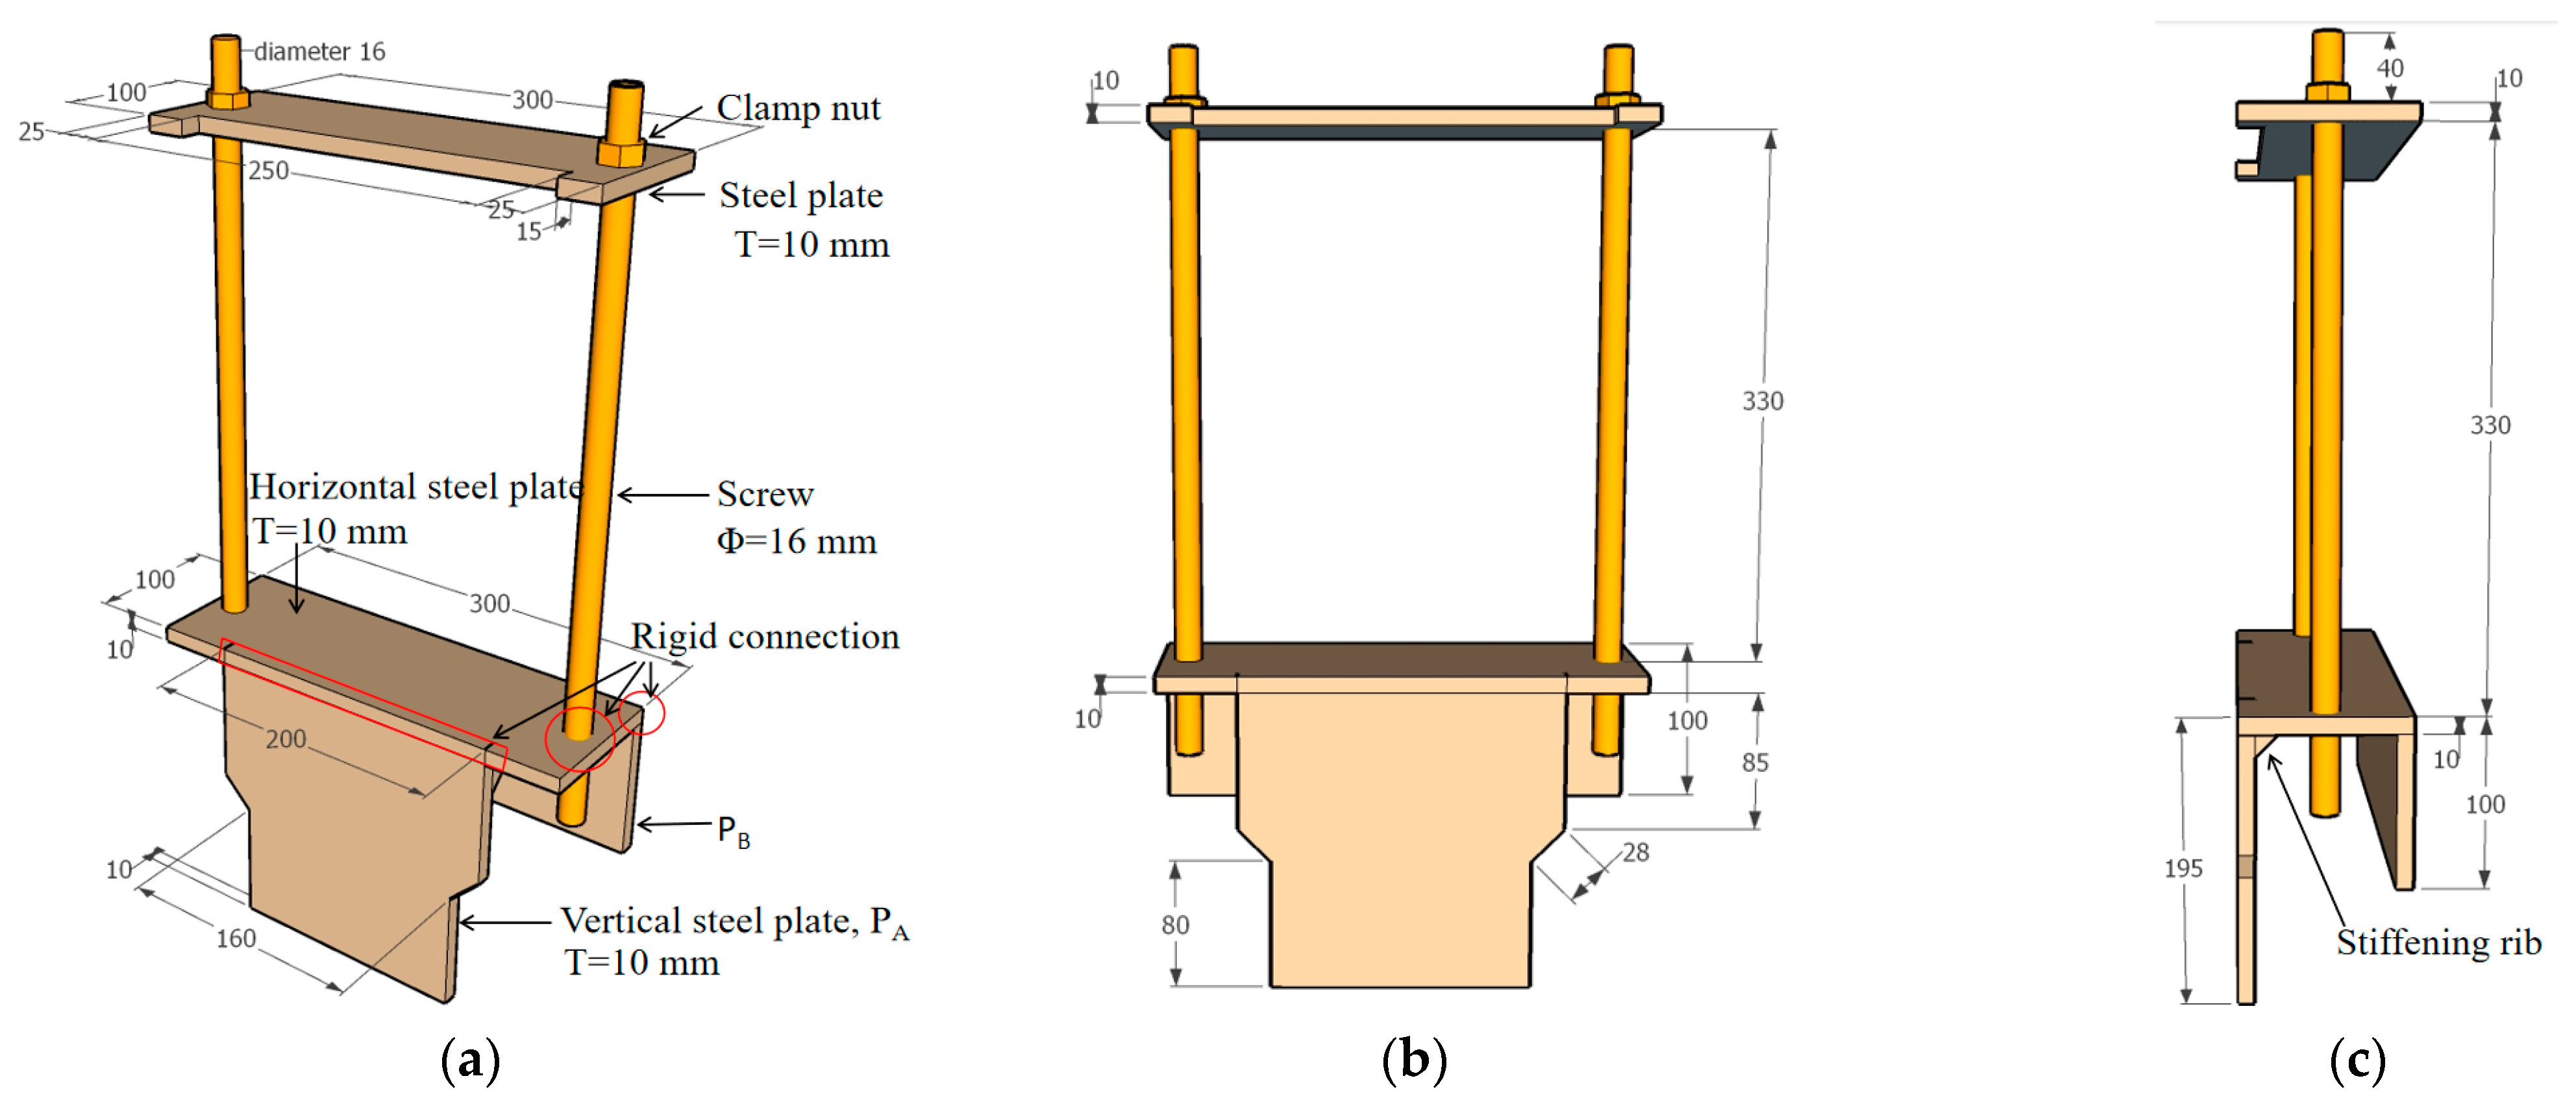
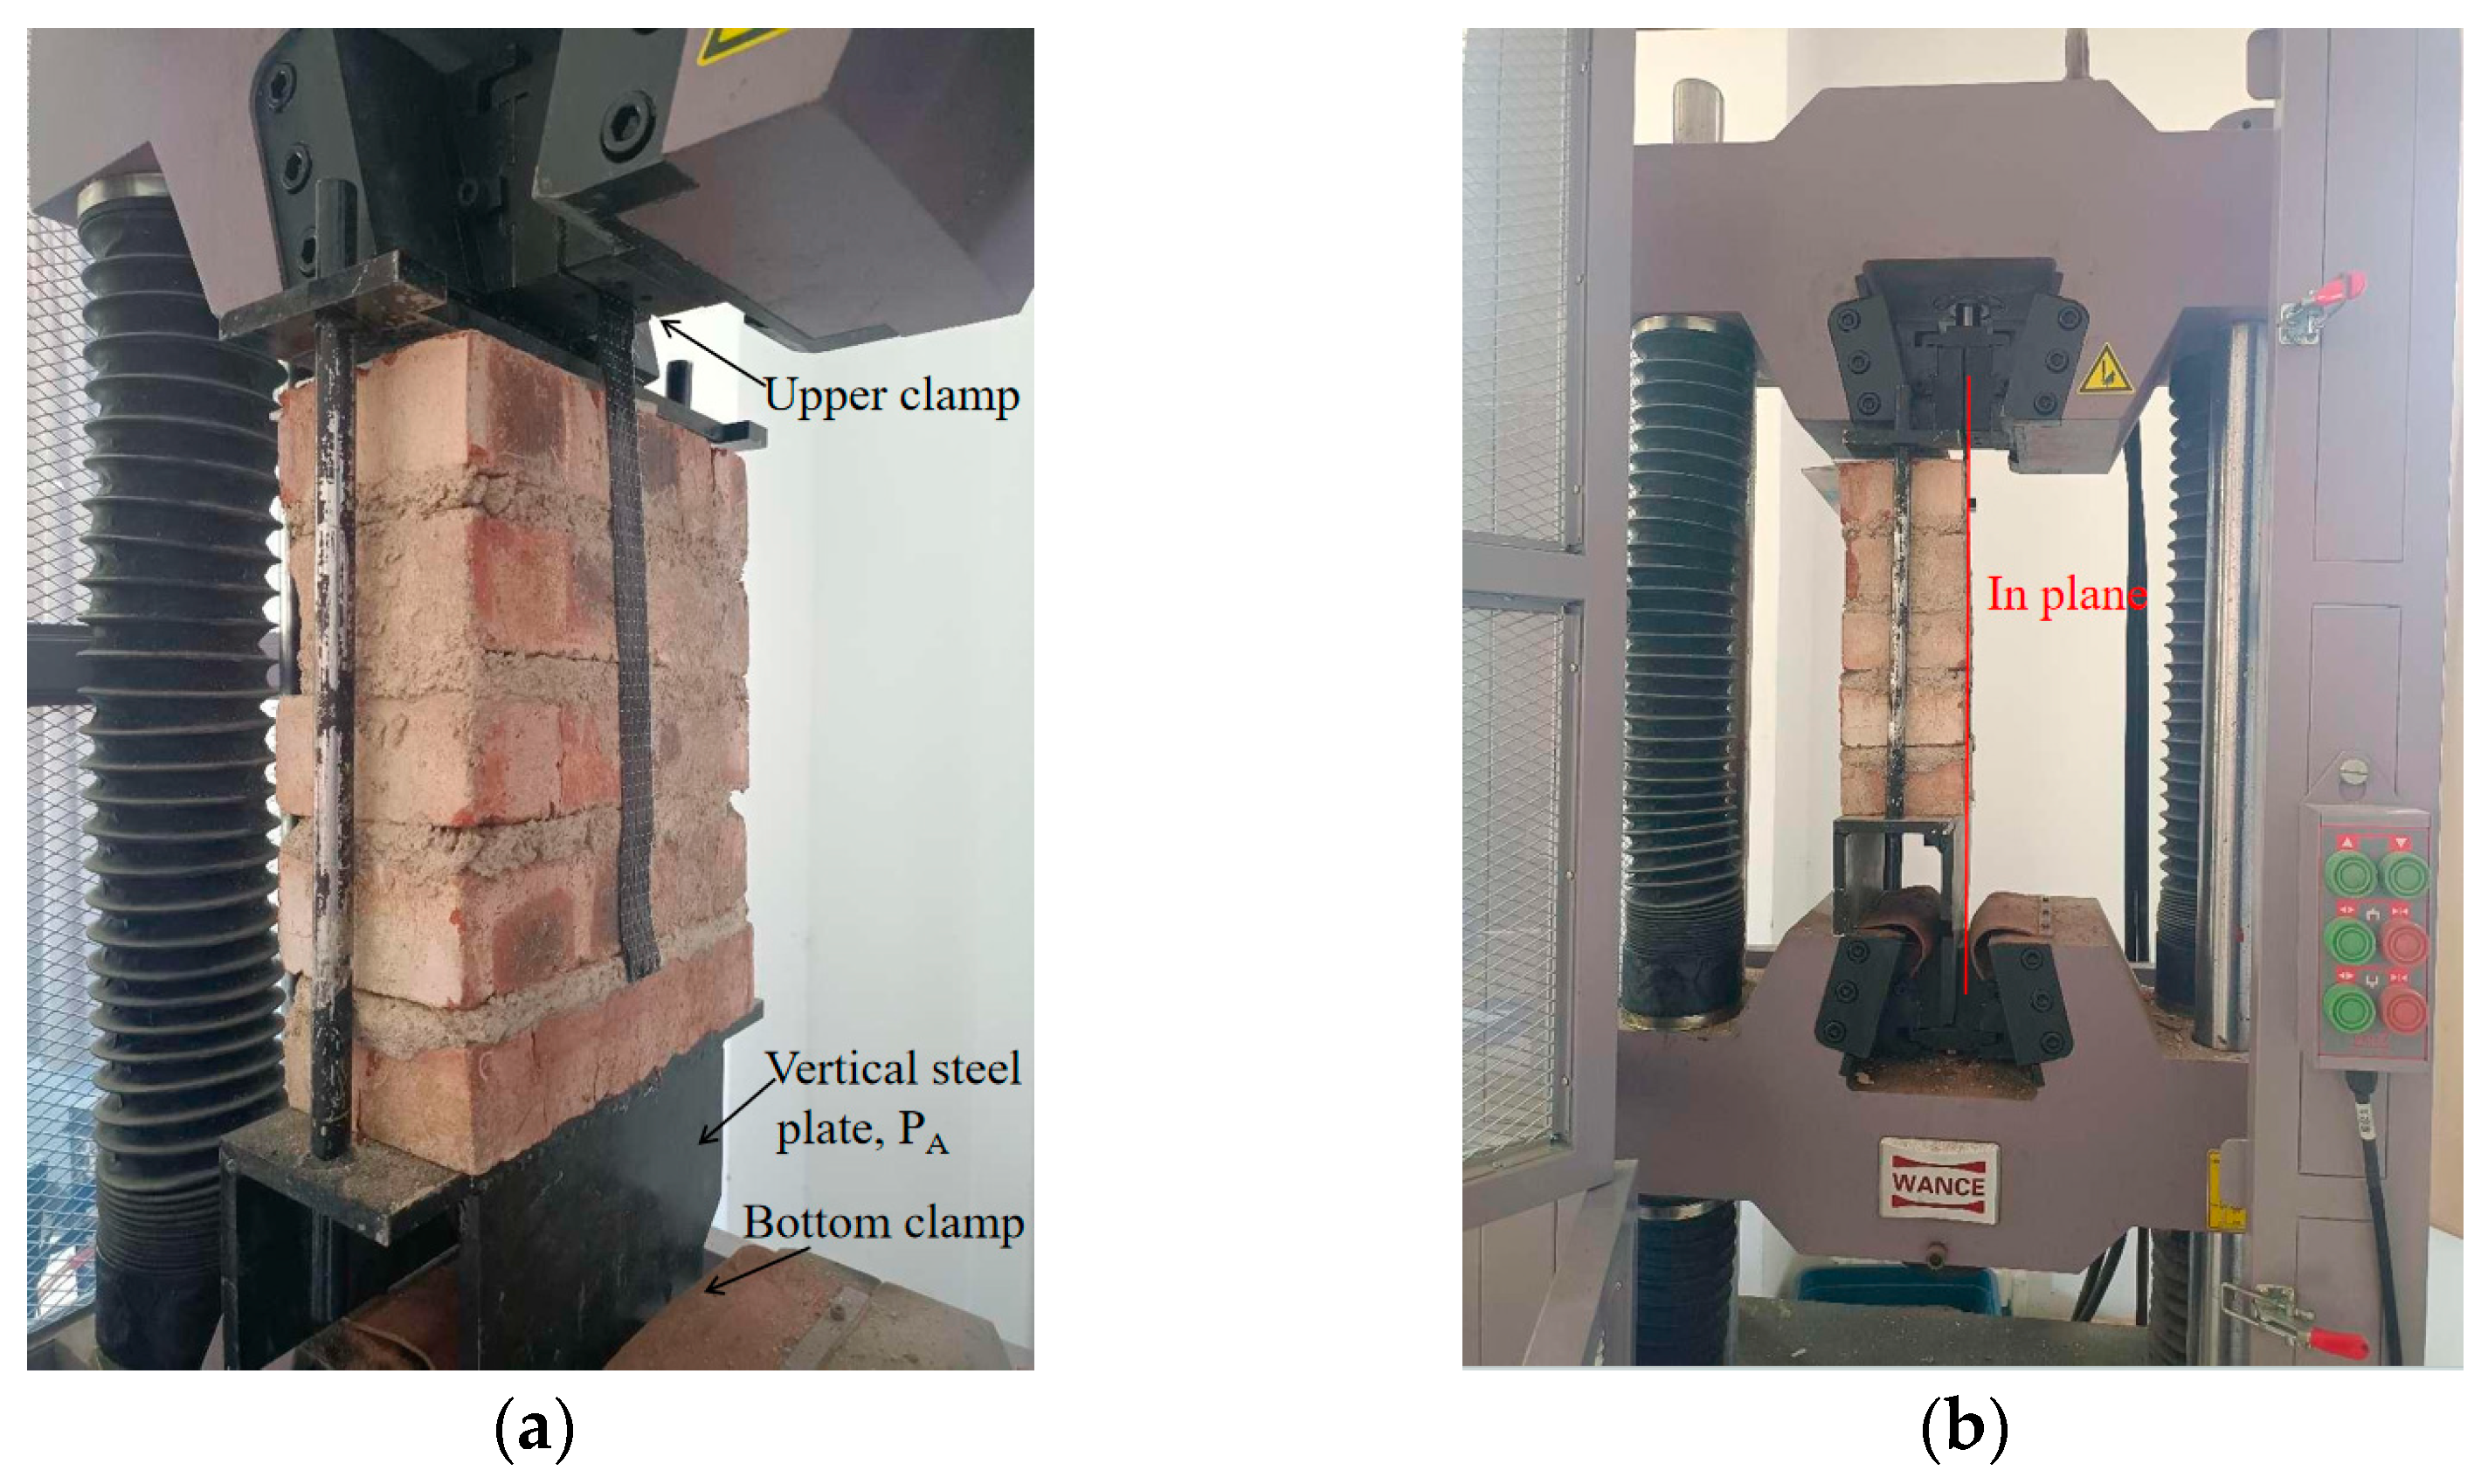
The bonding length and width of CFRP were determined based on GB50702-2011 [53], prior experimental studies [42,54], and preliminary tests. Bond lengths (50–300 mm) and widths (25/50 mm) were selected to evaluate the influence of these parameters on interfacial behavior, covering both practical applications and theoretical thresholds (e.g., effective bond length). The experimental design parameters are listed in Table 2.
The detailed dimensions and reinforcement schematics are shown in Figure 3. Based on the adhesive length of FRP, the masonry prisms were constructed using a varying number of bricks, with the thickness of the mortar joint maintained at 10 ± 2 mm. The height of the masonry prism was determined by the bonding length of the FRP sheet to ensure that it could be fully adhered to the external surface of the masonry prism. The entire production process was carried out by a single individual to minimize specimen discrepancies and ensure test accuracy. After construction, the specimens were cured in a natural environment for 28 days.
To address surface unevenness, the masonry substrate was polished with 80-grit sandpaper to remove irregularities and floating ash, followed by cleaning with ethanol to ensure adhesion [55]. The adhesive application (450 g/m2) and curing process further ensured uniform contact between CFRP and the substrate. A 10 mm space was reserved at the starting position of the FRP bonding zone (Figure 3) to reduce bending deformation during condensation and curing. The length of FRP in the free section was 3–5 times that of the width of the FRP sheet. This study also examined the impact of end anchorage on the peeling behavior of the FRP–masonry interface. For specimens with reinforcement parameters (d = 50 mm, L = 100/150 mm), a CFRP strip (100 mm × 50 mm) was vertically bonded at the loading end of the main FRP strip as the layering anchorage to enhance stress distribution, as shown in Figure 2. This method aimed to mitigate premature debonding by redistributing shear stresses. After a week of natural curing, the impregnated glue was cured and reached strength requirements.
To analyze FRP strain variation, strain gauges were arranged on the FRP sheet surface. Due to complex stress variation near the loading end, strain gauges were densely placed in this section; conversely, a relatively sparse arrangement was implemented near the free end (Figure 3). The strain gauge was BFH120-3AA-D300, manufactured by Yiyang Guangce Electronics Co., Ltd. (Yiyang, Hunan, China). It featured a resistance value of 120 Ω, a sensitivity coefficient of 2.0 ± 1%, and a measurement accuracy of 0.1 με. The bonding site had to be polished and cleaned meticulously, and the orientation of the sensitive grid of the strain gauge aligned with the longitudinal direction of the FRP sheet. Strain gauges were bonded at intervals along the center line of the CFRP length to measure FRP strain.
In the test, the loading end of the FRP was mechanically clamped by the tensile chuck. To prevent sliding of the FRP at the tensile chuck during the stretching process, the loading end of the FRP was specially treated. The thickness of this section within a length range of 50 mm was increased to 3 mm by employing a thin steel plate that was wrapped and bonded with adhesive.

2.3. Loading System

The loading equipment of the test adopted a double-space electro-hydraulic servo universal testing machine (UTM) manufactured by Shenzhen Wance Testing Machine Co., Shenzhen, China. The loading rate was 2 mm/min, and the loading control mode was displacement control. The masonry specimens were firmly fixed by steel plates on the upper and lower sides of a fixing setup (Figure 4).
During the installation process, the vertical steel plate (PA) at the base of the test setup was securely clamped by the bottom jig of the UTM, ensuring it remained in a vertical position. Additionally, both the FRP–masonry interface and the loading surface were aligned within a vertical plane to prevent any out-of-plane forces. The upper jig of the UTM exerted an upward load by clamping at the FRP strip’s loading end, as depicted in Figure 5.

3. Results and Discussion
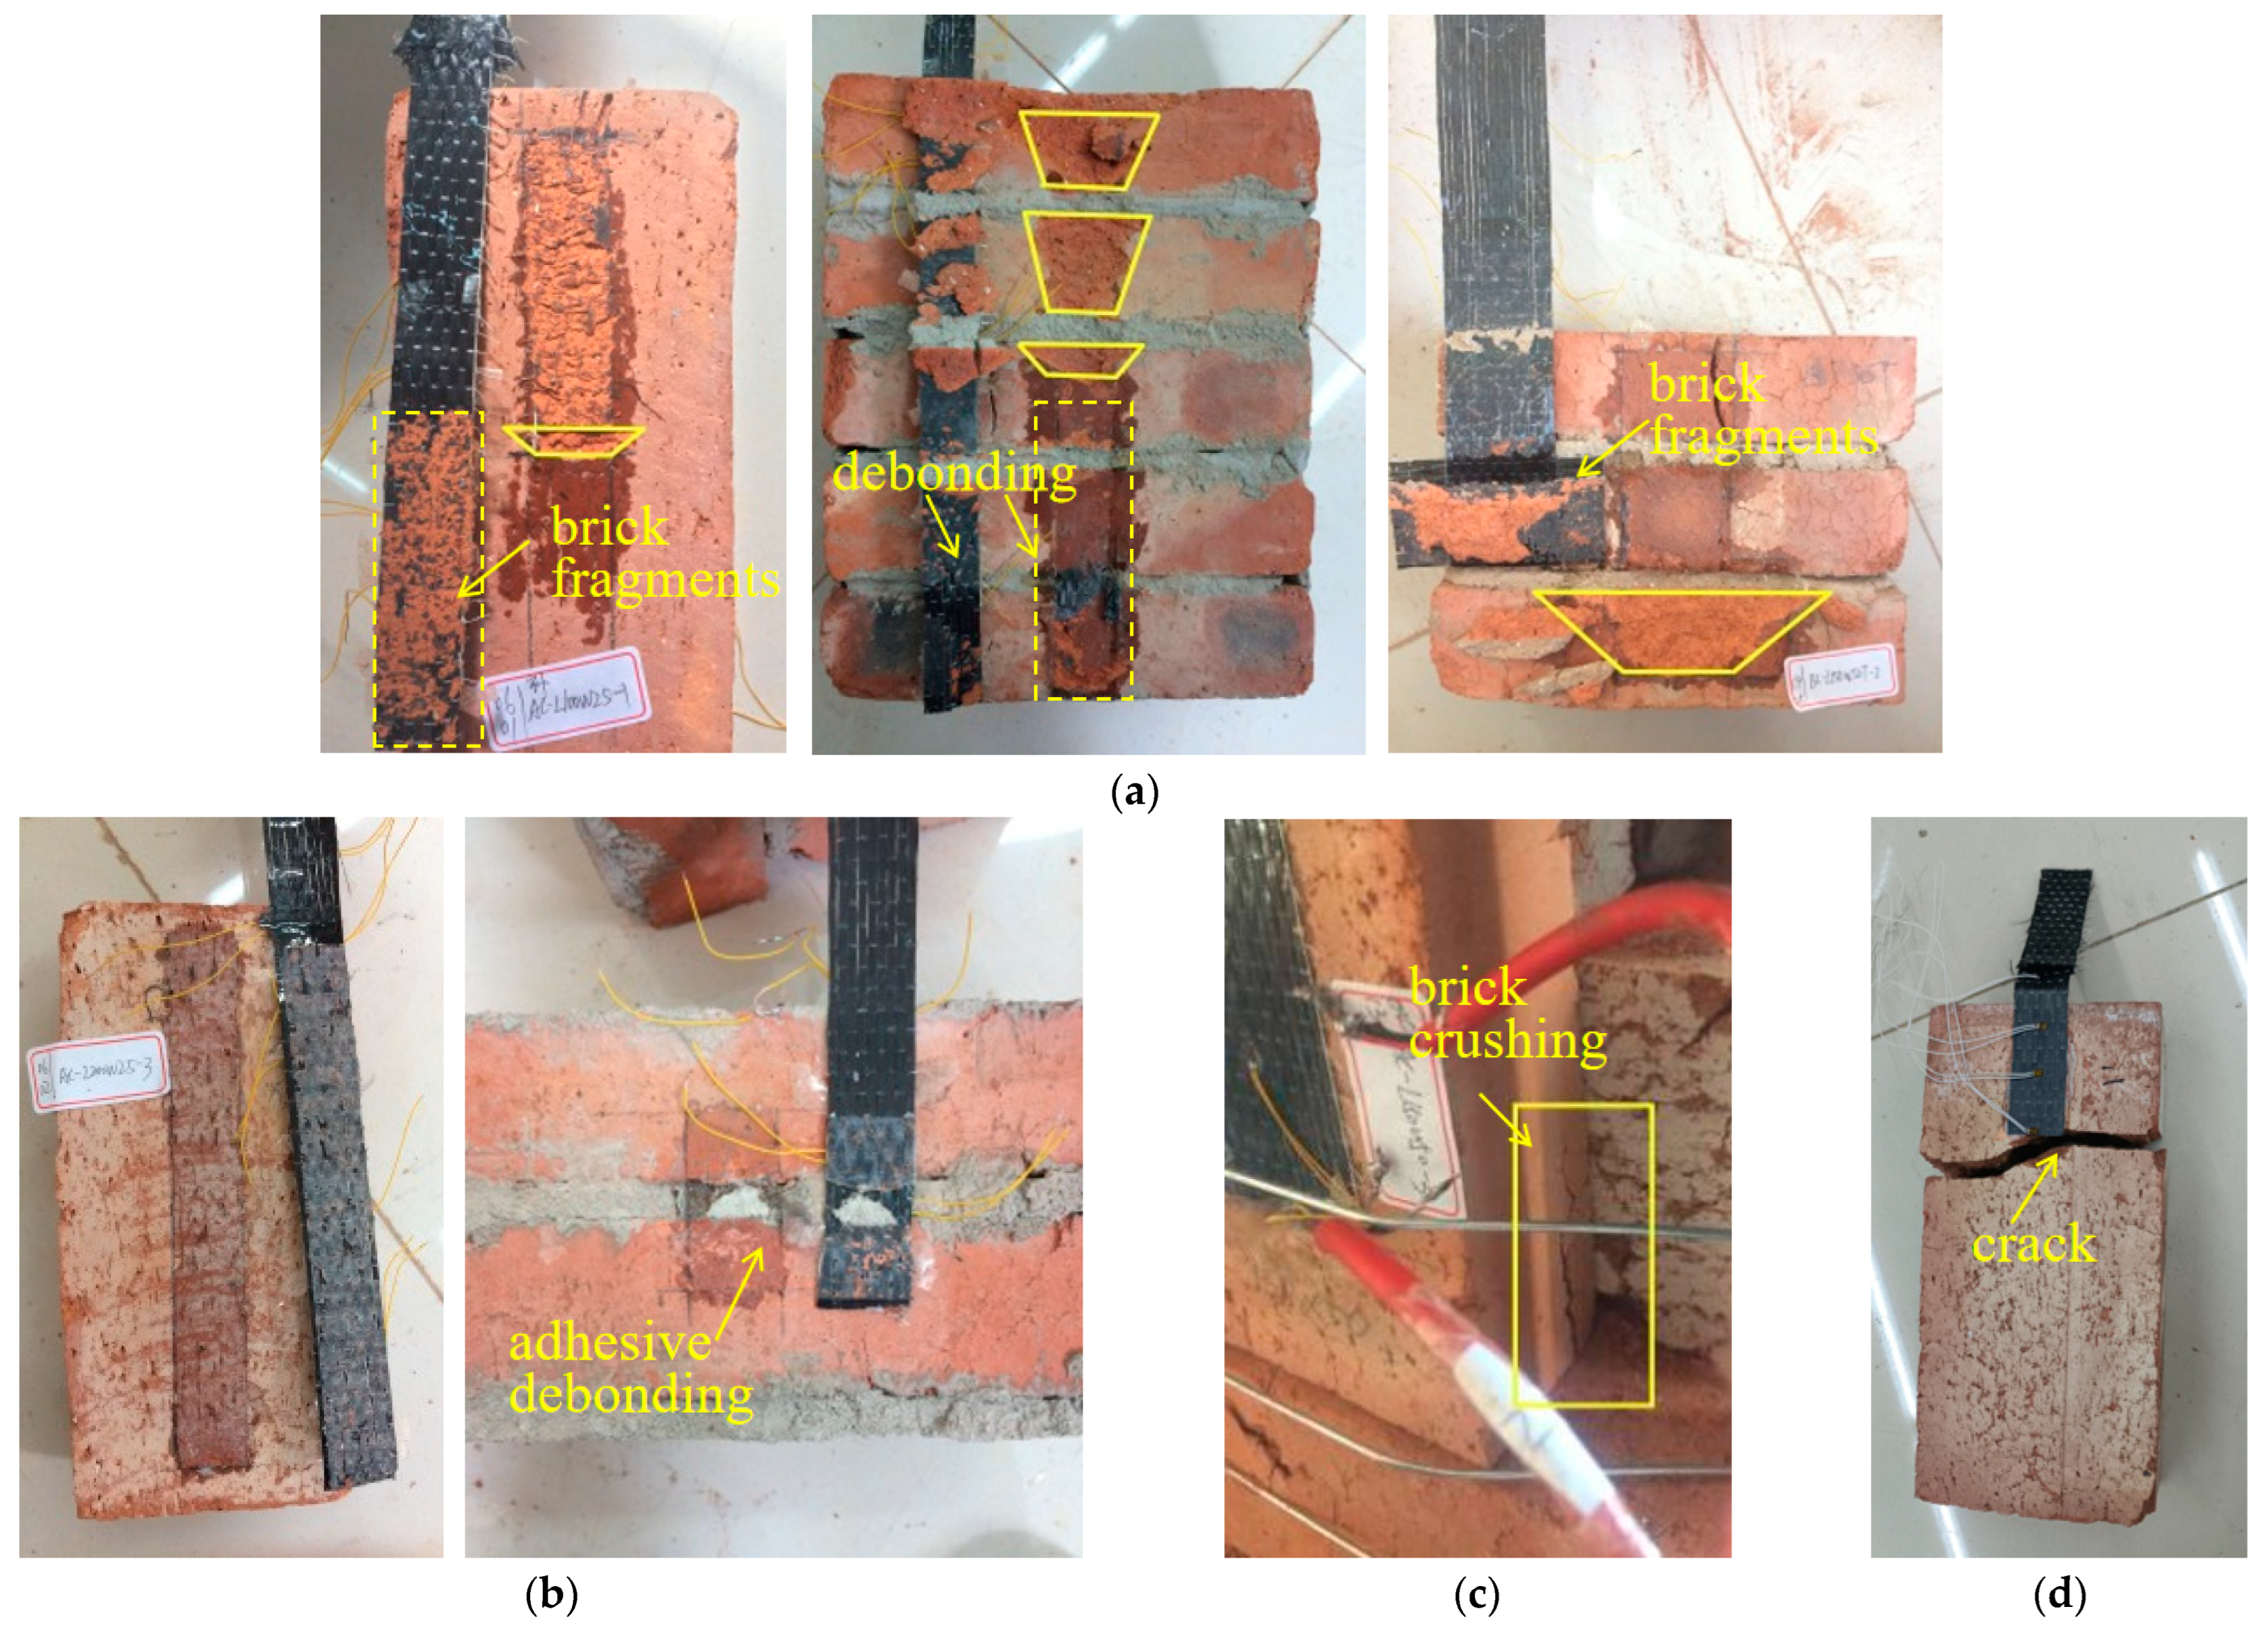
3.1. Failure Modes

As shown in Figure 6, the failure modes of specimens can be summarized into four modes: (I) cohesive failure within masonry; (II) adhesive detachment; (III) brick crushing; (IV) brick cracking.
As depicted in Figure 6a, the fracture interfaces were located in the FRP-reinforced masonry. When the stress intensity factor, KI, exceeded the fracture toughness, KIC, of the base material, crack propagation occurred, classified as the opening mode in fracture mechanics. The surfaces of the damaged specimens exhibited depressions of varying sizes and depths, indicating brittle failure. In specimen AC, the brick surface was uniformly pulled out by FRP strips within a bonding length of approximately 90%. The deep depressions were mainly concentrated at the end of the bonding area, with a significant amount of brick base material remaining on the FRP. In contrast, for specimen BC, the depression of the brick base after being pulled out was confined by the mortar joint. It formed an approximate isosceles inverted trapezoid shape without influencing each other. The trapezoidal area and depression depth gradually decreased from the loading end to the free end. The further away from the loading end, the flatter the inverted trapezoid. The phenomenon of damage occurring beyond the local bonding area indicated that the stress transfer process was not limited to the plane of the rectangular bonding area. During the transmission of shear stress along the length direction of FRP bonding, it not only transmitted downwards within a certain depth range below the bonding area to the brick substrate layer but also expanded laterally, known as the “width effect” [56]. This was the reason for introducing the width correction factor in the bond capacity model.
In failure mode II, the adhesive layer was peeled off, but the brick surface was flat, and the brick base material was not damaged (Figure 6b). This can be further refined into two cases: one is the debonding between the base material and the adhesive layer, with the cured resin being obviously observed on the FRP sheets, and the other is the debonding between the FRP and the adhesive layer, leaving fiber stuck to the brick base surface. The main reason for these failures was that the impregnated glue did not penetrate well into either the brick base or the FRP strips, resulting in the premature debonding of the FRP strip. It is also observed that, in masonry prisms, the mortar joint can still be pulled out without damaging the brick base. It shows that the weak mortar joint can affect the load transfer at the reinforced interface and has a great influence on the interface behavior of FRP-reinforced masonry structures.
Unusual types of brick crushing damage were also observed during the tests (Figure 6c). The primary reason is likely attributed to the combined effects of the strengthening force and shear force exerted by the FRP sheet, which subjected the bricks to complex stress states and even local stress concentration. Crushing failure in bricks occurs when the pressure induced by shearing or reinforcing forces exceeds the compressive strength of the masonry. In addition, the uneven surface and improper installation of individual specimens can contribute to out-of-plane loading forces in the specimens, ultimately leading to brick fracture (Figure 6d). The absence of a CFRP rupture in Figure 6 indicates that interfacial failure governed the system due to insufficient bond strength relative to CFRP’s tensile capacity. To optimize material utilization, two complementary approaches are proposed. Material optimization strategies include adopting adhesives with higher fracture energy or hybrid FRP systems such as CFRP-BFRP composites, which improve alignment between bond and tensile performance. Structurally, increasing bond width/length or integrating mechanical anchors (e.g., spikes) can redistribute interfacial stresses and fully exploit CFRP’s strength potential.

3.2. Bond Capacity

In this experiment, in addition to the bonding length and width of FRP, and the end anchorage end, we focused on studying the influence of the mortar joint on the interface bond capacity. The characteristic results are listed in Table 3.

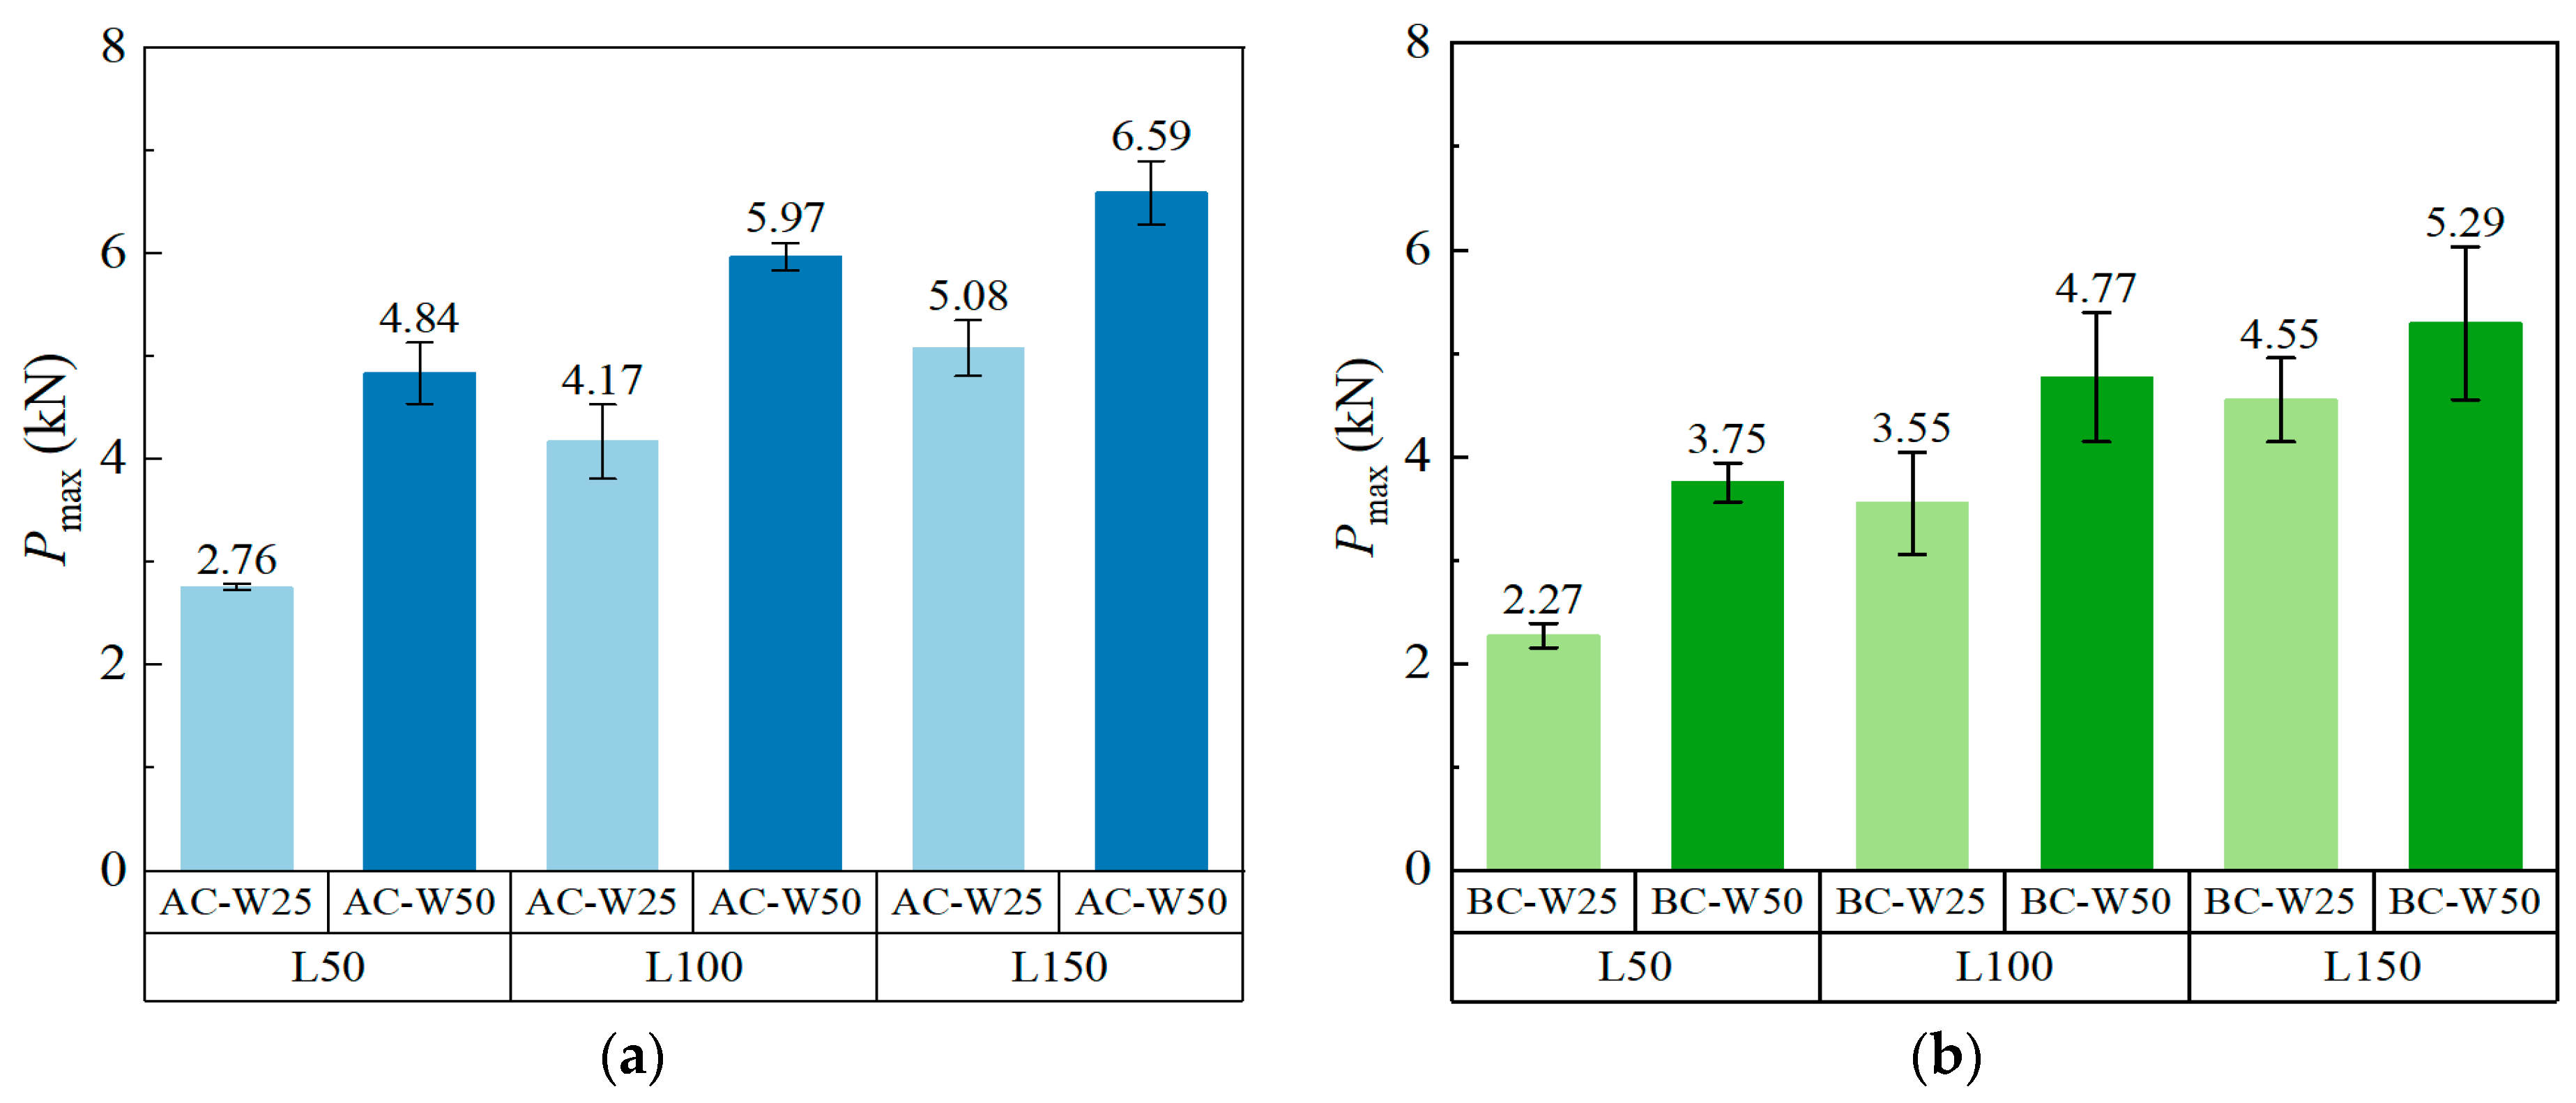
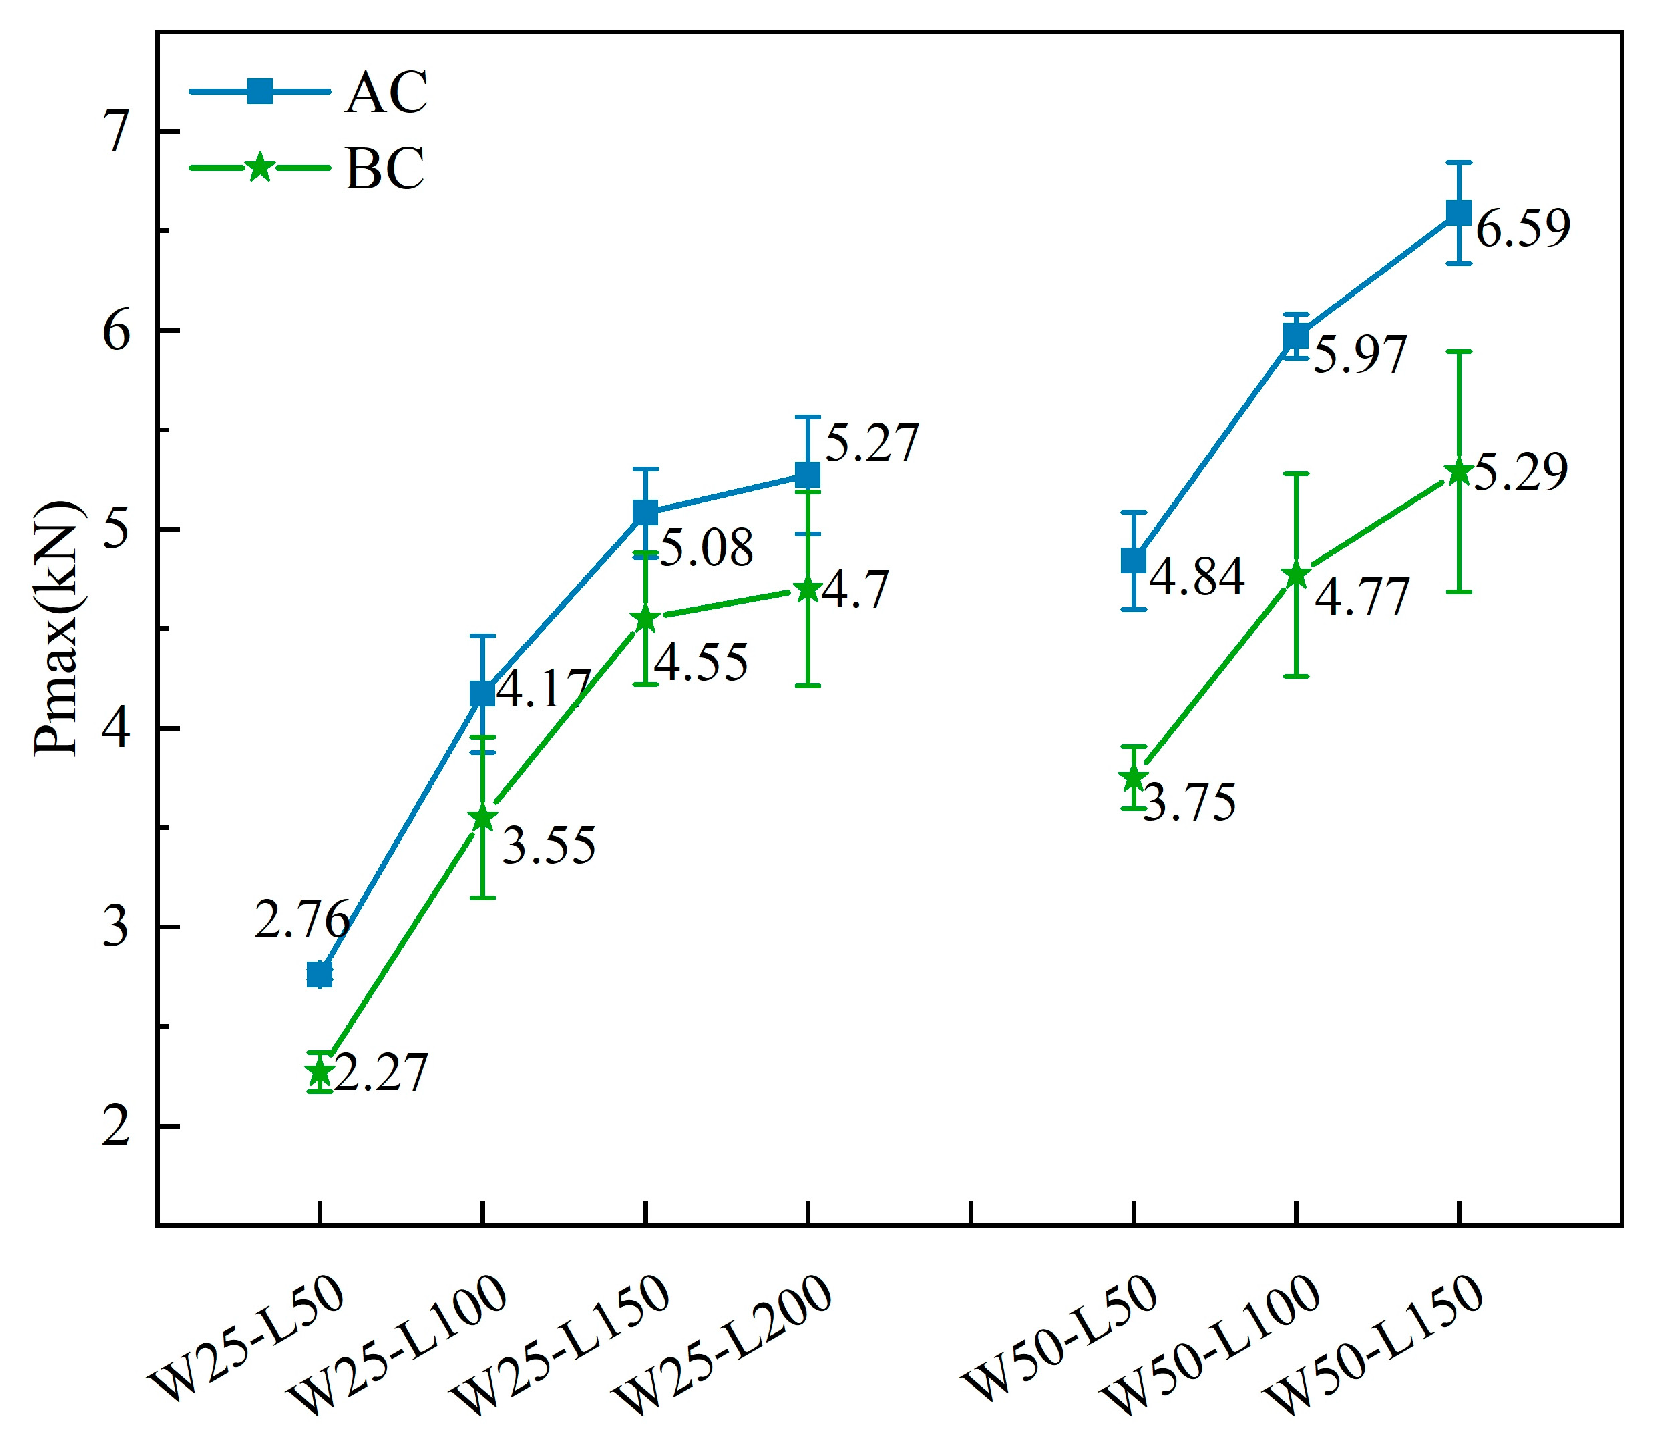
3.2.1. Influence of Bond Width on Bond Capacity

The results show that the bond capacity of the strengthened system can be increased by 16.3–75.4% by increasing the bond width. Based on CNR-DT 200/2004 [57], several scholars have proposed a calculation model for the maximum load [21,35], in which the maximum peeling load in the model increases with the increase in bonding width, consistent with the results of this experiment. As shown in Figure 7, the bond capacity of specimens AC or BC with the same length could be enhanced by increasing the width of the FRP sheet. The overall interface bond strength of single bricks increased by 29.7% to 75.4%, while that of masonry prisms only increased by 16.3% to 65.2%. This indicates that, due to the presence of mortar joints, increasing bonding width has a more significant effect on improving interface bond capacity for single bricks compared with masonry prisms. The presence of weak mortar joints leads to a decrease in the fracture energy at the interface of masonry prisms, resulting in a reduction in bond capacity for FRP specimens of the same size.
The impact of increasing bonding width on displacement at the loading end varies; there is an increasing trend in displacement at the loading end for single bricks, but it has no significant impact on displacement at the loading end for masonry prisms.

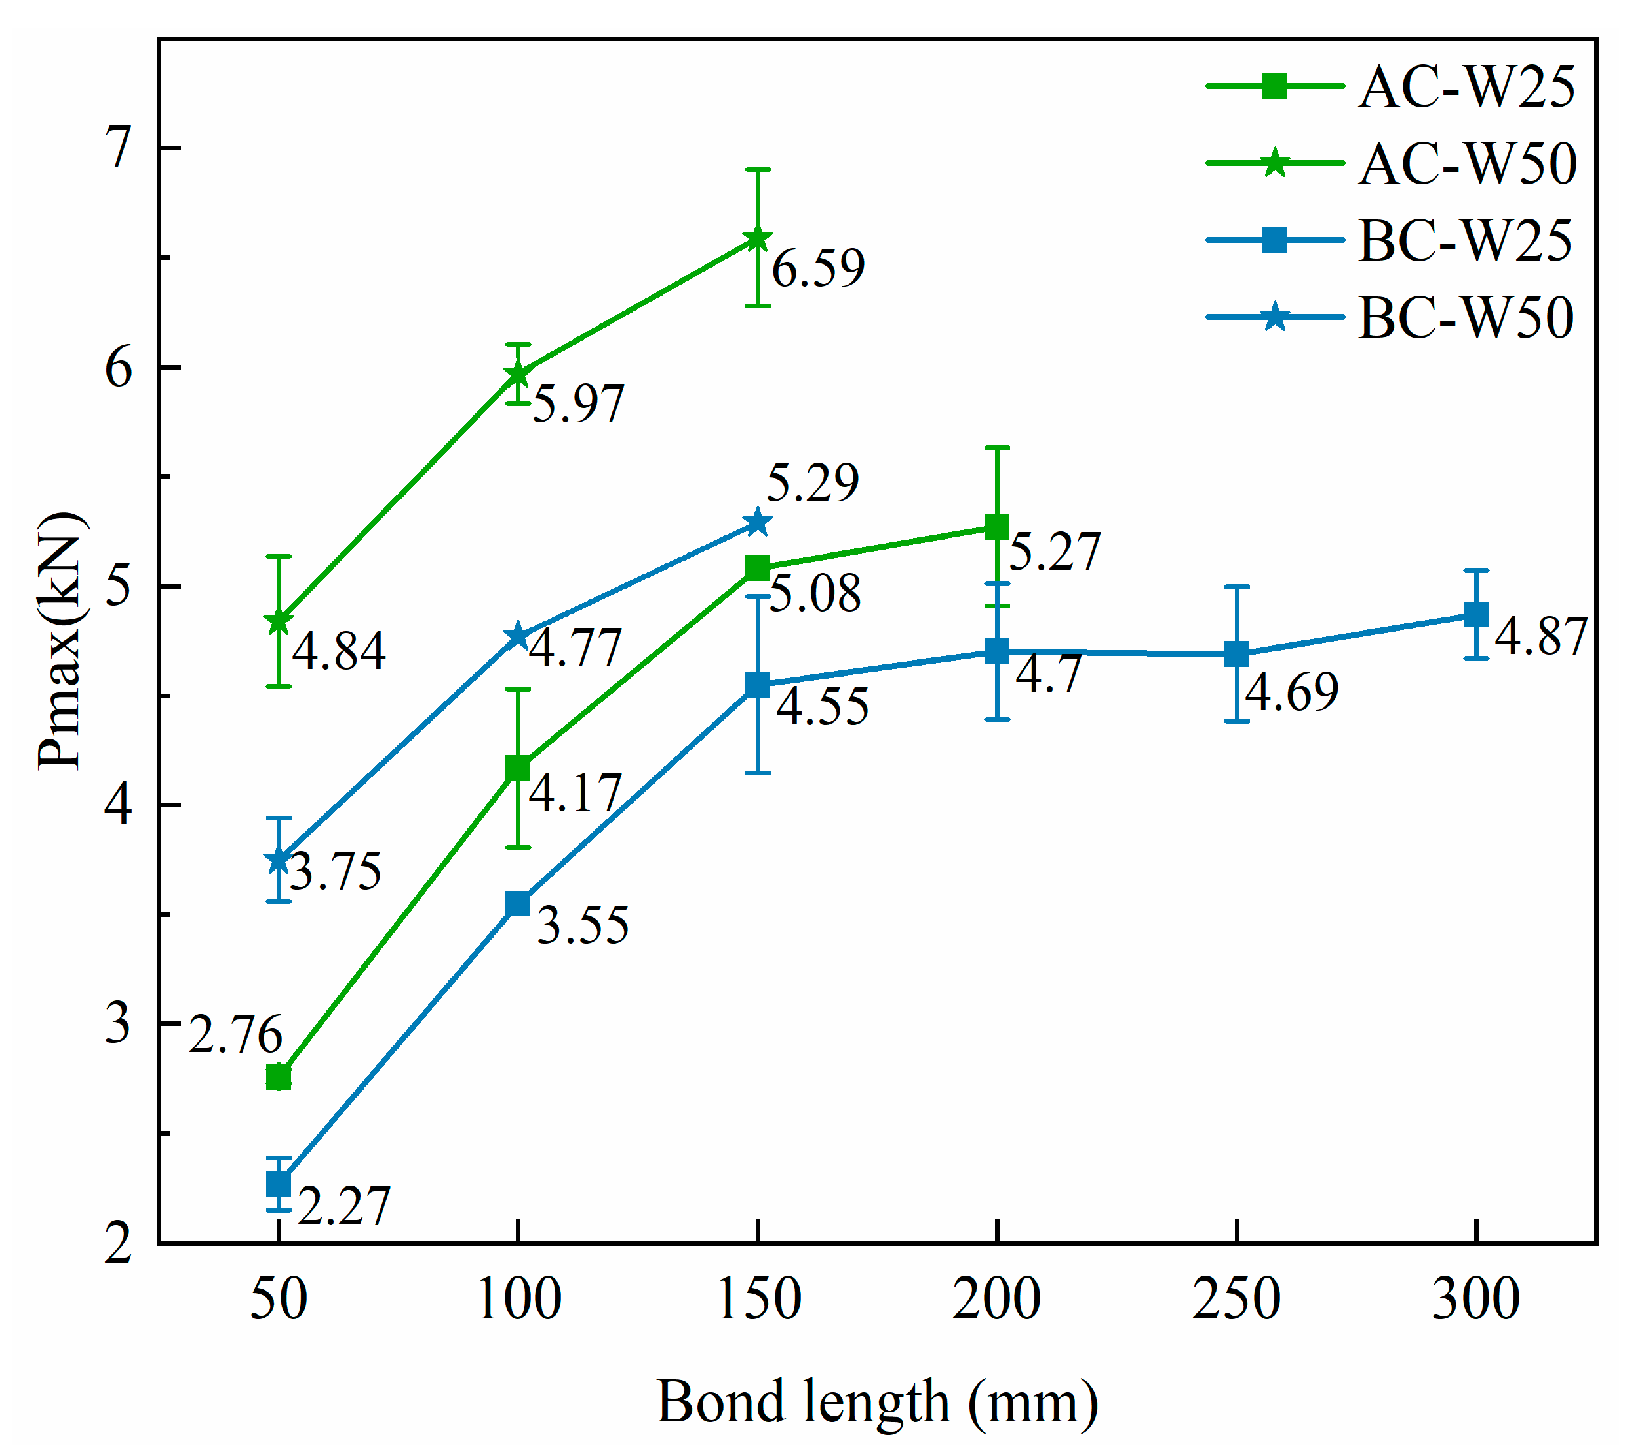
3.2.2. Influence of Bond Length on Bond Capacity

Within the limited bond length range, increasing the bond length can enhance the bond capacity. When the length exceeds the effective bond length ( L f   >   L e ), the interface bond capacity increases by no more than 10%. As the FRP bond length of specimens AC-W25 increased from 50 to 200 mm (Figure 8), the corresponding bond capacity also increased, measuring 2.76 kN, 4.17 kN, 5.08 kN, and 5.27 kN, respectively. It is worth noting that the rate of increase gradually decreased as the bond length continued to increase. The bond strength of specimen AC-L200W25 was only increased by 3.7% compared with specimen AC-L150W25. The same variation rule was also observed in specimens AC-W50. For CFRP-reinforced masonry prisms BC-W25, when the FRP bond length was between 150 mm and 200 mm, the peeling load did not increase further, fluctuating at around 4.7 kN.
As shown in Table 3, the maximum displacement at the loading end of specimens AC increased with an increase in bonding length; for single-brick specimens, when FRP bonding length was less than 150 mm, the maximum displacement at the loading end increased linearly with bonding length.

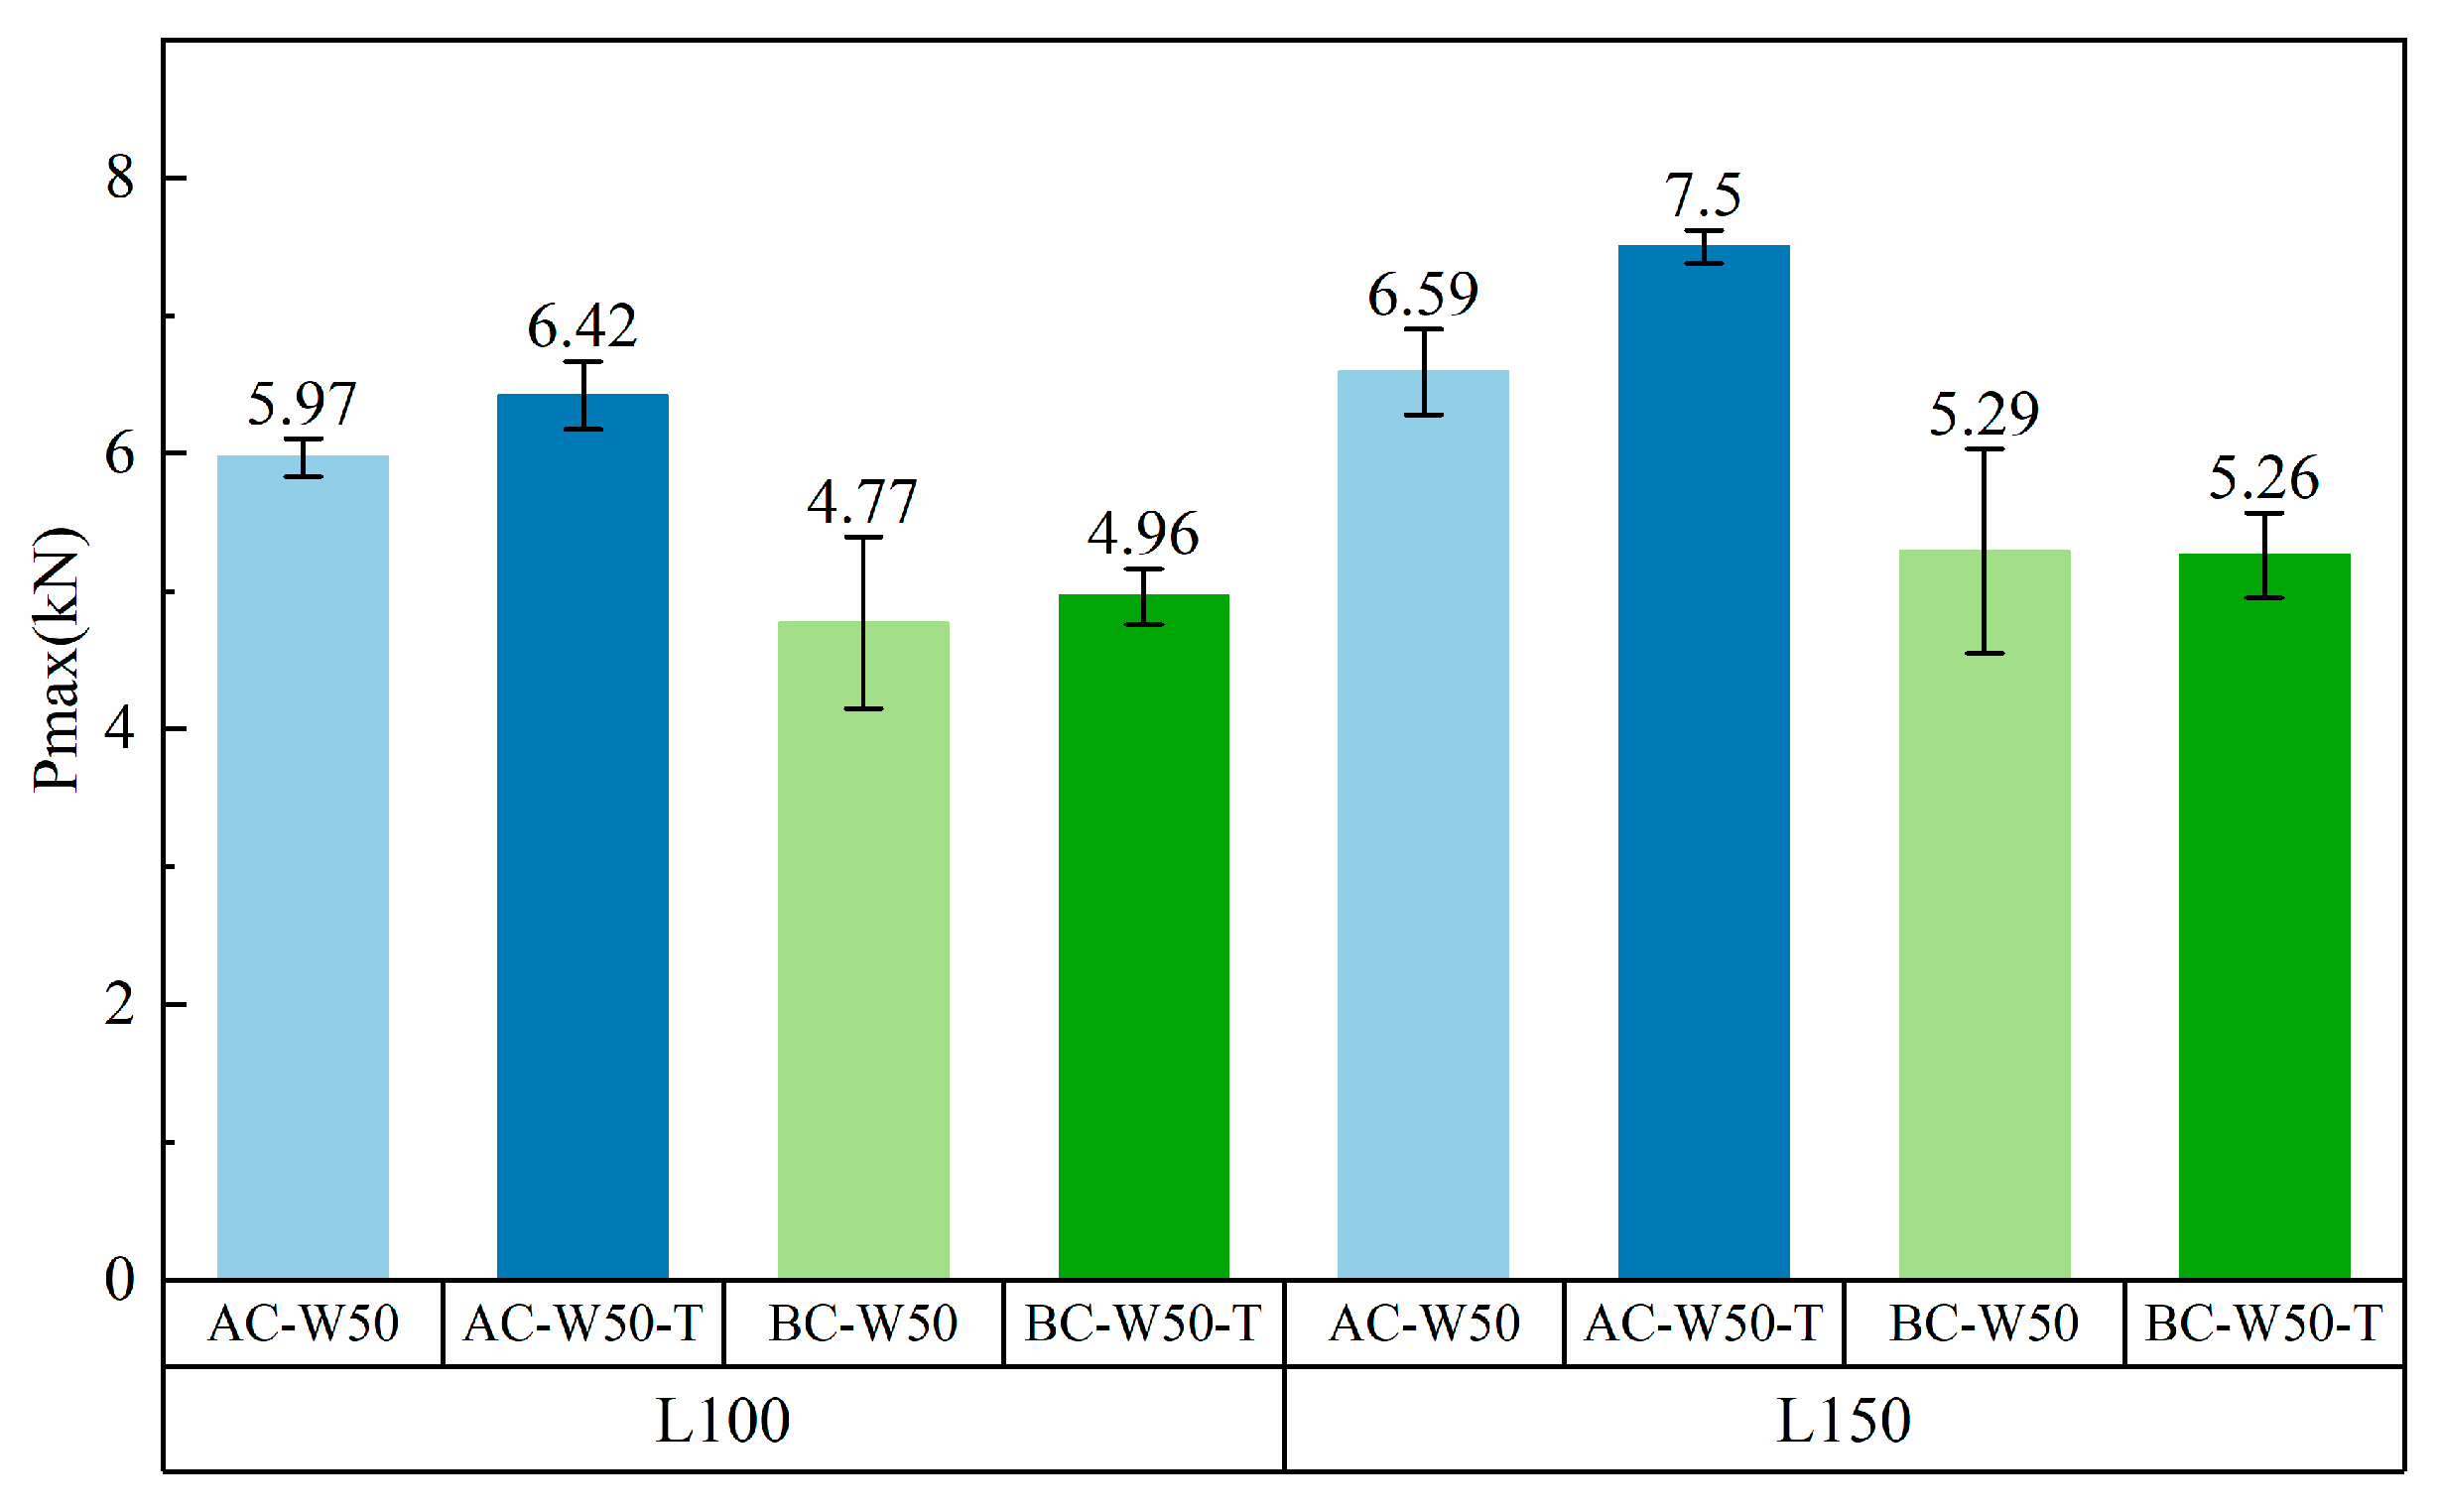
3.2.3. Influence of End Anchorage on Bond Capacity

As shown in Figure 9, the test results indicate that end anchorage had a certain enhancing effect on interface bond strength; however, the improvement effect was suboptimal, with only a maximum increase range of 14.0%. When the debonding failure is transmitted to the anchor end, it is equivalent to applying a concentrated force in the vertical direction of the anchor FRP layer, resulting in the anchorage FRP layer being easily destroyed. This indicates that FRP layerage at the bonding end may not be the most effective anchorage method, although it is recommended in many standards or design sets. The improvement may be a marginal strengthening effect produced by the adhesive. In addition, this anchoring method is also limited by the size of the anchoring FRP strips. New mechanical anchors, such as anchor spikes, can be tried to reduce premature debonding failure. Ceroni [56] achieved 25% enhancement with U-wraps. Bertolesi et al. [58] reported 30% improvement using anchor spikes. This highlights the potential of advanced anchors over simple CFRP layering. The incorporation of FRP layerage exerts a non-discernible influence on displacement control at the loading end, which is mainly attributed to the discrete characteristics of reinforced masonry specimens.

3.2.4. Influence of Mortar Joint on Bond Capacity

Shear Stress Analysis of Mortar Joint
As a sole base material, a single brick effectively transfers bond shear stress to the base material. When the FRP-reinforced single-brick reinforcement system fails, the fracture surface is located in the interfacial bond layer. The fracture condition depends on the fracture toughness KIC of the interfacial material. When the shear stress, τ x , of the base material is greater than KIC, the crack propagation and interface failure are manifested as instantaneous failure.
For FRP-reinforced masonry prisms, the energy balance method reveals that the bond shear stress in the brick substrate is greater than that in the mortar joint [42]. Furthermore, considering the boundary continuity conditions, the bond capacity of the brick substrate is greater than that of the mortar joint. The presence of the mortar joint inhibits smooth load transfer, leading to an increase in effective bond length for FRP. In this context, effective bond length refers to the maximum length of fiber bonding when interfacial debonding occurs under maximum load. When the load is transferred to the mortar joint, a sharp drop in load occurs at this point, but it does not affect the interfacial bond capacity (Figure 10). Similarly, as with the previous brick, the load transfer mechanism reinitiates crack formation near the loading end and continues to increase. The shear stress at the mortar joint decreases, and there is a “loss” of fracture energy; therefore, to maintain energy conservation at the interface and achieve maximum failure load, an increase in interface bonding length is required.
Influence of Mortar Joint on the Bond Capacity
Figure 10 illustrates the relationship between the applied load, P (force applied at the loaded end), and the global slip, S (slip at the loaded end), of 16 specimens without end anchorage. Before the load reached its peak value, the curve of specimens AC showed a linear trend with an increase in interface slip (Figure 11a,b). Upon reaching the maximum bond strength, the test curve underwent a sudden drop, accompanied by a loud bang, and FRP debonded. The specimens experienced brittle failure and interface failure.
The FRP debonding process of specimen BC was different from that of specimen AC. When the loading value reached 40% of the maximum load, inclined cracks first appeared near the bonding zone close to the loading end. With increasing load, the location of inclined cracks gradually extended toward the free end. The crack development stopped when encountering the mortar joint, and at the same time, local debonding of FRP occurred on the first brick with a slight tearing sound. The remaining bonded length range of FRP continued to bear force, and inclined cracks reappeared on the surface of adjacent bricks, repeating the previous process. The component overall showed a trend of gradual debonding from the loading end to the free end.
The influence of the mortar joint on the debonding behavior at the interface cannot be ignored. When local debonding of FRP occurred, a corresponding load drop of 7.5% to 30.0% was observed (Figure 11c,d), and this occurred precisely at the location of the mortar joint (Figure 9). Compared with brick, the stiffness and strength of the mortar joint were lower, leading to a discontinuous load transfer. As a result, masonry prisms with the same reinforcement parameters had a lower bond capacity than single bricks.
Due to the presence of the mortar joint, the bond capacity, Pmax,avg, of specimen BC decreased by 12.1–24.6% compared with specimen AC (Figure 12).
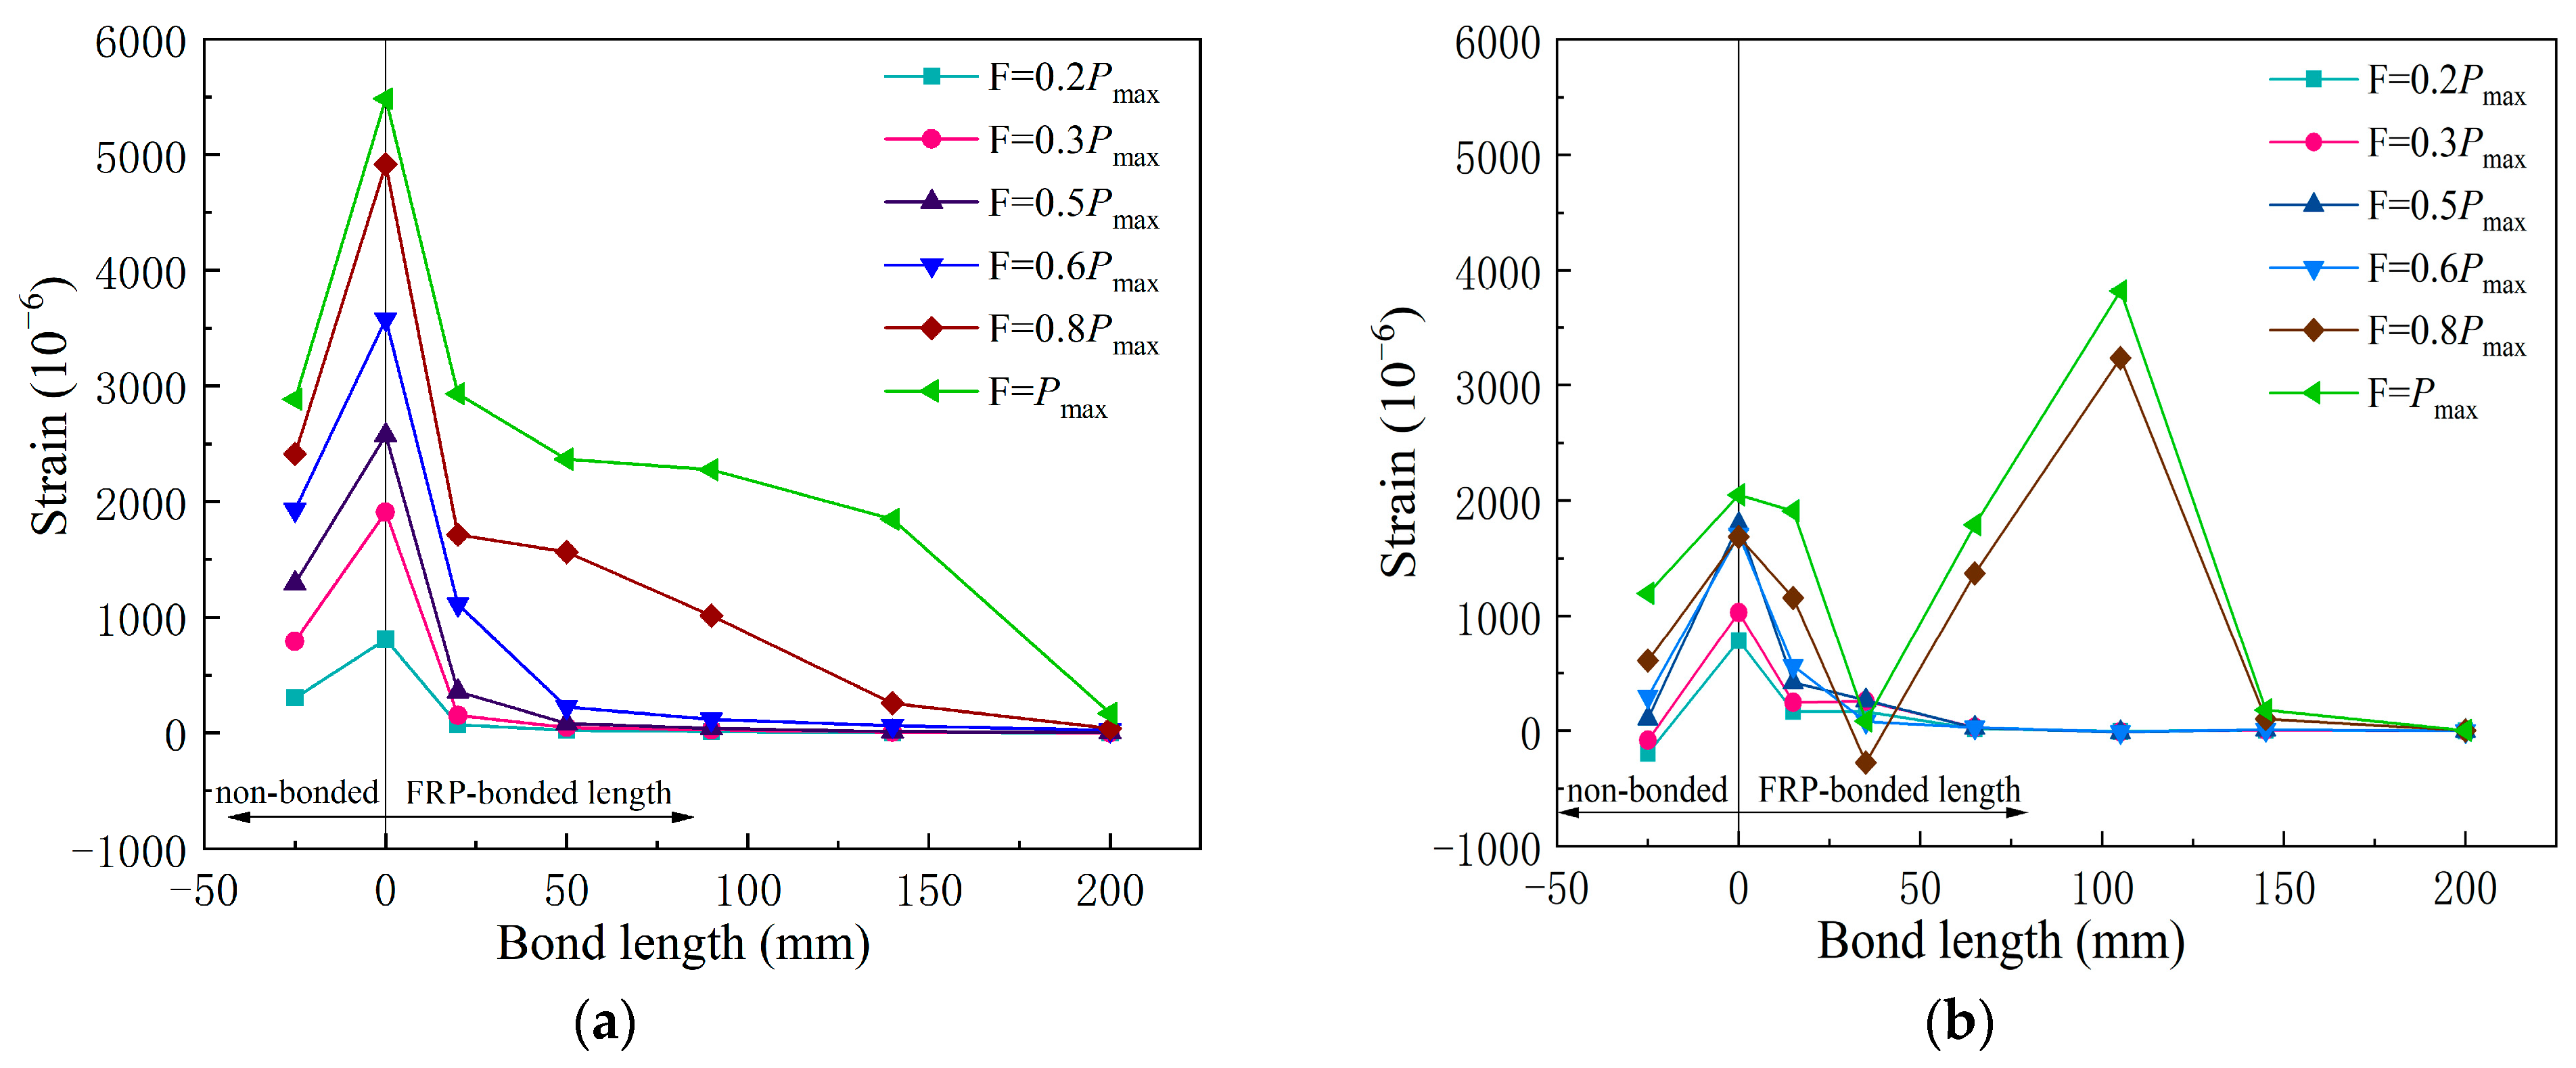
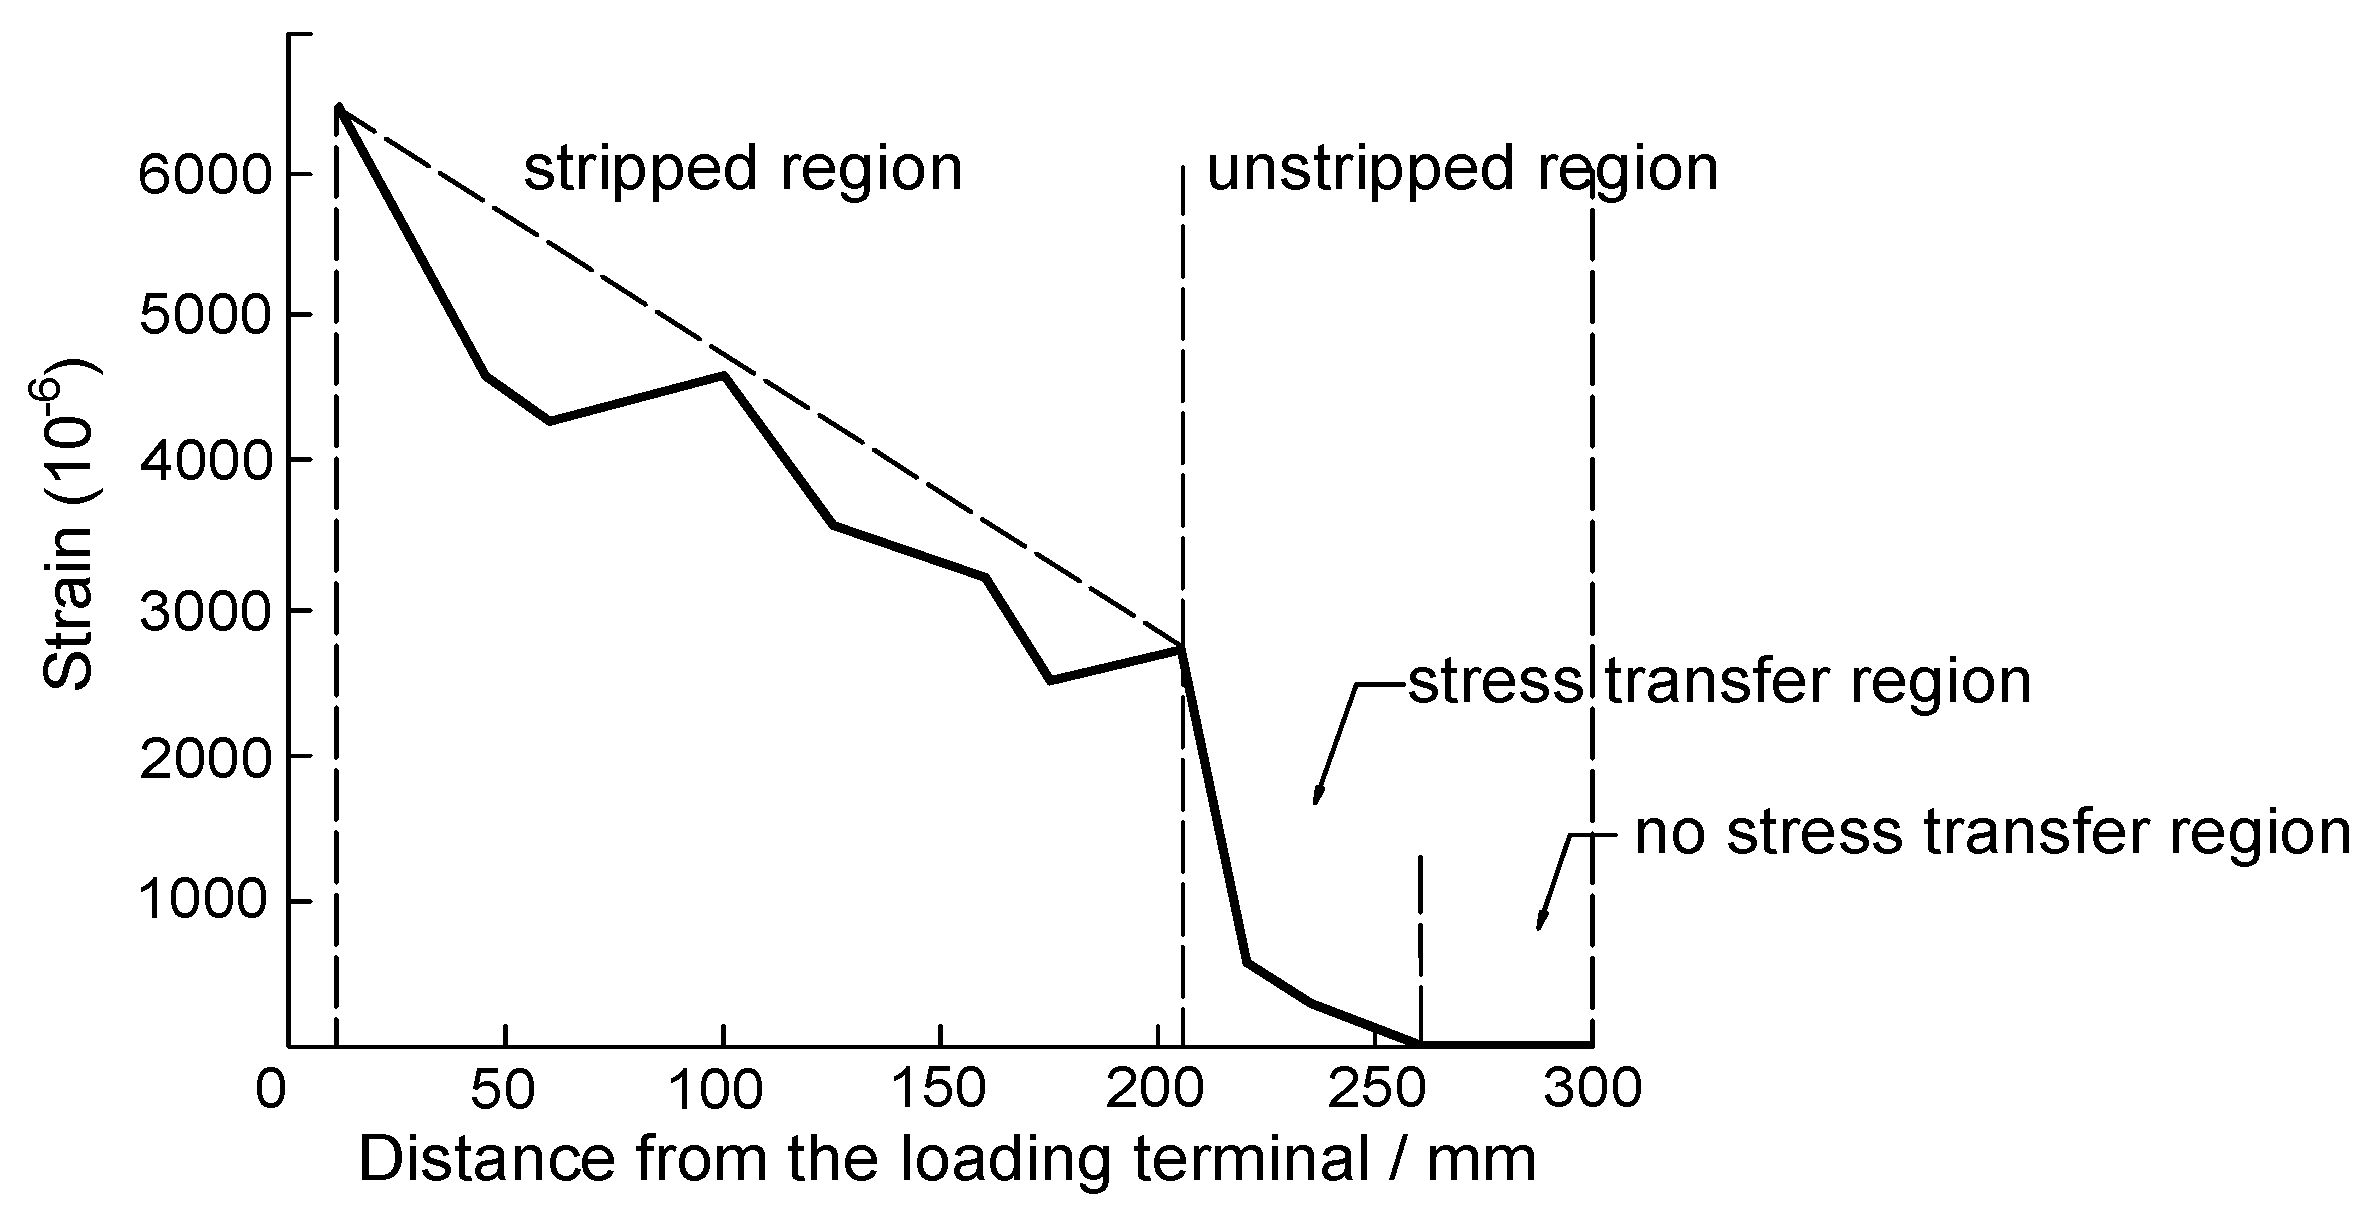
Influence of Mortar Joint on the FRP Deformation
Due to the length limitation of this paper, only specimen AC-L200W25 (No. 3) and specimen BC-L200W25 (No. 2) were selected for comparing and analyzing the influence of the mortar joint on FRP deformation. The distributions of fiber strain along the length are shown in Figure 13. The FRP strain values were recorded when the loading values were 20%, 30%, 50%, 60%, 80%, and 100% of the maximum bond capacity, Pmax.
The maximum FRP deformation of specimen AC-L200W25 occurred only in one position (near the loading end). When the tensile load was less than the maximum bond capacity, the deformation of FRP transferred to the bond end and decreased to zero until reaching the effective bond length. Specimen AC-L200W25 exhibited an FRP deformation reaching its limit value of 3854με at a distance of 20 mm from the loading end, leading to local FRP debonding at this position (Figure 13a). Due to the brittle nature of the base material, this local debonding ultimately resulted in the overall failure of the reinforcement system.
Due to the influence of the mortar joint, the FRP deformation development of specimen BC-L200W25 differed from that of specimen AC-L200W25 (Figure 13b). When the load reached 0.5Pmax, the FRP deformation at the adhesion starting position (0 mm) reached its limit value of 1686 με, leading to local stripping. As this debonding trend extended to the free end, it was blocked by the mortar joint, causing a decrease in FRP strain at that location down to zero. When the load increased to 0.8Pmax, the remaining FRP sheet without local stripping re-deformed with a limit strain of 3237 με, then decreased to zero at the effective bond length. As a result, there were multiple unequal peak points in the FRP deformation curve. The likely reason is that the mortar joint in the masonry prism inhibited the FRP sheet within the mortar joint region from reaching its ultimate deformation [40,59], and the strain transfer transitioned from a brick matrix interface to a weaker mortar matrix interface, and so on until Pmax was reached. The peaks were closely related to different adhesive properties between the FRP–mortar and FRP–brick interfaces, along with the differences in mechanical properties between mortar and brick.
It was also observed that the FRP strain on the non-bonded length was lower than that at zero abscissa on the FRP-bonded length under each loading level. This was mainly because the FRP in the bonded length and the masonry structure formed a whole by the adhesive with a smaller elastic modulus to bear the load together, while the FRP in the free segment only bore its own deformation.
Table 4 lists the maximum strain values of FRP-reinforced specimens without end anchorage. The interface bond performed optimally when the FRP bond length surpassed the effective bond length.

3.3. Effective Bond Length Le

The stress transfer area length increased continuously with the load and reached a maximum value at a certain load level. At this point, the stress transfer area no longer increased in length, and this maximum length was considered to be the effective bond length [60], as shown in Figure 14. When subjected to the interface limit bonding load, the effective bond length, Le, can be measured and determined as the distance between the position of the maximum FRP strain, εmax, and 0.04εmax [61]. Huang et al. [61] also proposed a formula for the effective bond length as follows.
L e = 14.6285 f m 0.2895 E f t f / 10,000 0.8576
where f m is the compressive strength of the base material (MPa), E f is the modulus of elasticity of FRP material (MPa), and t f is the thickness of CFRP (mm).
With the increase in the size of masonry prisms, the area ratio of mortar to brick changed on the cross-section. To accurately assess the effect of mortar joints on bond properties, we tentatively added a brick mortar joint percentage factor, χ, into Equation (1). The following regression model is proposed in this paper:
χ = 1 ( n · d ) L f
L e = α χ 1 f m 0.2895 E f t f / 10,000 0.8576
where α is the fitting coefficient, Lf is the FRP bond length, n is the number of mortar joints within the FRP bond length, fm is the compressive strength of the masonry, and d is the thickness of the mortar joint, which is 10 mm here. The value of α can be obtained by linear regression fitting; here, it is 27.7151.
Table 5 lists the measured and calculated effective bond lengths. When the bond length exceeded the effective bond length ( L f   >   L e ), the calculated values were in good agreement with the experimental results.

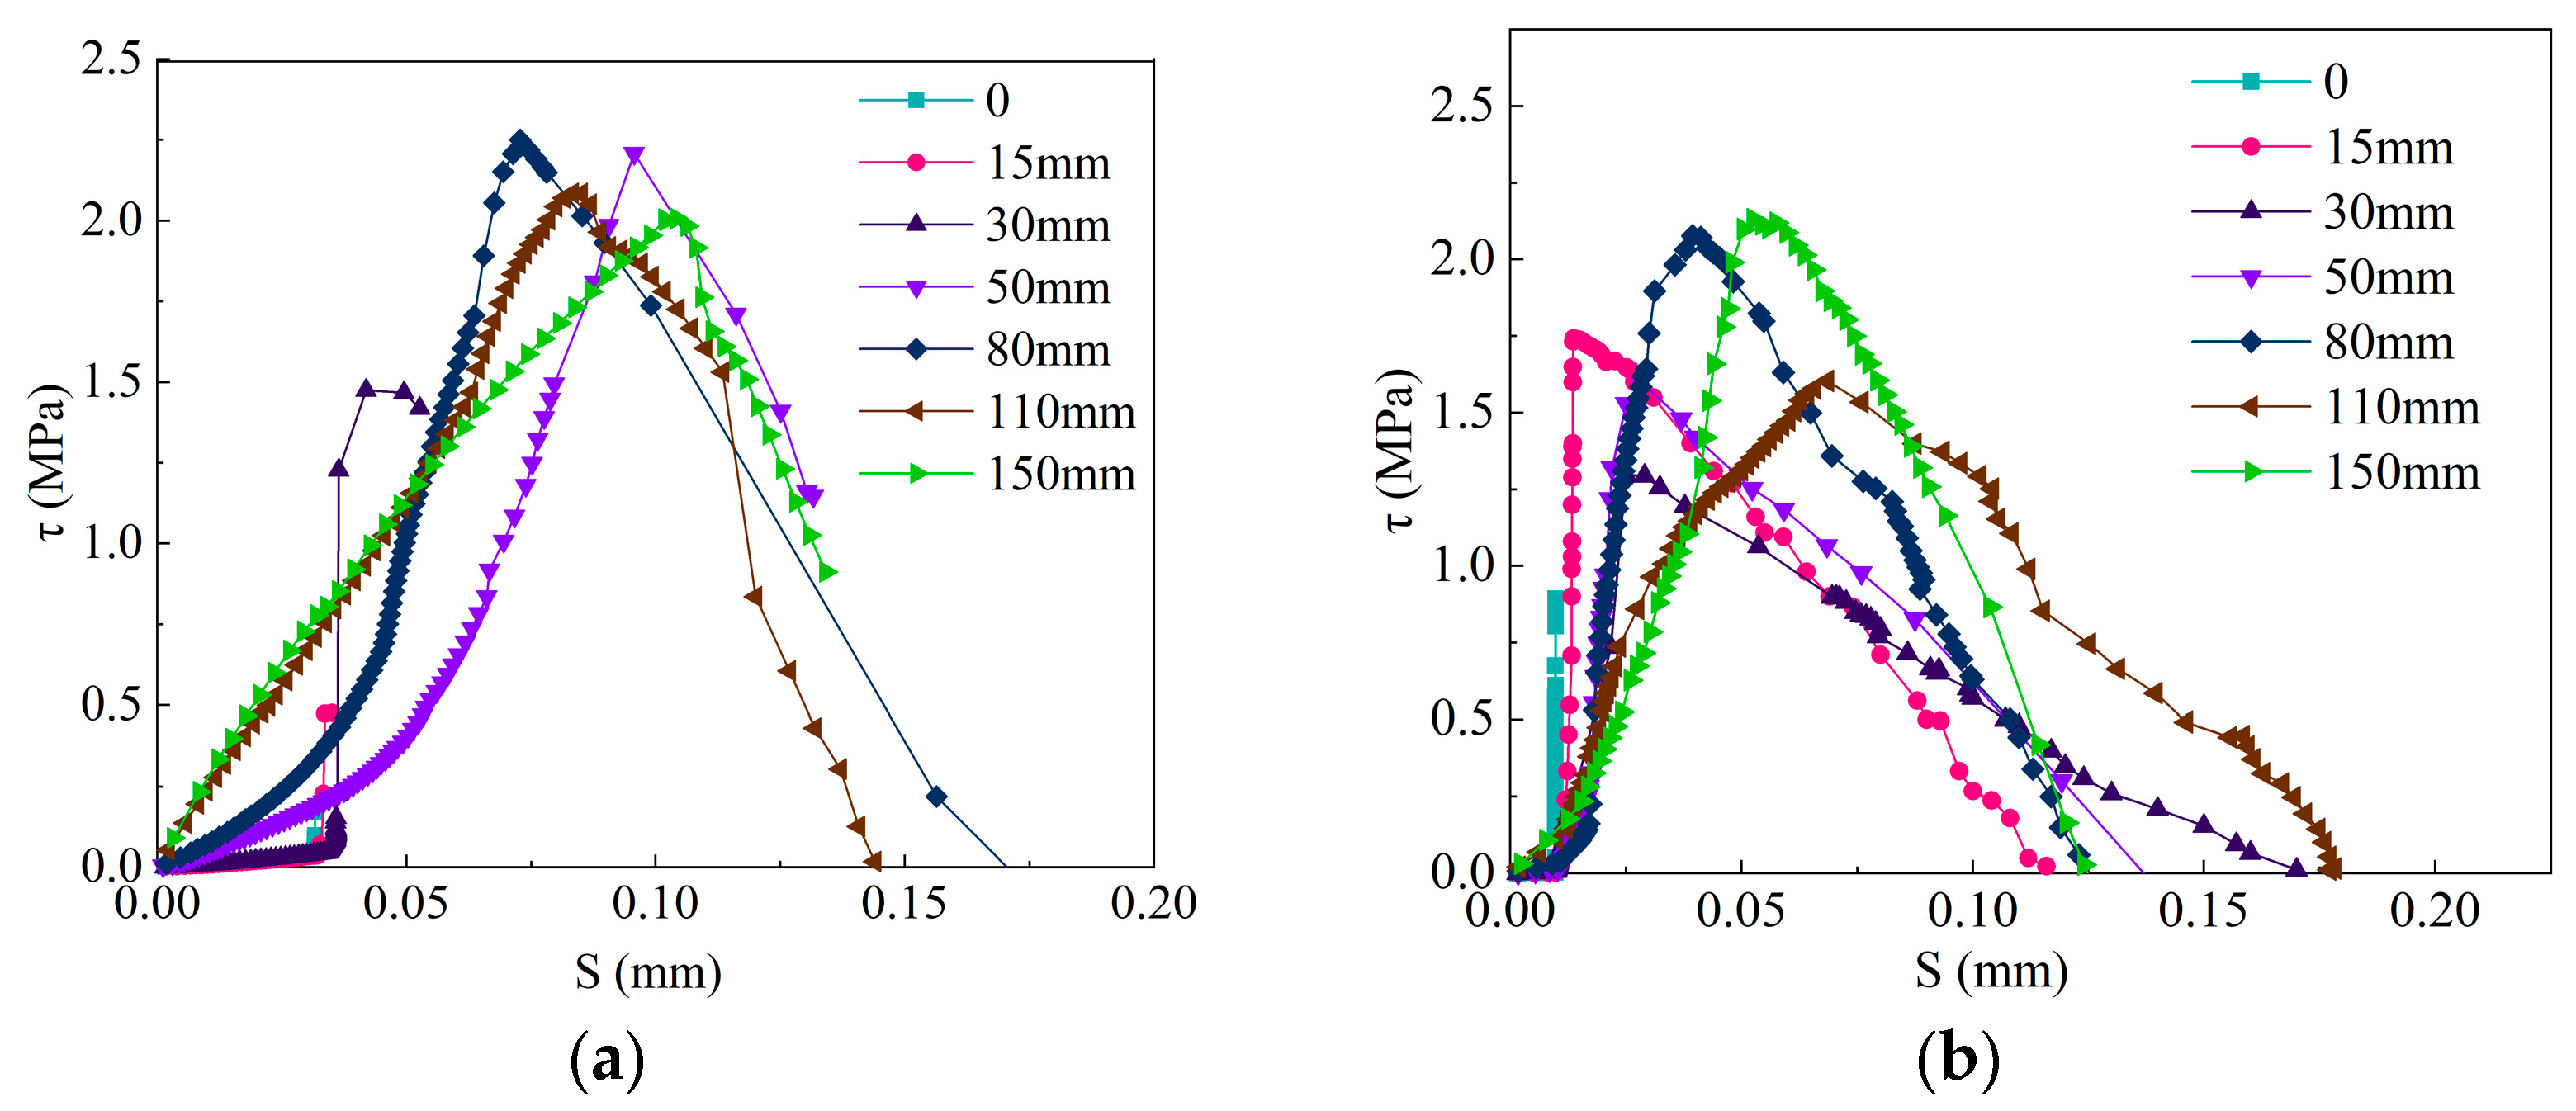
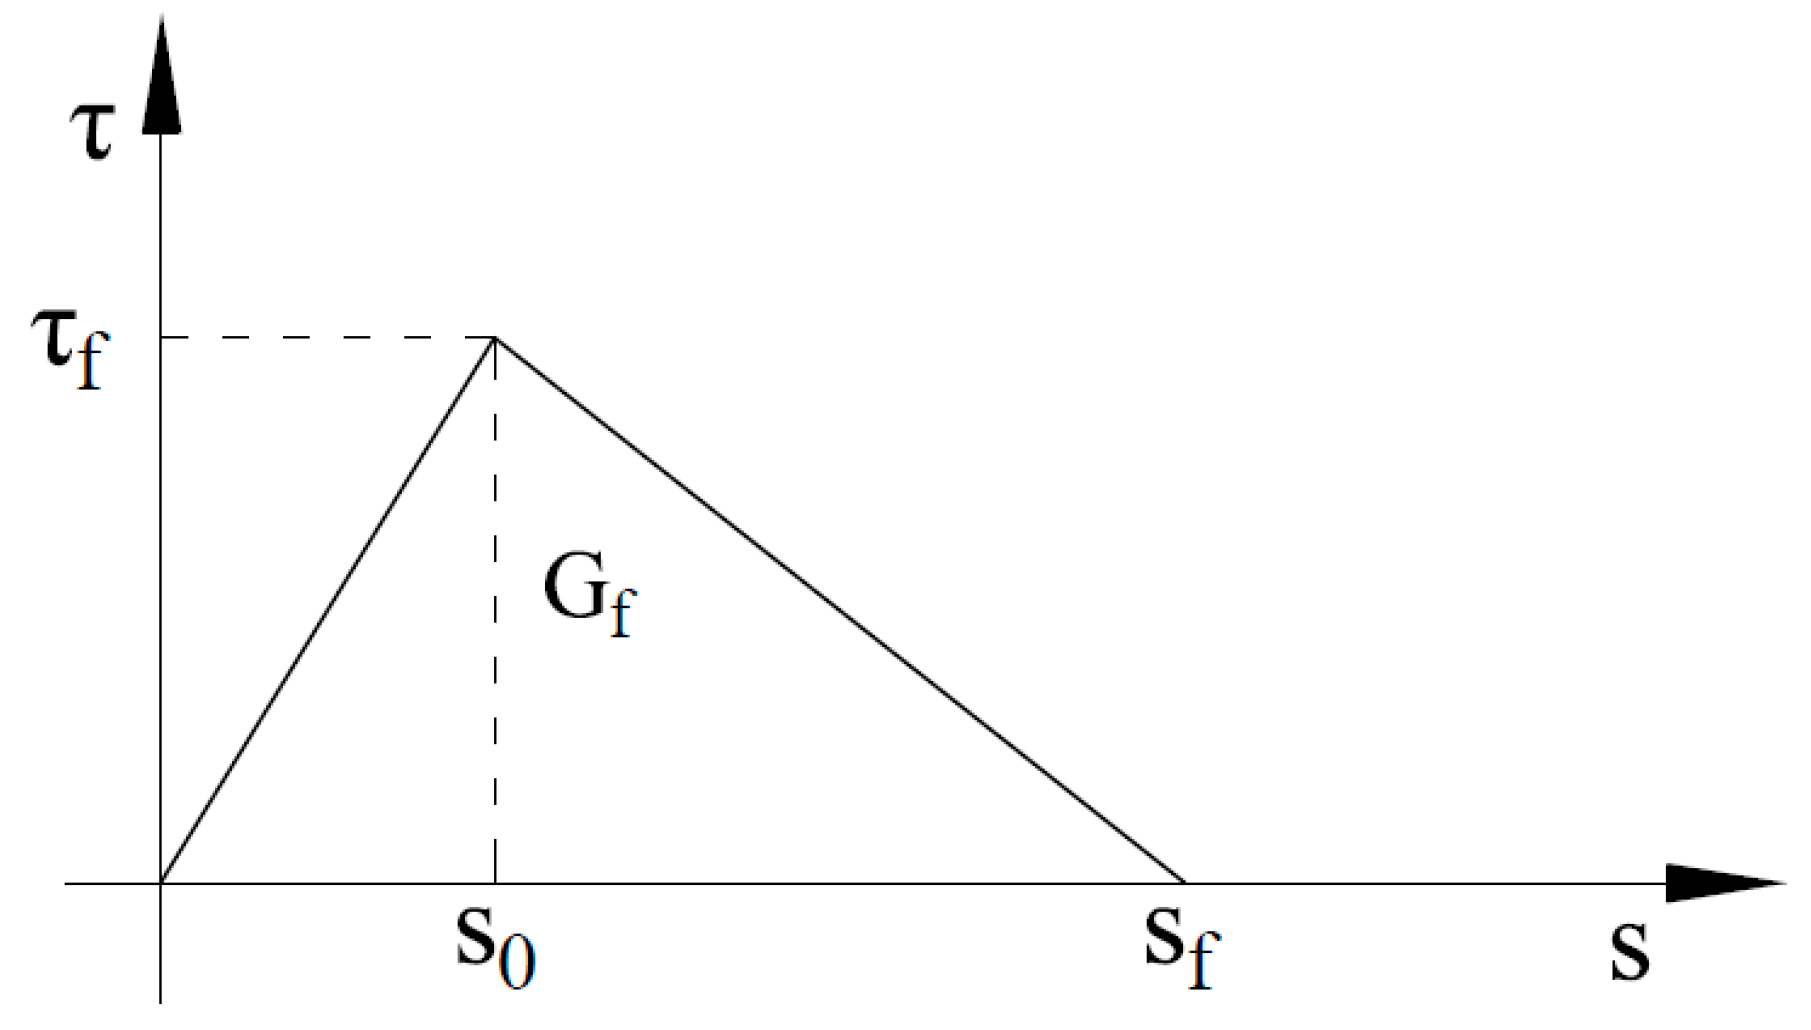
3.4. Interface Bond Strength Model

By arranging strain gauges on the FRP sheet, shear stress at a specific point can be obtained through the differential method. The slip at that point was determined using integration and superposition methods; thereby, the bond–slip relationship of the interface could be established. Figure 15 presents the local bond–slip curves of two representative specimens (AC-L150W25-No. 2, BC-L150W25-No. 1). The curves exhibited both ascending and descending sections; therefore, a bilinear bond–slip model (Figure 16) was employed to characterize the interface debonding behavior. The area enclosed by the bond–slip curve was the energy release rate,   G f , which can be calculated by Equation (4).
G f = 0 s τ s d s = 1 2 τ f S f
Based on the key parameters proposed by Lu [62], we introduced a brick–mortar area proportion coefficient, χ, and a length influence coefficient, βl, proposed by Carozzi [35]. An improved empirical formula was then proposed using the fitting method. The regression model is as follows:
τ f = a χ β 1 β w f m
S 0 = b β w f m
G f = c 2 χ 2 β 1 2 β w f m
The coefficients β 1 and β w are calculated using the following formula:
β 1 = L f L e 2 L f L e
β w = 3 b f / b 1 + b f / b
where a, b, and c are coefficients. bf and b are the width of FRP sheet and brick base, respectively.
For specimens without end anchorage, the mean value of τ f and S 0 was taken. Simultaneously, by integrating the bond–slip curves, we were able to obtain the interfacial energy release rate,   G f . The key parameters are listed in Table 6.
The coefficients a, b, and c were determined to be 0.07673, 0.00255, and 0.15323, respectively, by fitting the data in Table 6.
By assuming that the FRP sheet and the bonding layer were elastomers, Capozucca [40] proposed an interfacial bond strength model (Equation (10)) based on the principle of force balance, closely related to the fracture energy of the interface.
P = b f 2 E f t f G f
By substituting Equation (7) into Equation (10), we obtain an improved interfacial bearing capacity model (Equation (11)).
P = χ β 1 b f 0.26 E f t f β w f m
The comparison of the interface bond capacity for non-anchored FRP-reinforced masonry prisms, as calculated using the newly improved model (Pimp,cal) and other typical existing models (Pm1~3,cal) [34,35,63], with the experimental results presented in this paper (Ptest), is illustrated in Figure 17. Unlike existing models, the proposed formula incorporates the brick–mortar area ratio (χ) and energy release rate (Gf), improving accuracy for masonry substrates. The calculated results of improved models (Equation (11)) closely match the test results, with a ratio ranging between 0.75 and 1.33.

4. Conclusions and Future Outlook

In this paper, the effects of FRP bonding width, length, end anchorage, and mortar joint on bonding performance were investigated through one-sided shear tests on 20 groups of CFRP-reinforced brick masonry specimens. The proposed model, validated by experimental data, offers engineers a reliable tool for predicting interfacial bond strength in FRP-strengthened masonry, accounting for the often-overlooked effects of mortar joints. The following conclusions are drawn:
(1)
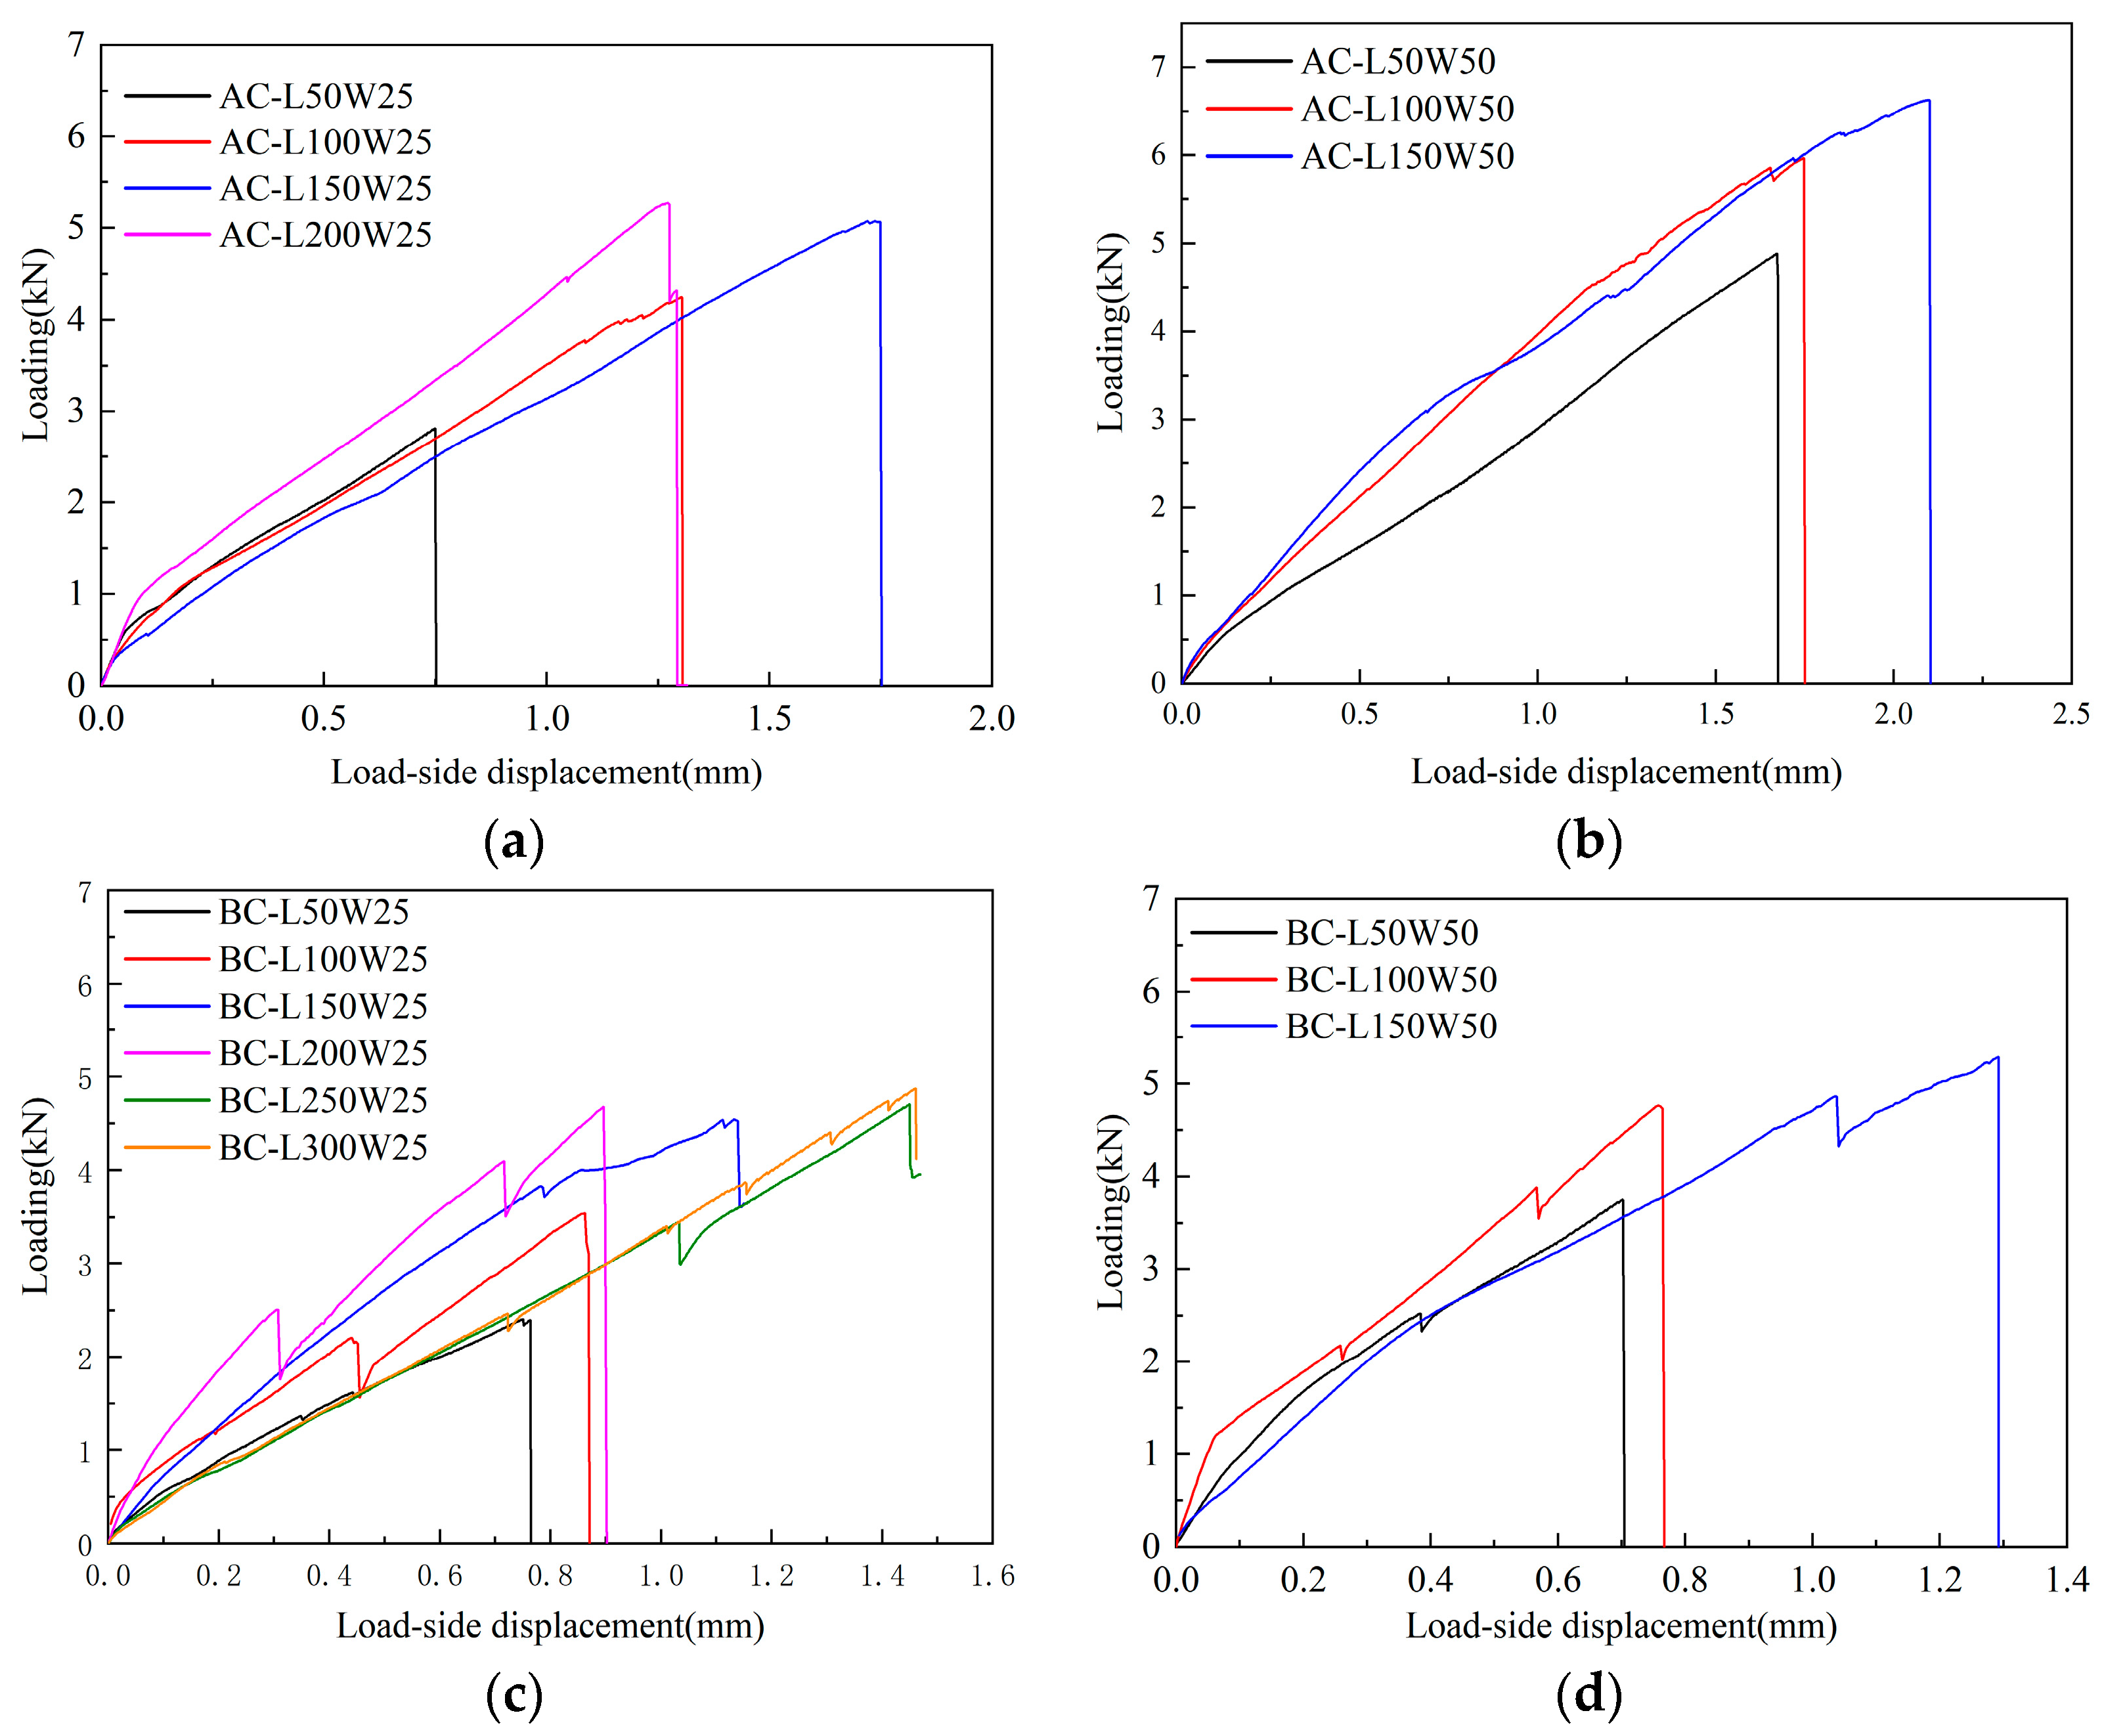
Increasing the FRP bonding width can significantly enhance the bond strength of reinforced masonry structures by 16.3–75.4%. The displacement at the loading end of specimen AC increased as the bond width increased, while the effect on the displacement at the loading end of specimen BC was not significant. Within the effective bond length range, the interfacial bond capacity increased with longer FRP bonding lengths, although the rate of increase gradually decreased. The maximum displacement at the loading end also increased with longer bonding lengths; however, it decreased when the bond length in specimen AC exceeded 200 mm. Additionally, the end anchorage had a moderate impact on interface bond capacity, resulting in an increase ranging from 7.5% to 21.8%.
(2)
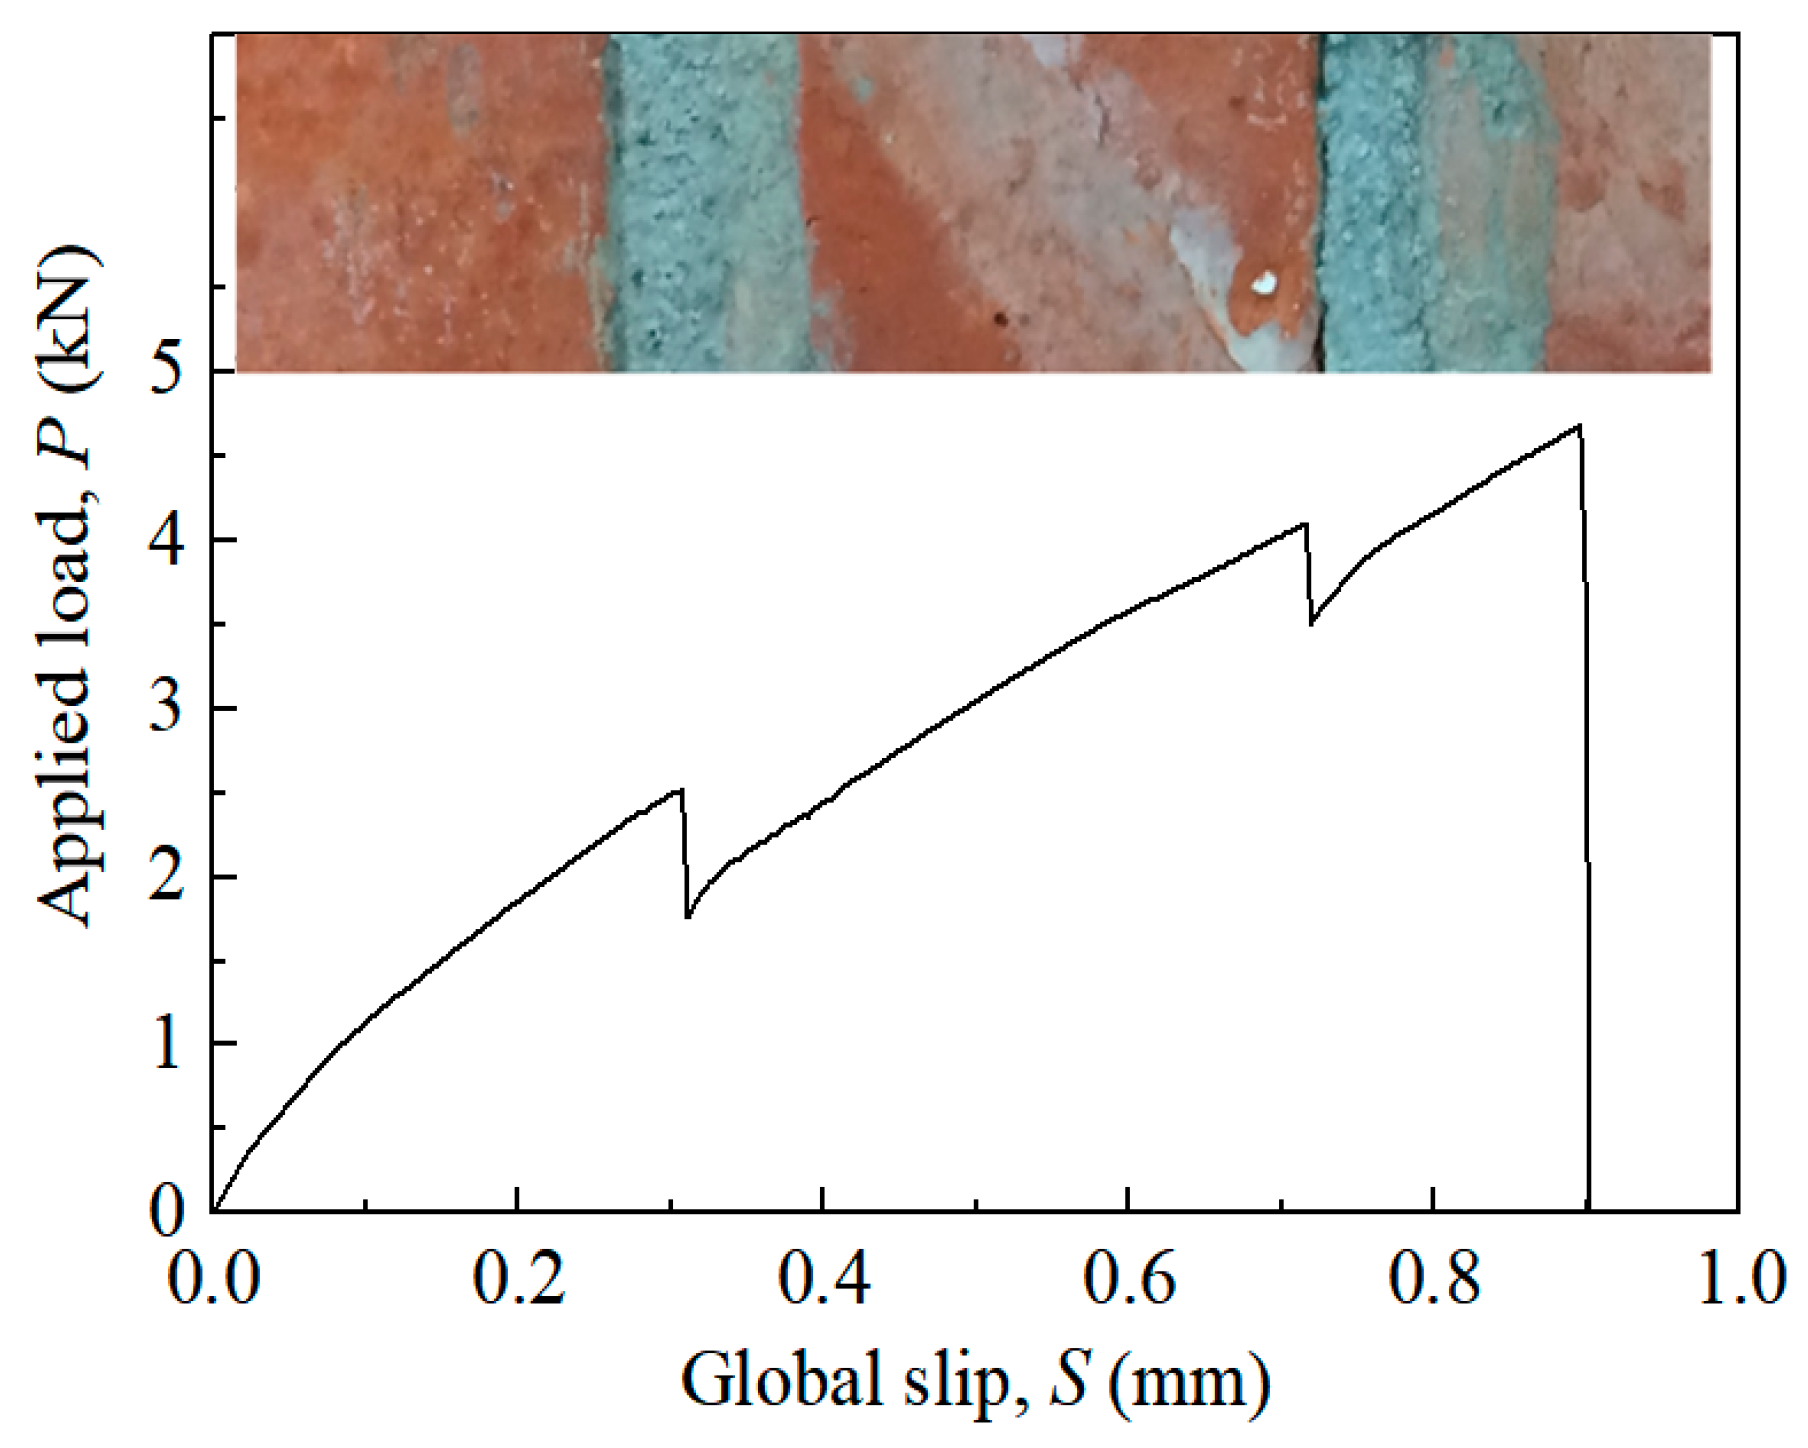
The shear stress at the mortar joint was lower than that at the brick base. The bond strength of specimen BC was 10.4–22.5% less than that of specimen AC, but its effective bond length was greater than that of specimen AC. The force vs. slip curves showed a discontinuous increase. When the load was transferred to the mortar joint, the load value continued to rise after decreasing by 7.5–30.0%. The FRP deformation limit in specimen AC occurred at only one location, while in specimen BC it occurred at multiple locations. Oblique cracks were visible in specimen BC but not in specimen AC.
(3)
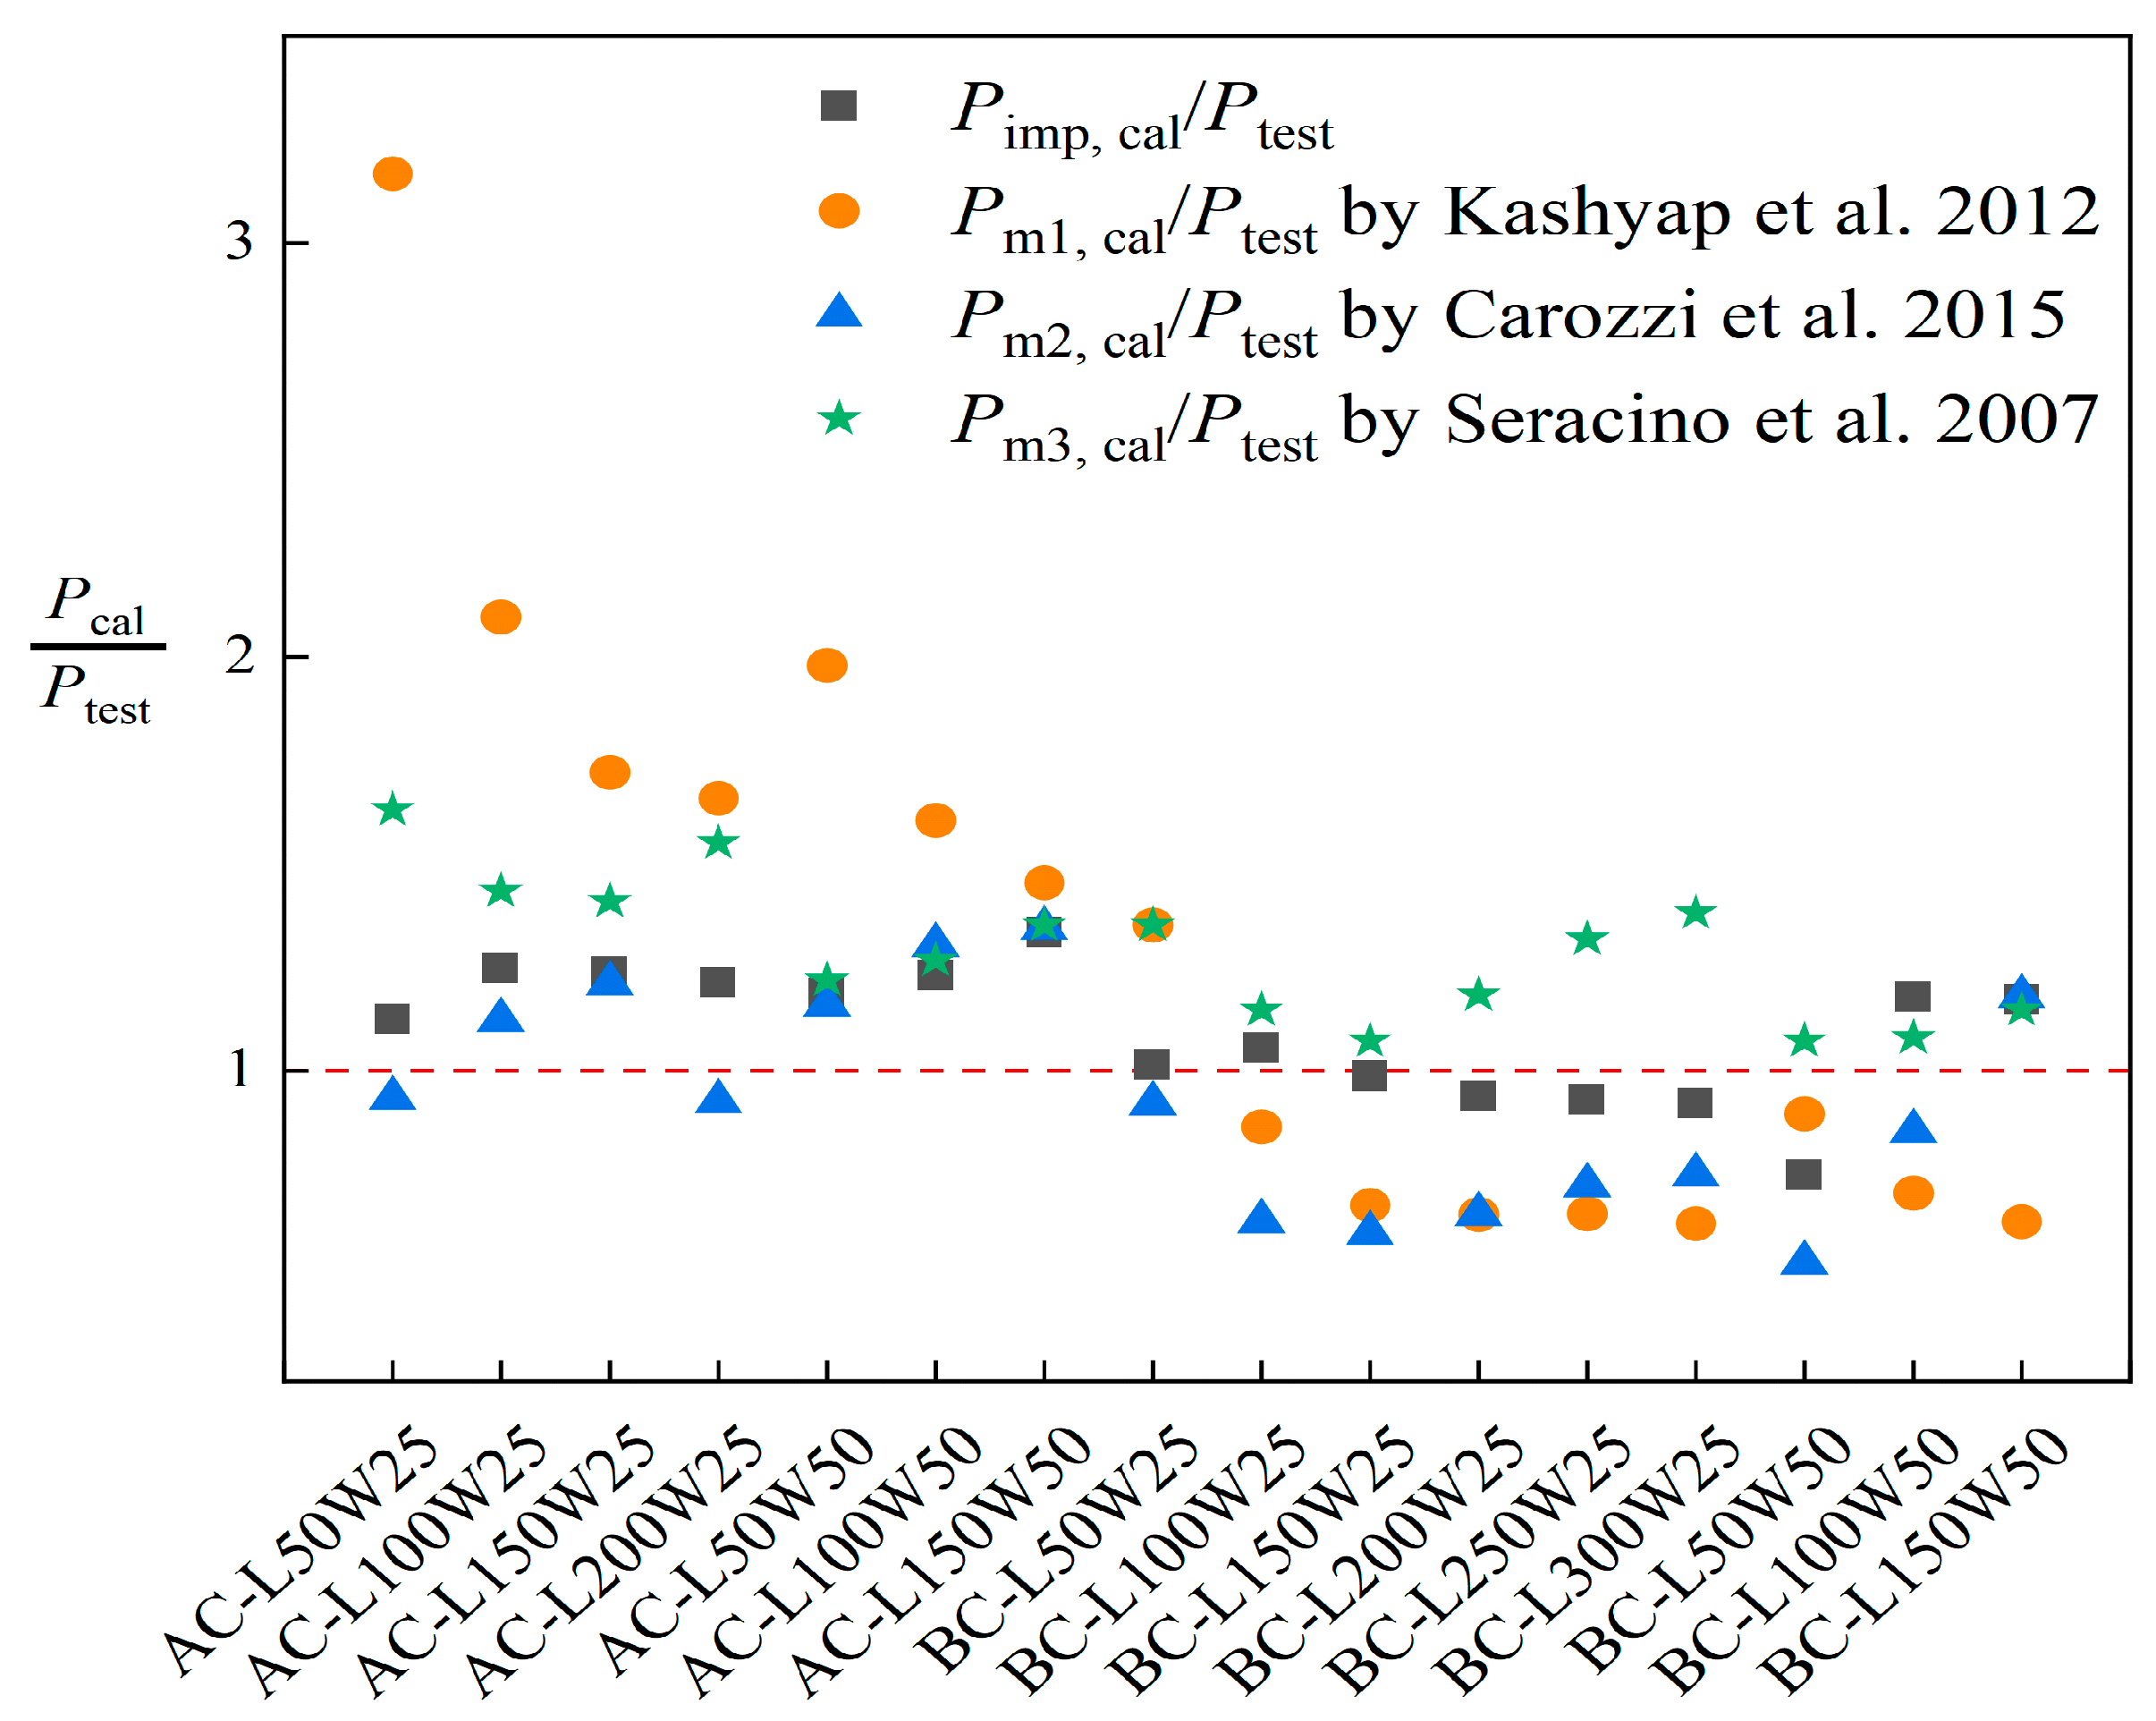
The improved bond strength model, incorporating χ and energy release rate, represents a significant advancement over prior approaches by addressing the discontinuous load transfer caused by mortar joints. The calculated results showed good agreement with experimental data, with an average prediction error of 10%. This improved model is suitable for the reinforcement design of brick masonry using fiber-reinforced composite materials.
FRP debonding is the main damage phenomenon due to the low bond strength of the FRP–masonry interface in FRP-strengthened masonry structures. To thoroughly study the effect of mortar on interfacial properties, more parameters such as mortar thickness, mortar type, block type, material strength, exposure environment, etc., should be taken into account in future research. Furthermore, a detailed analysis of the accuracy of the proposed formulations needs further comparisons with experimental results in future works. Especially, when it comes to structural reinforcement in corrosive environments, in addition to FRP sheets, we can use other alternative materials, such as stainless steel and FRP bars [64,65,66].

Author Contributions

Supervision, Z.L.; conceptualization, Z.L.; experimental, H.M. and E.W.; methodology, Y.L. and E.W.; original draft, H.M. and H.H.; review and editing, L.Z. and Z.L. All authors have read and agreed to the published version of the manuscript.

Funding

The authors would like to acknowledge the financial support of the National Natural Science Foundation of China (No. 52268038) and Yunnan Fundamental Research Projects (Grant No. 202201AT070159).

Data Availability Statement

The data presented in this study are available on request from the corresponding author.

Conflicts of Interest

The authors declare no conflicts of interest.

References

  1. ElGawady, M.A.; Lestuzzi, P.; Badoux, M. Aseismic retrofitting of unreinforced masonry walls using FRP. Compos. Part B-Eng. 2005, 37, 148–162. [Google Scholar] [CrossRef]
  2. Lin, B.; Chun, Q.; Ma, Y. Seismic behavior of historical masonry arched walls reinforced with novel hybrid FRPs. Structures 2025, 71, 107987. [Google Scholar] [CrossRef]
  3. Akhtar, A.; Saleem, S.; Salman, M.; Noman, M.; Zulqarnain, M.; Jirawattanasomkul, T. Performance of square masonry columns retrofitted with NSM steel and GFRP reinforcement under axial compression. Constr. Build. Mater. 2025, 458, 139534. [Google Scholar] [CrossRef]
  4. ElGawady, M.A.; Lestuzzi, P.; Badoux, M. Static cyclic response of masonry walls retrofitted with fiber-reinforced polymers. J. Compos. Constr. 2007, 11, 50–61. [Google Scholar] [CrossRef]
  5. Oliveira, D.V.; Basilio, I.; Lourenço, P.B. Experimental behavior of FRP strengthened masonry arches. J. Compos. Constr. 2010, 14, 312–322. [Google Scholar] [CrossRef]
  6. Cascardi, A.; Dell’Anna, R.; Micelli, F.; Lionetto, F.; Aiello, M.A.; Maffezzoli, A. Reversible techniques for FRP-confinement of masonry columns. Constr. Build. Mater. 2019, 225, 415–428. [Google Scholar] [CrossRef]
  7. Zhou, D.; Zhou, S.; Lei, Z. In-plane shear behaviors of constrained masonry walls externally retrofitted with BFRP. J. Compos. Constr. 2016, 20, 04015059. [Google Scholar] [CrossRef]
  8. Zhou, D.; Lei, Z.; Wang, J. In-plane behavior of seismically damaged masonry walls repaired with external BFRP. Compos. Struct. 2013, 102, 9–19. [Google Scholar] [CrossRef]
  9. Ehsani, M.R.; Saadatmanesh, H.; Velazquez-Dimas, J.I. Behavior of retrofitted URM walls under simulated earthquake loading. J. Compos. Constr. 1999, 3, 134–142. [Google Scholar] [CrossRef]
  10. Corradi, M.; Borri, A.; Vignoli, A. Strengthening techniques tested on masonry structures struck by the Umbria-Marche earthquake of 1997–1998. Constr. Build. Mater. 2002, 16, 229–239. [Google Scholar] [CrossRef]
  11. ElGawady, M.A.; Lestuzzi, P.; Badoux, M. In-plane seismic response of URM walls upgraded with FRP. J. Compos. Constr. 2005, 9, 524–535. [Google Scholar] [CrossRef]
  12. Gattulli, V.; Lofrano, E.; Paolone, A.; Pirolli, G. Performances of FRP reinforcements on masonry buildings evaluated by fragility curves. Comput. Struct. 2017, 190, 150–161. [Google Scholar] [CrossRef]
  13. Corradi, M.; Borri, A.; Castori, G.; Coventry, K. Experimental analysis of dynamic effects of FRP reinforced masonry vaults. Materials 2015, 8, 8059–8071. [Google Scholar] [CrossRef]
  14. Al-Jaberi, Z.; Myers, J.J.; ElGawady, M.A. Experimental and analytical approach for prediction of out-of-plane capacity of reinforced masonry walls strengthened with externally bonded FRP laminate. J. Compos. Constr. 2019, 23, 04019026. [Google Scholar] [CrossRef]
  15. Kałuża, M. Experimental Analysis of surface application of fiber-Reinforced polymer composite on shear behavior of masonry walls made of autoclaved concrete blocks. Buildings 2022, 12, 2208. [Google Scholar] [CrossRef]
  16. Guo, Z.; Tang, L.; Zong, Z.; Xiong, Y.; Jiang, T.; Xu, H. Cyclic out-of-plane testing of clay brick masonry walls strengthened with glass fiber-reinforced polymer strips. ACI Struct. J. 2023, 120, 135–148. [Google Scholar] [CrossRef]
  17. Bellini, A.; Mazzotti, C. A review on the bond behavior of FRP composites applied on masonry substrates. RILEM Tech. Lett. 2017, 2, 74–82. [Google Scholar] [CrossRef]
  18. Vaculik, J.; Visintin, P.; Burton, N.G.; Griffith, M.C.; Seracino, R. State-of-the-art review and future research directions for FRP-to-masonry bond research: Test methods and techniques for extraction of bond-slip behaviour. Constr. Build. Mater. 2018, 183, 325–345. [Google Scholar] [CrossRef]
  19. Olivito, R.S.; Codispoti, R.; Cevallos, O.A. Bond behavior of Flax-FRCM and PBO-FRCM composites applied on clay bricks: Experimental and theoretical study. Compos. Struct. 2016, 146, 221–231. [Google Scholar] [CrossRef]
  20. Gentilini, C.; Carloni, C.; Santoro, R.; Franzoni, E. Characterization of FRCM- and FRP-Masonry Bond Behavior. In Proceedings of the XII International Conference on Structural Analysis of Historical Constructions–SAHC, Online, 29 September–1 October 2021; pp. 2451–2457. [Google Scholar]
  21. Ceroni, F.; Leone, M.; Rizzo, V.; Bellini, A.; Mazzotti, C. Influence of mortar joints on the behaviour of FRP materials bonded to different masonry substrates. Eng. Struct. 2017, 153, 550–568. [Google Scholar] [CrossRef]
  22. Du, H.; Xian, G.; Tian, J.; Ma, Z.; Li, C.; Xin, M.; Zhang, Y. Effect of fiber surface treatment with silane coupling agents and carbon nanotubes on mechanical properties of carbon fiber reinforced polyamide 6 composites. Polym. Compos. 2025, 46, 1267–1283. [Google Scholar] [CrossRef]
  23. Dong, Z.; Ji, J.; Liu, Z.; Wu, C.; Wu, G.; Zhu, H.; Zhang, P. I-shaped ECC/UHPC composite beams reinforced with steel bars and BFRP sheets. Sustain. Struct. 2023, 3, 000022. [Google Scholar] [CrossRef]
  24. Ma, P.; Xin, R.; Yao, J. An investigation of bond behavior between composite materials (CFRP, GWMM, KPGC) and substrates (Brick and Concrete) for strengthening existing masonry structures. Constr. Build. Mater. 2023, 409, 134019. [Google Scholar] [CrossRef]
  25. Reboul, N.; Saidi, M.; Mualla, S.; Homoro, O.; Amziane, S. Bond behaviour of fibre reinforced polymers applied on masonry substrate: Analysis based on acoustic emission, digital image correlation and analytical modelling. Constr. Build. Mater. 2023, 403, 132921. [Google Scholar] [CrossRef]
  26. Ghiassi, B.; Marcari, G.; Oliveira, D.V.; Lourenço, P.B.; Monti, G. Numerical analysis of bond behavior between masonry bricks and composite materials. Eng. Struct. 2012, 43, 210–220. [Google Scholar] [CrossRef]
  27. Maruccio, C.; Basilio, I.; Oliveira, D.V.; Lourenço, P.B.; Monti, G. Numerical modelling and parametric analysis of bond strength of masonry members retrofitted with FRP. Constr. Build. Mater. 2014, 73, 713–727. [Google Scholar] [CrossRef]
  28. Grande, E.; Milani, G.; Formisano, A.; Ghiassi, B.; Fabbrocinol, F. Bond behaviour of FRP strengthening applied on curved masonry substrates: Numerical study. Int. J. Mason. Res. Inno. 2020, 5, 303–320. [Google Scholar] [CrossRef]
  29. Toufigh, V.; Yarigarravesh, M.; Mofid, M. Environmental effects on the bond at the interface of fiber-reinforced polymer and masonry brick. J. Reinf. Plast. Comp. 2017, 36, 1355–1368. [Google Scholar] [CrossRef]
  30. Maljaee, H.; Ghiassi, B.; Lourenço, P.B.; Oliveira, D.V. FRP-brick masonry bond degradation under hygrothermal conditions. Compos. Struct. 2016, 147, 143–154. [Google Scholar] [CrossRef]
  31. Ramirez, R.; Ghiassi, B.; Oliveira, D.; Lourenço, P.B. Long-term behaviour of GFRP-reinforced masonry components under outdoor environmental conditions: Results after 5-Year ex-posure. In International Brick and Block Masonry Conference; Springer: Cham, Switzerland, 2025; pp. 833–844. [Google Scholar] [CrossRef]
  32. Li, C.; Xian, G. Novel wedge-shaped bond anchorage system for pultruded CFRP plates. Mater. Struct. 2018, 51, 1–14. [Google Scholar] [CrossRef]
  33. Mansouri, I.; Hu, J.W.; Kisi, O. Novel predictive model of the debonding strength for masonry members retrofitted with FRP. Compos. Struct. 2016, 6, 337. [Google Scholar] [CrossRef]
  34. Kashyap, J.; Willis, C.R.; Griffith, M.C.; Ingham, J.M.; Masia, M.J. Debonding resistance of FRP-to-clay brick masonry joints. Eng. Struct. 2012, 41, 186–198. [Google Scholar] [CrossRef]
  35. Carozzi, F.G.; Colombi, P.; Poggi, C. Calibration of end-debonding strength model for FRP-reinforced masonry. Compos. Struct. 2015, 120, 366–377. [Google Scholar] [CrossRef]
  36. Rabi, M.; Cashell, K.A.; Shamass, R.; Desnerck, P. Bond behaviour of austenitic stainless steel reinforced concrete. Eng. Struct. 2020, 221, 111027. [Google Scholar] [CrossRef]
  37. Rabi, M. Bond prediction of stainless-steel reinforcement using artificial neural networks. Proc. Inst. Civ. Eng. -Constr. Mater. 2023, 177, 87–97. [Google Scholar] [CrossRef]
  38. Rabi, M.; Shamass, R.; Cashell, K.A. Structural performance of stainless steel reinforced concrete members: A review. Constr. Build. Mater. 2022, 325, 126673. [Google Scholar] [CrossRef]
  39. Sassoni, E.; Sarti, V.; Bellini, A.; Mazzotti, C.; Franzoni, E. The role of mortar joints in FRP debonding from masonry. Compos. Part B-Eng. 2018, 135, 166–174. [Google Scholar] [CrossRef]
  40. Capozucca, R.; Ricci, V. Bond of GFRP strips on modern and historic brickwork masonry. Compos. Struct. 2016, 140, 540–555. [Google Scholar] [CrossRef]
  41. Freddi, F.; Sacco, E. Debonding Process of Masonry Element Strengthened with FRP. Procedia Eng. 2015, 109, 27–34. [Google Scholar] [CrossRef]
  42. Carloni, C.; Focacci, C. FRP-masonry interfacial debonding: An energy balance approach to determine the influence of the mortar joints. Eur. J. Mech. A Solids 2016, 55, 122–133. [Google Scholar] [CrossRef]
  43. Mazzotti, C.; Murgo, F.S. Numerical and experimental study of GFRP-masonry interface behavior: Bond evolution and role of the mortar layers. Compos. Part B-Eng. 2015, 75, 212–225. [Google Scholar] [CrossRef]
  44. Ghiassi, B.; Oliveira, D.V.; Lourenço, P.B.; Marcari, G. Numerical study of the role of mortar joints in the bond behavior of FRP-strengthened masonry. Compos. Part B-Eng. 2013, 46, 21–30. [Google Scholar] [CrossRef]
  45. Focacci, F.; Carloni, C. A study of the fracture process at the FRP-masonry interface: The role of the periodic pattern of bricks and mortar joints. Key Eng. Mater. 2014, 624, 611–618. [Google Scholar] [CrossRef]
  46. GB 50003-2011; Code for Design of Masonry Structures. Ministry of Construction of China: Beijing, China, 2011. (In Chinese)
  47. GB/T 2542-2012; Test Methods for Wall Bricks. National Standardization Administration of China: Beijing, China, 2012. (In Chinese)
  48. GB 175-2023; Common Portland Cement. National Standardization Administration of China: Beijing, China, 2023. (In Chinese)
  49. JGJ 52-2006; Standard for Technical Requirements and Test Method of Sand and Crushed Stone (or Gravel) for Ordinary Concrete. Ministry of Construction of China: Beijing, China, 2006.
  50. JGJ/T 70-2009; Standard for Test Method of Basic Properties of Construction Mortar. Ministry of Construction of China: Beijing, China, 2009.
  51. ASTM D3039/D3039M-17; Standard Test Method for Tensile Properties of Polymer Matrix Composite Materials. ASTM: West Conshohocken, PA, USA, 2017.
  52. ASTM D638-22; Standard Test Method for Tensile Properties of Plastics. ASTM: West Conshohocken, PA, USA, 2022.
  53. GB 50702-2011; Code for Design of Strengthening Masonry Structures. Ministry of Con-Struction of China: Beijing, China, 2011. (In Chinese)
  54. Leone, M.; Aiello, M.A. Bond tests on clay bricks and natural stone masonry externally bonded with FRP. Materials 2021, 14, 7439. [Google Scholar] [CrossRef] [PubMed]
  55. Sassoni, E.; Andreotti, S.; Bellini, A.; Mazzanti, B.; Bignozzi, M.C.; Mazzotti, C.; Franzoni, E. In-fluence of mechanical properties, anisotropy, surface roughness and porosity of brick on FRP debonding force. Compos. Part B-Eng. 2017, 108, 257–269. [Google Scholar] [CrossRef]
  56. Ceroni, F. Bond tests to evaluate the effectiveness of anchoring devices for CFRP sheets epoxy bonded over masonry elements. Compos. Part B-Eng. 2017, 113, 317–330. [Google Scholar] [CrossRef]
  57. CNR-DT 200/2004; Guide for the Design and Construction of Externally Bonded FRP Systems for Strengthening Existing Structures. CNR-Advisory Committee of Technical Recommen-Dations for Construction, National Research Council: Rome, Italy, 2004.
  58. Bertolesi, E.; Grande, E.; Fagone, M.; Milani, G.; Rotunno, T. Mechanical model based on a BVP for FRPs applied on flat and curved masonry pillars with anchor spikes. Compos. Struct. 2021, 273, 114251. [Google Scholar] [CrossRef]
  59. Malena, M.; Focacci, F.; Carloni, C.; De Felice, G. The effect of the shape of the cohesive material law on the stress transfer at the FRP-masonry interface. Compos. Part B-Eng. 2017, 110, 368–380. [Google Scholar] [CrossRef]
  60. Yun, Y.; Wu, Y.F. Durability of CFRP-concrete joints under freeze-thaw cycling. Cold. Reg. Sci. Technol. 2011, 65, 401–412. [Google Scholar] [CrossRef]
  61. Huang, T.L.; Huang, Y.H. Analysis of the effective bond length between fiber reinforced polymer and brick. Sichuan Build. Sci. 2015, 41, 195–198. (In Chinese) [Google Scholar]
  62. Lu, X.; Ye, L.; Teng, J.; Zhuang, J. Bond-slip model for FRP-to-concrete interface. J. Build. Struct. 2005, 26, 10–18. (In Chinese) [Google Scholar] [CrossRef]
  63. Seracino, R.; Raizal Saifulnaz, M.R.; Oehlers, D.J. Generic debonding resistance of EB and NSM plate-to-concrete joints. J. Compos. Constr. 2007, 11, 62–70. [Google Scholar] [CrossRef]
  64. Rabi, M.; Shamass, R.; Cashell, K.A. Experimental investigation on the flexural behaviour of stainless steel reinforced concrete beams. Struct. Infrastruct. E 2023, 19, 1847–1859. [Google Scholar] [CrossRef]
  65. Rabi, M.; Cashell, K.A.; Shamass, R. Flexural analysis and design of stainless steel reinforced concrete beams. Eng. Struct. 2019, 198, 109432. [Google Scholar] [CrossRef]
  66. Rabi, M.; Cashell, K.A.; Shamass, R. Ultimate behaviour and serviceability analysis of stainless steel reinforced concrete beams. Eng. Struct. 2021, 248, 113259. [Google Scholar] [CrossRef]
Figure 1. Tensile stress–strain curves of the CFRP samples.
Buildings 15 00809 g001
Figure 2. Dumbbell-shaped hardened adhesive specimen for the tensile test (unit: mm).
Buildings 15 00809 g002
Figure 3. Schematic diagram of FRP-reinforced specimen (unit: mm). (a) Single brick, (b) masonry prism.
Buildings 15 00809 g003
Figure 4. Test setup. (a) Full view, (b) front view, (c) side view.
Buildings 15 00809 g004
Figure 5. Diagram of testing equipment and fixed FRP-reinforced specimen. (a) Full view, (b) side view.
Buildings 15 00809 g005
Figure 6. Failure modes of the tested specimens. (a) Type I: cohesive failure of masonry, (b) type II: adhesive debonding, (c) type III: brick crushing, (d) type IV: brick cracking.
Buildings 15 00809 g006
Figure 7. Influence of bond width on bond strength. (a) Specimens AC, (b) specimens BC.
Buildings 15 00809 g007
Figure 8. Influence of bond length on bond capacity.
Buildings 15 00809 g008
Figure 9. Influence of end anchorage on bond strength.
Buildings 15 00809 g009
Figure 10. Corresponding relationship between the position of load drop and the position of mortar.
Buildings 15 00809 g010
Figure 11. Force vs. slip curves of selected samples. (a) W = 25 mm, (b) W = 50 mm, (c) W = 25 mm, (d) W = 50 mm.
Buildings 15 00809 g011
Figure 12. Influence of end mortar joint on bond capacity.
Buildings 15 00809 g012
Figure 13. Strain profiles of selected samples. (a) Specimen AC-L200W25-No. 3, (b) specimen BC-L200W25-No. 2.
Buildings 15 00809 g013
Figure 14. Typical strain distribution curve [41,61].
Buildings 15 00809 g014
Figure 15. Bond–slip curves. (a) Specimen AC-L150W25, (b) specimen BC-L150W25.
Buildings 15 00809 g015
Figure 16. Typical bilinear bond–slip model.
Buildings 15 00809 g016
Figure 17. Calculated vs. experimental interface bond strength [34,35,63].
Buildings 15 00809 g017
Table 1. Mechanical properties of reinforcement materials.
Material Elastic   Modulus   E f /GPa Tensile   Strength   f c /MPaUltimate Strain/%
AverageStandard DeviationAverageStandard DeviationAverageStandard Deviation
CFRPManufacturer241/3710/1.70/
Sample test2472.8337807.071.740.04
AdhesiveManufacturer2.69/51.5/2.51/
Sample test2.730.0652.10.142.590.02
Notes: manufacturer is Shanghai Duanjun Manufacturing Company (Shanghai, China).
Table 2. Experimental design parameters.
SpecimenTypeBond Length/mmBond Width/mmNumberEnd Anchorage
AC-L50W25Single brick5025 3×
AC-L100W2510025 3×
AC-L150W2515025 3×
AC-L200W2520025 3×
BC-L50W25Masonry prism5025 3×
BC-L100W2510025 3×
BC-L150W2515025 3×
BC-L200W2520025 3×
BC-L250W2525025 3×
BC-L300W2530025 3×
AC-L50W50Single brick5050 3×
AC-L100W5010050 3×
AC-L150W5015050 3×
BC-L50W50Masonry prism5050 3×
BC-L100W5010050 3×
BC-L150W5015050 3×
AC-L100W50TSingle brick10050 3
AC-L150W50T15050 3
BC-L100W50TMasonry prism10050 3
BC-L150W50T15050 3
Notes: AC means single brick; BC means masonry prism; L means bond length of FRP; W means bond width of FRP; T means end anchorage; √ and × indicate whether the end of the specimen is anchored or not, respectively.
Table 3. Summary of test results.
SpecimenFailure ModePmax/kNPmax,avg
/kN
Pmax,COVSend/mmSend,avg
/mm
Send,COV
No. 1No. 2No. 3No. 1No. 2No. 3No. 1No. 2No. 3
AC-L50W25IIIII2.802.742.752.761.20.760.790.680.747.6
AC-L100W25III3.754.384.374.178.71.051.591.351.3320.3
AC-L150W25IVIII4.825.055.365.085.31.751.402.301.8225.0
AC-L200W25IIIII4.905.625.295.276.81.741.291.321.4517.4
BC-L50W25IIIII2.222.192.412.275.20.690.770.730.735.5
BC-L100W25IIII3.163.394.113.5513.91.050.961.301.1016.0
BC-L150W25IIIII4.694.094.864.558.91.431.070.891.1324.3
BC-L200W25IIII4.064.805.244.712.71.430.941.581.3225.4
BC-L250W25III4.774.954.354.696.61.571.791.471.6110.2
BC-L300W25III4.855.084.684.874.11.961.901.731.866.4
AC-L50W50IIIIV4.924.515.094.846.21.681.621.401.579.4
AC-L100W50I; IIIII5.846.115.965.972.31.851.901.831.861.9
AC-L150W50IIIIIII6.936.526.326.594.71.962.051.821.946.0
BC-L50W50IIII3.593.693.963.755.10.720.710.670.703.8
BC-L100W50IIIII4.954.085.294.7713.10.941.091.031.027.4
BC-L150W50IIIII6.025.304.545.2914.01.671.671.561.633.9
AC-L100W50TIVIII6.206.696.376.423.91.671.641.491.606.0
AC-L150W50TIVIII7.637.467.407.501.64.153.652.403.4026.5
BC-L100W50TIII; III; II4.814.885.194.964.11.721.721.831.763.6
BC-L150W50TI; III; IIII5.594.985.205.265.91.341.181.061.1911.8
Notes: No. 1–No. 3 are three repeated samples for each group; Pmax is the maximum applied load (force applied at the loaded end), and Send is the global slip (slip at the loaded end) corresponding to Pmax. Both were recorded by the data acquisition system of the UTM. Pmax,avg, Send,avg are the calculated average values, and Pmax,cov, Send,cov are the coefficients of variation (%), defined as the ratio of the standard deviation to its mean.
Table 4. Maximum strain value (10−6).
SpecimenεmaxSpecimenεmaxSpecimenεmaxSpecimenεmax
AC-L50W253823AC-L50W503083BC-L100W253472BC-L300W258702
AC-L100W253675AC-L100W502494BC-L150W253514BC-L50W502006
AC-L150W254116AC-L150W503351BC-L200W253967BC-L100W502292
AC-L200W255820BC-L50W253206BC-L250W256558BC-L150W503462
Table 5. Measured and calculated effective bond lengths.
SpecimenLe,mea/mmLe,cal/mmLe,mea/Le,cal
AC-L50W2541.669.20.60
AC-L100W2575.069.21.08
AC-L150W25100.769.21.45
AC-L200W25136.669.21.97
AC-L50W5041.869.20.60
AC-L100W5062.469.20.90
AC-L150W5087.369.21.26
BC-L50W2541.9120.30.35
BC-L100W2585.0107.00.79
BC-L150W25106.3110.70.96
BC-L200W25161.8113.31.43
BC-L250W25165.9114.61.45
BC-L300W25207.3110.71.87
BC-L50W5046.8120.30.39
BC-L100W5079.4107.00.74
BC-L150W5090.7110.70.82
Note: Le,mea, Le,cal are the measured and calculated effective bond lengths.
Table 6. Mean test values of key parameters.
Specimen S 0 /mm τ f /MPa G f /(N/mm)
AC-L50W250.0390.5000.085
AC-L100W250.0350.6970.028
AC-L150W250.1011.8010.218
AC-L200W250.0481.6710.105
AC-L50W500.0230.4640.011
AC-L100W500.0401.6010.092
AC-L150W500.0991.6420.163
BC-L50W250.0101.6150.016
BC-L100W250.0511.3790.083
BC-L150W250.0471.4430.099
BC-L200W250.0441.0920.074
BC-L250W250.0531.7700.102
BC-L300W250.0691.4870.186
BC-L50W500.0171.2500.023
BC-L100W500.0130.5500.015
BC-L150W500.0160.6400.016
Disclaimer/Publisher’s Note: The statements, opinions and data contained in all publications are solely those of the individual author(s) and contributor(s) and not of MDPI and/or the editor(s). MDPI and/or the editor(s) disclaim responsibility for any injury to people or property resulting from any ideas, methods, instructions or products referred to in the content.

