Article

Thermal Comfort and Adaptive Occupant Behaviour in Open Plan Offices in India and Lithuania

by
Himanshu Patel Tuniki
1,*,
Andrius Jurelionis
1,
Ricardo Forgiarini Rupp
2,
Rokas Valančius
1 and
Gabriel Bekö
3,4
1
Faculty of Civil Engineering and Architecture, Kaunas University of Technology, Studentų g. 48, 51367 Kaunas, Lithuania
2
Knowledge Centre on Daylight, Energy & Indoor Climate, VELUX A/S, Ådalsvej 99, 2970 Hørsholm, Denmark
3
International Centre for Indoor Environment and Energy, Department of Environmental and Resource Engineering, Technical University of Denmark, Koppels Allé 402, 2800 Kgs. Lyngby, Denmark
4
Healthy and Sustainable Built Environment Research Centre, Ajman University, Ajman P.O. Box 346, United Arab Emirates
*
Author to whom correspondence should be addressed.
Buildings 2025, 15(5), 766; https://doi.org/10.3390/buildings15050766
Submission received: 16 January 2025 / Revised: 21 February 2025 / Accepted: 24 February 2025 / Published: 26 February 2025
(This article belongs to the Section Building Energy, Physics, Environment, and Systems)

Abstract

Understanding the relationship between thermal comfort and adaptive behaviour in office environments is important for designing sustainable and occupant-centric buildings. This study investigates the thermal sensation, comfort preferences, and adaptive behaviours of occupants in five Indian and two Lithuanian offices. Indoor environmental parameters were measured, and online thermal comfort surveys were carried out. In total, 274 responses were collected. Differences between the two countries were observed in perception of the indoor thermal environment, comfort preferences, and adaptive behaviours. In the Indian offices, despite experiencing higher temperatures and relative humidity, most occupants reported feeling thermally neutral or slightly cool. In the Lithuanian offices (measured in the heating season), a third of the occupants felt slightly cool and another third slightly warm. Occupants in the Indian offices (limited direct access to temperature control, greater prevalence of business attire) showed a higher preference for adjusting the temperature. The occupants in the Lithuanian offices (access to temperature control, more flexible attire) preferred more frequently to adjust their clothing. Consumption of warm or cold beverages for thermal adaptation was equally preferred in the two countries. About 86% of the occupants who did not choose any adaptations reported being comfortable, compared to 65% of those who did. These findings highlight the associations between adaptive behaviour and thermal comfort, emphasising the need to consider individual preferences, environmental factors, and cultural norms in designing comfortable indoor environments.

1. Introduction

To achieve a more energy-efficient built environment, it is crucial to accurately predict energy performance and implement energy-saving measures already at the design stage. Although this can be achieved through numerical predictions, there is often a substantial difference between building energy calculations and the actual energy consumption, which forms the energy performance gap [1,2,3,4]. Occupant behaviour has been identified as one of the factors responsible for this gap [5]. Actions that building occupants undertake with the purpose of thermal adaptation can have significant consequences for the building’s energy use [6]. For example, the Japanese government’s “Cool Biz” campaign, launched in 2005, demonstrates how changes in dress code together with temperature adjustments can lead to significant reductions in a building’s carbon emissions [7,8,9]. It is therefore important to understand the impact of occupant behaviour on the energy consumption of buildings.
Occupants have a natural tendency to adapt to their environment upon facing discomfort [10]. Various factors contribute to the behavioural patterns of occupants. These can be physiological (e.g., age, sex, Body Mass Index (BMI), etc.), psychological (e.g., thermal perception, thermal history, etc.), or other contextual factors, such as type of the building, climate, season, culture, etc. [11,12,13]. For example, behavioural adaptations were found to vary with season and economic status in residencies in India, with more adaptation seen in residences with lower economic status without access to air conditioning [14]. In a study conducted in 28 office buildings in India, window opening and fan operation significantly influenced comfort conditions in Chennai with a warm-humid climate, but not in Hyderabad with a composite climate [15]. In this study, females, younger occupants, and people with low BMI had significantly higher comfort temperatures than males, older occupants, and obese occupants, respectively [16].
The common adaptations in offices are clothing adaptations, opening/closing windows, increasing/decreasing the temperature through controls, having hot/cold beverages, and adjusting the activity level or position [16,17,18,19]. Occupants exhibit cold or hot adaptive behaviours. Wiping sweat, taking off a piece of clothing, reducing the indoor temperature, having a cold drink, etc. are examples of hot adaptive behaviours, while putting on a piece of clothing, having a warm drink, increasing the indoor temperature, etc. are examples of cold adaptive behaviours [20,21]. In office environments, individuals often face limited choices for adaptation due to the presence of other people [21]. In some offices, there could be limitations or restrictions imposed by the building management on adjusting the environmental controls and windows are often inoperable. Additionally, there may be a lack of awareness and understanding of the existing environmental control systems. Such cases can severely impact the occupants’ thermal comfort and the choice of adaptations. Occupant satisfaction is influenced by the level of personal control over the indoor environmental factors. Occupant comfort and productivity are higher in buildings with easy and unrestricted access to temperature controls and operable windows [22,23,24].
Occupants tend to prioritise the most readily available adaptation, which is also employed more frequently [20]. For example, building occupants in open plan offices prefer adaptations at a personal level, such as changing clothing or having warm/cold drinks. If these adaptations are restricted (e.g., by dress codes), the adjustment of the room temperature may be more desired, potentially leading to increased energy use. However, occupants have different tolerance levels under different circumstances, and they do not always exhibit adaptive behaviour instantly upon facing discomfort [25,26]. Indeed, thermal satisfaction may occur even outside the comfort range specified by relevant standards [14,27].
To improve energy demand calculations and optimise building energy use, it is important to understand occupant behaviour in relation to thermal dissatisfaction [28]. The objectives of this study are to investigate the thermal adaptation behaviour in two countries with different climates, buildings, and cultures (India and Lithuania) using the same methodology, and explore the relationship between thermal adaptations and thermal comfort under these different conditions. The hot climate in southern India studied from May to July presents a context in which occupants frequently adopt cooling strategies [29]. Lithuania’s temperate climate in April allows for studying occupant behaviours in the heating period. This study does not aim to directly compare the two study populations but to investigate thermal adaptation strategies under two different sets of conditions. This allows for a better understanding of how contextual factors such as climate, building design, and culture might influence thermal comfort and related occupant behaviour.

2. Materials and Methods

The study was performed in seven office buildings, five situated in India (IN1–IN5) and two in Lithuania (LT1 and LT2), as detailed in Table 1. The countries were selected to cover two different climates and cultures, which are reflected in the differences in building construction, cultural norms, corporate culture, occupant behaviours, etc. For instance, dress code tends to be stricter in Indian offices compared to the relatively flexible norms observed in Lithuanian offices. One floor in each building was selected for the study. The investigated area in each building included an open plan office with a minimum of 20 employees with individual workstations. Each office had a mechanical ventilation system, and only two offices (IN5 and LT1) had operable windows. To investigate the differences in the occupants’ behavioural adaptations for thermal comfort, data were collected using an online questionnaire survey, indoor environmental measurements, and observations regarding office characteristics.

2.1. Selected Offices

2.1.1. Offices in India

The five offices (IN1–IN5) surveyed were situated in the city of Hyderabad, India (latitude: 17.3850° N, longitude: 78.4867° E). Hyderabad is in the southern region of India, with an elevation of 540 m. It has a population of 10.5 million. The city has a tropical wet and dry climate (Köppen climate classification Aw) bordering with a hot semi-arid climate (Köppen climate classification BSh). Summers are typically hot, with temperatures frequently exceeding 40 °C, while the monsoon season, from June to September, brings substantial rainfall. Winters are mild, with average daytime temperatures around 25 °C, and nighttime temperatures can be below 15 °C. The city’s climate is influenced by its inland location and elevation, leading to moderate humidity levels throughout the year. According to the Indian National Building Code, the climate is composite, with an average annual maximum temperature of 32.7 °C and an average annual minimum of 21.4 °C [30,31,32].
The selected offices reflect the Indian office building stock: IN4 is a newly constructed building, IN2 and IN5 were constructed a decade ago, while IN1 and IN3 are approximately 20 years old. All of the buildings are reinforced concrete structures in high-density urban neighbourhoods with the exception of IN4, which is located in suburban area. The office spaces considered in the study were all open plan offices. Smaller individual offices (cabins) and meeting rooms, often present along the outer walls, were not considered in this study. The details of each office space are given in Table 1. In offices IN1-IN4, the temperature control was delegated to one person, usually the janitorial staff. The employees in the open plan area had to request this person to alter the temperature or the fan speed of the air-conditioning system. In office IN5, an air-conditioning controller was available to the occupants. Since the offices IN2 and IN5 were small and had low occupancy, one 4-way cassette A/C was installed in the open plan area. Variable Refrigerant Flow (VRF) systems were installed in three of the offices (IN1, IN3, and IN4). VRF is the most common type of HVAC system in offices and commercial spaces in the city, and is often used in spaces with high occupancy. The system utilises one outdoor unit connected to multiple indoor units. In offices IN1-IN4, the occupants in the open plan area did not have direct access to the windows, but they had a view to the outdoors through the curtain wall of the cabins (individual offices).
Table 1. Description of the offices.
IN1IN2IN3IN4IN5LT1LT2
Monitoring
period
23 May
to 29 May, 2022
31 May
to 6 June, 2022
23 June
to 29 June, 2022
4 July
to 10 July, 2022
21 July
to 28 July, 2022
3 April
to 12 April, 2023
24 April
to 30 April, 2023
SeasonSummerSummerMonsoonMonsoonMonsoonSpring
(heating)
Spring (heating)
Floor number of the building/Total
number of floors
4/48/129/155/52/43/43/5
Floor area (m2)46210755711151101096600
No. of workstations102251002504523546
No. of employees 8523981652512850
Occupant density (m2/person)5.44.75.76.84.48.612
HVAC controlOn
request
On
request
On
request
On
request
Direct 1Direct 1Direct 1
Flexibility in clothingNoYesNoNoNoYesYes
Operable windows (open plan offices)NoNoNoNoYesYesNo
1 Can directly control using the remote control or the nearest thermostat.
The occupants in these buildings were encouraged to wear formal business attire. A specific dress code is not mandated; some flexibility within reasonable limits is permitted, allowing for attire such as jeans and t-shirts. For women, acceptable clothing for offices both culturally and professionally include the traditional chudidhar-kameez (also called salwar-kameez). A dupatta (light-weight scarf) is worn as a part of the chudidhar-kameez ensemble. It can cover the upper body or the head. The dupatta can also be used for easy clothing adaptation in the indoor environment [33]. Another attire often preferred by women in offices is the kurti-leggings or kurti-jeans combination.

2.1.2. Offices in Lithuania

The two offices surveyed, LT1 and LT2, were situated in the cities of Vilnius (latitude: 54.687157° N, longitude: 25.279652° E), which is at an elevation of 112 m, and Kaunas (latitude: 54.898521°N, longitude: 23.903597° E) at an elevation of 48 m, respectively. Vilnius has a population of about 700,000, while Kaunas has about 300,000. Overall, the climate in Lithuania can be classified as humid continental (Köppen climate classification Dfb), with cold winters and mild summers. Winters often have temperatures below freezing, with snow common from December to February, while summers are relatively short, with daytime temperatures typically ranging between 15 °C and 25 °C. Precipitation is distributed throughout the year, with the highest amounts in summer and autumn. The climate is influenced by both maritime and continental weather patterns, leading to significant seasonal temperature variation. Vilnius and Kaunas, the two surveyed cities, experience similar weather conditions, with colder temperatures in winter and pleasant, milder temperatures during the summer months. Vilnius has an average annual maximum temperature of 13 °C and an average annual minimum of 4 °C [34], while Kaunas has an average annual maximum temperature of 13 °C and an average annual minimum of 5 °C [35].
The selected offices are a part of typical, newly constructed office buildings in Lithuania. They feature concrete constructions and high-glazing facades. These offices had open plan layouts with additional cabins and conference rooms. District heating was the primary heating system in both buildings. The building in Kaunas (LT2) could also be heated and cooled using ground source heat pumps. Thermally Activated Building Systems (TABS) and built-in fan convectors were used for both heating and cooling. Radiators and underfloor heating were used in common areas. During periods of extra demand in the summer, additional air source heat pumps could be used for cooling. The office had a mechanical variable air volume (VAV) ventilation system with heat recovery. The office in Vilnius (LT1) employed air source heat pumps for cooling. It was equipped with VAV systems integrated into the main VRF system. The Vilnius office relies on standard radiator heating. Both offices have centralised control systems for cooling and heating, which are regulated based on outdoor temperature sensors. Furthermore, individual temperature adjustments can be made in different areas by the employees. All occupants in the LT1 office had access to operable windows. In the LT2 office, the windows were not operable, but the occupants had a view to the outdoors, as they were situated right next to the glazed façade. The employees were flexible regarding their attire, typically adhering to casual office wear.

2.2. Data Collection

The data collection period in the Indian offices lasted from May to July 2022, and in the Lithuanian offices it was in April 2023. An online survey covering thermal perception, adaptive behaviour, and building related symptoms (BRS) was sent to all employees in each of the seven offices over the one-week period during which measurements of the thermal environment were conducted. Every morning during this period, the employees received an email from their respective human resources department reminding them to fill the survey. The survey was filled once per employee. In the Indian offices, the response rate was 58.6%. The average age of the 232 respondents was 31.6 years (SD 7.9 years). Among the respondents, 173 were men and 59 were women. The average Body Mass Index (BMI) was 24.9 kg/m2 (SD 4.5 kg/m2). In the Lithuanian offices, the response rate for the survey was 23.6%. The average age of the 42 respondents was 31.2 years (SD 6.4 years). Among the respondents, 25 were men and 17 were women. The average BMI was 21.0 kg/m2 (SD 3.2 kg/m2) (Table 2). The mean clothing insulation for female occupants (Icl = 0.77 clo), and for male occupants (Icl = 0.69 clo) in the Indian offices was obtained by summing the clothing insulation values for each garment in a typical ensemble taken from the literature [36]. The clothing insulation value (Icl = 0.7 clo) for the Lithuanian work environment was used as specified by the appropriate standard [37]. The variation in the clothing was similar across all offices. All employees had desk jobs; therefore, the considered activity level was 1.2 MET, in both Indian and Lithuanian offices.

2.2.1. General Overview of the Questionnaire

The online survey tool, Zoho Survey, was used for the study. In both countries, the survey was conducted in English. The survey consisted of four sections. Section 1 gathered basic information about the individual, such as age, gender, height, weight, work timings, job title, work desk location, etc. Section 2 gathered data about the occupants’ perception of the indoor environment at the time of filling the questionnaire (i.e., “right now”). The section included questions regarding discomfort due to light, noise, air quality, and the thermal environment. The ASHRAE seven-point thermal sensation scale [38] was used to evaluate the thermal environment by the occupants. The comfort questions regarding thermal comfort and air quality had four answer choices from “Very uncomfortable” to “Very comfortable”. The thermal preference question had five answer choices ranging from “Much warmer” to “Much cooler” (Table 3). Section 3 gathered information similar to Section 2, but with a focus on the whole year, which depended on the memory recall of the occupants. Each question had the answer choices separately for each season specific to the two countries (Table 4). Section 4 gathered data about the adaptive behaviour, BRS (i.e., fatigue, nausea, headaches, etc.), and general dissatisfaction at the work desk (i.e., office lighting, dust, etc.).
The questions about adaptive behaviour focused on memory recall of the occupants. The list of adaptations included adjusting clothing before coming to the office, adjusting clothing while in the office, request to increase the temperature, request to decrease the temperature, have a warm drink, have a cold drink, and use of a personal heater/fan. The occupants were asked how often they would opt for a particular adaptation reflecting the average behaviour over a given season. The survey in the Indian offices asked the occupants to assume the worst season that they have experienced in terms of need for adaptive behaviour. The summer season is generally the hottest and most uncomfortable in this part of India, which is regarded as the worst season. The survey in the Lithuanian offices had two parts to the question about adaptations: summer and winter, with the same answer choices. In the buildings in Lithuania, the summer season is regarded as the most challenging in terms of thermal satisfaction. Data pertaining to the winter season is provided in the Supporting Information. Additionally in the Lithuanian survey, the “adjusting clothing while in office” option was split into “adding a piece of clothing” and “removing a piece of clothing” (Table S1).
The survey respondents were provided with four response choices for each adaptation: “Never”, “Few times a month”, “Few times a week”, and “On a daily basis”. For analytical purposes, responses “Never” and “Few times a month” were consolidated into “Almost never” to denote adaptations that were rarely preferred, while “Few times a week” and “On a daily basis” were consolidated into “Frequently”. Similarly, the “Very uncomfortable” and “Slightly uncomfortable” answer choices were consolidated and considered as “Uncomfortable”, and the “Slightly comfortable” and “Very comfortable” answer choices were consolidated into “Comfortable”.
The survey questions were prepared based on a review of the literature. Five experts in indoor environmental science tested the questionnaire and assessed the relevance of each question using a 4-point scale: “Not relevant”, “Somewhat relevant”, “Quite relevant”, and “Highly relevant”. “Quite relevant” and “Highly relevant” were assigned the value of 1. “Not relevant” and “Somewhat relevant” were assigned the value of 0. The Content Validity Index (CVI) for each item was determined by dividing the number of experts in agreement by the total number of experts [39]. The questions which had low CVI (less than 1.0), were either modified or removed. The average CVI across all the questions (CVI/Ave) indicates the proportion of items that achieved votes of high relevance. For a panel of five experts, the CVI/Ave is considered acceptable if it is 0.80 or larger [40]. For our final survey, the value is 0.84. The indicator CVI/UA is the proportion of items receiving “relevant” rating by all experts, i.e., there is a universal agreement (UA) among the experts. This index is considered acceptable for a panel of five experts if the value is 0.80 or larger [39]. For our final survey, the value is 0.81.

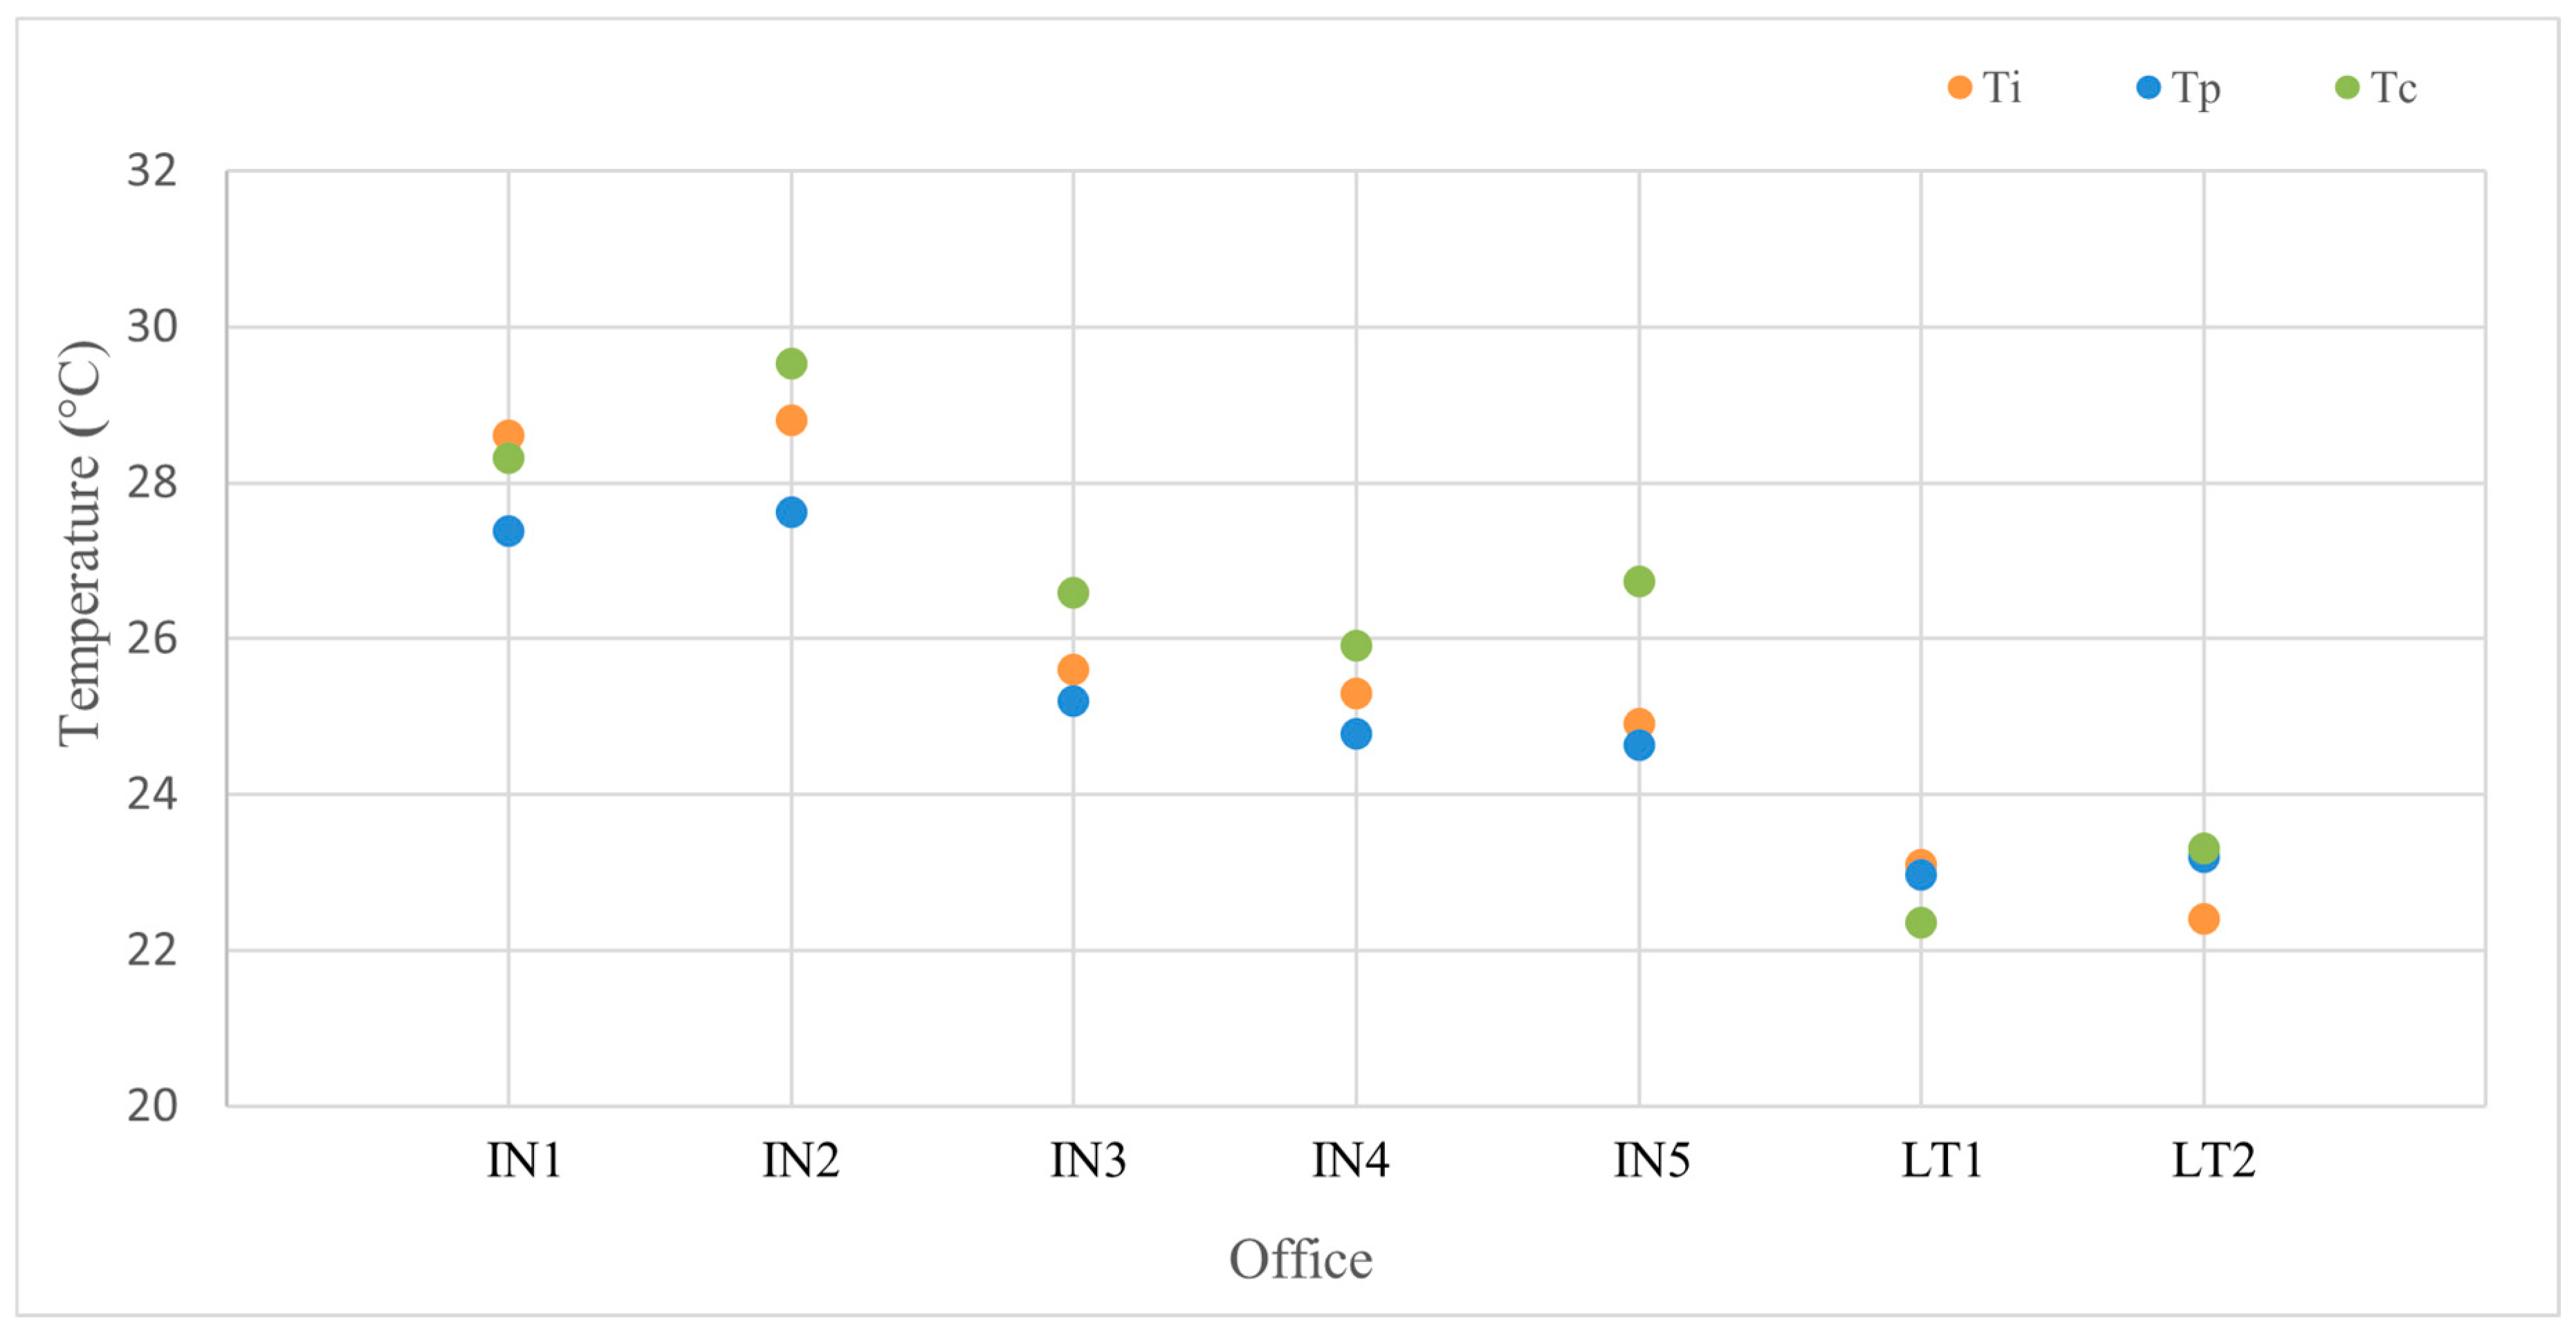
2.2.2. Objective Measurements

Air temperature, relative humidity, and concentrations of CO2 were measured using the IC-Meter Indoor Climate Monitors (IC-Meter, Aalborg, Denmark). The devices were connected to the internet via the GPRS (General Packet Radio Service), which allowed the data to be transmitted to a server and monitored anytime. In each of the offices, eight monitors were placed in the open plan area for a period of one week. The instruments recorded data every five minutes. The instruments were placed on the work desks at a height of 0.8 m from the ground [38]. The sensors were placed around the office in a way that the largest distance from any occupant to the nearest sensor was less than 1 m in IN2 and IN5 (small floor area offices) and 5 m in the rest of the offices (large floor area offices). The sensors inside the IC-Meters, their measurement range, and accuracies are detailed in Table 5. The timestamps on each of the survey responses were used to identify the corresponding measurement data, which represented the environment nearest to the person filling the survey. These data were used for an analysis of the associations between the measured values and survey responses to the “right-now” questions (Section 2 of the questionnaire).

3. Results and Discussion

3.1. “Right-Now” Survey Questions and Measured Data

About 46% of occupants in the Indian offices reported feeling thermally “neutral”, while around 22% indicated feeling “slightly cool” (Figure 1). Conversely, only 28% of occupants reported thermal discomfort despite the relatively high indoor temperatures (Figure 2, Table 6). Indian occupants are accustomed to the warm and humid climate, which likely increases their tolerance of higher temperatures and reduces discomfort under such conditions. This can be attributed to the principles of adaptive thermal comfort theory [41,42]. Approximately 44% of occupants preferred a slightly cooler thermal environment, while 31% preferred it to remain unchanged (Figure 3). At the time of filling the survey, the average indoor temperature in Indian offices was 26.6 °C with an average relative humidity of 53.4%.
In the Lithuanian offices, approximately 33% of occupants reported feeling “slightly cool”, while another 33% reported feeling “slightly warm”, with only 21% indicating feeling “neutral” (Figure 1). Approximately 35% of occupants reported thermal discomfort (Figure 2). Around 48% of occupants preferred their environment to remain unchanged, while 33% preferred it to be slightly warmer (Figure 3). At the time of filling the survey, the average indoor temperature was 22.8 °C and the average relative humidity was 34.2% (Table 6).
Table 7 shows the occupants’ thermal sensation and thermal comfort responses to the “right-now” questions. The thermal sensation vote (also referred to as the Actual Mean Vote, AMV) and the thermal comfort (Actual Percentage of Dissatisfied, APD) results from the survey reflect the conditions during the brief period of time when the survey was completed. The Predicted Mean Vote (baseline PMV) and the Predicted Percentage of Dissatisfied (PPD) were calculated using the online thermal comfort tool developed by the University of California, Berkeley, based on the ASHRAE 55 standard [38]. Since the radiant temperature and air speed were not measured, the mean radiant temperature (MRT) was assumed to be equal to the air temperature (T_air), and an average air speed of 0.1 m/s was assumed. It should be noted that pedestal/wall-mounted fans were employed in areas of insufficient air movement in offices IN1 and IN3. However, the effect of these fans on overall air movement was minimal as they only affected the occupants sitting right in front of them and they were not used all the time. Substantial differences were observed between the predicted thermal comfort indicators and the occupants’ responses to the “right-now” questions.

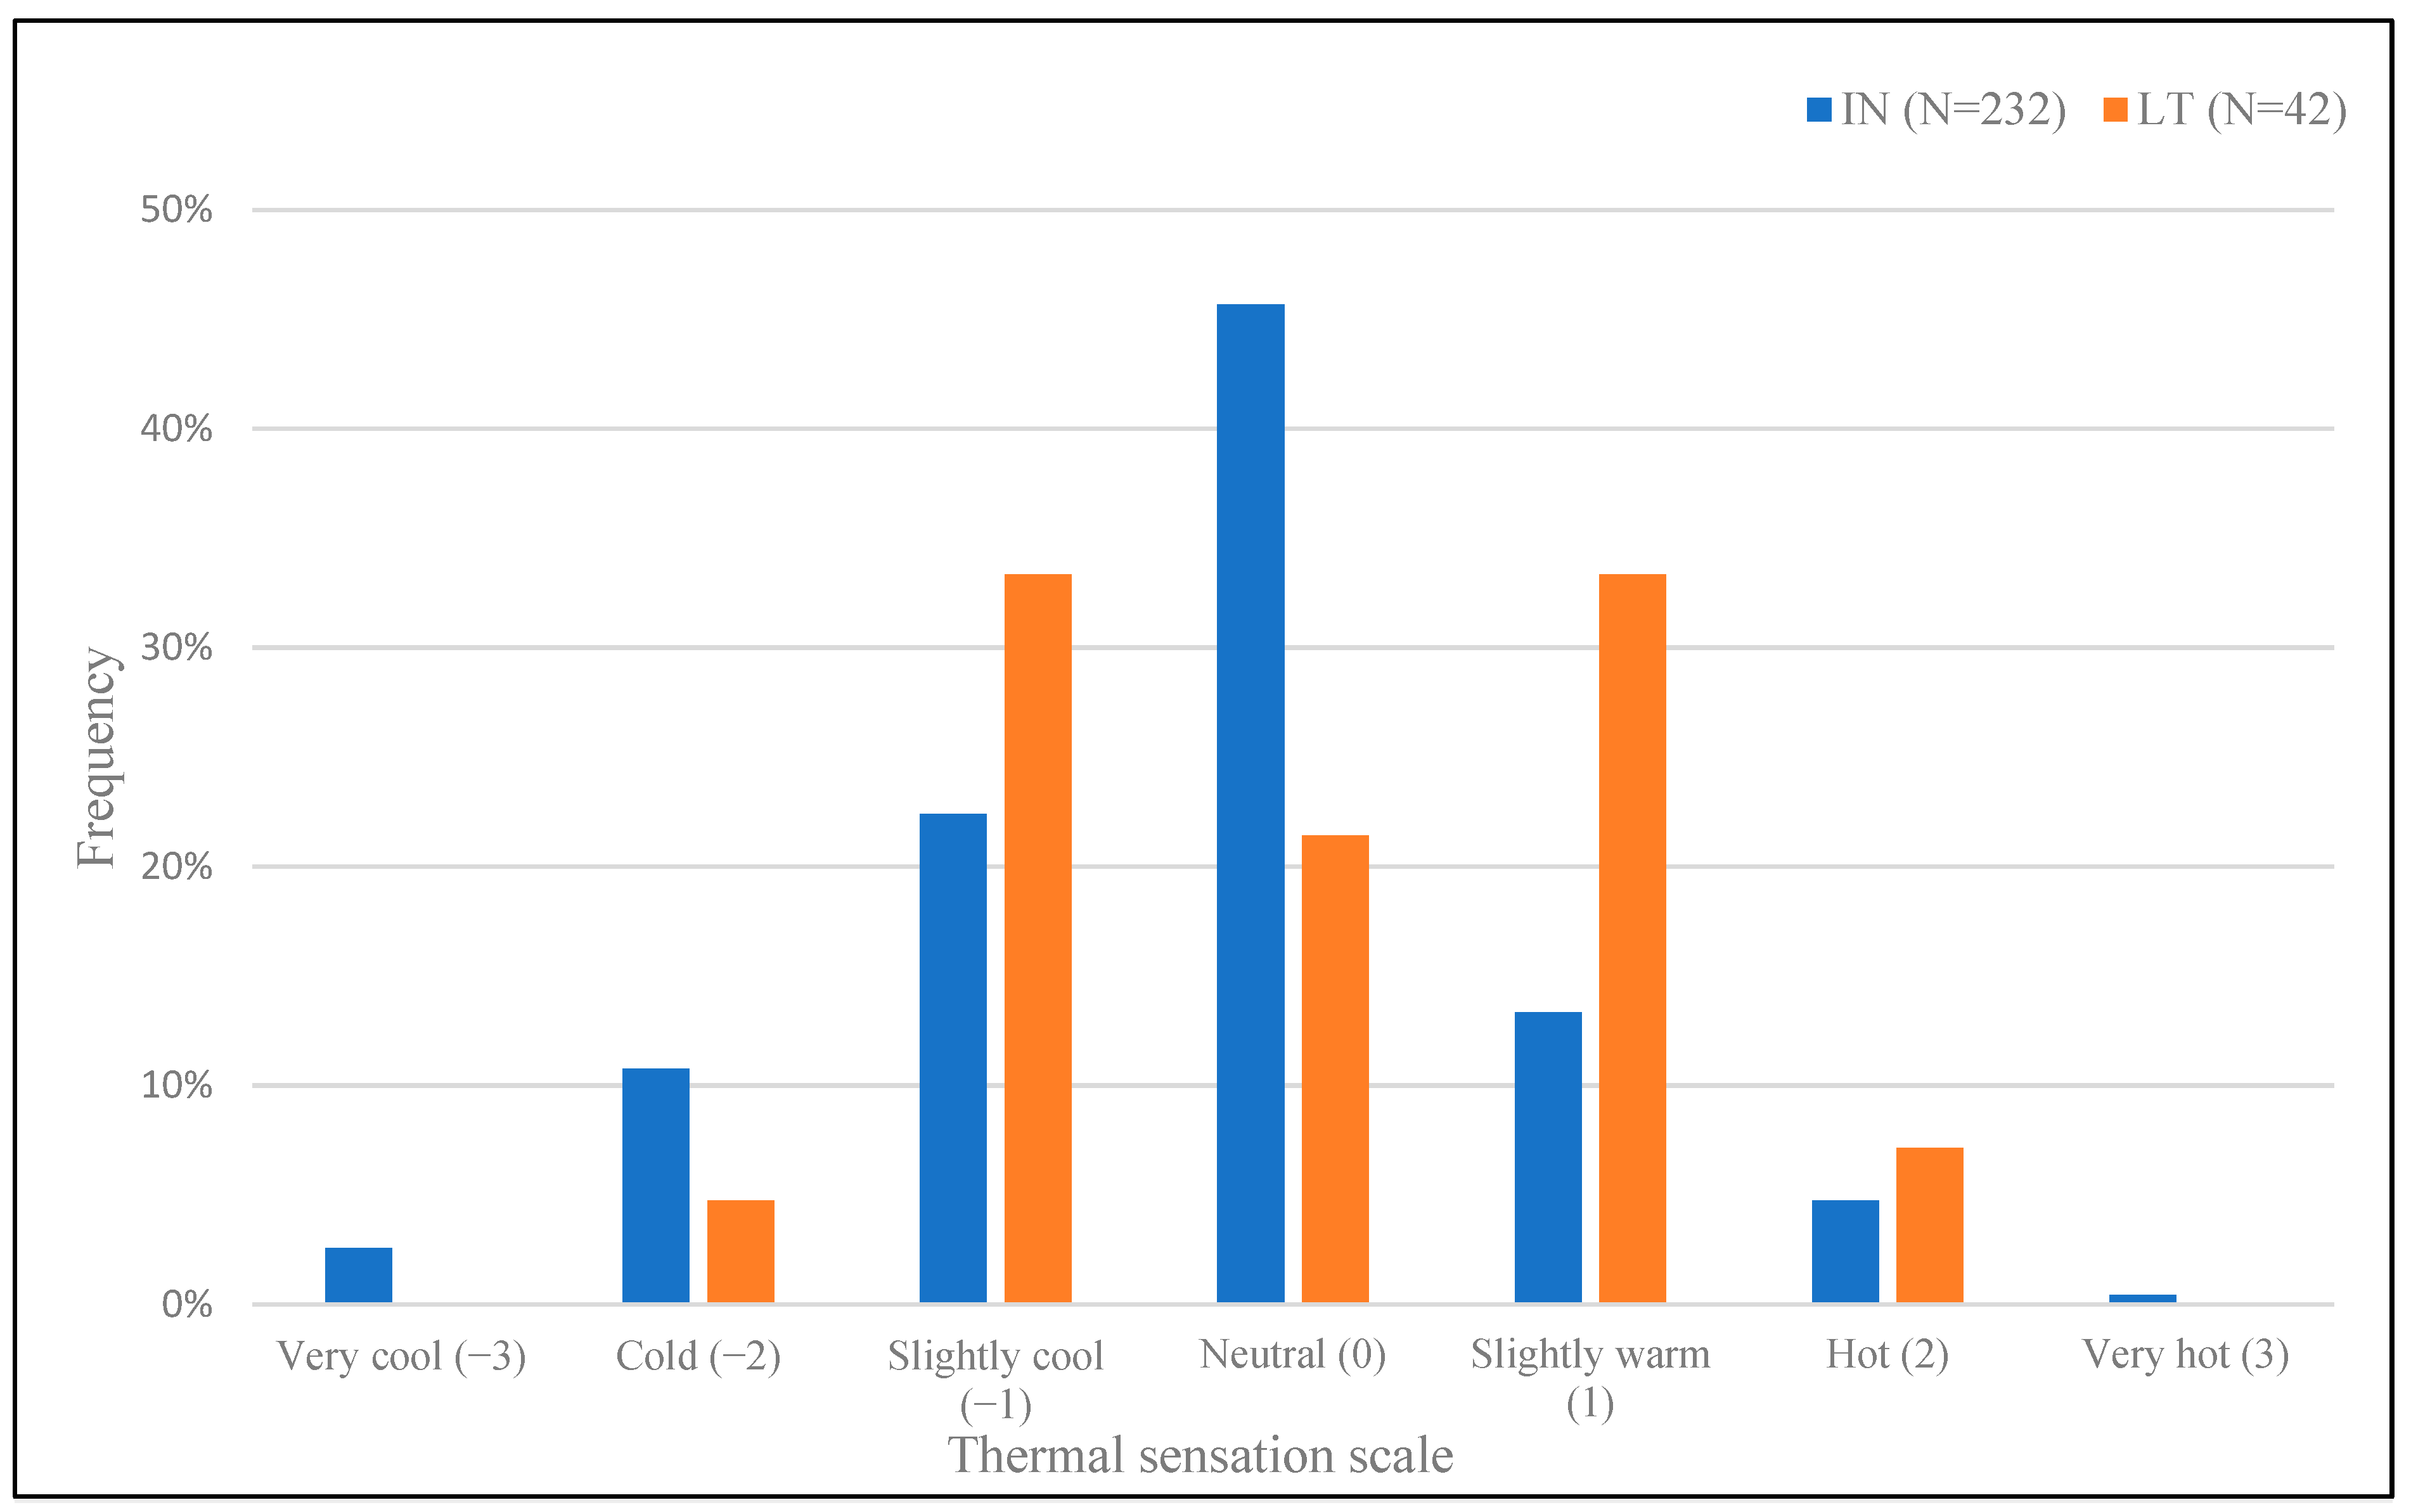
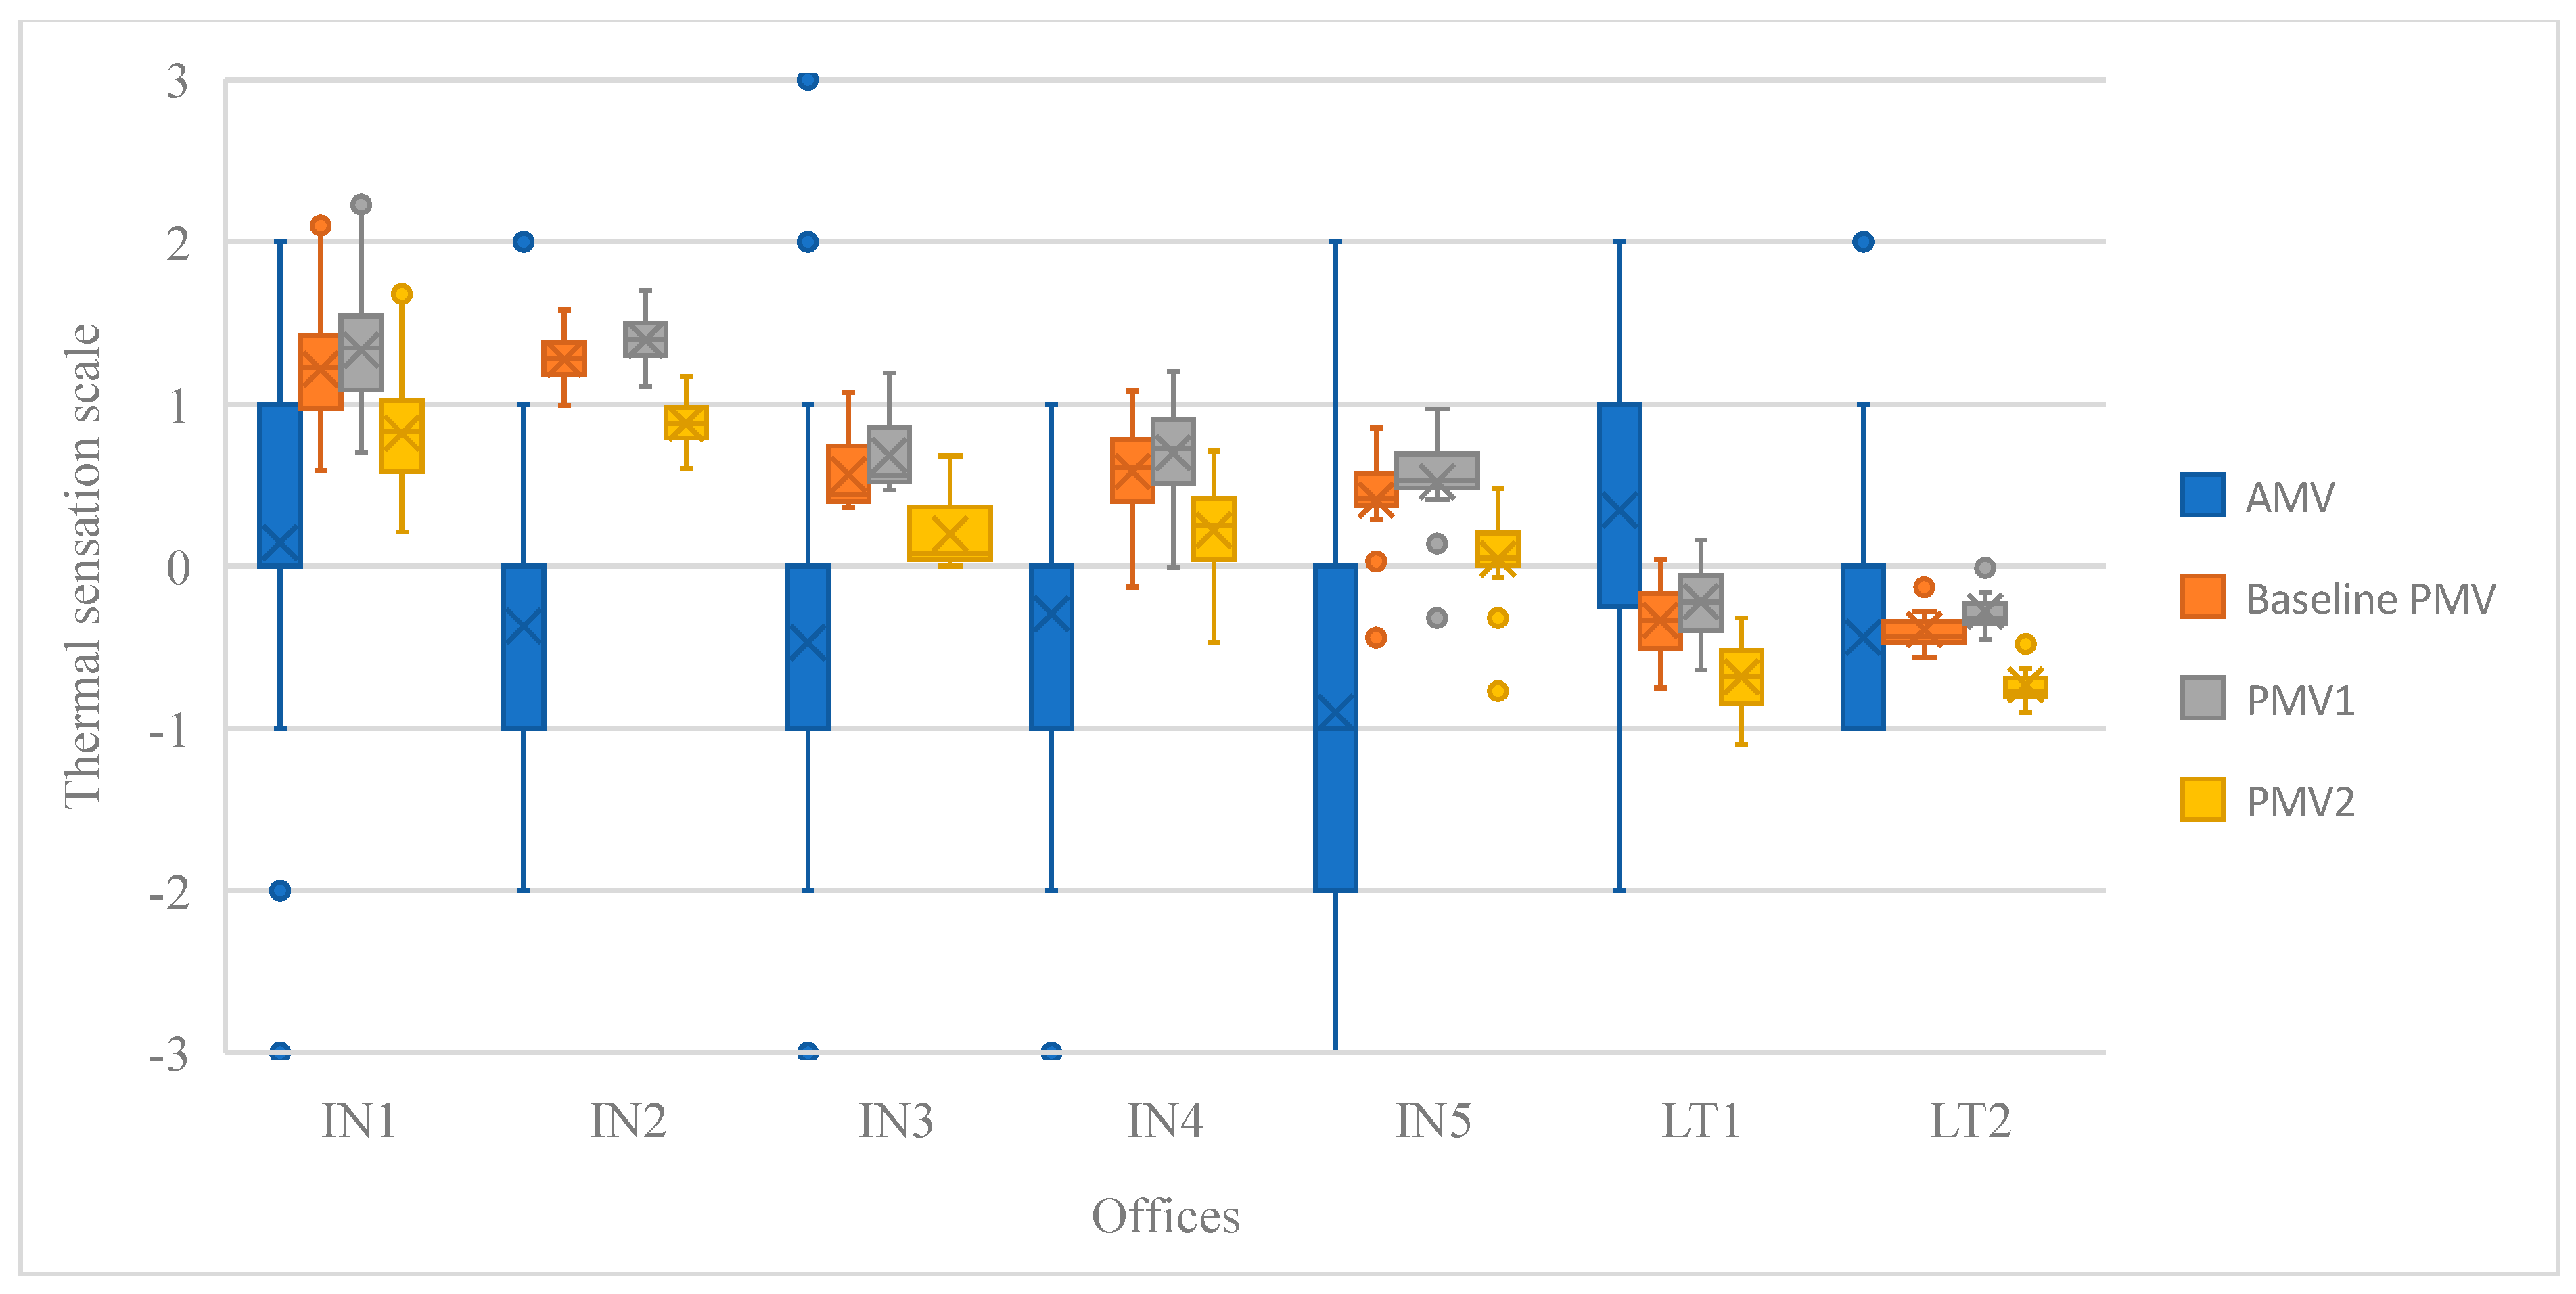
3.1.1. Thermal Sensation of the Occupants

In the Indian offices, the mean AMV ranged from −0.9 to 0.1, indicating neutral to cool thermal sensation. The mean baseline PMV was between 0.4 and 1.3 indicating that the occupants felt neutral to slightly warm (Figure 4). For the occupants in LT1, the mean AMV was 0.3 and the mean baseline PMV was −0.3 indicating the thermal conditions to be close to neutral. Similarly, the mean AMV and mean baseline PMV in LT2 were both −0.4, indicating the thermal conditions to be close to neutral.
The actual evaluations of thermal comfort by occupants (AMV) exhibit a large variability within the different office environments. For instance, in office IN1, the AMV values range from −3.0 to 2.0 with a mean of 0.15, and an IQR from 0.0 to 1.0. This pattern is consistent across all offices, highlighting the subjective nature of occupant comfort assessments (Figure 4). The PMV values show a narrower range, indicating a more uniform prediction of thermal comfort based on environmental parameters (some assumed) such as radiant temperature, relative humidity, and air speed. As expected, there was a significant discrepancy between predicted comfort levels and actual occupant experiences. The difference between AMV and PMV was relatively large in the Indian offices (absolute difference between 0.88 and 1.64), and smaller in the Lithuanian offices (0.68 and 0.05). This occurs because comfort perceptions are influenced by various factors, not limited to indoor environmental conditions, building characteristics, occupant density, male/female ratio, dress code, possibilities for adaptive behaviour, and individual differences between occupants. Moreover, the lack of measured radiant temperature and air speed and the use of standard values in the calculation of PMV add further uncertainties. We have therefore conducted a sensitivity analysis where we calculated the PMV for two additional scenarios to provide a range of possible PMV values, with the expectation that the actual values lie between these:
  • PMV1 (air speed = 0.1 m/s, increased mean radiant temperature by 1 °C):
This scenario assumes a lower air speed of 0.1 m/s and a mean radiant temperature (MRT) 1 °C higher than the air temperature. It is intended to reflect an indoor environment during transitional seasons or in spaces with active heating, such as in Lithuanian offices during the spring.
  • PMV2 (air speed = 0.2 m/s, decreased mean radiant temperature by −1 °C):
This scenario considers a higher air speed of 0.2 m/s and a mean radiant temperature 1 °C lower than the air temperature. It aims to represent an indoor environment with increased ventilation, air conditioning or additional air movement, such as in Indian offices during the summer.
For all Indian offices, the PMV1 scenario resulted in a uniform increase in average PMV by 0.1 compared to the baseline (Table S2). The PMV2 scenario showed a uniform decrease in average PMV by 0.4, resulting in a predicted thermal sensation closer to thermal neutrality and a decreased gap between AMV and PMV. For the Lithuanian offices, the PMV1 scenario yielded a slight increase of 0.1 in average PMV compared to the baseline. The PMV2 scenario resulted in a decrease in average PMV by 0.4 for LT1 and 0.3 for LT2, resulting in a predicted thermal sensation farther from thermal neutrality and an increased gap between AMV and PMV. Overall, however, MRT and air speed (within the reasonable ranges selected) have a relatively small effect on the overall trends observed for thermal sensation (Figure 4).

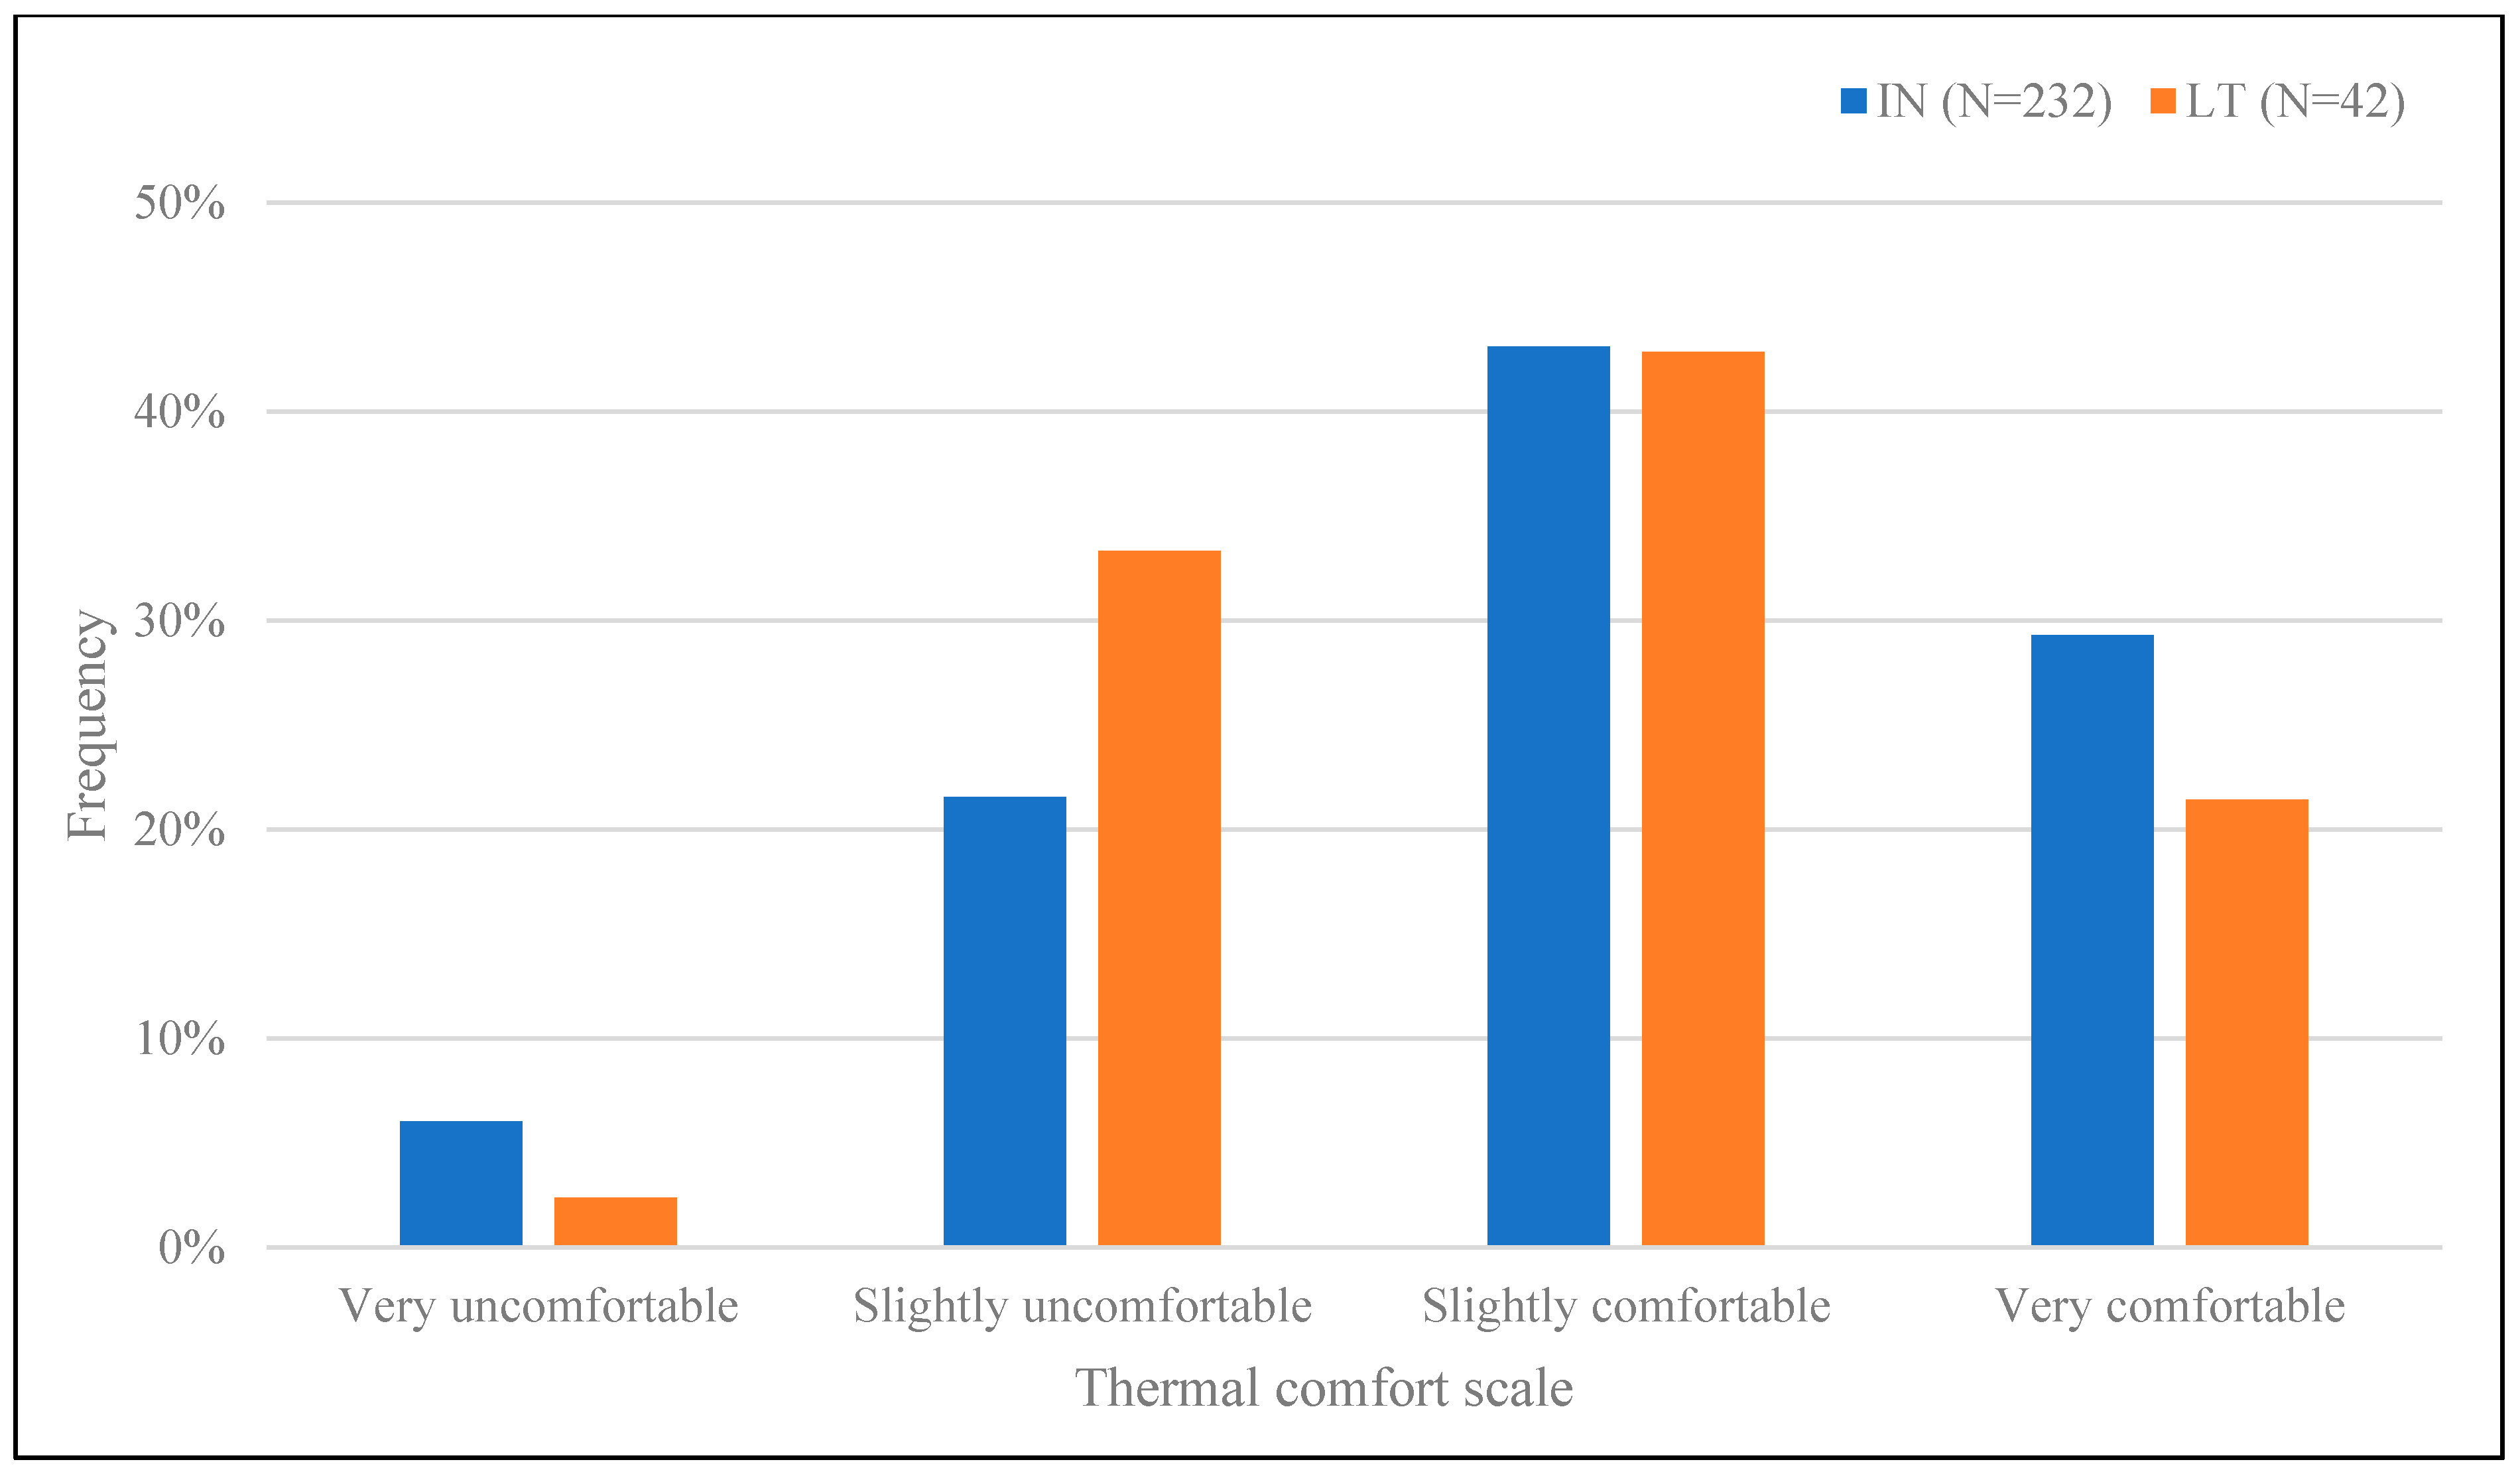
3.1.2. Perception of Thermal Comfort

The Indian offices exhibited APD between 17% and 45% (Table 7), exceeding what would be predicted based on measurements (PPD between 10% and 39%). A significant proportion of the occupants found the thermal conditions uncomfortable. The Lithuanian offices, characterised by lower indoor temperatures and relative humidity, had APD 23% and 56%, while the corresponding PPD was 8% and 9%, respectively, again indicating a lower predicted dissatisfaction based on standard thermal comfort models. The comfort temperature can be defined as the temperature at which most occupants would feel comfortable. It can be calculated using the Griffiths method [43], which is given by the following equation:
Tc = Ti + (0 − TSV)/G
where
Tc—comfort temperature (°C)
Ti—measured indoor air temperature at the time of filling the survey (°C)
TSV—thermal sensation vote, AMV
G—Griffiths constant (0.5 °C−1)
The comfort temperature (Tc) was calculated for each of the 274 occupants individually using their thermal sensation during the survey and the corresponding measured air temperature at the time when the survey was filled in. Figure 5 shows the average measured indoor air temperature at the time of filling the survey (Ti), average thermal comfort temperature (Tc), and average preferred temperature (Tp; see Section 3.1.3 “Thermal Preference of Occupants”) in each office. The comfort temperature aligned relatively well with the average indoor temperature. The comfort temperature was 0.7–1.8 °C higher in IN2 compared to IN5, while it was 0.3 °C lower in IN1 (Figure 5). The average Tc was 0.7 °C lower than the average indoor temperature in LT1, but it was 0.9 °C higher in LT2.

3.1.3. Thermal Preference of Occupants

Based on the Thermal Preference Vote (TPV) (Table 4), 44% of the Indian occupants preferred a slightly cooler environment and 31% preferred unchanged conditions (Figure 3). In the Lithuanian offices, 48% of occupants preferred unchanged conditions, while 33% preferred slightly warmer conditions. Differences in the preferences are caused by the observed temperatures and other factors such as climate, cultural norms, and individual comfort preferences. For instance, the survey in India was conducted during the warm months (May to July), while the Lithuanian survey was conducted in April with relatively cool outdoor temperatures. The preferred temperature was calculated using the following Griffiths method [43]:
Tp = Ti + (0 − TPV)/G
where
Tp—preferred temperature (°C)
Ti—measured indoor air temperature at the time of filling the survey (°C)
TPV—thermal preference vote, TPV
G—Griffiths constant (0.5 °C−1)
The preferred temperature (Tp) was calculated for the 274 occupants individually using their thermal preference votes during the survey and the corresponding measured air temperature at the time when the survey was filled in (Figure 5). In the Indian offices, the average preferred temperatures (ranging from 24.6 °C to 27.6 °C) were lower than the measured indoor air temperatures at the time of filling the survey (ranging from 24.9 °C to 28.8 °C) and lower than the comfort temperatures (ranging from 25.9 °C to 29.5 °C). The difference between the preferred temperature and indoor air temperature was between 0.3 and 1.2 °C and the difference between the preferred temperature and comfort temperature was between 0.9 and 2.1 °C. The preferred temperatures in LT1 were similar to the indoor air temperature (higher than the comfort temperature), while in LT2 it was higher than the indoor air temperature (similar to the comfort temperature). Occupants in the IN3, IN4, IN5, and LT1 offices preferred temperatures close to the actual indoor temperatures.
Measured indoor temperatures, comfort temperatures, and preferred temperatures follow similar trends, being highest in IN1 and IN2 where both indoor and outdoor temperatures were the highest, followed by IN3, IN4, and IN5, and lowest in LT1 and LT2 where the indoor and outdoor temperatures were the lowest. The Pearson correlation coefficient between Tc and Tp is 0.65 (p = 0.000). The indoor temperature is strongly correlated with Tc and Tp, with Pearson’s correlation coefficients of 0.69 and 0.73, respectively, both highly significant (p = 0.000). These results may be influenced by several factors, including climatic differences, as well as building design, HVAC systems, cultural norms, and adaptability (see Section 3.1.4 “Adaptive Thermal Comfort Model”).

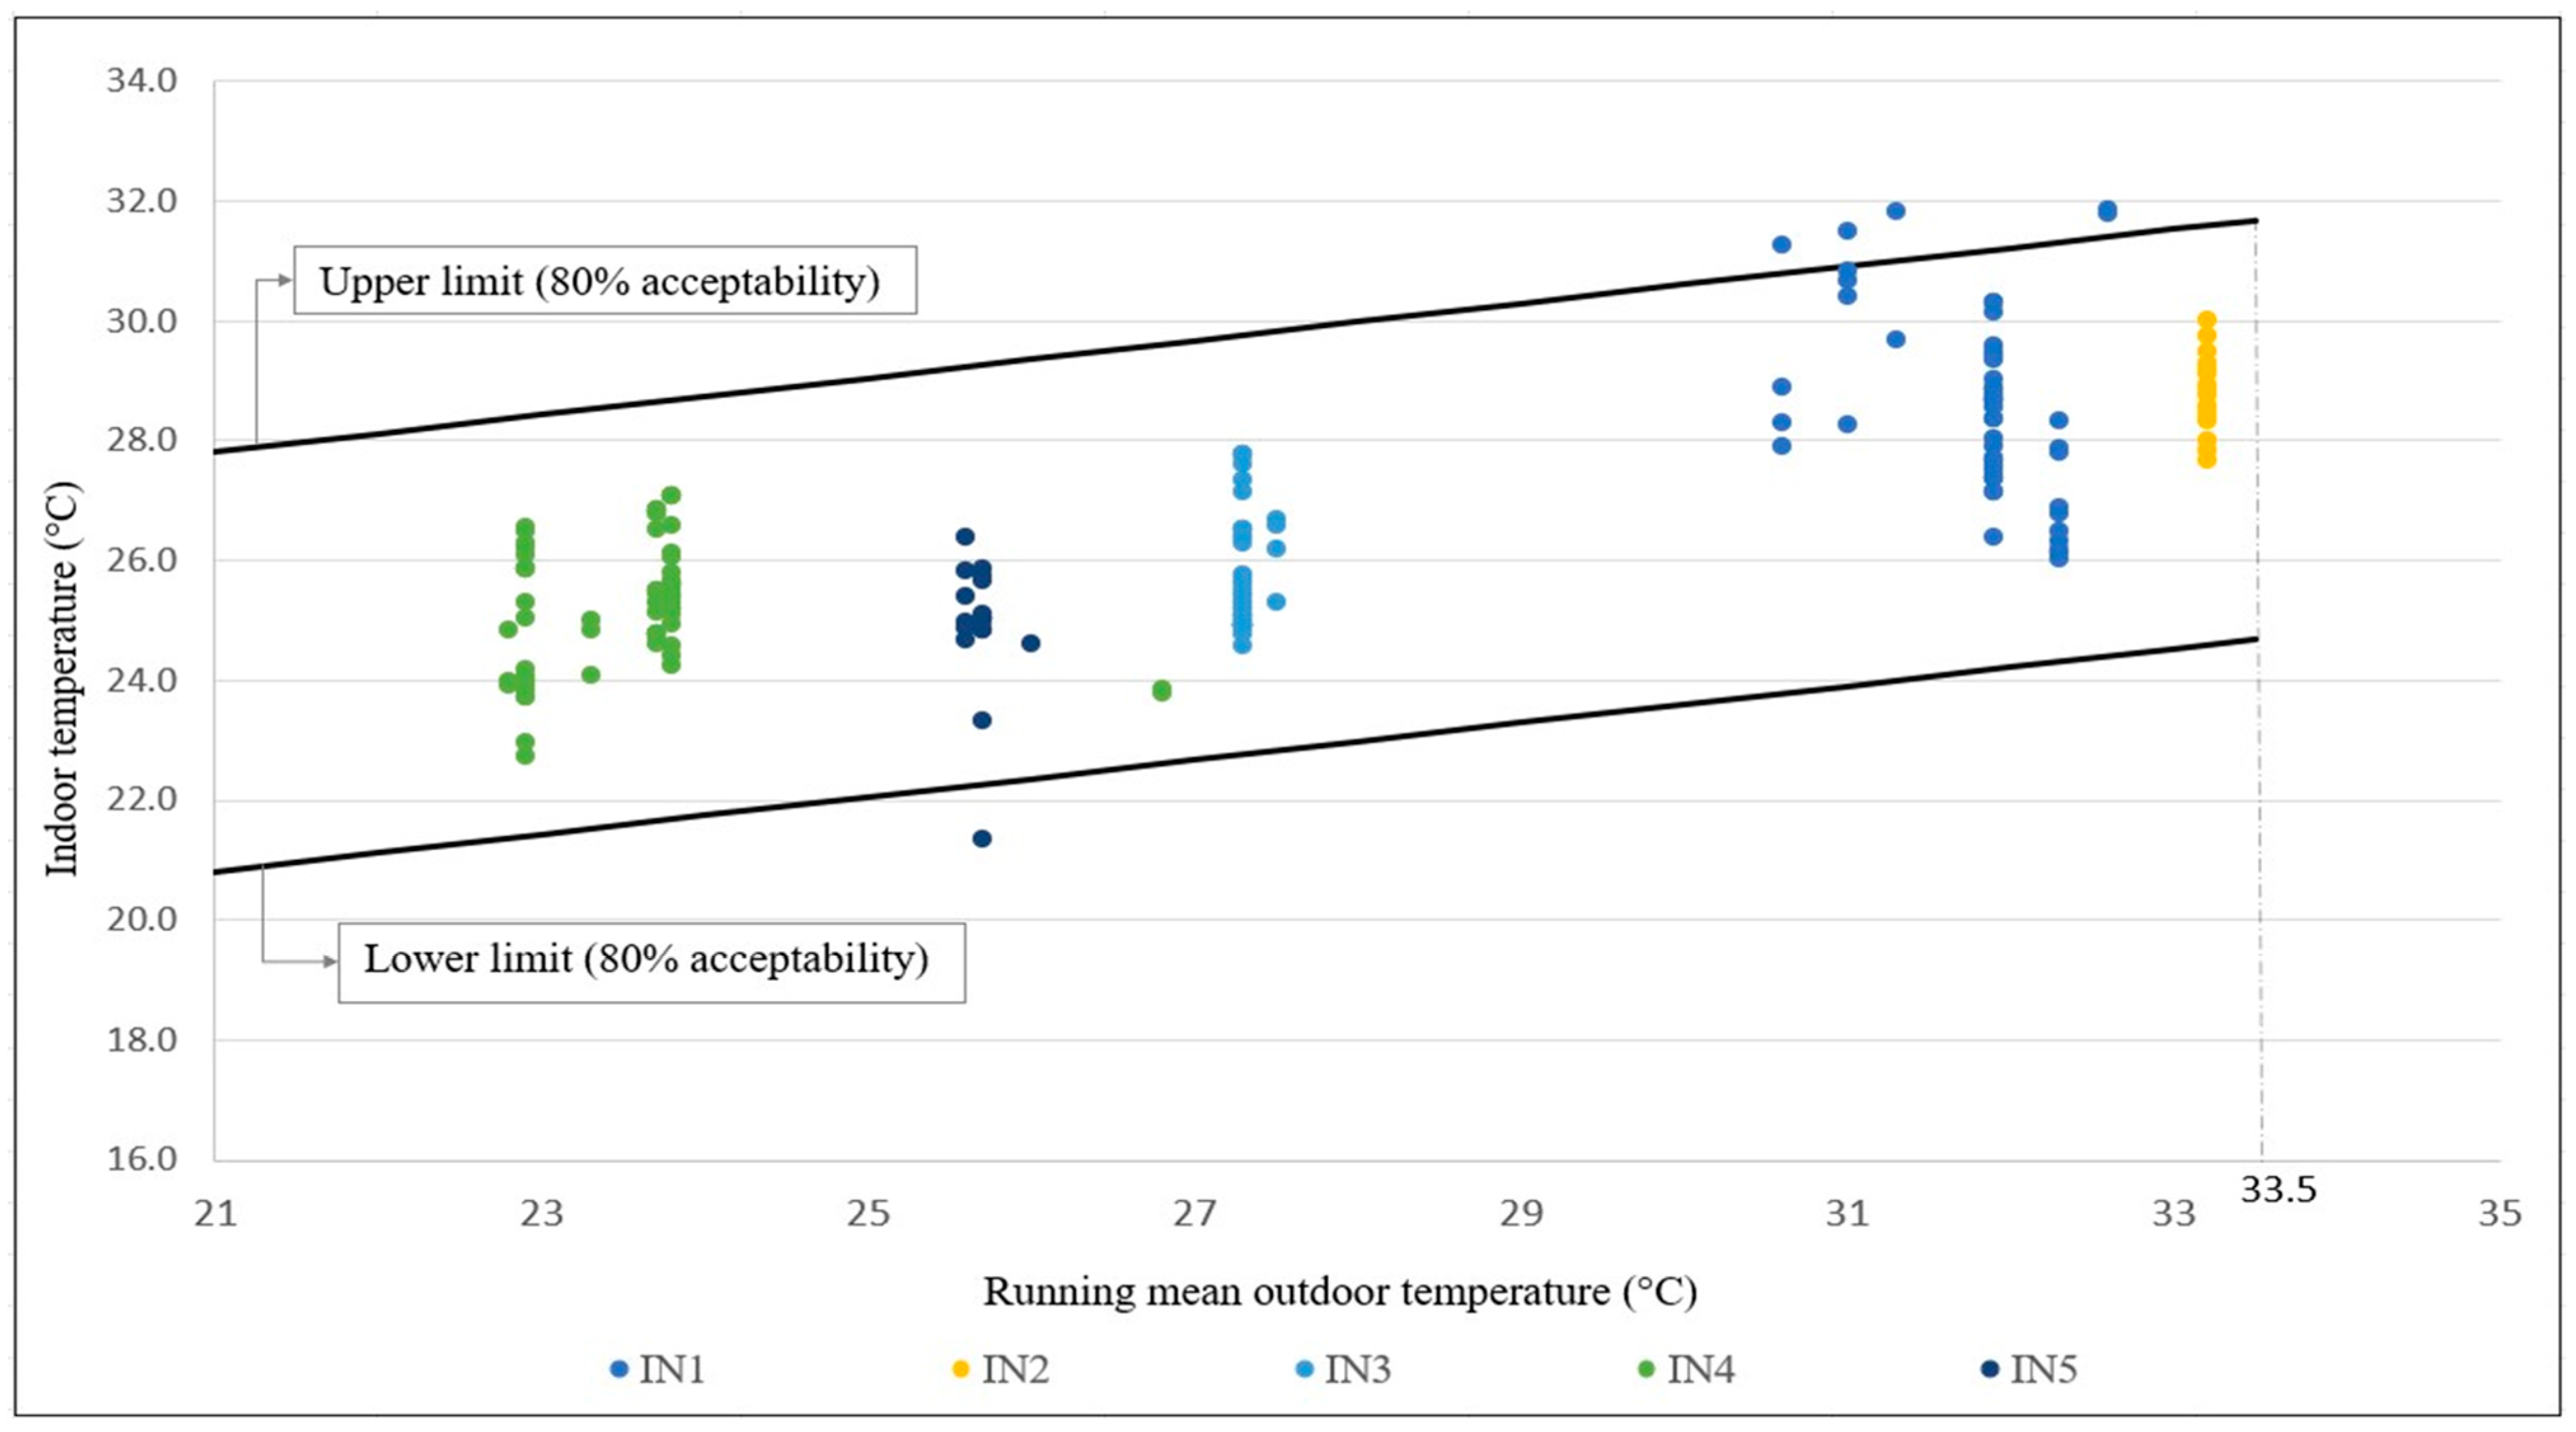
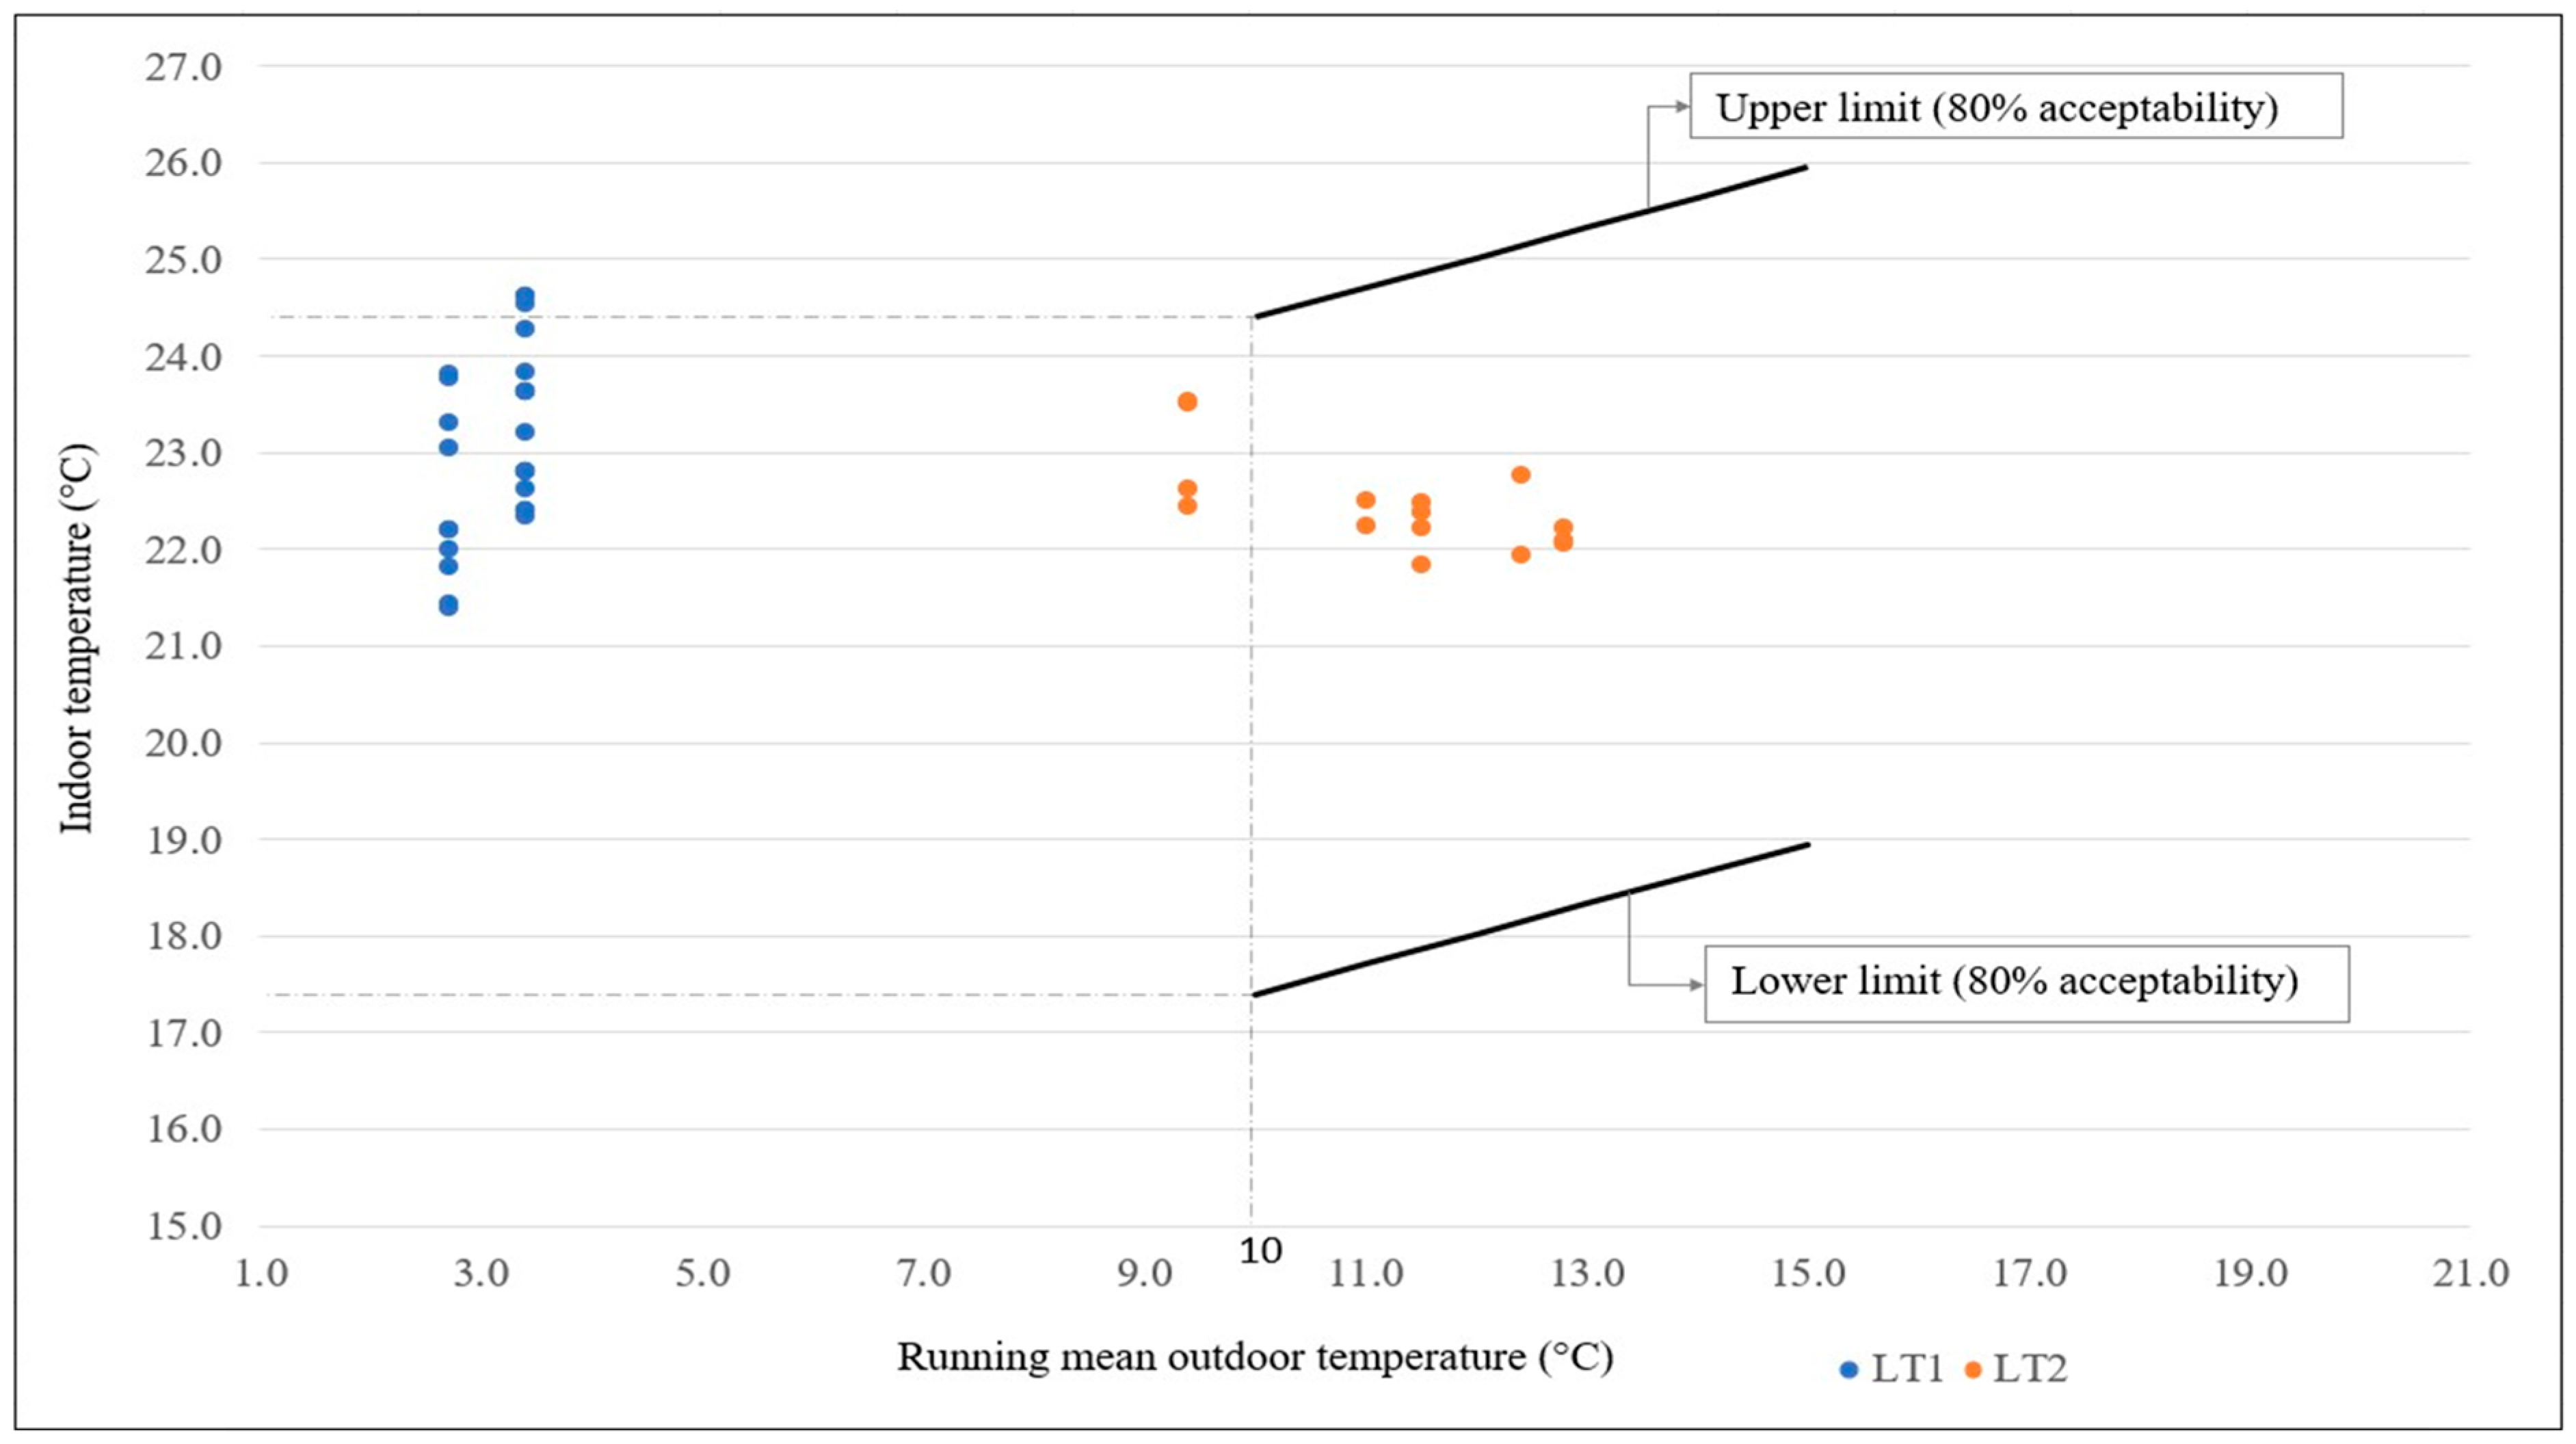
3.1.4. Adaptive Thermal Comfort Model

Figure 6 shows indoor temperatures for each occupant in the Indian offices at the time of filling the survey, plotted against the daily running mean outdoor temperatures. As per ASHRAE 55-2020 [38], the upper and lower limits with 80% acceptability were calculated using the following equations:
Upper 80% acceptability limit (°C) = 0.31 tpma(out) + 21.3
Lower 80% acceptability limit (°C) = 0.31 tpma(out) + 14.3
where tpma(out) is the prevailing mean outdoor air temperature which was calculated using the weighting criteria for the mean daily outdoor air temperatures of seven sequential days prior to each day considered [44]. The application of the ASHRAE 55 adaptive thermal comfort model was not designed for prevailing mean outdoor temperatures above 33.5 °C or below 10 °C.
For the Indian offices IN1 and IN2, higher outdoor temperatures were recorded as it was the summer season with minimum running mean outdoor temperatures of 30.6 °C and 33.2 °C, respectively. For offices IN3, IN4, and IN5, measured near the onset of the monsoon season, the minimum running mean outdoor temperatures were 27.3 °C, 22.8 °C, and 25.6 °C, respectively. Despite air conditioning, indoor temperatures remained relatively high. However, the findings of the Indian Model for Adaptive Comfort (IMAC) reveal that the Indian office occupants are adaptive and tolerant towards warmer temperatures [29,45]. Indoor temperatures were within the adaptive comfort range given in ASHRAE 55-2020 [38] for 97% of the respondents (Figure 6). Cases where temperatures exceeded these limits could be due to employees working beyond standard office hours. The central air-conditioning systems were turned off outside the office hours. Additionally, when the occupants arrived in the morning just when the air conditioning was turned on, the indoor temperatures required a period of time to decrease which could also explain the 3% of the respondents being outside the adaptive comfort range. The consistently high indoor temperatures despite the usage of air conditioning could be attributed to the low cooling capacity of the air-conditioning systems. Moreover, since the offices are a part of the concrete building structures, inadequate insulation may result in heat accumulation and high indoor temperatures.
The Lithuanian offices were investigated in the transitional spring season. The minimum running mean outdoor temperature was 2.7 °C and 9.4 °C, for LT1 and LT2, respectively. The running mean outdoor temperature for 29% of the respondents lied in ASHRAE 55 applicability range of 10–33.5 °C. The remaining 71% of data were below 10 °C of the running mean outdoor temperature. Here, the same thermal comfort range has been considered as for 10 °C (dashed lines in Figure 7). With this, 93% of the respondents were thermally comfortable. A larger variation in indoor temperatures was observed for the same outdoor temperatures in office LT1. It should also be noted that the adaptive thermal comfort model is not applicable for spaces without operable windows and with an operating air-conditioning. Most of our buildings used mechanical cooling and only two of the seven offices had operable windows (IN5 and LT1). Although the adaptive thermal comfort model is typically not applicable under these conditions, it appears that it could be extended to a broader range of conditions, as we encountered in the Indian offices in this study. This suggests potential applicability beyond the current considerations of ASHRAE 55. Whether this is also applicable for conditions observed in the Lithuanian offices needs to be further investigated on a larger dataset.

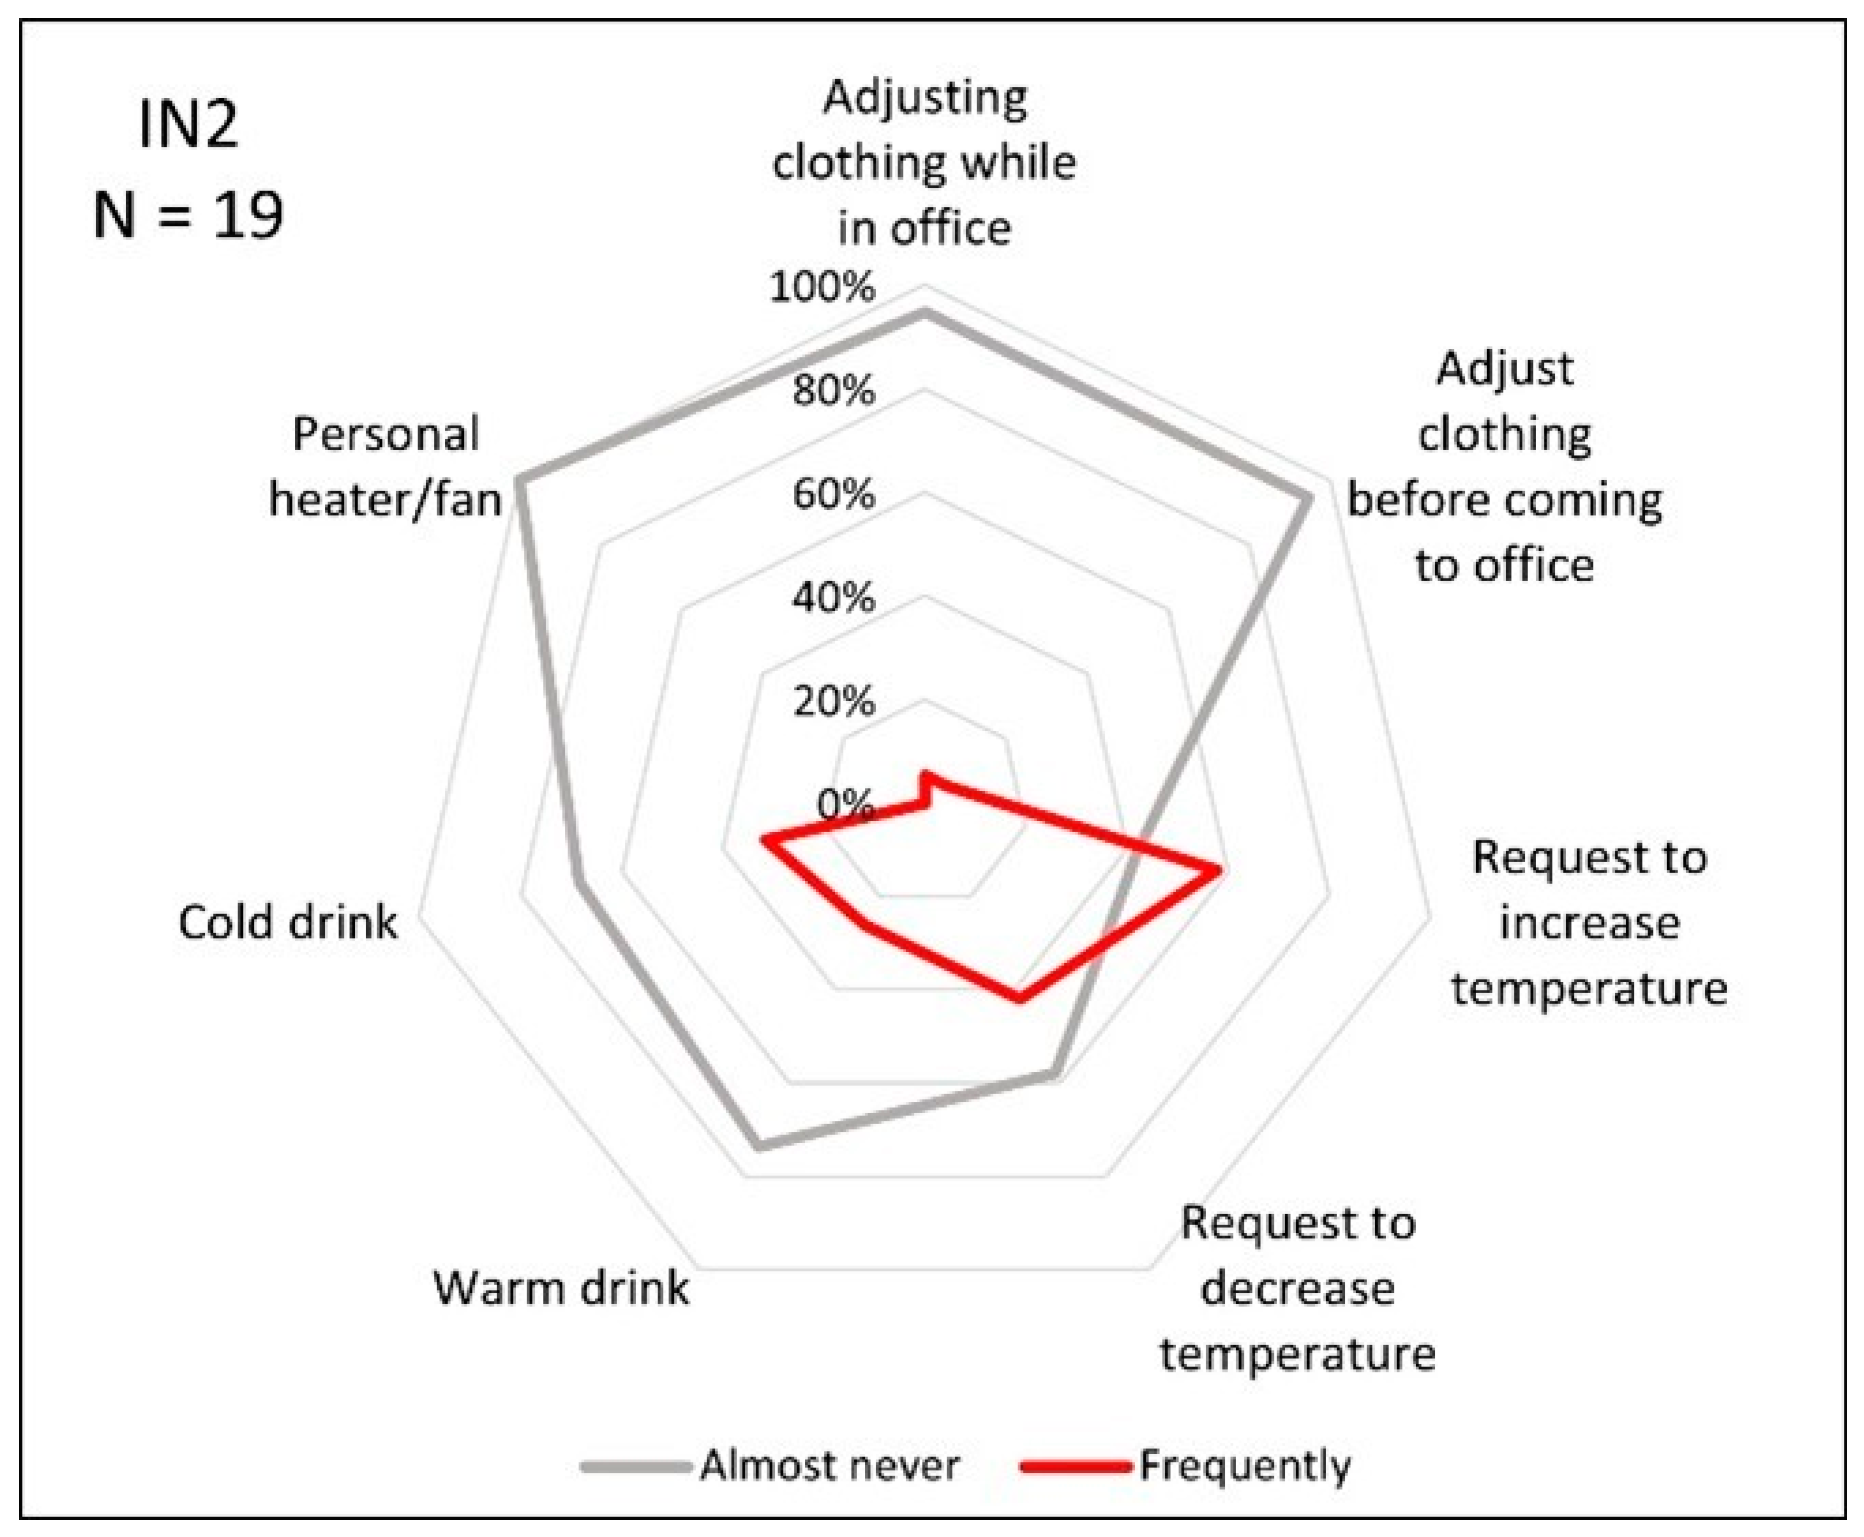
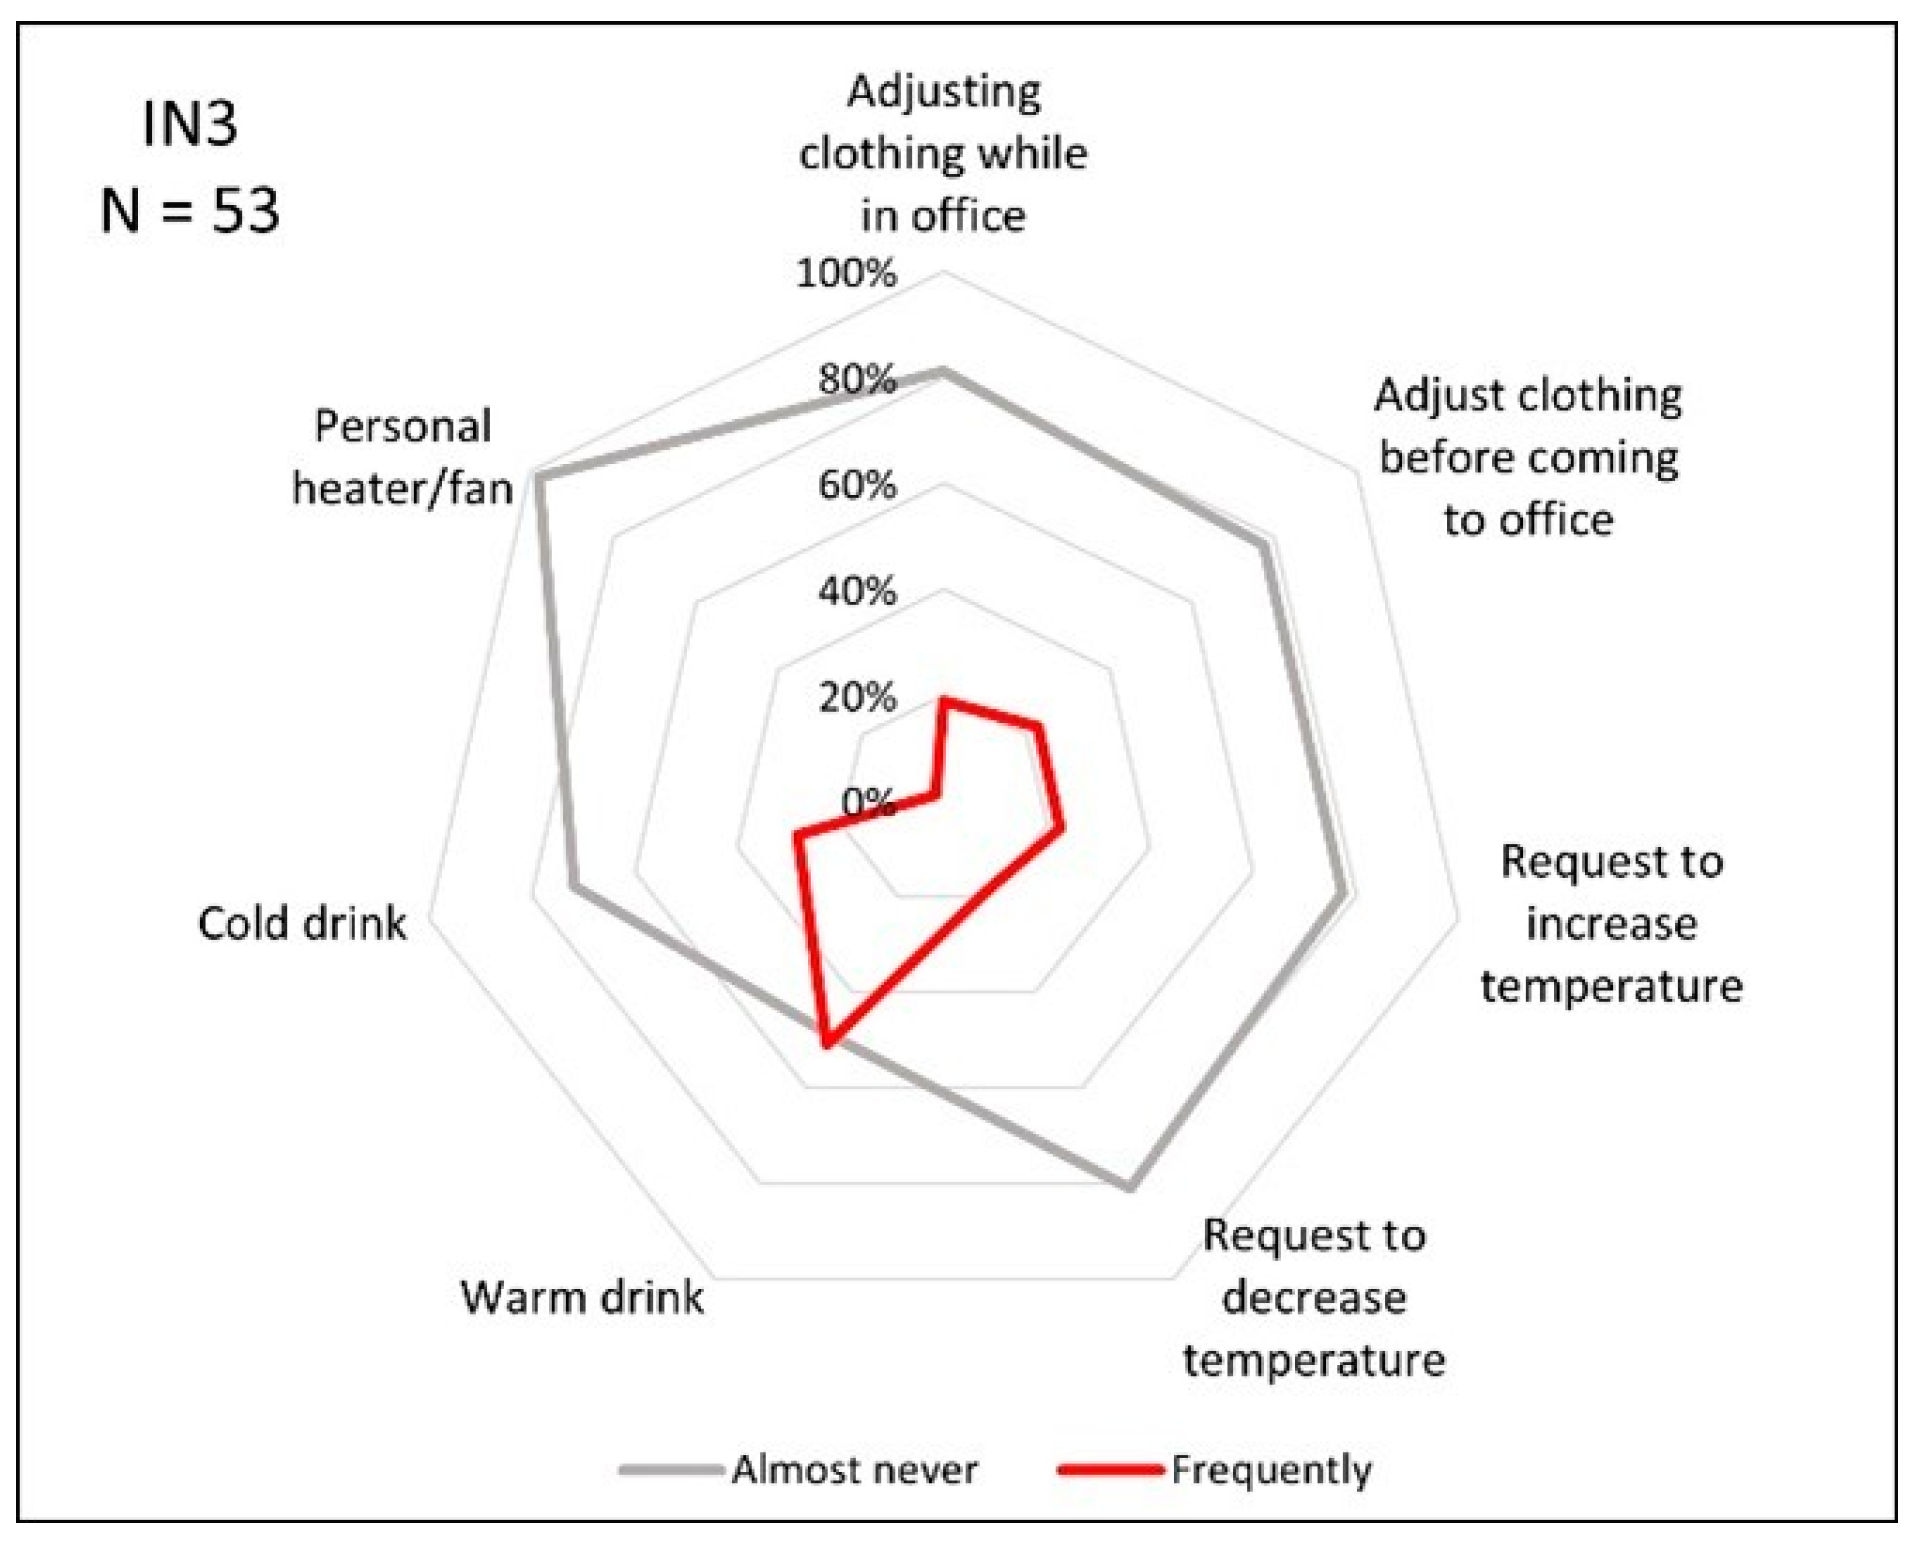
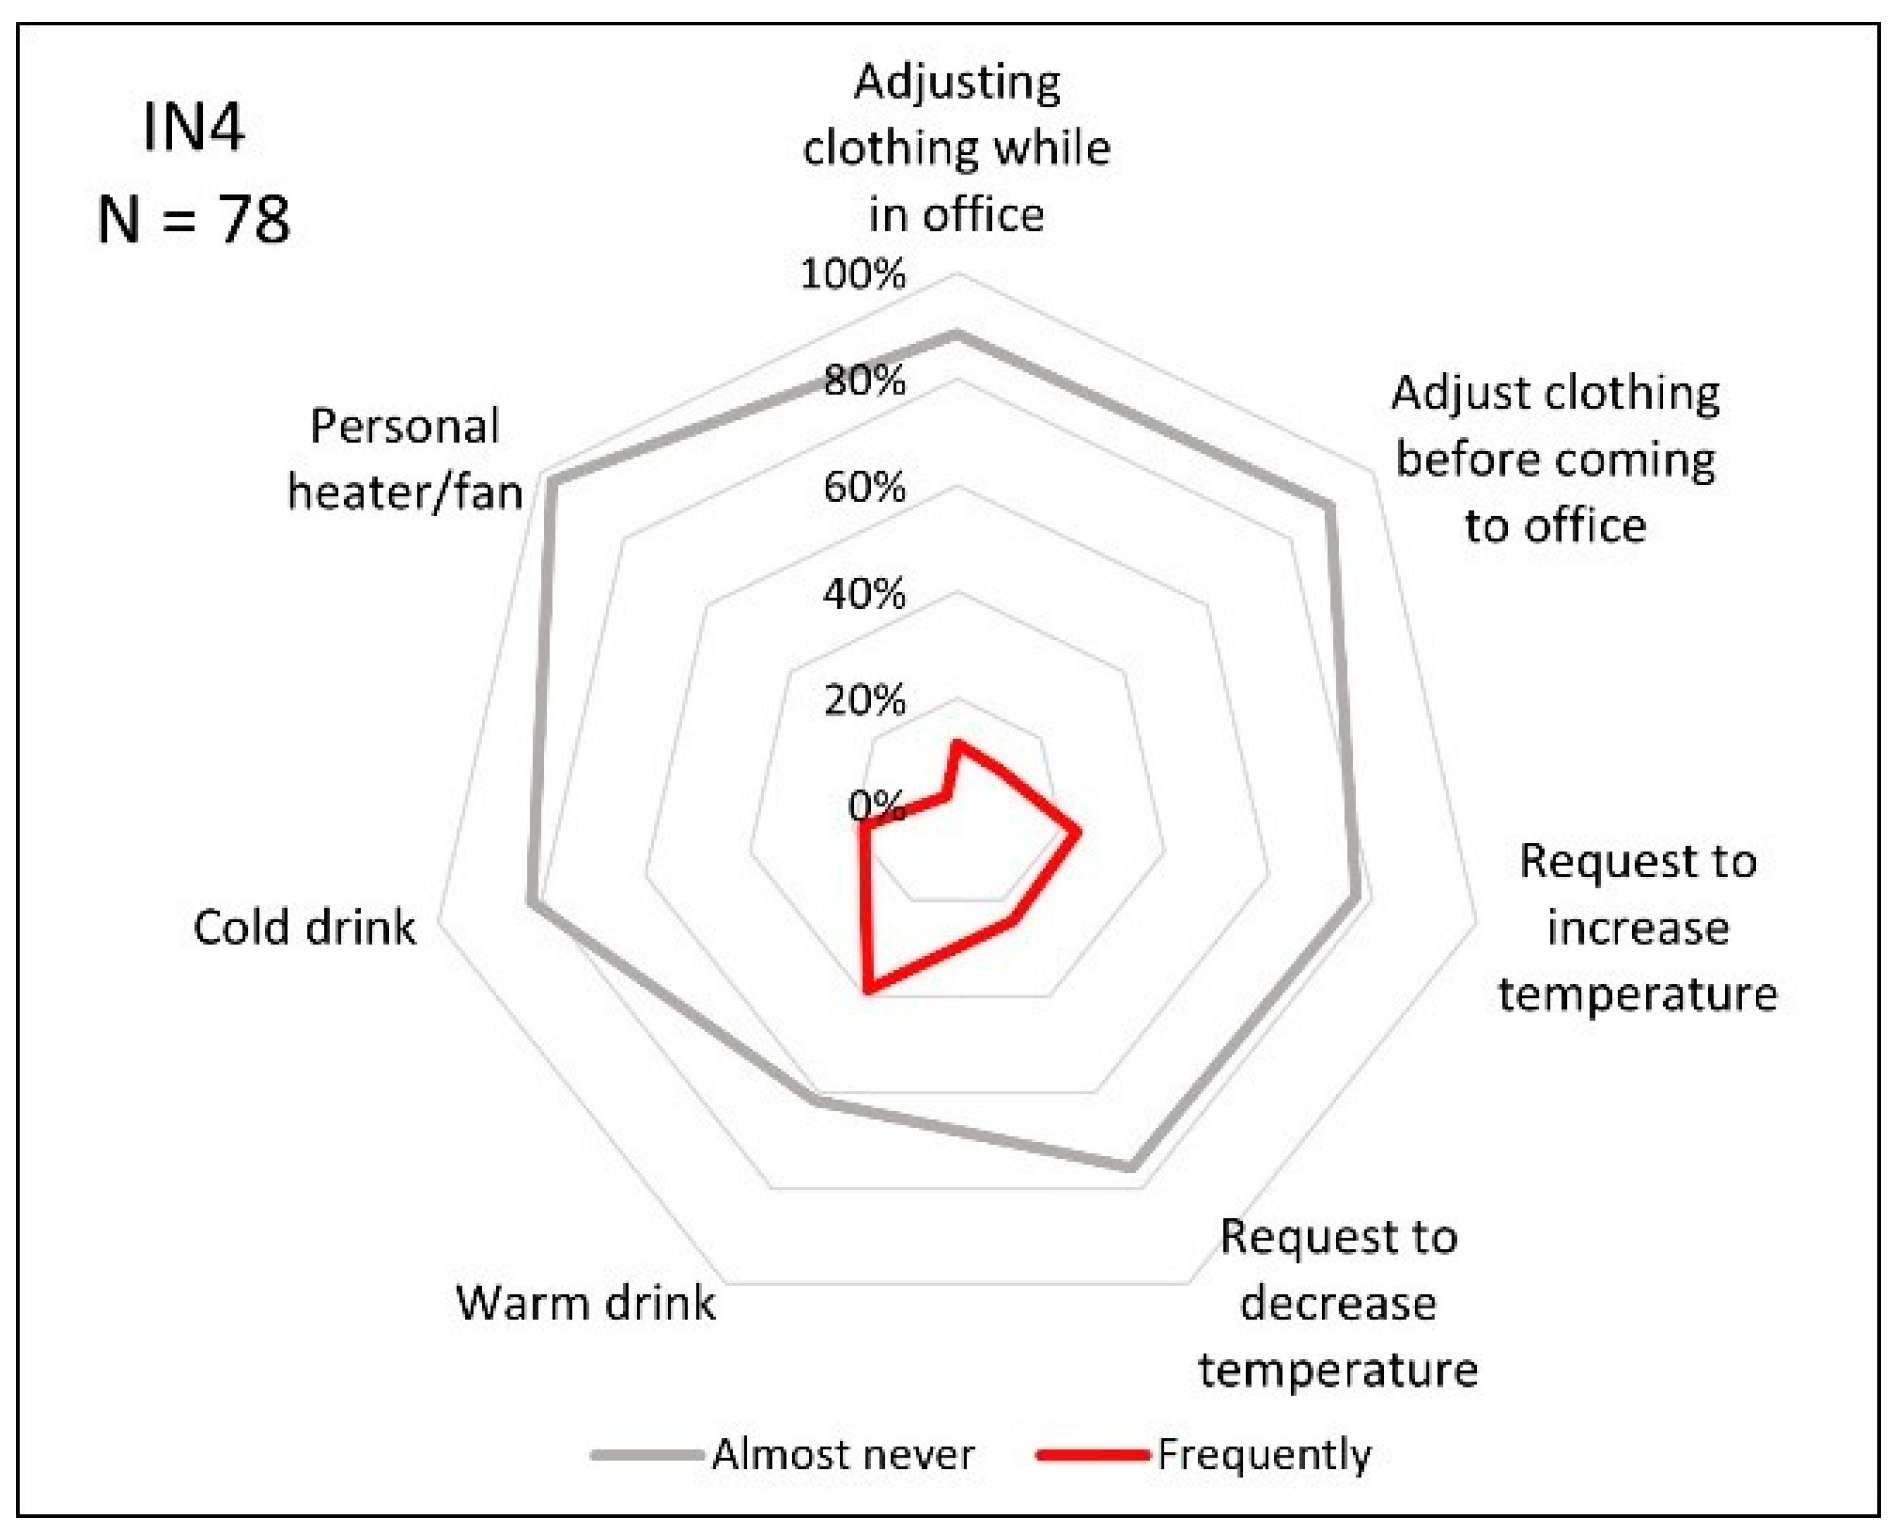
3.2. Adaptive Behaviour in the Offices

The analyses focus on seven key adaptations: adjusting clothing while in the office, adjusting clothing before coming to the office, requesting an increase in room temperature, requesting a decrease in room temperature, having a warm drink, having a cold drink, and utilising a personal heater/fan. Occupants in India were asked about their preferred adaptations in the most uncomfortable season of the year. Since the temperatures in Hyderabad, India, can reach up to 42 °C in the summer, it was considered the most uncomfortable season by most occupants. The occupants in Lithuania were asked about their adaptations in the summer and winter. Again, summer was considered the worst season. Table 8 details the adaptation preferences in the two countries for the summer season.
About 46% of the study population preferred to adjust their thermal comfort by regulating the temperature (Table 8). Beverage consumption emerged as a prevalent adaptation method, with 55% of respondents incorporating warm or cold drinks into their routines. This highlights the role of beverages in regulating body temperature and maintaining a sense of comfort. Hot drinks were preferred by 43% of the occupants and cold drinks by 34%. About 29% of occupants preferred to adjust their clothing, with 20% making the adjustments before arriving at the office and 22% adjusting their outfits while at work. The use of personal heaters or fans, however, was relatively infrequent, with only 6% of respondents employing their own personal devices.
On average, clothing adaptations were preferred by 24% of occupants in the Indian offices, and 60% in the Lithuanian offices. About 18% of the Indian occupants preferred to adjust their clothing before coming to the office, while 17% preferred to adjust their clothing while in the office. In the Lithuanian offices, 33% preferred to adjust the clothing before coming to the office, 45% added a piece of clothing and 29% removed a piece of clothing while in the office when feeling discomfort. The adaptations through temperature regulation were preferred by 47% of occupants in the Indian offices and 38% in the Lithuanian offices. The adaptations through warm or cold drinks were preferred by 55% of the occupants in both countries. The least preferred of all adaptations in both countries was using a personal heater/fan, which was preferred by 7% of the occupants in India and 2% in Lithuania.
The Lithuanian occupants displayed a higher tendency for clothing adaptations. The Indian occupants preferred to enhance their comfort with more energy-dependent adaptations, such as temperature control through air-conditioners, fans, etc. These adaptation strategies reflect the local building conditions and environmental, climate, and cultural influences (e.g., clothing style and flexibility, for example, business attire being more common in Indian offices) [46]. The adaptive preferences may be also linked to the perceived and actual control over temperature regulation. Studies have shown that the availability of temperature control and its proximity to the occupants has an influence on thermal comfort [47,48]. In the Indian offices (except for IN5), occupants lacked direct temperature control and operable windows, and they were required to submit requests to adjust the temperature according to their preferences. Occupants in the Lithuanian offices enjoyed direct access to temperature control through a thermostat, although with limitations on the degree of adjustment. The thermostat allowed for ±2 °C adjustment around the temperature set by the building management. Perceived and actual control over the temperature may be a significant factor influencing the occupants’ preferences for adaptation through temperature regulation. The absence of direct control in Indian offices likely contributed to the slightly higher desire for temperature control adaptations.
Adaptation preferences in the seven buildings are shown in Figure 8, Figure 9, Figure 10, Figure 11, Figure 12, Figure 13 and Figure 14. In offices IN1 and IN2, the most preferred adaptation to environmental conditions was increasing the room temperature (60% and 58% of the occupants, respectively; Figure 8 and Figure 9). In offices IN3 and IN4 (Figure 10 and Figure 11), the occupants especially preferred warm drinks, 51% and 38%, respectively. In IN5, a preference for cold drinks (65%) emerged as the dominant adaptation, followed closely by warm drinks (60%) (Figure 12). In LT1, 50% of the occupants preferred cold drinks as an adaptation, about 40% preferred adjusting clothing (in the office or before coming to the office), and 35% preferred warm drinks (Figure 13). LT2 showed a preference for adjusting clothing while in the office (50%) and warm drinks (38%) (Figure 14). In all offices, the use of a personal heater/fan was the least preferred adaptation, with only a handful of occupants opting for it. Overall, in the Indian offices, adjusting the temperature and beverage consumption were the most preferred, and in Lithuania offices adjusting clothing and beverage consumption were the most preferred. It should be noted that in corporate culture it is a common practice to consume small amounts of hot drinks (tea or coffee) multiple times throughout the day (likely culturally more pronounced in India). The question about beverages was framed to prompt respondents to associate it specifically with adaptive behaviour aimed at enhancing thermal comfort. However, it can be difficult to distinguish beverage consumption with the purpose of achieving thermal comfort among beverage consumption for pleasure or hydration, which can also have a beneficial effect on thermal comfort.

3.3. Relationship Between Thermal Comfort and Adaptive Behaviours

Table 9 compares the thermal comfort as recalled by the occupants (for summer from Section 3 of the questionnaire) with their recalled adaptive behaviour (summer being considered the worst season in both countries). Among the 274 occupants across all seven offices, 28% (78 occupants) felt thermally uncomfortable, while 72% (196 occupants) were comfortable. About 30% (81 individuals) indicated that they do not opt for any kind of adaptation. Among this group, 86% (70 occupants) reported being comfortable, while only 14% (11 occupants) reported discomfort (yet not choosing adaptive behaviour). The majority of occupants (70%, i.e., 193 occupants) employed at least one adaptation to regulate their thermal comfort. Within this group, 35% (67 occupants) reported discomfort while 64% (126 occupants) reported being comfortable. Thus, the majority of the occupants who did not choose any adaptation reported being comfortable, indicating that they recalled satisfaction with the thermal condition without any changes to be made. A higher proportion of individuals who chose adaptations reported discomfort compared to those in the non-adapting group. However, more than half of the persons with adaptive behaviour were comfortable. This may imply that among this population, adaptation increases comfort. On the other hand, one-third of the occupants remained uncomfortable despite the adaptive behaviour. Adaptive behaviour alone may not guarantee the perception of comfort. Moreover, there is likely variability in the effectiveness of the different adaptive behaviours.
A substantial proportion of occupants, i.e., 29% (80 occupants) expressed a preference for adjusting their clothing. About 22% (59 occupants) reported frequently adjusting clothing while in the office and 20% (55 occupants) reported frequently adjusting their clothing before coming to the office (Table 10). More than two thirds of those who frequently adopted this behaviour reported generally being thermally comfortable (71%, 57 occupants), and 29% (23 occupants) reported being uncomfortable. About 36% (99 occupants) preferred to relatively frequently request to increase the temperature. A larger fraction of this group reported discomfort 45% (45 occupants) than occupants not choosing this adaptive behaviour or occupants frequently choosing any other adaptive behaviour (except for the use of personal heater/fan). The desire for temperature regulation may be most closely related to thermal discomfort. About 55% (151 occupants) preferred to adapt by consuming either hot or cold drinks. Among the 43% (117 occupants) who frequently opted for warm drinks, discomfort was reported by 33% (39 occupants). In contrast, 34% (93 occupants) frequently had cold drinks, and 37% (34 occupants) reported discomfort. Usage of personal heaters/fans displayed a lower frequency 6% (16 occupants), and discomfort was reported by 50% (8 occupants) of them.
A slightly higher prevalence of being thermally comfortable was consistently observed among individuals who never chose a specific adaptation, suggesting that they might not require such measures. On the other hand, for those who do perform adaptive behaviour, the chosen adaptive measures did not seem to elevate their comfort level to or above that of those who do not opt for the specific adaptive behaviour. The difference is especially pronounced for the adaptations “request to increase the temperature” and “use a personal heater/fan”, where the effect of the adaptations would be expected to be greatest. However, the survey did not explicitly inquire about the thermal comfort before or after undertaking the adaptations. Thus, the results may also reflect the possible lack of clarity of the questions in the survey. It is plausible that some respondents reflected on their thermal comfort while taking adaptive behaviour consciously into account. Others may have done so without considering adaptive behaviour. The consideration of adaptive behaviour can influence the responses in various ways. For example, some occupants may have indicated comfort because they were actively seeking adaptive measures to improve their thermal comfort (65% of those felt comfortable; Table 9), while others may have indicated discomfort due to the need for more adaptations (35% of those who took adaptive action were still uncomfortable; Table 9). Future research should explore the temporal variation in comfort perception before, during, and after the adoption of specific adaptive behaviours.

4. Limitations and Future Work

The link between adaptive behaviour and thermal comfort remains relatively understudied. The strength and novelty of this research lie in the examination of thermal comfort and adaptation strategies in two countries characterised by different climates, building characteristics, and cultural contexts using the same methods. However, several limitations of the study need to be acknowledged. Measurements of radiant temperature and air speed were not conducted, which may have influenced the accuracy of thermal comfort assessments. Additionally, the air speed and mean radiant temperature used for calculations in the CBE Thermal Comfort tool were assumed to be 0.1 m/s and equal to the air temperature, respectively, which may not accurately reflect the actual conditions in the offices. The respondents in India were asked about their adaptations during the worst season, while those in Lithuania were asked about their adaptations specifically during summer and winter. To enhance consistency and enable possible comparisons, future research should standardise the survey questions across seasons and regions. Furthermore, the reliance on memory recall for assessing adaptive behaviours could introduce bias and inaccuracies. This prevents directly linking the respondents’ thermal comfort to the adaptative behaviour before, during, and after it occurs. Future research should address this limitation by implementing real-time assessments of thermal comfort and adaptive behaviours, providing a more comprehensive understanding of the dynamics between thermal comfort perceptions and adaptive strategies.
The absence of window operation as an adaptation in the survey (where applicable) represents a notable limitation in capturing all the different adaptive responses available to occupants. The availability of operable windows, or other various adaptation options, affects the general adaptive behaviour of the occupants. There were differences in the available adaptations and other factors that influence occupant behaviour in the studied buildings. Another limitation is the difference in the seasons during which the studies were conducted in the two countries. The study in the Indian offices was conducted in summer and monsoon seasons, whereas the study in Lithuania took place during the spring. Season can significantly impact thermal comfort perceptions and adaptive behaviours. A comparison of thermal comfort and adaptive behaviour across countries during corresponding seasons would be warranted. Comparisons between buildings and countries in our study should therefore be made with caution. Inclusion of a larger number of buildings and building occupants would allow for a more comprehensive study of the relationship between thermal comfort, adaptive behaviour, and associated factors. Additionally, the study did not capture temporal variations in adaptive behaviour and thermal comfort. Occupants’ preferences and preferred adaptive behaviour may change over time. Finally, this study did not assess the thermal comfort and adaptive behaviour in individual offices (cabins), which often offer greater opportunity for personalised environmental adjustments resulting in different adaptive strategies. A comparison of adaptive behaviour between open plan offices and individual offices is warranted.

5. Conclusions

This study investigated the relationship between thermal comfort and adaptive behaviour in office environments, with a particular focus on Indian and Lithuanian offices representing diverse climates and cultural contexts. Noteworthy differences in thermal sensation, comfort preferences, and adaptive behaviour were observed. Although Indian offices experienced higher temperatures and relative humidity, most occupants felt thermally neutral or slightly cool. As the Indian occupants are accustomed to the warm and humid climate, this likely increases their tolerance for higher temperatures and reduces discomfort under such conditions. A smaller proportion of occupants in Lithuania felt neutral, with a third of the population being slightly cool and another third slightly warm. The strong correlation between indoor temperature, comfort temperature, and preferred temperature shows that occupants’ comfort preferences are influenced by the actual indoor conditions. Factors such as climate, building design and operation, time of year, and cultural norms also influence thermal comfort preferences.
In Indian offices, where direct temperature control was limited, occupants displayed a higher preference for adaptive behaviour involving temperature regulation through air cooling devices or fans. Lithuanian occupants who had direct access to thermostat control, exhibited a higher tendency for clothing adaptations. This is also in line with the different office cultures and social norms, which may influence thermal comfort preferences and adaptive behaviours. In India, there is a greater prevalence of business attire, and warm beverages such as tea or coffee are consumed frequently even in the warmest seasons. Lithuania offers a greater acceptance of flexible attire. While the majority of occupants who did not choose any adaptations reported being comfortable (86%), a smaller proportion of those who chose adaptations reported being comfortable (65%). Adaptive behaviours generally enhance but do not guarantee thermal comfort. These findings underscore the complex relationship between adaptive behaviour and thermal comfort, highlighting the importance of considering individual preferences, environmental factors, and cultural norms in designing comfortable indoor environments.
In order to improve the thermal comfort of office workers in a sustainable manner, occupant behaviour and cultural aspects should be considered at the design stage. For example, energy-efficient adaptive behaviours, such as clothing adjustments, should be encouraged. Occupants should have greater access to temperature control systems, such as individual thermostats or operable windows. Using individual offices or the application of personalised ventilation systems or personalised environmental control systems (PECSs) could further improve personal comfort, energy efficiency, and worker performance. Thus, building designs should be sustainable and occupant-centric through considering individual preferences, environmental factors, and cultural norms.

Supplementary Materials

The following supporting information can be downloaded at: https://www.mdpi.com/article/10.3390/buildings15050766/s1, Table S1. Summer and winter adaptations in LT offices; Table S2. AMV, baseline PMV, PMV1, PMV2, PPD1, and PPD2.

Author Contributions

Conceptualisation, H.P.T. and A.J.; methodology, H.P.T., A.J., R.F.R. and G.B.; formal analysis, H.P.T.; investigation, H.P.T.; resources, H.P.T., R.V. and G.B.; data curation, H.P.T.; writing—original draft preparation, H.P.T.; writing—review and editing, A.J., R.F.R., R.V. and G.B.; supervision, A.J. and G.B. All authors have read and agreed to the published version of the manuscript.

Funding

This research received no external funding.

Data Availability Statement

All data are part of the manuscript and Supplementary Information.

Conflicts of Interest

The authors declare no conflicts of interest.

References

  1. Demanuele, C.; Tweddell, T.; Davies, M. Bridging the gap between predicted and actual energy performance in schools. In Proceedings of the World Renewable Energy Congress XI, Abu Dhabi, United Arab Emirates, 25–30 September 2010; pp. 1–6. [Google Scholar]
  2. Menezes, A.; Cripps, A.; Bouchlaghem, D.; Buswell, R. Predicted vs. actual energy performance of non-domestic buildings. In Proceedings of the Third International Conference on Applied Energy, Perugia, Italy, 16–18 May 2011; Volume 97, pp. 355–364. Available online: https://dspace.lboro.ac.uk/dspace-jspui/handle/2134/9429 (accessed on 15 January 2024).
  3. Mahdavi, A.; Jazizadeh, A.; Wagner, A.; O’Brien, W. Ten questions concerning occupant-centric control and operations. Build. Environ. 2023, 238, 110518. [Google Scholar] [CrossRef]
  4. O’Brien, W.; Zhang, T.; Alston, S.C.J.; Sadeghi, A.A.; Mahdavi, A. Introducing IEA EBC Annex 79: Key challenges and opportunities in the field of occupant-centric building design and operation. Build. Environ. 2020, 178, 106738. [Google Scholar] [CrossRef]
  5. De Wilde, P. The gap between predicted and measured energy performance of buildings: A framework for investigation. Autom. Constr. 2014, 41, 40–49. [Google Scholar] [CrossRef]
  6. Yan, H.; Shi, F.; Sun, Z.; Yuan, G.; Wang, M.; Dong, M. Thermal adaptation of different set point temperature modes and energy saving potential in split air-conditioned office buildings during summer. Build. Environ. 2022, 225, 109565. [Google Scholar] [CrossRef]
  7. Tanabe, S.I.; Haneda, M.; Nishihara, N. Workplace productivity and individual thermal satisfaction. Build. Environ. 2015, 91, 42–50. [Google Scholar] [CrossRef]
  8. Government of Japan. Press Release [Ministry of Environment]. 2005. Available online: https://www.env.go.jp/en/press/2005/1028a.html (accessed on 26 January 2024).
  9. Takagi, K. The Japanese Cool Biz Campaign: Increasing Comfort in the Workplace | Article | Environmental and Energy Study Institute. 2015. Available online: https://www.eesi.org/articles/view/the-japanese-cool-biz-campaign-increasing-comfort-in-the-workplace (accessed on 24 November 2023).
  10. Liu, Y.; Xu, H.; Zheng, P.; Lin, B.; Wu, H.; Huang, Y.; Li, Z. Thermal preference prediction based on occupants’ adaptive behavior in indoor environments—A study of an air-conditioned multi-occupancy office in China. Build. Environ. 2021, 206, 108355. [Google Scholar] [CrossRef]
  11. Alamirah, H.; Schweiker, M.; Azar, E. Immersive virtual environments for occupant comfort and adaptive behavior research—A comprehensive review of tools and applications. Build. Environ. 2022, 207, 108396. [Google Scholar] [CrossRef]
  12. Rupp, R.F.; Kim, J.; de Dear, R.; Ghisi, E. Associations of occupant demographics, thermal history and obesity variables with their thermal comfort in air-conditioned and mixed-mode ventilation office buildings. Build. Environ. 2018, 135, 1–9. [Google Scholar] [CrossRef]
  13. Pigliautile, I.; Casaccia, S.; Morresi, N.; Arnesano, M.; Pisello, A.L.; Revel, G.M. Assessing occupants’ personal attributes in relation to human perception of environmental comfort: Measurement procedure and data analysis. Build. Environ. 2020, 177, 106901. [Google Scholar] [CrossRef]
  14. Indraganti, M. Behavioural adaptation and the use of environmental controls in summer for thermal comfort in apartments in India. Energy Build. 2010, 42, 1019–1025. [Google Scholar] [CrossRef]
  15. Indraganti, M.; Ooka, R.; Rijal, H.B.; Brager, G.S. Drivers and barriers to occupant adaptation in offices in India. Archit. Sci. Rev. 2015, 58, 77–86. [Google Scholar] [CrossRef]
  16. Indraganti, M.; Ooka, R.; Rijal, H.B. Thermal comfort in offices in India: Behavioral adaptation and the effect of age and gender. Energy Build. 2015, 103, 284–295. [Google Scholar] [CrossRef]
  17. Liu, J.; Yao, R.; Wang, J.; Li, B. ‘Occupants’ behavioural adaptation in workplaces with non-central heating and cooling systems. Appl. Therm. Eng. 2012, 35, 40–54. [Google Scholar] [CrossRef]
  18. Rupp, R.F.; Andersen, R.K.; Toftum, J.; Ghisi, E. Occupant behaviour in mixed-mode office buildings in a subtropical climate: Beyond typical models of adaptive actions. Build. Environ. 2021, 190, 107541. [Google Scholar] [CrossRef]
  19. Humphreys, M.A. Field Studies of Thermal Comfort Compared and Applied. Build. Serv. Eng. 1974, 44, 5–27. [Google Scholar] [CrossRef]
  20. Langevin, J.; Gurian, P.L.; Wen, J. Tracking the human-building interaction: A longitudinal field study of occupant behavior in air-conditioned offices. J. Environ. Psychol. 2015, 42, 94–115. [Google Scholar] [CrossRef]
  21. Zheng, P.; Wang, C.; Liu, Y.; Lin, B.; Wu, H.; Huang, Y.; Zhou, X. Thermal adaptive behavior and thermal comfort for occupants in multi-person offices with air-conditioning systems. Build. Environ. 2022, 207, 108432. [Google Scholar] [CrossRef]
  22. Boerstra, A.C.; Loomans, M.G.L.C.; Hensen, J.L.M. Personal control over temperature in winter in Dutch office buildings. HVAC R Res. 2013, 19, 1033–1050. [Google Scholar] [CrossRef]
  23. Paciuk, M.T. The Role of Personal Control of the Environment in Thermal Comfort and Satisfaction at the Workplace; University of Wisconsin: Milwaukee, WI, USA, 1989. [Google Scholar]
  24. Nicol, F.; Humphreys, M.A. Thermal comfort as part of a self-regulating system. Build. Res. Pract. 1073, 1, 174–179. [Google Scholar] [CrossRef]
  25. Nicol, F.; Humphreys, M.; Roaf, S. Adaptive Thermal Comfort: Principles and Practice; Routledge: London, UK, 2012. [Google Scholar]
  26. Indraganti, M.; Boussaa, D. Comfort temperature and occupant adaptive behavior in offices in Qatar during summer. Energy Build. 2017, 150, 23–36. [Google Scholar] [CrossRef]
  27. Tsang, T.W.; Mui, K.W.; Wong, L.T. Adaption and Tolerance in Built Environment—An Evaluation of Environmental Sensation, Acceptance and Overall Indoor Environmental Quality (IEQ) in a Subtropical Region. Sustainability 2023, 15, 11094. [Google Scholar] [CrossRef]
  28. Liu, Y.; Li, H.; Zheng, P.; Wu, H.; Wang, Z.; Li, Z.; Lin, B. Non-invasive measurements of thermal discomfort for thermal preference prediction based on occupants’ adaptive behavior recognition. Build. Environ. 2023, 228, 109889. [Google Scholar] [CrossRef]
  29. Singh, M.K.; Ooka, R.; Rijal, H.B.; Kumar, S.; de Dear, R. Adaptive thermal comfort in the offices of three climates of North-East India. J. Build. Eng. 2023, 75, 106843. [Google Scholar] [CrossRef]
  30. Pawar, A.S.; Mukherjee, M.; Shankar, R. Thermal comfort design zone delineation for India using GIS. Build. Environ. 2015, 87, 193–206. [Google Scholar] [CrossRef]
  31. Bureau of Indian Standards. National Building Code of India, 2016, 2. Available online: https://archive.org/details/nationalbuilding01/in.gov.nbc.2016.vol1.digital/ (accessed on 15 December 2024).
  32. Bureau of Energy Efficiency, Energy Conservation Building Code. Ministry of Power, Government of India. 2017. Available online: https://beeindia.gov.in/sites/default/files/publications/files/ECBC%20book%20final%20one%20%202017_0.pdf (accessed on 11 January 2024).
  33. Rawal, R.; Manu, S.; Shukla, Y.; Thomas, L.E.; De Dear, R. Clothing insulation as a behavioural adaptation for thermal comfort in Indian office buildings. In Proceedings of the 9th Windsor Conference: Making Comfort Relevant, Windsor, UK, 7–10 April 2016; pp. 403–415. [Google Scholar]
  34. Vilnius, Vilnius, Lithuania Monthly Weather|AccuWeather. Available online: https://www.accuweather.com/en/lt/vilnius/231459/february-weather/231459?year=2023 (accessed on 13 February 2024).
  35. Kaunas, Kaunas, Lithuania Monthly Weather|AccuWeather. Available online: https://www.accuweather.com/en/lt/kaunas/228309/december-weather/228309?year=2023 (accessed on 13 February 2024).
  36. Indraganti, M.; Ooka, R.; Rijal, H.B. Field investigation of comfort temperature in Indian office buildings: A case of Chennai and Hyderabad. Build. Environ. 2013, 65, 195–214. [Google Scholar] [CrossRef]
  37. Ministry of Health. Lithuanian Hygiene Norm HN 69:2003 ‘Thermal Comfort and Sufficient Thermal Environment for Work Premises. Normative Values of Parameters and Measurement Requirements’; Vilnius, Lithuania. Available online: https://e-seimas.lrs.lt/portal/legalAct/lt/TAD/TAIS.230880 (accessed on 12 March 2024).
  38. ASHRAE and American National Standards Institute. Thermal Environmental Conditions for Human Occupancy. ASHRAE Stand. 55, 2020. Available online: https://www.ashrae.org/technical-resources/bookstore/standard-55-thermal-environmental-conditions-for-human-occupancy (accessed on 25 December 2024).
  39. Davis, L.L. Instrument review: Getting the most from a panel of experts. Appl. Nurs. Res. 1992, 5, 194–197. [Google Scholar] [CrossRef]
  40. Polit, D.F.; Beck, C.T. The content validity index: Are you sure you know what’s being reported? critique and recommendations. Res. Nurs. Health 2006, 29, 489–497. [Google Scholar] [CrossRef] [PubMed]
  41. Humphreys, M.A.; Nicol, J.F. Understanding the adaptive approach to thermal comfort. ASHRAE Trans. 1998, 104, 991–1004. [Google Scholar]
  42. de Dear, R.J.; Brager, G.S. Developing an adaptive model of thermal comfort and preference. ASHRAE Trans. 1998, 104, 145–167. [Google Scholar]
  43. Nicol, F.; Humphreys, M. Adaptive thermal comfort and sustainable thermal standards for buildings. Energy Build. 2002, 34, 563–572. [Google Scholar] [CrossRef]
  44. Rupp, R.F.; Ghisi, E. Predicting thermal comfort in office buildings in a Brazilian temperate and humid climate. Energy Build. 2017, 144, 152–166. [Google Scholar] [CrossRef]
  45. Manu, S.; Shukla, Y.; Rawal, R.; Thomas, L.E.; de Dear, R. Field studies of thermal comfort across multiple climate zones for the subcontinent: India Model for Adaptive Comfort (IMAC). Build. Environ. 2016, 98, 55–70. [Google Scholar] [CrossRef]
  46. Thapa, S.; Pernigotto, G. Adaptive Thermal Comfort in the Different Buildings of Temperate Climates—Comparison Between High-Latitude Europe and Mountainous Himalayas in India. Sustainabiliy 2025, 17, 404. [Google Scholar] [CrossRef]
  47. Ghanta, N.; Kongoletos, J.; Glicksman, L. Comfort control and improved thermostat location in conference rooms and academic working spaces. Build. Environ. 2021, 205, 108192. [Google Scholar] [CrossRef]
  48. Xie, K.; Lee, M.; Khalid, R.; Zakka, V.G. The impact of personal environmental control on the performance of thermal systems: Building energy consumption, occupant thermal comfort, and productivity. Energy Build. 2023, 298, 113552. [Google Scholar] [CrossRef]
Figure 1. Thermal sensation votes at the time of survey completion.
Buildings 15 00766 g001
Figure 2. Thermal comfort votes at the time of survey completion.
Buildings 15 00766 g002
Figure 3. Thermal preference votes at the time of survey completion.
Buildings 15 00766 g003
Figure 4. AMV, baseline PMV (0.1 m/s, MRT = T_air), PMV1 (0.1 m/s, MRT = T_air + 1 °C) and PMV2 (0.2 m/s, MRT = T_air − 1 °C) for each office. Box plots display the mean (marked with X), median (marked with a horizontal line), interquartile range (IQR), and potential outliers. The whiskers denote the minimum and maximum values within 1.5 times the IQR from the lower and upper quartiles, respectively.
Buildings 15 00766 g004
Figure 5. Average indoor temperature (Ti), comfort temperature (Tc), and preferred temperature (Tp) (N = 274).
Buildings 15 00766 g005
Figure 6. Adaptive thermal comfort model for the Indian offices.
Buildings 15 00766 g006
Figure 7. Adaptive thermal comfort model for the Lithuanian offices.
Buildings 15 00766 g007
Figure 8. Adaptations in office IN1.
Buildings 15 00766 g008
Figure 9. Adaptations in office IN2.
Buildings 15 00766 g009
Figure 10. Adaptations in office IN3.
Buildings 15 00766 g010
Figure 11. Adaptations in office IN4.
Buildings 15 00766 g011
Figure 12. Adaptations in office IN5.
Buildings 15 00766 g012
Figure 13. Adaptations in office LT1.
Buildings 15 00766 g013
Figure 14. Adaptations in office LT2.
Buildings 15 00766 g014
Table 2. Description of the occupants of the offices.
IN1IN2IN3IN4IN5LT1LT2
Total number of
occupants
8523981652512850
Total responses62195378202616
Response rate (%)72.982.654.147.38020.332
Gender (respondents) (Male/Female)40/227/1249/461/1716/414/1211/5
Age (years)
(mean ± SD)
28 ± 5.5827 ± 530 ± 0.0737 ± 8.7230 ± 5.2233 ± 7.029 ± 4.65
Height (m)
(mean ± SD)
1.7 ± 0.071.6 ± 0.071.7 ± 0.071.68 ± 0.081.67 ± 0.071.77 ± 0.091.78 ± 0.11
Weight (kg)
(mean ± SD)
67.2 ±
12.11
59.3 ± 12.4372.2 ±
12.83
72.6 ±
13.02
77 ±
14.4
73.0 ±
12.2
77.1 ±
14.6
BMI (kg/m2)
(mean ± SD)
24.3 ±
3.96
22.2 ±
4.25
24.8 ±
4.25
25.4 ±
4.35
27.9 ±
5.45
20.57 ±
2.8
21.6 ±
3.74
Table 3. Thermal environment questionnaire scales.
Thermal
Sensation
Very Cold
(−3)
Cold
(−2)
Slightly
Cool (−1)
Neutral
(0)
Slightly
Warm (+1)
Hot
(+2)
Very Hot
(+3)
Thermal
comfort
Very
uncomfortable
Slightly
uncomfortable
Slightly
comfortable
Very
comfortable
Thermal
preference
Much
warmer
WarmerUnchangedCoolerMuch cooler
Table 4. Distinct seasons and their periods in India and Lithuania.
MonthsIndiaLithuania
December to FebruaryWinterWinter
March to May Summer Spring
June to September Monsoon Summer
October to November Autumn Autumn
Table 5. Description of sensors used in the IC-Meter.
ParameterSensorRangeAccuracy
TemperatureSensirion SHT21−40 °C to 125 °C±0.3 °C
Relative HumiditySensirion SHT210 to 100%±2.0%
CO2SenseAir S8400 to 2000 ppm±30 ppm
(±3% of reading)
Table 6. Temperature and relative humidity at the time of filling the survey and outdoor temperatures during the week of the study period. Offices in IN were measured in May-August 2022, offices in LT in April 2023.
OfficeIndoor Air
Temperature (°C)
Average ± SD
Relative Humidity (%)
Average ± SD
Average Outdoor
Temperature (°C) for the
Week of the Experiment
(High)
Average Outdoor
Temperature (°C) for the Week of the Experiment (Low)
IN128.6 ± 1.540.6 ± 2.538.926.9
IN228.8 ± 0.642.5 ± 2.939.426.0
IN325.6 ± 0.955.8 ± 4.031.923.3
IN425.3 ± 1.069.4 ± 6.428.021.9
IN524.9 ± 1.058.9 ± 4.429.422.6
LT123.1 ± 1.026.6 ± 2.812.32.2
LT222.4 ± 0.541.9 ± 2.514.62.7
Table 8. Adaptation preferences in offices in India (IN) and Lithuania (LT) in the summer season. The questions about adding or removing clothing while in office, as asked in the LT offices, were merged into a single category (“adjusting clothing while in office”) for consistency across the data.
Temperature Control
Adjustments
Beverage
Consumption
Clothing
Adjustments
Other
Increase
temperature
(%)
Decrease
temperature (%)
Warm
drink
(%)
Cold
drink
(%)
Before coming to
office (%)
While
in office
(%)
Use of
personal heater/fan (%)
All
Occupants (N = 274)
3627433420226
Occupants (all) choosing at least one of the adaptations in the group4655296
IN offices
(N=232)
3828443318177
Occupants (IN) choosing at least one of the adaptations in the group4755247
LT offices
(N = 42)
2621364133452
Occupants (LT) choosing at least one of the adaptations in the group3855602
Table 9. Thermal comfort and adaptive behaviour for the whole study population.
Total (N = 274)UncomfortableComfortable
No. and percentage of occupants who did
not opt for any kind of adaptations
81 (29.6%)11 (14%)70 (86%)
No. and percentage of occupants who
preferred at least one type of adaptation
193 (70.4%)67 (35%)126 (65%)
Table 10. Reported thermal comfort stratified by adaptative behaviour (N = 274).
AdaptationPreferenceTotal
(% of Study Population)
Uncomfortable (% of Total)Comfortable
(% of Total)
Adjust clothing while in the officeFrequently59 (22%)18 (31%)41 (69%)
Almost never215 (78%)60 (28%)155 (72%)
Adjust clothing before coming to
the office
Frequently55 (20%)16 (29%)39 (71%)
Almost never219 (80%)62 (28%)157 (72%)
Any clothing adjustmentFrequently80 (29%)23 (29%)57 (71%)
Request to increase the temperatureFrequently99 (36%)45 (45%)54 (55%)
Almost never175 (64%)33 (19%)142 (81%)
Request to decrease the temperatureFrequently73 (27%)23 (32%)50 (68%)
Almost never201 (73%)55 (27%)146 (73%)
Any temperature changeFrequently126 (46%)52 (41%)74 (59%)
Have a warm drinkFrequently117 (43%)39 (33%)78 (67%)
Almost never157 (57%)39 (25%)118 (75%)
Have a cold drinkFrequently93 (34%)34 (37%)59 (63%)
Almost never181 (66%)44 (24%)137 (76%)
Any drinkFrequently151 (55%)57 (38%)94 (62%)
Use a personal heater/fanFrequently16 (6%)8 (50%)8 (50%)
Almost never258 (94%)70 (27%)188 (73%)
Table 7. PMV and PPD for all offices (“right-now” conditions). The compliance with ASHRAE 55 standard is based on the thermal comfort tool.
OfficeStudy PeriodAMV
Average ± SD
Baseline PMV
Average ± SD
APD
(%)
Baseline
PPD (%)
ASHRAE 55
Compliant
IN1
(N = 62)
23 May–29 May 20220.1 ± 1.21.2 ± 0.4 4537No
IN2
(N = 19)
31 May–6 June 2022−0.4 ± 1.11.3 ± 0.22139No
IN3
(N = 53)
23 June–29 June 2022−0.5 ± 1.10.6 ± 0.22313No
IN4
(N = 78)
4 July–10 July 2022−0.3 ± 0.80.6 ± 0.31714No
IN5
(N = 20)
21 July–28 July 2022−0.9 ± 1.20.4 ± 0.33510Yes
LT1
(N = 26)
3 April–12 April 20230.3 ± 1.1−0.3 ± 0.2238Yes
LT2
(N = 16)
24 April–30 April 2023−0.4 ± 0.9−0.4 ± 0.1569Yes
Disclaimer/Publisher’s Note: The statements, opinions and data contained in all publications are solely those of the individual author(s) and contributor(s) and not of MDPI and/or the editor(s). MDPI and/or the editor(s) disclaim responsibility for any injury to people or property resulting from any ideas, methods, instructions or products referred to in the content.

