Article

Experimental and Finite Element Analysis of Bending Performance of Web-Embedded Double Inverted T-Shaped Steel–Concrete Composite Beams

1
College of Civil Engineering, Yangzhou Polytechnic Institute, Yangzhou 225100, China
2
College of Mechanical and Electrical Engineering, Northeast Forestry University, Harbin 150040, China
3
College of Civil Engineering, Suzhou University of Science and Technology, Suzhou 215009, China
4
College of Civil Engineering, Nanjing Tech University, Nanjing 211816, China
*
Author to whom correspondence should be addressed.
Buildings 2025, 15(5), 717; https://doi.org/10.3390/buildings15050717
Submission received: 15 January 2025 / Revised: 18 February 2025 / Accepted: 21 February 2025 / Published: 24 February 2025
(This article belongs to the Section Building Materials, and Repair & Renovation)

Abstract

This study investigates the bending performance of web-embedded double inverted T-shaped steel–concrete composite beams (WDTSCBs) through experimental testing and finite element analysis (FEA). A novel composite beam structure was developed, where double inverted T-shaped steel beams are interconnected by slotted web plates and embedded in concrete flanges, aiming to enhance load-bearing capacity and ductility. Four WDTSCB specimens, utilizing C40 concrete and Q345qB steel, were tested under static loading to analyze failure modes, load-deflection behavior, and crack development. The experimental results were validated by FEA in ABAQUS, achieving an error margin of less than 5%. The findings indicate that WDTSCBs exhibit superior flexural performance compared to traditional composite beams, with higher bending resistance and reduced steel consumption. These results provide valuable insights into the design and optimization of steel–concrete composite structures, promoting their application in civil engineering.

1. Introduction

In recent years, with the advancement of bridge and building engineering towards long-span and lightweight designs, steel–concrete composite structures have emerged as a preferred solution in structural engineering by combining the advantages of both materials [1,2,3]. These systems offer significant benefits in terms of load-bearing capacity, stiffness, and seismic performance, making them widely applicable in bridges and high-rise buildings [4,5]. Among recent innovations, the web-embedded double inverted T-shaped steel–concrete composite beam represents a notable advancement, enhancing bending resistance through its unique configuration [6,7,8]. Additionally, design codes such as GB/T 228-2010 and Eurocode 4 provide guidelines for the design and analysis of composite structures, ensuring their safety and reliability [9,10]. However, despite its theoretical support, comprehensive research on this specific design’s bending resistance remains limited [6].
Recent studies have explored various material combinations and configurations to enhance traditional steel–concrete composite beams [11,12,13]. Notably, Jianjun Yang et al. investigated composite beams with concealed cross-beams and longitudinal beams, demonstrating high stiffness and ductility under bending conditions [14]. While their methodology provided valuable insights into crack propagation and deformation patterns, questions remain regarding stress distribution under complex loading scenarios. Building on this foundation, P. Stylianidis et al. advanced the field by analyzing FRP-reinforced steel–concrete composite beams, introducing new theoretical models for design optimization [15]. However, these studies have not addressed the specific mechanical behavior of web-embedded double inverted T-shaped steel configurations.
At the same time, recent studies have demonstrated the superior performance of ultra-high-performance concrete (UHPC) in composite beams under bending moments, particularly in terms of crack resistance and stiffness [16,17,18,19]. However, the high cost and complex manufacturing process of UHPC limit its widespread application. In contrast, the proposed web-embedded double inverted T-shaped steel–concrete composite beams (WDTSCBs) offer a cost-effective alternative with comparable bending performance. While UHPC excels in high-strength applications, WDTSCBs provide a balanced solution for medium-span structures, combining the advantages of traditional steel–concrete composites with enhanced load-bearing capacity and ductility.
Finite element analysis has emerged as a crucial tool in understanding composite beam behavior [20,21,22,23]. Fan et al. demonstrated how engineered cementitious composite (ECC) materials enhance crack resistance and stiffness under negative bending moments [24], while Ban et al. developed optimization schemes for high-strength steel–concrete composite beams [25,26]. Yet, a comprehensive understanding of stress distribution and failure modes in web-embedded double inverted T-shaped steel structures under complex loading remains elusive.
To address these knowledge gaps, this research combines experimental testing with finite element analysis to systematically investigate the flexural performance of web-embedded double inverted T-shaped steel–concrete composite beams. The study focuses specifically on stress distribution and failure modes under static loading conditions, employing both detailed experimental observations of load-bearing capacity and crack development, and refined FEA modeling. This integrated approach aims to not only advance the theoretical understanding of these innovative composite structures but also provide practical design guidelines for engineering applications.

2. Experimental Program
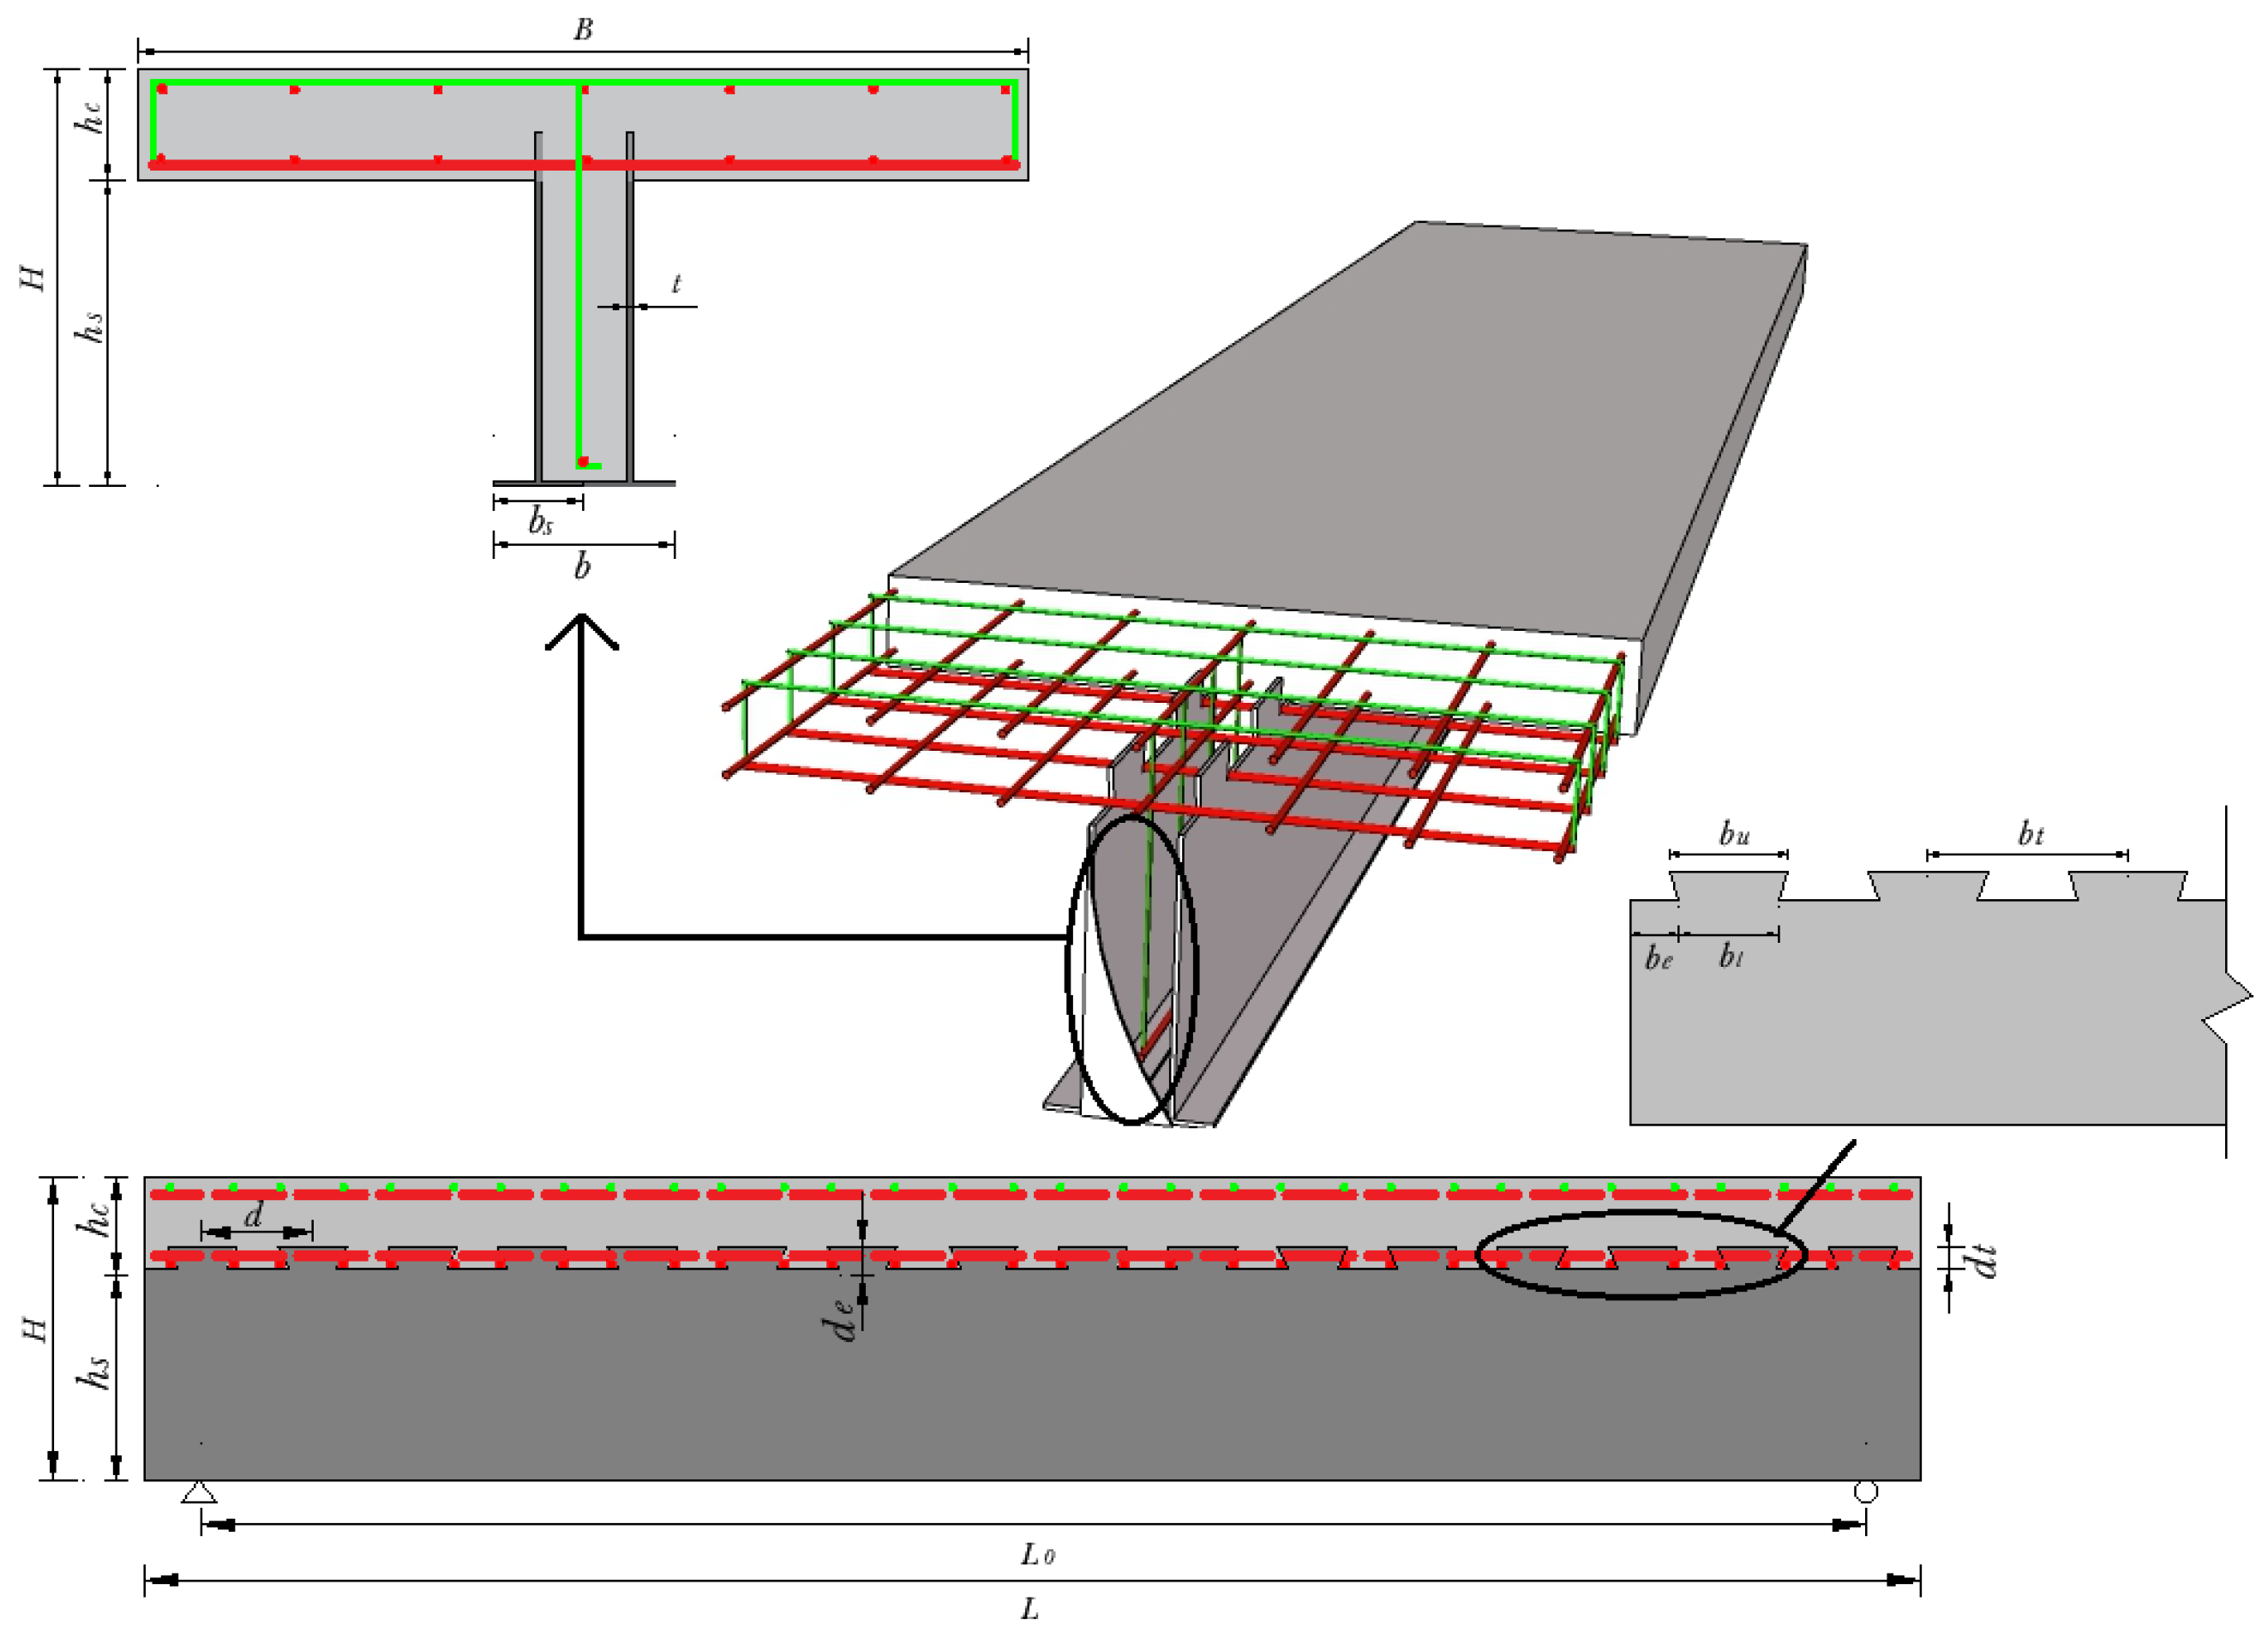
2.1. Test Specimens

The test specimen consists of double inverted T-shaped steel beams, embedded connectors, T-shaped concrete beams, and transverse diaphragms, as illustrated in Figure 1. This embedded structural design reduces steel consumption, enhances longitudinal and lateral constraints between concrete and steel beams, and improves the overall stability of the composite beam. The double inverted T-shaped steel beam, filled with concrete, ensures local stability throughout the loading process [27].
The dimensions of the specimen are depicted in Figure 2: the beam length L = 3200 mm; the effective span of the beam L0 = 3000 mm, with three transverse partitions spaced at dh = 800 mm in the midspan; and the beam height is H = 300 mm, with a concrete beam flange thickness of hc = 80 mm and a plate width of B = 640 mm. The lower flange width of the inverted T-shaped steel beam is bs = 64 mm, while the width of the double inverted T-shaped beam is b = 130 mm. The height of the steel plate embedded within the concrete is de = 35 mm, including the height of the embedded shear key at dt = 30 mm. The upper length of the shear member is bu = 88 mm and the lower length is bl = 100 mm, with shear member spacing at bt = 200 mm and a distance of be = 50 mm between the slotted shear member and the beam end. Two nominal diameters of threaded steel bars are used in the plate: 8 mm and 12 mm. The horizontal steel bars are spaced at 100 mm, and the vertical steel bars, related to the shear key spacing, are also spaced at 100 mm. The vertical single-hoop steel bar has a length of 280 mm, with spacing aligned to that of the longitudinal steel bars. The steel bar clear concrete cover is 5 mm thick.
Table 1 outlines the main size parameters of the test specimens, assigning specific numbers to each specimen based on their respective dimensional characteristics. WDTSCB-1-SS serves as the reference specimen, featuring a concrete slab width of 640 mm, an inverted T-shaped steel plate thickness of 4 mm, and a shear key spacing of 200 mm. WDTSCB-2-B760 has a concrete slab width of 760 mm. WDTSCB-3-T6 is characterized by an inverted T-shaped steel plate thickness of 6 mm, while WDTSCB-4-J300 has a shear member spacing of 300 mm. The thickness of the steel plates (t = 4 mm and t = 6 mm) is consistent for both the flange and the web. Here is a brief explanation of the parameter selection instructions. The concrete slab width (640 mm and 760 mm) was chosen based on typical engineering dimensions and structural load-bearing characteristics. The material economy and structural stability were considered for the steel plate thickness (4 mm and 6 mm). The shear connector spacing (200 mm and 300 mm) and embedded depth (35 mm) were informed by preliminary research and the anticipated interface slip behavior.

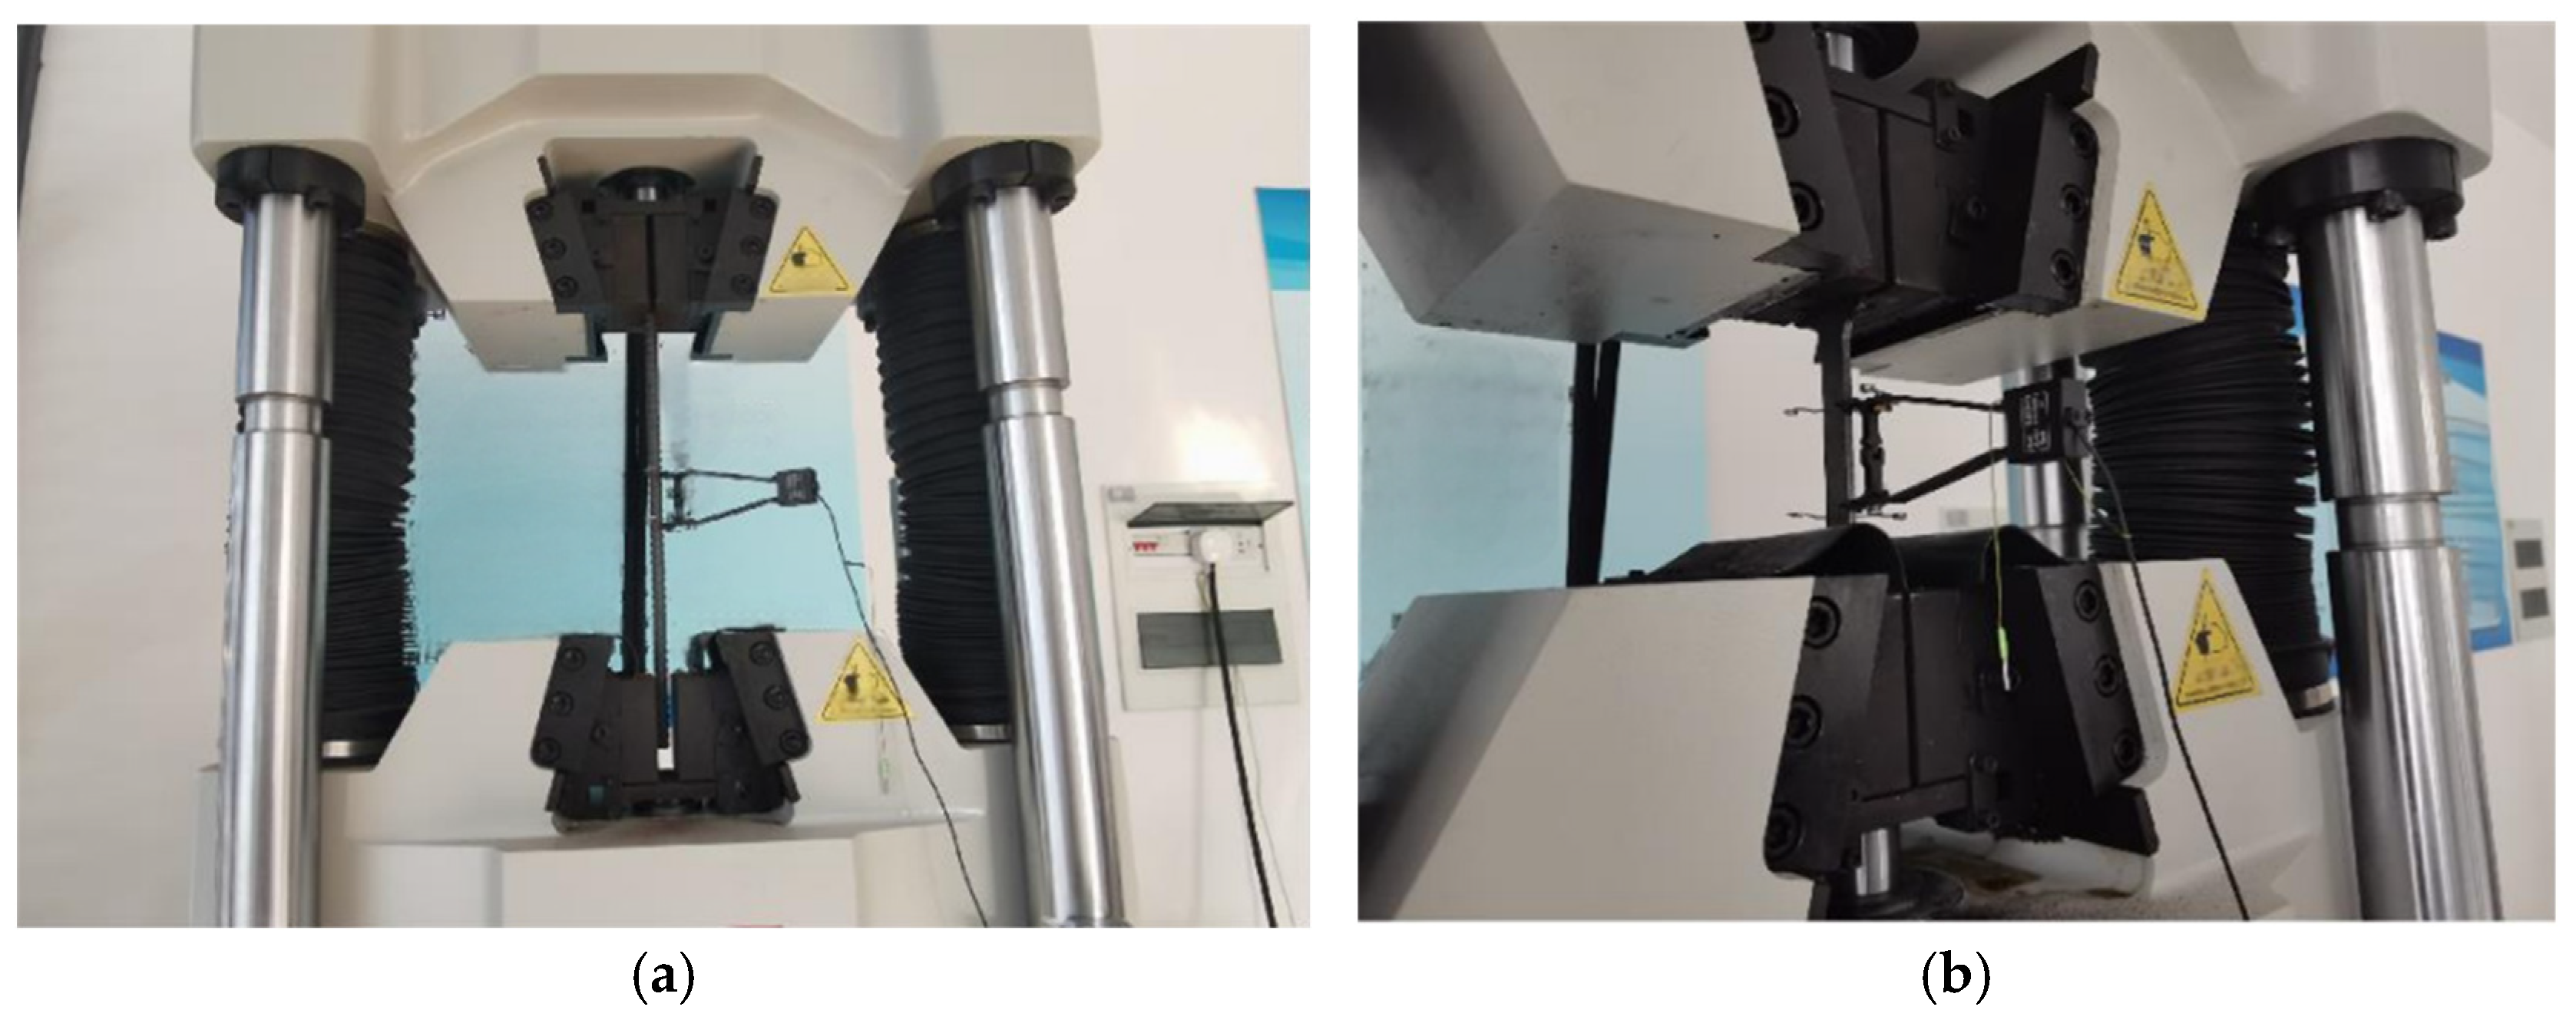
2.2. Material Properties

Figure 2 illustrates the detailed structure of the specimen, where the red sections represent C12 steel bars and the green sections indicate C8 steel bars. The transverse steel bars within the slab are positioned inside the slots, while the longitudinal steel bars in WDTSCB-4-J300 have a spacing of 118 mm.
The experiment utilized C40 concrete, Q345qB steel plate, and HRB400 steel bars. Before the experiment, the material properties of the specimens were tested in accordance with the Chinese code GB/T 228-2010 [9,10].
(1)
Mechanical properties of steel
Three sets of standard specimens were sampled from the same batch of Q345qB steel plates and steel bars for tensile testing (as shown in Figure 3). The tensile tests provided critical mechanical properties of the steel, with detailed results presented in Table 2 and Table 3.
(2)
Mechanical properties of concrete
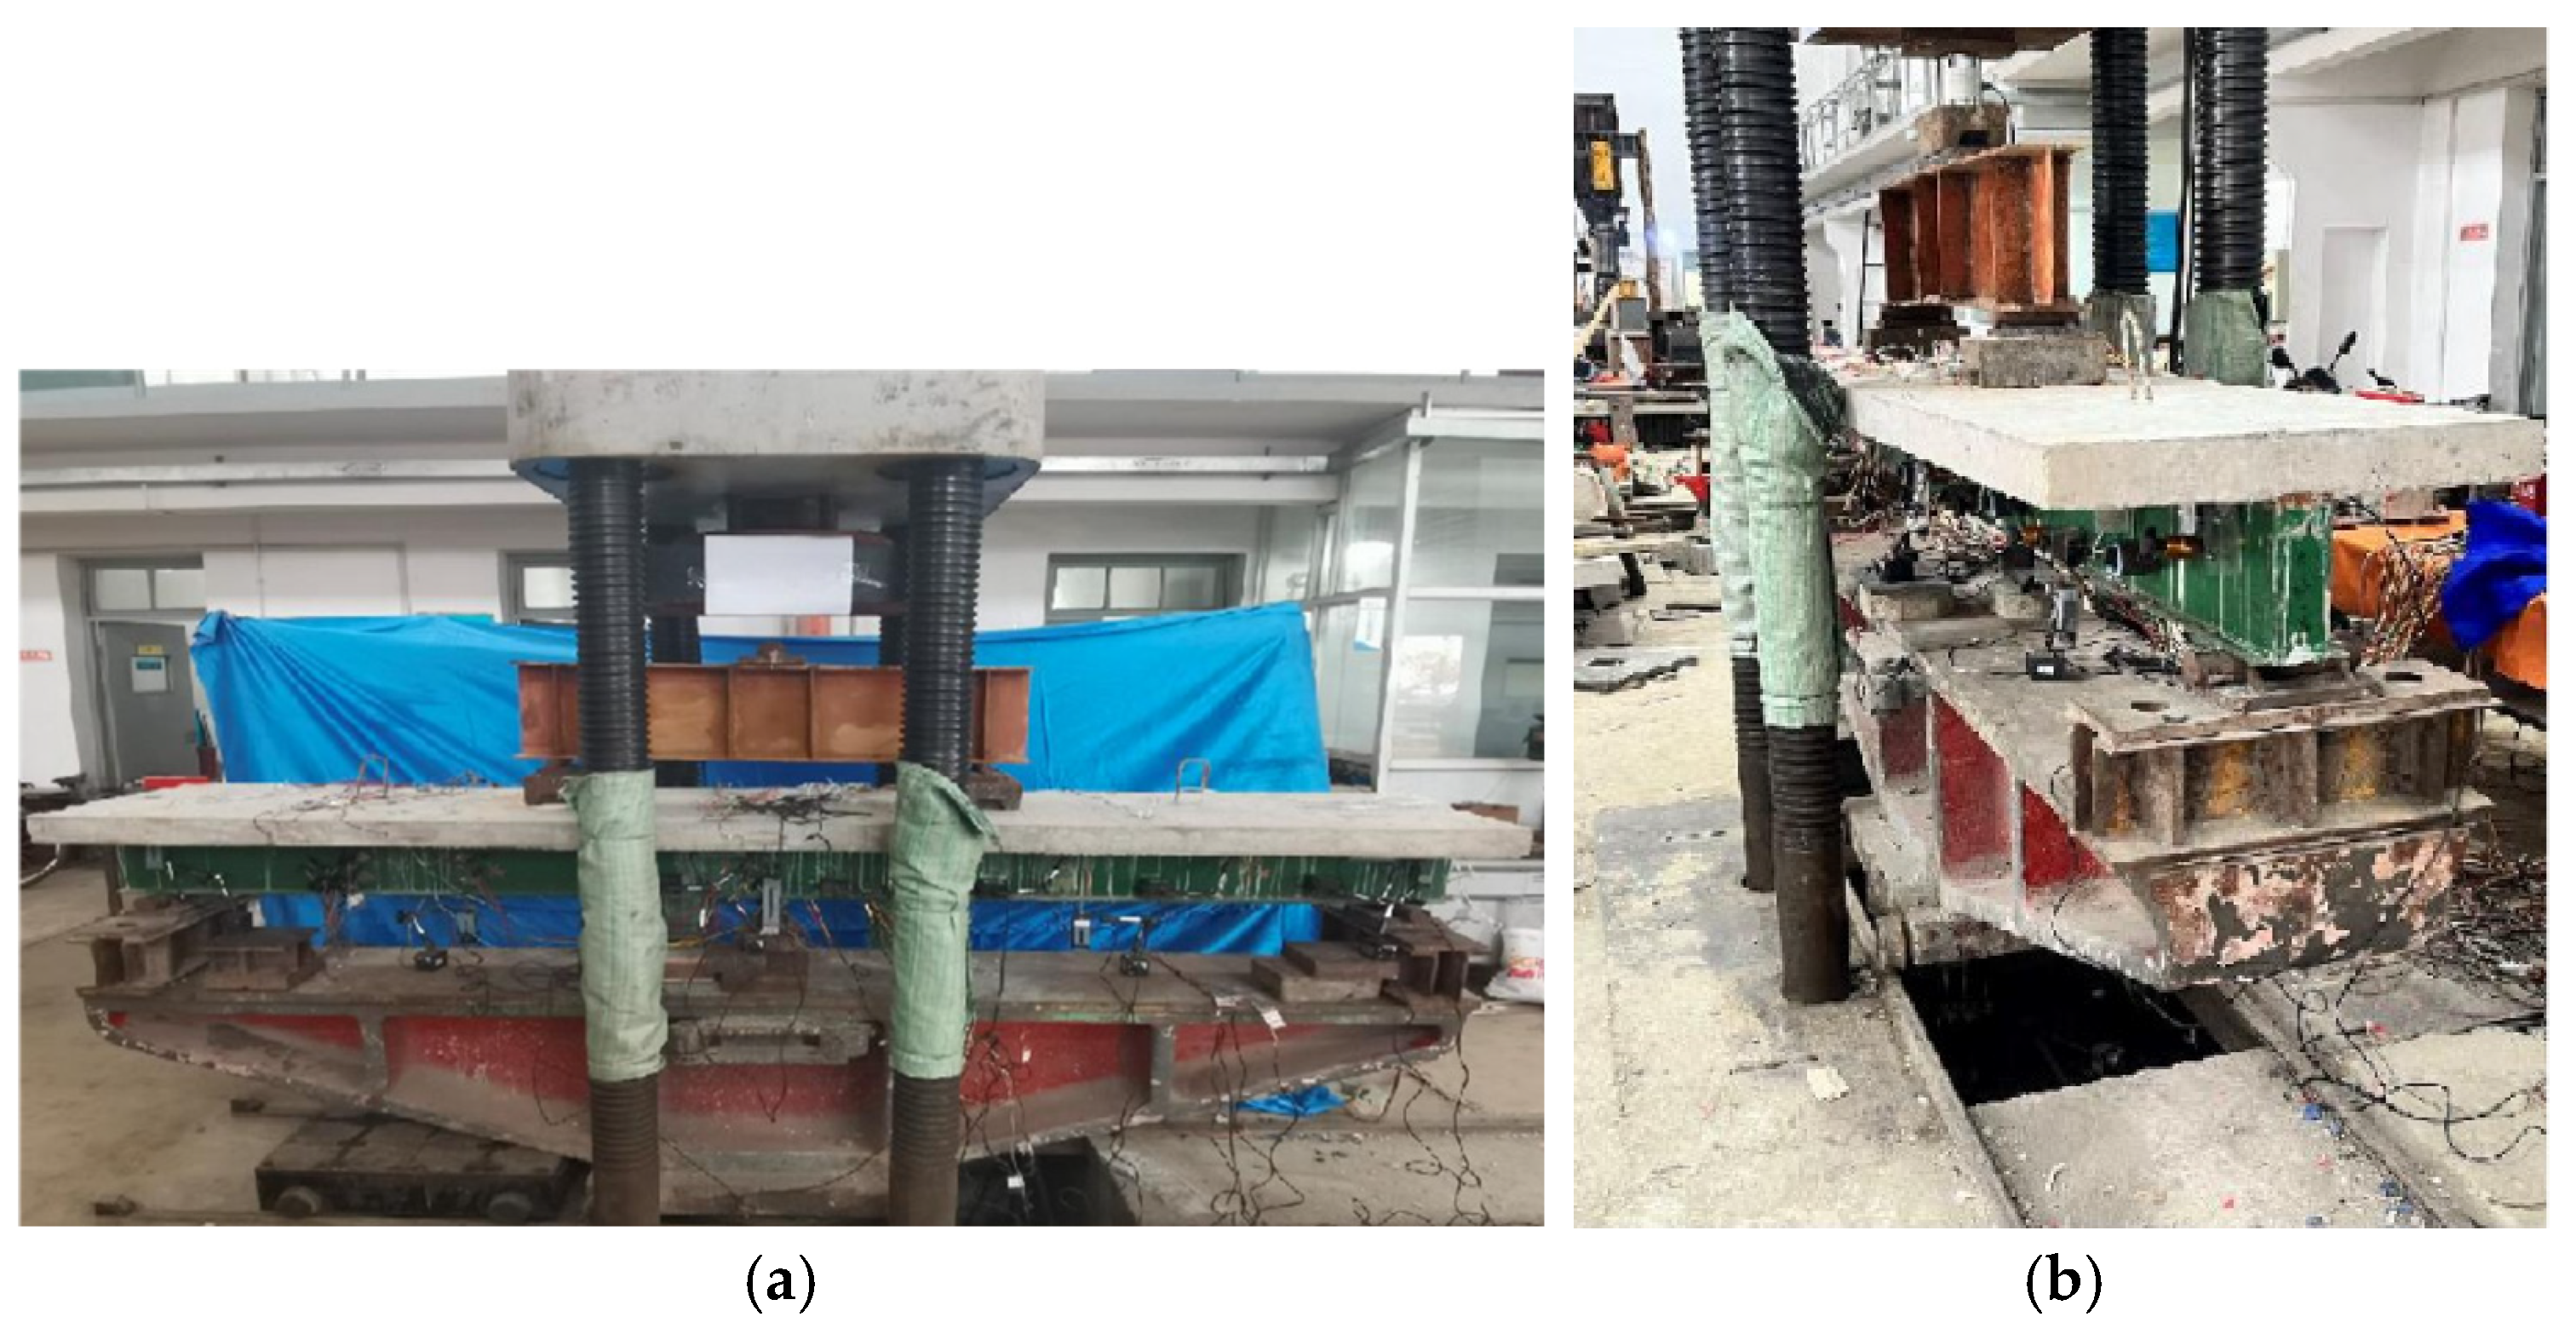
The design strength of the concrete used was C40, and commercial concrete was cast in place. During the casting of the composite beam, six standard concrete test specimens were created, each measuring 150 mm × 150 mm × 150 mm, as shown in Figure 4. These specimens were cured under identical conditions for 28 days. The compressive strength of the concrete specimens was measured using a compression testing machine, with the test procedure shown in Figure 5. The mechanical performance indicators are summarized in Table 4. The standard value of the concrete cube compressive strength was 40.7 MPa, while its axial compressive strength was calculated to be 27.2 MPa. To determine the modulus of elasticity of concrete, the formula provided by the European Committee for Standardization (CEN) in EN 1992-1-1:2004 [28] Eurocode 2: Design of concrete structures—Part 1-1: General rules and rules for buildings was utilized. The elastic modulus of the concrete was calculated according to Equation (1).
E c = 10 5 2.2 + 34.7 f c u , k   ( MPa )
where f c u . k is the standard value of the compressive strength of the concrete cube.

2.3. Loading Scheme

The WDTSCB bending failure test was conducted using a YAW-5000 loading machine (manufactured by Shandong Zhongyi Instrument Co., Ltd., Jinan, China) with a distribution beam for three-point symmetric loading, as shown in Figure 6. The test specimen was supported by a reaction frame, which included roller bearings and hinge bearings to simulate simply supported boundary conditions. The specimen was carefully adjusted with sand cushion treatment to ensure it was positioned horizontally. Load data were collected by placing a force sensor at the midpoint of the distribution beam.
Before the formal loading, the specimen undergoes pre-loading to estimate its ultimate bending-bearing capacity Mu. It is gradually loaded to 0.2Mu, and this load is held for a designated period while monitoring the readings of all instruments to ensure their stability and the normality of the load–displacement relationship. Once the detection is complete, the load is reset to zero.
The test employs a displacement-controlled loading mechanism. During the elastic loading stage, the loading rate is set to 1 mm/min, with a displacement increment of 2 mm per stage. If the load displacement curve indicates a decreasing segment, the loading rate is adjusted to 0.5 mm/min. The test concludes when clear signs of crushing appear at the loading point, indicating that the specimen has been damaged and has lost its bearing capacity [27].

2.4. Arrangement of the Strain Gauges

During the experiment, data on displacement and strain for the WDTSCB were systematically collected. The concrete sections were equipped with SZ120-60AA (manufactured by Chengdu Electric Measurement Sensor Technology Co., Ltd., Chengdu, China) resistive strain gauges, while the steel plates were fitted with BX120-3AA (manufactured by Bengbu Sensor System Engineering Co., Ltd., Bengbu, China) resistive strain gauges.
Displacement data collection encompassed several key aspects: firstly, the deflection of the composite beam was primarily measured at the mid-span and at the L0/4 sections, using displacement gauges numbered V2V5. Secondly, to measure the relative slip between the T-shaped concrete beam and the double inverted T-shaped steel beam, five displacement gauges were placed at mid-span, labeled S1S5. Lastly, the settlement of supports during loading was measured by installing two displacement gauges, numbered V1 and V6, on the concrete wing plates corresponding to the supports. The arrangement of the strain gauges is shown in Figure 7.
Strain data collection primarily involved measuring positive strains induced by pure bending. Strain gauges were longitudinally arranged and uniformly distributed across the top of the concrete wing plates, both side faces, the lower flange of the steel beams, and both side faces of the steel beam web. The arrangement of the strain gauges is shown in Figure 8.

3. Experimental Results and Discussion

3.1. Bending Resistance and Failure Mode

Figure 9 depicts the experimental phenomenon of the WDTSCB-4-J300 double inverted T-shaped steel-concrete composite beam with embedded web plates. Figure 10 presents the load–displacement curve for this composite beam. Table 5 presents the ratio of characteristic load to peak load. PCL represents the cracking load on the bottom surface of the concrete flange plate, PYL represents the mid-span yield load of the steel beam, PTY represents the 1/4 section yield load of the steel beam, PP represents the peak load, and PD represents the failure load [29].
The analysis of the experimental phenomena indicates that the test components ultimately fail due to extensive concrete crushing at the loading point, leading to a loss of load-carrying capacity in the specimens. All four components exhibit the same failure process and mode.
The development of specimen failure can be summarized in the following stages:
Elastic stage (0–PCL): The initial transverse crack emerges on the underside of the flange plate at the loading point (L0/3). As the load increases, additional fine transverse cracks develop on the lower surface of the flange plate, extending from the loading point toward the mid-span section. Vertical cracks also form on the sides of the flange plate.
Elastoplastic stage (PCLPYL): During this stage, the yield region of the double inverted T-shaped steel beam gradually extends from the mid-span section to the support points. The concrete beam does not exhibit any new horizontal or vertical cracks, but the cracks formed during the elastic stage fully develop, leading to a reduction in the overall stiffness of the component.
Plastic strengthening stage (PYLPP): At the 1/4 section, the double inverted T-shaped steel beam reaches its yield point, marking the beginning of the plastic strengthening stage. During this phase, the concrete beam develops numerous horizontal and vertical cracks, which grow and connect to form through cracks. The load continues to increase, albeit slowly, while the deflection increases rapidly. Once the cracks are fully formed, load fluctuations occur, indicating a redistribution of forces as internal cracks develop in the concrete beam. Concurrently, yielding of the steel reinforcement at the top of the slab leads to transverse cracking in the concrete, while oblique cracks appear on the sides of the flange plate. This stage culminates in the specimen reaching its peak bearing capacity.
Failure stage (PPPD): Once the specimen reaches its peak load, transverse cracks begin to form in the top layer of concrete, while oblique cracks develop on the sides of the flange plate. These transverse cracks gradually progress toward concrete crushing, and the oblique cracks on the flange plate extend toward the crushing zone, creating an oblique crushing region. At this point, the specimen can no longer sustain the applied load, signaling its failure. When damage occurs, the load curve exhibits a stepped decrease, indicative of the failure of the embedded shear connectors with tenon webs. This failure progresses sequentially from the stress point to the end of the concrete tenon. Following the damage of each concrete tenon, internal force redistribution takes place at the steel–concrete interface, resulting in a brief plateau on the load–displacement curve before ultimate failure.

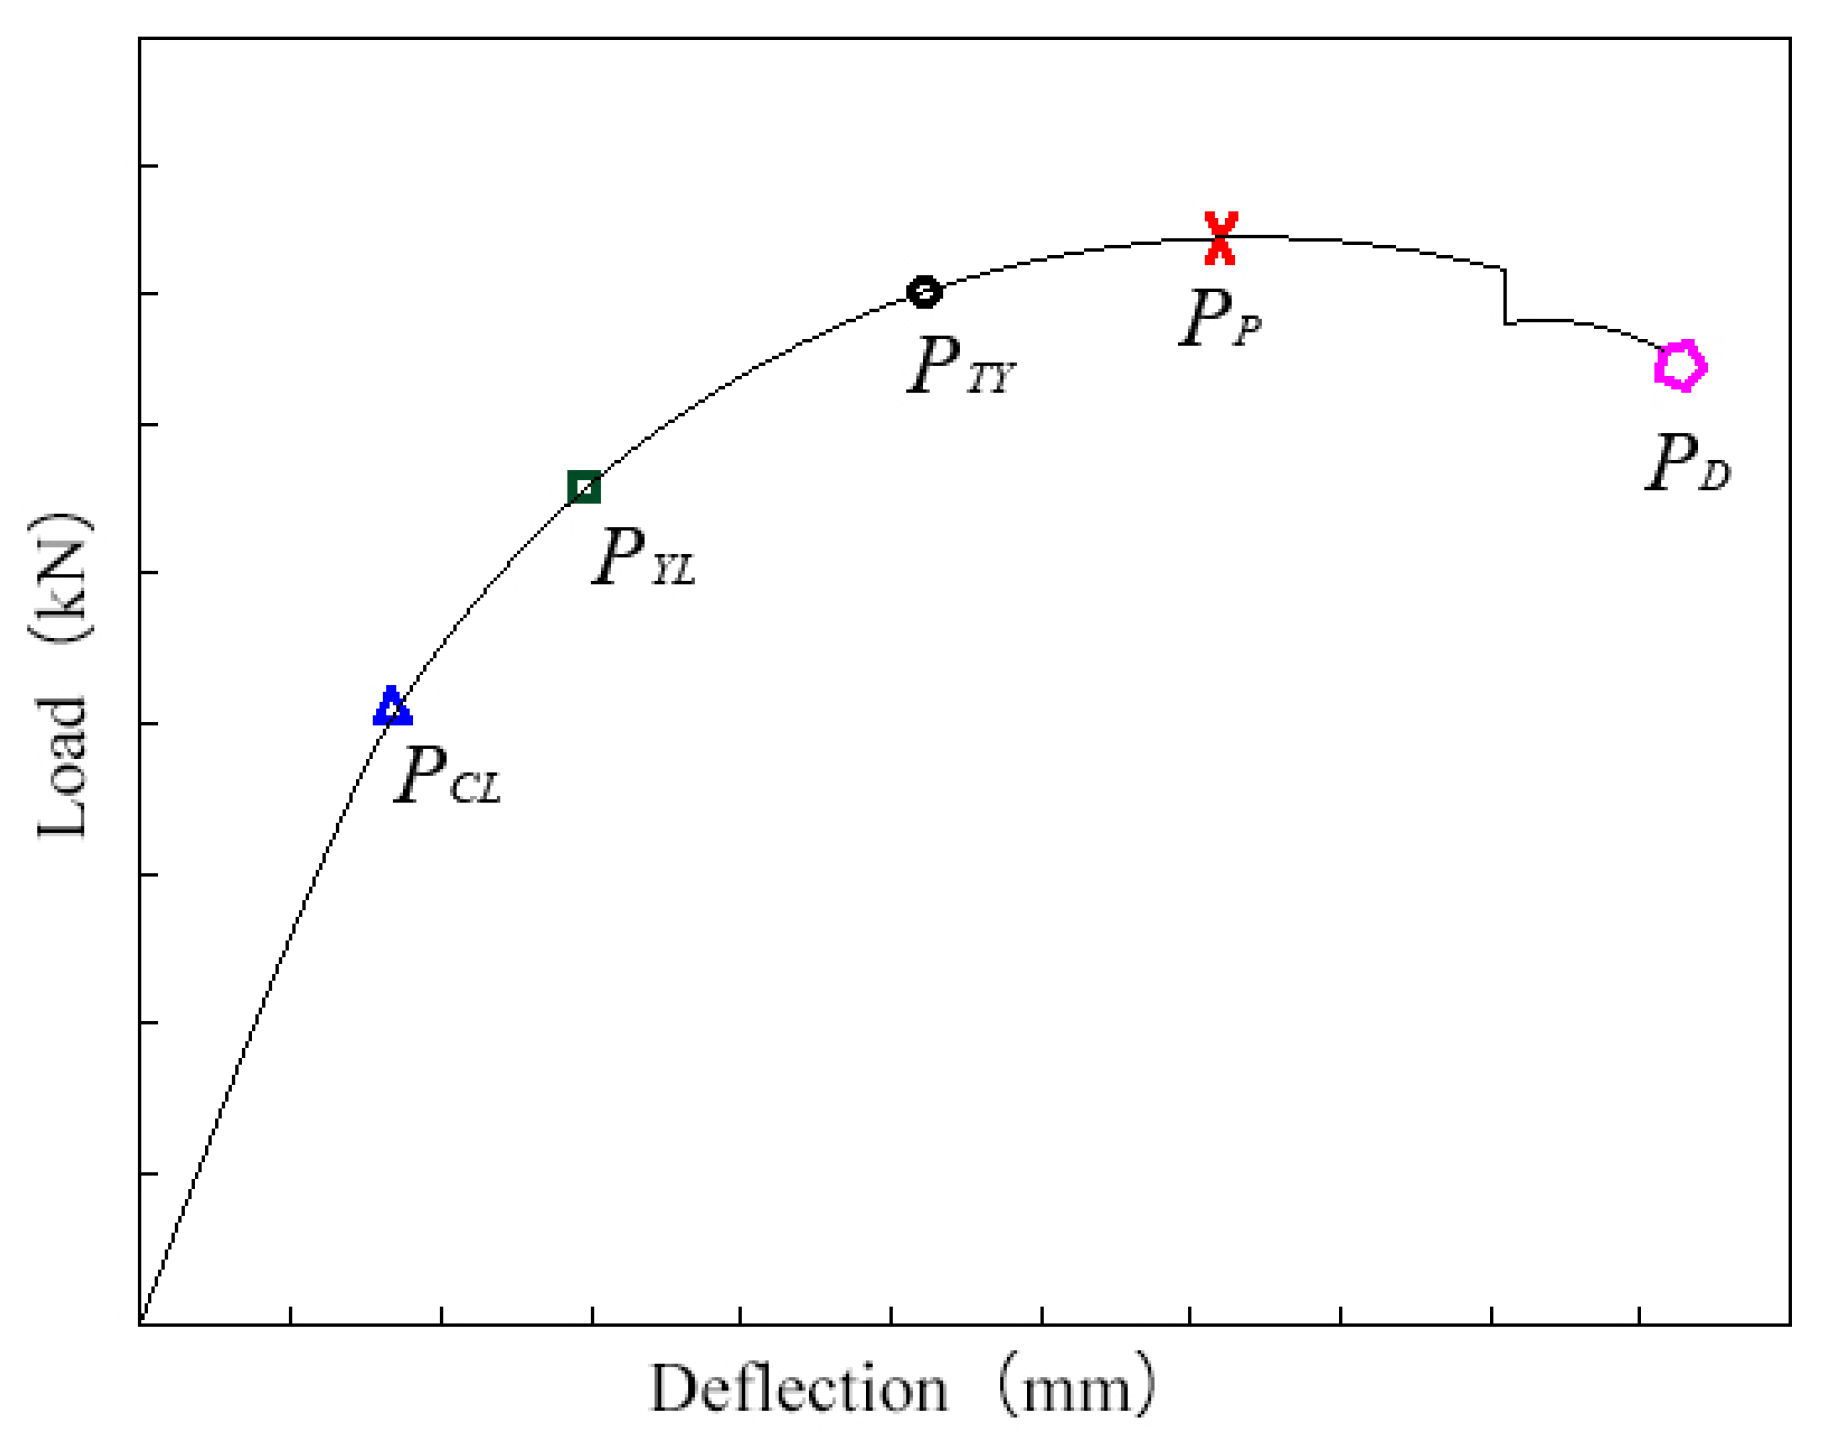
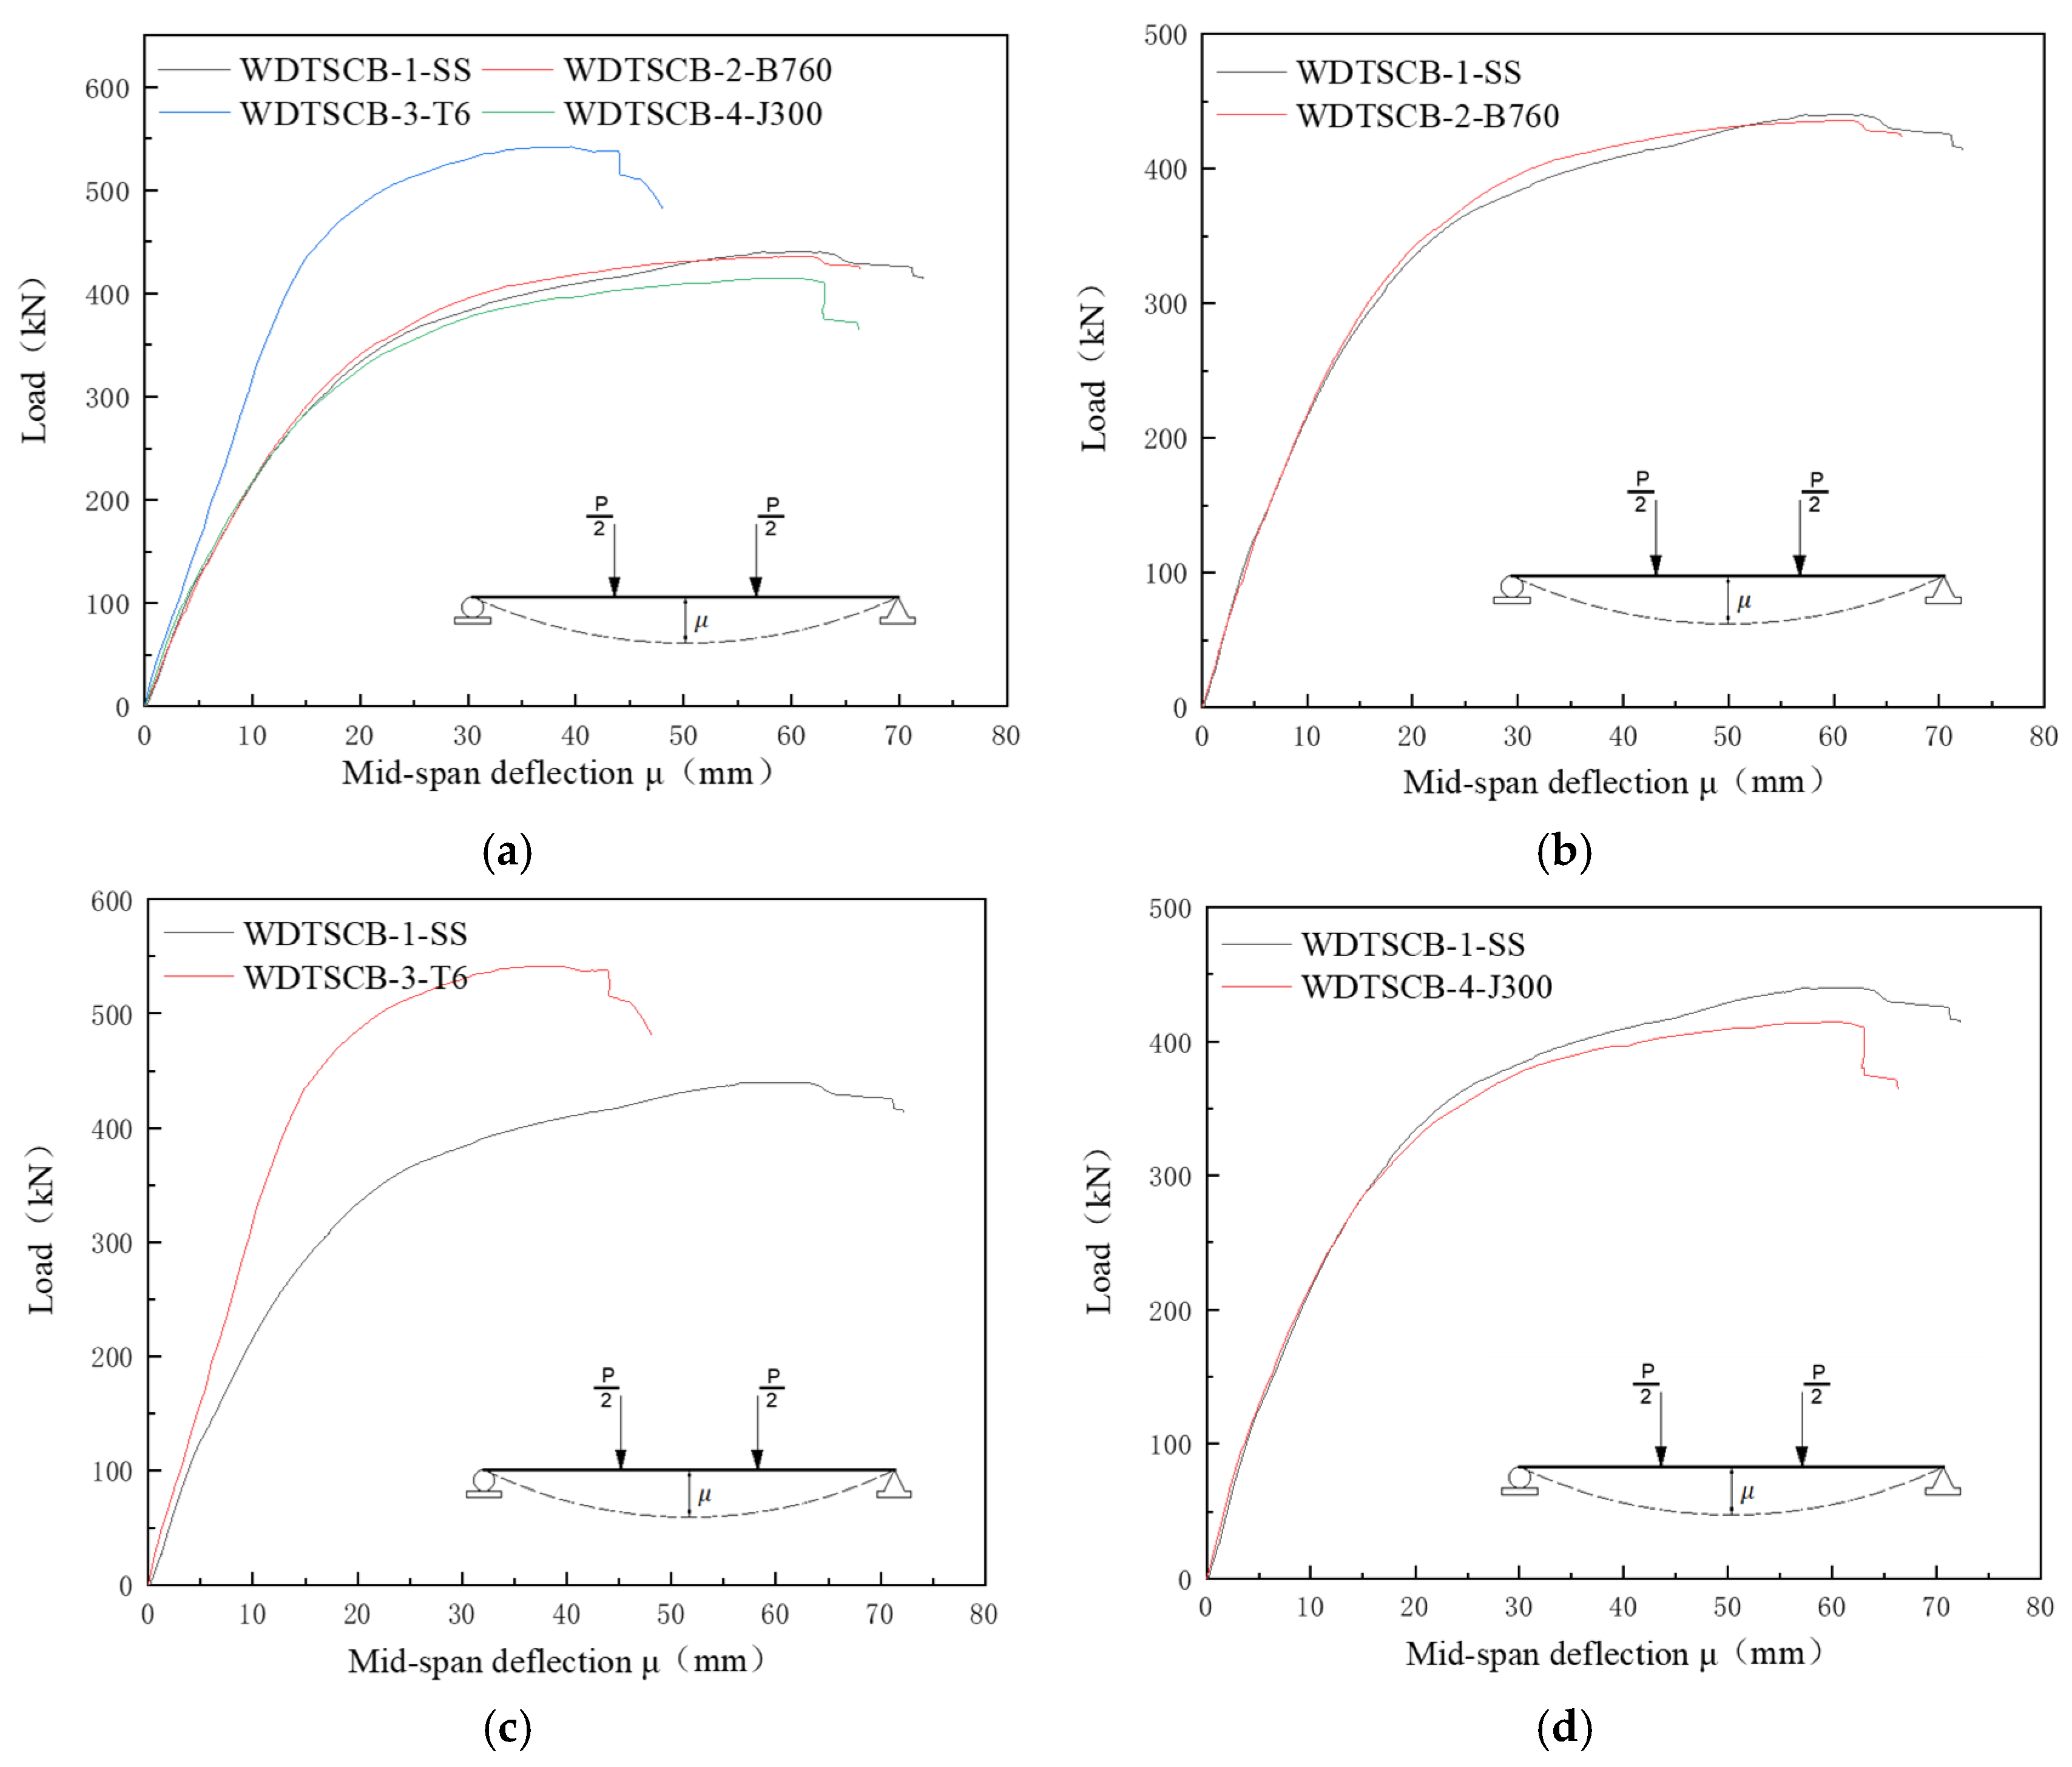
3.2. Load–Deflection Analysis

Load and Mid-Span Deflection

Figure 11 illustrates the relationship between load and mid-span deflection for the WDTSCB. In Figure 11a, a comparative curve of load–deflection for four test specimens is presented. Figure 11b–d show the load–deflection comparison curves for various specimens, focusing on different parameter conditions relative to the reference specimen (WDTSCB-1-SS). Table 6 summarizes the load and deflection data at critical nodes during the bending of the specimens. Specifically, μYL, μP, and μD denote the mid-span deflection corresponding to the section yield state, peak state, and failure state, respectively; γ = μD/μYL represents the ductility coefficient of the specimen; and δ = PP/PYL denotes the plastic development coefficient of the specimen.
Figure 11b indicates that changes in the width of the concrete flange have a minimal effect on the specimen’s stiffness and load-bearing capacity. However, increasing the flange width reduces the ductility of the specimen and weakens its plastic development. Compared to the reference specimen WDTSCB-1, the WDTSCB-2 specimen has a larger cross-sectional area in the compression zone. In the WDTSCB-2 specimen, significant mid-span deflection occurred before the concrete and internal reinforcement at the flange edges had fully developed, which led to the failure of the edge concrete and rendered the specimen non-functional. In contrast, the WDTSCB-1 specimen exhibited more pronounced plastic development and a more controlled failure. Therefore, the effective width of the concrete flange should be carefully considered in the design of WDTSCB to optimize performance.
Figure 11c demonstrates that increasing the thickness of the double inverted T-beam significantly enhances both the stiffness and the load-bearing capacity of the specimen. Specifically, compared to the reference specimen (t = 4 mm), WDTSCB-3 (t = 6 mm) exhibits a 25.5% increase in yield load and an 18.6% increase in peak load. However, due to the thicker steel plate in the WDTSCB-3 specimen, plastic development was insufficient at failure.
Figure 11d reveals that changes in the spacing of shear connectors have a minimal effect on the initial stiffness of the component but significantly reduce its load-bearing capacity. Compared to the reference specimen WDTSCB-1, WDTSCB-4 shows a 5.9% reduction in load-bearing capacity. During the elastic stage, the load-deflection curves for WDTSCB-4 (bt = 300 mm) and the reference specimen (bt = 200 mm) are nearly identical, indicating comparable initial stiffness. However, in the plastic development stage, the larger spacing of shear connectors in WDTSCB-4 results in greater relative slip and uplift at the steel-concrete interface. This compromise in the overall integrity of the component leads to a notable reduction in load-bearing capacity and insufficient plastic development.

4. Finite Element Analysis

The finite element analysis was conducted using ABAQUS software (version 6.14). The concrete and steel beams were modeled using C3D8R elements, while the reinforcement bars were modeled using T3D2 elements. The mesh size was set to 50 mm for concrete and 30 mm for steel to ensure accurate results.

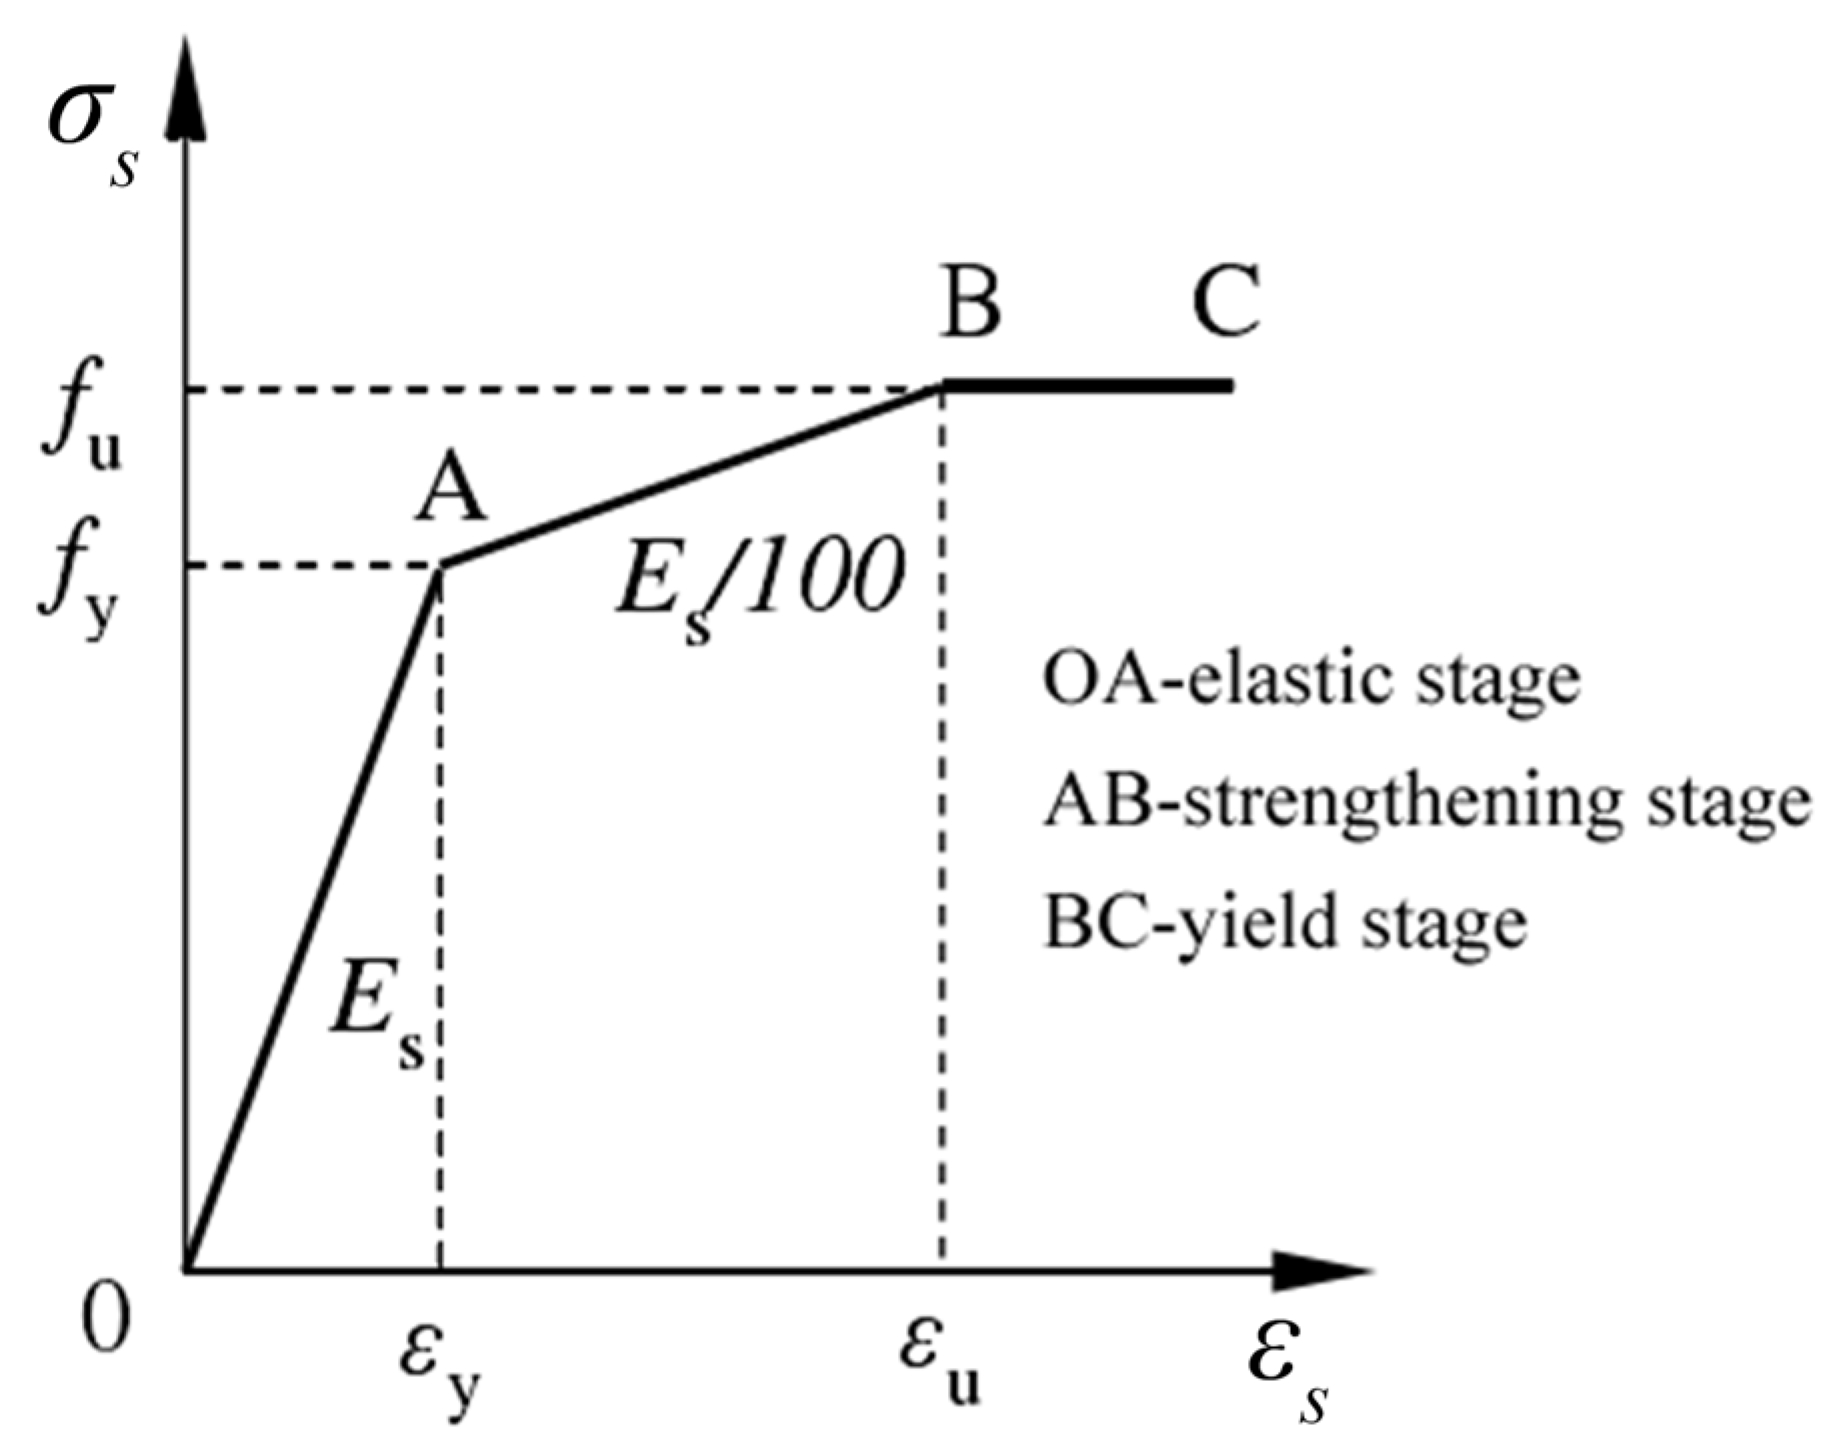
4.1. Material Constitutive Relationship

(1)
Constitutive relationship of steel
Steel is a homogeneous material with consistent mechanical properties under both tensile and compressive stresses. The constitutive relationship of steel, including steel plates and steel bars, follows a trilinear elastic–plastic strengthening model. The trilinear elastic–plastic strengthening model was adopted for the steel constitutive relationship to accurately capture the material behavior under both tensile and compressive stresses. This model aligns with the experimental tensile test results, providing a reliable representation of the steel’s elastic, yield, and hardening phases. The performance parameters of steel are derived from tensile tests, with a Poisson’s ratio of 0.3. The stress–strain curve of steel is illustrated in Figure 12.
The uniaxial stress–strain curve of steel is determined according to Equation (2):
σ s = E s ε s ε s ε y f y + k ε u ε y ε y < ε s ε u 0 ε s > ε u
where:
  • E s is the elastic modulus of steel;
  • ε s is the steel strain;
  • σ s is the steel stress;
  • f y is the yield strength of steel;
  • ε y is the yield strain of steel, ε y = f y / E s ;
  • k is the slope of hardened section of steel, k = 0.01 E s ;
  • ε u is the peak strain of steel.
(2)
Constitutive relationship of concrete
Concrete is a composite material made up of various components, which may contain micropores, microcracks, and other forms of material damage. This damage accumulates and evolves during the process of concrete failure under stress, making it challenging to accurately simulate the true constitutive behavior of concrete using plastic theory alone [30]. Therefore, the constitutive model for concrete adopts the plastic damage constitutive model recommended by the latest edition (2015) of the “Code for Design of Concrete Structures” (GB50010-2010) [31].
The stress–strain curve of concrete under uniaxial tension (Figure 12) can be determined according to Equation (3) [10]:
σ = ( 1 d t ) E c ε
d t = 1 ρ t 1.2 0.2 x 5 x 1 1 ρ t α t x 1 1.7 + x x > 1
x = ε ε t . r
ρ t = f t . r E c ε t . r
where:
  • α t is the parameter value of the descending section of the uniaxial tensile stress–strain curve of concrete, detailed in reference [10];
  • f t . r is the representative value of the uniaxial tensile strength of concrete, which can be taken as f t , f t k , or f t m based on the actual structural analysis needs;
  • ε t . r is the peak tensile strain of concrete—see reference [10];
  • d t is the evolution parameter of concrete uniaxial tensile damage.
The stress–strain curve of concrete under uniaxial compression (Figure 13) is determined according to Equation (4):
σ = 1 d c E c ε
d c = 1 ρ c n n 1 + x n x 1 1 ρ c α c x 1 2 + x x > 1
ρ c = f c . r E c ε c . r
n = E c ε c . r E c ε c . r f c . r
x = ε ε t . r
where:
  • α c is the parameter value for the descending section of the stress–strain curve of concrete under uniaxial compression, detailed in reference [10];
  • f c . r is the representative value of the uniaxial compressive strength of concrete, which can be taken as f c , f c k , or f c m based on the actual structural analysis needs;
  • ε c . r is the peak compressive strain of concrete—see reference [10];
  • d c is the damage evolution parameter of concrete under uniaxial compression.
Figure 13. Uniaxial stress–strain curve of concrete.
Buildings 15 00717 g013
The calculation parameters of the concrete damage plasticity model are shown in Table 7.
In the formula, ψ is the expansion angle, ε is the flow potential offset value, f b 0 / f c 0 is the ratio of biaxial ultimate compressive strength to uniaxial ultimate tensile strength, K c is the ratio of the second stress invariant on the tensile meridional plane to the compressive meridional plane, and μ represents the viscosity coefficient [32].

4.2. Element Selection

The bending resistance of composite beams cannot be accurately simulated without accounting for the influence of shear member thickness and concrete tenon thickness on WDTSCB, which is effectively connected via embedded shear members in the web. To ensure accuracy, solid elements are selected for both the concrete and the steel plates. In order to enhance the bending stiffness of the element and improve displacement calculation accuracy, the C3D8R (8-node hexahedral linear reduced integral element) is employed to simulate the bending performance of the composite beams. This element mitigates false shear strain under bending loads and exhibits minimal accuracy errors even in the presence of distortion during deformation. Both the concrete and the steel beams are modeled using the C3D8R element. Due to the relatively small bending stiffness of steel bars, only their tensile and compressive effects are considered in the analysis. Consequently, the three-dimensional linear truss element T3D2 is used for the steel bars in the slab [32].

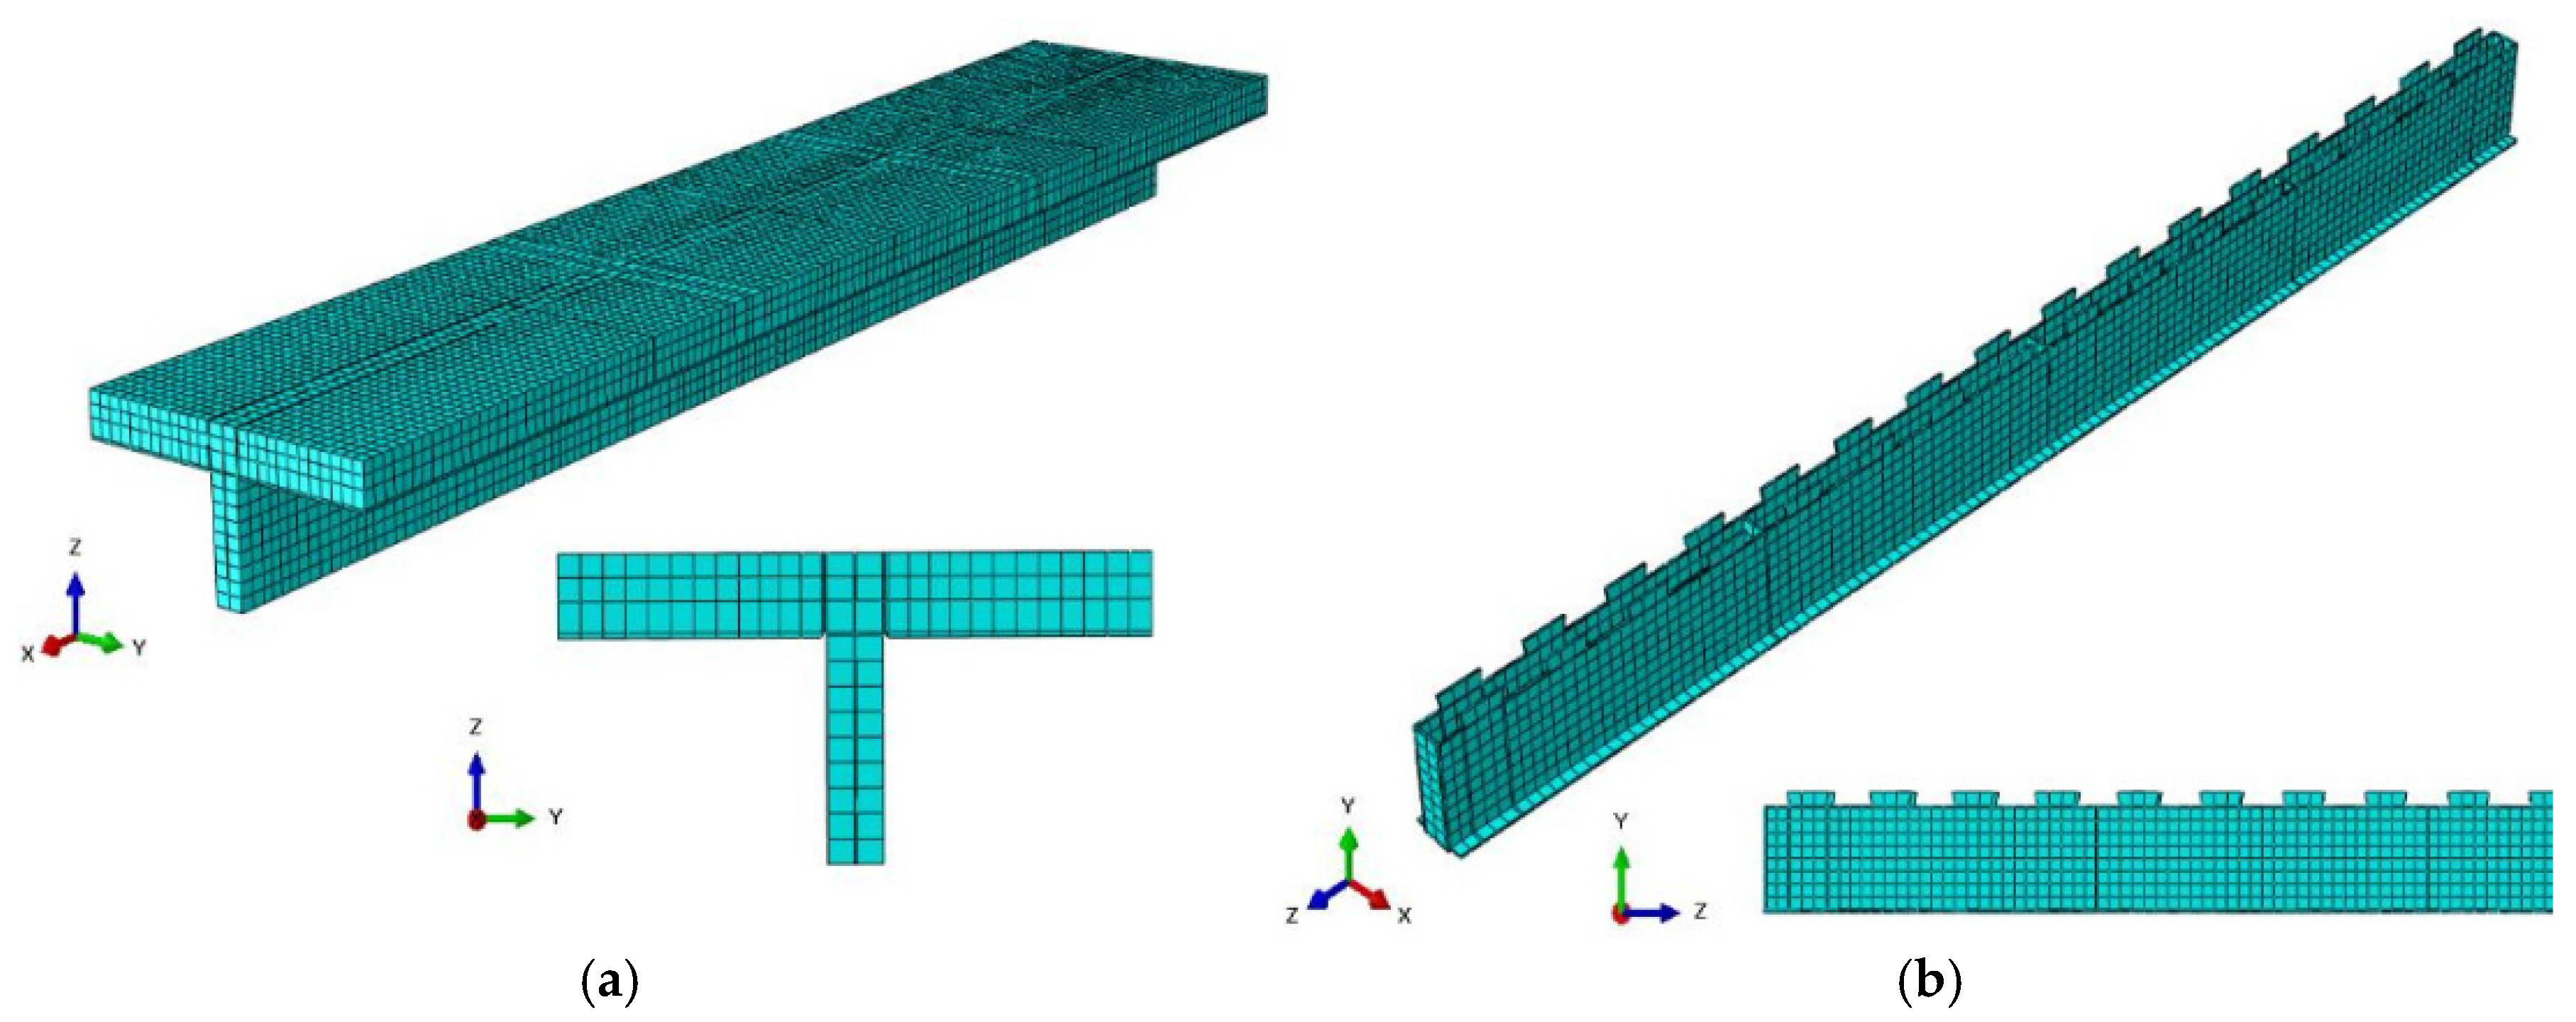
4.3. Geometry Establishment and Mesh Division

In the finite element simulation, it is very important to select the appropriate mesh size, and it is necessary to find a balance between accuracy and computational cost. A smaller mesh size can provide higher simulation accuracy because it can more accurately capture the geometry and stress distribution of the structure. However, it also means more nodes and cells, which significantly increases the demand for computing time and resources. In addition, the specific physical characteristics of the problem need to be considered in the selection of mesh size. For example, a finer mesh may be required in the stress concentration area or at the material interface to accurately capture the local behavior. Convergence verification is also an indispensable part. Ideally, as the mesh size gradually decreases, the simulation results should tend to be stable. This process is called convergence. If the results change significantly with mesh refinement, it indicates that the current mesh may not be sufficient to capture the key features of the structure. By comprehensively considering these factors, we can optimize the computational efficiency while ensuring the accuracy of the simulation.
Hexahedral meshes offer significant advantages over three-dimensional tetrahedral meshes in terms of computational accuracy, deformation characteristics, number of mesh divisions, and resistance to distortion. The specimen should be cut and partitioned to obtain regular hexahedral elements. To guarantee precise and efficient calculations, we adopted the following unit sizes: 50 mm for the concrete solid unit, 30 mm for the double inverted T-shaped steel beam solid element, and 40 mm for the steel truss element. Figure 14 displays the results of the mesh division.

4.4. Interaction

(1)
Merge
The double inverted T-shaped steel plate, end partition, and transverse partition are merged into a single unit by simulating the welding of the steel plate. Similarly, the steel bars are merged into a single unit by simulating the binding of the steel mesh.
(2)
Tie
Bind the distribution beam, support pad, and composite beam together to create a secure connection.
(3)
Coupling
A reference point (RP) is established at the center of the bearing pad on the side of the loading beam that is not in contact with the combined beam. The face is kinematically coupled to the reference point using kinematic coupling.
(4)
Contact
Frictional contact is defined as the interaction between double inverted T-shaped steel plates, embedded connectors, concrete, and concrete tenons. The coefficient of friction between assembled members depends mainly on the specifics of the actual engineering application, such as the condition of the contact surfaces, regardless of whether any interfacial treatment has been used. It may be due to multiple uncertainties, such as the incompactness of concrete vibration on the contact surfaces. This finite element simulation is carried out by testing the effect of different friction coefficients on the results and finally determining the friction coefficient that meets the conditions of the experiment. Penalty contact is used in the tangential direction, and small slip effects are considered, with a friction coefficient of 0.3 [32].
(5)
Embedded Region
The steel mesh is embedded in the concrete.

4.5. Boundary Conditions and Loading Control

The boundary conditions for the finite element simulation are identical to those of the experiment. Figure 15 illustrates the boundary and loading conditions of the finite element model. Throughout the loading process, the cushion blocks and plates function solely as force transmitters, without accounting for their deformation; thus, they are modeled as rigid bodies [32].
(1)
Boundary
Simple support constraints are applied to the coupling reference points RP-3 and RP-4 of the support pad. The displacement constraint in the Z direction and the rotation constraint in the X direction for the left coupling reference point are released to simulate a sliding hinge support. For the right end coupling reference point, only the rotation in the X direction is constrained to simulate a fixed hinge support.
(2)
Load
The composite beam is subjected to a load through a distribution beam that is connected to reference points RP-1 and RP-2. Displacement loading is then carried out on the coupling reference point.

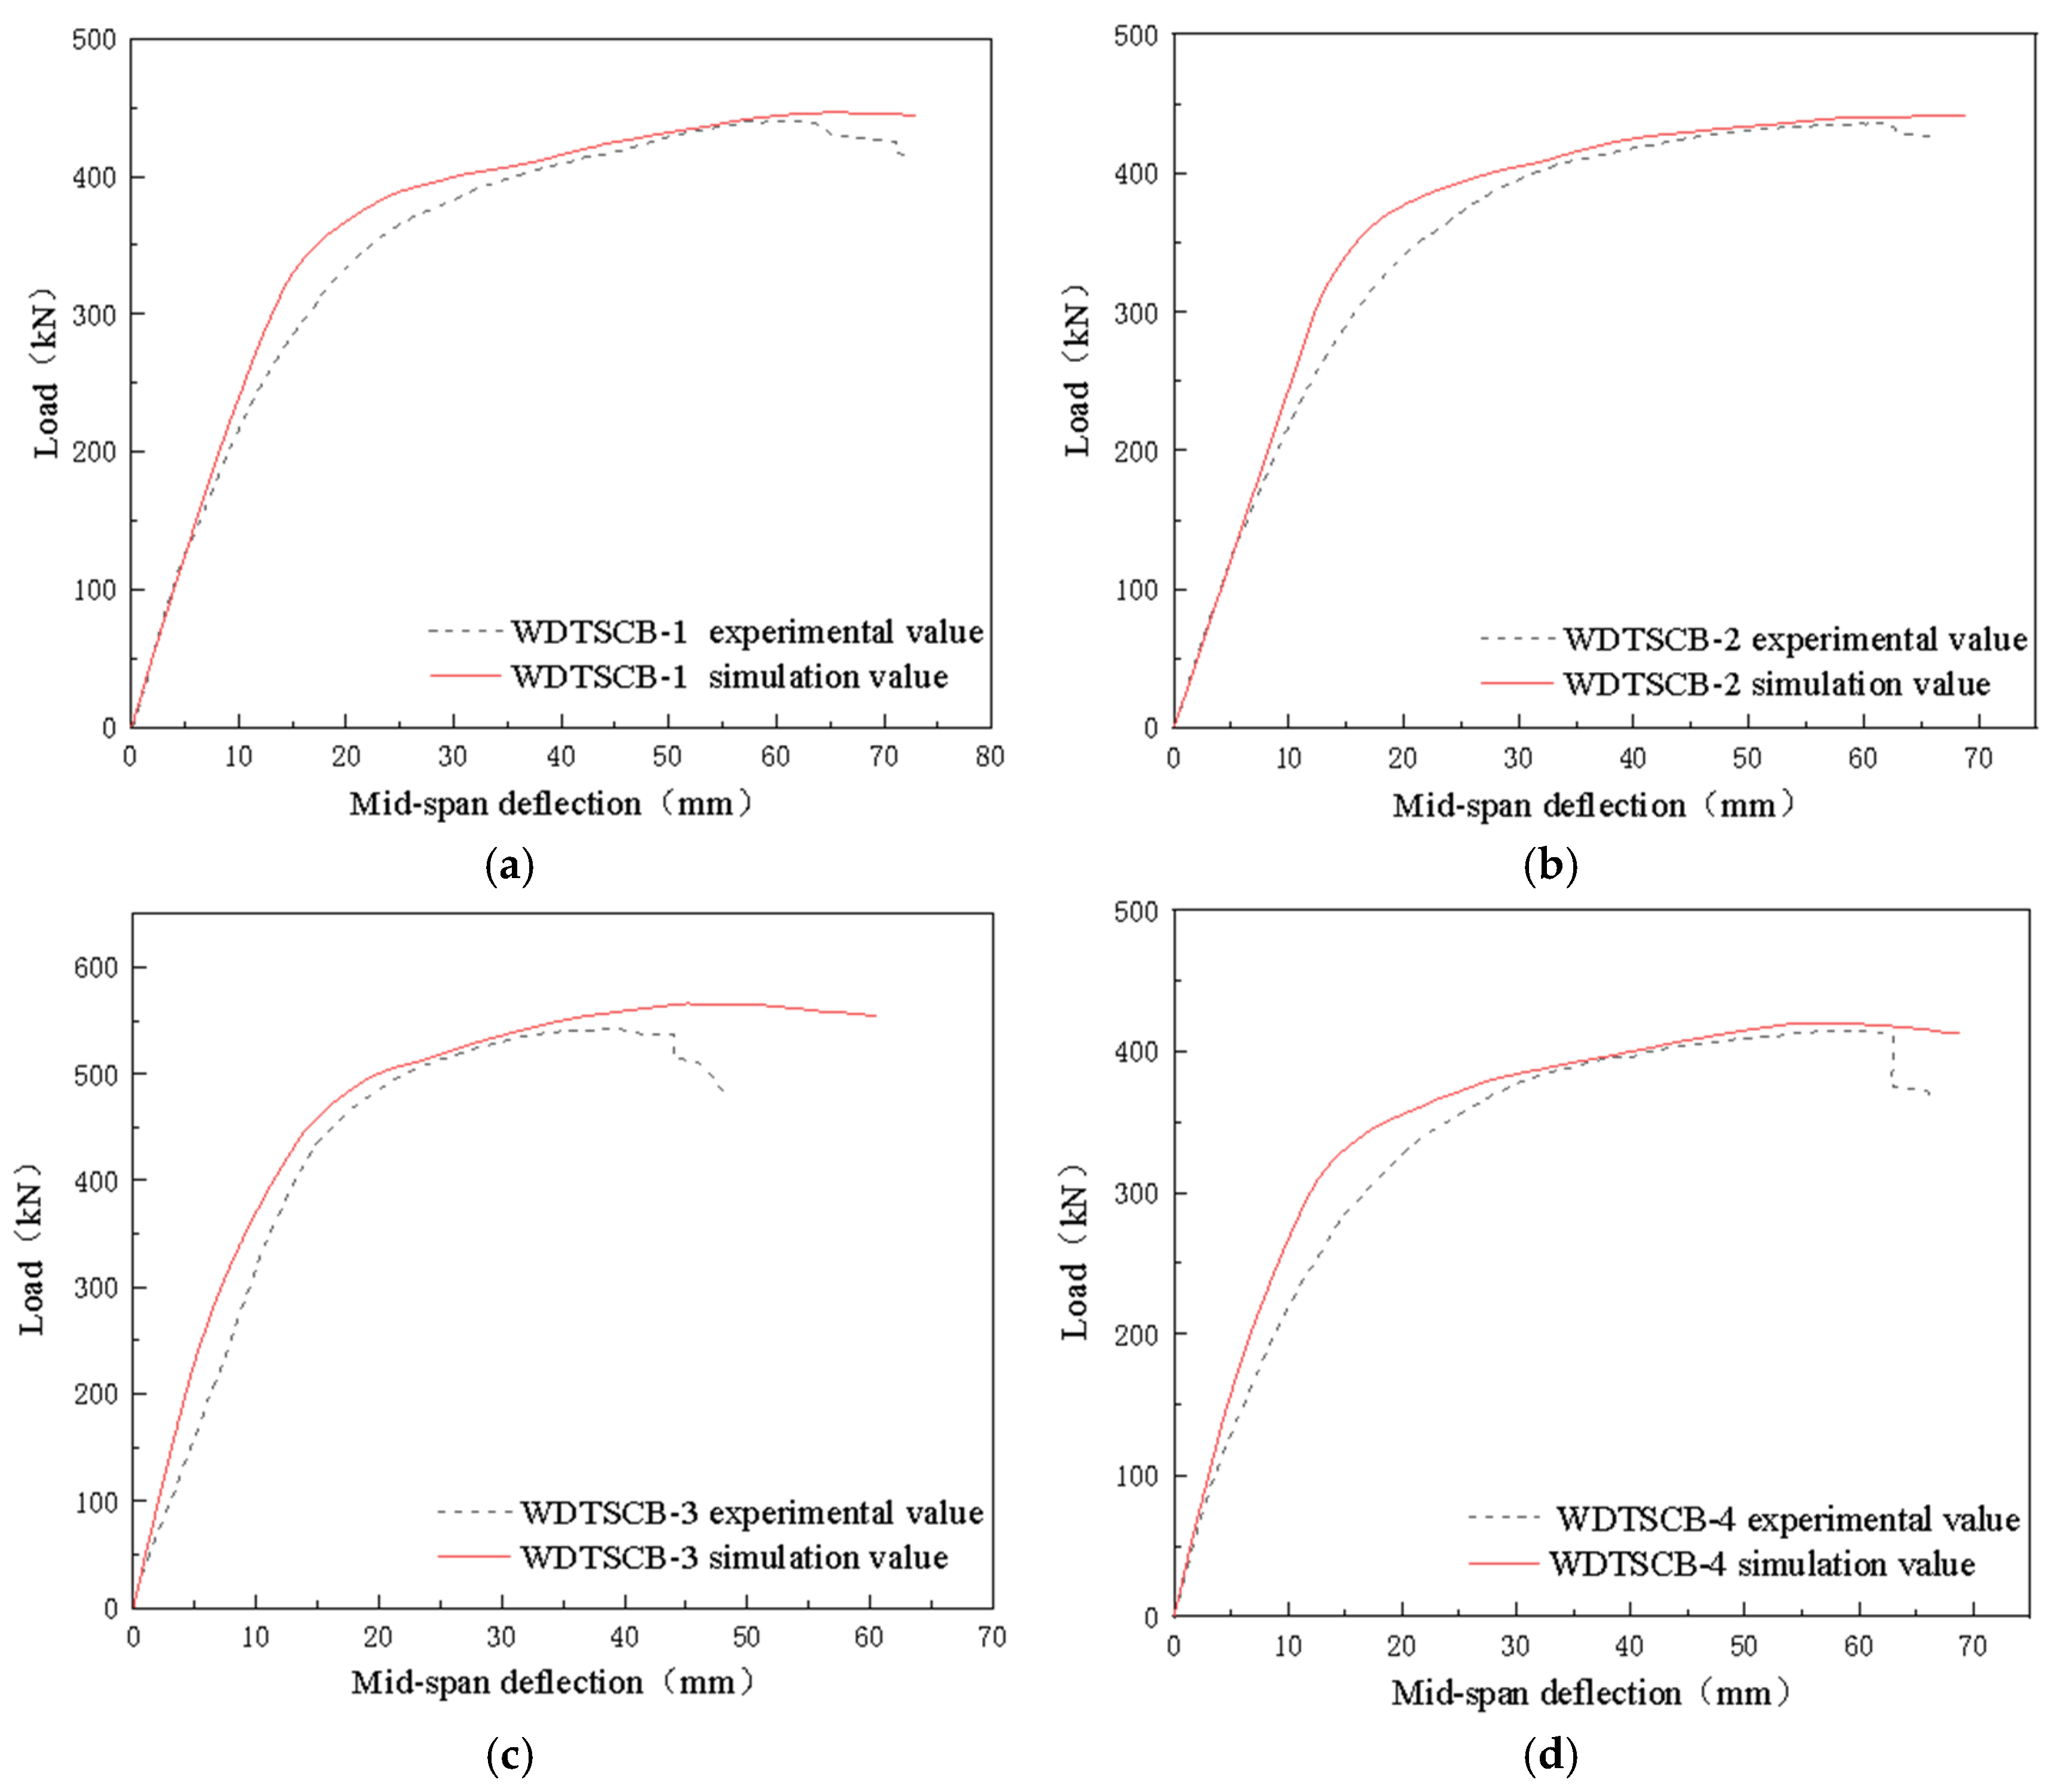
4.6. Finite Element Simulation Verification

(1)
Comparison of load and deflection curves
Using the aforementioned method, four finite element models of the WDTSCB were established. Figure 16 shows the comparison curve between the experimental and simulated values of the WDTSCB load displacement. From Figure 16, it can be seen that the finite element simulation values are generally in good agreement with the experimental values. However, due to the omission of internal defects and other factors in the finite element simulation, the overall calculated stiffness tends to be slightly higher than the experimental stiffness. Table 8 summarizes the peak loads from both the finite element simulation and the experiments, revealing an error margin of within 5% between the simulated and experimental values. Overall, the ABAQUS finite element model developed in this study effectively simulates the entire bending process of the WDTSCB.
(2)
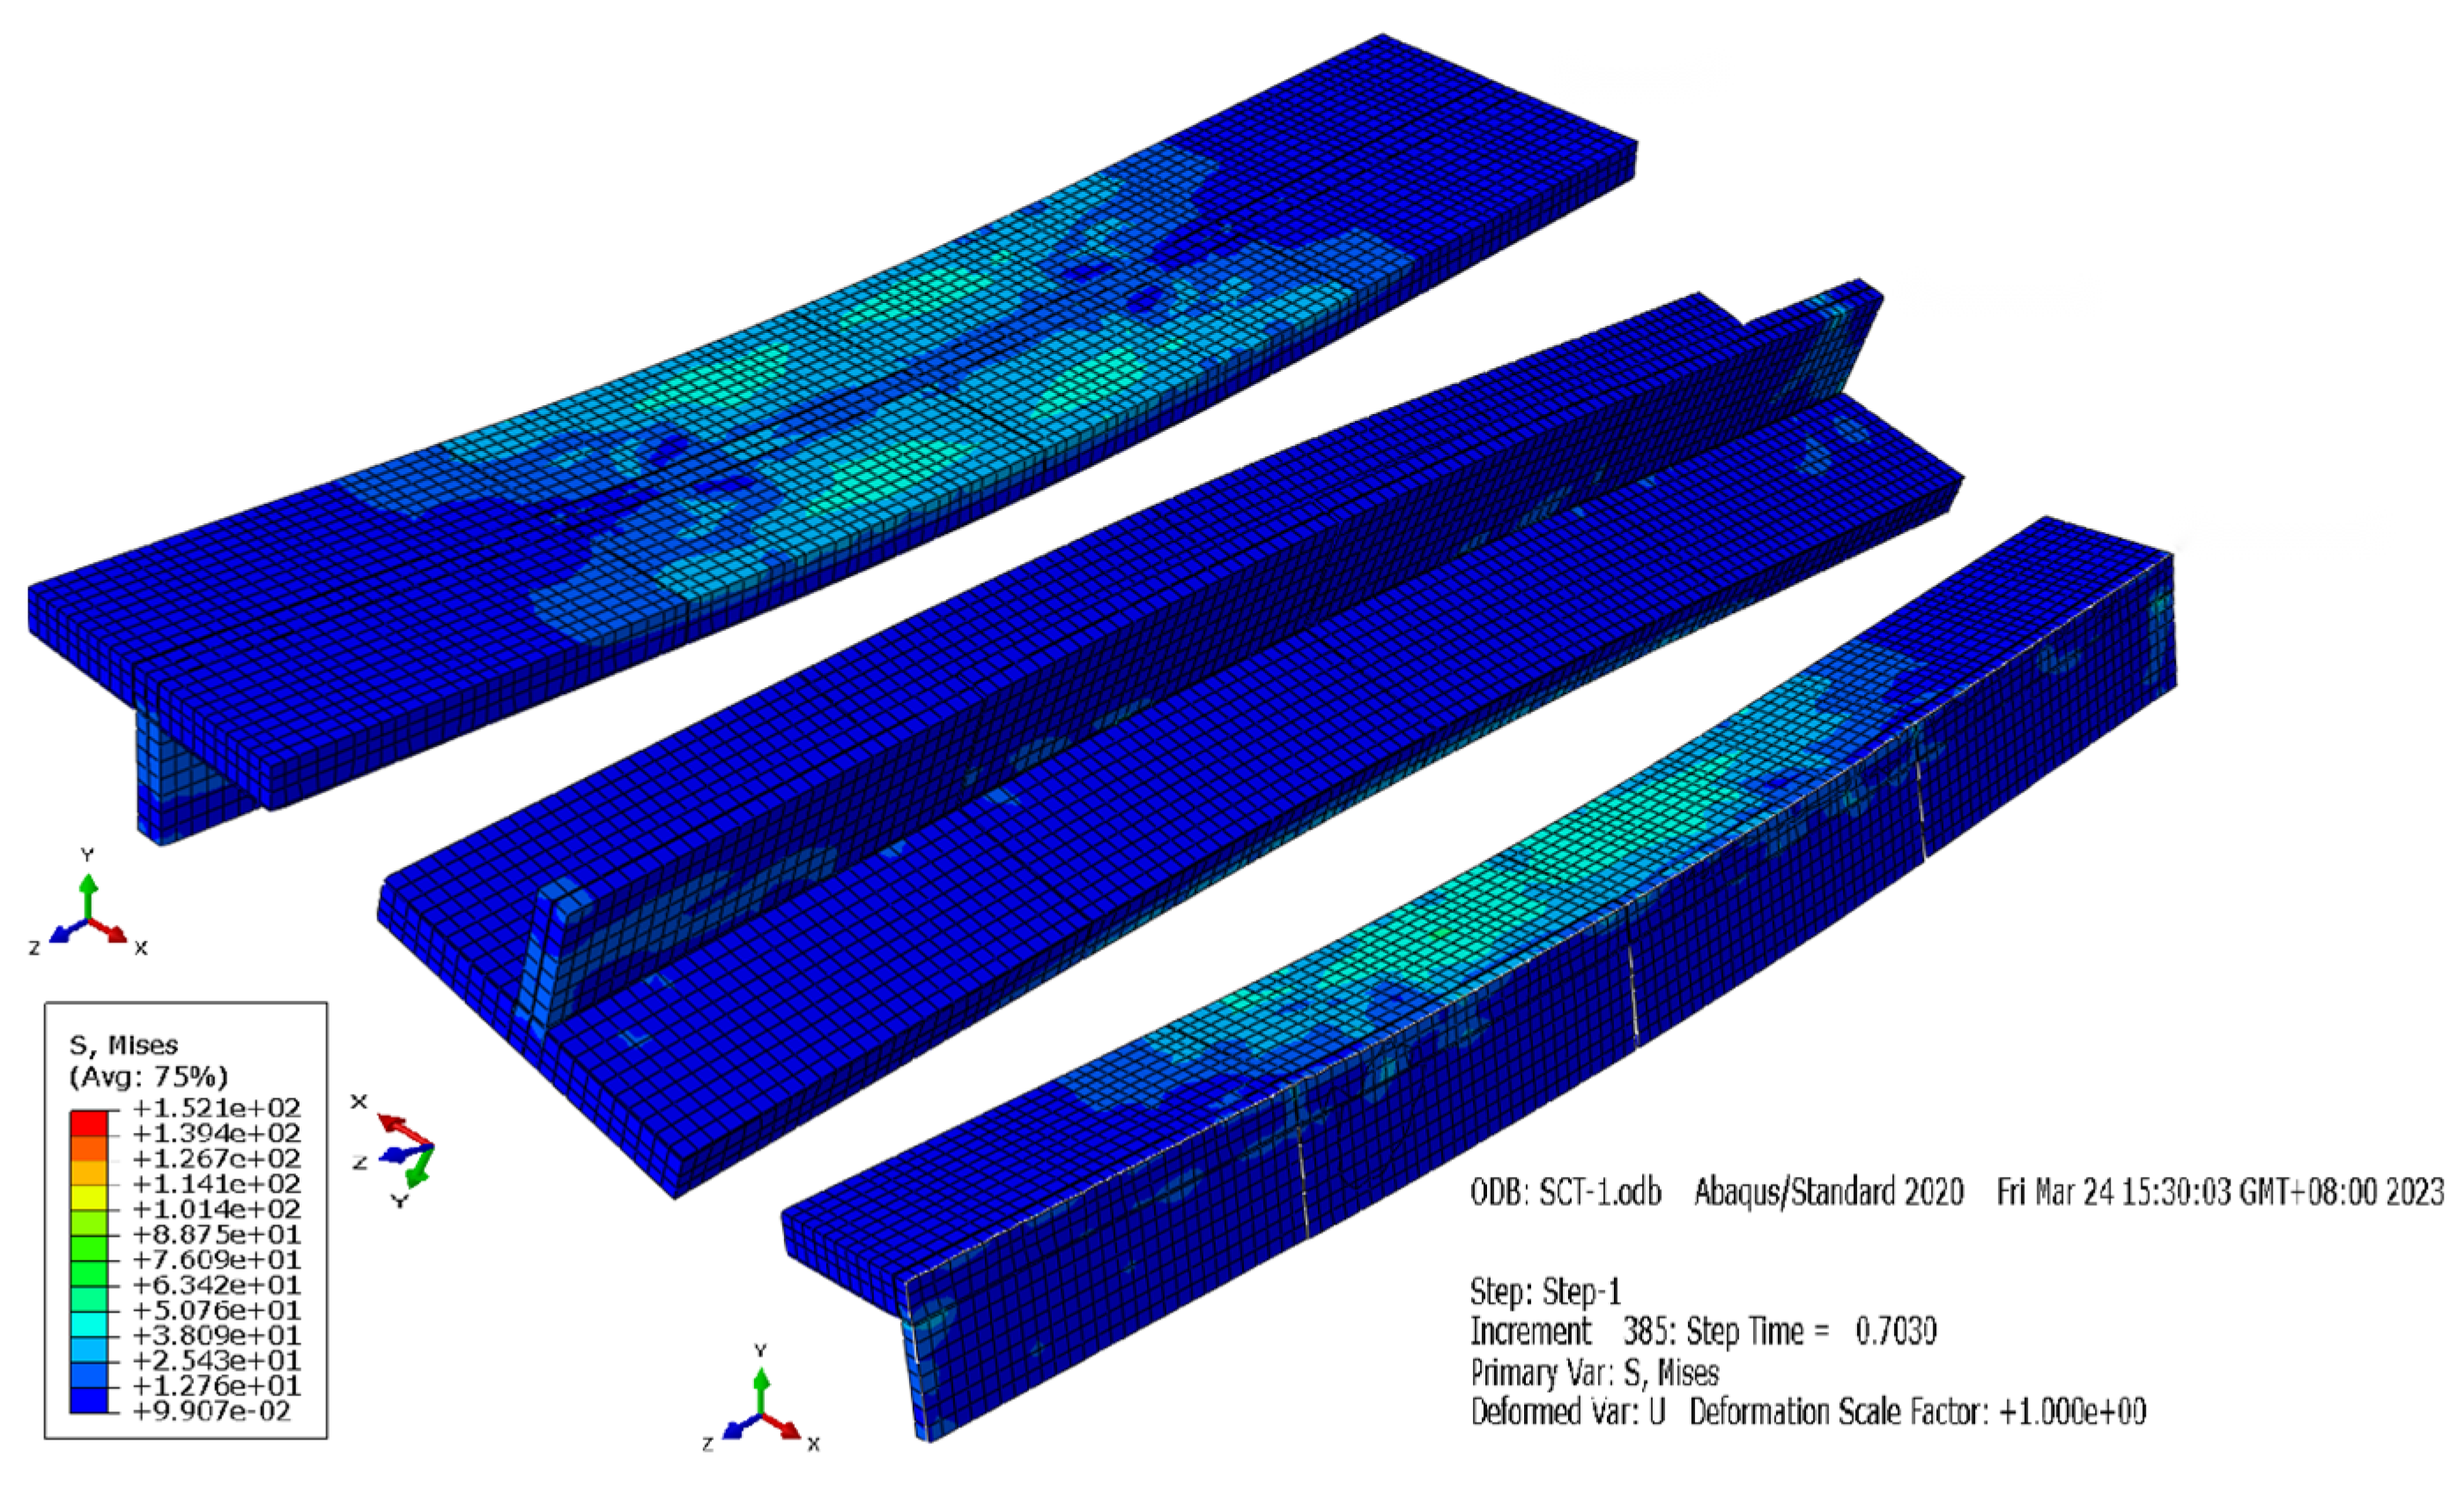
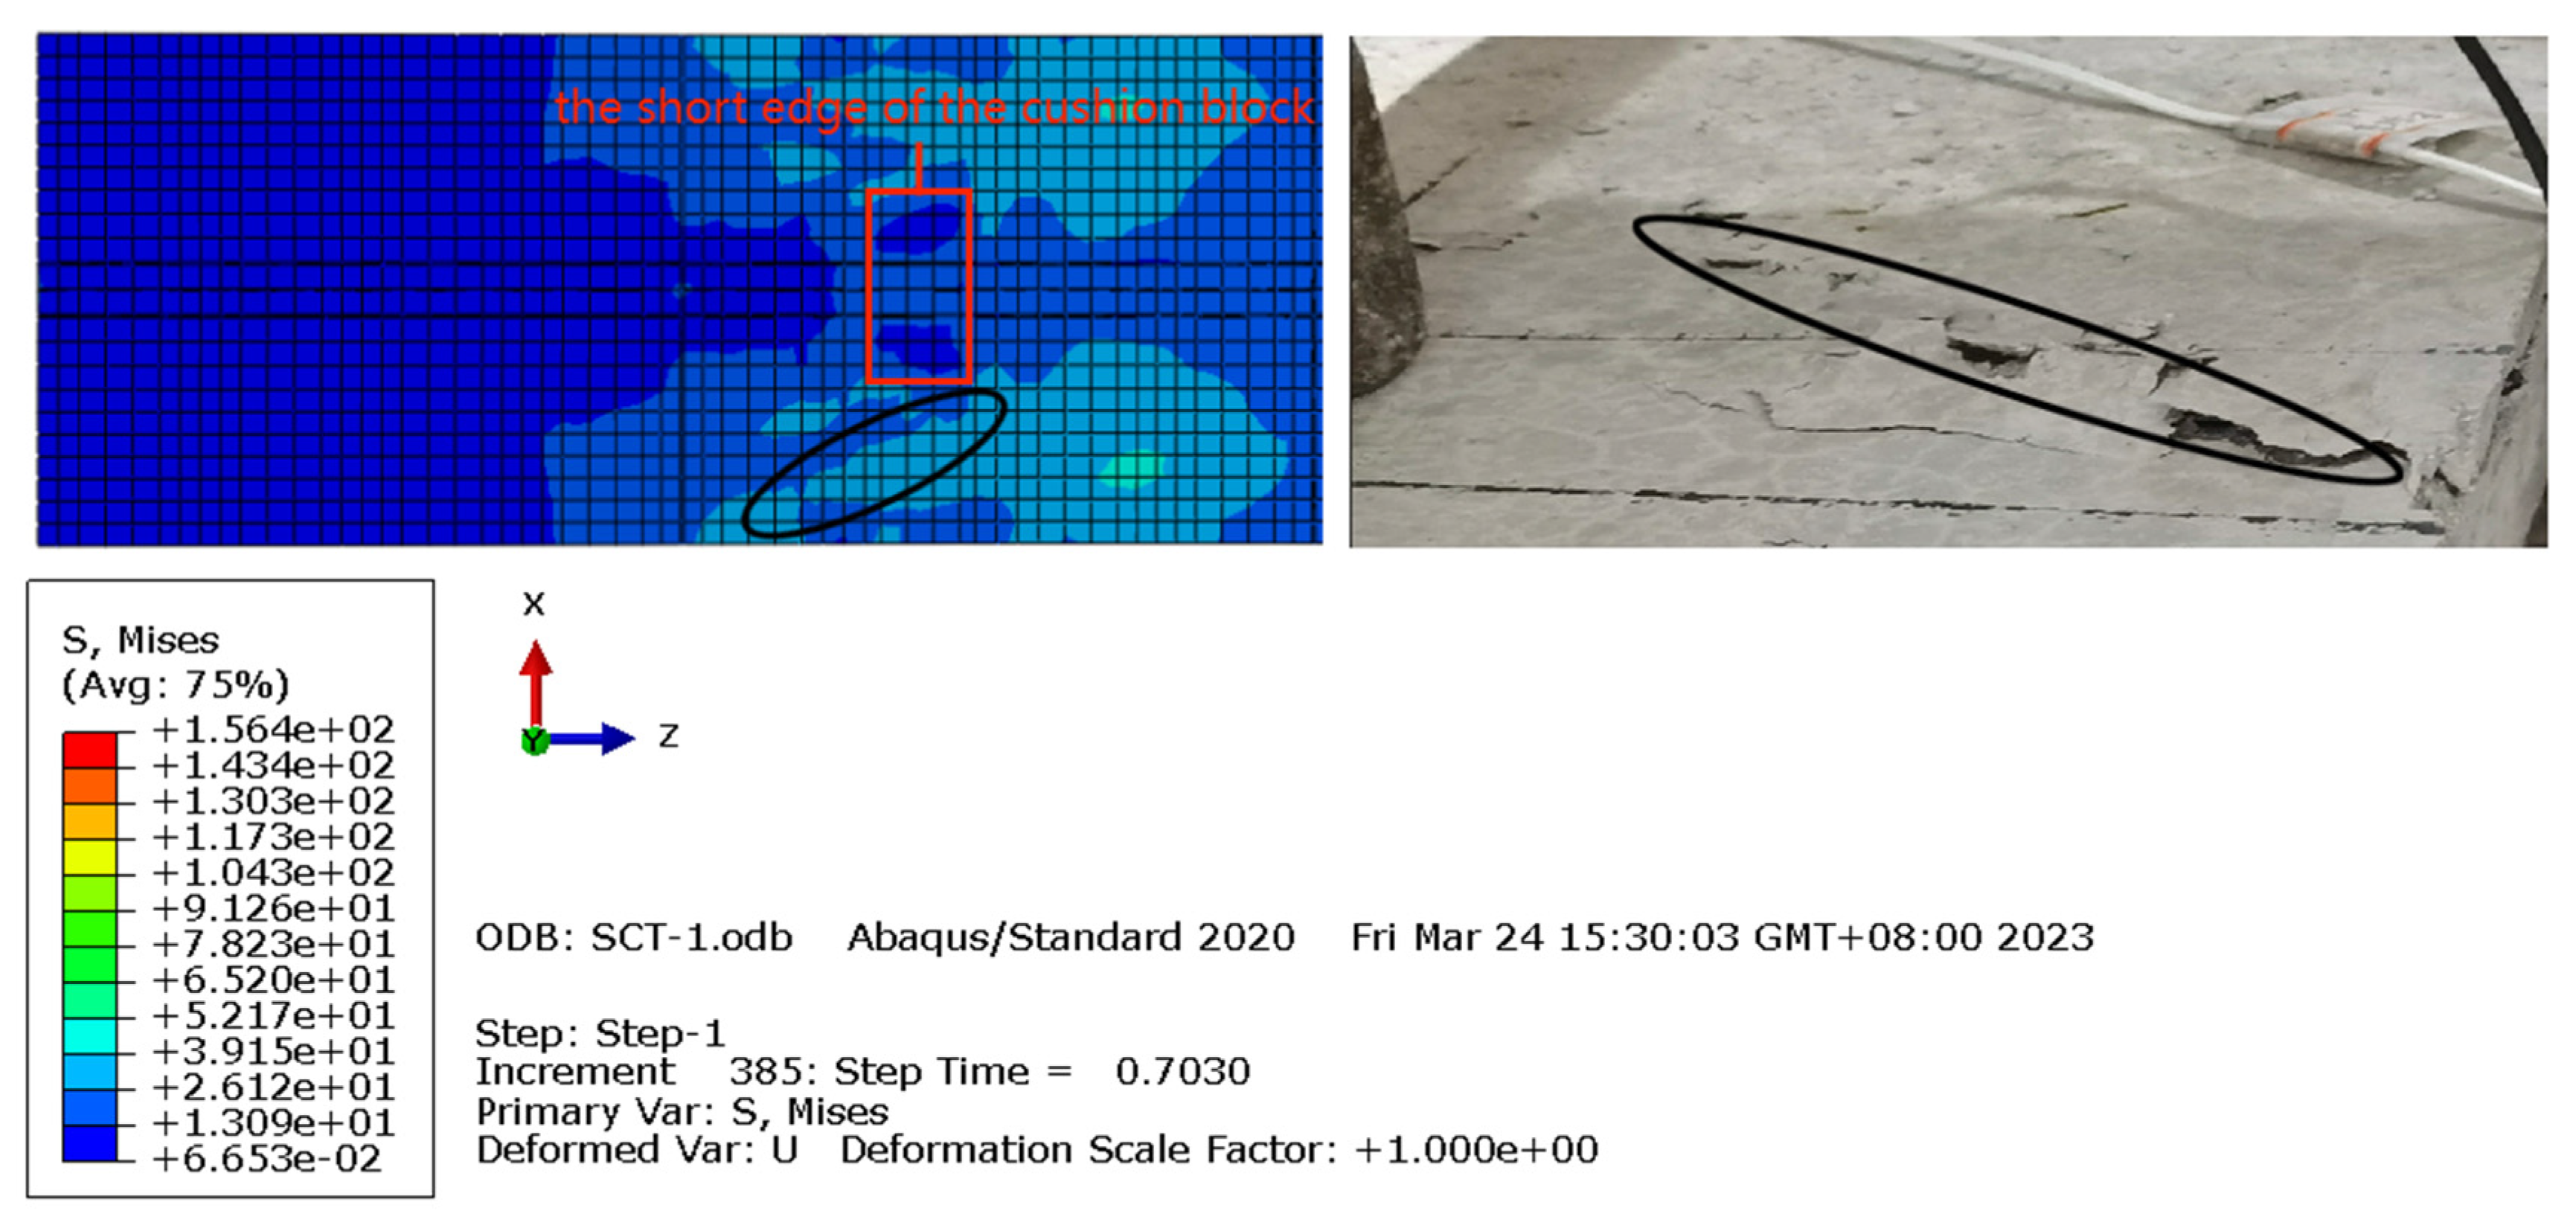
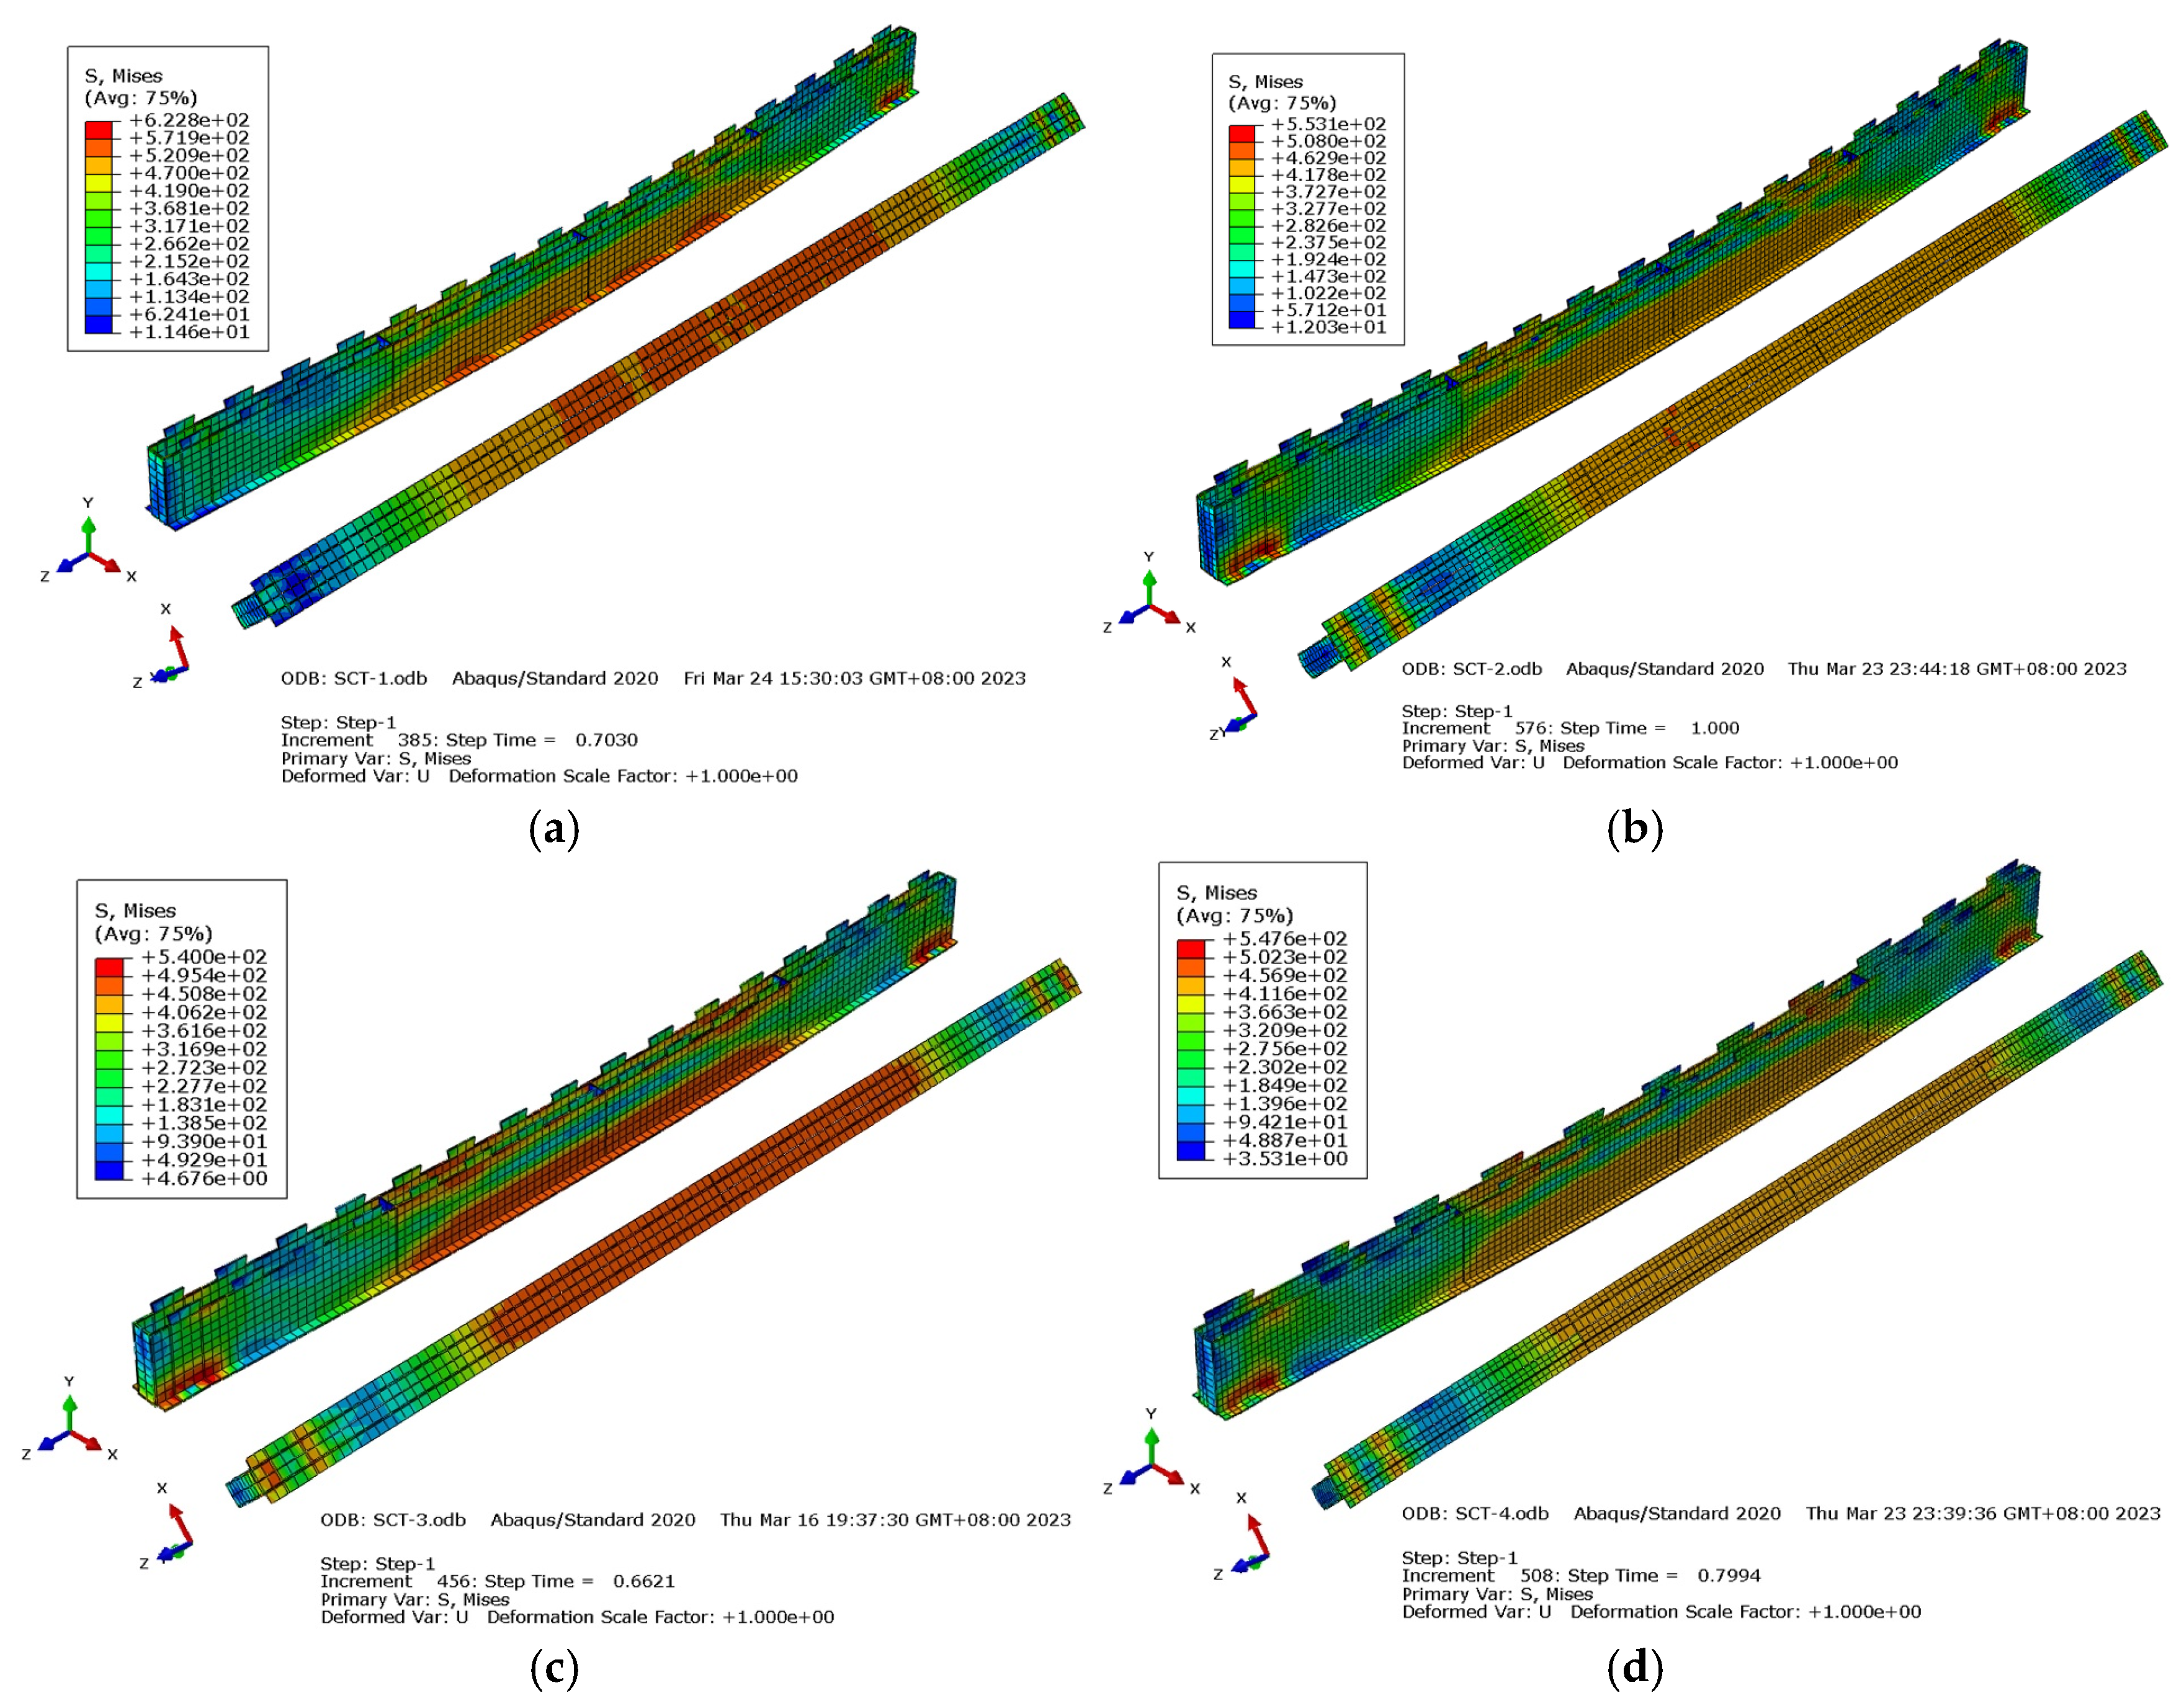
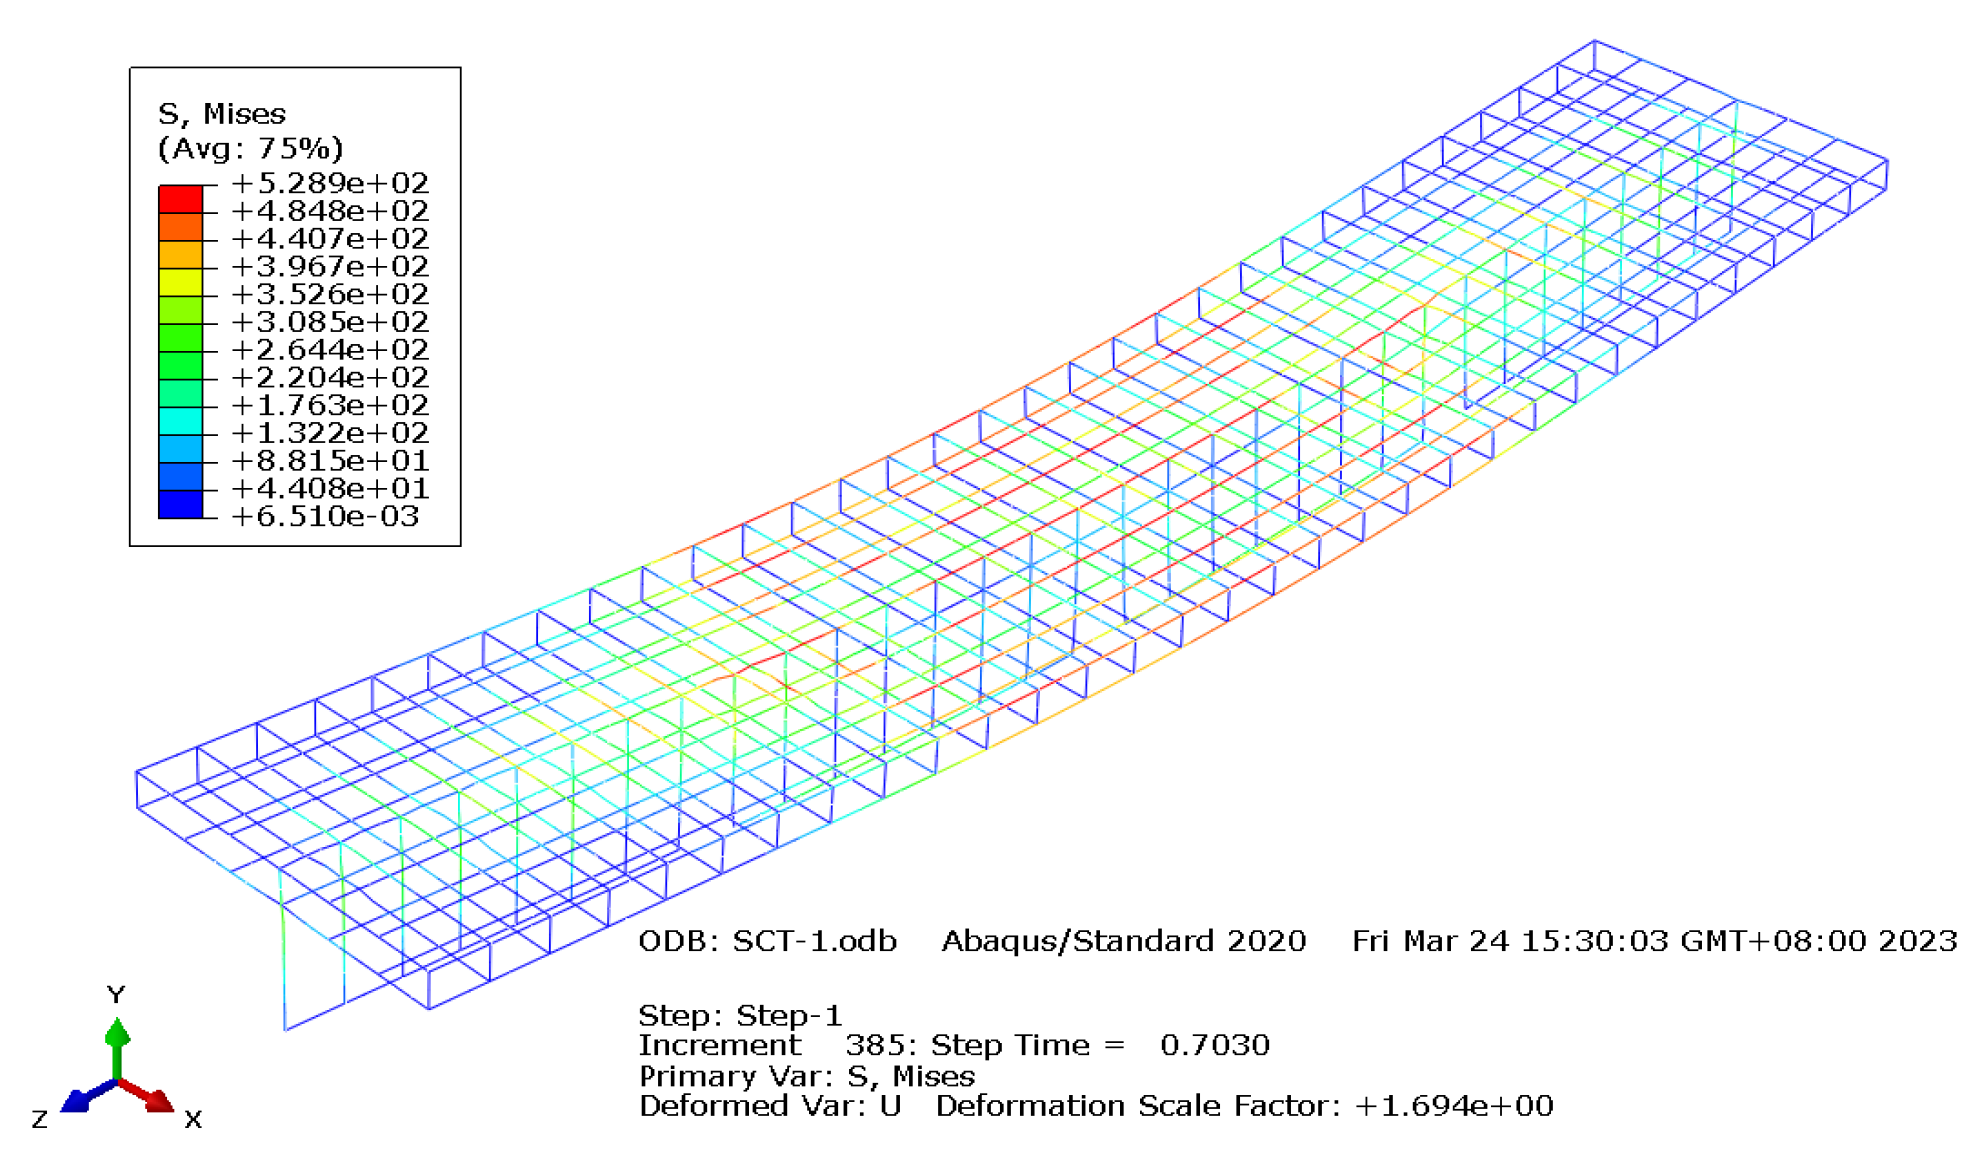
Comparison of failure mechanisms
Stress cloud maps were extracted for each component under extreme load from the finite element geometric nonlinear simulation results. These maps were then compared with experimental phenomena and results.
Concrete slab
Figure 17 illustrates the stress distribution map of the WDTSCB-1-SS concrete slab obtained from the finite element simulation under peak load conditions. The compressive stress in the pure bending section of the concrete top plate is relatively high when subjected to symmetrical loads, whereas the stress in the shear member remains comparatively low. Furthermore, the compressive stress on the concrete top plate decreases as the shear span section approaches the support. When a force is applied to the shear span section, relative slip occurs at the interface, causing the shear member and concrete tenon to be pressed against each other. This interaction results in increased stress on the shear member within the shear span section.
Figure 18 illustrates the stress distribution and the experimental phenomena of the WDTSCB-1-SS concrete at the point of failure. The stress at the short edge of the cushion block is relatively high, correlating with the diagonal cracks and the crushing of the concrete top plate observed in the experimental results.
Double inverted T-shaped steel beam
Figure 19 illustrates the stress distribution of the WDTSCB double inverted T-shaped steel beam under peak load. The stress in the bottom plate and the web of the steel beam at the pure bending section is relatively high, while the stress in the web plate decreases diagonally from the pure bending section to the shear span section. Additionally, the stress in the bottom plate of the steel beam gradually diminishes from the pure bending section to the shear span section. The bottom plate reaches its full section yield, while the web plate enters the plastic development stage, with half of its area transitioning into the plastic strengthening stage. This observation is consistent with the measured strain distribution.
Steel truss
Figure 20 illustrates the stress distribution of the steel truss under peak load for WDTSCB-1-SS. The longitudinal steel stress in the pure bending section of the plate exceeds 440 MPa and reaches the yield state upon the application of the peak load. This indicates that the steel bars within the plate are capable of effectively withstanding the tensile forces generated in the beam under external loads, thereby helping to control the development of cracks.

5. Conclusions

This investigation presents a comprehensive analysis of web-embedded double inverted T-shaped steel–concrete composite beams (WDTSCBs) through experimental testing and finite element analysis (FEA). The research yields several significant findings with important implications for structural engineering:
  • Structural Response and Failure Mechanisms:
The WDTSCBs exhibited a four-stage failure progression: elastic, elastoplastic, plastic strengthening, and ultimate failure. The primary failure mode was characterized by concrete crushing at loading points, with initial cracking occurring at 58–66% of peak load. The specimens demonstrated consistent load–deformation behavior, with yield loads ranging from 62 to 80% of peak capacity. The interface slip between the steel and the concrete remained minimal until 84–94% of ultimate load was reached, indicating effective composite action.
2.
Effect of Structural Parameters:
Structural parameters significantly influence the flexural performance of WDTSCBs. Increasing the steel plate thickness improved the ultimate flexural capacity by up to 18.6%, while reducing the shear connector spacing enhanced the load-bearing performance by 5.9%. These results highlight the importance of precise parameter optimization in improving overall structural efficiency.
3.
Ductility and Material Efficiency:
The WDTSCBs achieved full section yield at ultimate flexural failure, confirming effective utilization of the composite action between steel and concrete. However, the contribution of increased concrete flange width to flexural performance diminished beyond a critical threshold, suggesting the need for balanced material design.
4.
Reliability of FEA Simulations:
The FEA model developed in ABAQUS accurately reproduced the bending performance of WDTSCBs, with an error margin of less than 5% compared to the experimental results. This demonstrates the reliability of the model in simulating the structural behavior of similar composite beams.
These results contribute significantly to the understanding of WDTSCB behavior and provide practical guidelines for their implementation in civil engineering applications. Future research should focus on investigating the dynamic response and long-term performance of these innovative composite structures under various loading conditions.

Author Contributions

Conceptualization, J.S., X.Z. and J.C.; methodology, J.S., X.Z., P.W., K.Y. and J.C.; software, J.S. and X.Z.; validation, J.S., X.Z. and J.C.; formal analysis, J.S., X.Z. and J.C.; resources, J.S., X.Z. and J.C.; data curation, J.S. and X.Z.; writing—original draft preparation, J.S.; writing—review and editing, J.S., X.Z., P.W., K.Y. and J.C.; visualization, J.S., X.Z. and J.C.; supervision, P.W., K.Y. and J.C.; project administration, J.C.; funding acquisition, J.C. All authors have read and agreed to the published version of the manuscript.

Funding

This research was funded by the Suzhou City Construction System Science and Technology Project (2023-262).

Data Availability Statement

The data that support the findings of this study are available from the corresponding author upon reasonable request.

Conflicts of Interest

The authors declare no potential conflicts of interest with respect to the research, authorship, and/or publication of this article.

References

  1. Cui, B.; Wu, H.; Zhao, C.; Liu, J.; Guo, Z. Steel–Concrete Composite Cable-Stayed Bridge—Main Bridge of the Jiangxinzhou Yangtze River Bridge at Nanjing. Struct. Eng. Int. 2023, 33, 107–114. [Google Scholar] [CrossRef]
  2. Wu, F.; Fan, Z.; He, L.; Liu, S.; Zuo, J.; Yang, F. Comparative study of the negative bending behaviour of corrugated web steel–concrete composite beams using NC, ECC and UHPC. Eng. Struct. 2023, 283, 115925. [Google Scholar] [CrossRef]
  3. Zhu, Y.; Zhang, J.; Gao, X. Construction management and technical innovation of the main project of Hong Kong–Zhuhai–Macao Bridge. Front. Eng. Manag. 2018, 5, 128–132. [Google Scholar] [CrossRef]
  4. Degée, H.; Elghazouli, A.; Somja, H.; Bogdan, T.; Plumier, A. Recent advances in steel-concrete composite and hybrid structures: Concrete elements reinforced by steel profiles. ce/papers 2017, 1, 285–290. [Google Scholar] [CrossRef]
  5. Nguyen, H.; Mutsuyoshi, H.; Zatar, W. Flexural Behavior of Hybrid Composite Beams. Transp. Res. Rec. J. Transp. Res. Board 2013, 2332, 53–63. [Google Scholar] [CrossRef]
  6. Yang, Y.; Liang, W.; Yang, Q.; Cheng, Y. Flexural behavior of web embedded steel-concrete composite beam. Eng. Struct. 2021, 240, 112345. [Google Scholar] [CrossRef]
  7. Yang, Y.; Han, J.; Zhao, Y.; Yu, Y.; Chen, Y.F. Shear behavior of web-embedded steel-concrete composite beam. Adv. Struct. Eng. 2023, 26, 842–857. [Google Scholar] [CrossRef]
  8. Gao, X.; Wang, M.; Guo, J.; Li, H. Flexural behaviors of a novel precast hollow UHPC composite beam reinforced with inverted T-shaped steel: Experimental investigation and theoretical analysis. J. Build. Eng. 2024, 86, 108893. [Google Scholar] [CrossRef]
  9. Eurocode 4—Design of composite steel and concrete structures. In Dictionary Geotechnical Engineering/Wörterbuch GeoTechnik; Herrmann, H., Bucksch, H., Eds.; Springer: Berlin/Heidelberg, Germany, 2014; p. 486. [Google Scholar] [CrossRef]
  10. GB/T 228–2010; Metallic Materials Tensile Method at Room Temperature. Standardization Administration of China: Beijing, China, 2010.
  11. Yuan, F.; Hu, R. Flexural behaviour of ECC and ECC–concrete composite beams reinforced with hybrid FRP and steel bars. Adv. Struct. Eng. 2021, 24, 3171–3183. [Google Scholar] [CrossRef]
  12. Ge, W.J.; Ashour, A.F.; Yu, J.; Gao, P.; Cao, D.F.; Cai, C.; Ji, X. Flexural Behavior of ECC–Concrete Hybrid Composite Beams Reinforced with FRP and Steel Bars. J. Compos. Constr. 2019, 23, 04018069. [Google Scholar] [CrossRef]
  13. Han, S.; Zhou, A.; Ou, J. Relationships between interfacial behavior and flexural performance of hybrid steel-FRP composite bars reinforced seawater sea-sand concrete beams. Compos. Struct. 2021, 277, 114672. [Google Scholar] [CrossRef]
  14. Yang, J.; Chen, H.; Hu, S.; Gan VJ, L. Experimental studies on the flexural behaviour of steel-concrete composite beams with transverse and longitudinal hidden girders. Eng. Struct. 2019, 179, 583–594. [Google Scholar] [CrossRef]
  15. Stylianidis, P.M.; Petrou, M.F. Study of the flexural behaviour of FRP-strengthened steel-concrete composite beams. Structures 2019, 22, 124–138. [Google Scholar] [CrossRef]
  16. Hakeem, I.Y.; Rahman, M.K.; Althoey, F. Experimental Investigation of Hybrid Beams Utilizing Ultra-High Performance Concrete (UHPC) as Tension Reinforcement. Materials 2022, 15, 5619. [Google Scholar] [CrossRef] [PubMed]
  17. Momeni, M.; Demetriou, D.; Papadakis, L.; Bedon, C.; Petrou, M.F.; Nicolaides, D. Damage investigation of blast loaded UHPFRC panels with optimized mixture design using advanced material models. Results Eng. 2024, 23, 102518. [Google Scholar] [CrossRef]
  18. Xia, J. Flexural Behavior of High-Strength Steel and Ultra-High-Performance Fiber-Reinforced Concrete Composite Beams. Buildings 2024, 14, 131. [Google Scholar] [CrossRef]
  19. Yoo, D.Y.; Yoon, Y.S. Structural performance of ultra-high-performance concrete beams with different steel fibers. Eng. Struct. 2015, 102, 409–423. [Google Scholar] [CrossRef]
  20. Tong, L.; Chen, L.; Wang, X.; Zhu, J.; Shao, X.; Zhao, Z. Experiment and finite element analysis of bending behavior of high strength steel-UHPC composite beams. Eng. Struct. 2022, 266, 114594. [Google Scholar] [CrossRef]
  21. Sivasuriyan, A.; Vijayan, D.S.; Sankaran, N.; Parthiban, D. Finite element analysis of RC beams using static experimental data to predict static and dynamic behaviors. Sci. Rep. 2024, 14, 31238. [Google Scholar] [CrossRef] [PubMed]
  22. Gong, W.; Li, X.; Ge, Z.; Liu, H.; Lin, Z.; Liu, X.; Yang, G. Steel-concrete composite beams strengthened with NSM CFRP systems at the hogging-moment regions. Eng. Struct. 2023, 292, 116576. [Google Scholar] [CrossRef]
  23. Rahnavard, R.; Craveiro, H.D.; Simões, R.A.; Laím, L.; Santiago, A. Test and design of built-up cold-formed steel-lightweight concrete (CFS-LWC) composite beams. Thin-Walled Struct. 2023, 193, 111211. [Google Scholar] [CrossRef]
  24. Fan, J.; Gou, S.; Ding, R.; Zhang, J.; Shi, Z. Experimental and analytical research on the flexural behaviour of steel–ECC composite beams under negative bending moments. Eng. Struct. 2020, 210, 110309. [Google Scholar] [CrossRef]
  25. Ban, H.; Bradford, M.A. Flexural Strength of High-Strength Steel-Concrete Composite Beams with Varying Steel Grades. In Proceedings of the Composite Construction in Steel and Concrete VII, North Queensland, Australia, 28–31 July 2016; American Society of Civil Engineers: Reston, VA, USA, 2016; pp. 120–130. [Google Scholar] [CrossRef]
  26. Hai, N.D.; Mutsuyoshi, H.; Asamoto, S.; Matsui, T. Structural behavior of hybrid FRP composite I-beam. Constr. Build. Mater. 2010, 24, 956–969. [Google Scholar] [CrossRef]
  27. Badache, H.; Mezhoud, S.; Melhem, A.Q. Evaluation of Behavior of Hybrid Beam Combining Steel Inverted T-Section and RC Flange. Civ. Environ. Eng. Rep. 2022, 32, 166–181. [Google Scholar] [CrossRef]
  28. EN 1992-1-1:2004; Eurocode 2: Design of Concrete Structures—Part 1-1: General Rules and Rules for Buildings. European Committee for Standardization (CEN): Brussels, Belgium, 2004.
  29. He, H.; Liang, X.; Shang, J.; Long, Y. Experimental study on residual mechanical properties after cyclic loading of steel-concrete composite-laminated beams. Case Stud. Constr. Mater. 2023, 19, e02257. [Google Scholar] [CrossRef]
  30. Lesmana, C.; Hu, H.T.; Pan, T.C.; Lin, Z.S. Parametric Study on Nonlinear Finite Element Analysis of Prestressed Reinforced Concrete Beam Strengthened by Fiber-Reinforced Plastics. Math. Probl. Eng. 2022, 2022, 9646889. [Google Scholar] [CrossRef]
  31. GB50010-2010; Code for Design of Concrete Structures. Standardization Administration of China: Beijing, China, 2010.
  32. Śledziewski, K.; Górecki, M. Finite Element Analysis of the Stability of a Sinusoidal Web in Steel and Composite Steel-Concrete Girders. Materials 2020, 13, 1041. [Google Scholar] [CrossRef] [PubMed]
Figure 1. Structural drawing of the WDTSCB.
Buildings 15 00717 g001
Figure 2. Dimensions of the WDTSCB.
Buildings 15 00717 g002
Figure 3. Steel tensile test: (a) rebar tensile test; (b) steel plate tensile test.
Buildings 15 00717 g003
Figure 4. Concrete standard specimen.
Buildings 15 00717 g004
Figure 5. Concrete specimen compression test.
Buildings 15 00717 g005
Figure 6. Image of specimen loading device: (a) specimen loading device—forward direction; (b) specimen loading device—lateral direction.
Buildings 15 00717 g006
Figure 7. Displacement meter arrangement.
Buildings 15 00717 g007
Figure 8. Arrangement of the strain gauges: (a) front view; (b) side view; (c) top view.
Buildings 15 00717 g008
Figure 9. WDTSCB-4-J300 test phenomenon: (a) cracks at the bottom of the board; (b) cracks at the top of the board; (c) concrete crushing area; (d) lateral flange cracks; (e) final deformation of the specimen.
Buildings 15 00717 g009
Figure 10. WDTSCB mid-span section deflection curve for typical load.
Buildings 15 00717 g010
Figure 11. Comparison of load–mid-span deflection curves: (a) load–mid-span deflection diagrams; (b) concrete slab widths; (c) plate thickness; (d) shear connector spacing.
Buildings 15 00717 g011
Figure 12. Uniaxial stress–strain curve of steel.
Buildings 15 00717 g012
Figure 14. Grid element division of test pieces: (a) concrete grid division; (b) grid division of double inverted T-shaped steel beams.
Buildings 15 00717 g014
Figure 15. Model loading and boundary conditions.
Buildings 15 00717 g015
Figure 16. Comparison curve of load deflection between WDTSCB test and finite element simulation: (a) WDTSCB-1-SS load–deflection curve; (b) WDTSCB-2-B760 load–deflection curve; (c) WDTSCB-3-T6 load–deflection curve; (d) WDTSCB-4-J300 load–deflection curve.
Buildings 15 00717 g016
Figure 17. Stress distribution of WDTSCB-1-SS under peak load.
Buildings 15 00717 g017
Figure 18. Stress distribution and experimental phenomena of WDTSCB-1-SS under peak load.
Buildings 15 00717 g018
Figure 19. Stress distribution of the WDTSCB under peak load: (a) WDTSCB-1-SS; (b) WDTSCB-2-B760; (c) WDTSCB-3-T6; (d) WDTSCB-4-J300.
Buildings 15 00717 g019
Figure 20. Stress distribution of the steel truss under the peak load of WDTSCB-1-SS.
Buildings 15 00717 g020
Table 1. Detailed dimensions of the WDTSCB.
Test Piece NumberL (mm)L0 (mm)B (mm)t (mm)be (mm)bu (mm)bl (mm)bt (mm)
WDTSCB-1-SS3200300064045010088200
WDTSCB-2-B7603200300076045010088200
WDTSCB-3-T63200300064065010088200
WDTSCB-4-J30032003000640431150138300
Table 2. Mechanical properties of steel plate.
Material TypeSpecimen NumberThicknesses (mm)Yield Strength
σ s (MPa)
Tensile Strength
σ b (MPa)
Elastic Modulus (GPa)Yield Ratio
σ b / σ s
plateS44421.0530.9211.61.3
S66477.0567.7219.61.2
Table 3. Mechanical properties of rebar.
Material TypeSpecimen NumberBar Diameter (mm)Yield Strength
σ s (MPa)
Tensile Strength
σ b (MPa)
Elastic Modulus (GPa)Yield Ratio
σ b / σ s
rebarC88527.6649.8227.21.2
C1212434.9610.4191.61.4
Table 4. Concrete material property test results.
NumberSCT-1SCT-2SCT-3SCT-4SCT-5SCT-6
Compressive strength (N/mm2)41.142.239.839.941.739.5
Average value (N/mm2)40.7
Table 5. WDTSCB specimen stage-loading statistics.
Name of Test PiecePCL/PPPYL/PPPTY/PPPP/PPPD/PP
WDTSCB-1-SS0.580.620.8410.94
WDTSCB-2-B7600.580.750.9410.97
WDTSCB-3-T60.660.800.9210.89
WDTSCB-4-J3000.660.720.8710.89
Table 6. Specimen load and mid-span deflection values.
Specimen Number P C L P Y L P T Y P P P D μ Y L μ P μ D μ D / L 0 γ δ
(kN)(kN)(kN)(kN)(kN)(mm)(mm)(mm)
WDTSCB-1255.0273.1371.4439.8413.214.061.685.71/356.11.5
WDTSCB-2253.6326.1409.3435.3422.218.258.368.41/443.81.3
WDTSCB-3357.1436.5498.6540.2481.115.234.448.11/623.21.1
WDTSCB-4272.0296.4361.8413.7369.716.356.866.41/454.11.2
Table 7. Calculation parameters of the concrete damage plasticity model.
ψ ε f b 0 / f c 0 K c μ
300.11.160.6670.001
Table 8. Comparison of ultimate bearing capacity experimental values and finite element simulation values of WDTSCB.
Test Piece NumberWDTSCB-1-SSWDTSCB-2-B760WDTSCB-3-T6WDTSCB-4-J300
Measured value
P P (kN)
439.8435.3540.2413.7
Analog value
FEM (kN)
446.7443.4565.8420.2
|( P P − FEM)/FEM| (%)1.51.84.51.5
Disclaimer/Publisher’s Note: The statements, opinions and data contained in all publications are solely those of the individual author(s) and contributor(s) and not of MDPI and/or the editor(s). MDPI and/or the editor(s) disclaim responsibility for any injury to people or property resulting from any ideas, methods, instructions or products referred to in the content.

