Article

An Investigation of the Effect of Fissure Inclination on Specimen Deformation and the Damage Mechanism Based on the DIC Method

1
School of Machinery and Automation, Weifang University, Weifang 261061, China
2
College of Electromechanical Engineering, Qingdao University of Science and Technology, Qingdao 266061, China
*
Author to whom correspondence should be addressed.
Buildings 2025, 15(5), 713; https://doi.org/10.3390/buildings15050713
Submission received: 9 January 2025 / Revised: 20 February 2025 / Accepted: 20 February 2025 / Published: 24 February 2025
(This article belongs to the Section Building Structures)

Abstract

:
In order to investigate the effect of fissure inclination on the mechanical properties, deformation, and crack evolution of the surrounding rock in the roadway, uniaxial compression experiments were conducted on sandstone-like materials with prefabricated fissures. The high-speed camera and DIC (digital image correlation) method were employed to analyze the strain distribution and the crack evolution of the specimen. The results demonstrated that the presence of fissures reduces the stress for crack initiation, with intact specimens producing new cracks from about 75% of peak strength and fissured specimens producing new cracks from 50% to 60% of peak strength. The fissure reduced the strength and elastic modulus of the specimen while increasing the strain. The fissure inclination of 45° exhibited the most significant changes compared to the intact specimen. The peak strength and elastic modulus decreased by 54.52% and 35.95%, respectively, and the strain increased by 151.42%. The intact specimen and specimen with 90° inclination are mainly distributed with the shear crack, tensile crack, and far-field crack, which are mainly tensile–tension damage; specimens with 0~75° inclination are mainly distributed with the wing crack, anti-wing crack, oblique secondary crack, and coplanar secondary crack, which are mainly shear slip damage. The direction of the extension of cracks is related to the fissure inclination. For specimens with 0° inclination, the new cracks mainly propagate in the direction perpendicular to the fissure; for specimens with 30° and 45° inclinations, the new cracks mainly propagate in the direction parallel and perpendicular to the fissure; for specimens with 60° and 75° inclinations, the new cracks propagate in the direction parallel to the fissure; and for specimens with 90° inclination, the new cracks propagate in the direction parallel to the fissure.

1. Introduction

The excavation disturbance results in the redistribution of in situ stresses within the surrounding rock, thereby inducing a rise in internal cracking. This, consequently, impacts the deformation and mechanical properties of the rock mass. The geo-stress and engineering disturbances induce the generation of joints, cracks, holes, and other defects within the rock mass. These defects affect the deformation pattern and mechanical properties, resulting in the mechanical properties of the rock mass exhibiting pronounced non-linear characteristics [1]. The characteristics of soft rock, such as large deformation and strong rheology, are especially pronounced in deep rock [2]. Consequently, numerous scholars conducted research into the initial damage to the mechanical properties, deformation theory, and damage mechanism of the rock mass.
Fractured rock is frequently subject to significant deformations that are challenging to analyze and manage. One potential solution to this problem is to analyze the failure pattern and the cracking pattern of the surrounding rock [3]. A large number of researchers have conducted studies on the mechanical properties of fractured rock. Alneasan [4] investigated the effect of grain size and mineralogical composition on the rupture speed and propagation path of cracks. Also, he [5] investigated the effect of temperature on rock fracture behavior and found the behavior of mudstone gradually changed from ductile to brittle behavior due to the thermal treatment. Zengin [6] investigated the effect of porosity and pore parameters on rock materials’ failure behavior with unconfined and confined stress conditions. Zare [7] investigated the effect of parameters such as angle, length, and number of joints on the shear strength of non-persistent rock joints. Danielli [8] performed a series of uniaxial compression experiments on homogeneous gypsum specimens containing two pre-existing open flaws and a frictional interface. Klammer [9] performed laboratory on rock-like samples and took into account uniaxial compression tests and acoustic emission tests. This demonstrated that the stiffness and shape at the grain scale had a great influence on the intrinsic proneness to strain burst of rocks. Asadizadeh [10] investigated the effect of layer spacing and inclination angle on the indirect tensile strength, crack development, failure pattern, and contact force chain of layered disks. It was found that the increase in the layer orientation up to 15° results in a peak in the tensile strength followed by a decrease. Göğüş [11] conducted laboratory tests and numerical experiments on andesite samples to investigate the characteristics of damage zones in the form of strain fields. Sisodiya [12] proposed a novel microcrack damage theory to describe the time-dependent behavior of brittle rocks. İbrahim [13] examined crack initiation and crack damage for weak rocks subjected to uniaxial compression. Lee [14] investigated crack types and crack coalescence patterns in specimens with a flaw pair under uniaxial compression and horsetail cracks, anti-wing cracks, and tensile wing cracks were observed. Hedan [15] investigated the mixed-mode behavior of desiccation cracks in a clayey rock front gallery. Bahrani [16] investigated the confined peak strength of laboratory-scale rock specimens containing grain-scale strength-dominating features. Cui [17] performed a series of unconfined compression tests on specimens of two types of sandstones, argillite and basalt, which contain open and filled cracks and found that the presence of cracks tends to decrease the strength of rocks. Hu [18] investigated the influence of parallel joint spacing on the size effect and characteristic size of rock uniaxial compressive strength. However, there were limitations of the traditional contact measurement method in quantifying strain at the crack tip and achieving adequate measurement accuracy. The full-field strain distribution in different regions of the rock during the loading process remains indistinct. The acoustic emission technique, while effective in monitoring crack extension, lacked directivity and precision in measuring strain distribution.
Hence, some researchers have utilized non-contact measurements to characterize the deformation of the rock mass. The most commonly employed method is the DIC method. Liu et al. [19] investigated the cracking behavior and the effect of flaw geometries on the mechanical properties of rock materials, and the cracking process is evaluated with digital image correlation. Zoppo et al. [20] analyzed the damage pattern of fiber-reinforced cementitious composites with the DIC technique. Wu et al. [21] investigated the evolution and stability characteristics of granite thermal damage with digital image correlation (DIC) technology. Sharafisafa [22] investigated the interaction of the pre-existing flaws with the newly formed cracks the digital image correlation and the bonded particle model. Carlota [23] et al. investigated the velocity of the cracks by implementing the digital image correlation (DIC) technique. Although researchers have employed the DIC method to investigate the crack propagation mechanism, they have yet to utilize the DIC method to thoroughly analyze the physical mechanisms and interactions.
In this study, sandstone-like specimens with artificially prefabricated fissures were utilized to document the initiation, evolution, and failure of cracks on the specimen surface via high-speed photography. The paper has innovations in two aspects. Methodologically, it combined high-speed photography with the DIC method, overcoming traditional measurement limitations and providing full-field strain data. Content wise, it analyzed how fissure inclination affected specimen strain, mechanical parameters, and crack propagation. We clarified failure characteristics at different inclinations, offering new insights into rock deformation and failure. The crack evolution path of the damaged rock mass was analyzed based on the DIC method to reveal the failure mechanism and crack evolution pattern of the damaged rock mass. The term “fissure” was defined as prefabricated cracks, while “cracks” referred to newly generated cracks that appear during the loading process.

2. Materials and Methods

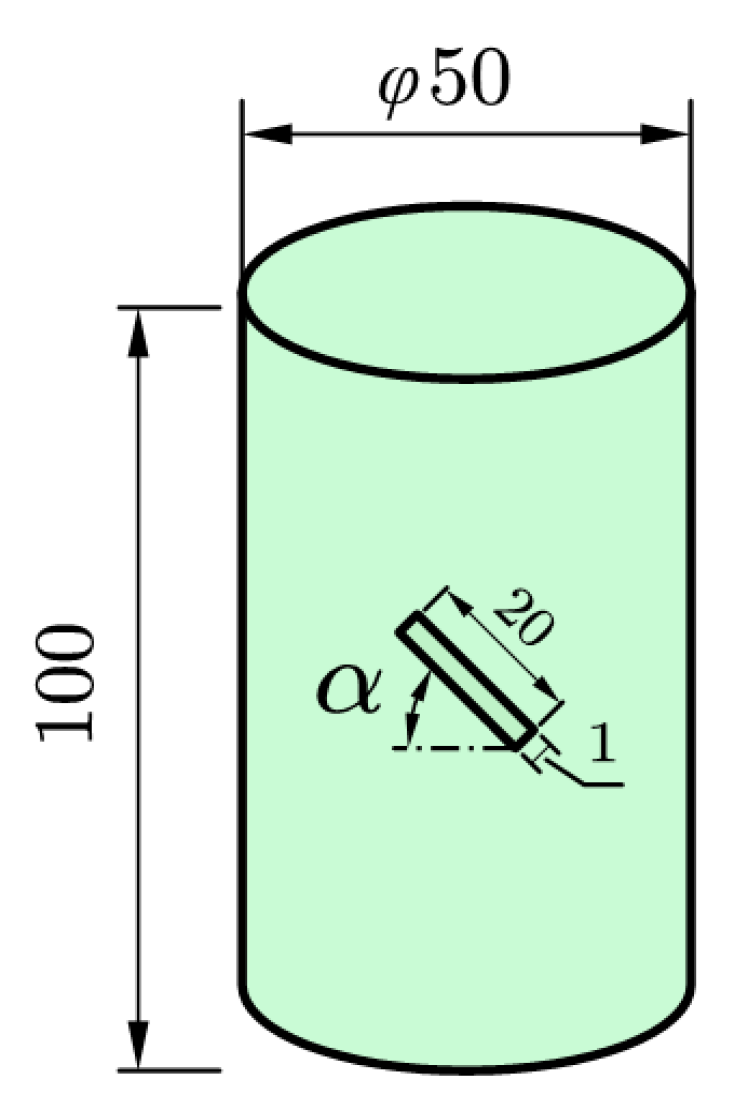
2.1. Principles of Specimen Preparation

In order to systematically study the influence of fissure inclination on the mechanical properties and deformation distribution of rock, the sandstone-like specimens prepared in this paper were modeled on sandstone taken from the Zigong area of Sichuan Province, and they were light yellow in color and dense in structure; mechanical parameters of which are given in Table 1. In this paper, river sand was selected as the aggregate, cement as the binder, and gypsum powder as the conditioner to prepare sandstone-like specimens. The proportions of sandstone-like specimens were as follows: river sand/cement/gypsum powder/water = 2:1:0.05:0.7 [24]. In accordance with the Standard for Test Method of Engineering Rock Mass (GB/T 50266-2013 [25]), the sandstone-like specimens were manufactured with the size of φ50 × 100 mm. The specimens exhibited less than 0.05 mm of non-parallelism at both ends, with a diameter of error less than 0.3 mm. Furthermore, the perpendicularity to the axis exhibited less than 0.25° of error. In order to simulate the initial damage of the rock mass, a prefabricated fissure was made in the center of the sandstone-like specimens. The fissure exhibited a rectangular shape with dimensions of L × W = 20 × 1 mm and a depth of 25 mm, as illustrated in Figure 1 The angles α between the central axis of the prefabricated fissure and the horizontal plane were 0°, 30°, 45°, 60°, 75°, and 90°, respectively. The loading pattern of the test specimen is presented in Figure 2.

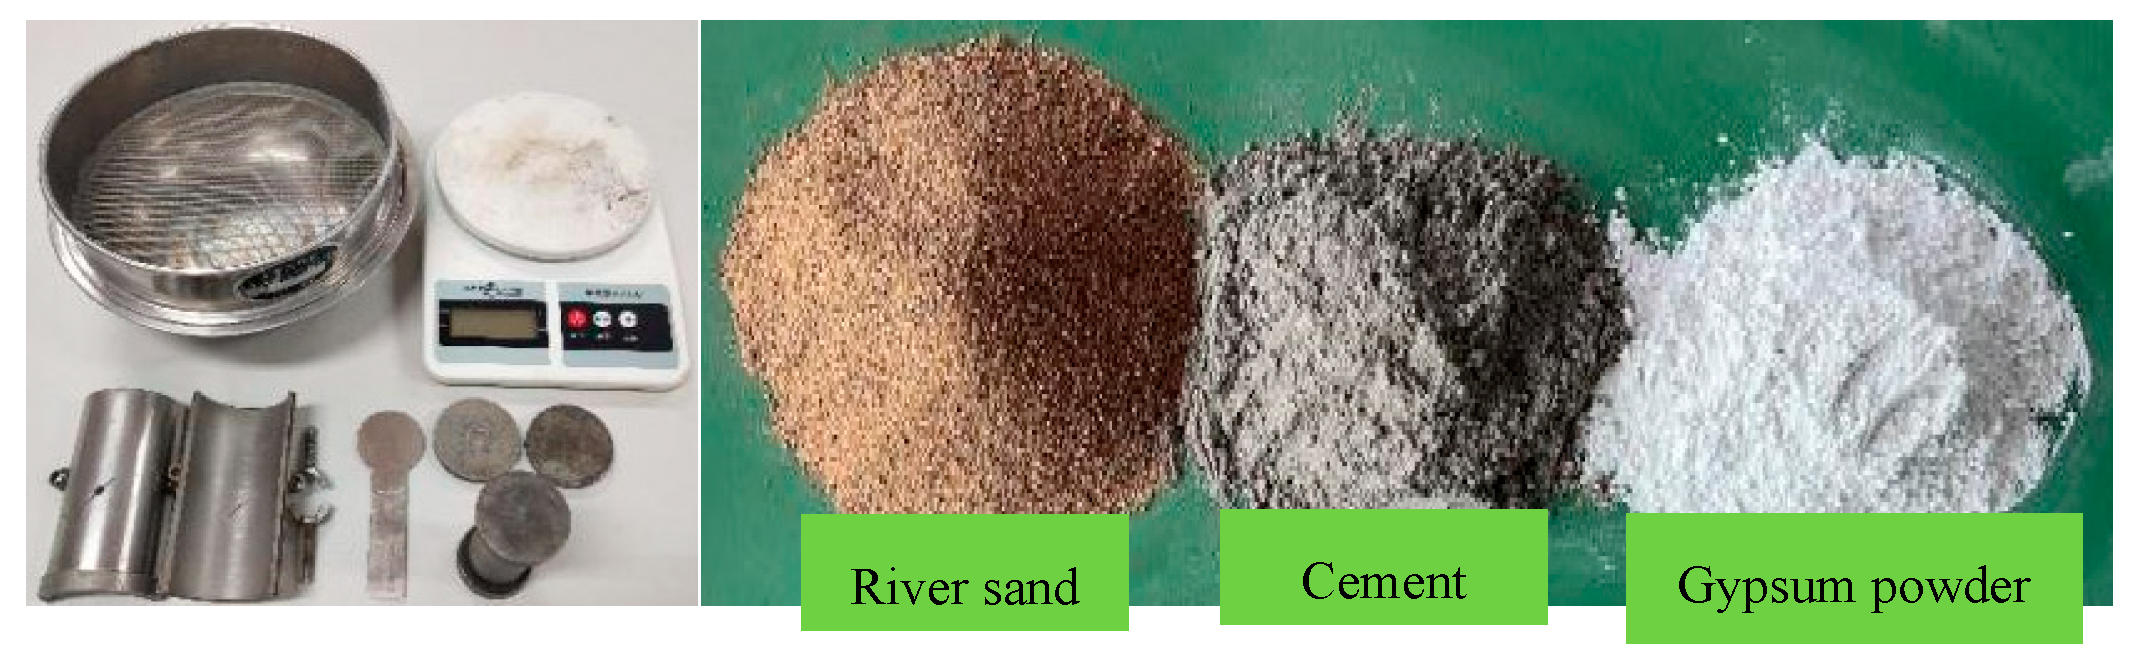
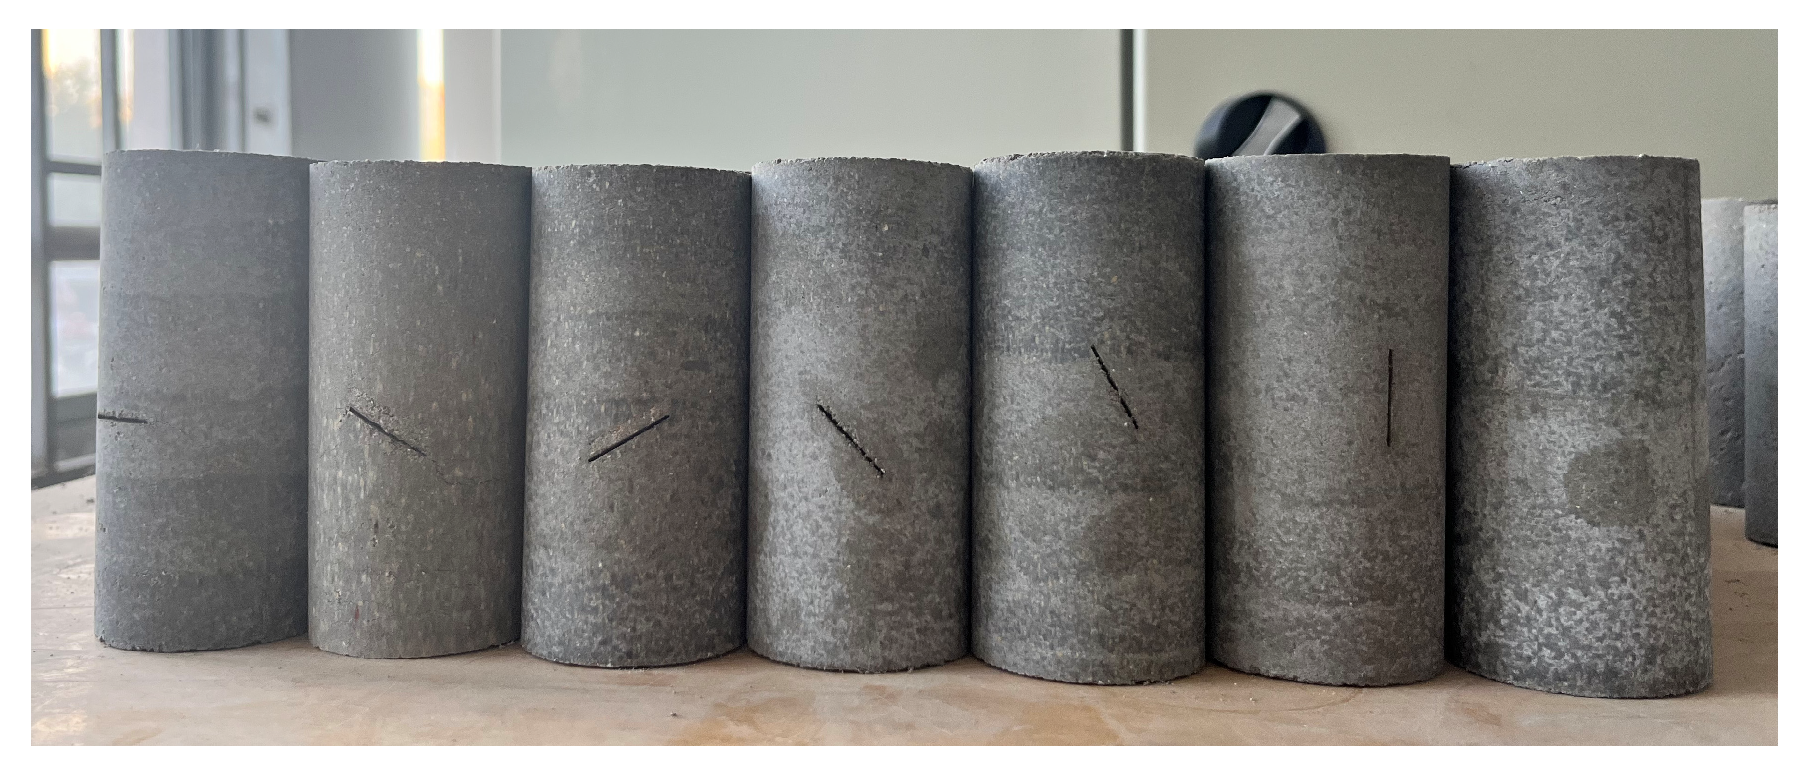
2.2. Specimen Preparation

The preparation process of the prefabricated fissure specimens was as follows. The components were weighed according to the proportions design mentioned above. Subsequently, the river sand, cement, and gypsum powder were mixed and stirred homogeneously to ensure uniform distribution within the mixture. Water was then added and stirred until a homogeneous mixture was achieved. Finally, the prepared mixture was poured into the mold in four separate batches, with each subsequent batch being compacted with the use of a steel hammer. Upon completion of the compaction process, a steel plate was inserted into the prefabricated fissure in the mold. One hour later, the steel plate was removed from the specimen to complete the preparation of the fissure.
The specimen preparation apparatus and ingredients are shown in Figure 3. In order to ensure the integrity of the specimens, specimens were left in the mold for four hours. The ambient temperature was maintained at 25 °C and the humidity remained at least 50% in the constant temperature, and the humidity box dried specimens for 7 days. Following this, naturally dry the specimen in the dry room for 21 days, maintaining a temperature of at least 25°. Subsequently, the specimen is subjected to a uniaxial compression test.
Two specimen types were prepared for the investigation: (1) intact specimens and (2) prefabricated fissure specimens. The intact specimen exhibited no fissure, whereas the prefabricated fissure specimen displayed an artificially fabricated fissure in the center of the specimen. The inclination angles of the fissure were 0°, 30°, 45°, 60°, 75°, and 90°. A total of 21 specimens were prepared for these tests, with three specimens for each type of specimen. The specimens were numbered according to the following rule: “type-number”. For example, “Intact-1” was used to refer to specimen number “1” of an intact specimen. The remaining specimens were similarly numbered, and the prepared specimens are shown in Figure 4.

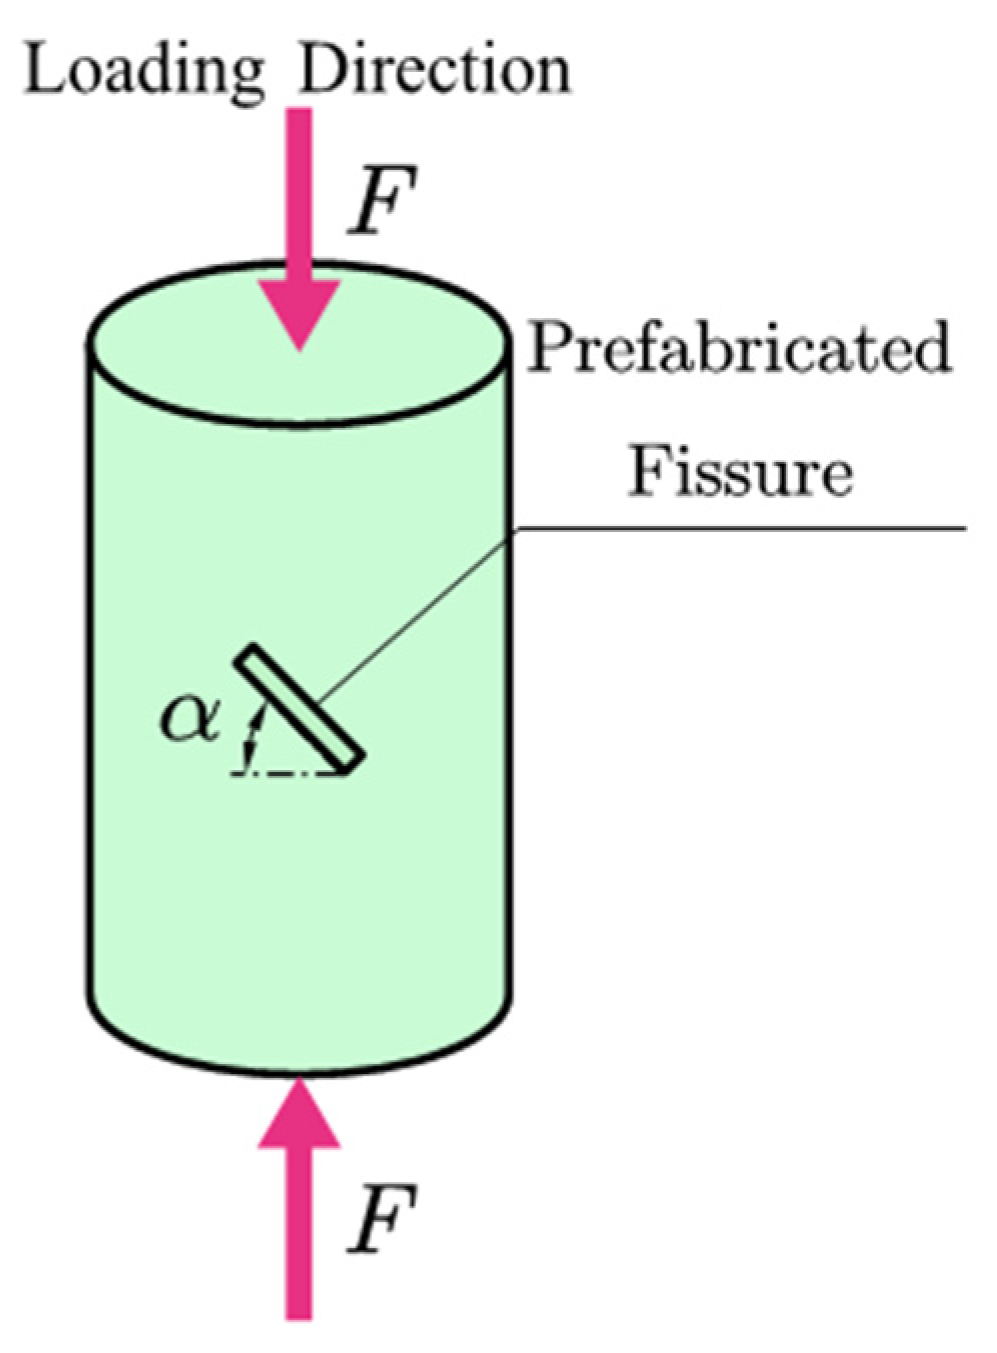
2.3. Experiment Design

The uniaxial compression test on sandstone-like specimens was conducted to investigate the effect of the fissures on the deformation characteristics and failure patterns of the rock mass. A high-speed camera was employed to document the deformation of the specimen surface. The displacement and strain of the specimen surface were analyzed by the DIC method, and the strain distribution of the specimen surface was generated.
We performed mechanical tests on both intact specimens and fissure specimens. The mechanical parameters were calculated as the average of the three test results. The loading speed was conducted with displacement-controlled loading and the deformation process was recorded by a high-speed camera. The test system, depicted in Figure 5, comprised the following components: a mechanical testing machine, a high-speed camera, a data acquisition card, LED lighting, a computer, and DIC analysis software (VIC-2D 7.2). The test method is illustrated in Figure 6. The DIC analysis software used in this investigation was VIC-2D, which can measure strains from 0.005% to 2000% with a measurement accuracy of 0.000005*FOV (Field of View).

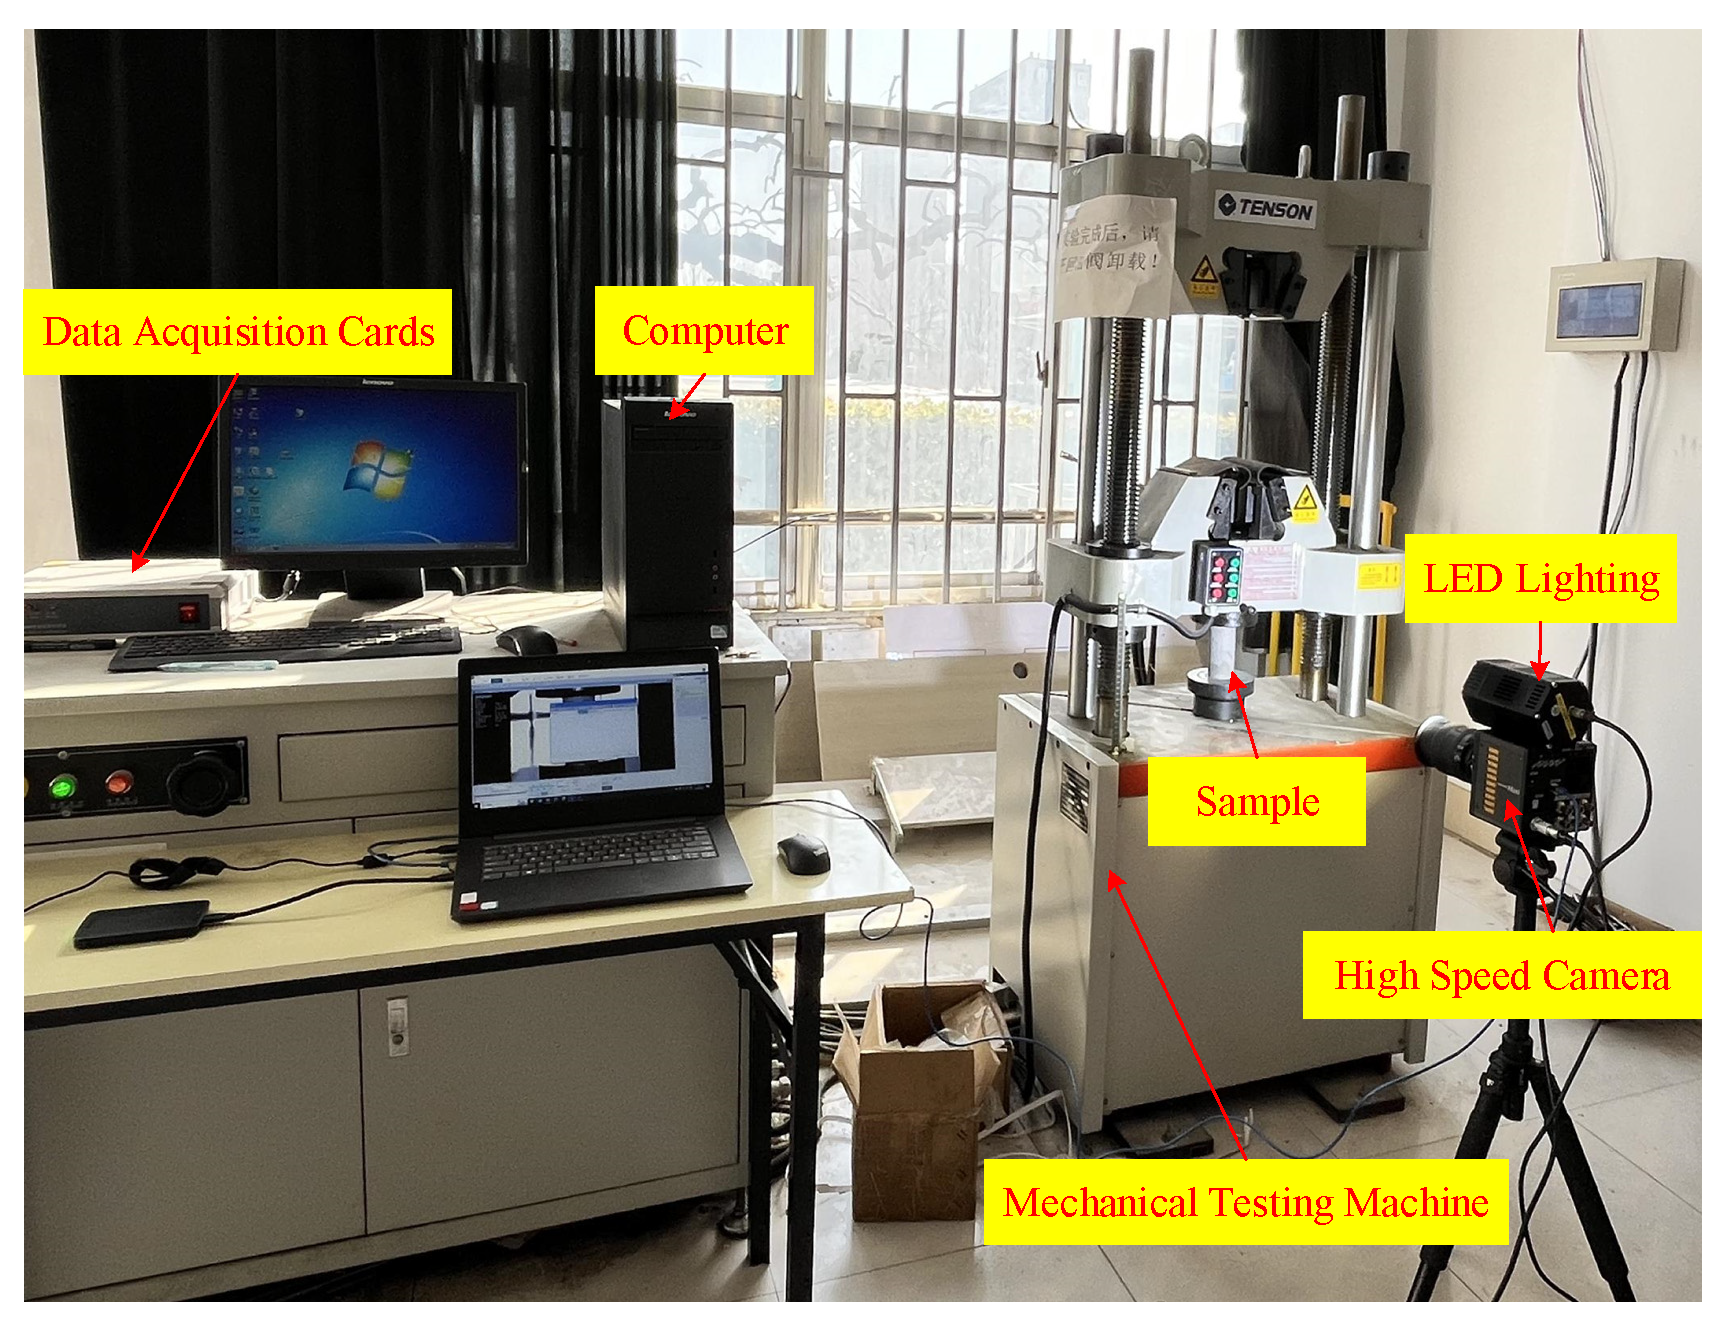
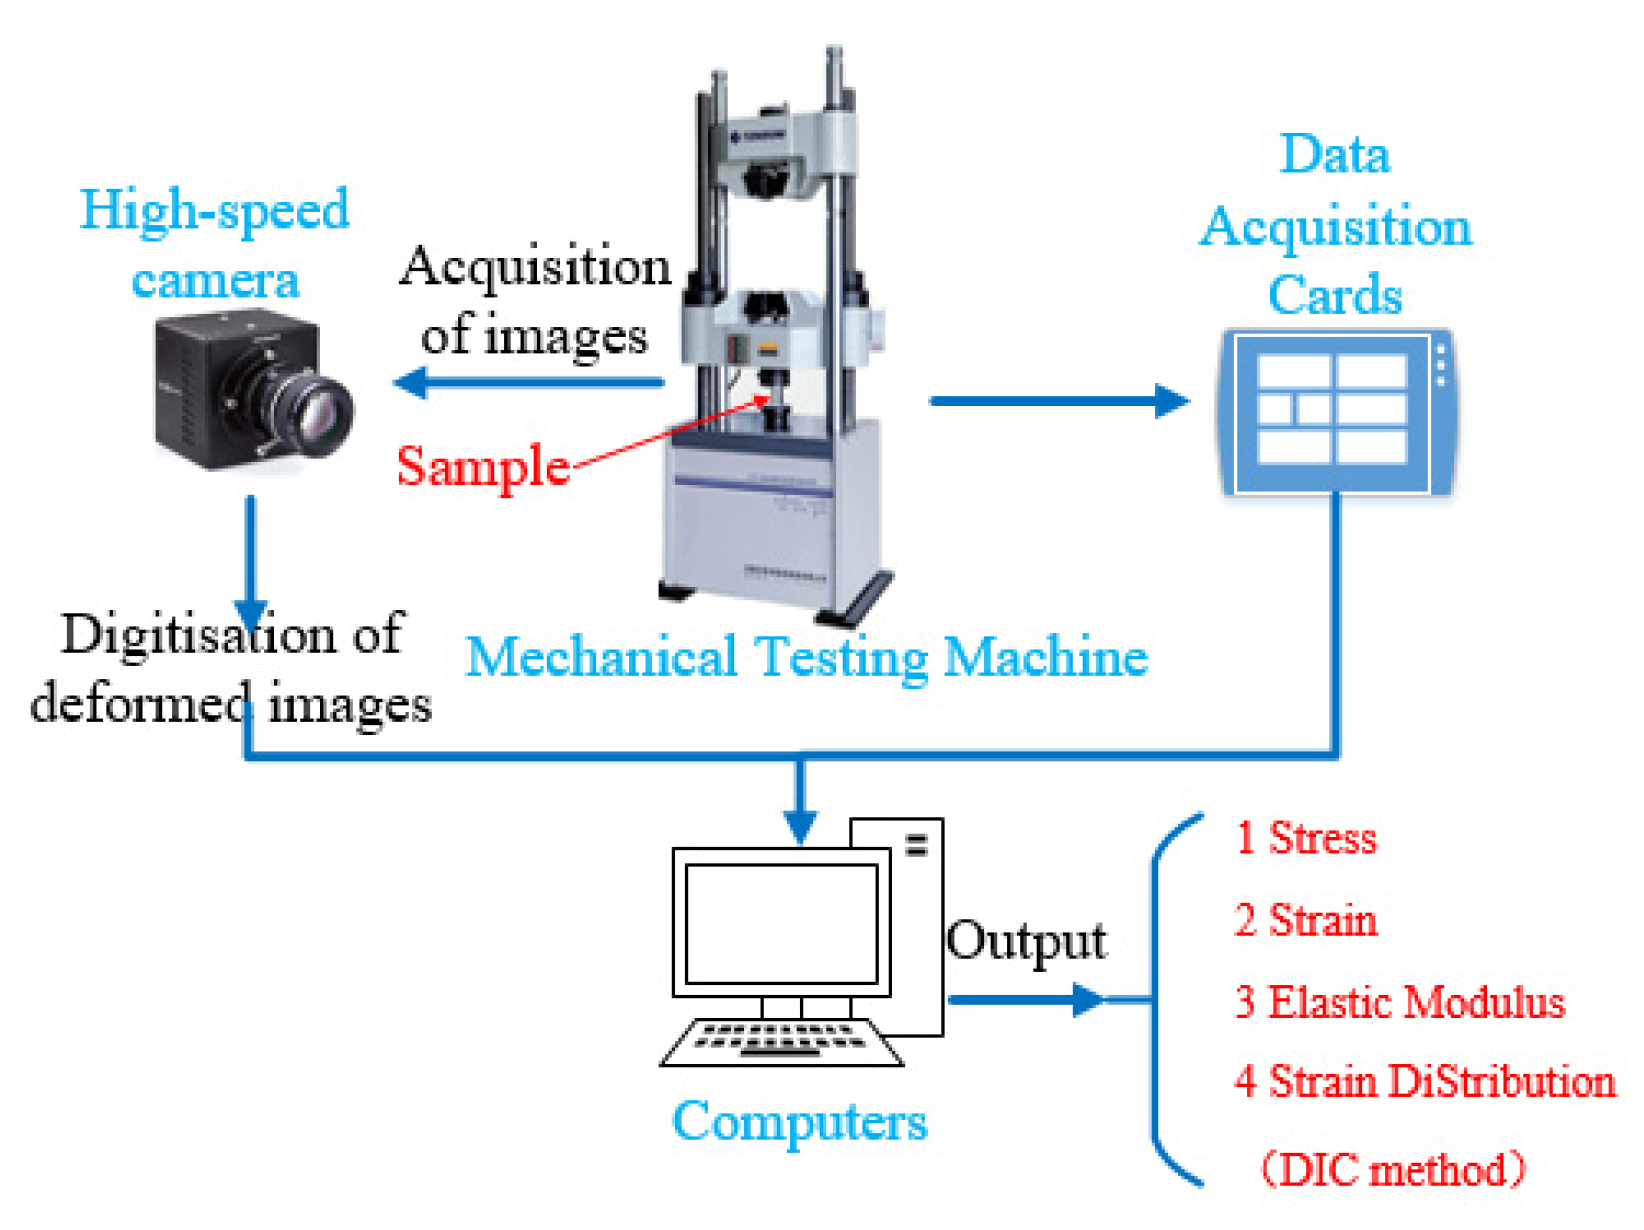
2.4. Experimental Process

Mechanical tests were conducted on intact specimens and prefabricated fissure specimens, respectively. The tests were performed with the material mechanics testing machine with a maximum load of 300 kN and an accuracy of ±50 N. In order to guarantee the reliability and precision of the test results, displacement-controlled loading was employed, with a loading rate of 0.1 mm/min. The specimen surface underwent imaging during the test, captured by a high-speed camera, FASTCAM Mini WX50, manufactured by Photron (Tokyo, Japan). The camera had an effective pixel resolution of 2048 × 2048 pixels, while the frame rate was set to 50 fps and the shutter speed to 1/1000.
The testing process was divided into three phases, as outlined below:
  • Loading process. The loading process entailed uniaxial compression tests on intact specimens and specimens with prefabricated fissures, respectively. The loading was halted immediately upon the specimen’s loss of bearing capacity and the emergence of discernible cracks on its surface.
  • Image acquisition. The deformation images of the specimen surface were captured with a high-speed camera. In order to obtain a clear image of the specimen, an LED flash was employed to illuminate the specimen.
  • Strain calculation. A comparison and analysis of the images of the deformed and undeformed specimens was conducted using the DIC method in order to calculate the strain distribution on the specimen surface.

3. Results and Discussion

The compressive strength, strain, and elastic modulus of the specimens were then calculated. Additionally, a comprehensive analysis was conducted to evaluate the crack pattern and the failure mechanism of the rock mass under the influence of prefabricated fissures. To prevent the introduction of error due to the discreteness of the mechanical test results, three tests were carried out for each specimen, with the resulting data averaged across the three tests.

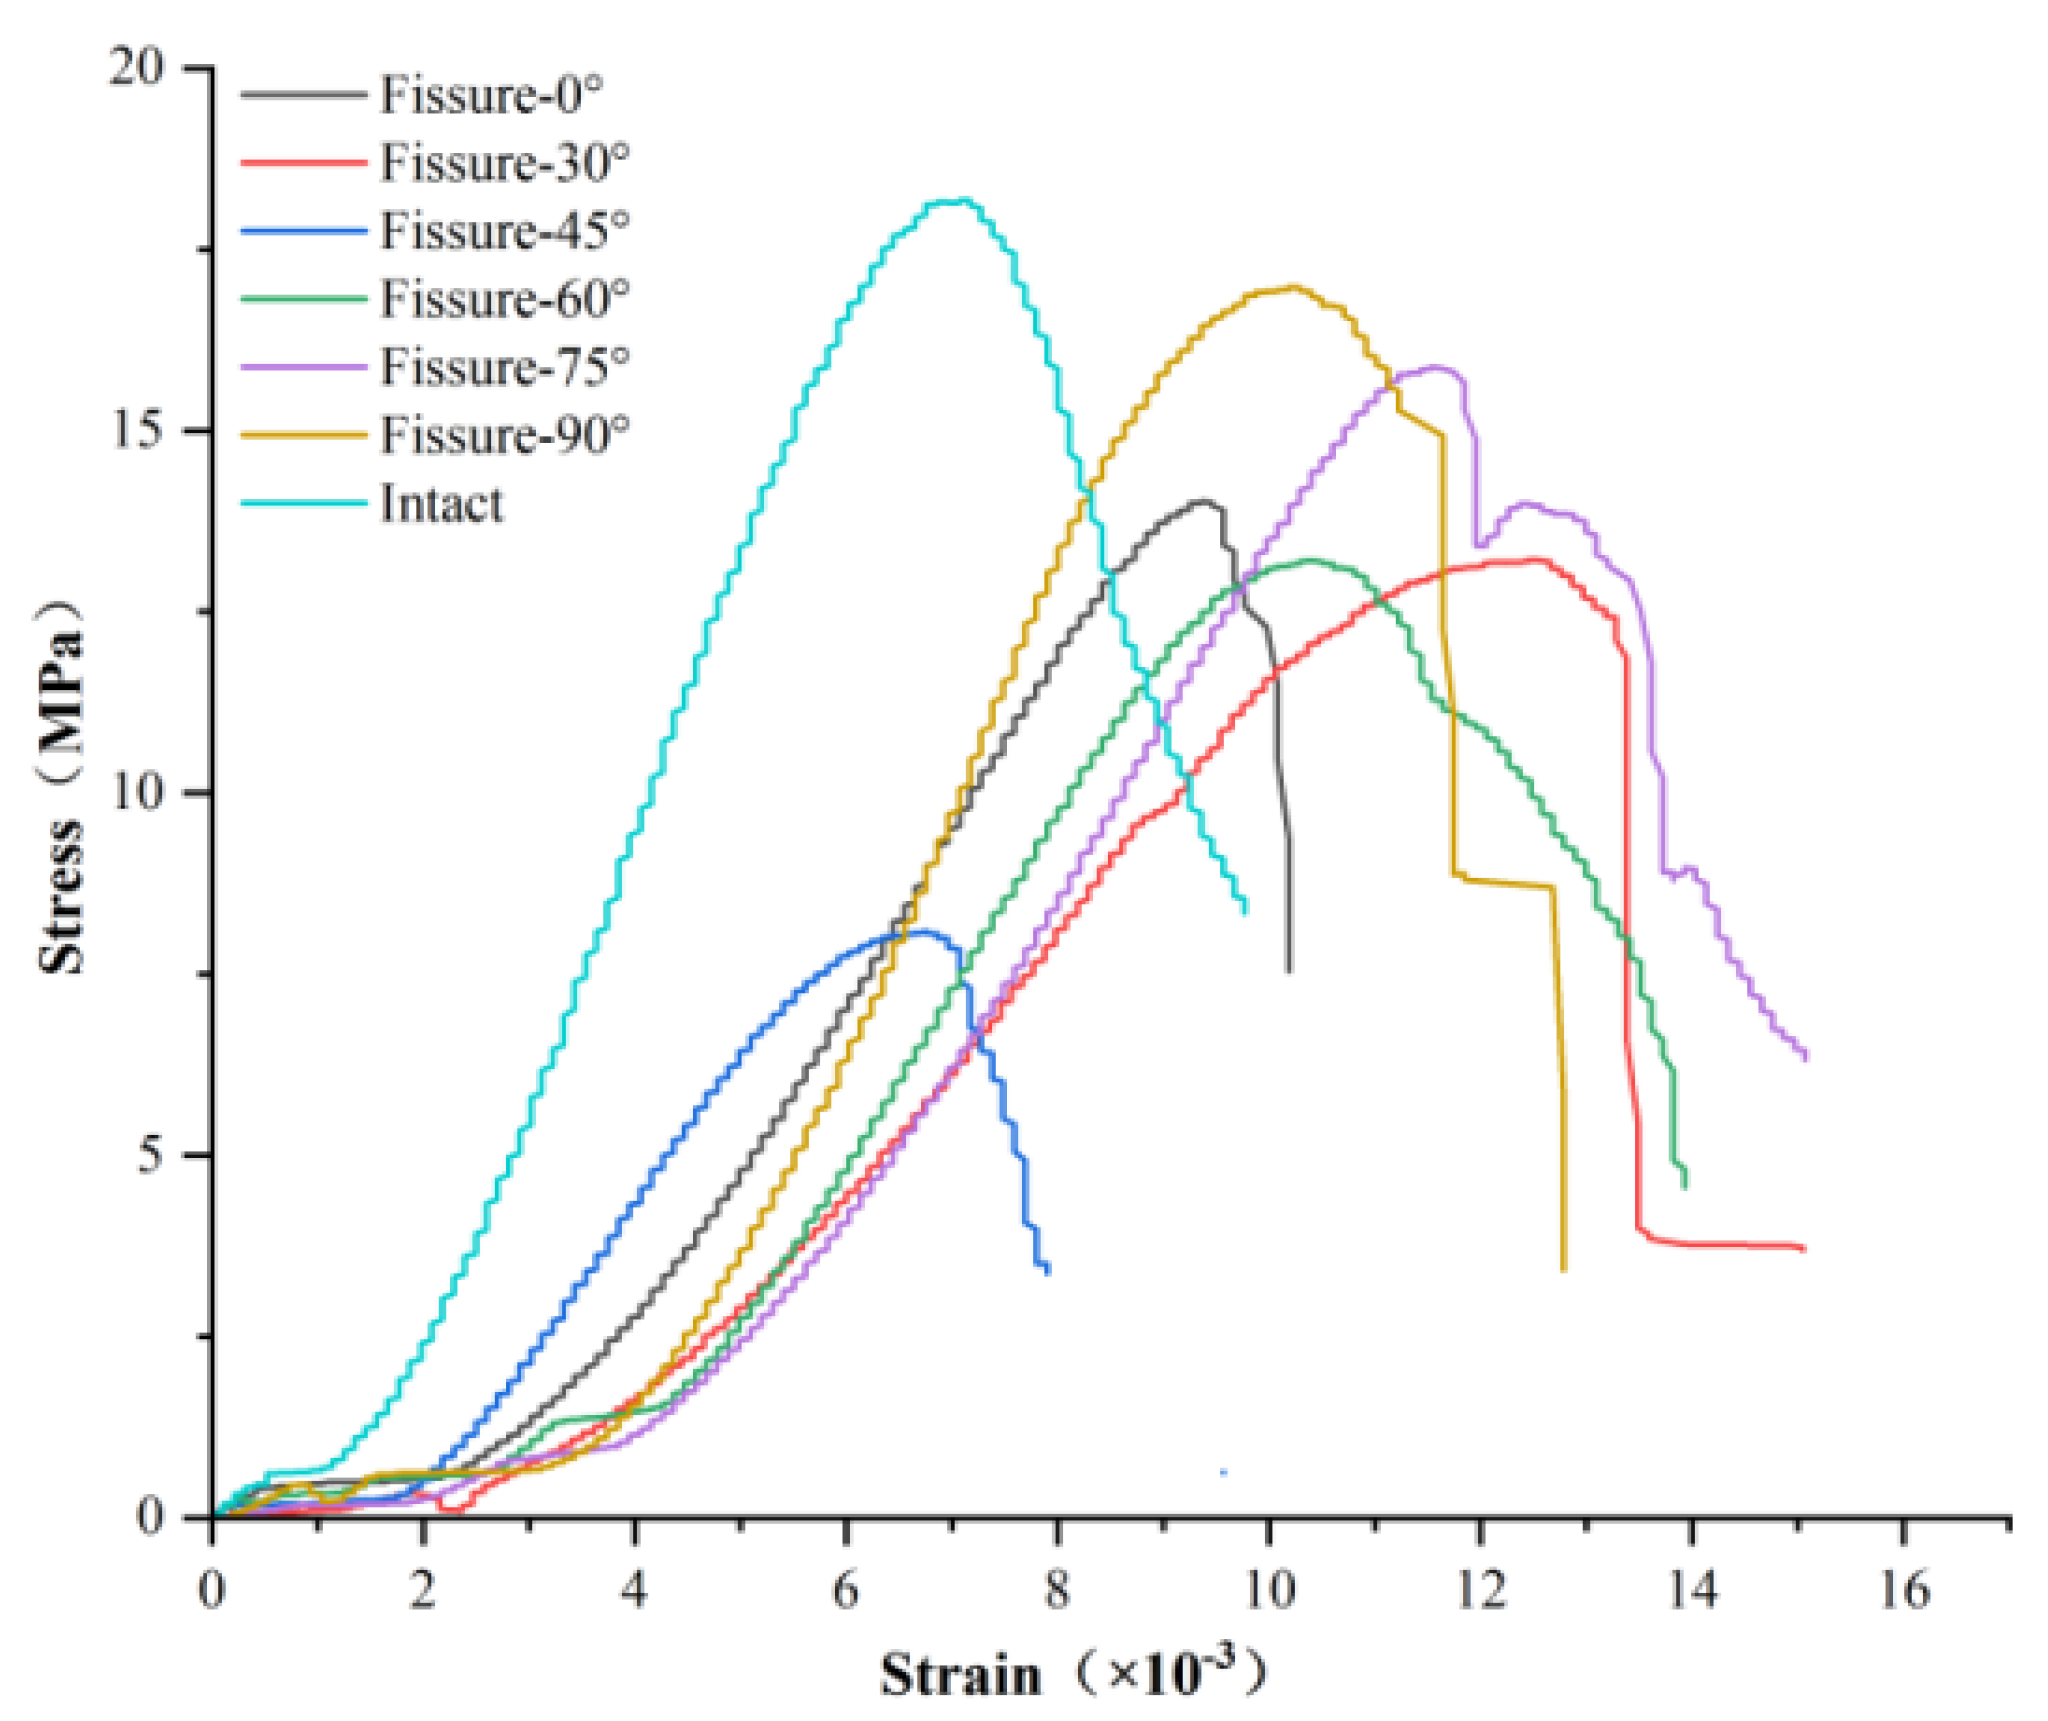
3.1. Stress–Strain Curves and Mechanical Parameters

In order to investigate the influence of fissure inclination on the mechanical properties of the specimens, seven kinds of specimens were tested. The stress–strain curves of intact and prefabricated fissured specimens from one group of tests were analyzed. Figure 7 depicts the stress–strain curves for both the intact and prefabricated fissured specimens. Table 2 presents the main mechanical parameters of all tested specimens. It can be observed that all specimens underwent four distinct stages during the loading process: the internal structural compression stage, the elastic deformation stage, the plastic deformation stage, and the destroyed stage. However, the stress–strain curves indicated that the internal structure of the intact specimen experiences a brief period of compaction prior to elastic deformation followed by the elastic deformation stage after a very small strain of approximately 1.45 × 10⁻³. In contrast, the prefabricated fissured specimens entered the elastic deformation stage following a larger deformation. The strain thresholds for the fissured specimens to elastic deformation ranged from 1.98 × 10⁻³ to 4.21 × 10⁻³. Furthermore, the fissured specimens exhibited larger deformations than the intact specimens before elastic deformation. The strain of the specimen before elastic deformation was attributed to the presence of microcracks, pores, and other internal structural defects, which resulted in the internal structure becoming compacted. This phenomenon has been observed in previous studies [26,27,28]. Also, this phenomenon has been observed in numerous compression tests on fissured rock [29].
In order to investigate the influence of the fissure inclination on the mechanical properties of the prefabricated fissure specimens, an analysis was conducted on the mechanical parameters measured in the tests. A detailed analysis of the strain distribution on the surface of the specimens and the initiation and evolution patterns of the cracks was conducted via the DIC method. The test results are presented in the following section.

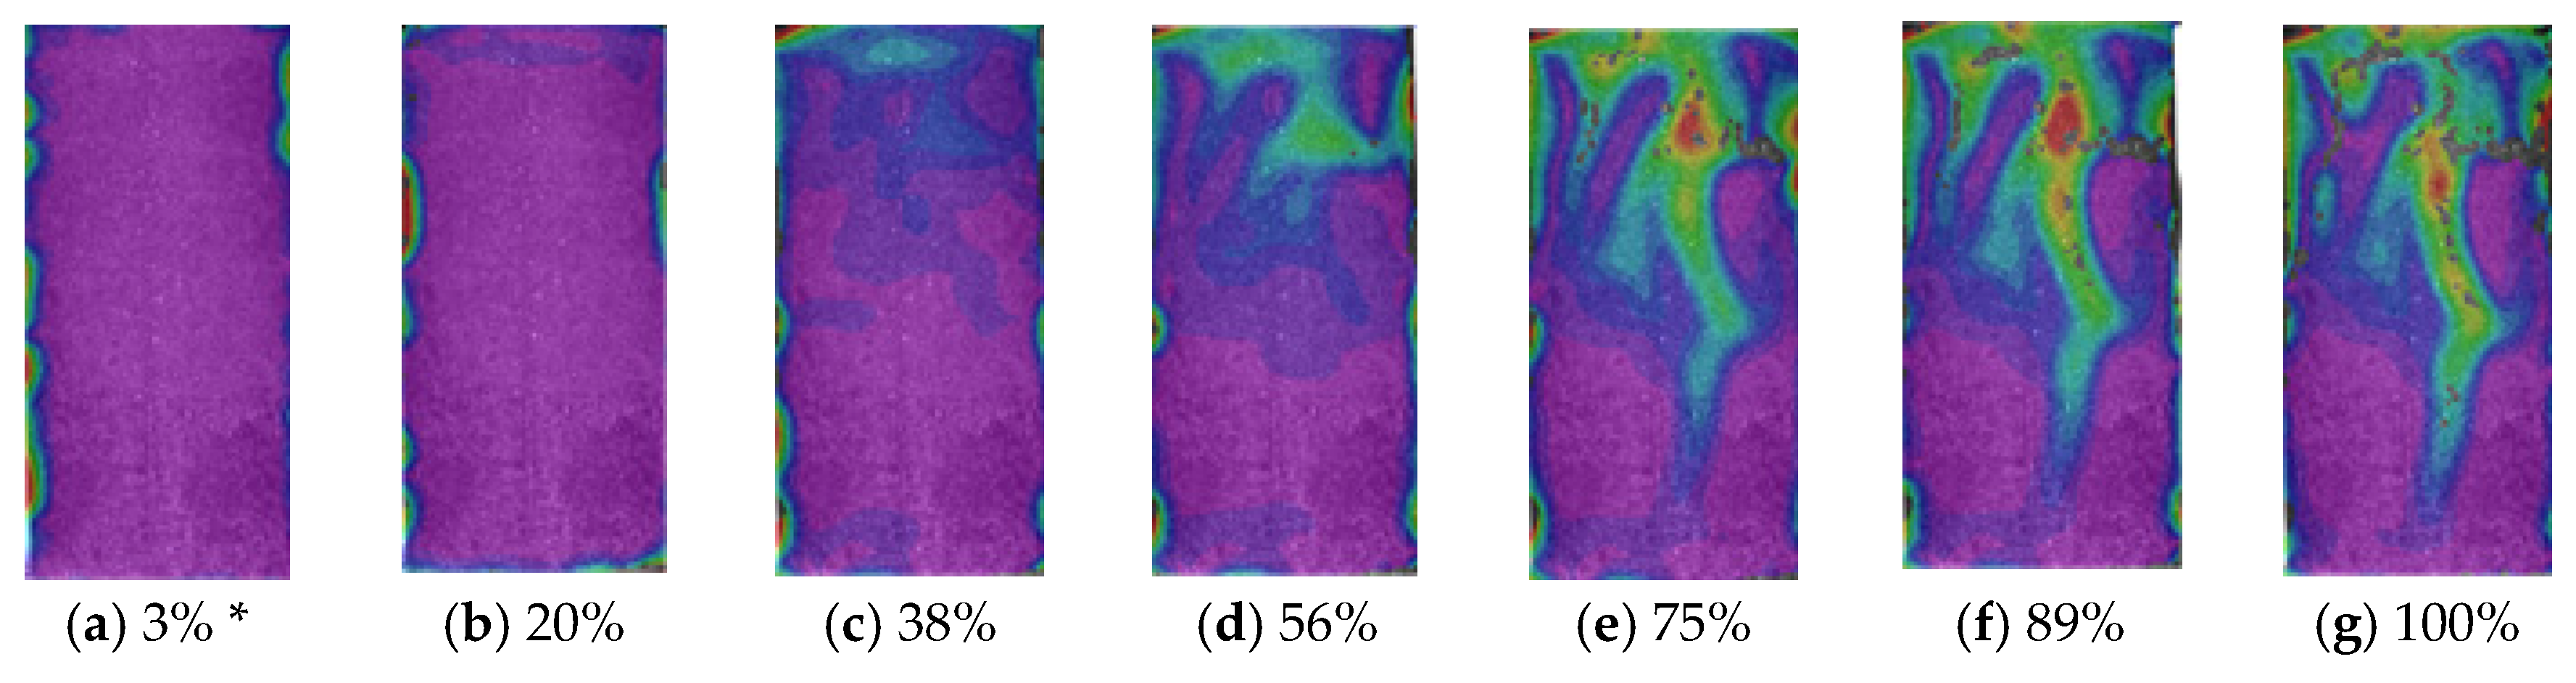
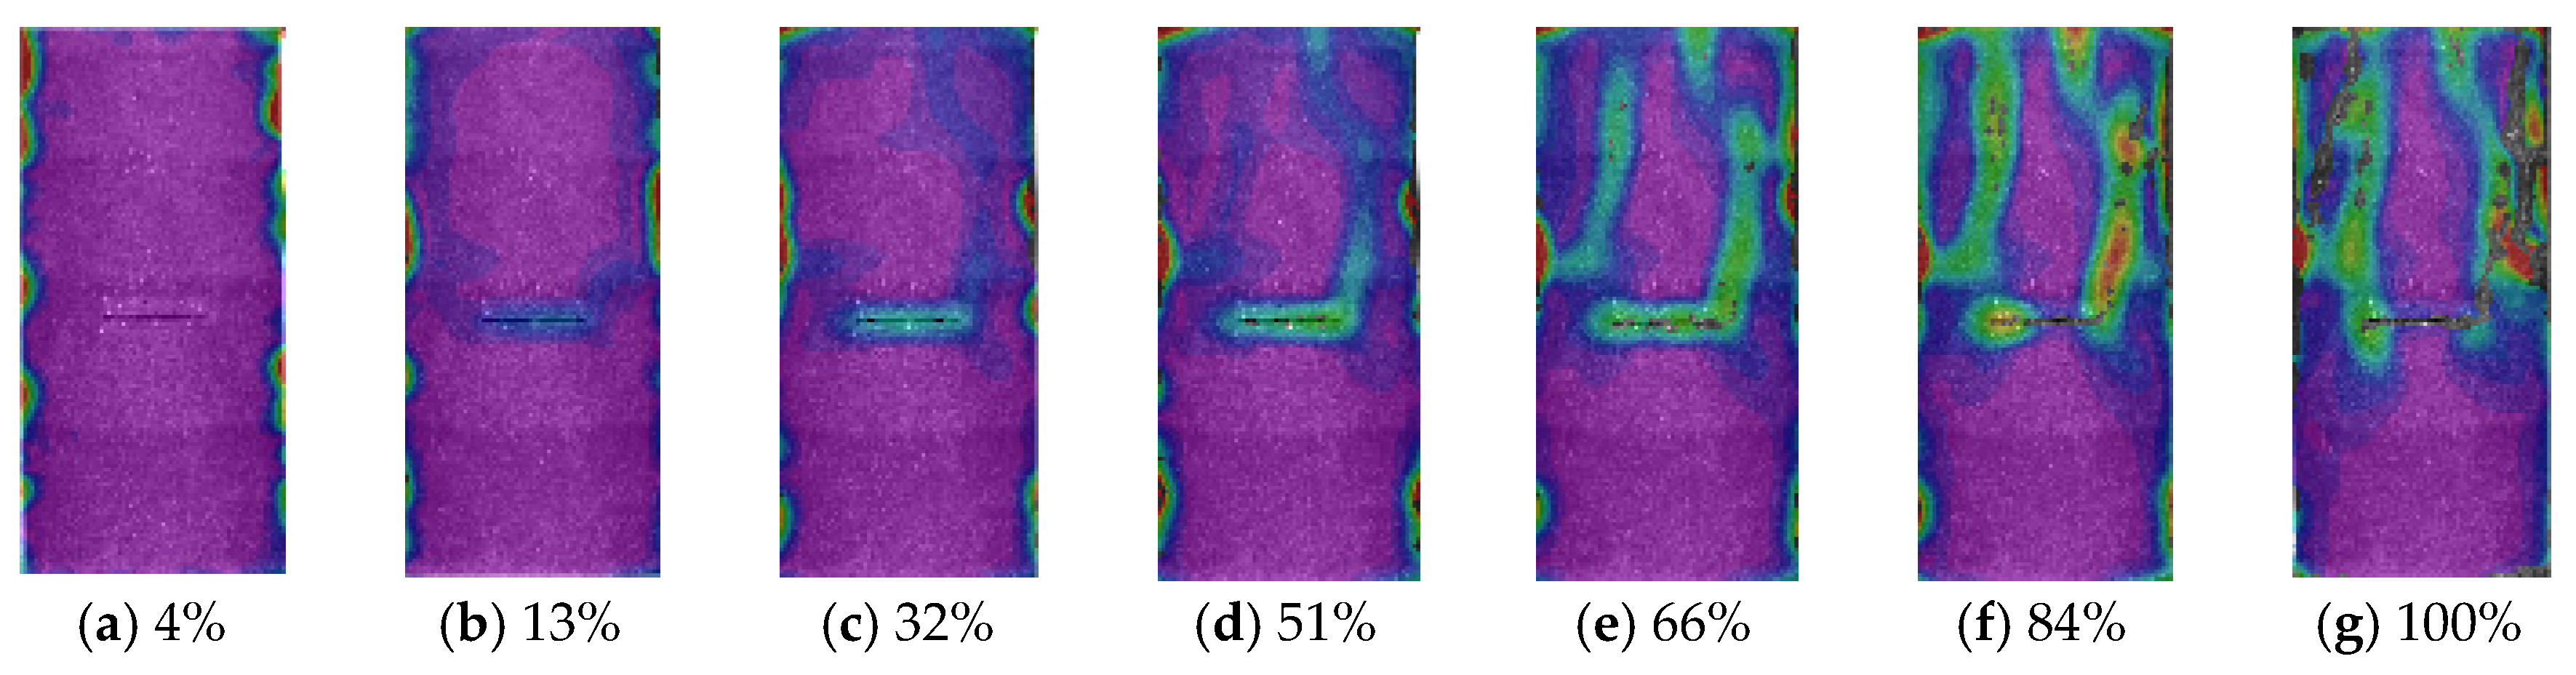
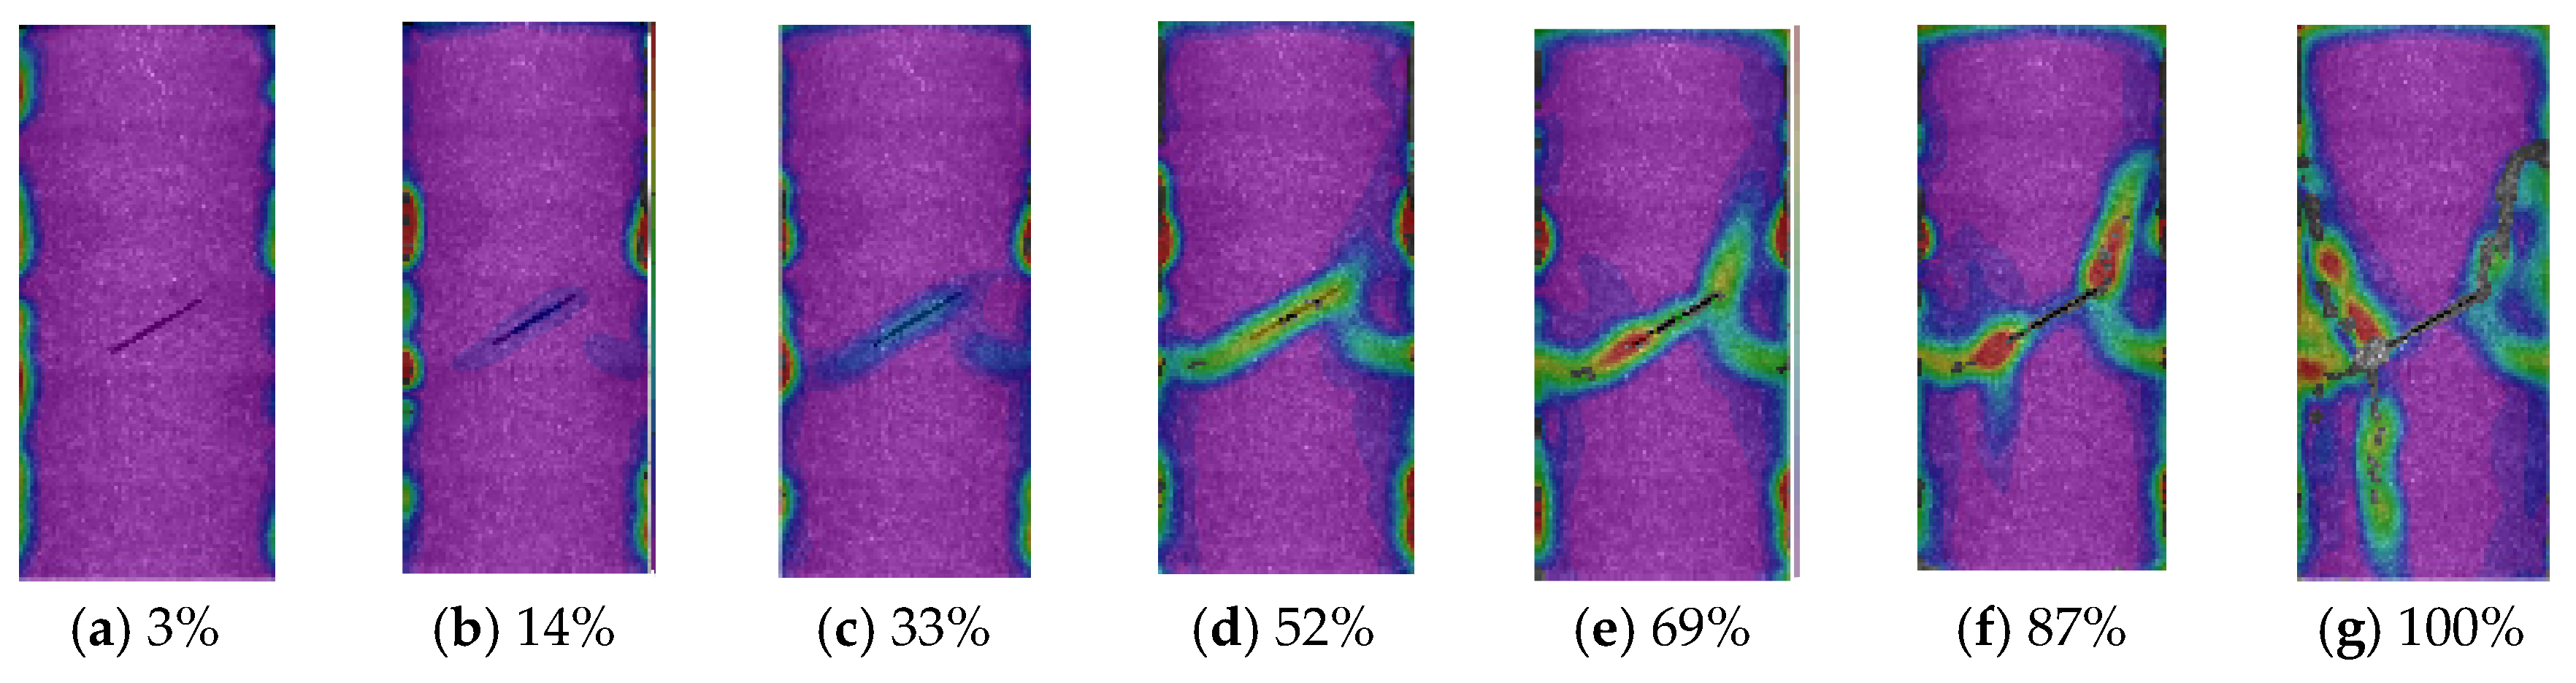
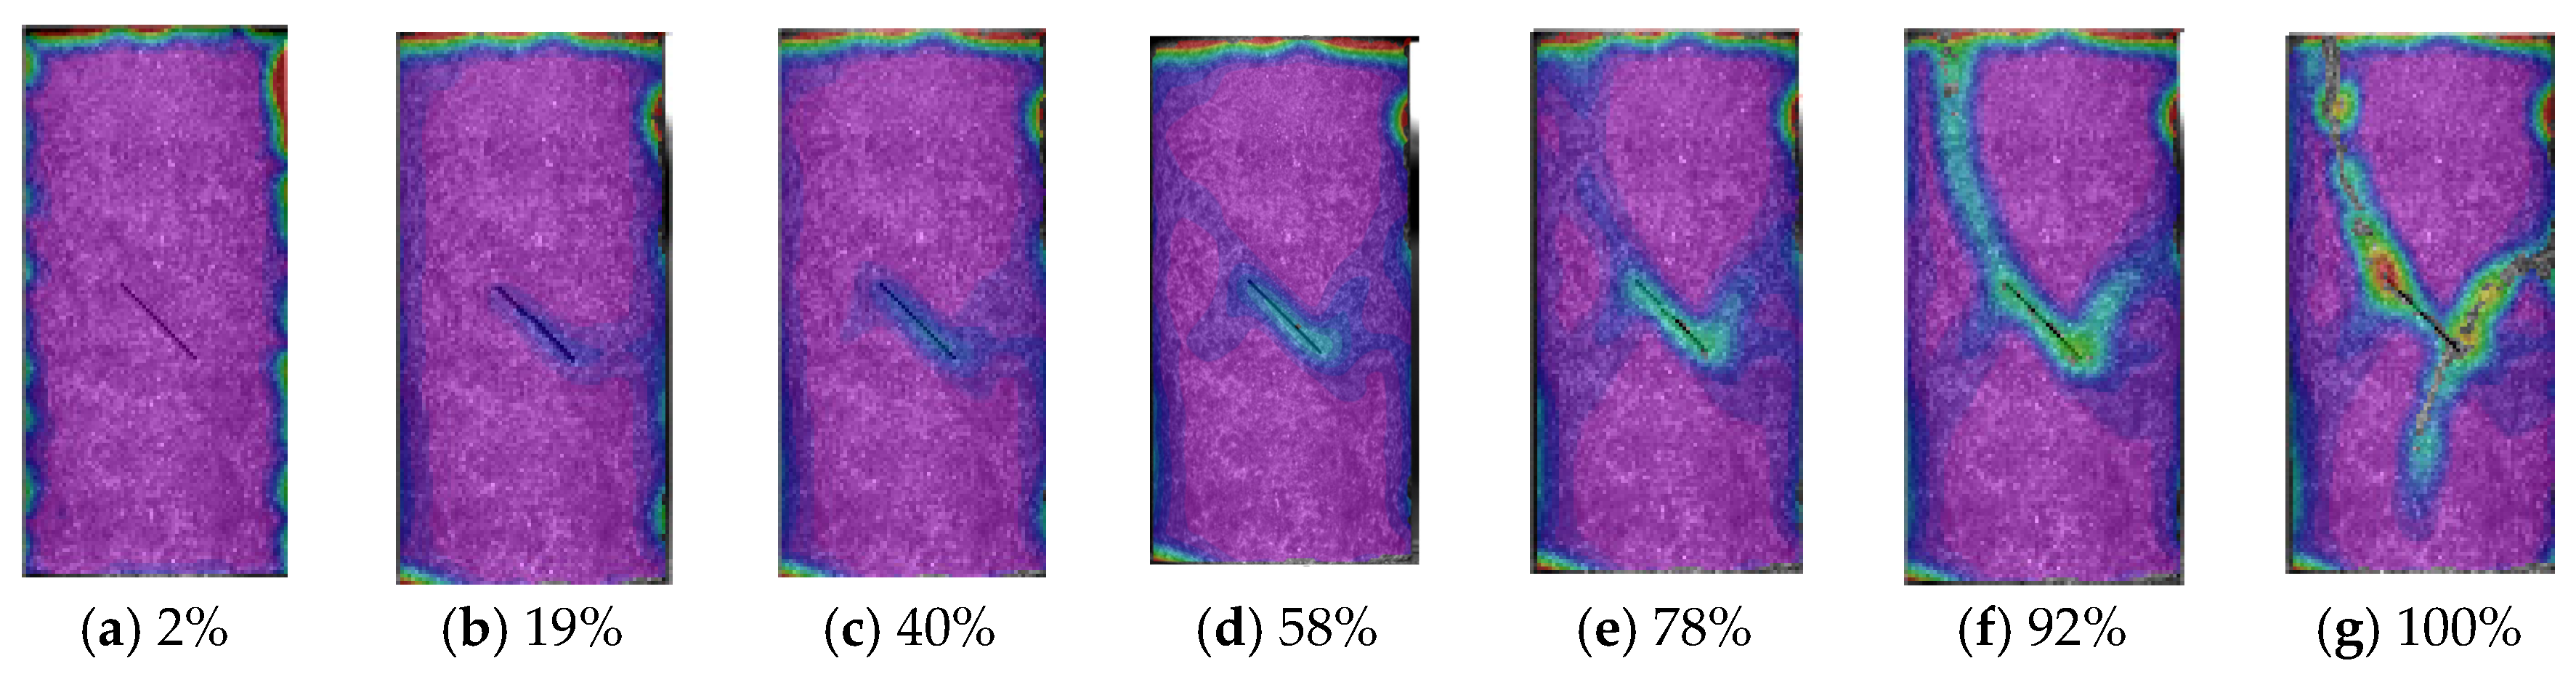
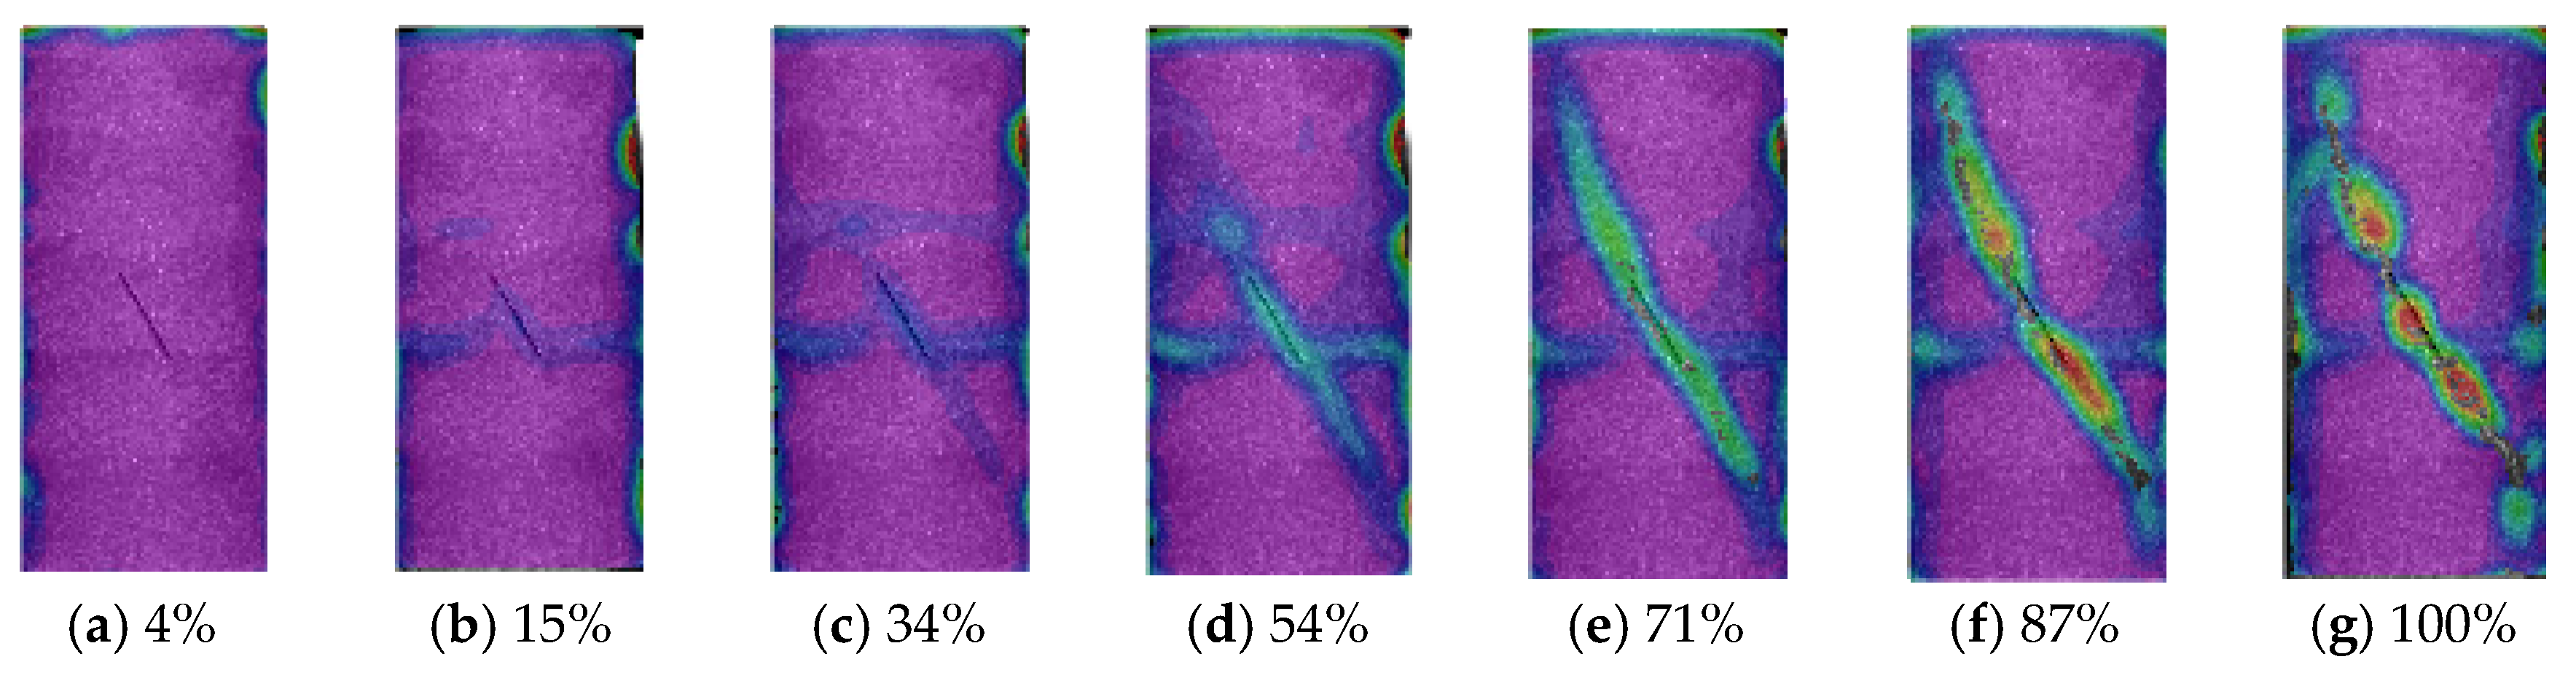
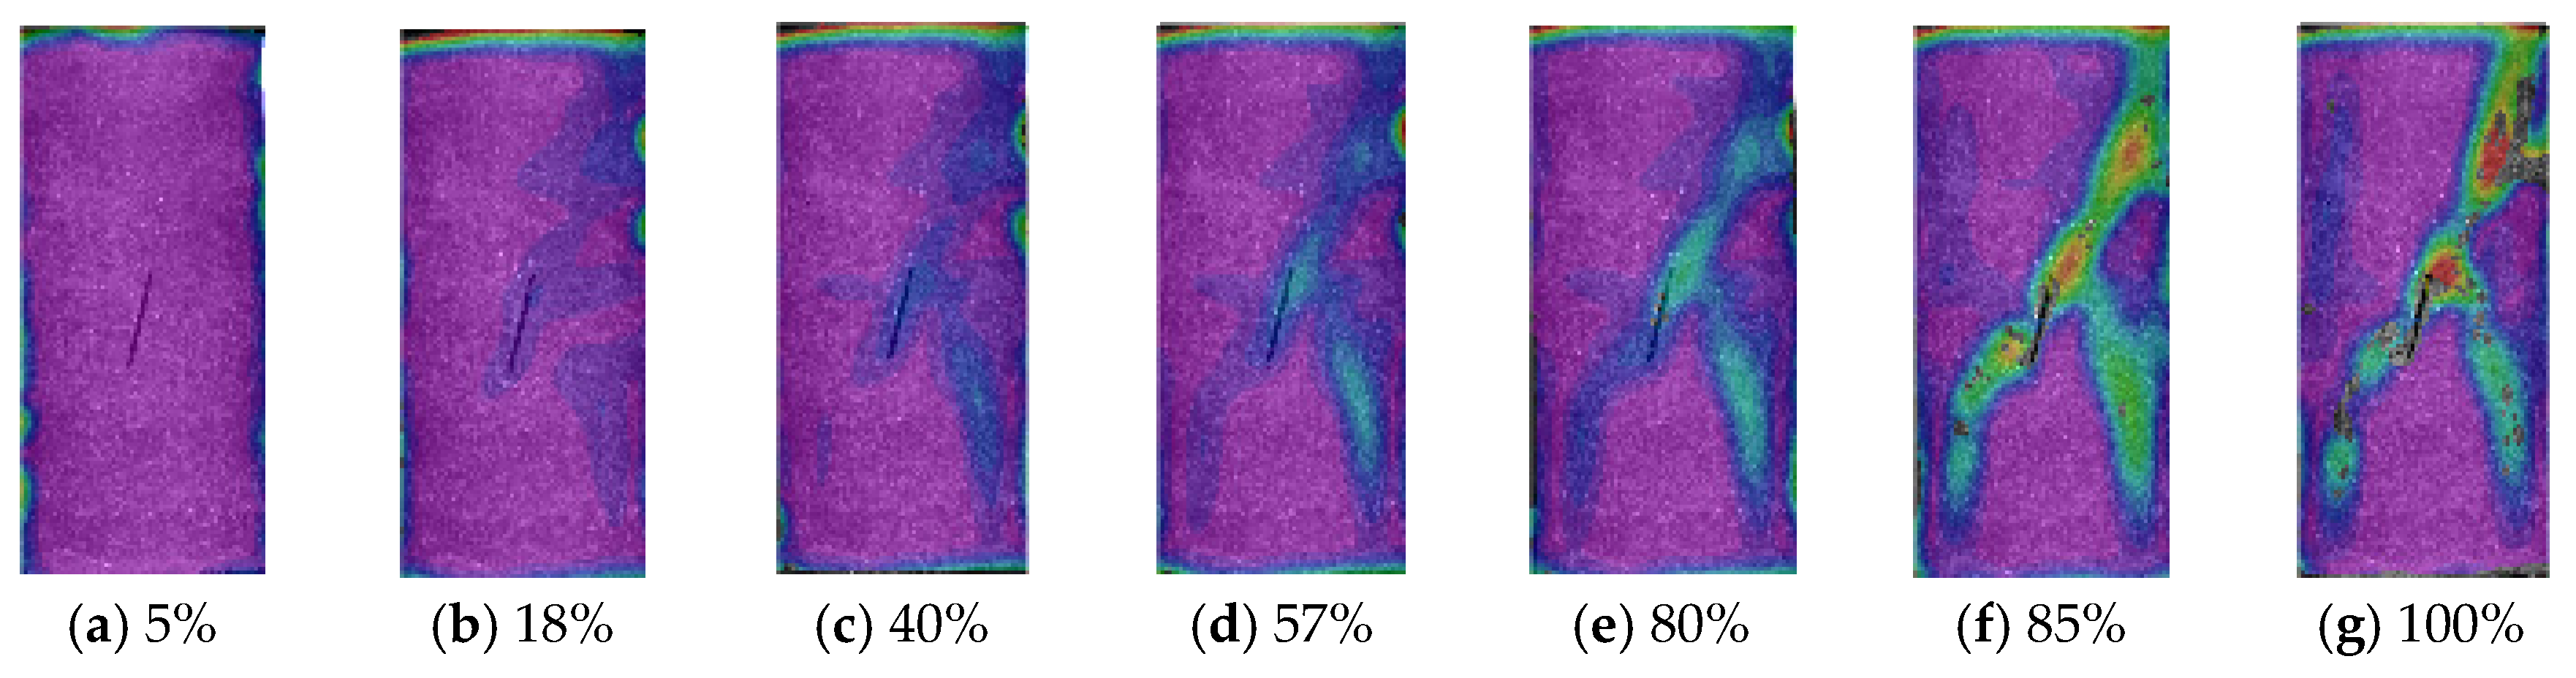
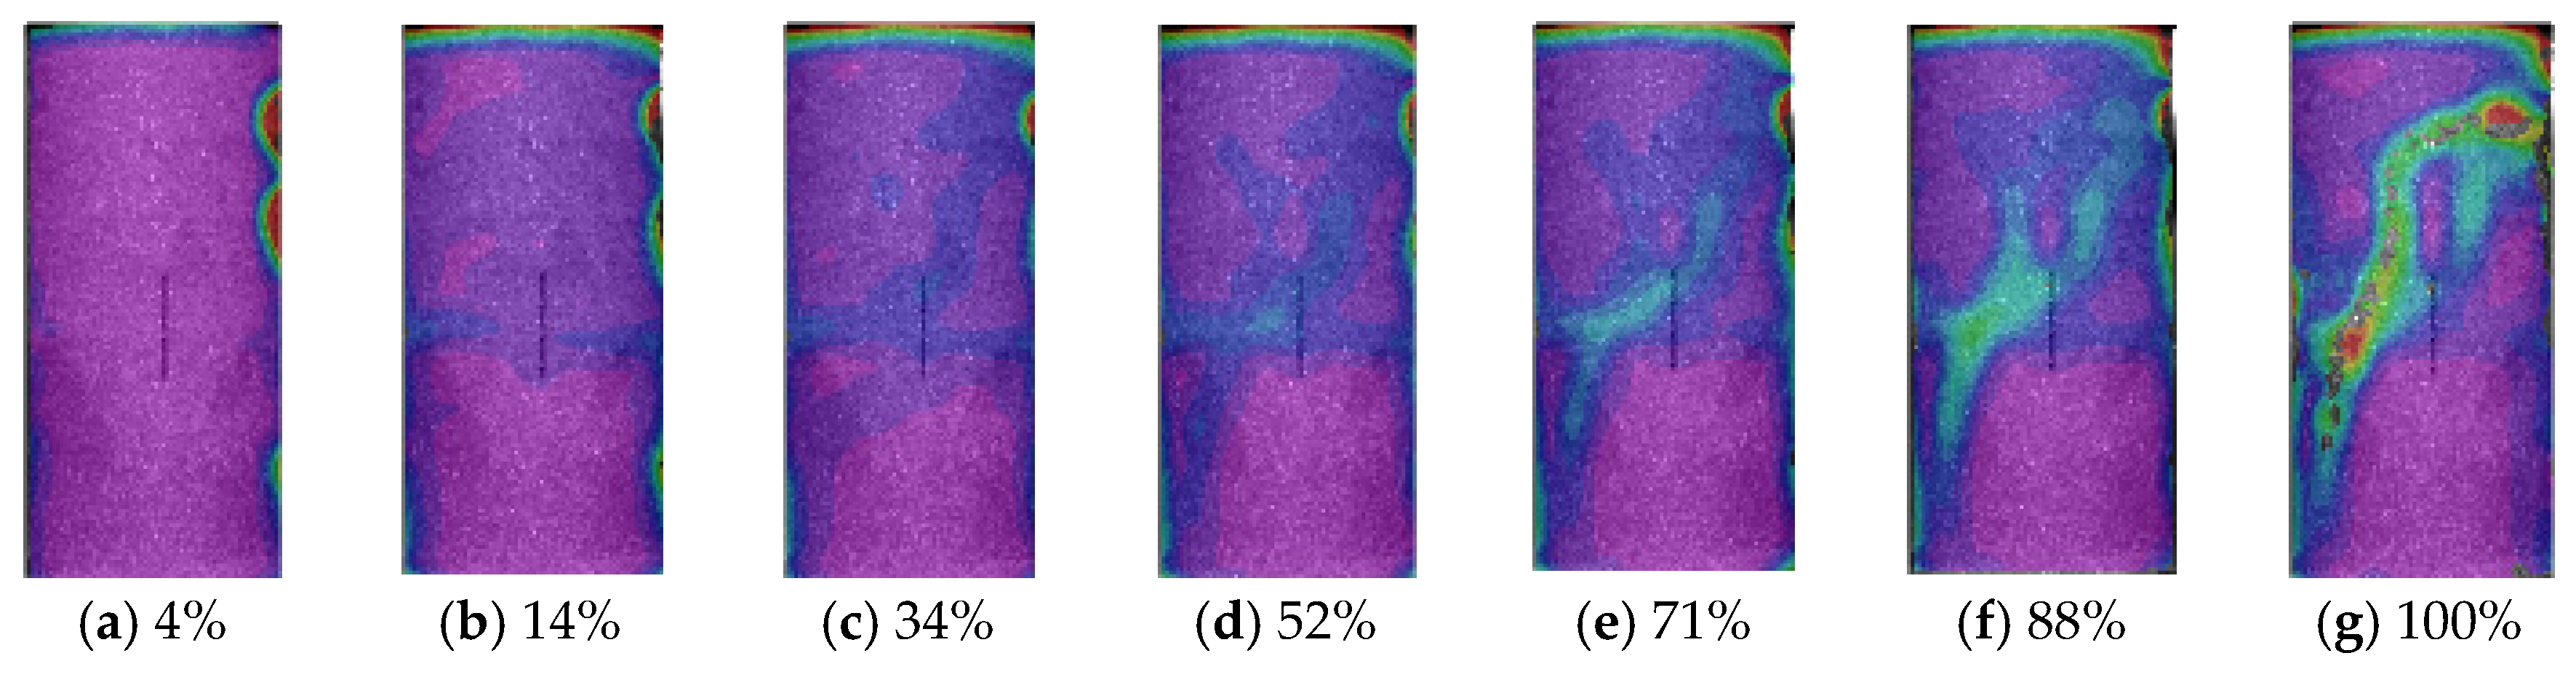
3.2. Analysis of Crack Evolution Based on the DIC Method

Many researchers have employed the DIC method to investigate the deformation of specimens [21,23,30,31]. We analyzed the deformation of intact and fissured specimens, respectively, and calculated the strain field on the surface of the specimen with the DIC method. In order to avoid the influence of errors on the strain analysis, we ignored the strains at the upper and lower ends and the left and right sides of the specimen. Consequently, the strain field in the middle part of the specimen was analyzed.
Previous studies have demonstrated that the deformation of the specimen was homogeneous when the applied load was small. Nevertheless, as the applied load increased, the anisotropy of the material caused the specimen surface to deform in a non-uniform manner [32]. As the load increased, the internal cracks that had previously existed in the sample began to propagate, grow in size, and ultimately lead to failure [33].
For the intact specimen, it was found the strain was extremely small and relatively uniformly distributed when the load did not exceed 3% of the peak stress (Figure 8a). As the load increased (Figure 8b), the strain on the surface of the specimen was concentrated at the top and extended downward from the top along the direction of the principal stresses (Figure 8c,d). This resulted in the formation of microcracks at the site of a larger strain. Concurrently, microcracks were observed at the locations of the greatest strain. The deformation of the specimen surface gradually increases along with the principal stress when the load exceeds 75% of the peak stress (Figure 8e,f). This was accompanied by the appearance of obvious cracks on the specimen surface, which resulted in specimen damage when the load exceeded the specimen’s bearing capacity (Figure 8g). Liu [34] observed that new cracks appeared on limestone specimens when the load reached 52% to 69% of the peak strength. New cracks were generated in the specimens at approximately 56% of the peak strength. This phenomenon was primarily attributable to the presence of prefabricated fissures, which resulted in the concentration of stress around the fissure tips.
It could be observed that the deformation was relatively uniform in the initial loading stage. As the load increased, new cracks were generated in the strain concentration areas, extending in the direction of the principal stress. The distribution of cracks on the specimen indicated that the area of crack distribution was in agreement with the strain concentration area identified in the DIC analysis. This indicated that the strain concentration area might be a potential area for the generation of new cracks, which in turn might result in further damage in this area.
The crack evolution process of the prefabricated fissured specimens can be roughly divided into two groups. One group was the fissured specimen with inclinations of 0°, 30°, and 45°. In this group, the strain of the specimen increased from the tip of the fissure and extended outward from the tip of the fissure. The other group was the fissured specimen with inclinations of 60°, 75°, and 90°. The strain of these specimens converged from the vicinity of the fissure to the tip of the fissure and then extended from the tip of the fissure to the perimeter of the specimen.
The strains present in specimens with inclinations of 0°, 30°, and 45° were found to be uniformly distributed, with a coordinated and consistent deformation of the specimen when the applied load did not exceed 4% of the peak stress (Figure 9a, Figure 10a and Figure 11a). Non-uniform deformation of the specimen surface occurred when the applied load exceeded 13% and 19% of peak stress (Figure 9b, Figure 10b and Figure 11b), accompanied by an increase in strain at the prefabricated fissure. The strain concentration was observed in the specimen at the tip of the prefabricated fissure when the load increased to 32% to 40% of the peak stress. The strain exhibited a gradual increase along the direction of the principal stress (Figure 9c,d, Figure 10c,d and Figure 11c,d). Analogous phenomena had been identified in rock-like specimens with prefabricated fissures [35].
The specimen exhibited an apparent crack when the applied load reached approximately 51% to 58% of the specimen’s peak stress (Figure 9e,f, Figure 10e,f and Figure 11e,f). The specimen’s surface strain then gradually expanded from the fissure tip in a direction parallel to the principal stress. The strain primarily propagated in two directions: parallel and perpendicular to the prefabricated fissure. Upon reaching a load of approximately 84% to 92% of its peak stress, a series of discernible cracks emerged on the specimen’s surface (Figure 9g, Figure 10g and Figure 11g). A comparison of the images of the specimen damage with the results of the DIC analysis revealed that the cracks generated after breakage coincided with the locations of bigger strains.
It was observed that the distribution of the strain was uniform when the load reached 5% of peak stress for specimens with fissure inclination angles of 60° and 75° (Figure 12a, Figure 13a and Figure 14a). The strain of the specimen initially increased from the middle part of the specimen and converged to the fissure tip when the load reached 34% to 40% of the peak stress rather than converging from the tip of the fissure (Figure 12b, Figure 13b and Figure 14b). The strain in the specimen increased gradually from the tip of the fissure in the direction of the principal stress toward the ends of the specimen when the load reached 54% to 57% of the peak stress (Figure 12d, Figure 13d and Figure 14d). Upon reaching a load of 71% to 80% of the peak stress, numerous cracks emerged on the specimen (Figure 12e, Figure 13e and Figure 14e). These cracks aligned consistently with the direction of the fissure. The specimen began to exhibit signs of destruction when the load exceeded 87% of the peak stress (Figure 12f, Figure 13f and Figure 14f).
In the case of the specimen with a fissure inclination of 90°, the DIC analysis revealed that the surface strain of the specimen was uniformly distributed when the load did not exceed 4% of the peak stress (Figure 14a). However, when the load exceeded 34% of the peak stress, the distribution of strain on the surface of the specimen appeared to be non-uniform (Figure 14c). The locations of higher strains were predominantly observed above the bottom of the fissure. The strain increased from the area near the fissure when the load exceeded 52% of the peak stress (Figure 14d), which was different from the other specimen where the strain change started from the tip of the fissure. Upon exceeding 71% of the peak stress (Figure 14e), the specimen exhibited visible cracks on the specimen’s surface. As the load approached 88% of the peak stress (Figure 14f), the size and number of these cracks grew, reaching a point where they became a precursor to damage. At this point, the specimen exhibited a significant deterioration in its structural integrity. This discrepancy might be attributed to the direction of the fissure being perpendicular to the direction of the principal stress at 90°, making it difficult for the specimen to produce stress concentration inside the fissure tip. In mechanical tests on sandstone-like materials, it was demonstrated that the change in strength and elastic modulus of the specimens was minimized at a fissure dip angle of 90°. In other instances of prefabricated fissures, the fissure was oriented at an angle to the direction of the principal stresses; thereby, the possibility of the stress concentration increased at the tip of the fissure.

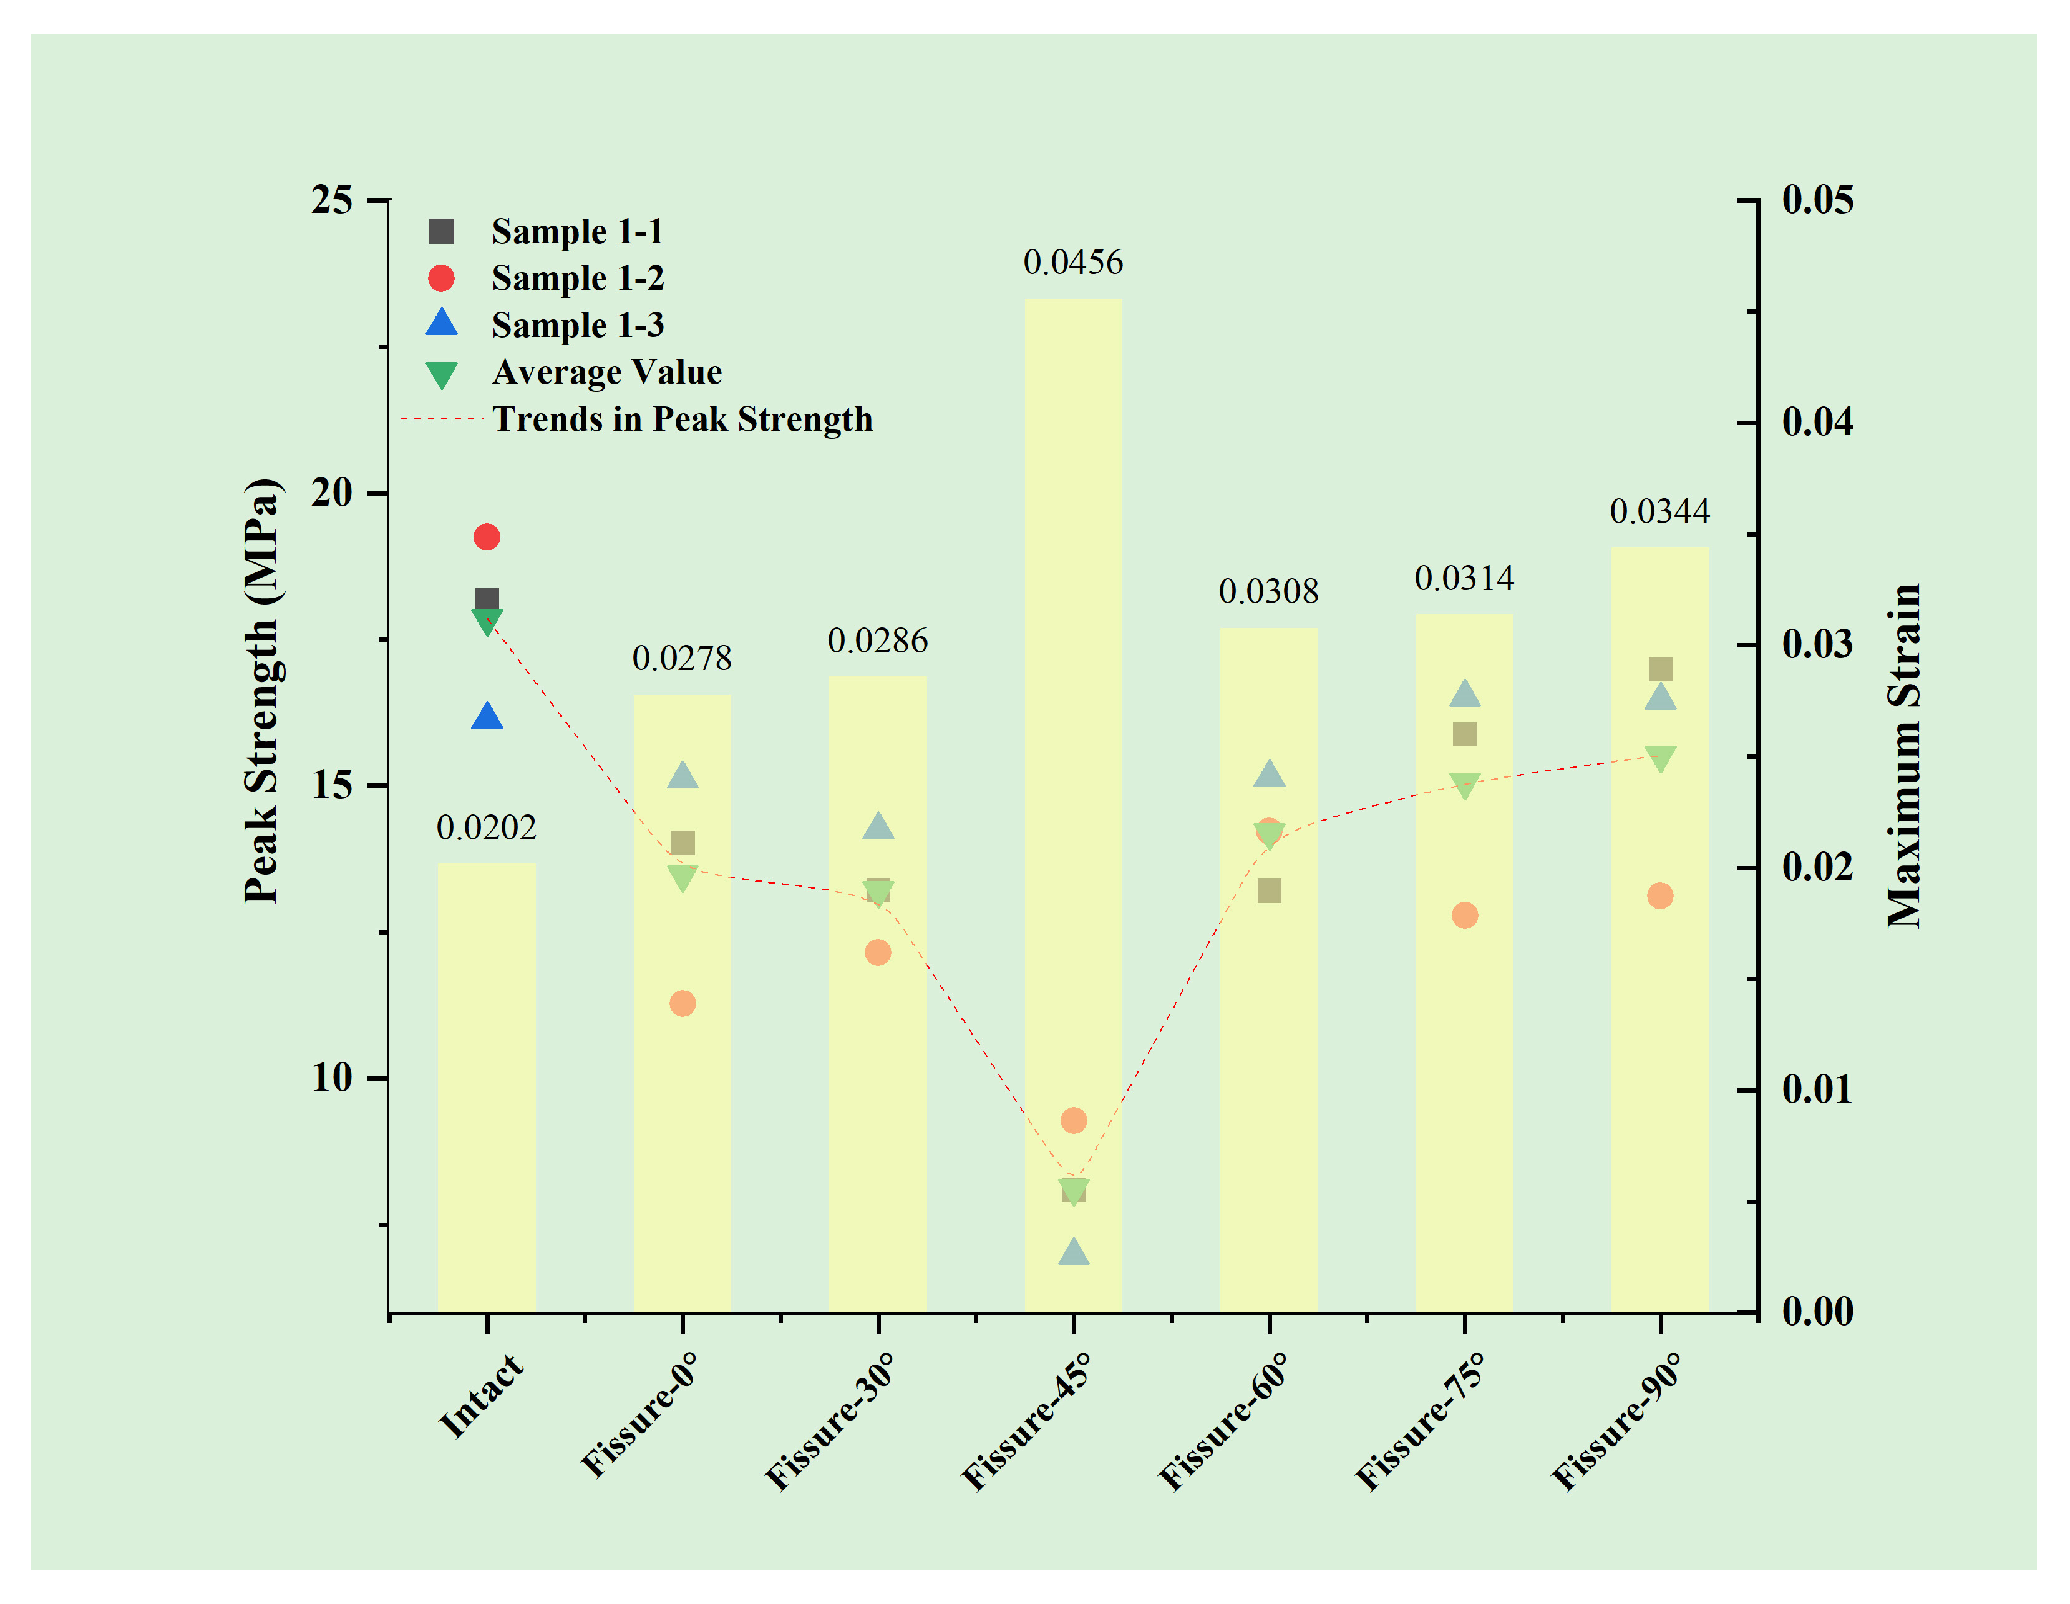
3.3. Effect of Fissure Inclination on Peak Strength and Maximum Strain

Based on the peak stresses in Table 2, we calculated the average of the three sets of peak stresses (green points). The relationship between the peak strength and the maximum strain with the fissure inclination angle is shown in Figure 15. In Figure 15, it can be seen that the maximum strain increases and then decreases with the increase in the fissure inclination, and the maximum strain on the specimen surface reaches the maximum value of 0.0456 at the fissure inclination angle of 45°, which is increased by 125.74% compared with the intact specimen. The maximum strains at the fissure inclination angle of 0–30° and the fissure inclination angle of 60–90° are increased by 37.63–70.30% compared with the intact specimen. The peak strength decreases with the increasing fissure inclination angle and then increases, and the strength also reaches the minimum value at 45°, which is only 8.094 MPa, and compared to the intact specimen, the strength is reduced by 55.46%. The peak strengths at fissure inclination angles of 0–30° and 60–90° decrease by 6.53–27.25% compared with the intact specimen, indicating that the fissure has the greatest effect on the strength of the specimen at 45°.
When comparing the trends of peak strength and maximum strain, it was found that the presence of fissures increased the deformation and decreased the strength. Furthermore, it was determined that the inclination angle of 45° had the greatest effect on the specimen, resulting in the lowest strength and the greatest local strain. In the tests [36] and simulations [37,38] of single-fissure specimens, it was also found that the strength of the specimens reached its minimum value at around 45°, and in the tests conducted with prefabricated double fissures in 3D-printed materials [39], it was found that the strength reached its minimum value at around fissure inclination of 30°. A combination of the DIC (Figure 9, Figure 10, Figure 11, Figure 12 and Figure 13) analysis revealed that the maximum strain of the damaged specimen occurred near the crack tips. New cracks tend to emerge at the crack tips of fissured specimens. This phenomenon can be attributed to the stress concentration at the crack tip, which results in damage accumulation in the local area and facilitates the formation of new cracks.

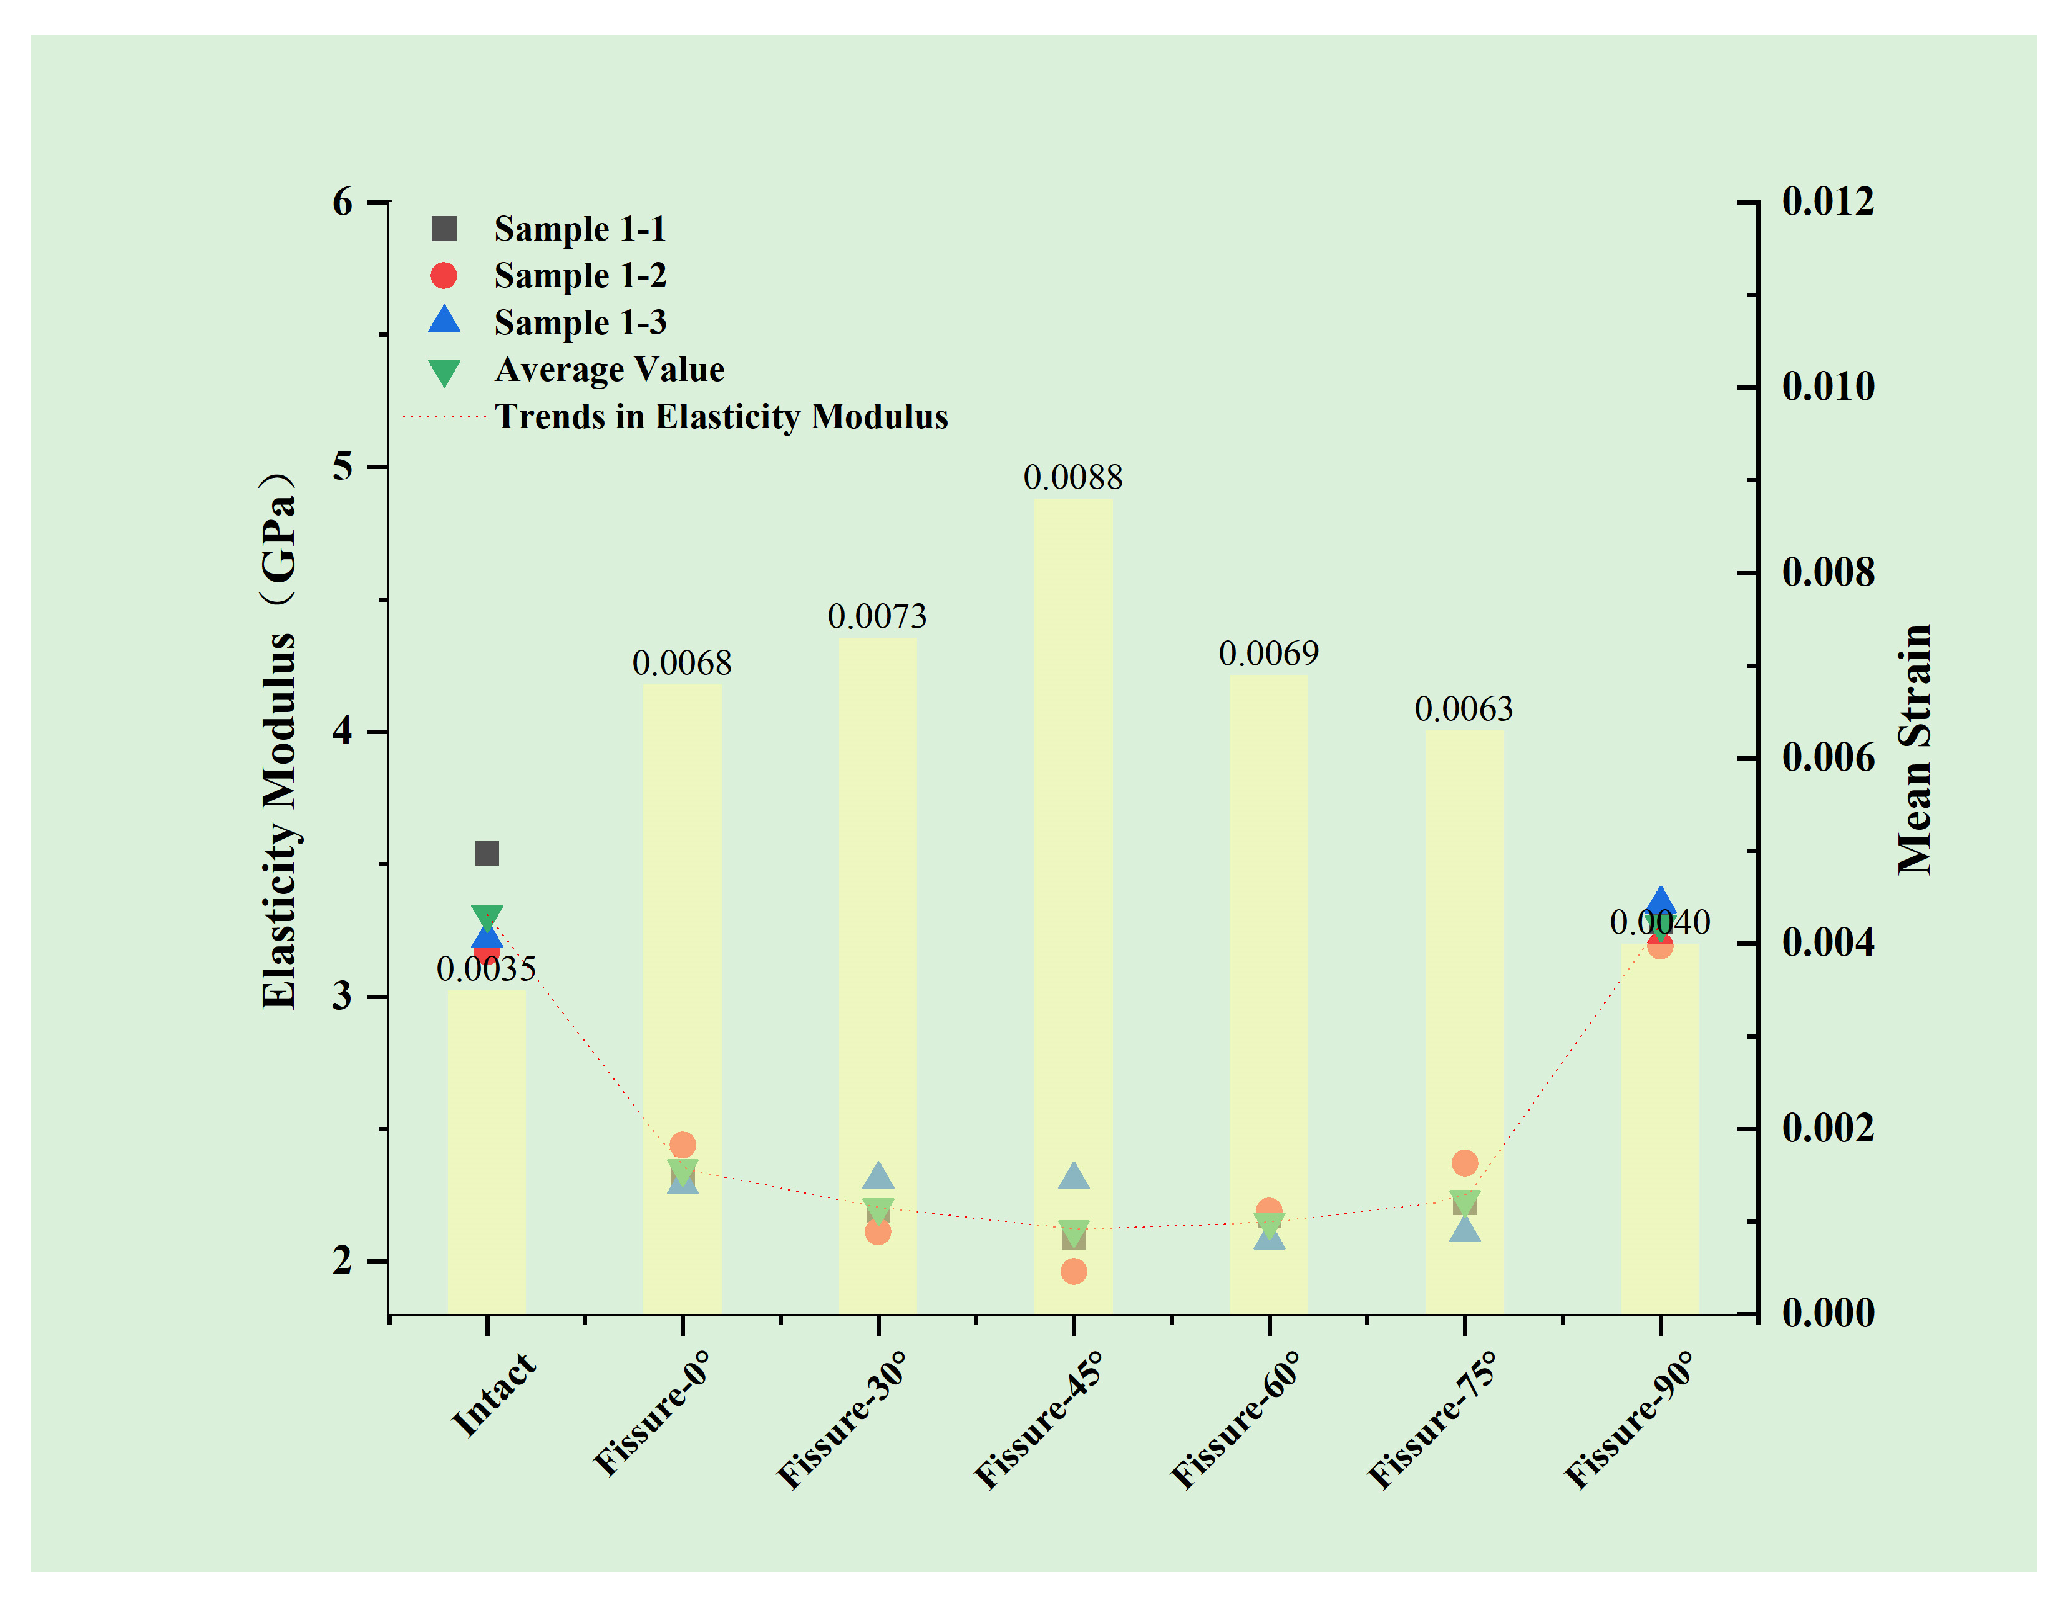
3.4. Effect of Fissure Inclination on the Elastic Modulus

The mean surface strain and elastic modulus were calculated via the DIC method, as illustrated in Figure 16. Figure 16 demonstrates that the elastic modulus is the largest and the mean strain is the smallest for the intact specimen and the specimen with 90° fissure inclination. The elastic modulus of the intact specimen and the specimen with a 90° inclination exhibited a relatively close correlation, with values of 3.31 GPa and 3.27 GPa, respectively. The discrepancy between the intact specimen and the fissured specimen was only 1.2%. The elastic modulus of the specimen within the range of 0~75° of the inclination has been reduced compared with that of the intact specimen, indicating that the existence of the fissure has reduced the specimen’s ability to resist deformation. However, the difference in the elastic modulus had not been significant within this range. The elastic modulus has exhibited a decrease with an increase in the fissure inclination, followed by an increase, reaching a minimum value when the fissure inclination has been 45°. This suggested that the change in the fissure inclination angle had minimal influence on the deformation resistance of the specimen within this interval (0~75°).
Among all specimens, the intact specimen exhibited the smallest mean surface strain, measuring 0.0035. The specimen at the 90° inclination demonstrated the smallest mean surface strain, measuring only 0.0040, and the increase in it is only 14.29% compared with the intact specimen. The mean surface strain of the specimen is the largest at the fissure inclination angle of 45°, which is 0.0088. The increase in the average strain is 151.43% compared with the intact specimen. The trend of the mean strain is opposite within the range of 0~75°. With the increase in fissure inclination, the mean strain increases and then decreases, reaching a maximum at the fissure inclination angle of 45°.
This indicates that the fissure increases specimen deformation, but this effect is minimized at a fissure inclination of 90°. This may be due to the fact that the fissure is oriented in the same direction as the principal stress, which makes it difficult to form a large stress concentration at the fissure tip. A comparison of this effect with the DIC strain cloud (Figure 9, Figure 10, Figure 11, Figure 12 and Figure 13) revealed that a significant strain has not been observed at the fissure tip. The fissure inclination angle ranges from 0° to 75°, and the fissure contributes to the specimen surface deformation. However, within this range, the fissure angle exerted a minimal influence on the specimen surface’s mean strain.
In previous tests for elliptical double-fissure specimens [29], it was found that the elastic modulus exhibited a decrease and subsequent increase with the increase in the fissure inclination in the range of 0° to 90°. Additionally, the specimens exhibited the smallest elastic modulus in fissure inclination from 15° to 45°. This was consistent with the present trend of the elastic modulus, although there was a slight discrepancy in the angle of the elastic modulus minimum. This might be attributed to the inconsistency in the morphology and number of fissures.

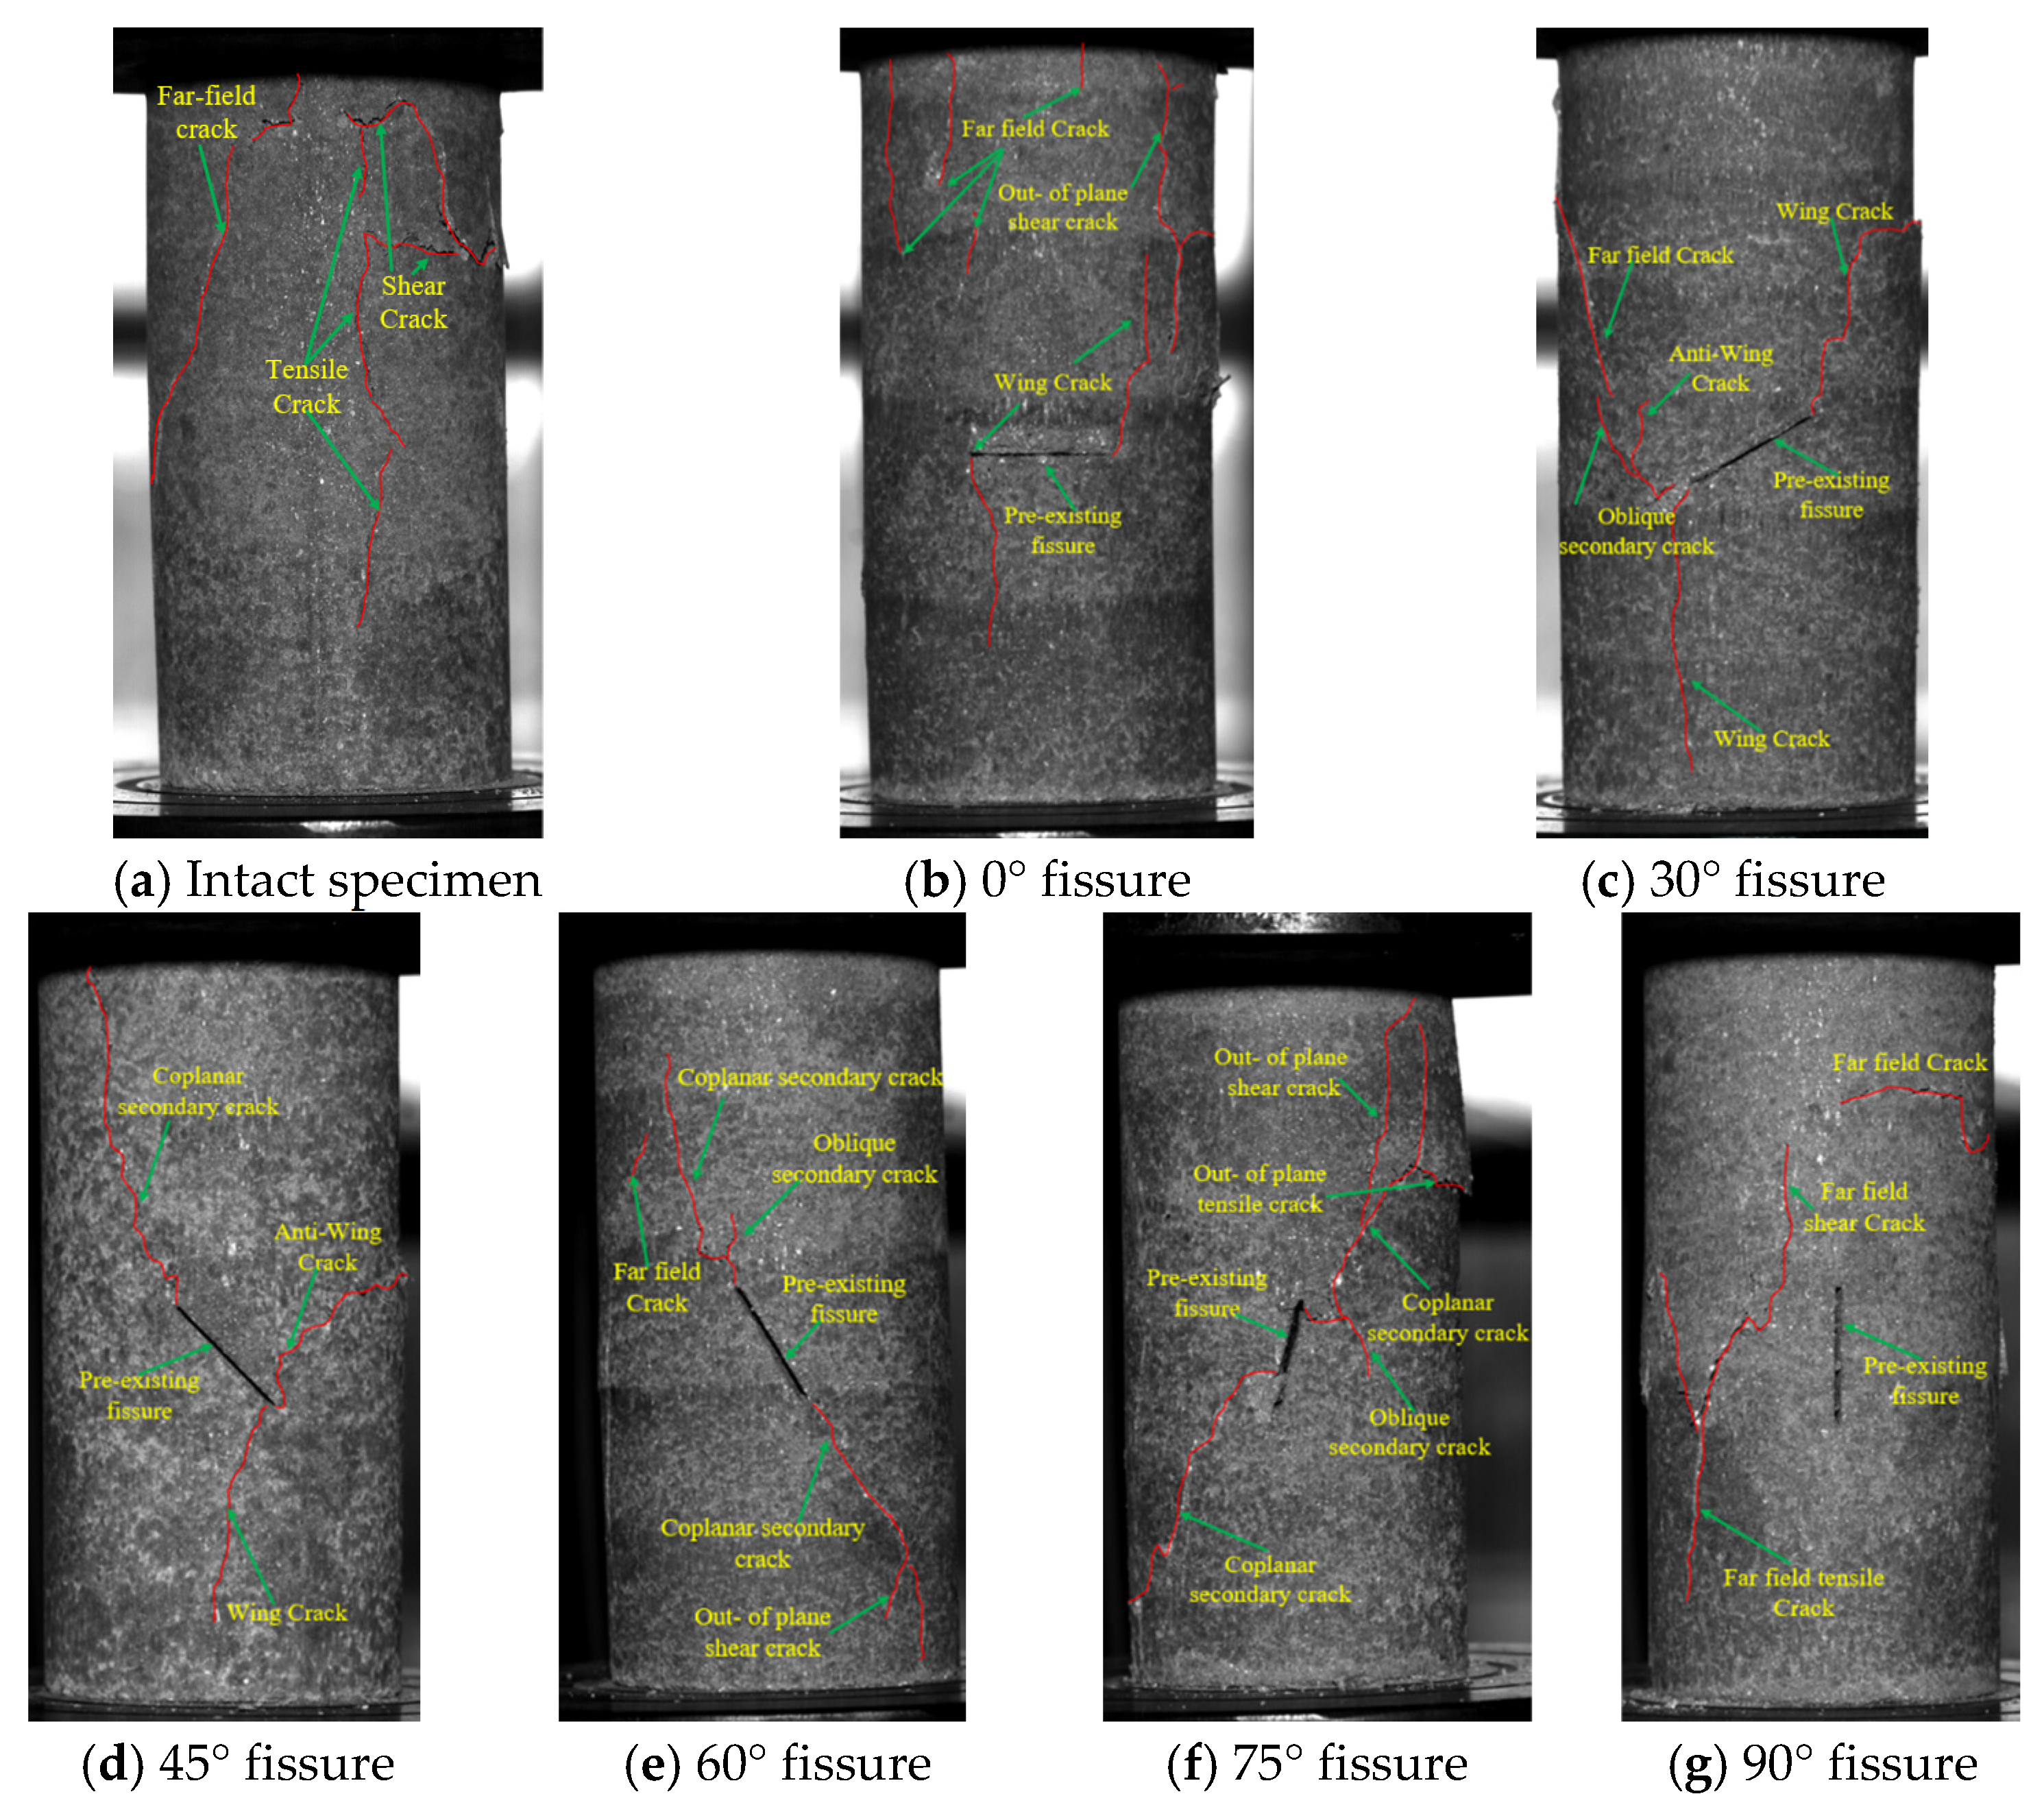
3.5. Crack Pattern of the Damaged Specimen

Following the breaking of the prefabricated fissure specimen, cracks on the surface of the specimen were classified into nine categories [40]. These included the wing crack, anti-wing crack, oblique secondary crack, coplanar secondary crack, out-of-plane shear crack, out-of-plane tensile crack, far-field crack, far shear crack, and far tensile crack. The classification is presented in Figure 17.
The cracks on the surface of the broken specimen are illustrated in Figure 17. Surface cracking was observed after the breaking of intact and prefabricated fissured specimens.
Statistical analysis of the surface cracks of both fissured and intact specimens revealed that intact specimens exhibited a reduced number of surface cracks, predominantly concentrated at the upper and lower extremities. In contrast, fissured specimens with a higher number of surface cracks are primarily distributed around the prefabricated fissure. The strain field distribution of the DIC analysis indicated that this was mainly attributable to stress concentration around the prefabricated fissure, resulting in the generation of strain concentration around the fissure, which resulted in the local range of deformation intensification and the accumulation of damage. Obvious microcracks appeared on the surface of the specimen when the damage accumulated to a certain extent.
The analysis of the crack patterns revealed that intact specimens and specimens with 90° inclinations were predominantly characterized by shear cracks, tensile cracks, and far-field cracks. This phenomenon could be attributed to the inherent fragility of the specimen. The failure patterns of these materials were primarily characterized by shear slip failures. In contrast, for specimens with fissure inclination ranging from 0° to 75°, the surface cracks were more diverse, with the wing crack and anti-wing crack being predominant near the crack tip. The distribution of cracks was related to the fissure inclination angle. For the intact specimen, cracks were primarily extended along the direction of the principal stress, which was consistent with the crack extension law of the specimen with a fissure angle of 90°. In specimens with 0° crack inclination, the cracks predominantly extended in the direction perpendicular to the fissure, manifesting as wing cracks, accompanied by a minor incidence of out-of-plane shear cracks and far-field cracks. For specimens with 30° and 45° fissure inclinations, the cracks primarily extended in the directions parallel and perpendicular to the fissure and were predominantly wing cracks accompanied by a negligible amount of coplanar secondary cracks and far-field cracks. For specimens with 60° and 75° fissure inclinations, the cracks mainly extended along the direction parallel to the fissure and were dominated by coplanar secondary cracks, with a small number of far-field cracks and out-of-plane tensile cracks at locations farther away from the prefabricated fissure. This indicated that when the fissure was at a certain angle to the principal stress, the damage of the specimen was mainly shear slip damage; when the fissure was parallel to the direction of the principal stress or there was no fissure in the specimen, the damage of the specimen was tensile–tensile damage.

4. Conclusions

This paper presented the results of mechanical tests conducted on sandstone-like specimens with prefabricated fissures. The process of crack initiation, evolution, and destruction of the specimens was analyzed with a high-speed camera and the DIC method. Furthermore, the influence of fissure inclination on the mechanical parameters, as well as the crack pattern and strain distribution, were analyzed. The following conclusions could be drawn from the findings of this paper:
  • The DIC method revealed that the maximum strain of the fissured specimen was predominantly concentrated at the fissured tips. The intact specimen was found to generate new cracks at approximately 75% of the peak strength, while the fissured specimen exhibited new crack formation at 50–60% of the peak strength. It was determined that as the fissure inclination approaches 45°, the strain on the specimen’s surface increases. Conversely, as the fissure inclination approaches 90°, the strain on the specimen’s surface approaches that of the intact specimen.
  • The presence of the fissure reduced the strength and elastic modulus while increasing the strain. The magnitude of these changes is related to the fissure inclination. The fissure inclination of 45° exhibited the most significant changes compared to the intact specimen. The peak strength and elastic modulus decreased by 54.52% and 35.95%, respectively, and the strain increased by 151.42%. The fissure inclination of 90° exhibited the least significant change compared to the intact specimen, with the peak strength and elastic modulus reduced by only 13.02% and 1.11%, respectively, and the strain increased by 14.29%.
  • The intact specimen and specimen with 90° inclination are mainly distributed with the shear crack, tensile crack, and far-field crack, which are mainly tensile–tension damage; specimens with 0~75° inclination are mainly distributed with the wing crack, anti-wing crack, oblique secondary crack, and coplanar secondary crack, which are mainly shear slip damage.
  • The new cracks mainly originate from the tip of the fissure and propagate at an angle to the direction of the principal stress. For specimens with 0° inclination, the new cracks mainly propagate in the direction perpendicular to the fissure; for specimens with 30° and 45° inclinations, the new cracks mainly propagate in the direction parallel and perpendicular to the fissure; for specimens with 60° and 75° inclinations, the new cracks propagate in the direction parallel to the fissure; and for specimens with 90° inclination, the new cracks propagate in the direction parallel to the fissure.
The findings of this study provide a more precise understanding of the deformation and damage mechanisms of rocks under various stress conditions. In addition, this study facilitates a more accurate prediction of the response of rocks under engineering loads, including the potential location, form, and timing of damage. Consequently, this enables the implementation of effective reinforcement and protection measures in advance, thereby reducing engineering safety risks.

Author Contributions

Methodology, H.W.; Software, H.W.; Formal analysis, X.F., Y.W. and Z.Y.; Investigation, H.W.; Resources, Y.W.; Writing—review & editing, Z.Y.; Visualization, X.F.; Supervision, F.X., Y.W. and Z.Y.; Project administration, X.F.; Funding acquisition, F.X. All authors have read and agreed to the published version of the manuscript.

Funding

This paper obtained its funding from Project 51905382 supported by the National Natural Science Foundation of China and Project 2021BS24 supported by the Scientific Research Foundation of Weifang University.

Data Availability Statement

The data used to support the findings of this study are available from the corresponding author upon request.

Acknowledgments

The authors wish to acknowledge this support. At the same time, the authors are very grateful for the anonymous reviewers’ valuable comments.

Conflicts of Interest

The authors declare that there are no conflicts of interest regarding the publication of this paper.

References

  1. Kang, H.P. Seventy years development and prospects of strata control technologies for coal mine roadways in China. Chin. J. Rock Mech. Eng. 2021, 40, 1–30. [Google Scholar] [CrossRef]
  2. Yang, J.; Min, T.J.; Liu, B.H.; Chen, K.K.; Yang, L. Research progress on disasters and prevention in deeping mining. Sci. Technol. Eng. 2020, 20, 14767–14776. [Google Scholar]
  3. Zhao, Y.M.; Feng, X.T.; Jiang, Q.; Han, Y.; Zhou, Y.Y.; Guo, H.G.; Kou, Y.Y.; Shi, Y.E. Large Deformation Control of Deep Roadways in Fractured Hard Rock Based on Cracking-Restraint Method. Rock Mech. Rock Eng. 2021, 54, 2559–2580. [Google Scholar] [CrossRef]
  4. Alneasan, M.; Behnia, M. An experimental investigation on tensile fracturing of brittle rocks by considering the effect of grain size and mineralogical composition. Int. J. Rock Mech. Min. 2021, 137, 104570. [Google Scholar] [CrossRef]
  5. Alneasan, M.; Alzo’ubi, A.K. Comprehensive investigation of rock fracture behaviour in clay-rich rocks under the effect of temperature: Experimental study under three loading modes (I, I/II, II). Eng. Fract. Mech. 2022, 276, 108933. [Google Scholar] [CrossRef]
  6. Zengin, E.; Erguler, Z.A. Experimental investigation of pore-fracture relationship on failure behaviour of porous rock materials. Bull. Eng. Geol. Environ. 2022, 81, 351. [Google Scholar] [CrossRef]
  7. Zare, S.; Karimi-Nasab, S.; Jalalifar, H. Analysis and determination of the behavioral mechanism of rock bridges using experimental and numerical modeling of non-persistent rock joints. Int. J. Rock Mech. Min. 2021, 141, 104714. [Google Scholar] [CrossRef]
  8. Moura, D.D.; Bobet, A. Crack Interaction with a Frictional Interface in a Rock-Model Material: An Experimental Investigation. Rock Mech. Rock Eng. 2022, 55, 6187–6207. [Google Scholar] [CrossRef]
  9. Klammer, A.; Peintner, C.; Gottsbacher, L.; Biermann, J.; Bluemel, M.; Schubert, W.; Marcher, T. Investigation of the Influence of Grain-Scale Heterogeneity on Strainburst Proneness Using Rock-Like Material. Rock Mech. Rock Eng. 2023, 56, 407–425. [Google Scholar] [CrossRef]
  10. Asadizadeh, M.; Khosravi, S.; Abharian, S.; Imani, M.; Shakeri, J.; Hedayat, A.; Babanouri, N.; Sherizadeh, T. Tensile behavior of layered rock disks under diametral loading: Experimental and numerical investigations. Granul. Matter 2023, 25, 21. [Google Scholar] [CrossRef]
  11. Gögüs, Ö.; Avsar, E. Stress levels of precursory strain localization subsequent to the crack damage threshold in brittle rock. PLoS ONE 2022, 17, e0276214. [Google Scholar] [CrossRef]
  12. Sisodiya, M.; Zhang, Y.D. A Time-Dependent Directional Damage Theory for Brittle Rocks Considering the Kinetics of Microcrack Growth. Rock Mech. Rock Eng. 2022, 55, 2693–2710. [Google Scholar] [CrossRef]
  13. Öge, I.F.; Erkayaoglu, M. Pre- and post-failure characterisation of low-strength rocks by generalised crack initiation and crack damage. Bull. Eng. Geol. Environ. 2024, 83, 91. [Google Scholar] [CrossRef]
  14. Lee, J.; Ha, Y.D.; Hong, J.W. Crack coalescence morphology in rock-like material under compression. Int. J. Fract. 2017, 203, 211–236. [Google Scholar] [CrossRef]
  15. Hedan, S.; Valle, V.; Giot, R.; Cosenza, P. Behavior in mixed-mode of desiccation cracks on a clayey rock front gallery. Int. J. Rock Mech. Min. 2022, 154, 105104. [Google Scholar] [CrossRef]
  16. Bahrani, N.; Kaiser, P.K. Estimation of Confined Peak Strength of Crack-Damaged Rocks. Rock Mech. Rock Eng. 2017, 50, 309–326. [Google Scholar] [CrossRef]
  17. Cui, C.; Gratchev, I. Effects of pre-existing cracks and infillings on strength of natural rocks—Cases of sandstone, argillite and basalt. J. Rock Mech. Geotech. Eng. 2020, 12, 1333–1338. [Google Scholar] [CrossRef]
  18. Hu, G.J.; Ma, G. Size effect of parallel-joint spacing on uniaxial compressive strength of rock. PLoS ONE 2021, 16, e0257245. [Google Scholar] [CrossRef]
  19. Liu, L.W.; Li, H.B.; Li, X.F. A state-of-the-art review of mechanical characteristics and cracking processes of pre-cracked rocks under quasi-static compression. J. Rock Mech. Geotech. Eng. 2022, 14, 2034–2057. [Google Scholar] [CrossRef]
  20. Del Zoppo, M.; Menna, C.; Di Ludovico, M.; Asprone, D.; Prota, A. Opportunities of light jacketing with Fibre Reinforced Cementitious Composites for seismic retro fi tting of existing RC columns. Compos. Struct. 2021, 263, 113717. [Google Scholar] [CrossRef]
  21. Wu, X.H.; Wu, X.; Zhang, S.K.; Zhu, Y. Macro/Microfracture evolution and instability behaviors of high-temperature granite under water-cooling subjected to Brazilian splitting test using the DIC technique. PLoS ONE 2023, 18, e0294258. [Google Scholar] [CrossRef]
  22. Sharafisafa, M.; Aliabadian, Z.; Tahmasebinia, F.; Shen, L.M. A comparative study on the crack development in rock-like specimens containing unfilled and filled flaws. Eng. Fract. Mech. 2021, 241, 107405. [Google Scholar] [CrossRef]
  23. San Miguel, C.R.; Petropoulos, N.; Yi, C.P.; Johansson, D. Experimental Investigation of Blast-Induced Crack Propagation Based on Digital Image Correlation Analysis. Shock Vib. 2024, 2024, 4149322. [Google Scholar] [CrossRef]
  24. Chen, Y.W.; Feng, J.L.; Li, H.; Meng, Z.F. Effect of coarse aggregate volume fraction on mode II fracture toughness of concrete. Eng. Fract. Mech. 2021, 242, 107472. [Google Scholar] [CrossRef]
  25. GB/T 50266-2013; Standard for Test Methods of Engineering Rock Masses. China Planning Press: Beijing, China, 2013.
  26. Zhou, X.P.; Li, L.H.; Berto, F. Cracking Behaviors of Rock-Like Specimens Containing Two Sets of Preexisting Cross Flaws under Uniaxial Compression. J. Test. Eval. 2019, 47, 838–867. [Google Scholar] [CrossRef]
  27. Zhao, C.; Zhou, Y.M.; Zhao, C.F.; Bao, C. Cracking Processes and Coalescence Modes in Rock-Like Specimens with Two Parallel Pre-existing Cracks. Rock Mech. Rock Eng. 2018, 51, 3377–3393. [Google Scholar] [CrossRef]
  28. Liu, J.W.; Wu, N.; Si, G.Y.; Zhao, M.X. Experimental study on mechanical properties and failure behaviour of the pre-cracked coal-rock combination. Bull. Eng. Geol. Environ. 2021, 80, 2307–2321. [Google Scholar] [CrossRef]
  29. Yang, S.Q.; Huang, Y.H.; Tian, W.L.; Zhu, J.B. An experimental investigation on strength, deformation and crack evolution behavior of sandstone containing two oval flaws under uniaxial compression. Eng. Geol. 2017, 2017, 326–327. [Google Scholar] [CrossRef]
  30. Aboayanah, K.R.; Abdelaziz, A.; Haile, B.F.; Zhao, Q.; Grasselli, G. Evaluation of Damage Stress Thresholds and Mechanical Properties of Granite: New Insights from Digital Image Correlation and GB-FDEM. Rock Mech. Rock Eng. 2024, 57, 4679–4706. [Google Scholar] [CrossRef]
  31. Shen, P.W.; Tang, H.M.; Zhang, B.C.; Ning, Y.B.; Su, X.X.; Sun, S.X. Weakening Investigation of Reservoir Rock by Coupled Uniaxial Compression, Computed Tomography and Digital Image Correlation Methods: A Case Study. Sensors 2021, 21, 344. [Google Scholar] [CrossRef] [PubMed]
  32. Xiu, Z.G.; Wang, S.H.; Ji, Y.C.; Wang, F.L.; Ren, F.Y.; Nguyen, V.T. Loading rate effect on the uniaxial compressive strength (UCS) behavior of cemented paste backfill (CPB). Constr. Build. Mater. 2021, 271, 121526. [Google Scholar] [CrossRef]
  33. Yin, Q.; Jing, H.W.; Zhu, T.T. Mechanical behavior and failure analysis of granite specimens containing two orthogonal fissures under uniaxial compression. Arab. J. Geosci. 2016, 9, 31. [Google Scholar] [CrossRef]
  34. Liu, H.F.; Zhu, C.Q.; Zheng, K.; Ma, C.H.; Yi, M.X. Crack Initiation and Damage Evolution of Micritized Framework Reef Limestone in the South China Sea. Rock Mech. Rock Eng. 2021, 54, 5591–5601. [Google Scholar] [CrossRef]
  35. Yang, S.Q.; Huang, Y.H. Failure behaviour of rock-like materials containing two pre-existing unparallel flaws: An insight from particle flow modeling. Eur. J. Environ. Civ. Eng. 2018, 22, s57–s78. [Google Scholar] [CrossRef]
  36. Zou, C.J.; Wong, L.N.Y.; Loo, J.J.; Gan, B.S. Different mechanical and cracking behaviors of single-flawed brittle gypsum specimens under dynamic and quasi-static loadings. Eng. Geol. 2016, 201, 71–84. [Google Scholar] [CrossRef]
  37. Yang, S.Q.; Xu, T.; He, L.; Jing, H.W.; Wen, S.; Yu, Q.L. Numerical study on failure behavior of brittle rock specimen containing pre-existing combined flaws under different confining pressure. Arch. Civ. Mech. Eng. 2015, 15, 1085–1097. [Google Scholar] [CrossRef]
  38. Duriez, J.; Scholtès, L.; Donzé, F.V. Micromechanics of wing crack propagation for different flaw properties. Eng. Fract. Mech. 2016, 153, 378–398. [Google Scholar] [CrossRef]
  39. Tian, W.; Han, N.V. Mechanical properties of rock specimens containing pre-existing flaws with 3D printed materials. Strain 2017, 53, e12240. [Google Scholar] [CrossRef]
  40. Cheng, H.; Zhou, X.P.; Zhu, J.; Qian, Q.H. The Effects of Crack Openings on Crack Initiation, Propagation and Coalescence Behavior in Rock-Like Materials Under Uniaxial Compression. Rock Mech. Rock Eng. 2016, 49, 3481–3494. [Google Scholar] [CrossRef]
Figure 1. Schematic diagram of the specimen and the prefabricated fracture.
Buildings 15 00713 g001
Figure 2. Sample loading.
Buildings 15 00713 g002
Figure 3. Component materials and tools for specimen fabrication.
Buildings 15 00713 g003
Figure 4. Part of prepared specimens.
Buildings 15 00713 g004
Figure 5. Mechanical experiment system.
Buildings 15 00713 g005
Figure 6. The deformation test method.
Buildings 15 00713 g006
Figure 7. Stress–strain curves of the specimen.
Buildings 15 00713 g007
Figure 8. Strain distribution for intact specimens (* the percentage indicates the ratio of the load to the peak stress).
Buildings 15 00713 g008
Figure 9. Strain distribution of the specimen with a fissure of 0°.
Buildings 15 00713 g009
Figure 10. Strain distribution of the specimen with a fissure of 30°.
Buildings 15 00713 g010
Figure 11. Strain distribution of the specimen with a fissure of 45°.
Buildings 15 00713 g011
Figure 12. Strain distribution of the specimen with a fissure of 60°.
Buildings 15 00713 g012
Figure 13. Strain distribution of the specimen with a fissure of 75°.
Buildings 15 00713 g013
Figure 14. Strain distribution of the specimen with a fissure of 90°.
Buildings 15 00713 g014
Figure 15. The trend of peak strength with the fissure inclination angle.
Buildings 15 00713 g015
Figure 16. The trend of the elastic modulus with the fissure inclination angle.
Buildings 15 00713 g016
Figure 17. Cracking patterns of fissured rock mass upon breakage (the red line represents the visible cracks on the surface of the specimen following its breakage).
Buildings 15 00713 g017
Table 1. Main mechanical property parameters of sandstone and sandstone-like materials.
IndexDensity
(g/cm3)
Compressive Strength (MPa)Elastic Modulus
(GPa)
Poisson’s RatioInternal Friction Angle (°)
Sandstone 1.2~2.754.5~510.6~2.20.25~0.3027~45
Sandstone-like Materials1.6~1.86.5~22.30.96~3.540.21~0.3223~51
Table 2. Main physical and mechanical parameters of sandstone-like specimens.
NumberHigh (mm)Diameter (mm)Density (g/cm3)Peak Stress
(MPa)
Elastic Modulus (GPa)
Intact-1100.3250.122.12 18.17 3.54
Intact-299.6849.722.16 19.253.17
Intact-399.8249.742.19 20.133.22
Fissure 0°-1100.1249.922.12 14.02 2.32
Fissure 0°-2100.1650.262.10 13.282.44
Fissure 0°-3100.2849.902.05 15.122.29
Fissure 30°-1100.2050.282.04 13.22 2.19
Fissure 30°-2100.3050.262.07 12.152.11
Fissure 30°-399.8850.022.05 14.252.31
Fissure 45°-199.7649.942.11 8.10 2.09
Fissure 45°-299.6450.162.14 9.281.96
Fissure 45°-3100.2250.182.09 7.982.31
Fissure 60°-199.5850.062.12 13.21 2.17
Fissure 60°-299.9249.802.07 14.232.19
Fissure 60°-399.8450.222.16 13.152.08
Fissure 75°-199.5850.122.16 15.88 2.22
Fissure 75°-299.7050.142.11 14.782.37
Fissure 75°-3100.2050.182.08 16.522.11
Fissure 90°-1100.1450.222.10 16.99 3.28
Fissure 90°-2100.1049.782.09 15.123.19
Fissure 90°-399.9050.222.1316.473.35
Disclaimer/Publisher’s Note: The statements, opinions and data contained in all publications are solely those of the individual author(s) and contributor(s) and not of MDPI and/or the editor(s). MDPI and/or the editor(s) disclaim responsibility for any injury to people or property resulting from any ideas, methods, instructions or products referred to in the content.

