
Balancing Construction Costs and Environmental and Social Performances in High-Rise Urban Development: A Generative Urban Design Approach


Abstract
1. Introduction
2. Literature Review
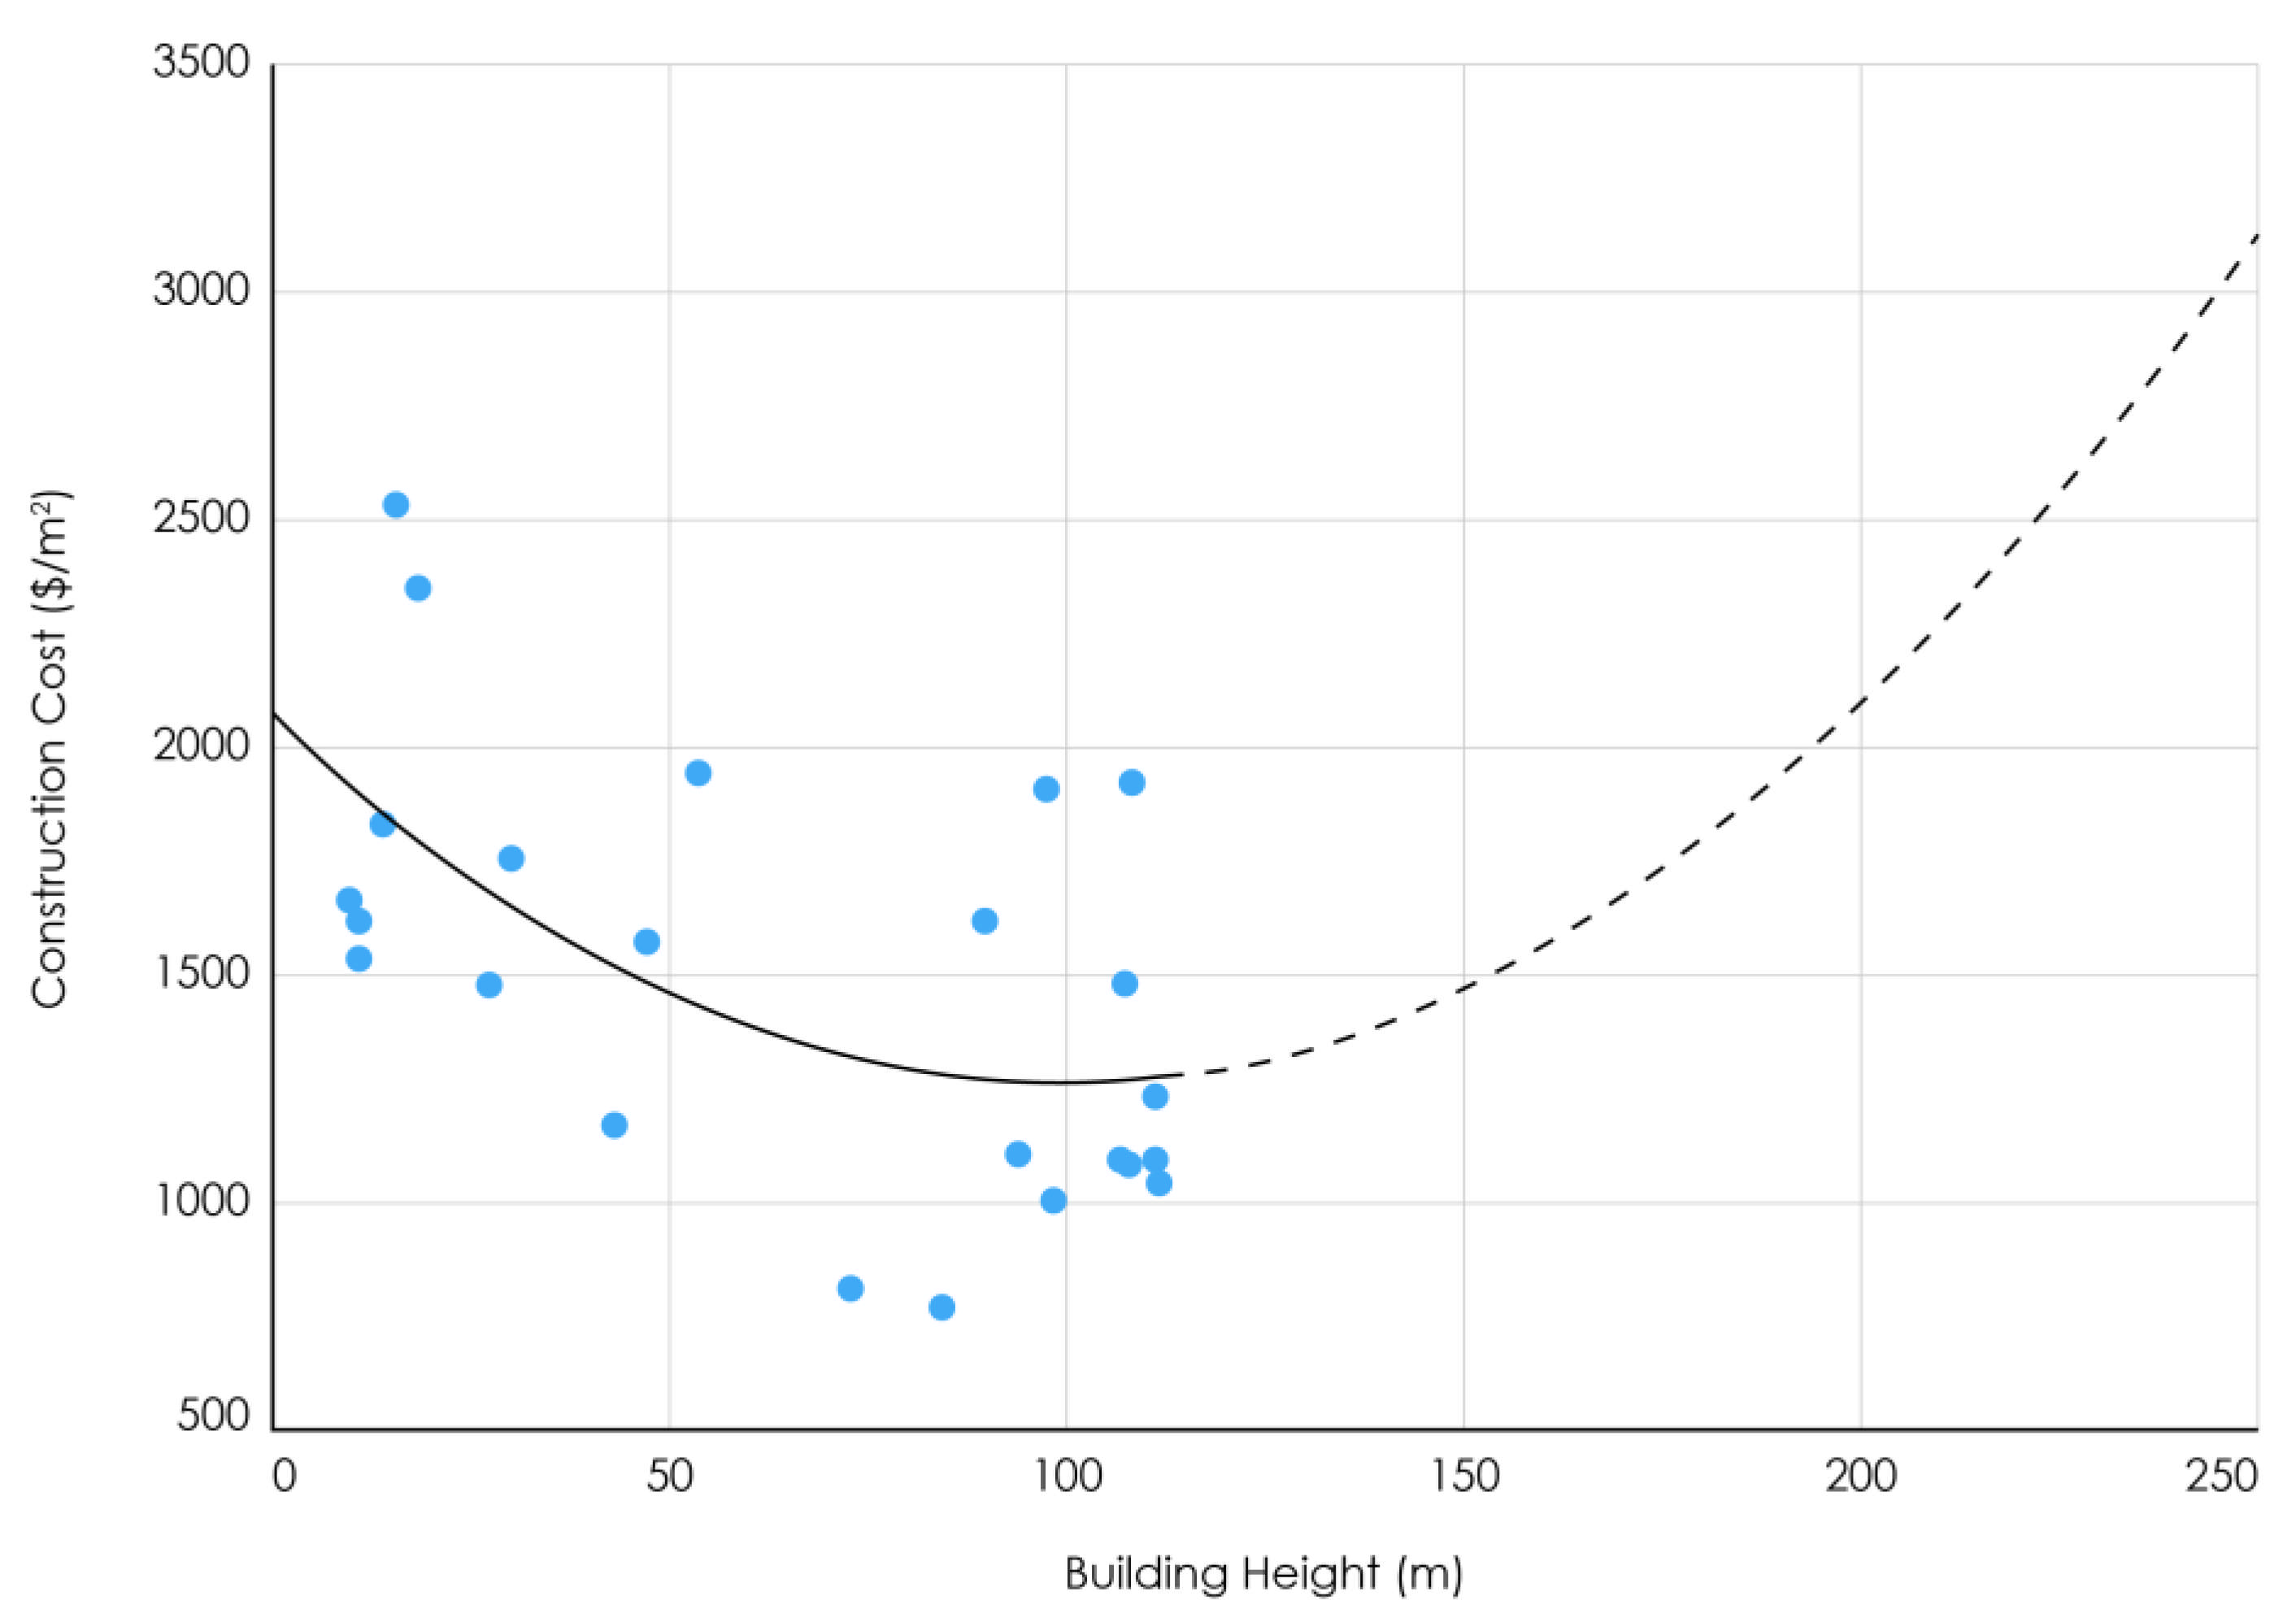
2.1. Construction Cost of High-Rise Buildings
2.2. Multi-Objective Evolutionary Algorithms
3. Research Methodology
3.1. Urban Form and Performance Objectives
3.2. Construction Cost Estimates
3.3. Multi-Objective Optimization
4. Case Study: High-Rise Urban Development in Guangzhou, China
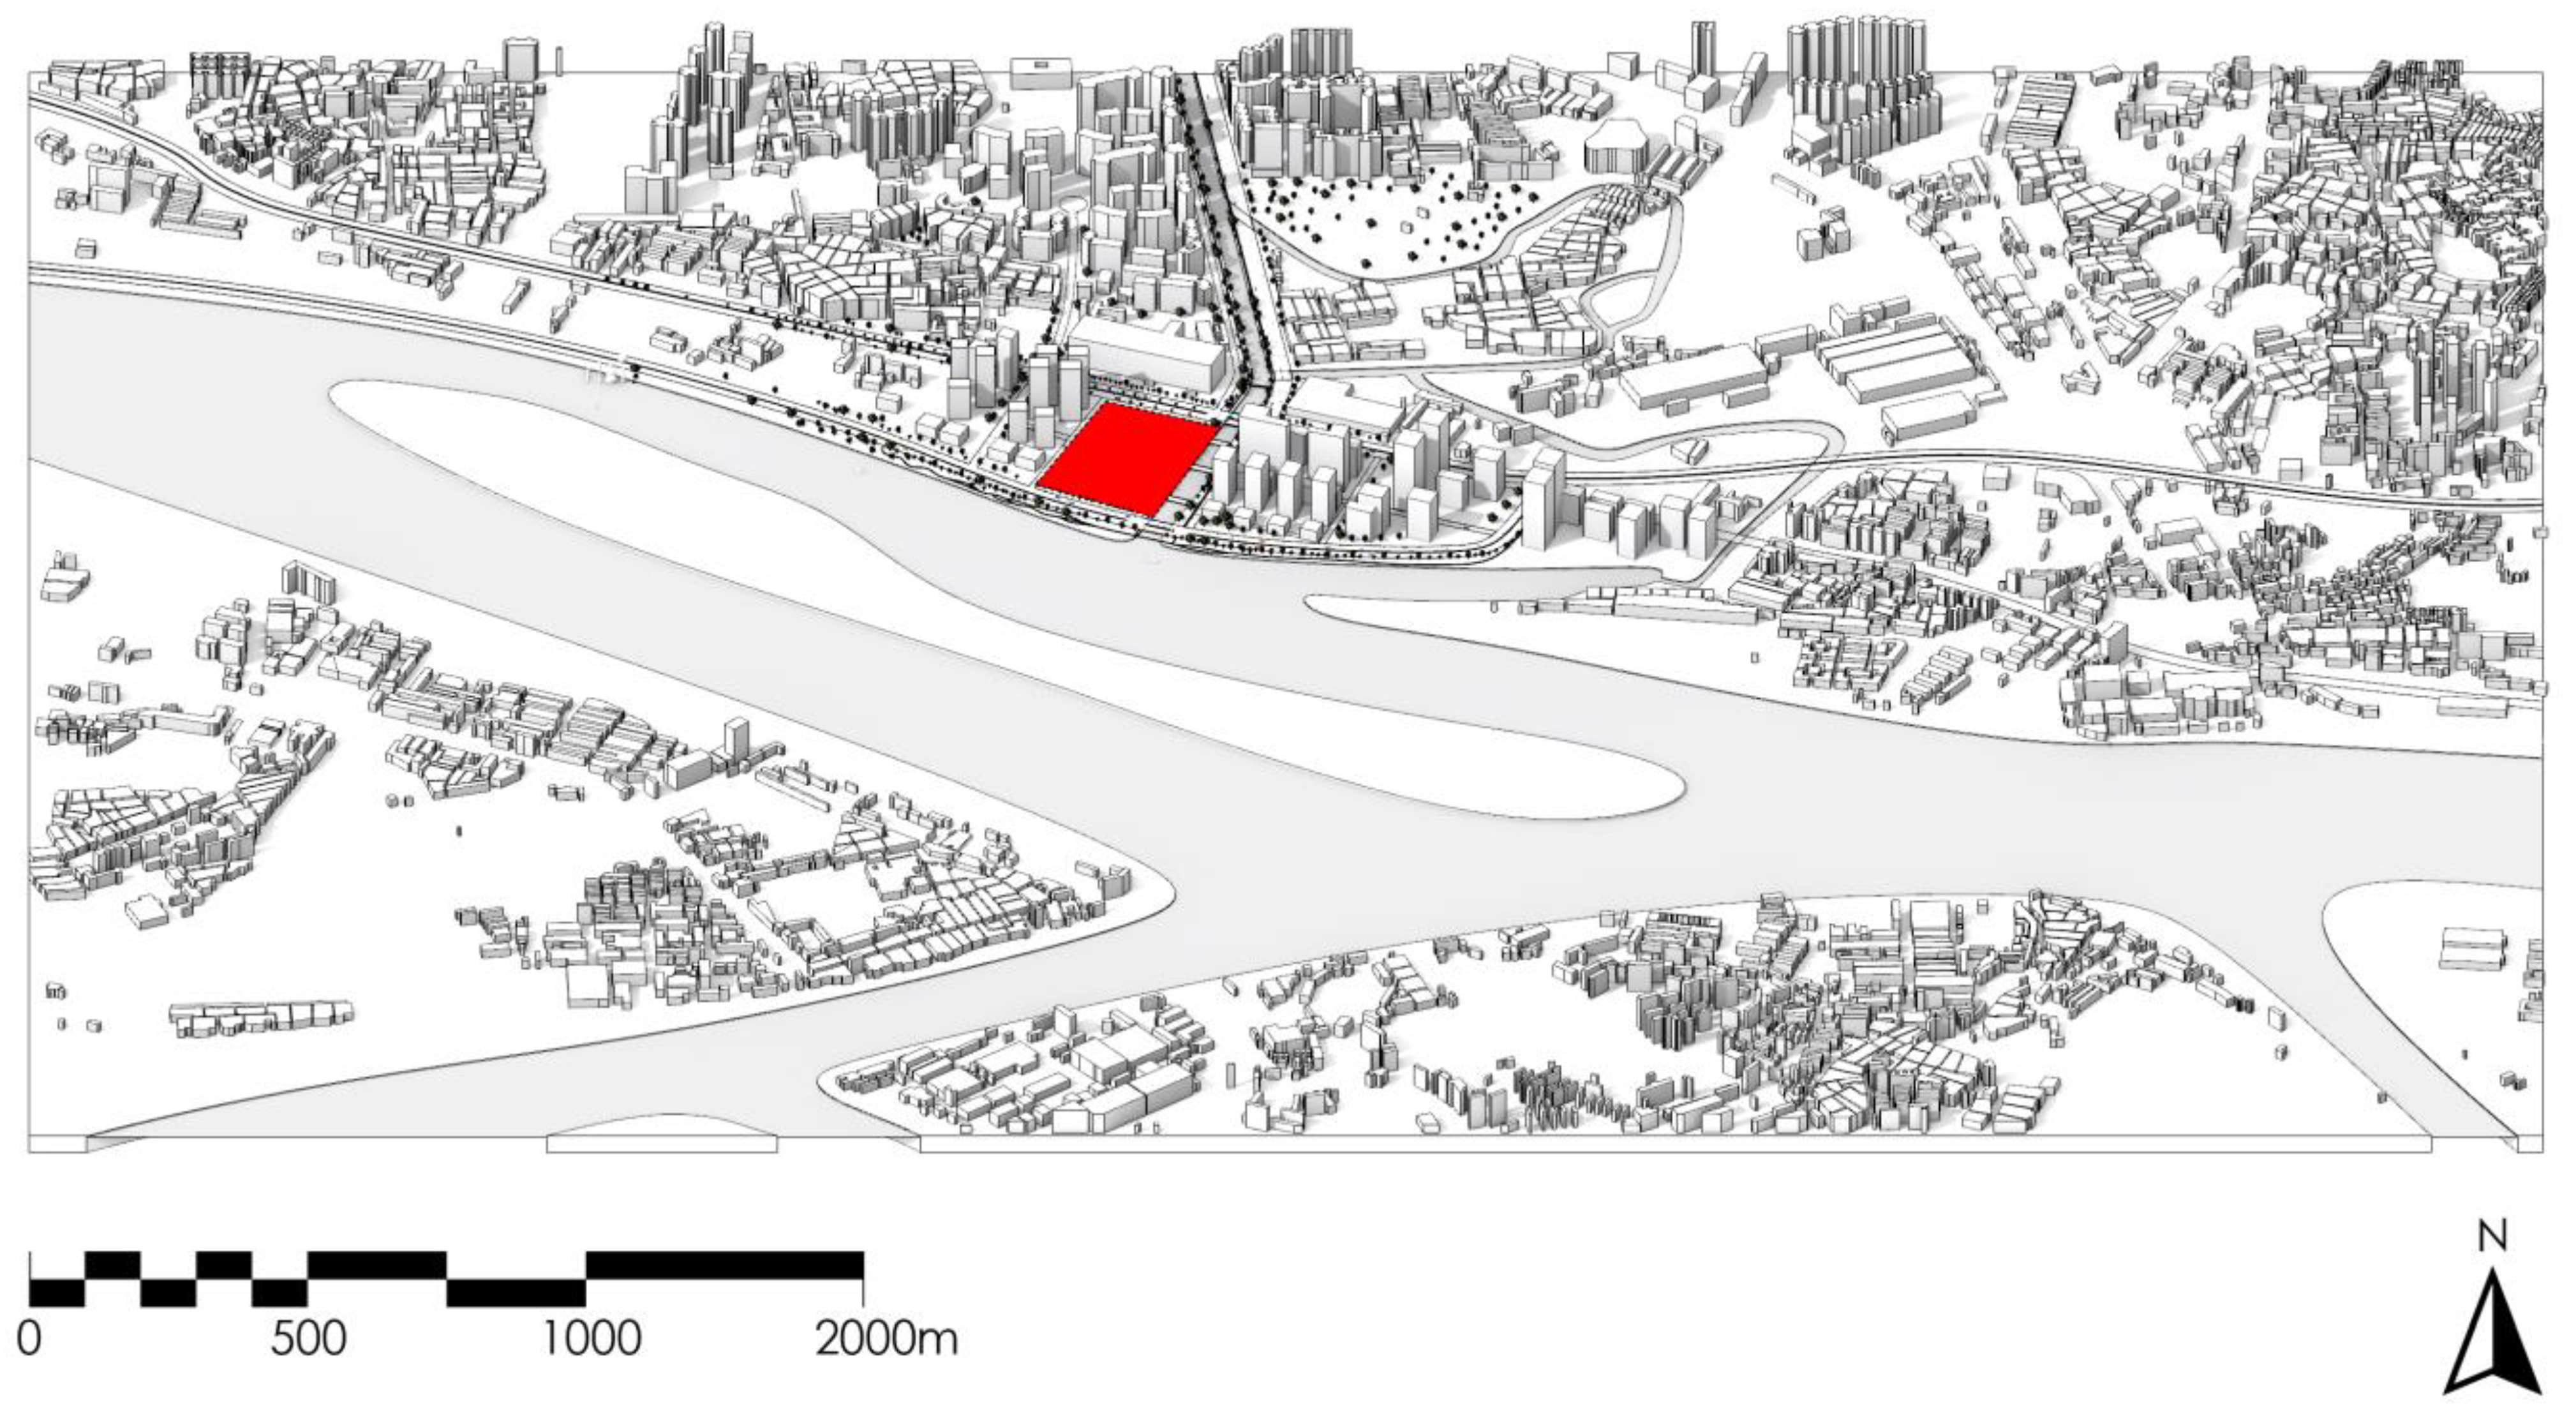
4.1. Site Analysis
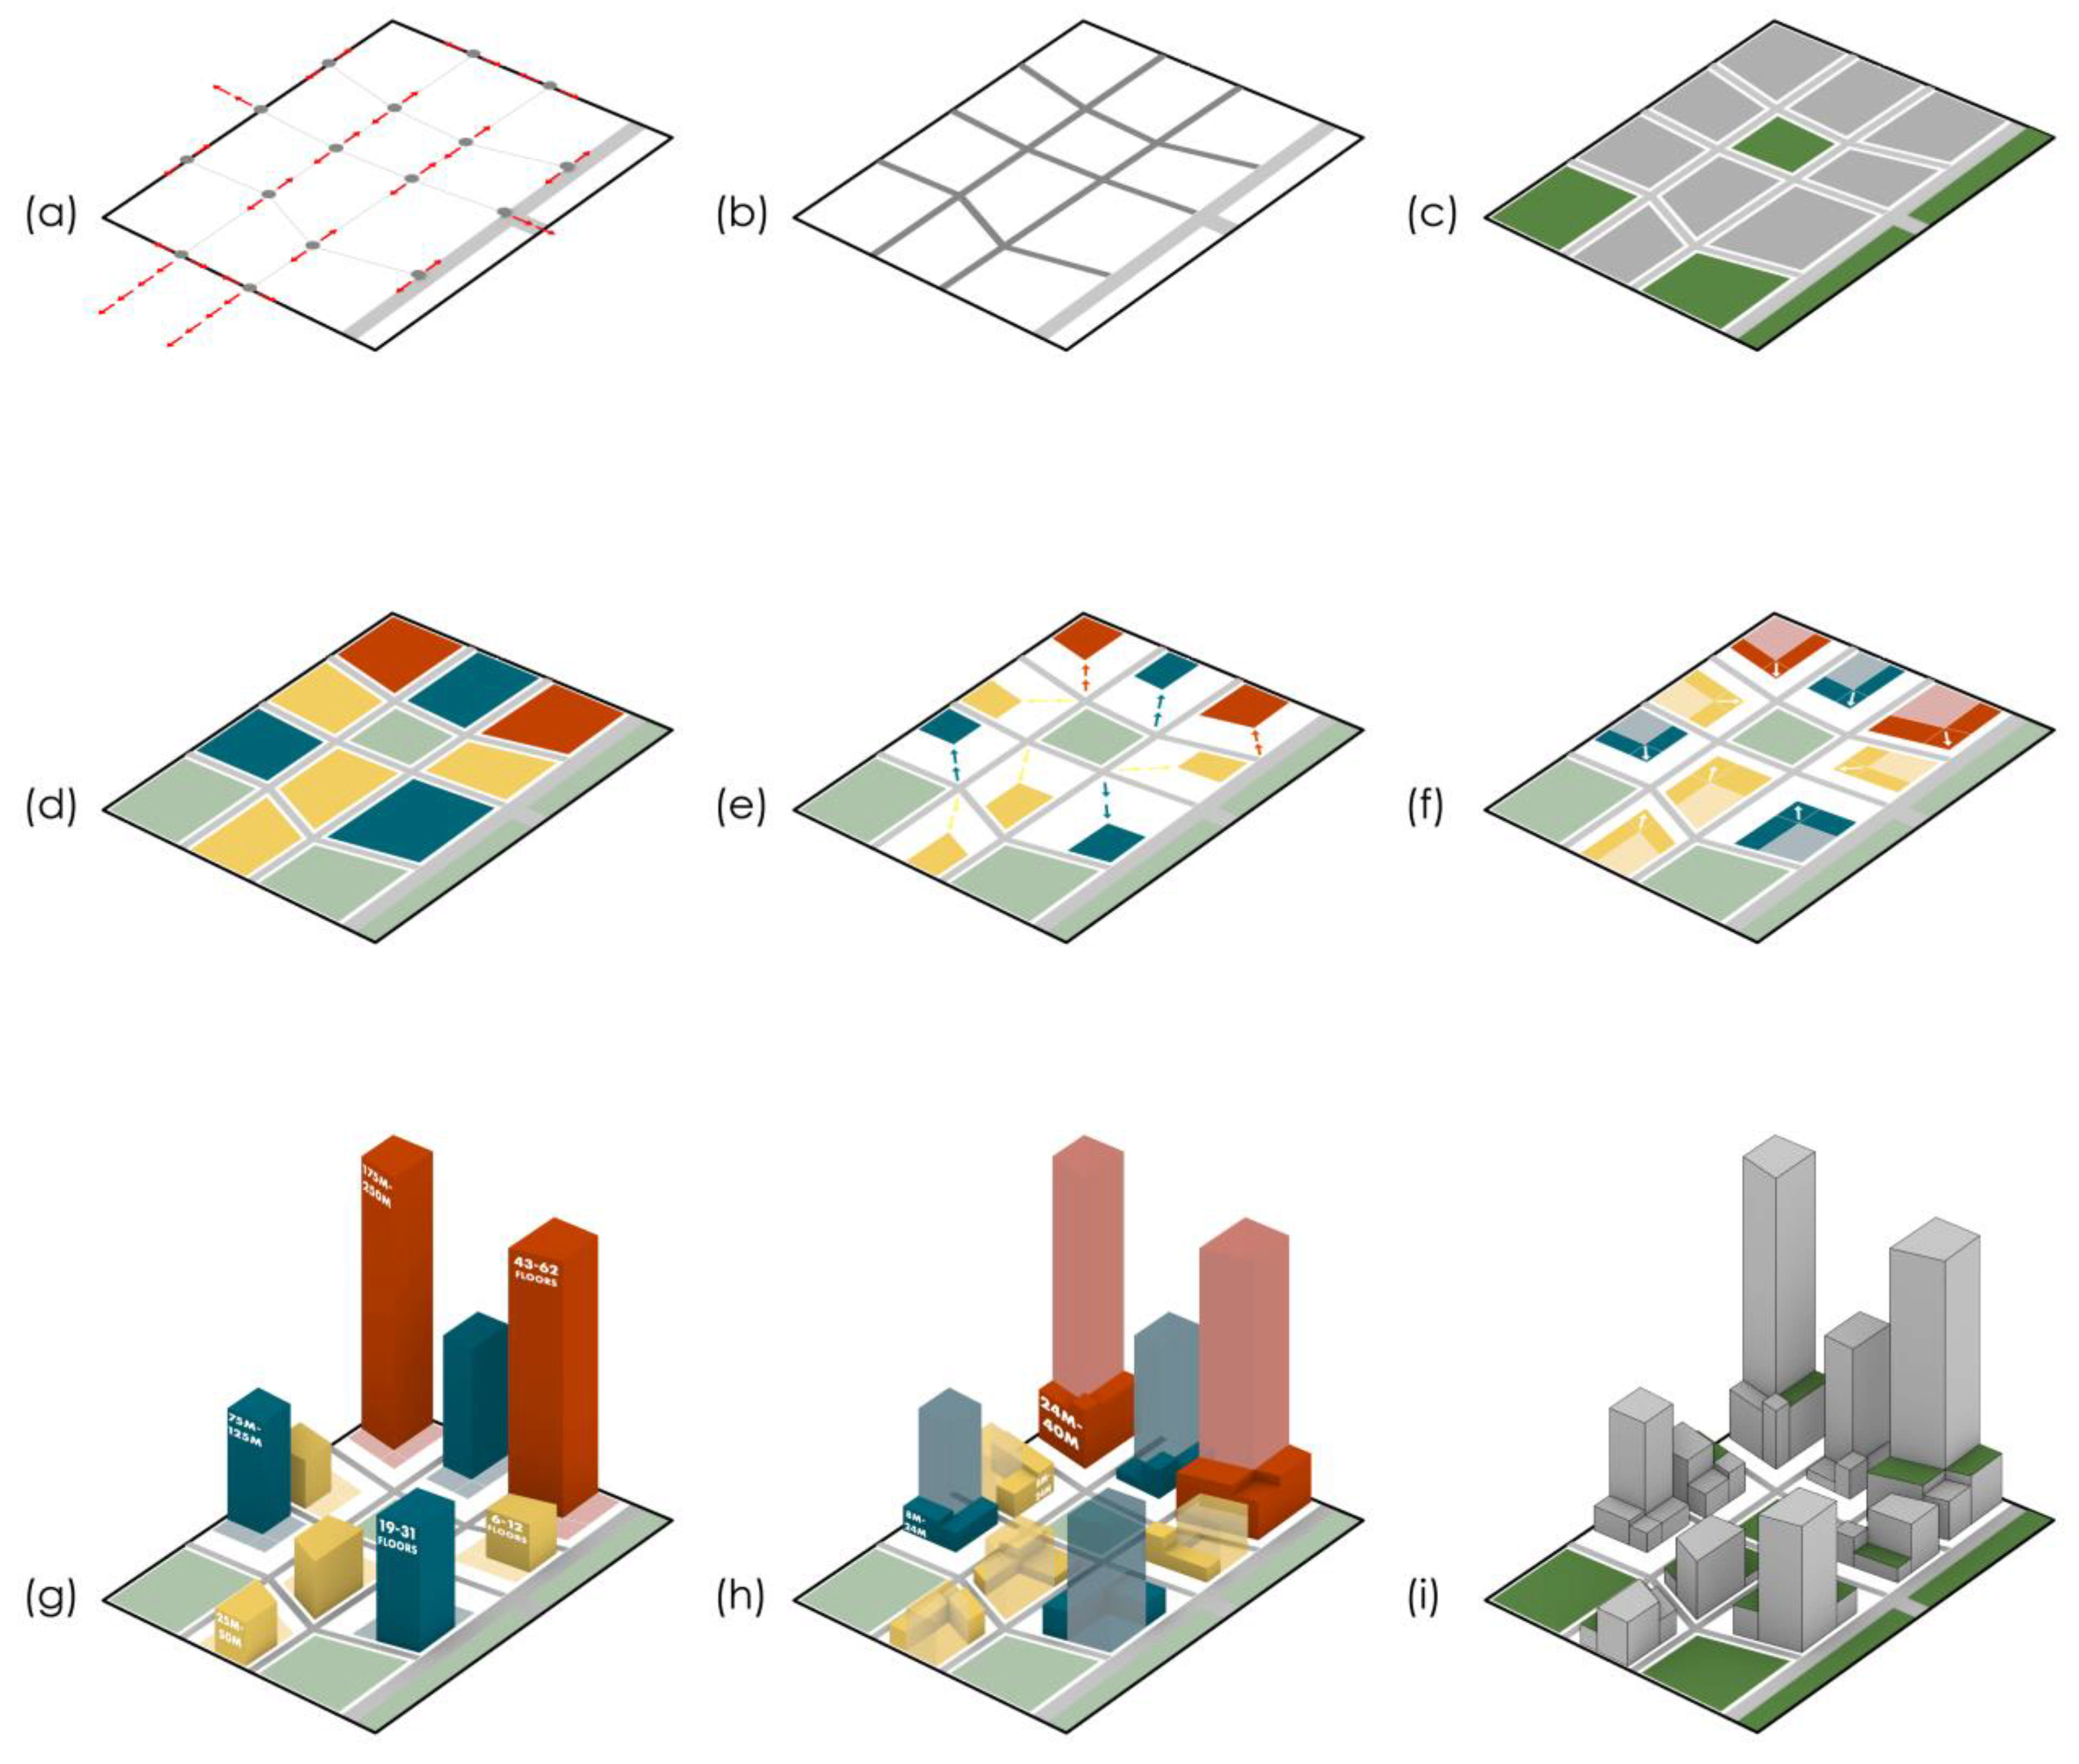
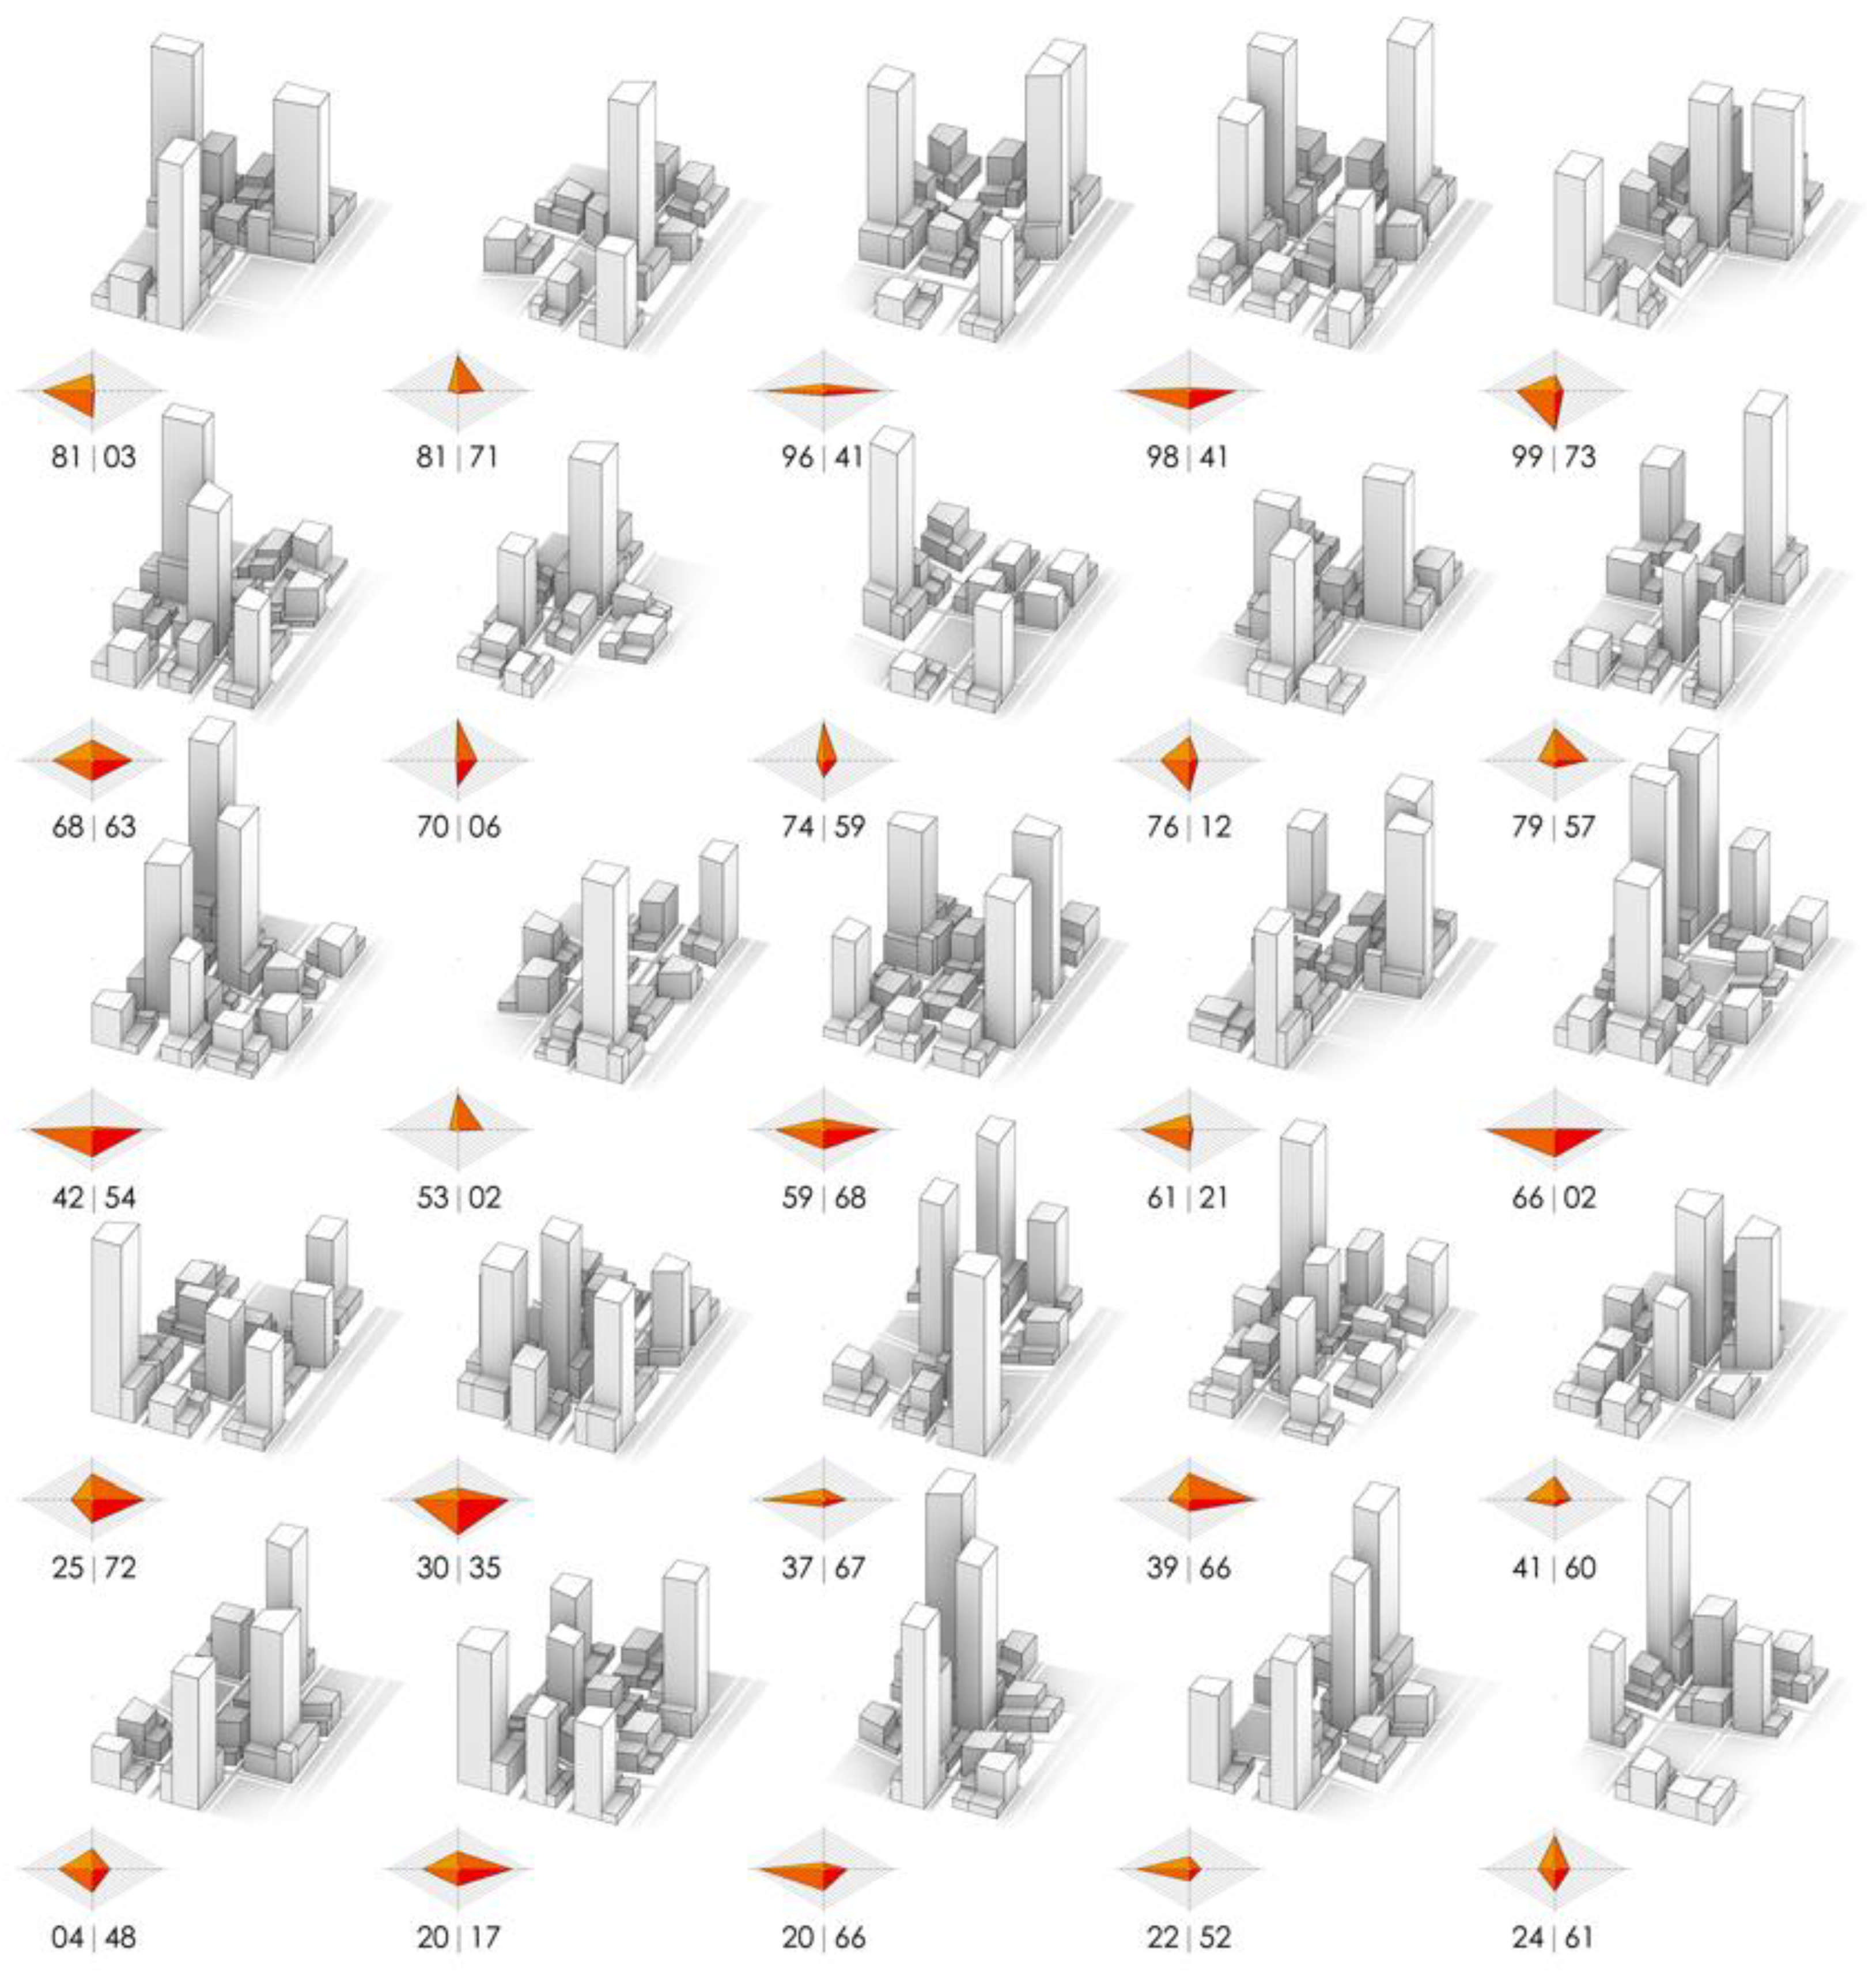
4.2. Form Generation and Performance Evaluation
5. Analysis and Selection
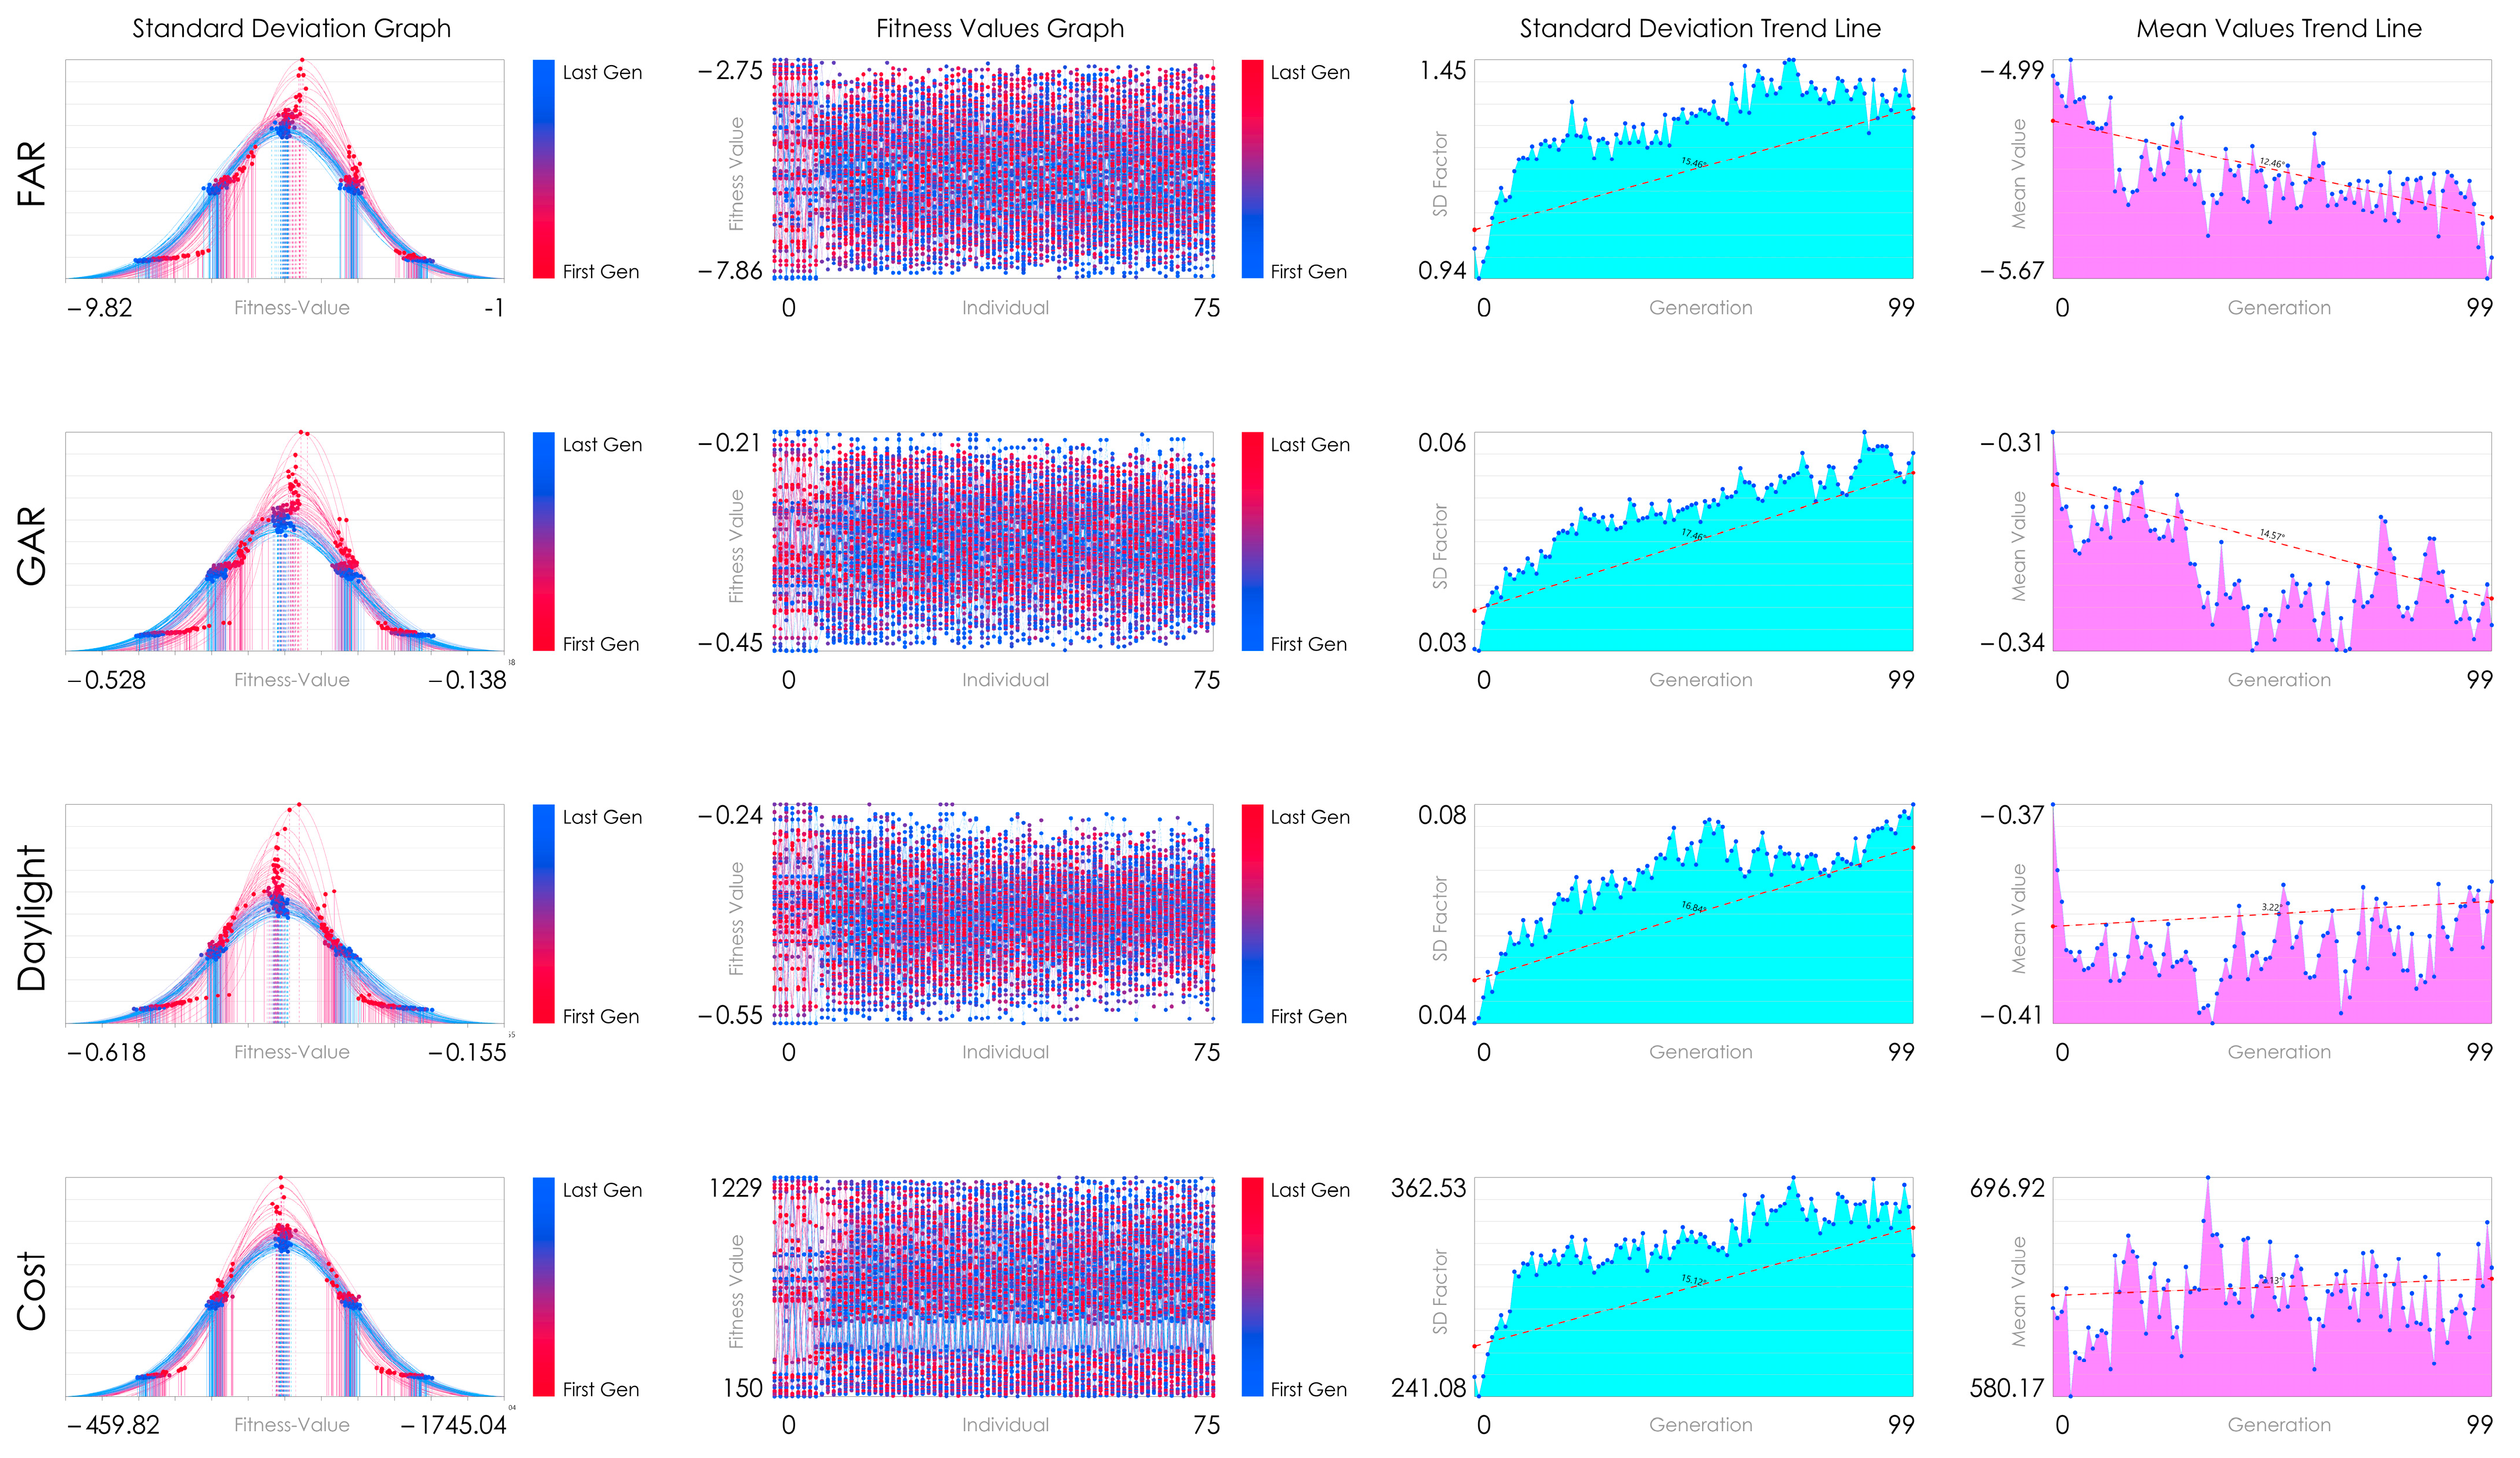
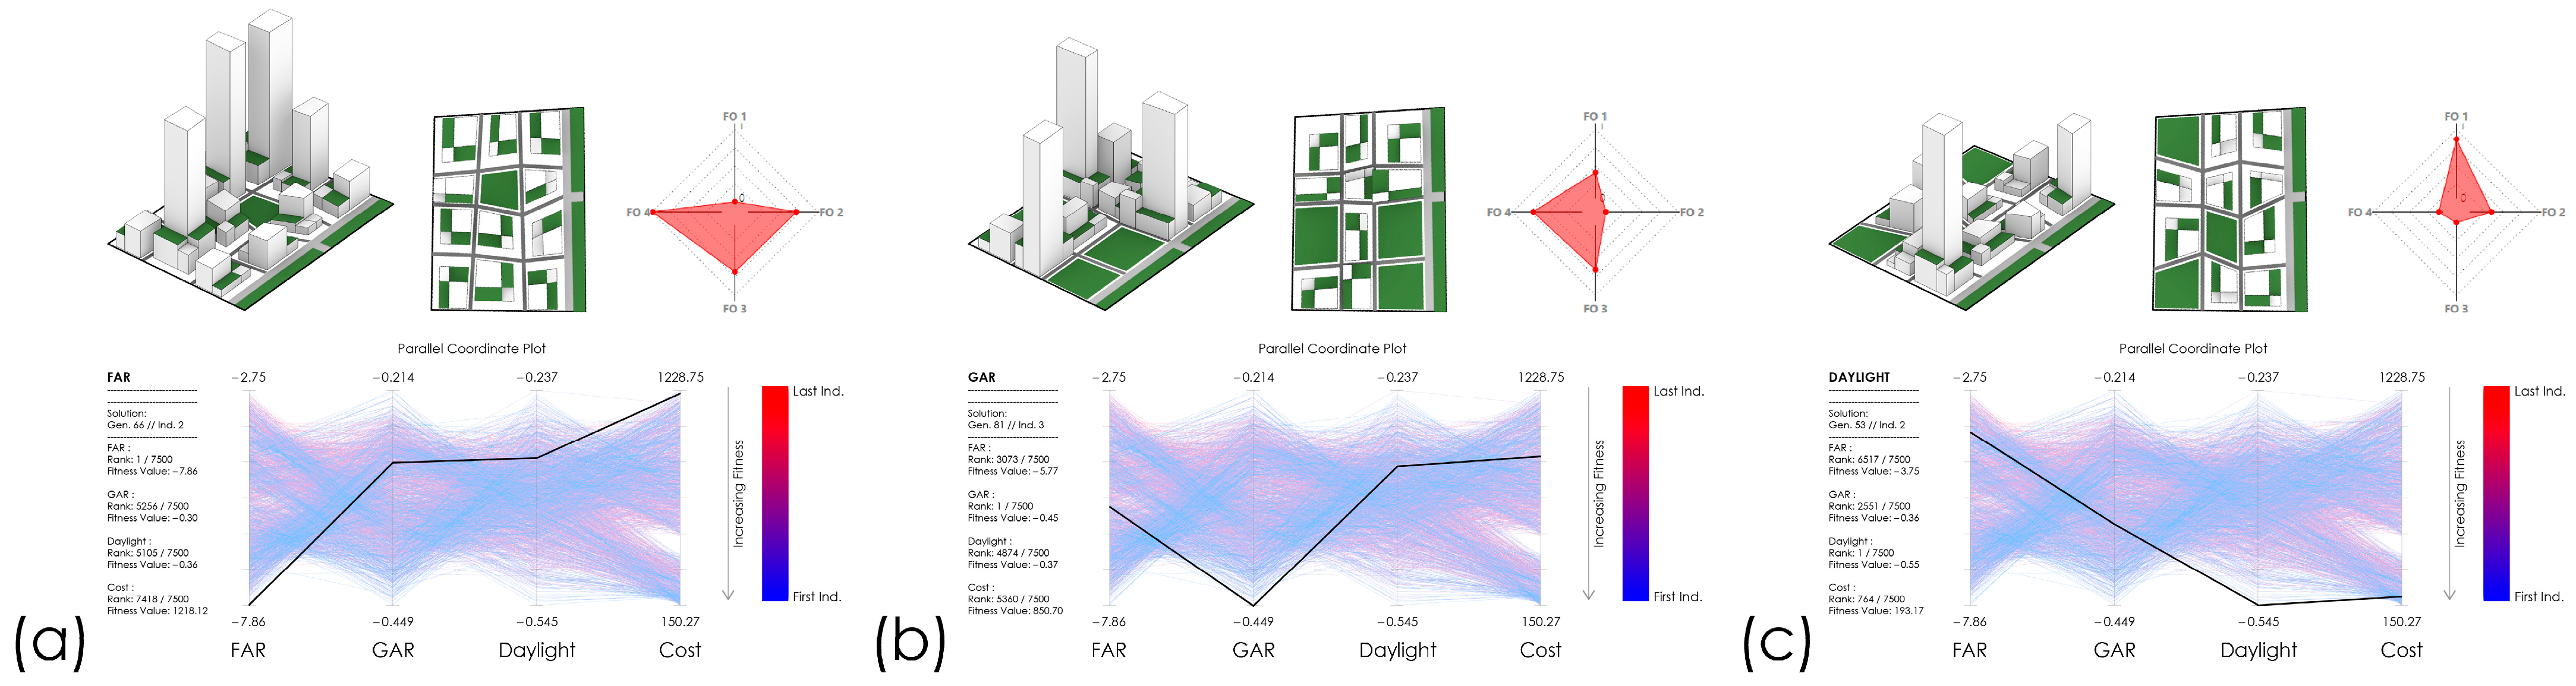
5.1. Result Analysis
5.2. Evaluation and Selection
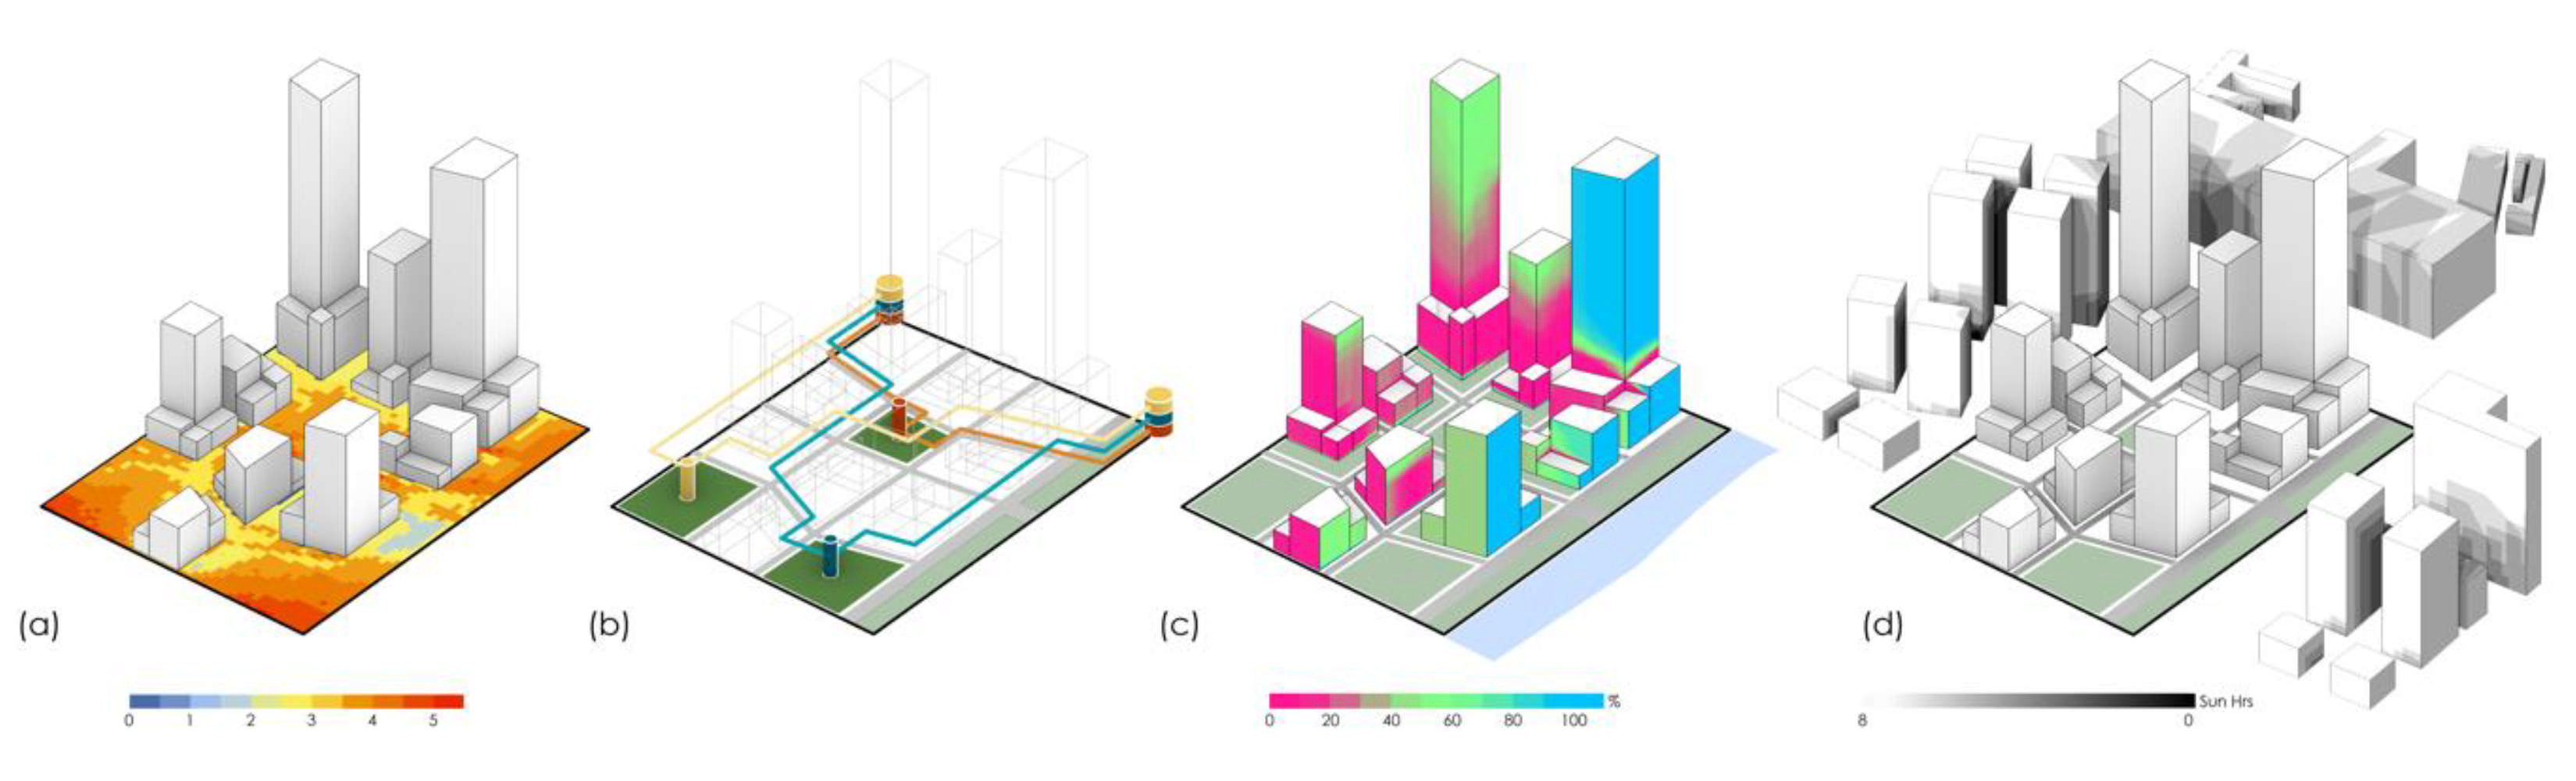
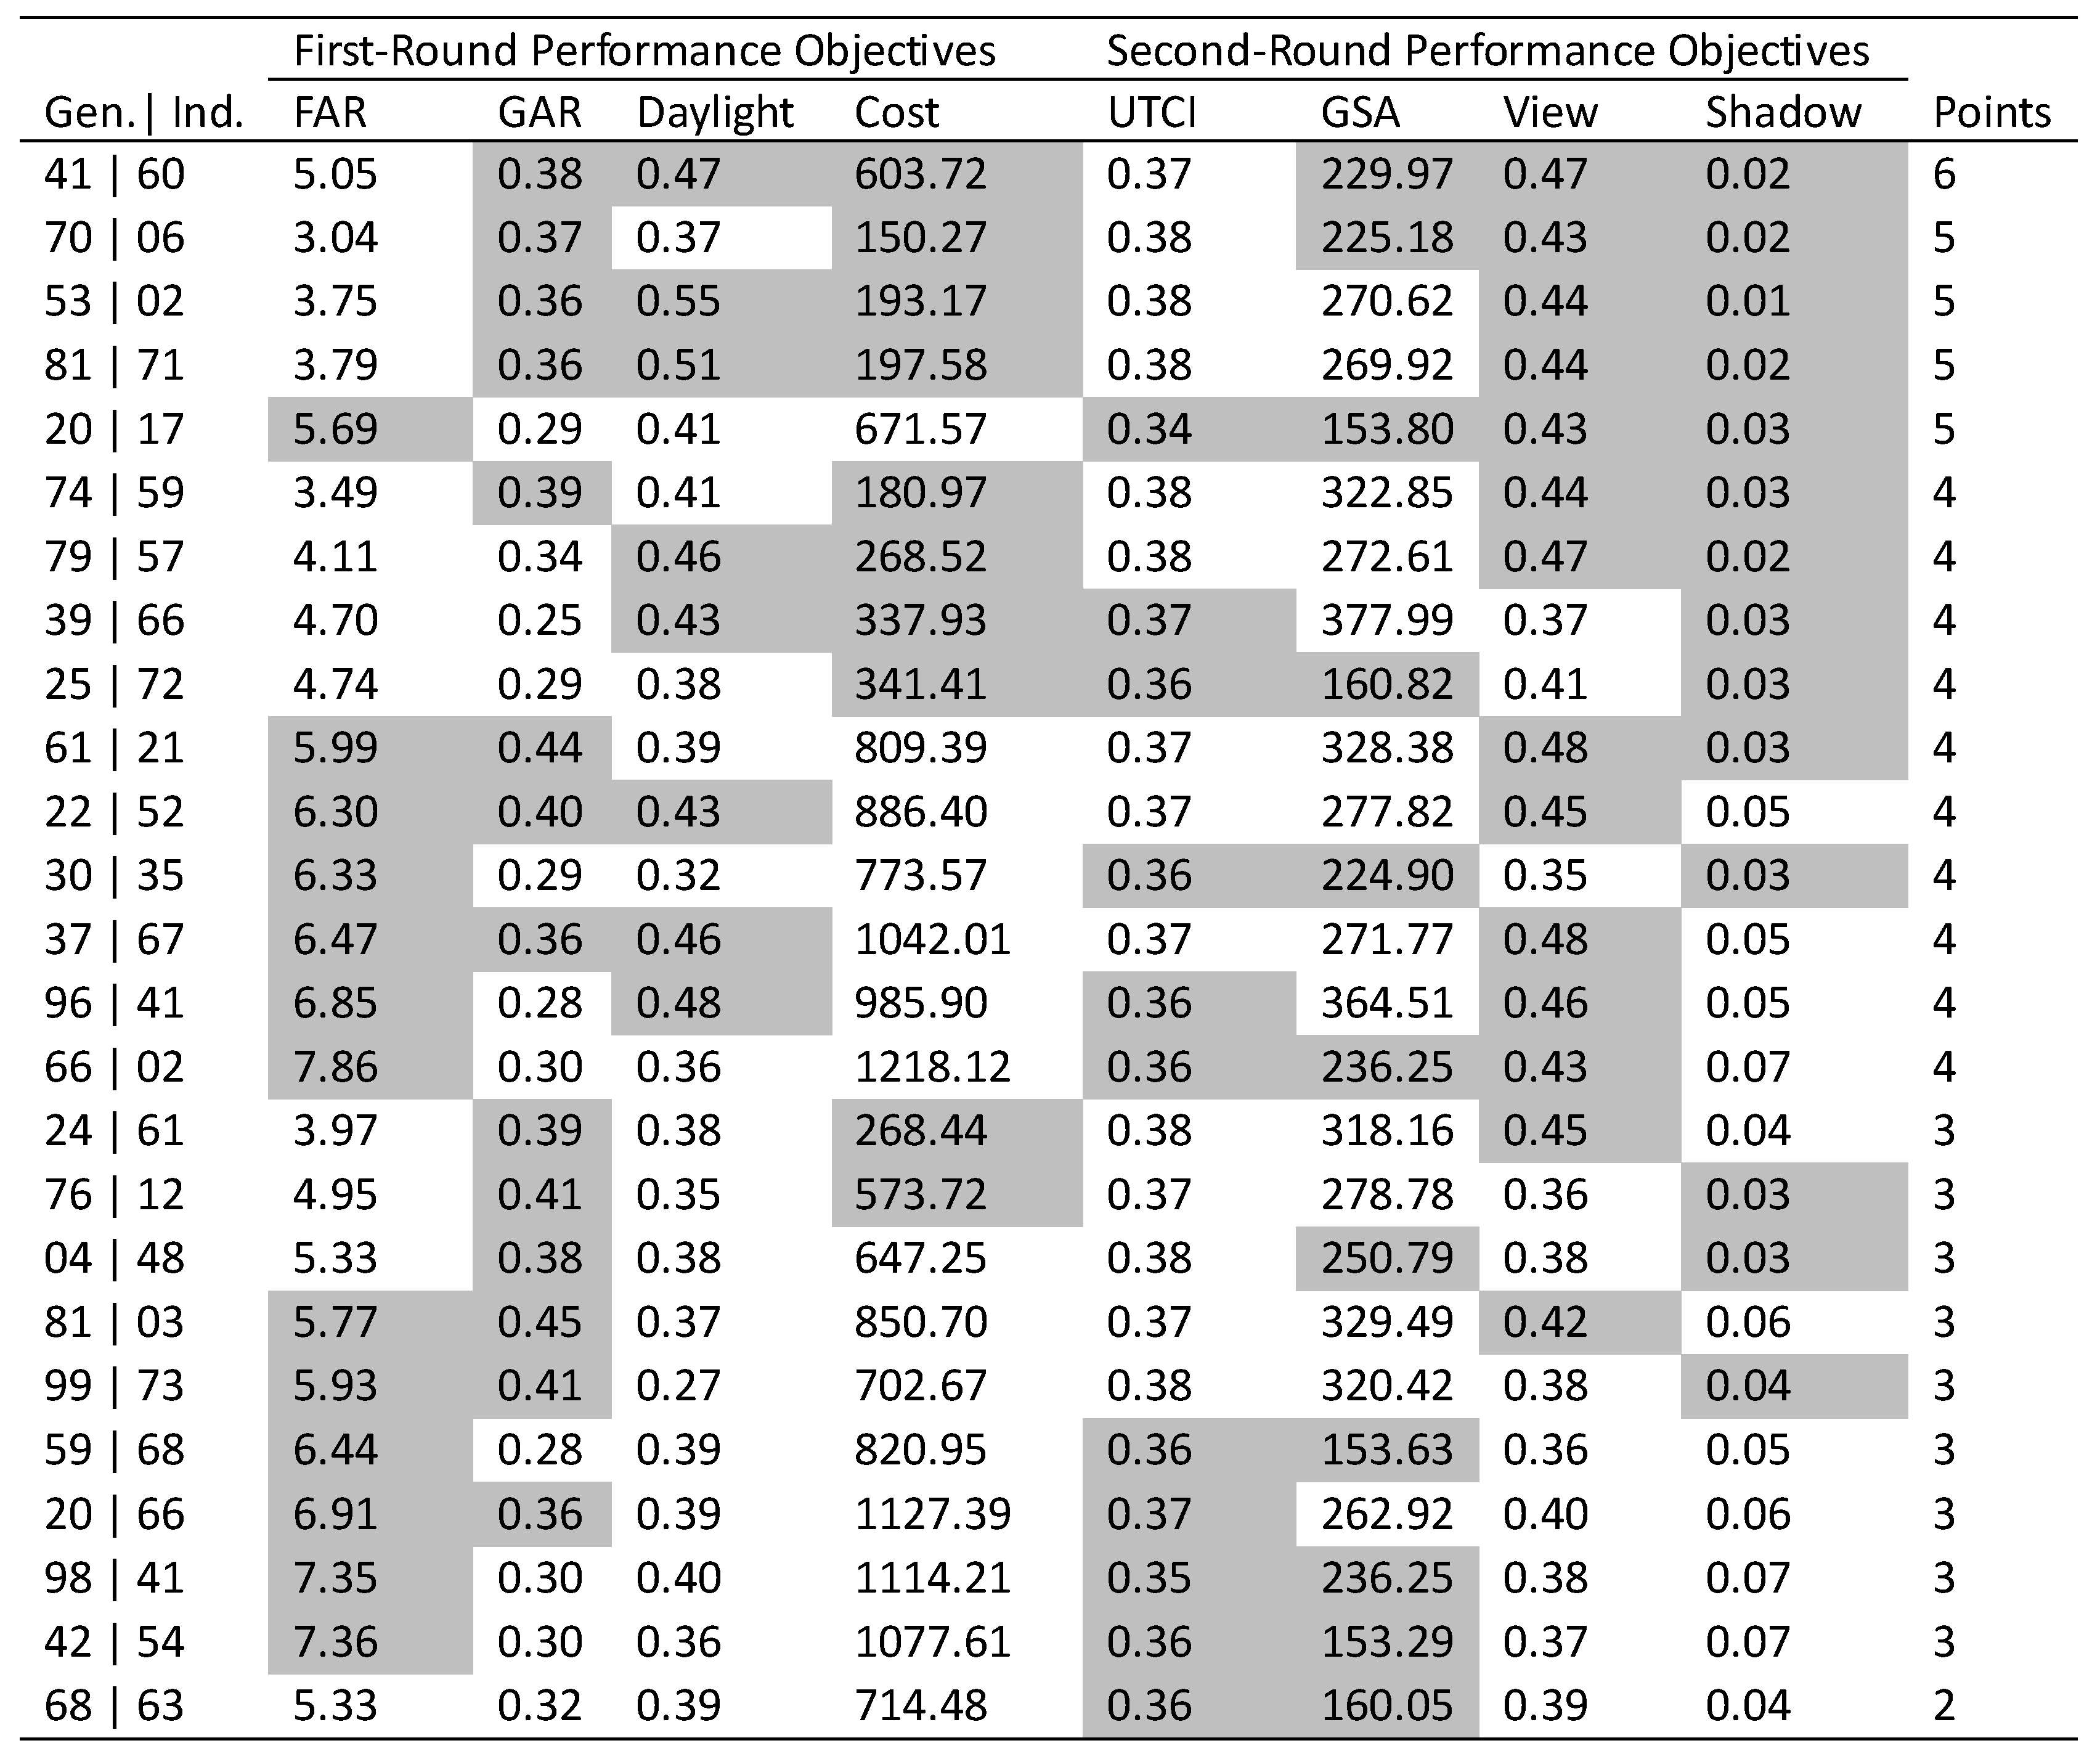
5.3. Second-Round Evaluation
6. Discussion
Author Contributions
Funding
Data Availability Statement
Conflicts of Interest
References
- Du, P.; Al-Kodmany, K.; Ali, M.M. (Eds.) The Routledge Handbook on Greening High-Density Cities: Climate, Society and Health, 1st ed.; Routledge: New York, NY, USA, 2024. [Google Scholar]
- Du, P.; Wood, A.; Stephens, B. Empirical Operational Energy Analysis of Downtown High-Rise vs. Suburban Low-Rise Lifestyles: A Chicago Case Study. Energies 2016, 9, 445. [Google Scholar] [CrossRef]
- Nagy, D.; Villaggi, L.; Benjamin, D. Generative Urban Design: Integrating Financial and Energy Goals for Automated Neighborhood Layout. In Proceedings of the Symposium for Architecture and Urban Design, Delft, The Netherlands, 4–7 June 2018. [Google Scholar] [CrossRef]
- Besserud, K.; Hussey, T. Urban Design, Urban Simulation, and the Need for Computational Tools. IBM J. Res. Dev. 2011, 55, 2:1–2:17. [Google Scholar] [CrossRef]
- Sun, Y. Generative Methods for Urban Design and Rapid Solution Space Exploration. Master’s Thesis, Cornell University, Ithaca, NY, USA, 2021. [Google Scholar] [CrossRef]
- Wilson, L.; Danforth, J.; Davila, C.C.; Harvey, D. How to Generate a Thousand Master Plans: A Framework for Computational Urban Design. In Proceedings of the Symposium on Simulation for Architecture and Urban Design, SIMAUD ’19, Atlanta, GA, USA, 7–9 April 2019; Society for Computer Simulation International: San Diego, CA, USA, 2019; pp. 1–8. [Google Scholar]
- Jiang, F.; Ma, J.; Webster, C.J.; Chiaradia, A.J.F.; Zhou, Y.; Zhao, Z.; Zhang, X. Generative Urban Design: A Systematic Review on Problem Formulation, Design Generation, and Decision-Making. Prog. Plan. 2024, 180, 100795. [Google Scholar] [CrossRef]
- Newton, D.W. Identifying Correlations between Depression and Urban Morphology through Generative Deep Learning. Int. J. Archit. Comput. 2023, 21, 136–157. [Google Scholar] [CrossRef]
- Barr, J.M. The Economics of Skyscraper Height. In Building the Skyline: The Birth and Growth of Manhattan’s Skyscrapers; Oxford University Press: Oxford, UK, 2016; pp. 141–183. [Google Scholar] [CrossRef]
- Chau, K.-W.; Wong, S.K.; Yau, Y.; Yeung, A.K.C. Determining Optimal Building Height. Urban Stud. 2007, 44, 591–607. [Google Scholar] [CrossRef]
- Picken, D.H.; Ilozor, B.D. Height and Construction Costs of Buildings in Hong Kong. Constr. Manag. Econ. 2003, 21, 107–111. [Google Scholar] [CrossRef]
- Ashworth, A.; Perera, S. The relationship between construction price and height. Chart. Surv. Build. Quant. Surv. Q. 1978, 5, 68–71. [Google Scholar]
- Picken, D.; Ilozor, B. The Relationship between Building Height and Construction Costs. In Design Economics for the Built Environment; John Wiley & Sons, Ltd.: Hoboken, NJ, USA, 2015; pp. 47–60. [Google Scholar] [CrossRef]
- Blackman, I.Q.; Picken, D.H. Height and Construction Costs of Residential High-Rise Buildings in Shanghai. J. Constr. Eng. Manag. 2010, 136, 1169–1180. [Google Scholar] [CrossRef]
- Showkatbakhsh, M.; Makki, M. Multi-Objective Optimisation of Urban Form: A Framework for Selecting the Optimal Solution. Buildings 2022, 12, 1473. [Google Scholar] [CrossRef]
- Balling, R.J.; Taber, J.T.; Brown, M.R.; Day, K. Multiobjective Urban Planning Using Genetic Algorithm. J. Urban Plan. Dev. 1999, 125, 86–99. Available online: https://trid.trb.org/view/503961 (accessed on 1 July 2024). [CrossRef]
- Koenig, R.; Miao, Y.; Aichinger, A.; Knecht, K.; Konieva, K. Integrating Urban Analysis, Generative Design, and Evolutionary Optimization for Solving Urban Design Problems. Environ. Plan. B Urban Anal. City Sci. 2020, 47, 997–1013. [Google Scholar] [CrossRef]
- Choi, J.; Nguyen, P.C.T.; Makki, M. The Design of Social and Cultural Orientated Urban Tissues through Evolutionary Processes. Int. J. Archit. Comput. 2020, 19, 331–359. [Google Scholar] [CrossRef]
- Dogan, T.; Samaranayake, S.; Saraf, N. Urbano: A New Tool to Promote Mobility-Aware Urban Design, Active Transportation Modeling and Access Analysis for Amenities and Public Transport. In Proceedings of the Symposium on Simulation for Architecture and Urban Design, SIMAUD ’18, Delft, The Netherlands, 4–7 June 2018; Society for Computer Simulation International: San Diego, CA, USA, 2018; pp. 1–8. [Google Scholar]
- Dogan, T.; Yang, Y.; Samaranayake, S.; Saraf, N. Urbano: A Tool to Promote Active Mobility Modeling and Amenity Analysis in Urban Design. Technol. Archit. Des. 2020, 4, 92–105. [Google Scholar] [CrossRef]
- Hong Kong Architectural Services Department. Building Works Tender Price Index Report. Available online: https://www.archsd.gov.hk/en/reports/building-works-tender-price-index.html# (accessed on 15 February 2024).
- May, E.; Du, P.; Martine, V. Environmental Justice: A Case Study into the Heat Vulnerable Neighborhoods of Philadelphia. 2023. Available online: https://www.acsa-arch.org/chapter/environmental-justice-a-case-study-into-the-heat-vulnerable-neighborhoods-of-philadelphia/ (accessed on 1 July 2024).


| No. | First-Round Evaluation | Second-Round Evaluation | ||
|---|---|---|---|---|
| Performance Objective | Measurement | Performance Objective | Measurement | |
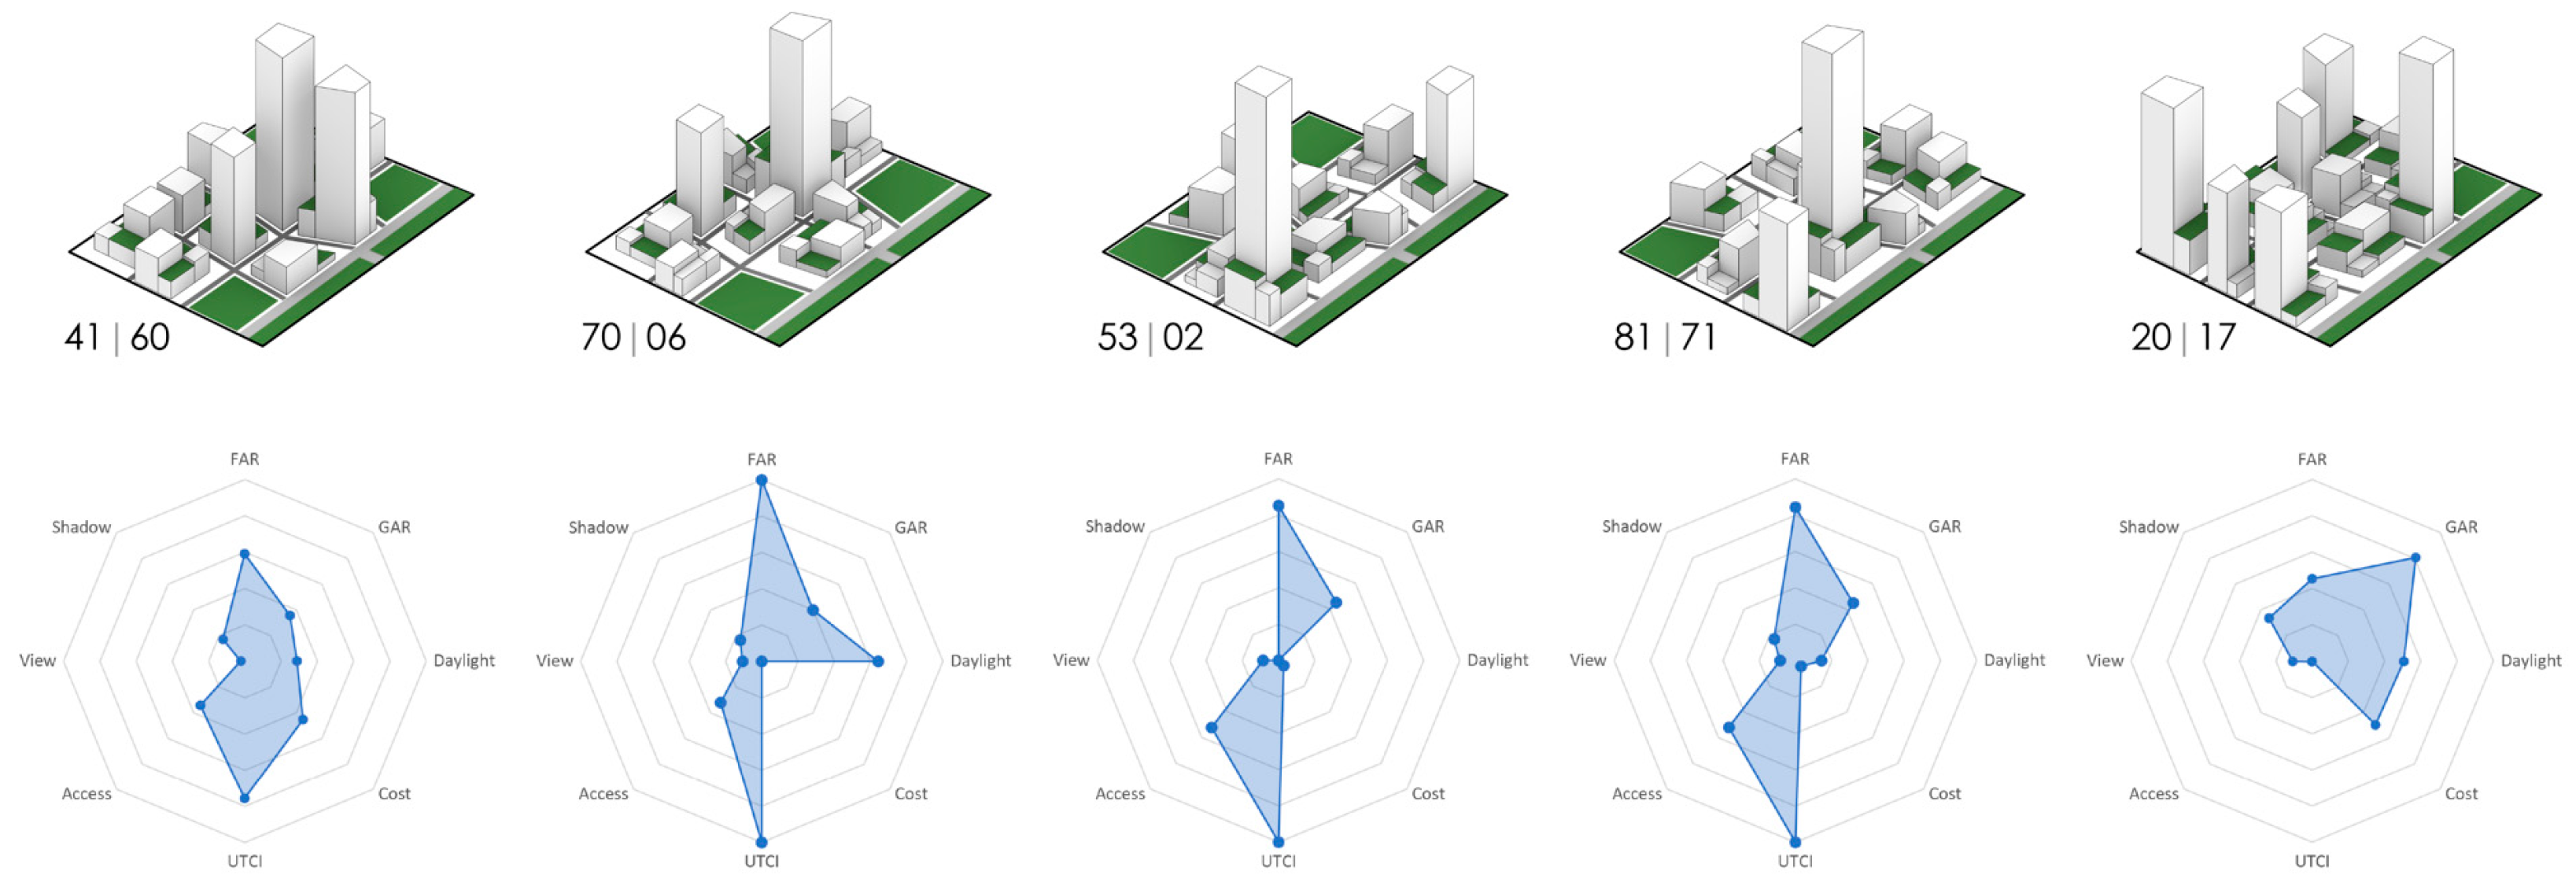
| 1 | Urban Density | Floor Area Ratio (FAR) | Heat Stress | Universal Thermal Climate Index (UTCI) on the street level |
| 2 | Green Space Area | Green Area Ratio (GAR) | Green Space Accessibility (GSA) | The walking distances connecting the green spaces within the site from the surrounding neighborhoods |
| 3 | Daylight Potential | The ratio of the building facades with direct sun exposure | View Interest | ratio of the building facades with direct view access to the river |
| 4 | Construction Cost | The total cost of constructing all the buildings | Shadow Impact | Direct sun exposure to the buildings outside the site boundary |
Disclaimer/Publisher’s Note: The statements, opinions and data contained in all publications are solely those of the individual author(s) and contributor(s) and not of MDPI and/or the editor(s). MDPI and/or the editor(s) disclaim responsibility for any injury to people or property resulting from any ideas, methods, instructions or products referred to in the content. |
© 2025 by the authors. Licensee MDPI, Basel, Switzerland. This article is an open access article distributed under the terms and conditions of the Creative Commons Attribution (CC BY) license (https://creativecommons.org/licenses/by/4.0/).
Share and Cite
Du, P.; Little, G.; Romero, E. Balancing Construction Costs and Environmental and Social Performances in High-Rise Urban Development: A Generative Urban Design Approach. Buildings 2025, 15, 661. https://doi.org/10.3390/buildings15050661
Du P, Little G, Romero E. Balancing Construction Costs and Environmental and Social Performances in High-Rise Urban Development: A Generative Urban Design Approach. Buildings. 2025; 15(5):661. https://doi.org/10.3390/buildings15050661
Chicago/Turabian StyleDu, Peng, Geoffrey Little, and Erick Romero. 2025. "Balancing Construction Costs and Environmental and Social Performances in High-Rise Urban Development: A Generative Urban Design Approach" Buildings 15, no. 5: 661. https://doi.org/10.3390/buildings15050661
APA StyleDu, P., Little, G., & Romero, E. (2025). Balancing Construction Costs and Environmental and Social Performances in High-Rise Urban Development: A Generative Urban Design Approach. Buildings, 15(5), 661. https://doi.org/10.3390/buildings15050661