Abstract
Micropiles are a new type of retaining structure widely used in slope engineering due to their small footprint, low vibration and noise emissions, and simple construction process. This study aims to investigate the dynamic response and failure mechanisms of micropiles used in retaining accumulation landslides under seismic loading through shaking table tests and numerical simulation. The failure process, observed phenomena, and bending moments of micropiles in the test were discussed, and the shear force distribution of micropiles was thoroughly analyzed based on numerical simulation. The findings reveal that the natural frequency of the entire landslide system exhibits a gradual decrease and tends to stabilize under sustained earthquake excitation. The bending moment of micropiles follows an “S” shape, with a larger magnitude at the top and a smaller one at the bottom. Additionally, the shear force distribution exhibits a “W-shaped” pattern. Damage to micropiles mainly includes the flexural shear combination failure at the load-bearing section (which occurs within 1.4–3.6 times the pile diameter above the sliding surface) and the shear failure near the sliding surface. This study provides significant insights into the strengthening mechanisms of micropiles under seismic action and offers valuable guidance for the design of slope support.
1. Introduction
China is a mountainous and earthquake-prone country [1,2,3,4], where earthquake-induced landslides are the predominant geological disasters following seismic events. Compared to landslides triggered by other factors, earthquake-induced landslides are characterized by rapid onset, large-scale occurrences, and significant destructiveness [5,6,7]. Typically, casualties and property losses caused by earthquakes account for more than half of the overall losses incurred [8]. Therefore, ensuring the safety of landslide-prone areas in seismic regions, studying the anti-seismic mechanisms of retaining structures, and developing tailored anti-seismic design theories for landslide prevention have become urgent priorities in the field of geological disaster mitigation.
Among various types of anti-slip structures, micropiles have emerged as a novel retaining solution in slope engineering. In recent years, as engineering designs have shifted from rigid to flexible approaches for seismic resistance, micropiles have gained increasing popularity in seismic landslide engineering [9,10,11,12,13]. Micropiles are small-diameter (typically less than 300 mm or 12 inches) drilled and grouted replacement piles that are usually reinforced. Compared to traditional anti-sliding piles, micropiles offer several advantages, including simplicity, rapid installation, environmental friendliness, cost-effectiveness, and versatility across different soil types and ground conditions. Moreover, they can be easily deployed in areas with limited equipment access, which makes them particularly suitable for addressing landslides in hilly, steep, or mountainous terrains.
Up to now, significant progress has been made in understanding the behavior of micropiles under static loads [14,15,16,17,18,19], but there remains a noticeable gap in studies addressing their dynamic characteristics during seismic events. The advancement of seismic-resistant technology for micropiles lags behind their practical application in engineering, and investigations into earthquake-induced damage are still limited. Although valuable research has been conducted on the use of micropiles to support slopes and mitigate landslides during seismic events [20], these studies predominantly rely on numerical simulations. For example, Noorzad and Saghaee [20] used PLAXIS to explore the dynamic response of inclined micropiles under seismic loading. Their findings show that the axial force within the micropile increases as the incline angle rises, while shear force and bending moment values decrease with a higher inclination angle. Furthermore, Yang [21] and Wang [22] analyzed the dynamic response of slopes supported by various composite micropile structures using FLAC3D to identify optimal configurations for composite micropiles suitable for earthquake-prone areas. In dynamic model tests, most studies on micropiles focus primarily on homogeneous soil landslides. For example, Zheng et al. [23] conducted large-scale shaking table tests to compare the deformation characteristics and internal force distribution of parallel-arranged and herringbone-shaped micropiles under seismic loading.
However, the understanding of seismic mechanisms involved in micropile-retained slopes, dynamic behaviors, and failure characteristics of micropiles remains incomplete. Although it has been demonstrated that micropiles have good seismic performance due to their high flexibility, ductility, and capacity to withstand extension forces [24,25], most of these studies were involved in piled foundations. Unlike consolidated foundations, stabilizing micropiles in slopes or landslides can be significantly influenced by lateral spreading. To thoroughly analyze the seismic failure mechanisms and dynamic response of micropiles, as well as to better understand their performance in landslides during earthquakes, a shaking table model test was conducted on an accumulation landslide. Additionally, numerical simulations were performed using ABAQUS finite element software (Version: 2020). The failure process, the observed phenomena and the bending moments of micropiles during the test, and the force distribution characteristics of micropiles in dynamic numerical simulation were discussed.
2. Shaking Table Model Test Design
2.1. Shaking Table Test System and Model Box Design
The shaking table model test was conducted at the Seismic Structure Laboratory of Xi’an University of Architecture and Technology in China. The experimental setup employed a computer-controlled hydraulic system manufactured by MTS, a renowned US-based company. The dimensions of the shaking table are 4.1 m × 4.1 m and the operating frequency is 0.1 to 100 Hz. In the horizontal direction, the maximum acceleration levels reach ±1.5 g and the maximum displacement is ±25 cm.
The test model box is a rigid container with internal dimensions of 2.6 m (length) × 1.4 m (width) × 1.67 m (height). It consists of an edge-angle steel base support frame, a steel plate bottom, and transparent tempered glass walls on the left and right sides, to observe the deformation and failure phenomena. To minimize interference caused by seismic wave reflections and ensure accurate observations, two 10 cm thick polystyrene foam boards were securely attached to both ends of the container [26]. Additionally, to reduce relative displacement between the soil and the bottom of the box, a layer of cobblestones was affixed to its inner surface.
2.2. Similarity Relations
In practical engineering, the form of landslides is generally complex. While using a scaled landslide as the test model could provide a more realistic simulation of the actual seismic response, it may introduce additional complexities and distractions. Considering the focus of this study is to investigate the seismic responses and failure mechanisms of micropiles, we intentionally simplified the experimental design by disregarding the complex nature of landslide formations. As a result, in this study, we generalize the landslide as a two-level accumulation landslide reinforced by three rows of micropiles, as illustrated in Figure 1. The landslide consists of three distinct sections: Slope 1# (with a slope ratio of 1:0.59), Slope 2# (with a slope ratio of 1:0.75), and a platform where vertical micropile groups are installed. According to the micropile design requirements and reasonable pile spacing recommendations [27,28], the row spacing and column spacing of the micropiles are set to 7 times and 4 times the pile diameter, respectively.
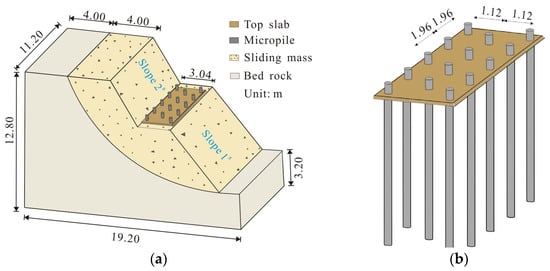
Figure 1.
Accumulation landslide reinforced by micropiles: (a) dimensions of landslide model; (b) layout of micropiles.
In the experiments, we consider geometric dimension L, elastic modulus E, and material density ρ as the fundamental parameters. Taking into account the maximum load and size limitations of the shaking table, as well as the length–diameter ratio of conventional micropiles in practical engineering applications, we establish a geometric similarity ratio Cl of 8, with CE = 3 and Cρ = 0.75. Additionally, other similarity ratios for various parameters used in this study are calculated based on Buckingham’s theory and dimensional analysis (Table 1).

Table 1.
Similarity relations in the shaking table test.
2.3. Simulation Material
Based on field landslide data [29,30] and considering the feasibility of preparing similar materials, a sliding mass simulation material was prepared using loess and gravel (with a diameter range of 1 to 2.5 cm), closely emulating the characteristics observed in actual landslides. Through a series of laboratory direct shear tests, an optimal loess-to-gravel ratio of 1:0.8 was determined. Additionally, materials simulating the composition of the sliding bed were created by mixing loess, cement, medium sand, and water in a ratio of 1:0.3:0.13:0.15 to accurately reflect the properties of the prototype landslide. The sliding zone was simulated using a single layer of plastic paper. The cohesive force and internal friction angle of the sliding band were 7 kPa and 28°, respectively. The physical and mechanical parameters of the landslide model are presented in Table 2.
Table 2.
Physical and mechanical parameters of the landslide model.
The micropile model was prefabricated by assembling an aluminum cage and then casting a mold. Guided by the geometric similarity ratio (Cl = 8), the diameter of the micropile model was set at 2.8 cm, with a reinforcement configuration of 4Φ6 mm. The longitudinal reinforcement was simulated using aluminum with an elastic modulus of 6.9 × 10⁴ MPa and the stirrups were made from fine iron wire. For the casting material in this experiment, gypsum slurry was chosen due to its similar properties to concrete material. The water-to-paste ratio of the gypsum slurry was maintained at 0.7, and it exhibited a compressive strength of 11.1 MPa. The elastic modulus of the micropile model was determined to be 1.2 × 10⁴ MPa through a four-point bending experiment. Since the upper slab only serves to fix the top of each pile and is not the focus of our research, it was simulated using a wooden board, and its physical parameters were not tested.
2.4. Modeling Process
The preparation process of the landslide model (Figure 2) is illustrated as follows: (i) mixing the simulated soil; (ii) fixing the test micropiles to the predesigned position and constructing the sliding bed by sequentially compacting soil layers; (iii) forming the sliding surface according to its designated shape; (iv) creating the sliding mass; (v) installing a top slab onto the apex of each micropile; and finally, (vi) securing the landslide model to the shaking table.
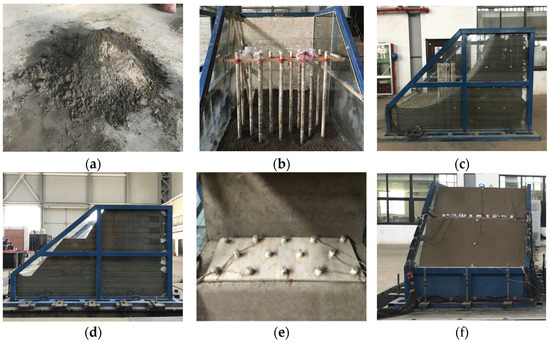
Figure 2.
The preparation process of the landslide model: (a) mixing the simulated soil; (b) fixing the micropiles and making the sliding bed; (c) forming the sliding surface; (d) creating the sliding mass; (e) installing the top slab; and (f) securing the landslide model to the shaking table.
2.5. Monitoring Scheme
The acceleration responses of the landslide model were monitored at various locations by strategically embedding acceleration sensors. Accelerometers A01 to A06 were positioned on the slope surface, while accelerometers A07 to A19 were evenly distributed within the landslide body, as depicted in Figure 3. To investigate the dynamic behavior of micropiles during shaking, 8 sets of strain gauges (type: BE-120) were attached to the longitudinal bars of the pile along the bond axis.

Figure 3.
Distribution of measuring points: (a) layout of the accelerometer in the landslide model; (b) layout of strain gauge on the micropiles.
2.6. Loading Conditions
Because horizontal earthquake force is the major cause of structure destruction and can significantly reduce landslide stability, all seismic waves applied during the shaking experiments were directed exclusively along the X-axis. A diverse range of seismic waves, including Wenchuan, El Centro, and Kobe waves, as well as sinusoidal waves, were selected as input signals. The loading sequence followed a gradual incremental method outlined in Table 3. Furthermore, to obtain critical information such as natural vibration frequencies, damping ratios, and other dynamic characteristics of the landslide model, white noise with an amplitude of 0.03 g was scanned across the model after adjusting the amplitude of the acceleration loading.
Table 3.
Input signals in the shaking table test.
3. Numerical Model
To gain further insights into the dynamic response of the landslide and deformation characteristics of micropiles, a comprehensive numerical model was developed using the finite-element software ABAQUS.
3.1. Numerical Modeling and Parameter Setting
The grid size Δl in the numerical model is generally determined by the highest frequency present in the entire seismic wave time history. A smaller grid size is required when dealing with seismic waves that have higher maximum frequencies [31,32]. To accurately capture the propagation properties of seismic waves, it is necessary for the maximum grid size Δl to be less than 1/10–1/8 of the input seismic waves’ wavelength (Equation (1)):
where Δl represents the grid size of the numerical model and λ denotes the minimum length of the seismic wave.
Δl ≤ (1/10–1/8)λ
In this study, input seismic waves have a maximum frequency below 40 Hz. Based on Equation (1), the maximum unit size of the model is determined to be 13.75 cm. Considering both calculation accuracy and efficiency, we set the grid size ranging from 1.5 to 5 cm.
To replicate the behavior of the sliding mass soil, the Mohr–Coulomb elastic model was employed, while an elastic model was used to represent the bedrock of the sliding bed and the top plate of the micropiles. The material parameters for the numerical model were derived from measurements obtained during tests and subsequently adjusted to reflect the prototype landslide. The specific parameters are shown in Table 4. The predominant element type in the model was C3D8R hexahedral elements, supplemented by C3D6 wedge-shaped elements.
Table 4.
The parameters of the numerical model in dynamic numerical simulation.
Moreover, in order to improve computational efficiency, only half of the entire landslide was established due to its symmetrical nature. Figure 4 illustrates the three-dimensional numerical representation of the numerical model.
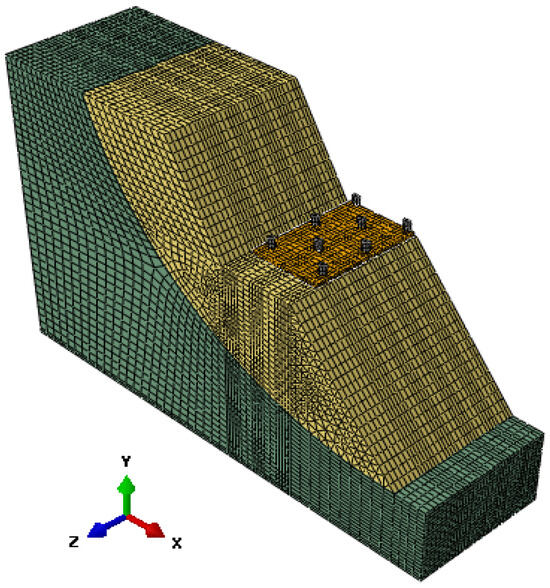
Figure 4.
The micropile-supported landslide model in the seismic numerical simulation.
The interaction between the micropiles and the top slab was defined as “binding”. For contact surfaces involving interactions between piles and sliding body, piles and sliding bed, pile top plate and platform, as well as sliding body and sliding bed, a “hard contact” normal direction was specified. The Coulomb friction model incorporating tangential friction formulae with respective coefficients for each contact surface was employed. Detailed parameters related to interaction simulations can be found in Table 5.
Table 5.
Parameters in interaction simulation.
3.2. Boundary Conditions and Seismic Loadings
In dynamic analysis of semi-infinite bodies such as slopes and landslides, properly addressing the boundary conditions extending to infinity is crucial. Common methods for handling dynamic boundary conditions include artificial boundaries, viscous boundaries, viscoelastic boundaries, and transmission boundaries. Although viscous boundaries are simple and convenient, their accuracy is limited, as they fail to consider the elastic recovery characteristics of slopes or landslides, and they are prone to low-frequency instability. On the other hand, while transmission boundaries offer higher accuracy with second-order precision, stability issues still persist. In contrast, viscoelastic artificial boundaries can effectively simulate the elastic recovery behavior of semi-infinite media beyond artificial borders like slopes and foundations while maintaining good stability and high accuracy. Consequently, this numerical research adopts viscoelastic artificial boundary conditions.
The concept of a viscoelastic artificial boundary can be visualized as an equivalent parallel spring–damper system [33,34]. The determination of spring stiffness and damping coefficients in both normal and tangential directions of the artificial boundary can be achieved using Equations (2) and (3):
where KBN and KBT are the spring normal and tangential stiffness, respectively; CBN and CBT are the damping coefficients in the normal and tangential directions of the damper. R is the distance from the wave source to the artificial boundary. cP and cS are the p-wave and S-wave velocities, respectively. G is the shear modulus of the medium. ρ is the mass density of the medium. αN and αT are the normal and tangential viscoelasticity artificial boundary correction coefficients, respectively, whose values are set at 1.2 and 0.7.
3.3. Verification of Numerical Simulation
In order to verify the rationality of numerical model establishment and parameter selection, take the acceleration measurements of measuring points A2 and A4 under the 0.2 g Wenchuan wave as an example. Figure 5 and Figure 6 display the acceleration time history curves and spectral response of A2 and A4, respectively, under 0.2 g Wenchuan waves.
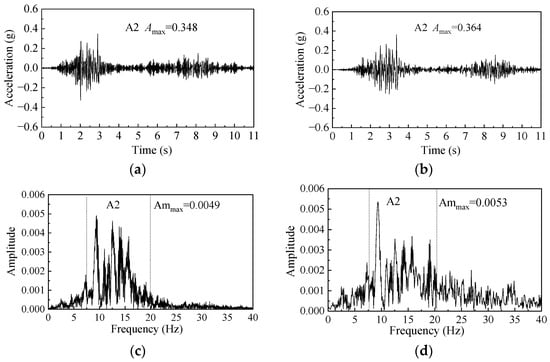
Figure 5.
The acceleration time history and spectral response of measuring point A2: (a) acceleration time history in the test; (b) acceleration time history in the numerical simulation; (c) spectral response in the test; and (d) spectral response in the numerical simulation.
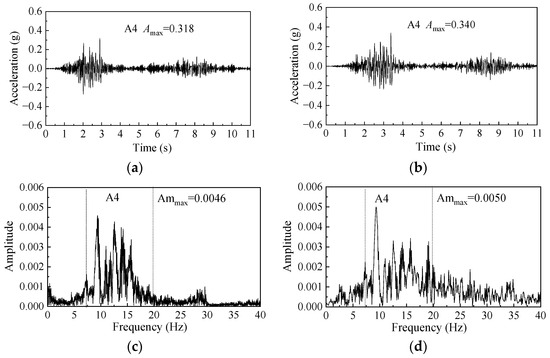
Figure 6.
The acceleration time history and spectral response of A4: (a) acceleration time history in the test; (b) acceleration time history in the numerical simulation; (c) spectral response in the test; and (d) spectral response in the numerical simulation.
Based on the comparison between Figure 5a and Figure 5b, as well as between Figure 6a and Figure 6b, it can be seen that the acceleration time history curves obtained from numerical calculations closely match those derived from shaking table tests. The acceleration obtained by tests and numerical simulation shows the same variation trend with time, except for slight differences in values and phases. The peak acceleration Amax of measurement point A2 in the shaking table test is 0.348 g, and the numerical calculation yields a value of 0.364 g, resulting in a maximum error of 4.6%. Similarly, for A4, the experimental value is 0.318 g, and the numerical result is 0.340 g, indicating a maximum error of 6.9%.
By comparing Figure 5c with Figure 5d and Figure 6c with Figure 6d, it can be observed that whether from the shaking table test or the numerical simulation, the dominant frequency band of seismic waves transmitted to the landslide is primarily concentrated in the range of 7.5–20 Hz, and its dominant frequency is 9 Hz. However, compared with the numerical simulation, the spectrum data in the test show that the landslide model also exhibits a strong response near 15 Hz, which may be related to the natural frequency of the test model (19–22 Hz). In addition, the peak amplitude Ammax of A2 in the test is 0.0049, and the numerical calculation value is 0.0053, resulting in a maximum error of 7.5%. For A4, the maximum error is 8.0%.
The error between the calculated values and the test values at different measurement points is not exactly the same, mainly because numerical simulations assume the materials’ perfect homogeneity, whereas actual model construction cannot guarantee absolute uniformity at each measuring point. Nevertheless, on the whole, the calculated values are in good agreement with the experimental values. Whether in the acceleration time history curve or the spectral curve, the maximum error between the numerical simulation and the experiment does not exceed 10%. So the numerical model establishment and the settings of parameters are reasonable.
4. Results
4.1. Deformation and Failure Phenomenon
- (1)
- Slope failure process and test phenomenon
After each excitation, the occurrence of cracks in the landslide model was carefully recorded. Figure 7 and Figure 8 depict a visual representation of the failure mode and crack development in the landslide model.
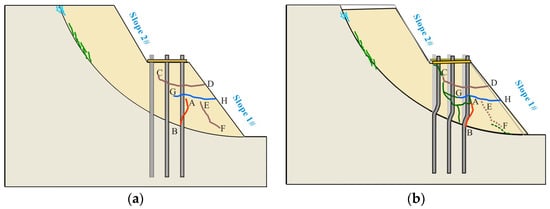
Figure 7.
Failure process and fracture development of the landslide: (a) before sliding; (b) after sliding.
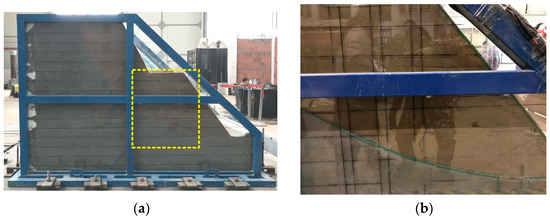

Figure 8.
Destruction process of the landslide model: (a) Overall view of the slope failure area; (b) after a 0.8 g, 16 Hz sine wave; (c) after 1.0 g Wenchuan waves; and (d) the damaged landslide model after shaking tests.
In the range of 0.1–0.6 g, no observable changes were observed in the landslide behavior. However, when subjected to a 0.8 g, 8 Hz sine wave, a tension crack, A–B (approximately 22.5 cm in length), appeared on the frontal side of the front row piles (Figure 7a). Simultaneously, soil near the apex of the slope exhibited loosening compared to its initial state, accompanied by a slight accumulation of gravel along the sliding surface. Subsequently, under a 0.8 g, 16 Hz sine wave, crack A-B continued to widen while cracks C–D and E–F developed at the shoulder region of the slope, where the sliding mass began to move (Figure 7b and Figure 8b). The crest subsided by approximately 1 cm, and the toe displaced by about 0.5 cm.
When subjected to a 1.0 g Wenchuan wave, a shear crack, G–F, appeared approximately 20 cm below crack C–D (Figure 7b and Figure 8c). Under a 1.0 g, 4 Hz sine wave, the previous cracks were extended and widened, leading to the development of a “mesh rupture body” stretching from the rear pile to the slope toe. At the same time, during shaking, soil near the slope’s summit and toe continuously cascaded down onto the shaking table, causing slow movement along the sliding surface. Ultimately, horizontal displacement at the slope toe was measured at 4 cm while settlement at the crest was recorded as 1.3 cm (Figure 7b and Figure 8d).
According to the characteristics of the macroscopic damage to the model following the tests, it can be inferred that the primary failure mode of the reinforced accumulation landslide is characterized by a combination of shear failure and tensile crack failure in the reinforced area, movement of the entire sliding mass, and disintegration near the toe.
- (2)
- Damage phenomenon of micropiles after earthquake
After the test, the landslide model was excavated to observe the seismic damage characteristics. As shown in Figure 9, varying degrees of bending deformation were observed in the load-bearing sections of all three rows of piles, primarily occurring within a range of 2 to 6 times the pile diameter above the sliding surface. However, for the embedded section of the piles, only a few extrusion cracks were observed on the backside of the piles near the sliding surface (within a range of 0.2 to 0.5 times the pile diameter below the sliding surface), while the rest of the piles remained essentially undamaged.
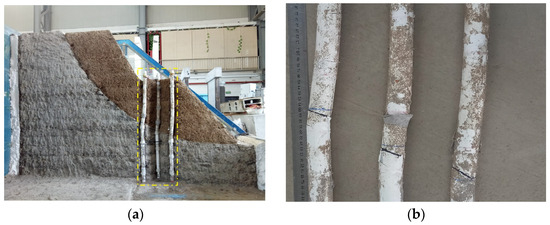
Figure 9.
Destruction of the micropiles in the accumulation landslide after the earthquake: (a) center cross-section of the landslide; (b) overall failure profile of each pile.
Comparing the damage conditions among the three rows of piles, it is evident that rear row piles exhibit more severe bending deformation accompanied by numerous cracks on their front side. The middle row piles experience slightly less bending but also display numerous cracks on their front side, similar to those observed in the rear row. Additionally, within this range of bending, the protective layer on the front side of these piles shows several fine cracks as well. Conversely, no noticeable damage is observed in the front row piles. Analyzing the damage near the sliding surface for all three rows of piles (Figure 9b) reveals that damage primarily occurs on the rear sides of these piled elements; similarly, the severity followed an order: “the rear row > the middle row > the front row”.
4.2. Natural Frequency Change
In this study, the natural frequency of the accumulation landslide was determined using the Transfer Function Method [35,36,37]. Figure 10 illustrates the variations in the natural frequency of the landslide over its loading history.
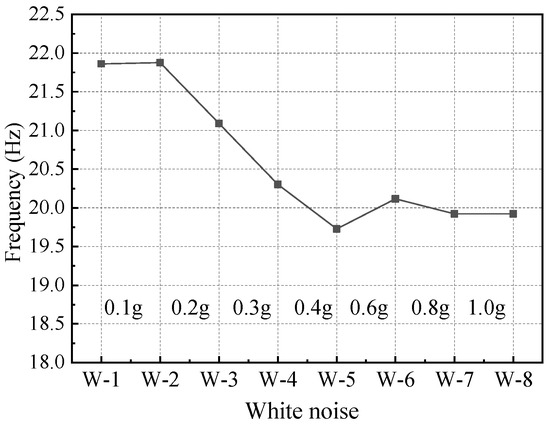
Figure 10.
The changing curve of the natural frequency after each white noise scanning test.
It can be seen that the natural frequency of the accumulation landslide exhibits a decreasing trend, ranging from 21.8 to 19.7 Hz. Following the low-magnitude 0.1 g wave test, the natural frequency of the landslide remained generally consistent with its initial value of 21.8 Hz. However, under the 0.2 g to 0.4 g wave tests, the natural frequency decreased linearly by approximately 3.7%. This indicates that, although no visible macroscopic damage was observed, the internal damage that occurred in the landslide contributed to a reduction in its stiffness. During the 0.6 g to 1.0 g wave tests, discernible macroscopic damage phenomena emerged in the sliding area, and the natural frequency of the landslide did not decrease further due to the support of the micropiles. Ultimately, it exhibited minor fluctuations, stabilizing at approximately 20 Hz. Compared to other supporting structures such as retaining walls and anti-slide piles [38], micropiles are less effective in enhancing the overall stiffness and natural frequency of the slope during an earthquake. This is mainly because the micropiles are lightweight flexible retaining structures, which have little influence on the natural frequency of landslides.
4.3. Bending Moment Characteristics of Micropiles
In order to investigate the bending moment characteristics of micropiles, strain gauges were attached to the longitudinal bars of the micropiles. The bending moments were calculated using Equation (4):
where M represents the bending moment, Es denotes the elastic modulus of the micropile, and W signifies the section modulus. ε1 corresponds to the strain on the front surface of the micropile (for clarity, this is defined as facing towards the slope toe) obtained by the shaking test, while ε2 refers to the strain on its rear surface (facing away from the slope toe) obtained by the shaking test. Figure 11, Figure 12 and Figure 13 illustrate the maximum bending moment curves of three rows of micropiles subjected to Wenchuan waves in the test.
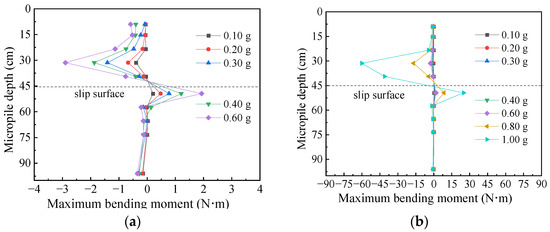
Figure 11.
Bending moment distribution curve of the front pile: (a) at 0.1–0.6 g; (b) at 0.1–1.0 g.

Figure 12.
Bending moment distribution curve of the middle pile: (a) at 0.1–0.6 g; (b) at 0.1–1.0 g.
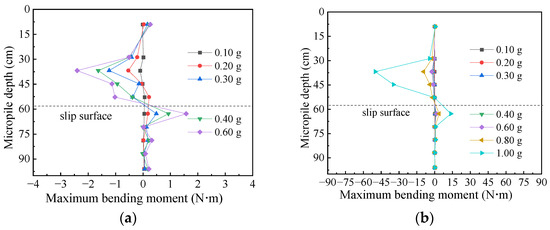
Figure 13.
Bending moment distribution curve of the rear pile: (a) at 0.1–0.6 g; (b) at 0.1–1.0 g.
As seen from Figure 11, Figure 12 and Figure 13, the bending moment of the micropiles exhibits an “S” shape, with predominantly negative values in the load-bearing section (above the sliding surface) and positive values in the embedded section (below the sliding surface). The bending moment value is mainly distributed within the range of 1.4 to 3.6 times the pile diameter above the sliding surface. Due to the curved natural shape of the sliding surface, there are slight differences between the rear two rows and front row piles regarding their respective locations for maximum bending moments. Specifically, measurement point S4 (3.7 times the pile diameter) represents where both the rear row piles and the middle row reach their maximum bending moments, whereas, for the front row piles, this occurs at measurement point S3 (6 times the pile diameter), which is significantly higher than those observed for other two rows. For the maximum negative bending moment points, all three rows share their peak values at point S6 (approximately 1.4 times the pile diameter).
By comparing the bending moment values in the load-bearing section and the embedded section, it can be found that the increase in the positive bending moment of the embedded section is significantly smaller than that in the load-bearing section. This highlights an “S” shape, with a larger magnitude at the top and a smaller magnitude at the bottom. The maximum negative bending moment is approximately 1.5 times to 3.4 times the maximum positive bending moment, and this difference becomes more pronounced with increasing intensity. As the earthquake-induced sliding mass moves, piles in the load-bearing section continuously experience bending and deformation toward the slope toe. Despite the deformation in the load-bearing section causing opposite deformations in the embedded section, these deformations are constrained by the bedrock, resulting in relatively modest bending moment values across each row of piles in the embedded section.
In addition, by comparing the bending moments among the three rows of piles, it can be found that the bending moment values of the back row piles are the largest under the same loading strength. Moreover, this phenomenon becomes increasingly pronounced with the loading strengths.
4.4. Shear Force Characteristics of Micropiles
Because the shear force cannot induce micro-deformation of the strain gauge grid, no resistance change can be produced. So monitoring the shear response of micropiles during shaking table tests is challenging.
To address this issue and investigate the distribution of shear forces under earthquake, the maximum shear forces were obtained through ABAQUS numerical calculations. It is important to note that the convention for symbolizing shear force aligns with structural mechanics principles. Specifically, positive values represent shear forces associated with a clockwise rotational trend of the micro-element. Figure 14 presents the shear force distribution curves of the micropiles subjected to Wenchuan waves.
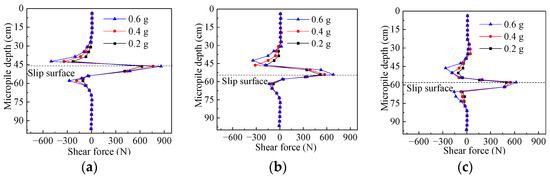
Figure 14.
Shear force distribution curves of the micropiles: (a) the rear pile; (b) the middle pile; and (c) the front pile.
The numerical simulation results of the shear forces exhibit a distinctive “W” pattern among each row of piles. Positive shear forces are primarily concentrated near the sliding surface, while negative shear forces are mainly observed within a limited range along the loaded and embedded sections. Specifically, the negative shear force is predominantly distributed in the range of 1.4 to 3.6 times the pile diameter above the sliding surface and 1.8 times the pile diameter below the sliding surface.
Additionally, at the same magnitude, the shear forces among the rear, middle, and front rows of piles exhibit an approximate ratio of 1.3:1.1:1. The rear row pile experiences higher force values followed by the middle row and then the front row piles. Consequently, the pile shear force is mainly distributed at the sliding surface, with the shear force in the rear row piles being greater than that in the first two rows. Obviously, this observation is consistent with the damage mode of micropiles discussed in Section 4.1 and the bending moment distribution in Section 4.3.
5. Discussion
To further determine the deformation and failure characteristics of micropiles in accumulation landslides under earthquake, the distribution of the pile bending moment and the shear force is analyzed by taking a 0.6 g Wenchuan wave as an example. To ensure data consistency, the values of the bending moment and the shear force are obtained from numerical simulation. Figure 15 presents a comparison of the shear force and the bending moment at the same location of the micropiles under a 0.6 g Wenchuan wave.
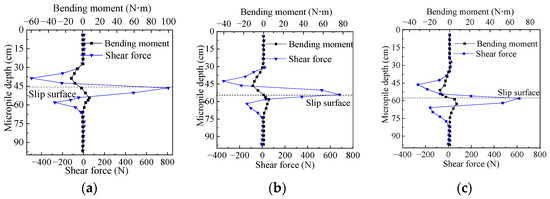
Figure 15.
Comparison of the shear force and the bending moment of the micropiles under a 0.6 g Wenchuan wave: (a) the rear pile; (b) the middle pile; and (c) the front pile.
For the load-bearing section of piles, comparing the shear force corresponding to the maximum bending moment of the pile, it is observed that the rear pile experiences a maximum bending moment of −3.28 N·m, while the middle and front piles experience maximum bending moments of −10.81 N·m and −9.77 N·m, respectively. The corresponding shear forces at these sections are −495.31 N, −184.89 N, and −182.29 N, respectively. Compared with the bending moment value at the point of the maximum shear force, the shear value of the rear pile, the middle pile, and the front pile are −495.31 N, −341.67 N, and −33.14 N, respectively. The corresponding bending moment values are −13.28 N·m, −9.28 N·m, and −5.28 N·m, respectively. It can be clearly seen that under the same loading condition, there exists non-zero shear force at points where maximum bending moments occur and non-zero bending moments at positions where maximum shearing forces occur.
According to the failure phenomenon in the shaking table test, the pile in the range of 2–6 times the pile diameter above the sliding surface was bent and deformed towards the slope toe. In this range, both the shear force and the bending moment in the load-bearing section were significantly large. Therefore, it can be inferred that the deformation and failure mode of the load-bearing section is characterized by a combination of bending and shearing.
At the sliding surface, as seen in Figure 15, the shear force of each pile reaches the maximum value. Specifically, the rear pile experiences a shear force of 808.33 N, the middle pile experiences a shear force of 681.77 N, and the front pile experiences a shear force of 619.79 N. The bending moment values of the three rows of piles at the sliding surface are negligible and approach zero. Based on experimental observations, the lateral protective layer behind the micropiles near the sliding surface was cracked. Additionally, the numerical results indicate significant shear force at the sliding surface but a negligible bending moment. Therefore, it can be concluded that near the slip surface, the deformation and failure mode of the micropiles is dominated by shear failure.
In the embedded section, no apparent damage was observed in the test due to the presence of bedrock with a high elastic modulus. Furthermore, the pile bending moment and shear force are quite small compared with the load-bearing section. As a result, the embedded section of micropiles is basically not damaged and deformed.
Based on the failure mode and dynamic response of micropiles obtained in this study, it is recommended that the following seismic optimization measures should be considered in practical landslide engineering during the design phase:
- (1)
- Enhance the flexural strength of the weak section to prevent ductility failure at locations with high bending moments.
Findings from both shaking table tests and numerical simulations indicate that the most significant bending moment occurs within a range of 1.4 to 3.6 times the pile diameter above the sliding surface. Therefore, it is crucial to reinforce this specific area to mitigate the risk of ductility failure caused by excessive bending moments.
Meanwhile, because the bending deformation of micropiles is flexible deformation, the ductility of the micropiles should be prioritized when considering seismic construction measures. Ductility in structural materials refers to their capacity to undergo deformation from the yield stage until a rapid reduction in bearing capacity occurs under seismic and gravitational forces. Consequently, micropiles with higher ductility can effectively absorb seismic energy through deformation, resulting in reduced earthquake-induced damage.
- (2)
- Ensure the shear strength of vulnerable sections to prevent shear damage in regions with high shear forces.
Because the shear failure of micropiles is a brittle failure, there are no precursors before the failure, and the energy released by the earthquake cannot be absorbed. It is crucial to prevent shear failure before bending failure during earthquakes. The significant cracking observed in the protective layer behind the pile body near the sliding surface in tests can be attributed to the occurrence of the shear failure preceding the ductile failure. Therefore, it is imperative to pay particular attention to reinforcing the area around the sliding surface for micropiles in landslide-prone regions.
- (3)
- Focus on enhancing the reinforcement of the rear row piles.
Both the shaking table tests and numerical simulations revealed that the rear row of piles experienced the most severe damage and deformation, with significantly high shear forces, elevated bending moments, and considerable damage. This is primarily attributed to noticeable yielding behavior in micropiles, which leads to substantial plastic deformation after yielding. Upon yielding of the rear row piles, there is a redistribution of forces due to plastic deformation, leading to load transfer towards the middle row. Consequently, when stress levels in the middle row reach yield conditions, load transfer occurs towards the front row. Therefore, reinforcing the rear row is imperative for seismic design considerations pertaining to micropiles.
6. Conclusions
To reveal the failure mechanisms and dynamic response of an accumulation landslide reinforced by micropiles under an earthquake, we conducted a shaking table test on an accumulation landslide model reinforced with micropiles and supplemented by numerical simulations. The destruction phenomenon, change in natural frequency, characteristics of the bending moment, and distribution patterns of the shear force were comprehensively discussed, respectively. The key findings obtained from this study are as follows:
- (1)
- The primary failure modes of the accumulation landslide after reinforcement with micropiles under an earthquake mainly include “shear failure” and “tensile crack failure” in the area reinforced by micropiles, movement of the entire sliding body, and disintegration near the toe.
- (2)
- Micropiles, as flexible supporting structures with a limited footprint, do not have the same impact on the natural frequency of landslides as other supporting structures, such as anti-sliding piles, retaining walls, or lattice bolts. Under sustained earthquake excitation, the natural frequency of the entire system gradually decreases and tends to stabilize during strong earthquakes.
- (3)
- The dynamic bending moment of micropiles in an accumulation landslide exhibits an “S” shape, with a larger magnitude at the top and a smaller one at the bottom. The bending moment is mainly distributed in the range of 1.4 to 3.6 times the pile diameter above the sliding surface. The shear force distribution demonstrates a distinct “W-shaped” pattern, with the maximum shear force concentrated at the sliding surface.
- (4)
- The damage to micropiles mainly includes a combination of flexural and shear failures in the load-bearing section, as well as shear failure near the sliding surface. In practical landslide engineering applications, it is crucial to reinforce the part that is 1.4 to 3.6 times the pile diameter above the sliding surface to prevent ductility damage caused by excessive bending moments. Additionally, special attention should also be given to enhancing reinforcement near the sliding surface, particularly for rear row piles.
Author Contributions
N.L. and K.H. designed the methodology, wrote the original manuscript, and performed the theoretical and simulation tests. J.L. and R.W. performed the basic mathematical calculations, validated all the results, and conducted the formal analysis. T.X. and J.C. reviewed the entire mathematical results and wrote the manuscript. All authors have read and agreed to the published version of the manuscript.
Funding
This research is supported by the Project of Science and Technology R&D Program of China Construction Seventh Engineering Division Co., Ltd., grant number: CSCEC7b-2023-Z-12, funder: CSCEC Seventh Engineering Division, and the Projects of Natural Science Foundation of China, grant number: 41572261 and 52404222, funder: Natural Science Foundation of China.
Data Availability Statement
The data presented in this study are available on request from the corresponding author. The data are not publicly available due to funding project confidentiality requirements.
Acknowledgments
The authors would like to thank Hui Cheng, Jian Li, Ou Gao, and Xueling Liu from Chang’an University for their help in the model test.
Conflicts of Interest
Author Jingkun Li was employed by the company Communications Construction Company of CSCEC 7th Division Corp. Ltd. The remaining authors declare that the research was conducted in the absence of any commercial or financial relationships that could be construed as a potential conflict of interest.
References
- Sun, B.B.; Wang, P.X.; Deng, M.J.; Fang, H.Y.; Xu, J.; Zhang, S.R.; Wang, C. Seismic performance assessment of hydraulic tunnels considering oblique incoming nonstationary stochastic SV waves based on the generalized PDEM. Tunn. Undergr. Space Technol. 2024, 143, 105481. [Google Scholar] [CrossRef]
- Sun, B.B.; Deng, M.J.; Zhang, S.R.; Liu, W.Y.; Xu, J.; Wang, C.; Cui, W. Efficient Fragility Analysis of Cross-Fault Hydraulic Tunnels Combining Support Vector Machine and Improved Cloud Method. J. Earthq. Eng. 2024, 28, 2403–2421. [Google Scholar] [CrossRef]
- Sun, B.B.; Wang, P.X.; Zhang, G.Q.; Deng, M.J.; Liu, W.Y.; Xu, J. Endurance time history analysis of the seismic behavior and performance assessment of hydro-chemo-mechanical degradation-affected hydraulic tunnels with service time. Undergr. Space 2024, 17, 207–225. [Google Scholar] [CrossRef]
- Sun, B.B.; Wang, P.F.; Deng, M.J.; Liu, W.Y.; Xu, J. Life-cycle dynamic analysis and probabilistic seismic risk assessment of cross-fault hydraulic tunnels considering AAR-induced deterioration. Soil Dyn. Earthq. Eng. 2024, 176, 108320. [Google Scholar] [CrossRef]
- Randall, W.J.; Tanyaş, H. The influence of frequency and duration of seismic ground motion on the size of triggered landslides—A regional view. Eng. Geol. 2020, 273, 105671. [Google Scholar]
- Rodríguez-Peces, M.J.; Román-Herrera, J.C.; Peláez, J.A.; Delgado, J.; Tsige, M.; Missori, C.; Martino, S.; Garrido, J. Obtaining suitable logic-tree weights for probabilistic earthquake-induced landslide hazard analysis. Eng. Geol. 2020, 275, 105743. [Google Scholar] [CrossRef]
- Tanyaş, H.; Hill, K.; Mahoney, L.; Fadel, I.; Lombardo, L. The world’s second-largest, recorded landslide event: Lessons learnt from the landslides triggered during and after the 2018 Mw 7.5 Papua New Guinea earthquake. Eng. Geol. 2022, 297, 106504. [Google Scholar] [CrossRef]
- Wang, Y.; Zhuang, J.Q.; Li, W.; Zhao, Y.; Jia, Y.J. Discrete element simulation of instability and movement process of loess slope under seismic loads. Eng Geol. 2018, 26, 1139–1154. (In Chinese) [Google Scholar]
- Ali Komak, P.; Hadis Jalilian, M.; Jianhua, Y.; Yat Fai, L. Shaking table investigation of effects of inclination angle on seismic performance of micropiles. Int. J. Geomech. 2018, 18, 04018142. [Google Scholar] [CrossRef]
- Hadis Jalilian, M.; Jianhua, Y.; Ali Komak, P.; Yat Fai, L. A 1-g shaking table investigation on response of a micropile system to earthquake excitation. Acta Geotech. 2020, 15, 827–846. [Google Scholar] [CrossRef]
- Jeng, C.J.; Lin, C.C. Performance analysis of slopes reinforced using micropiles. J. Perform. Constr. Fac. 2018, 32, 04018008. [Google Scholar] [CrossRef]
- Shahrour, I.; Juran, I. Seismic behaviour of micropile systems. Proc. Inst. Civ. Eng-Gr. 2004, 8, 109–120. [Google Scholar] [CrossRef]
- Sun, S.W.; Wang, J.C.; Bian, X.L. Design of micropiles to increase earth slopes stability. J. Cen. South. Univ. 2013, 20, 1361–1367. (In Chinese) [Google Scholar] [CrossRef]
- Bai, M.Z.; Du, Y.Q.; Wang, X.Q.; Qiu, S.M.; Tian, G. In-situ study on the combined strengthening effects of intensive micropile groups and anchor-cable ground beam on subgrade slopes of existing roads. Int. J. Earth Sci. Eng. 2016, 9, 1038–1048. [Google Scholar]
- Morteza, E.; Morteza, G.N.; Farid, K. Experimental and numerical study of micropiles to reinforce high railway embankments. Int. J. Geomech. 2013, 12, 729–744. [Google Scholar]
- Preece, D. Slope stabilisation of a section of the thirlmere aqueduct by the use of spaced micropiles and permeation grouting. J. Deep. Found. Inst. 2011, 5, 27–38. [Google Scholar] [CrossRef]
- Choi, W.; Kim, G.; Kim, I.; Doohyun, K.; Junhwan, L. Compressive Load-Carrying Behavior of Inclined Micropiles Installed in Soil and Rock Layers. Int. J. Geomech. 2020, 20, 04020147. [Google Scholar] [CrossRef]
- Chao, W.L.; Yang, J.; LIU, W.J.; Pan, S.Q.; Deng, Z.W. Calculation model and numerical validation of horizontal capacity of micropiles with different section forms. Adv. Civ. Eng. 2022, 2022, 3709415. [Google Scholar] [CrossRef]
- Shi, H.; Bai, M.Z.; Li, C.; Zhang, Y.L.; Tian, G. Correspondence analysis of soil around micropile composite structures under horizontal load. Math. Pro. Eng. 2015, 2015, 382427. [Google Scholar] [CrossRef]
- Noorzad, R.; Saghaee, G.R. Seismic analysis of inclined micropiles using numerical method. In Proceedings of the International Foundation Congress and Equipment Expo Contemporary Topics in Deep Foundations, Orlando, FL, USA, 15–19 March 2009; pp. 406–413. [Google Scholar]
- Yang, J. Study on Dynamic Response Characteristics of Reinforced Slope with Micropiles and the Aseismic Analysis Method. Master’s Thesis, Southwest Jiaotong University, Chengdu, China, 2012. (In Chinese). [Google Scholar]
- Wang, D. Research on Micropiles to Earthquake Load. Master’s Thesis, Southwest Jiaotong University, Chengdu, China, 2014. [Google Scholar]
- Zheng, J.; Niu, W.Q.; Wu, H.G.; Shi, Y.Q. Research on the characteristics of large-scale shaking table experiment slope and dynamic of micropiles. J. Railw. Eng. Soc. 2017, 34, 22–28. [Google Scholar]
- Sadek, M.; Shahrour, I. Influence of the head and tip connection on the seismic performance of micropiles. Soil Dyn. Earthq. Eng. 2006, 26, 461–468. [Google Scholar] [CrossRef]
- Escoffier, S. Experimental study of the effect of inclined pile on the seismic behavior of pile group. Soil. Dyn. Earthq. Eng. 2012, 42, 275–291. [Google Scholar] [CrossRef]
- Lombardr, D.; Bhattacharya, S.; Scarpa, F.; Bianchi, M. Dynamic response of a geotechnical rigid model container with absorbing boundaries. Soil. Dyn. Earthq. Eng. 2015, 69, 46–56. [Google Scholar] [CrossRef]
- Men, Y.M.; Wang, Y.Z.; Hao, J.B.; Li, X.C. Geological Disaster Control Engineering Design; Metallurgical Industry Press: Beijing, China, 2011; pp. 156–168. [Google Scholar]
- Loehr, J.E.; Bowders, J.J.; Owen, J.W.; Sommers, L.; Liew, W. Slope stabilization with recycled plastic pins. J. Transp. Res. Rec. 2000, 1714, 1–8. [Google Scholar] [CrossRef]
- Li, T.Y.; He, B.H.; Lei, T.W.; Chen, Z.P.; Zhang, Y. Indoor experiments on eroding rills hydrodynamics characteristics of earth-rock mixed landslide slope in Wenchuan Earthquake area. J. Hydraul. Eng. 2014, 45, 892–902. [Google Scholar]
- Niu, G.; Sun, D.A.; Kong, L.; Shao, L.T.; Wang, H.; Wang, Z.Z. Investigation into the shear strength of a weakly expansive soil over a wide suction range. Acta Geotech. 2024, 19, 3059–3073. [Google Scholar] [CrossRef]
- Lin, Y.L.; Li, Y.X.; Yang, G.L.; Li, Y. Experimental and numerical study on the seismic behavior of anchoring frame beam supporting soil slope on rock mass. Soil. Dyn. Earthq. Eng. 2017, 98, 12–23. [Google Scholar] [CrossRef]
- Kuhlemeyer, R.L.; Lysmer, J. Finite element method accuracy for wave propagationproblems. J. Soil Mech. Found. Div. 1973, 99, 421–427. [Google Scholar] [CrossRef]
- Dong, J.H.; Zhu, Y.P.; Zhou, Y.; Ma, W. Dynamic calculation model and seismic response for frame supporting structure with prestressed anchors. Sci. China. Technol. Sc. 2010, 53, 1957–1966. [Google Scholar] [CrossRef]
- Bao, X.; Liu, J.B.; Li, S.T.; Wang, F.; Wang, P.G. Seismic response analysis of the reef-seawater system under obliquely incident p and SV waves. Ocean. Eng. 2020, 200, 107021. [Google Scholar] [CrossRef]
- Li, N.; Wang, B.Q.; Men, Y.M.; Liu, N.N.; Liu, X.L.; Gao, O. Dynamic behavior of soil anchorage landslide at different frequencies. Geomat. Geomat. Nat. Haz. Risk. 2019, 10, 271–286. [Google Scholar] [CrossRef]
- Lin, Y.L.; Leng, W.M.; Yang, G.L.; Li, L.; Yang, J.S. Seismic response of embankment slopes with different reinforcing measures in shaking table tests. Nat. Haz. 2015, 76, 791–810. [Google Scholar] [CrossRef]
- Maddaloni, G.; Ryu, K.P.; Reinhorn, A.M. Simulation of floor response spectra in shake table experiments. Earthq. Eng. Struct. D. 2011, 40, 591–604. [Google Scholar] [CrossRef]
- Yu, Y.Z.; Deng, L.J.; Sun, X.; He, L. Centrifuge modeling of dynamic behavior of pile-reinforced slopes during earthquakes. J. Cent. South. Univ. Technol. 2015, 17, 1070–1078. [Google Scholar] [CrossRef]
Disclaimer/Publisher’s Note: The statements, opinions and data contained in all publications are solely those of the individual author(s) and contributor(s) and not of MDPI and/or the editor(s). MDPI and/or the editor(s) disclaim responsibility for any injury to people or property resulting from any ideas, methods, instructions or products referred to in the content. |
© 2025 by the authors. Licensee MDPI, Basel, Switzerland. This article is an open access article distributed under the terms and conditions of the Creative Commons Attribution (CC BY) license (https://creativecommons.org/licenses/by/4.0/).