Article

Research on the Bending Load-Bearing Capacity of UHPC-NC Prefabricated Hollow Composite Slabs in Cross-Section

1
College of Civil Science and Engineering, Yangzhou University, Yangzhou 225127, China
2
Jiangsu Testing Center for Quality of Construction Engineering Co., Ltd., Nanjing 210033, China
3
The Third Engineering Co., Ltd. of CCCC Fourth Harbor Engineering Co., Ltd., Zhanjiang 524005, China
*
Authors to whom correspondence should be addressed.
Buildings 2025, 15(4), 519; https://doi.org/10.3390/buildings15040519
Submission received: 10 January 2025 / Revised: 31 January 2025 / Accepted: 3 February 2025 / Published: 8 February 2025
(This article belongs to the Section Building Structures)

Abstract

This study aims to investigate the bending load-bearing capacity of precast hollow composite slabs composed of ultra-high-performance concrete (UHPC) and Normal Concrete (NC). Through finite element numerical analysis and verification, this study analyzes various key factors influencing the performance of the composite slab, including the wall thickness of the square steel tube, the diameter of transverse reinforcing bars, the thickness of the precast bottom slab, and the strength grade of the concrete. The results indicate that the use of UHPC significantly enhances the bending performance of the composite slab. As the wall thickness of the square steel tube and the strength of UHPC increase, both the yield load and ultimate load capacity of the composite slab show considerable improvement. By conducting an in-depth analysis, this study identifies different stages of the composite slab during the loading process, including the cracking stage, yielding stage, and ultimate stage, thereby providing important foundations for optimizing structural design. Furthermore, a set of bending load-bearing capacity calculation formulas applicable to UHPC-NC precast hollow composite slabs is proposed, offering practical tools and theoretical support for engineering design and analysis. The innovation of this study lies not only in providing a profound understanding of the application of composite materials in architectural design but also in offering feasible solutions to the energy efficiency and safety challenges faced by the construction industry in the future. This research demonstrates the tremendous potential of ultra-high-performance concrete and its combinations in modern architecture, contributing to the sustainable development of construction technology.

1. Introduction

The rapid development of the global construction industry presents significant challenges to traditional building methods. Many conventional designs often neglect energy efficiency and sustainability, failing to consider the effective utilization of resources [1,2]. Consequently, this oversight results in excessive energy consumption and substantial carbon emissions during the lifespan of these buildings, placing an additional burden on the environment. Furthermore, traditional construction typically employs non-environmentally friendly materials and outdated techniques, which exacerbate high energy consumption and contribute to considerable carbon footprints on construction sites. Additionally, traditional design models tend to be relatively inflexible, lacking the adaptability and innovation necessary to address the rapidly evolving demands of contemporary society and technological advancements [3,4]. In response to these challenges, prefabricated construction has emerged as a promising alternative, garnering increasing attention. This method employs factory-produced components that facilitate rapid assembly on-site, significantly reducing construction timelines while enhancing component quality control in the manufacturing phase [5,6]. Consequently, prefabricated buildings improve construction quality and efficiency, positioning themselves as a viable solution to the array of challenges posed by traditional building practices.
The composite slab is a crucial building component that plays an essential role in prefabricated construction. It exhibits high strength, excellent integrity, and a significant degree of prefabrication [7,8,9], making it extensively utilized in various construction projects, particularly in scenarios requiring substantial lateral load resistance. As a horizontal element, the composite slab not only enhances the structural stability of buildings but also accelerates construction processes and improves economic efficiency. The fundamental components of the composite slab consist of a prefabricated base slab, a concrete topping layer, and an embedded steel reinforcement framework. The incorporation of a prefabricated base slab effectively reduces construction time while enhancing quality; the concrete topping layer further bolsters the integrity and load-bearing capacity of the component; and the embedded steel reinforcement framework significantly increases the tensile strength of the composite slab, thereby enhancing its overall structural performance.
Despite the advancements in composite slab technology, several shortcomings persist. In terms of flexural performance, particularly in the design of large-span structures, the flexural capacity of composite slabs often fails to meet the requisite engineering standards. Due to their structural form and material characteristics, composite slabs struggle to withstand increased bending stresses as span lengths increase, resulting in excessive deflection. This limitation curtails their applicability in projects requiring significant spans. In comparison to ideal floor structures, composite slabs demonstrate relatively inadequate flexural stiffness. When subjected to loads, they are often unable to effectively resist bending deformation, which compromises the overall stability of the structure. From an economic perspective, the design and construction of reinforced truss composite slabs entail substantial steel consumption. The extensive use of steel not only inflates material costs, which constitute a significant portion of building project expenditures but also diminishes the project’s competitiveness. Increased steel consumption corresponds to greater component weight, introducing numerous practical challenges during construction. These challenges include the need for larger equipment and additional manpower for handling and lifting, thereby increasing construction complexity and duration, and placing higher load-bearing demands on structural elements, such as foundations. This ultimately contributes to elevated foundational infrastructure costs. Regarding stability and safety, reinforced truss composite slabs exhibit considerable instability risks during load transfer. Due to their structural characteristics and force mechanisms, localized or global instability can easily manifest when loads reach critical levels or are unevenly distributed, potentially initiating a chain reaction within the structure that poses significant threats to the safety of the entire construction project. Furthermore, the tensile strength of composite slabs is relatively low, rendering them susceptible to cracking under typical or extreme loads. Such cracks not only detract from the aesthetic quality of the structure but, more critically, impair its durability and waterproofing. Harmful agents, such as moisture, can infiltrate through these fissures, leading to the corrosion of materials like reinforcing steel, thereby accelerating structural degradation and severely compromising safety and longevity. Consequently, this paper aims to address the limitations of existing methods by harnessing the advantages of material combinations and innovative designs for the reinforcing framework, thereby ensuring the effective application of composite slabs in future construction projects. Researchers must delve into the design, material selection, and construction processes of composite slabs to confront current challenges and enhance their overall performance.
In the contemporary construction industry, the selection of materials and structural design significantly influences both the safety and economic viability of projects. Accordingly, this paper presents an innovative methodology that employs ultra-high-performance concrete (UHPC) for the casting of precast slabs, while utilizing Normal Concrete (NC) for the on-site casting layer. This approach aims to enhance the overall performance of the structure by rationally combining different materials to maximize their respective advantages.
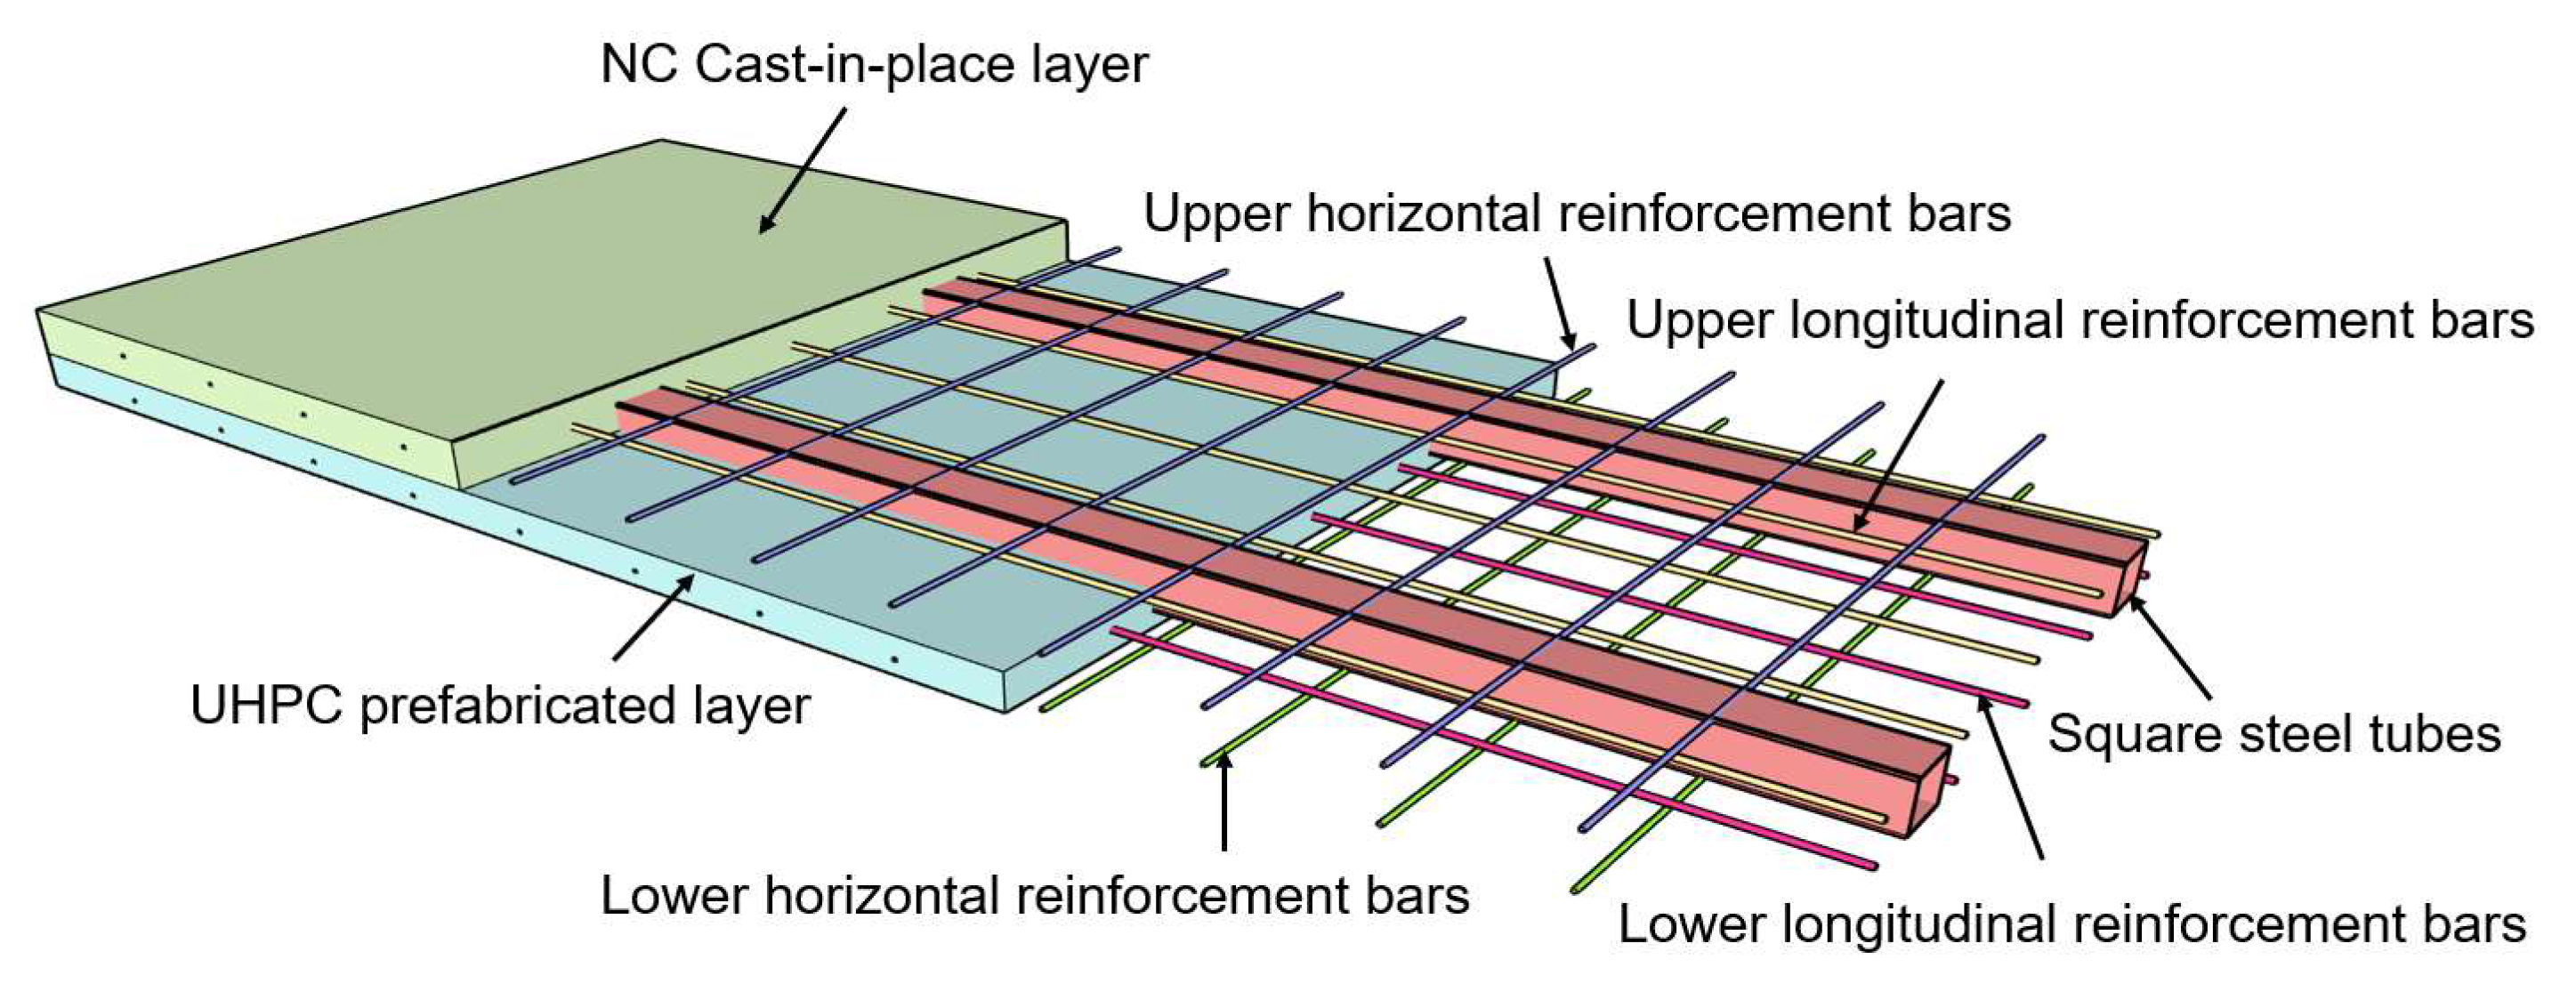
Initially, a steel reinforcement framework consisting of square steel tubes, longitudinal rebars, and transverse rebars was constructed. The welding of the steel pipes and rebars resulted in a monolithic structure that enhanced the firmness of the connection points and overall stability. The use of welding simplifies on-site connections and increases construction efficiency. As welding can be performed indoors, only minimal assembly is required on-site, significantly reducing construction time. Compared to mechanical connections, welded connections exhibit superior tensile and shear capacities, effectively resisting external loads. Furthermore, the compact nature of the welded connection structure facilitates inspection and repair during subsequent maintenance, thereby ensuring long-term safety. This reinforcement framework, coupled with UHPC and NC, creates a prefabricated hollow composite slab, as illustrated in Figure 1. UHPC, characterized by its exceptionally high tensile strength, contributes outstanding toughness and stability to the composite slab, effectively mitigating the risk of cracking during transportation and construction. This enhancement not only preserves the integrity of the structure but also significantly prolongs its expected service life.
In the context of material selection, square steel pipes represent a primary alternative to traditional reinforcement bars. This approach not only reduces overall steel consumption but also effectively mitigates the instability issues associated with upper chord reinforcement during the construction process. Such innovative design strategies simplify and enhance construction efficiency while also decreasing project costs. Furthermore, the newly developed prefabricated hollow composite slabs exhibit superior bending performance compared to conventional materials, making them a more reliable solution for large-span structures. This performance advantage is particularly significant in modern architecture, especially in the design and construction of high-rise buildings and expansive public facilities. The amalgamation of UHPC and square steel pipes not only substantially improves the structural integrity of the composite slabs but also enhances construction efficiency. This novel design framework provides effective solutions to various challenges currently confronting the construction industry, aligning seamlessly with the modern demands of large-span structures and underscoring the substantial potential for future architectural advancements.
In recent years, researchers have investigated the utilization of steel tubes in concrete structures, focusing on the synergistic effects of steel tubes and concrete in enhancing component performance. Nie et al. [10] explored a method for filling steel tubes with concrete. The collaboration between these two materials significantly increases their efficiency, rendering them particularly suitable for concrete slab applications. Jia et al. [11] found that embedding steel plates within concrete slabs can greatly improve their shear performance, especially in shear walls of high-rise buildings. Furthermore, Wang et al. [12] examined a dual-layer pipe component composed of carbon steel, concrete, and stainless steel, designed for submarine pipelines. This configuration allows the steel tube to function synergistically with the concrete, thereby enhancing overall performance. Nakahara et al. [13] tested concrete-filled steel tube (CFST) structures. The load–deformation relationship obtained from the tests was well tracked through three-dimensional finite element analysis.
UHPC, recognized for its exceptional durability and significantly enhanced compressive and tensile strengths compared to conventional concrete, has received considerable attention and application in construction engineering. Its potential is especially prominent in the design and manufacturing of precast components. Researchers have increasingly acknowledged that leveraging the high tensile performance of UHPC can substantially improve the structural performance of composite slabs, thus elevating their overall tensile capacity. A study by Qasim et al. [14] demonstrates that implementing a UHPC layer on the surface of reinforced concrete components can markedly enhance their flexural strength. Zhu et al. [15] proposed a coating technique for applying a UHPC layer to the surfaces of damaged reinforced concrete slabs, effectively increasing their flexural load-bearing capacity. Xue et al. [16] utilized UHPC in load-bearing components, joints, and composite layers of bridge surfaces in bridge engineering, revealing that UHPC can significantly lower the construction costs of steel–concrete composite bridges. Additionally, Abo El-Khier et al. [17] introduced a methodology for connecting precast concrete slabs to steel beams using UHPC, achieving full composite action. Wang et al. [18] examined the bonding characteristics between UHPC and ordinary concrete, which is crucial for the effective application of UHPC–ordinary concrete composite slabs. The study conducted by Momeni et al. [19] indicates that the utilization of UHPC can substantially enhance the performance of panels, modify their failure modes, and thus improve their overall structural integrity when subjected to high strain conditions.
In recent years, the application of UHPC in construction materials has garnered significant attention within the field of building materials research. Although extensive studies have been conducted on the properties and applications of UHPC in various concrete components, research on composite structures incorporating steel tubes and UHPC remains relatively scarce. This area demands further exploration to fully harness the exceptional performance of UHPC. Currently, a systematic and comprehensive investigation into the factors influencing the mechanical properties of composite slabs with integrated steel tube frameworks is lacking. This deficiency has resulted in incomplete design references and calculation formulas. To address this gap, this paper establishes a finite element numerical model for prefabricated hollow composite slabs made of UHPC and NC. Following the development of the model, experimental validation confirmed its accuracy, thereby enhancing the reliability and applicability of the research findings.
This study specifically examines the influence of several key factors on the bending performance of composite slabs. These factors include the wall thickness of square steel tubes, the diameter of transverse reinforcement bars, the thickness of prefabricated bottom plates, and the strength class of concrete, among others. An in-depth analysis of these factors enhances the understanding of their actual effects on the performance of composite slabs, thereby providing a scientific basis for future design and applications. Furthermore, a set of applicable formulas for calculating the positive section bending load capacity of UHPC-NC prefabricated hollow composite slabs has been proposed. These formulas not only offer theoretical support for the design of composite slabs but also facilitate structural analysis and optimization in practical applications.
This research comprehensively examines the limitations of conventional composite slab designs and introduces an innovative design scheme that integrates UHPC with steel tubes for prefabricated hollow composite slabs. This integration maximizes the exceptional properties of UHPC, significantly improving the bending stiffness and overall structural safety of the composite slabs, thus fulfilling contemporary architectural requirements for high-strength and large-span structures. Additionally, this paper not only presents novel design concepts derived from systematic investigations of various material combinations but also offers practical calculation formulas and foundational principles for engineering applications. This innovation addresses prevailing challenges in the construction industry, including energy consumption, cost efficiency, and safety, while paving the way for new avenues in architectural design and material applications, thereby possessing both substantial theoretical and practical significance. Consequently, the primary innovation of this study is the enhancement of performance and practicality in prefabricated buildings through material innovation and structural optimization, providing viable solutions for the sustainable evolution of the construction industry.

2. Numerical Model of UHPC-NC Prefabricated Hollow Composite Slab

2.1. Constitutive Relationship

This study constructed a numerical model of UHPC-NC prefabricated hollow composite slabs using the general finite element analysis software ABAQUS 2022, providing a numerical simulation basis for evaluating the load-bearing capacity of such slabs under bending loads. The plastic damage model (CDP) provided in ABAQUS serves as the basis for the material model. This model effectively describes the nonlinear behavior and damage evolution that concrete undergoes during loading. Specifically, the uniaxial compressive and tensile stress–strain relationships for UHPC are based on the constitutive model proposed by Zheng [20]. Zheng’s model, validated by experimental data, accurately reflects the stress–strain characteristics of ultra-high-performance concrete under extreme conditions, providing a reliable theoretical basis for the application of the model. This model is suitable for UHPC with a strength of C100 and above and incorporates steel fibers, maintaining tensile stress upon cracking due to the presence of steel fibers. When calculating the nominal section bearing capacity of the composite slab, the contribution of tensile stress of UHPC needs to be considered, as detailed in Equations (1) and (2). Wang [21] applied this constitutive model to analyze the bending performance of steel box ultra-high-performance concrete beams, with the simulation results fitting well with the experimental results. Ji [22] employed the constitutive model for the bending performance study of rectangular section steel ultra-high-performance concrete beams, achieving similarly favorable results. On the other hand, for ordinary concrete, the constitutive model used originates from Guo’s [23] double-parameter model, which is suitable for ordinary concrete with strengths ranging from C20 to C40, as detailed in Equations (3) and (4). This model has been validated by extensive experimental data and is applicable for describing the mechanical behavior of ordinary concrete under various loading conditions, demonstrating good applicability and accuracy. Rong et al. [24] applied this constitutive model in the study of the load-bearing performance of prefabricated high-strength reinforced concrete frame joints, while Li et al. [25] adopted an improved constitutive model for the protective layer concrete in the study of unified equations for confined concrete compressive stress–strain curves, both aligning well with the experimental results. Furthermore, a bilinear model was used for the stress–strain relationship of reinforcement and steel, simplifying the complex mechanical behaviors of reinforcements and steel, thus reflecting their strength and ductility under different loading states more intuitively in numerical simulations. The UHPC and ordinary concrete material models selected for this study integrate various known constitutive models, allowing for a more accurate description of material mechanical behavior under different conditions, providing scientific support for subsequent engineering applications, and offering crucial references for the optimization and design of material performance. The symbols in Equations (1)–(4) are illustrated in numbers 1–11 in Nomenclature.
σ Uc / f Uc = 1.55 ε Uc / ε Uc 0 1.20 ε Uc / ε Uc 0 4 + 0.65 ε Uc / ε Uc 0 5 0 ε Uc / ε Uc 0 < 1 ε Uc / ε Uc 0 / 6 ε Uc / ε Uc 0 1 2 + ε Uc / ε Uc 0 ε Uc / ε Uc 0 1
σ Ut / f Ut = 1.17 ε Ut / ε Ut 0 + 0.65 ε Ut / ε Ut 0 2 0.83 ε Ut / ε Ut 0 3 0 ε Ut / ε Ut 0 < 1 ε Ut / ε Ut 0 / 5.5 ε Ut / ε Ut 0 - 1 2.2 + ε Ut / ε Ut 0 ε Ut / ε Ut 0 1
σ c / f c = α ε c / ε 0 + ( 3 2 α ) ε c / ε 0 2 + ( α 2 ) ε c / ε 0 3                                                         ε c < ε 0 ε c / ε 0 / β ε c / ε 0 1 2 + ε c / ε 0                                                         ε c ε 0
σ t / f t = 1.2 ε t / ε t 0 0.2 ε t / ε t 0 6           ε t < ε t 0 ε t / ε t 0 / γ ε t / ε t 0 1 1.7 + ε t / ε t 0           ε t ε t 0
In the study of concrete damage plasticity models, a range of constitutive computational parameters has been proposed, which are essential for the model’s effectiveness and accuracy. The primary constitutive parameters of the concrete damage plasticity model include the dilation angle Ψ, the flow potential offset ζ, the ratio of biaxial ultimate compressive strength to uniaxial ultimate strength (fb0/fc0), and the ratio Kc of the second stress invariants in tension and compression meridians. These parameters not only encapsulate the mechanical properties of concrete under various states but also directly influence the shape of the flow potential function and the formation of the yield surface. In practical applications, considering the viscosity coefficient μ is crucial for addressing convergence issues within the model. Given that concrete materials often face computational convergence challenges during softening and stiffness degradation processes, the appropriate selection of the viscosity coefficient μ becomes particularly important. The literature [26] indicates that a viscosity coefficient of 0.005 typically yields optimal results. To analyze the effects of varying viscosity coefficients on simulation outcomes, Figure 2 presents the load–displacement curves of the structure with viscosity coefficients set to 0.004, 0.005, and 0.006. The results reveal that a high viscosity coefficient leads to a more rigid structural behavior, whereas a low coefficient renders the analysis increasingly challenging to converge. To ensure calculation accuracy, a viscosity coefficient of 0.005 is determined to be the most compatible with the experimental curve. Consequently, this paper adopts a viscosity coefficient of 0.005 for the finite element model, thereby enhancing the convergence rate of the softening segment and ultimately improving computational efficiency.
Overall, the effective application of the CDP model requires careful setting of a series of parameters, particularly the rational selection of the viscosity coefficient. Only through a reasonable configuration of parameters can the model ensure both efficiency and accuracy in practical computations. The magnitude of the expansion angle directly reflects the expansion capacity of concrete materials; a larger expansion angle typically indicates a stronger expansion capacity, which helps improve the convergence of numerical calculations. The range of the expansion angle is between 30 and 35, while the eccentricity is set to 0.1 based on the software’s default settings, indicating that the variation in the expansion angle of concrete remains small under a wide range of confining pressure conditions. The model assumes that the uniaxial tensile and compressive responses of concrete are characterized by damage plasticity. The CDP model uses fb0/fc0 and K parameters to describe how to extend from uniaxial parameters to biaxial. From the biaxial loading characteristics obtained through experiments, under a biaxial tensile stress state, there is no significant change in biaxial tensile strength compared to uniaxial tensile strength. In a state of one-way compression and one-way tension, the compressive strength gradually decreases with increasing tensile stress (tensile–compression softening effect). When concrete is subjected to biaxial compression, its compressive strength is higher than that of uniaxial compressive strength (strength enhancement effect), about 16% under biaxial isostatic conditions. Therefore, without altering the existing characteristics of concrete, the value of fb0/fc0 is taken as 1 + 16%, suggesting a recommended value of 1.16. K (with a recommended value of K = 2/3) represents the case where the maximum principal stress is negative; for any given initial yield point at constant pressure, the ratio of the second stress invariant on the tensile meridian to that on the compressive meridian must satisfy 0.5 < K < 1.0. Specific details for setting the relevant parameters can be found in Table 1, ensuring the scientific and effective implementation of the model.

2.2. Finite Element Model

This study constructed a finite element model of a prefabricated hollow composite slab made from UHPC and NC, aiming to conduct a detailed analysis of its mechanical properties, as illustrated in Figure 3. In the model, UHPC, NC, and square steel tubes are represented using three-dimensional solid elements C3D8R, while the reinforcement is modeled with spatial truss elements T3D2. This design enhances the model’s ability to accurately simulate the behavior of the actual structure. The C3D8R element is a linear reduced integration element specifically designed for handling complex three-dimensional solid models. Its main advantage lies in the improvement of computational efficiency, as the reduced number of integration points significantly decreases computation time and resource consumption, which is particularly important for large model analyses. Moreover, the C3D8R element performs excellently when addressing nonlinear problems with large deformations. It adapts well to the deformations of concrete components under loading, capturing the physical characteristics of the material under complex behavior. Another notable advantage is that the C3D8R element effectively prevents the phenomenon of shear locking. Shear locking is a common numerical issue that can lead to inaccurate simulations, and the reduced integration technique used in the C3D8R element significantly reduces the occurrence of this phenomenon. This feature is particularly important when simulating concrete slabs, as the interaction between concrete and mechanical behavior is often complex and unpredictable. On the other hand, the T3D2 element is a linear three-dimensional beam element suitable for modeling one-dimensional components like reinforcement bars. Its advantage lies in its accuracy, which allows for precise simulation of the physical characteristics of reinforcement under tension and compression, thus ensuring a good bond with concrete. The T3D2 element effectively captures the mechanical behavior of reinforcement within concrete, ensuring the reliability of structural analysis. At the same time, compared to other types of solid elements, the use of the T3D2 element greatly reduces computational complexity and resource demands, which is crucial for large model analyses. The T3D2 element connects well with the C3D8R element, forming a complex interaction network between reinforcement and concrete, thereby providing highly accurate simulation results. In summary, the combination of using C3D8R elements for simulating cushions, precast slabs, and cast-in-place layers alongside T3D2 elements for reinforcement truss simulation has significant advantages in computational efficiency and accuracy. The reduced integration characteristics of the C3D8R element enhance its ability to capture the nonlinear behavior of concrete materials, while the T3D2 element ensures precise simulation of the interaction between reinforcement and concrete. Such a combination guarantees that high-precision mechanical analyses can still be conducted with limited computational resources, supporting the design and optimization of concrete slab components.
Composite slab bending components are an essential part of modern structural engineering, typically consisting of prefabricated base slabs and cast-in-place layers, with the interface between the two referred to as the composite interface. This interface plays a crucial role in the mechanical performance of the structure and is key to the interaction between the prefabricated and cast-in-place layers. The interface of such components can be divided into three main levels: the diffusion layer, the strong effect layer, and the weak effect layer. The diffusion layer is located at the contact surface between the prefabricated layer and the cast-in-place layer, primarily formed by hydration products, whose structural characteristics significantly influence the overall bonding performance. The strong effect layer is responsible for bearing large shear forces, and its strong adhesion is due to the mechanical interlocking forces between hydration products, thereby enhancing the load-bearing capacity of the slab. The weak effect layer is situated at the outermost layer of the interface, possessing weaker load-bearing capabilities primarily due to the presence of microcracks and irregular bonding interfaces. Traditional macroscopic mechanical analysis methods often become complex and limited when studying the stress performance of composite interfaces; therefore, it is necessary to appropriately simplify the model to facilitate in-depth analysis of its stress characteristics. Common methods of handling composite interfaces [27] are shown in Table 2. This study is based on existing finite element analysis techniques to analyze different stress analysis methods, using numerical simulations through the establishment of contact pairs in the simulation of composite slab specimens.
Contact phenomena can be divided into two main directions: normal direction contact and tangential direction adhesion slip. This classification provides a deeper understanding of how objects interact, which is especially crucial in mechanical analysis and simulation. In the design of contact elements, two main types exist: kinematic formulation (hard contact) and penalty function formulation (soft contact). Hard contact elements achieve very precise contact between objects through constraints, ensuring an orderly contact relationship and avoiding excessive closure phenomena. This means that in a hard contact model, the contact state between objects is complete; once contact is established, no penetration between objects occurs. Soft contact elements, on the other hand, employ a penalty function method akin to a layered cake, providing a certain degree of elastic response. When objects come into contact, the soft contact model allows for deformation, thereby creating local elastic effects between the contact surfaces. This configuration enables the materials to better simulate real physical behaviors during contact, such as friction and adhesion effects.
In the connection between the prefabricated UHPC slab and the cast-in-place NC layer, a hard contact model is typically used in the normal direction. This choice ensures that the contact pressure can be effectively transmitted without restriction, making it particularly suitable for engineering applications that require high stiffness and large load-bearing capacity. When the contact pressure decreases to zero or becomes negative, the contact surface automatically separates, thus removing the contact constraints at the corresponding nodes. This design not only enhances the safety and reliability of the structure but also optimizes computational performance, enabling the system to flexibly respond to changing contact conditions.
In engineering practice, a grid size of 50 mm is commonly selected, as it is suitable for various types of structural analysis. This dimension has been validated [28] and demonstrated to perform effectively under comparable conditions. While larger grid sizes can alleviate the computational burden and expedite the analysis, excessively large grids may result in insufficiently accurate outcomes. The 50 mm grid size represents a balance between computational efficiency and result accuracy, enabling the effective capture of critical features within the structure. Accordingly, the model employs a uniform global grid size of 50 mm for meshing.
Li et al. [29] conducted both three-point and four-point loading tests on concrete slabs. The results demonstrated that the load-bearing capacity of the specimens during four-point loading was greater than that observed during three-point loading. Additionally, the findings from the finite element simulations aligned with the experimental results. Consequently, this study employs the four-point loading configuration, with the left side designated as a fixed support and the right side configured as a movable support. This arrangement restricts displacement and establishes effective control conditions for subsequent analyses, thereby facilitating a more accurate simulation of the stress conditions encountered in actual applications. To mitigate the problem of excessive local stress, rigid pads are incorporated beneath the loading points and support positions, and the binding constraint (Tie) technique is implemented to manage relative sliding or separation phenomena. The implementation of Tie binding constraints effectively connects the cushion to both the precast base slab and the cast-in-place layer, ensuring that their interaction is accurately simulated during the analytical process. This constraint maintains consistent deformation and displacement between the cushion and the concrete, preventing relative slip and detachment phenomena, which simplifies contact problems. Additionally, the Tie constraint enhances the stability and efficiency of the computations.
The finite element model developed in this study ensures both the accuracy and reliability of the analysis of UHPC and NC prefabricated hollow composite slabs through appropriate treatment of contact surfaces, uniform mesh discretization, and effective loading and support strategies. This model not only serves as a reference for subsequent research but also establishes a significant theoretical foundation for design and optimization in practical engineering applications.

3. Finite Element Model Validation

To validate the rationality of the established model, this paper conducts a finite element analysis of structures closely related to the UHPC-NC prefabricated hollow-core slabs. These structures include the flexural performance study of concrete beams with built-in grouting in square steel pipe trusses, prefabricated steel–concrete composite beams, and ultra-high-performance concrete beams with high-strength steel. Firstly, these cases represent common and typical structural types in current engineering applications, effectively reflecting the performance of the design model in practical applications. Secondly, the selected cases encompass different types of steel and concrete combinations, ensuring the breadth and applicability of the model parameter validation. Finally, ample experimental data exists for these structures, providing a solid foundation for the accuracy of the finite element analysis. Therefore, these specific test cases are chosen to verify the accuracy of the model parameters, ensuring the scientific and practical nature of the design. Through comparative analysis with the corresponding experimental results, a solid theoretical basis and validity verification are provided for the numerical model of the UHPC-NC prefabricated hollow-core slab constructed in this study.

3.1. Concrete Beam with Embedded Grouted Square Steel Tube Truss

The study referenced in ref. [
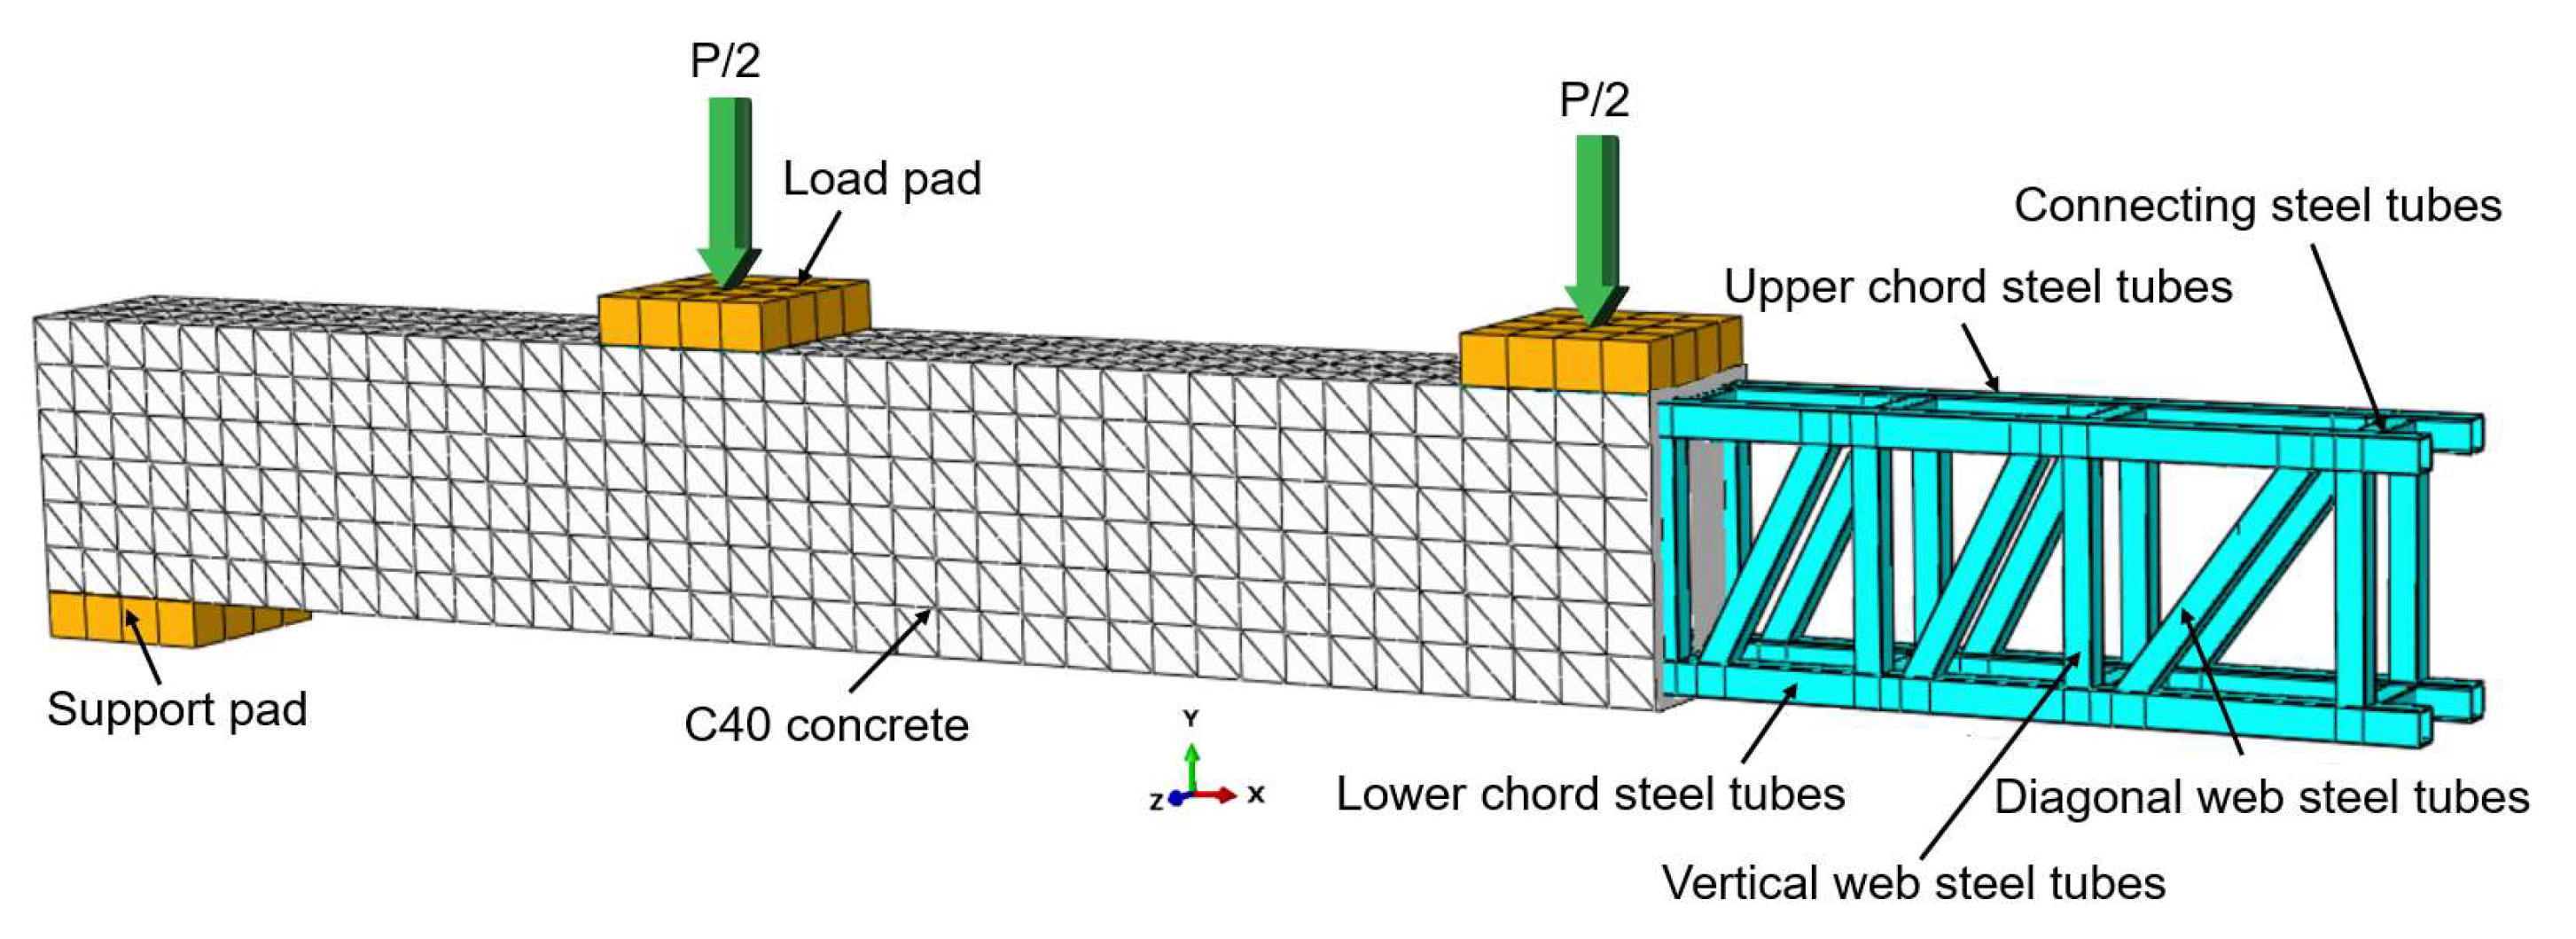
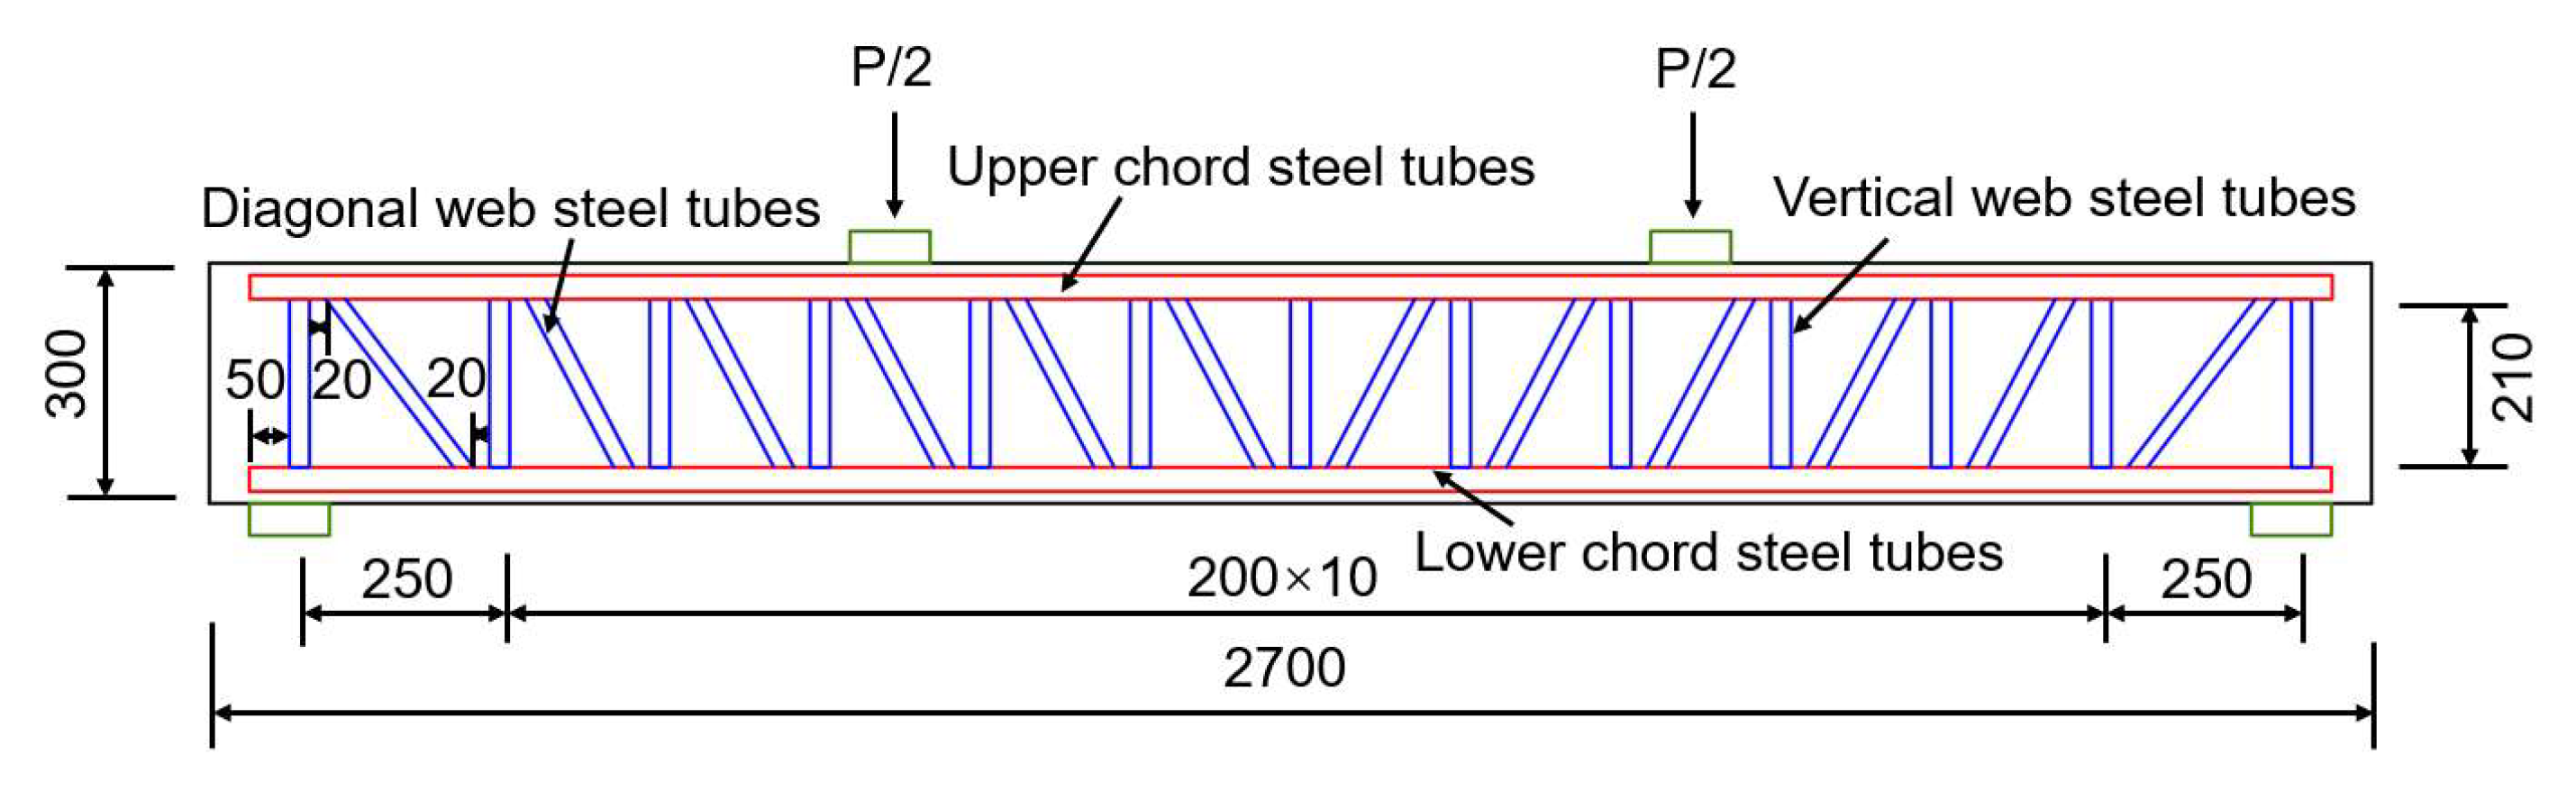
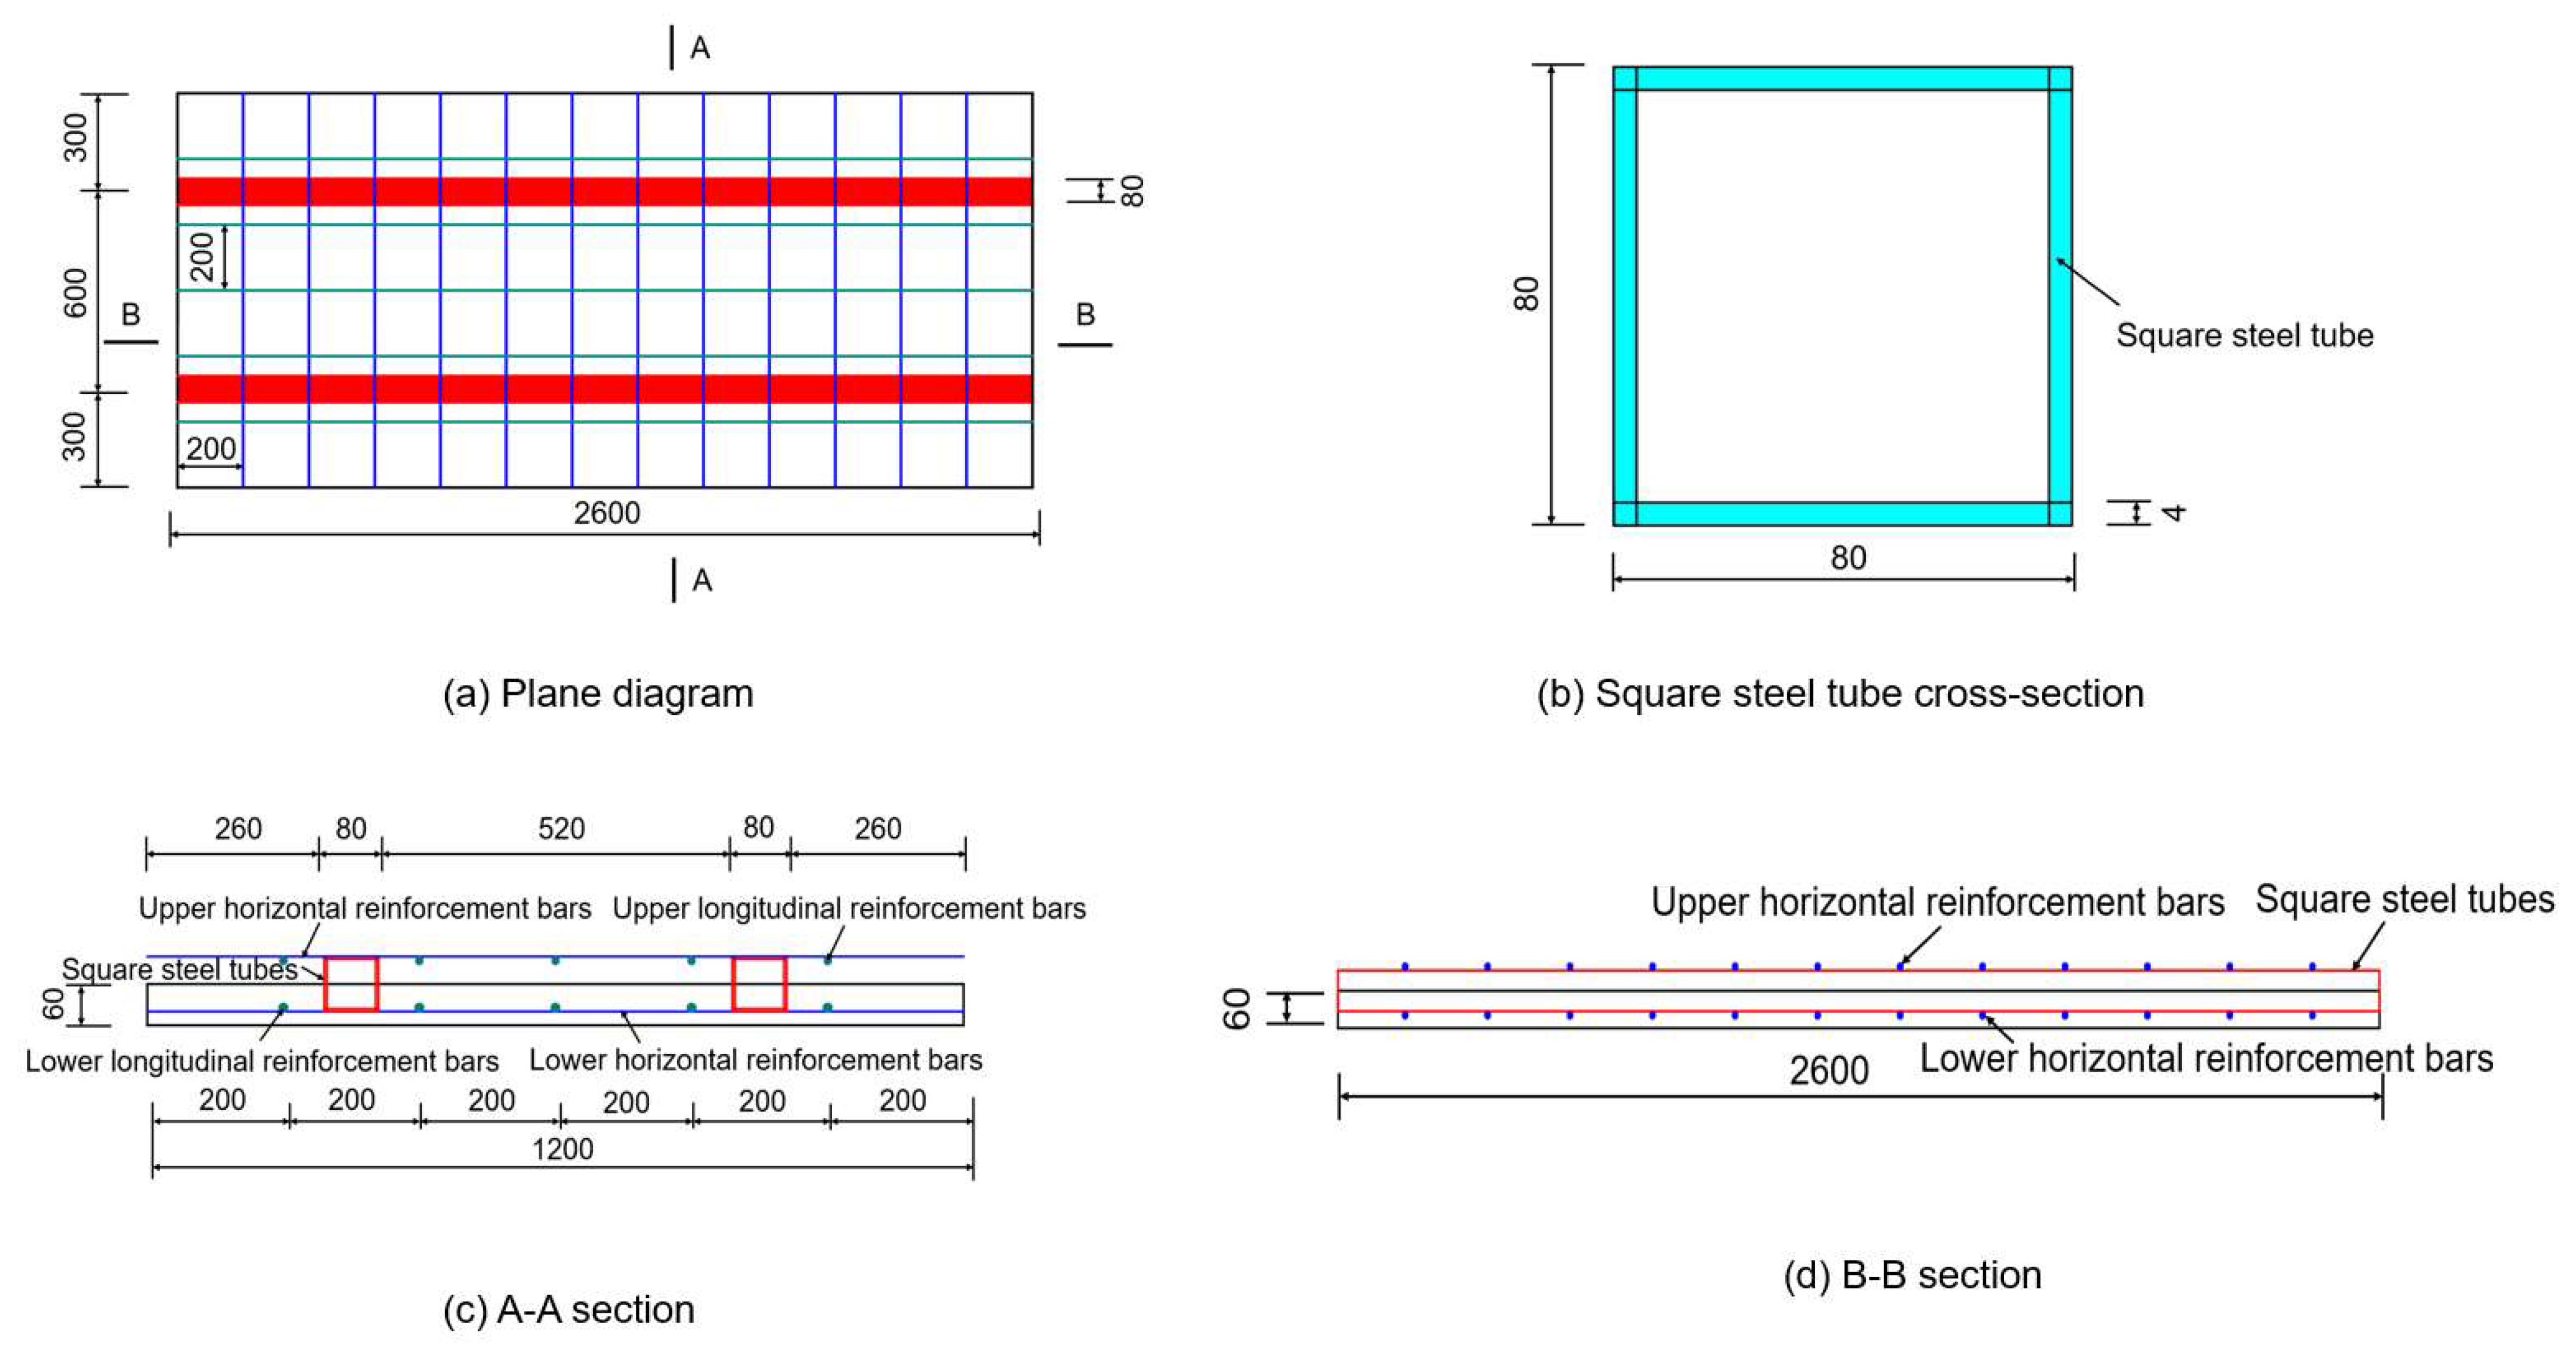
30] conducted experimental research on built-in grouted square tube truss concrete beams. Specimen B-5 was selected as the subject for finite element analysis. The three-dimensional structural diagram of specimen B-5 is depicted in Figure 4, while its specific geometric dimensions and reinforcement details are provided in Figure 5. The total length of the specimen is 2700 mm, the width is 200 mm, and the effective span is 2500 mm, with a three-point loading method applied. The center point of the bottom support block is positioned 100 mm from the lateral edge of the bottom of the beam. The thickness of the concrete protective layer surrounding the outermost square tube is 15 mm, and the overall thickness of specimen B-5 is 300 mm.
The test specimen’s material composition comprises two primary components: the upper and lower chords, both constructed from square steel tubes. The upper chord is specified as 30 mm × 30 mm with a wall thickness of 2 mm, while the lower chord also measures 30 mm × 30 mm but features a greater wall thickness of 3 mm. The web member specifications are 25 mm × 25 mm with a wall thickness of 2 mm, as are those of the connection member. This material selection ensures that the test specimen maintains substantial load-bearing capacity and stability. All square steel tubes are fabricated from Q235 grade steel, which is known for its advantageous plasticity and strength characteristics. The longitudinal square steel tubes are oriented transversely across the beam, with two located on the top and two on the bottom. The spacing between the transverse square steel tubes is 130 mm, and they are interconnected using coupling rods arranged in the transverse direction. The grout material is composed of ordinary Portland cement P.O42.5, a UEA expansion agent, an FDN high-efficiency water-reducing agent, and tap water mixed together. The water-to-cement ratio is 0.4, with the expansion agent UEA (accounting for the weight of the cement) being 7% and the water-reducing agent FDN (also accounting for the weight of the cement) being 0.7%. The cubic compressive strength is 36.3 MPa.
In this study, C40 concrete has been selected, exhibiting a measured cubic compressive strength fcu of 44.8 MPa and an elastic modulus Es of approximately 3.36 × 10⁴ MPa. Regarding the strength of the steel tubes, the measured yield strength fy of the upper chord member is 297 MPa, whereas the yield strength fy of the lower chord member is 345 MPa. The measured yield strength of the web and connecting members reaches 360 MPa, which is significantly higher. It is noteworthy that the constitutive relationship between ordinary concrete and square steel tubes discussed in this article adheres to the principles outlined in Section 2.1.
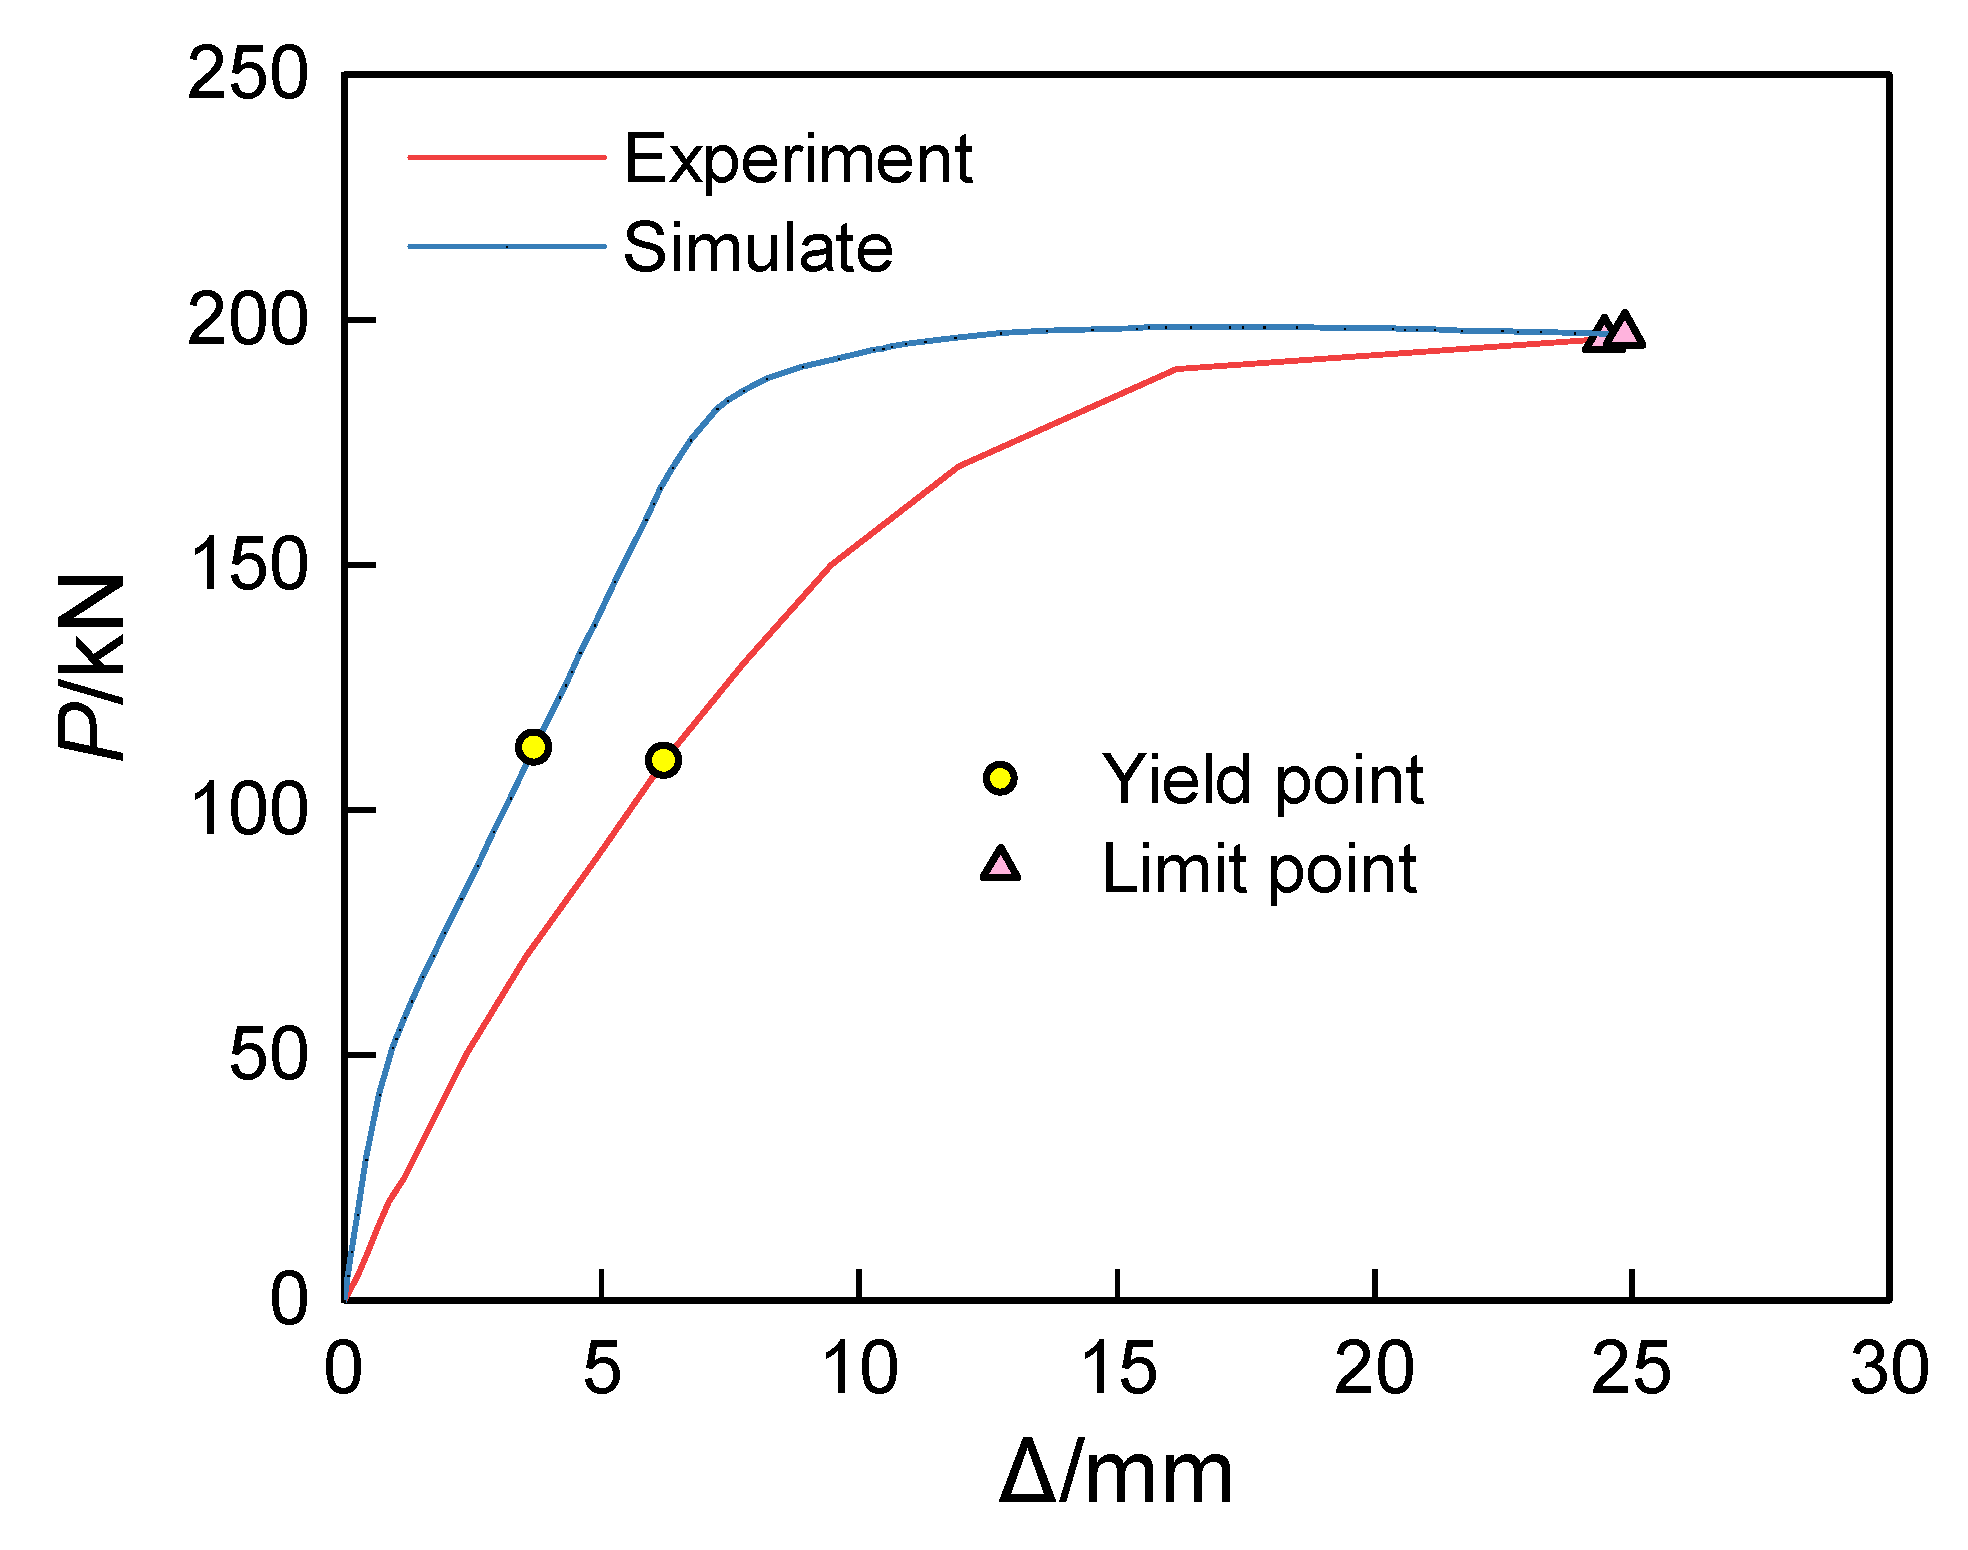
In this study, we conducted a detailed comparison between finite element simulations and experimental data, with a particular focus on the performance of the mid-span deflection–load (P − Δ) curves. Figure 6 clearly displays the results of this comparison, allowing for an intuitive analysis of the differences and similarities between the simulation and experimental results. Through experimental measurements, a yield load Pyt of 110.00 kN and a failure load Put of 196.00 kN were obtained. Meanwhile, in the finite element simulation, the yield load PyFE was 112.65 kN and the ultimate load PuFE was 197.10 kN. Further analysis shows that in the comparison of yield points between the experimental and simulation results, the ratio of experimental value to simulated value is approximately 0.98, with a deviation percentage of 2.41%; at the ultimate state, the ratio approaches 0.99, with a deviation percentage of 0.56%, indicating a strong convergence between the two. This suggests that the (P − Δ) curve obtained via the finite element method can accurately reflect the response characteristics of real components, successfully validating the accuracy and reliability of the constructed finite element model. The analysis confirms that the concrete beam of the square steel tube truss with grouted chord tubes mainly experiences the following four stages during vertical loading: (1) Elastic stage: Before the concrete cracks, the mid-span deflection shows a nearly linear change with the vertical load. (2) Cracked working stage: After cracks occur in the lower part of the concrete at the mid-span of the test beam, the (P − Δ) curve of the test beam gradually deviates from the linear line. Due to the influence of the embedded square steel tube truss, the loading stiffness of the test beam slightly decreases after cracking. (3) Steel tube yield stage: When the lower edge of the lower chord steel tube of the test beam shows tensile yielding, the (P − Δ) curve begins to deviate significantly from the linear line, exhibiting a certain degree of inflection, and the loading stiffness further decreases. (4) Failure stage: When the lower chord steel tube of the test beam fully yields under tension, further loading results in a significant deflection of the (P − Δ) curve. As the vertical load increases, the stiffness of the composite beam decreases markedly, and the mid-span deformation increases sharply.

3.2. Prefabricated Steel-Concrete Beam
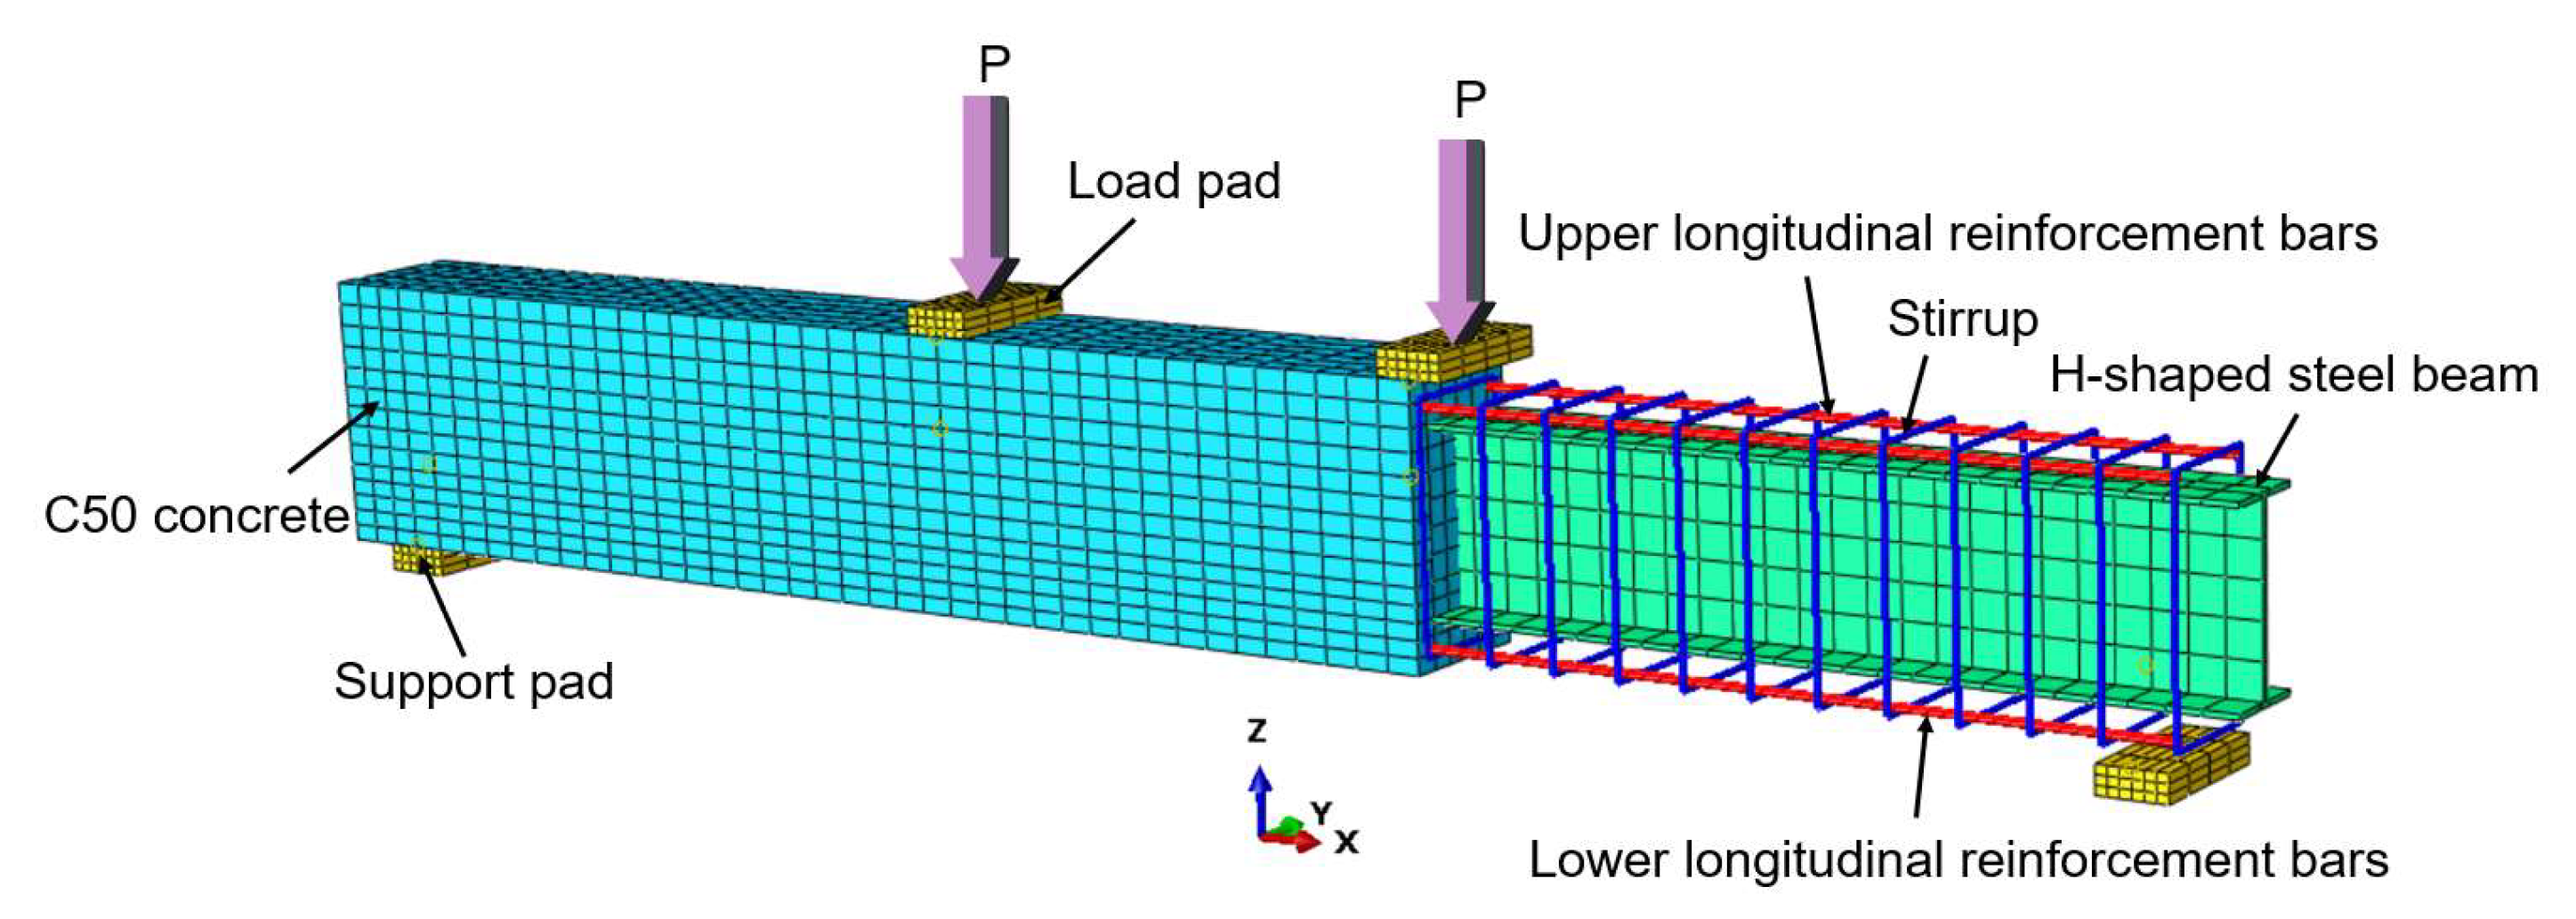
The literature [
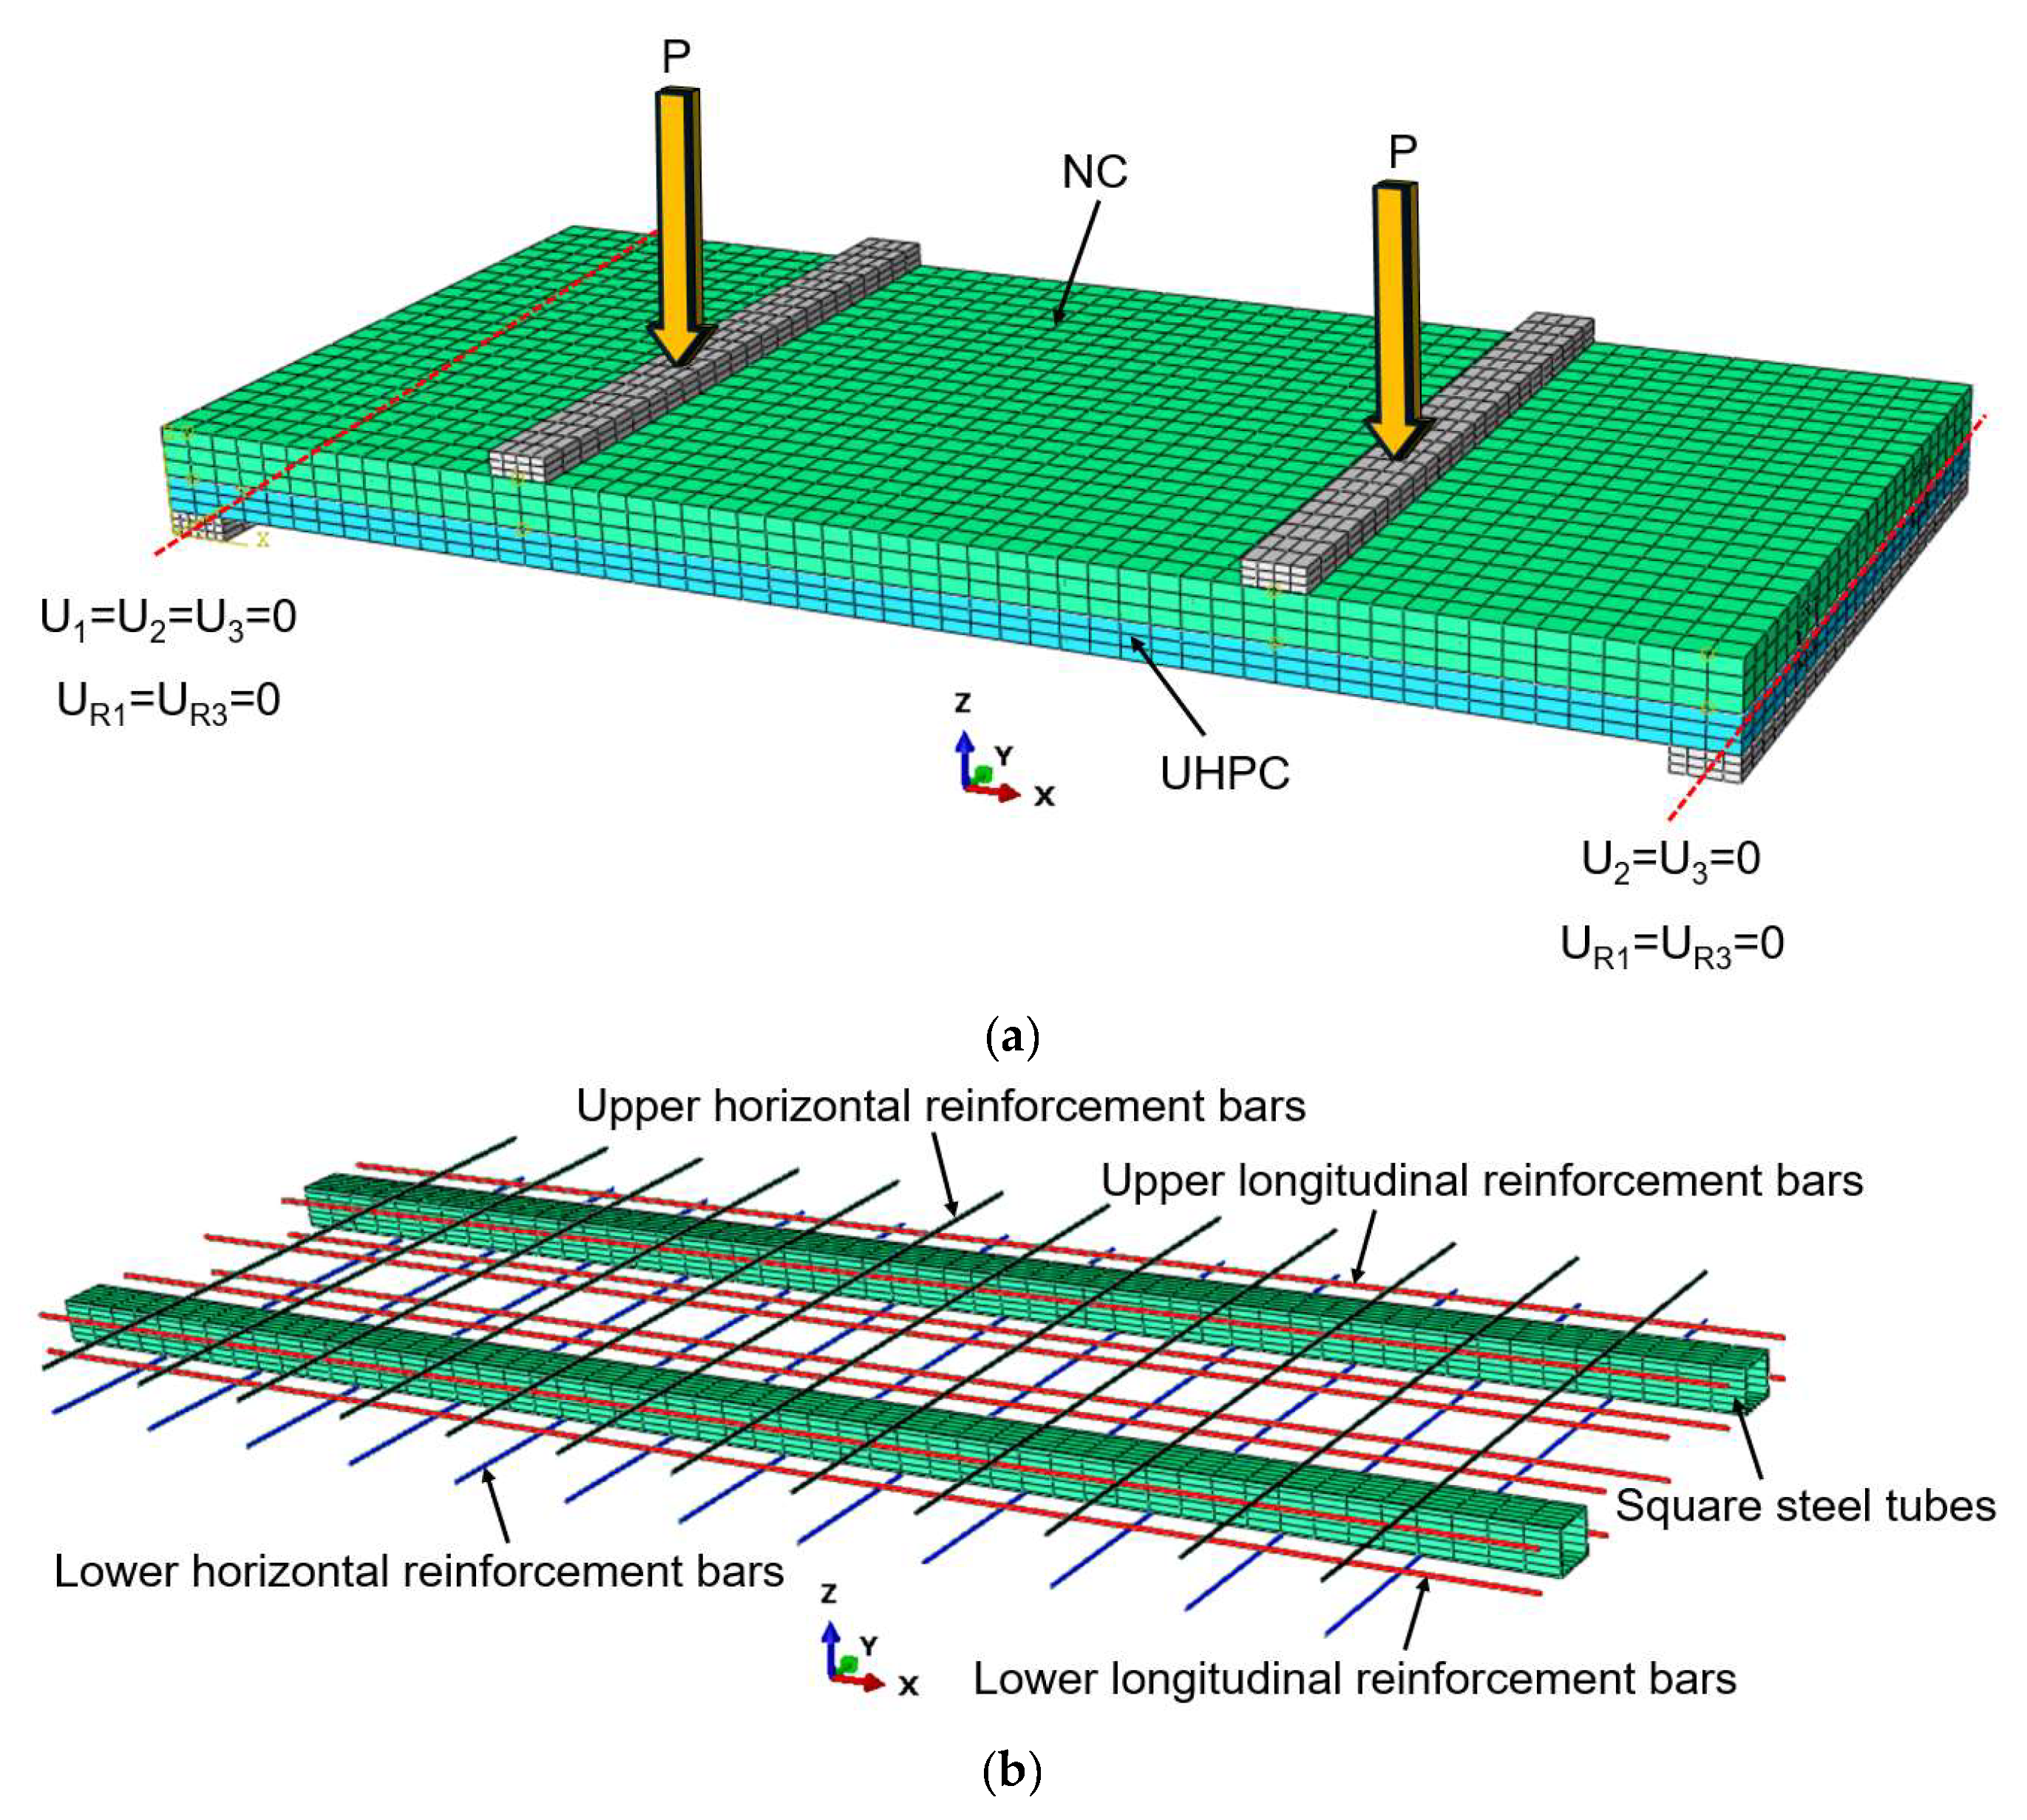
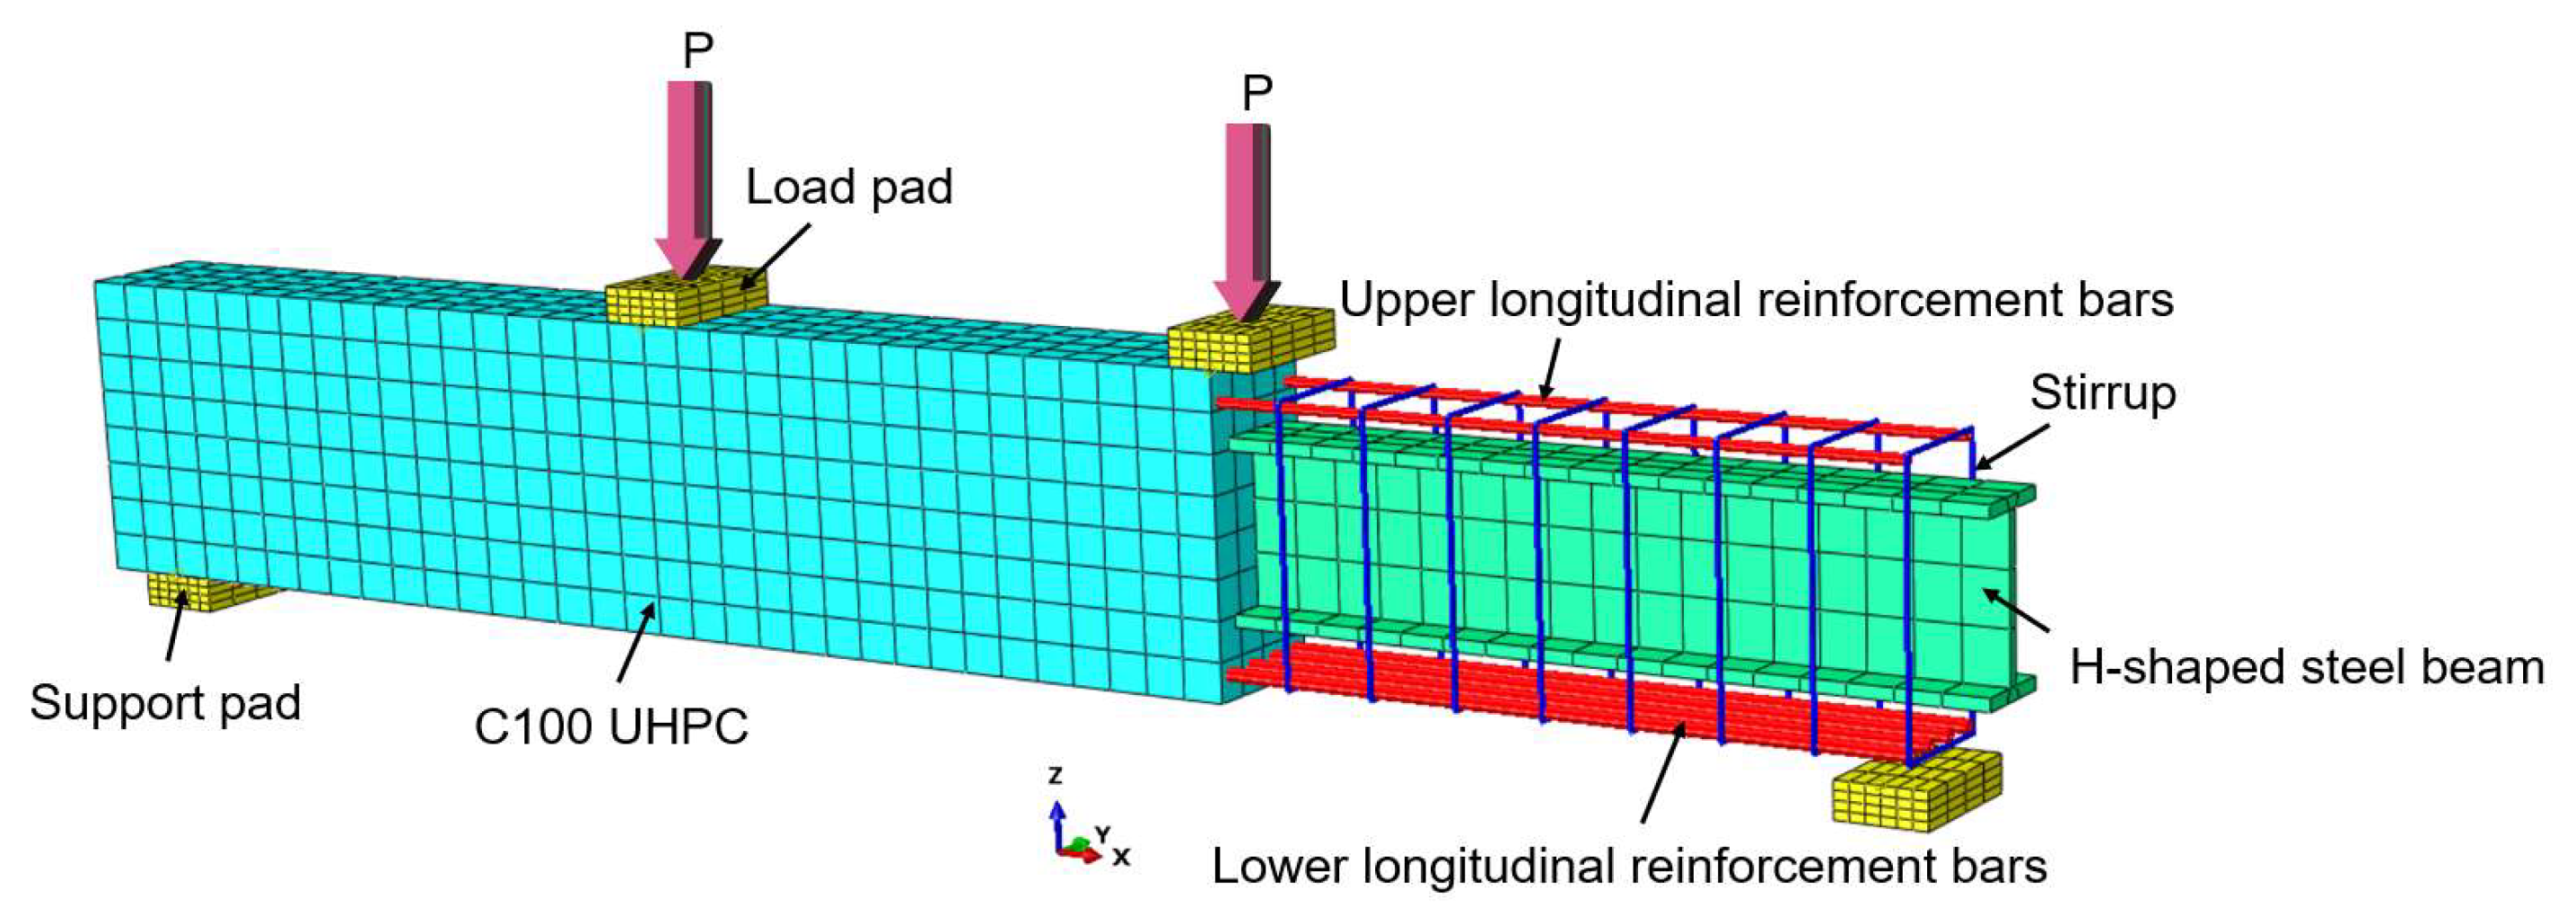
31] presents experimental research on prefabricated steel–concrete beams, with specimen RSPB-1-1 selected as the validation object for finite element analysis. The three-dimensional structural schematic of this specimen is illustrated in 
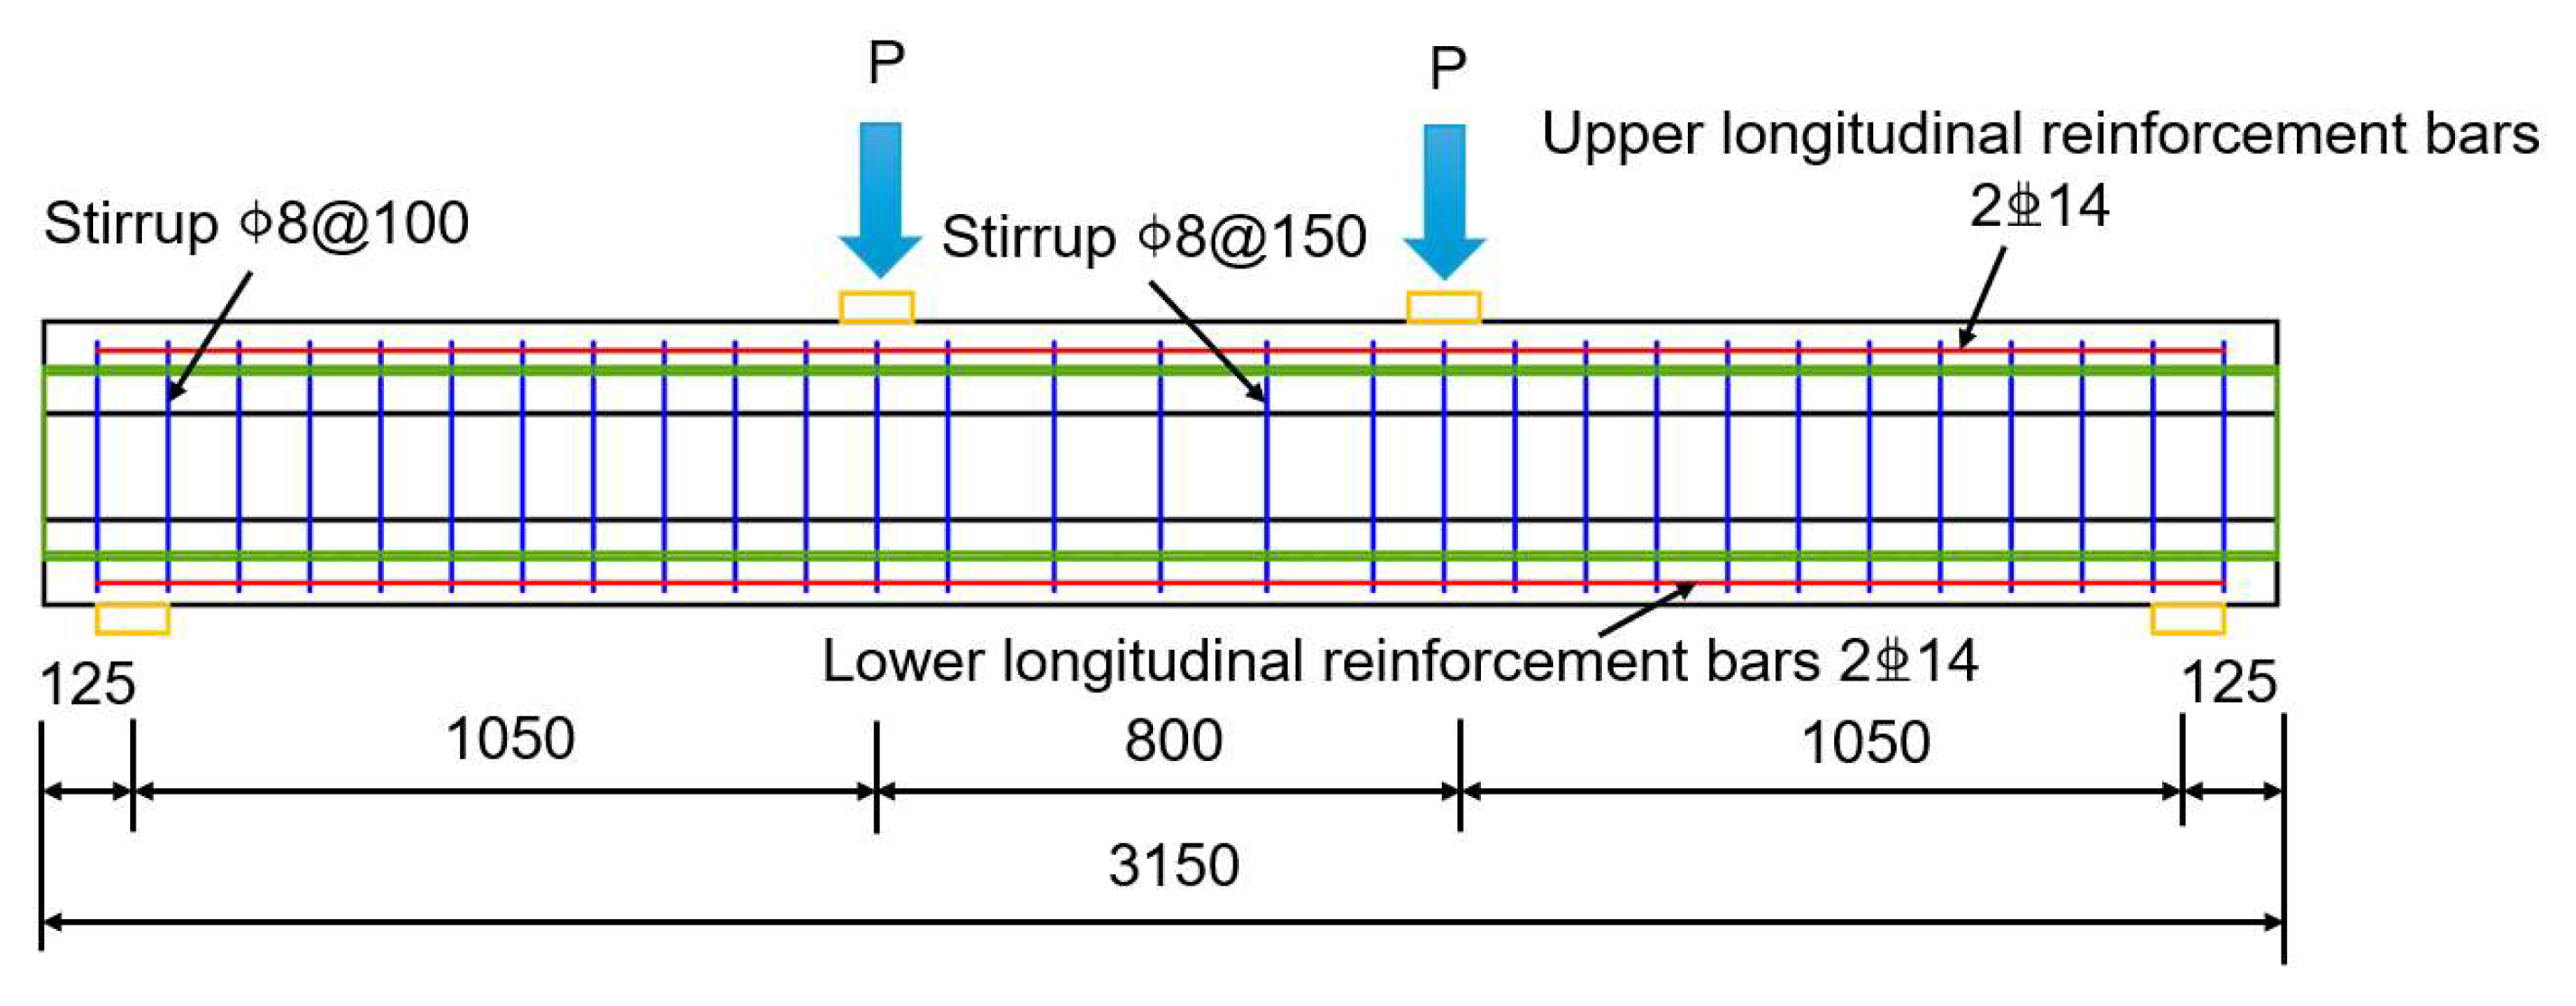
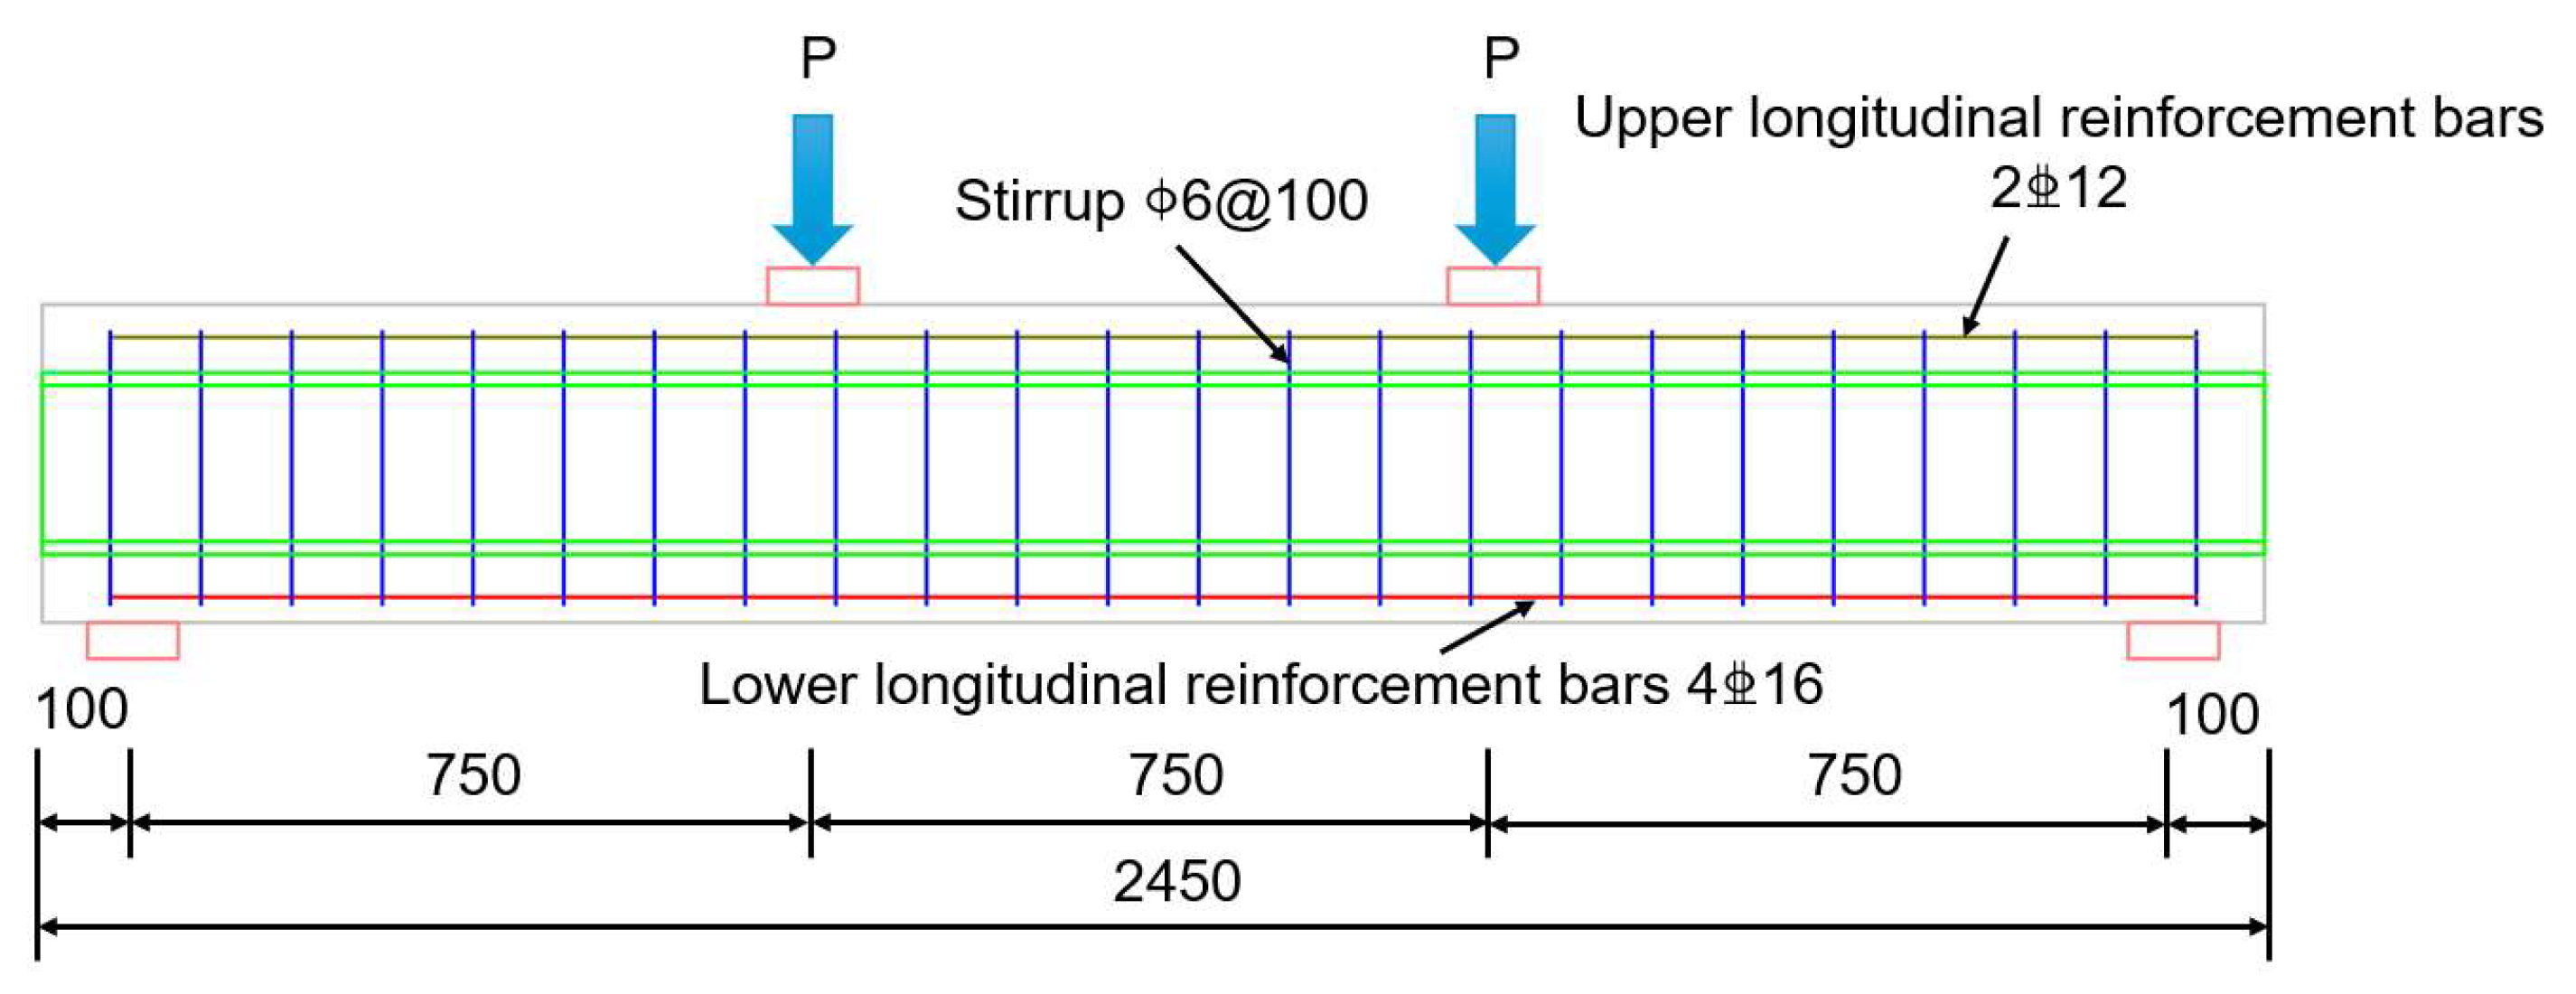
Figure 7, while detailed information regarding the elevation view and cross-sectional dimensions is provided in
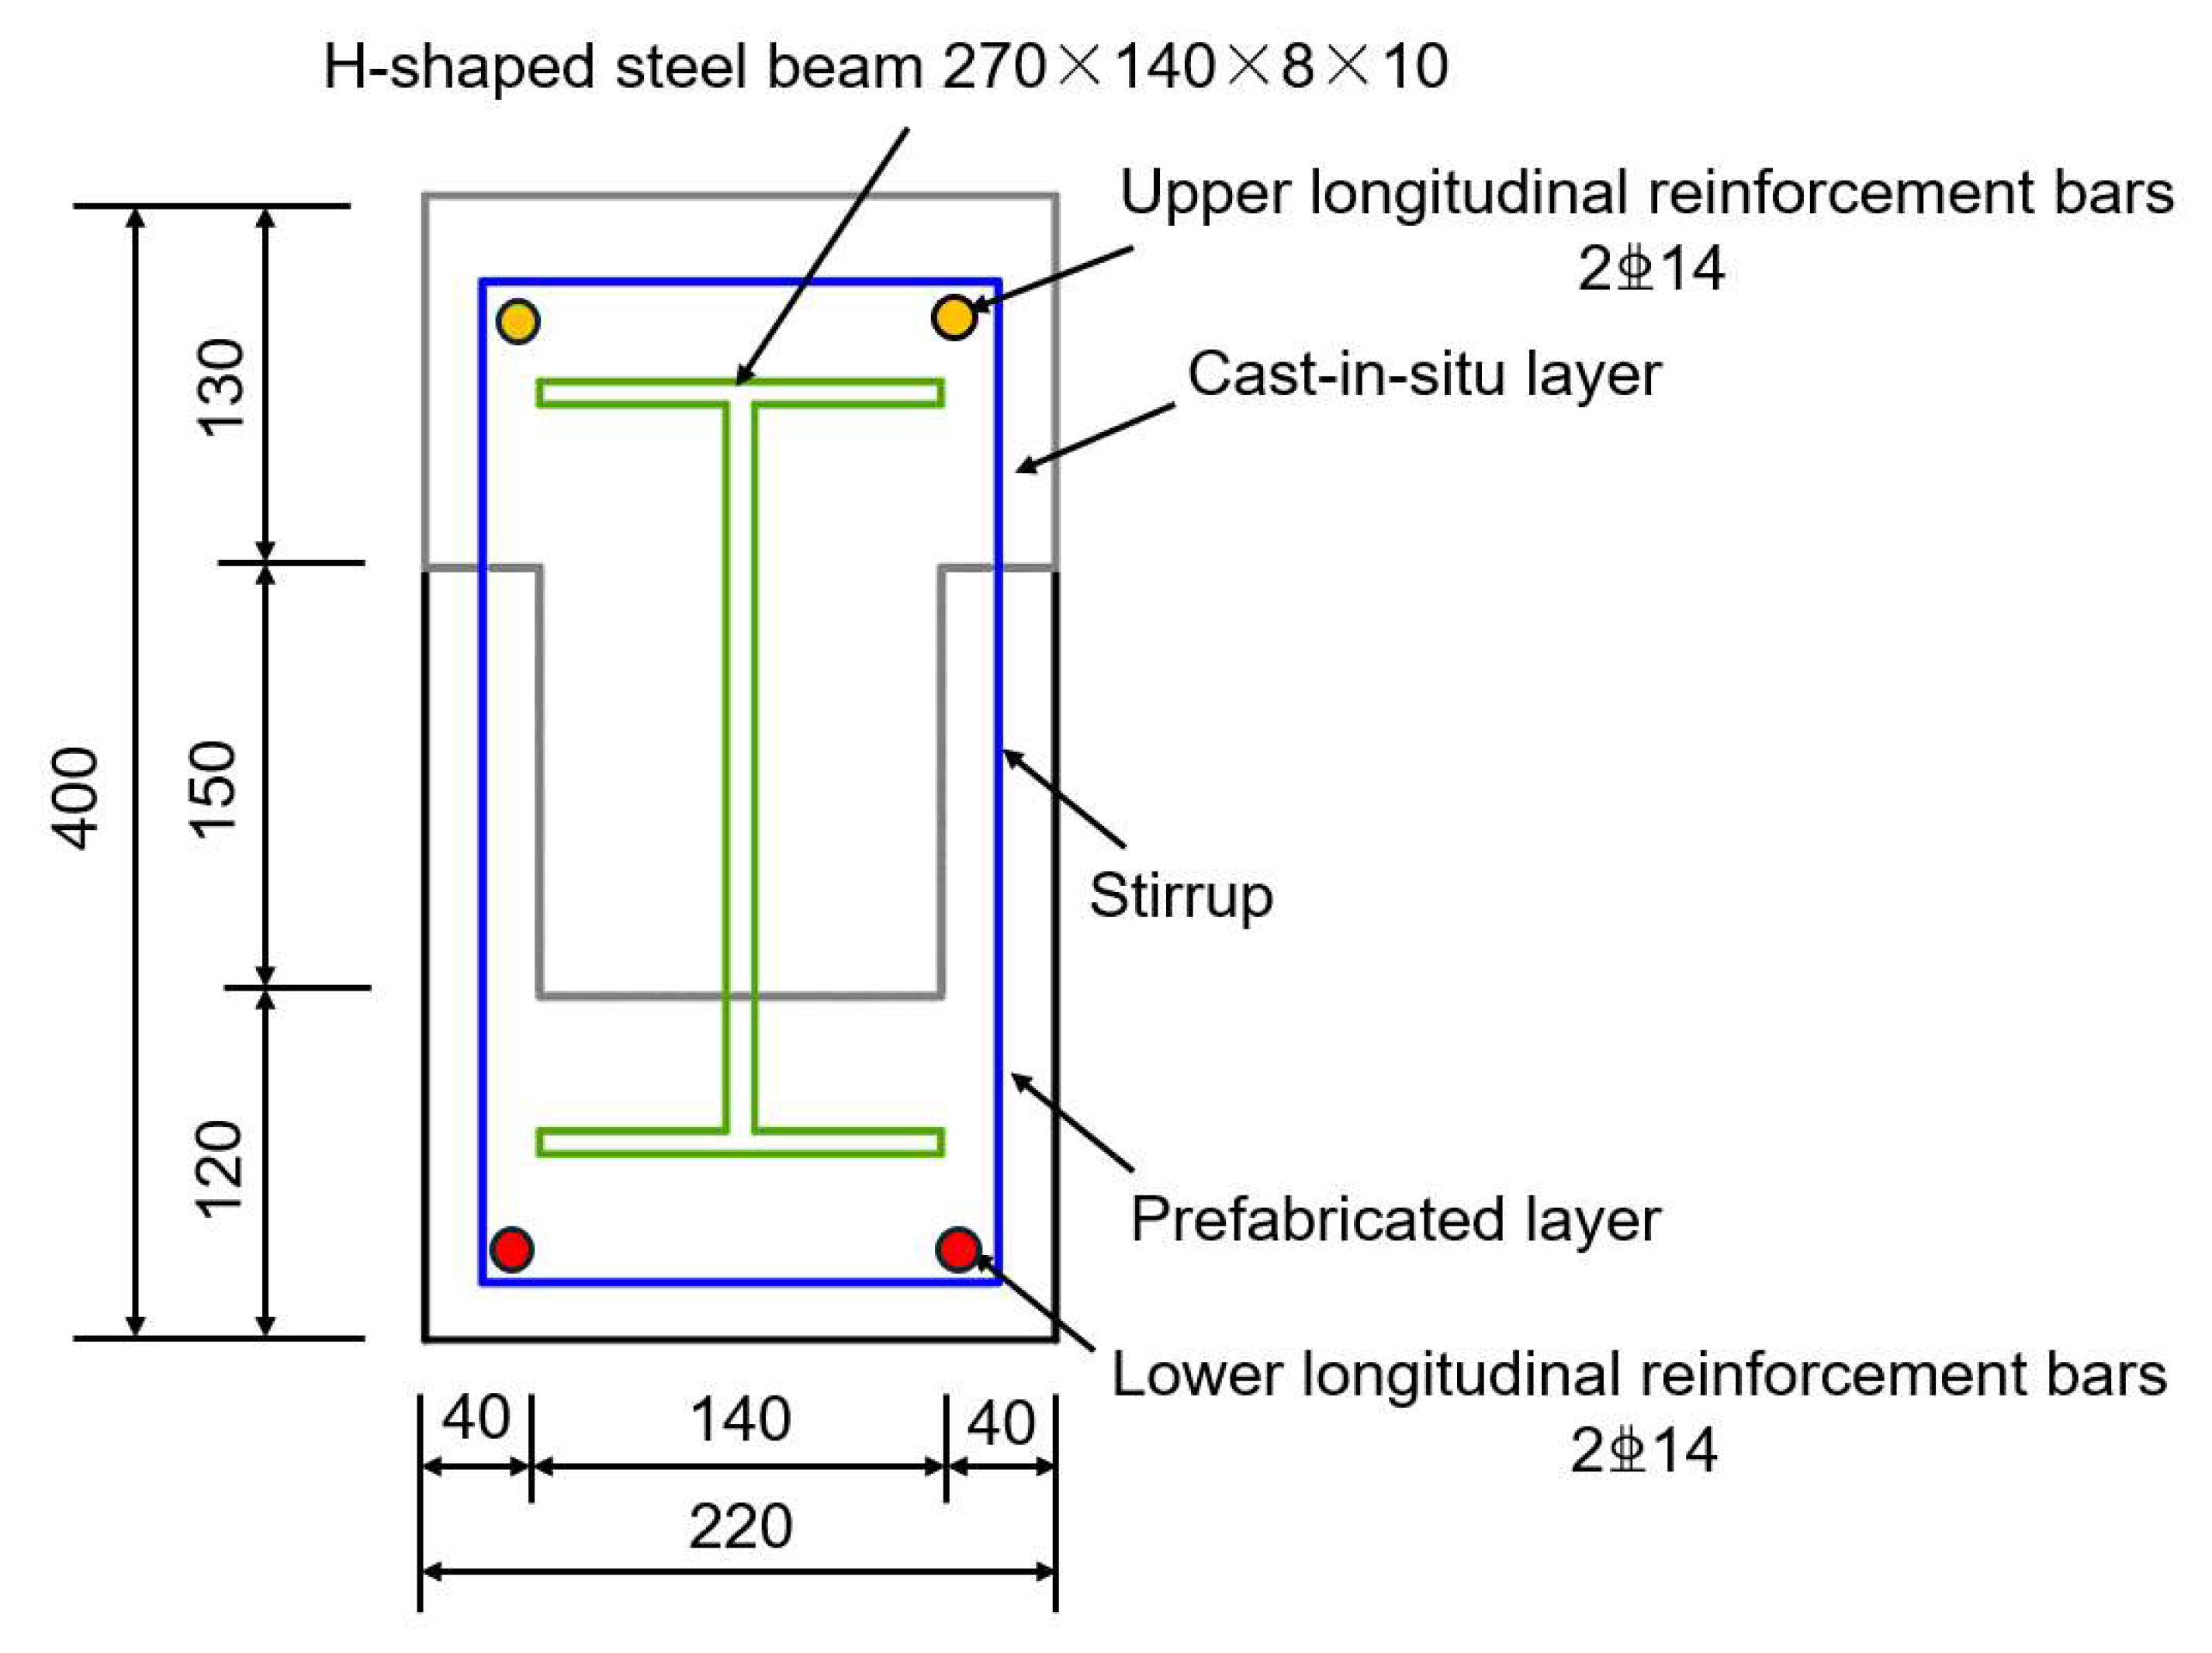
 Figure 8 and Figure 9. The specific dimensions of the specimen include a total length of 3150 mm, a width of 220 mm, a total thickness of 400 mm, and a calculated span of 2900 mm, where a three-point loading method is employed. Additionally, the center distance from the supporting block of the base to the lateral edge of the specimen measures 125 mm.
Regarding the construction details, the stirrups of the specimen are fabricated from an A8 diameter rebar, with the outer stirrups positioned 75 mm from the edge of the beam. In order to improve the shear capacity of the beam, the stirrup spacing on both sides is set at 100 mm with 12 stirrups, while the stirrups in the middle are arranged at 150 mm with 4 stirrups.
This study utilized C50 concrete with a measured cube compressive strength fcu of 55.2 MPa. Additionally, the strength of the reinforcing steel is a critical focus of the research. The yield strength fy of the HRB400 rebar was found to be 497 MPa, while the flange of the H-shaped steel, made from Q235 steel, exhibited a yield strength fy of 364 MPa. The yield strength fy of the web of the H-shaped steel was measured at 406 MPa.
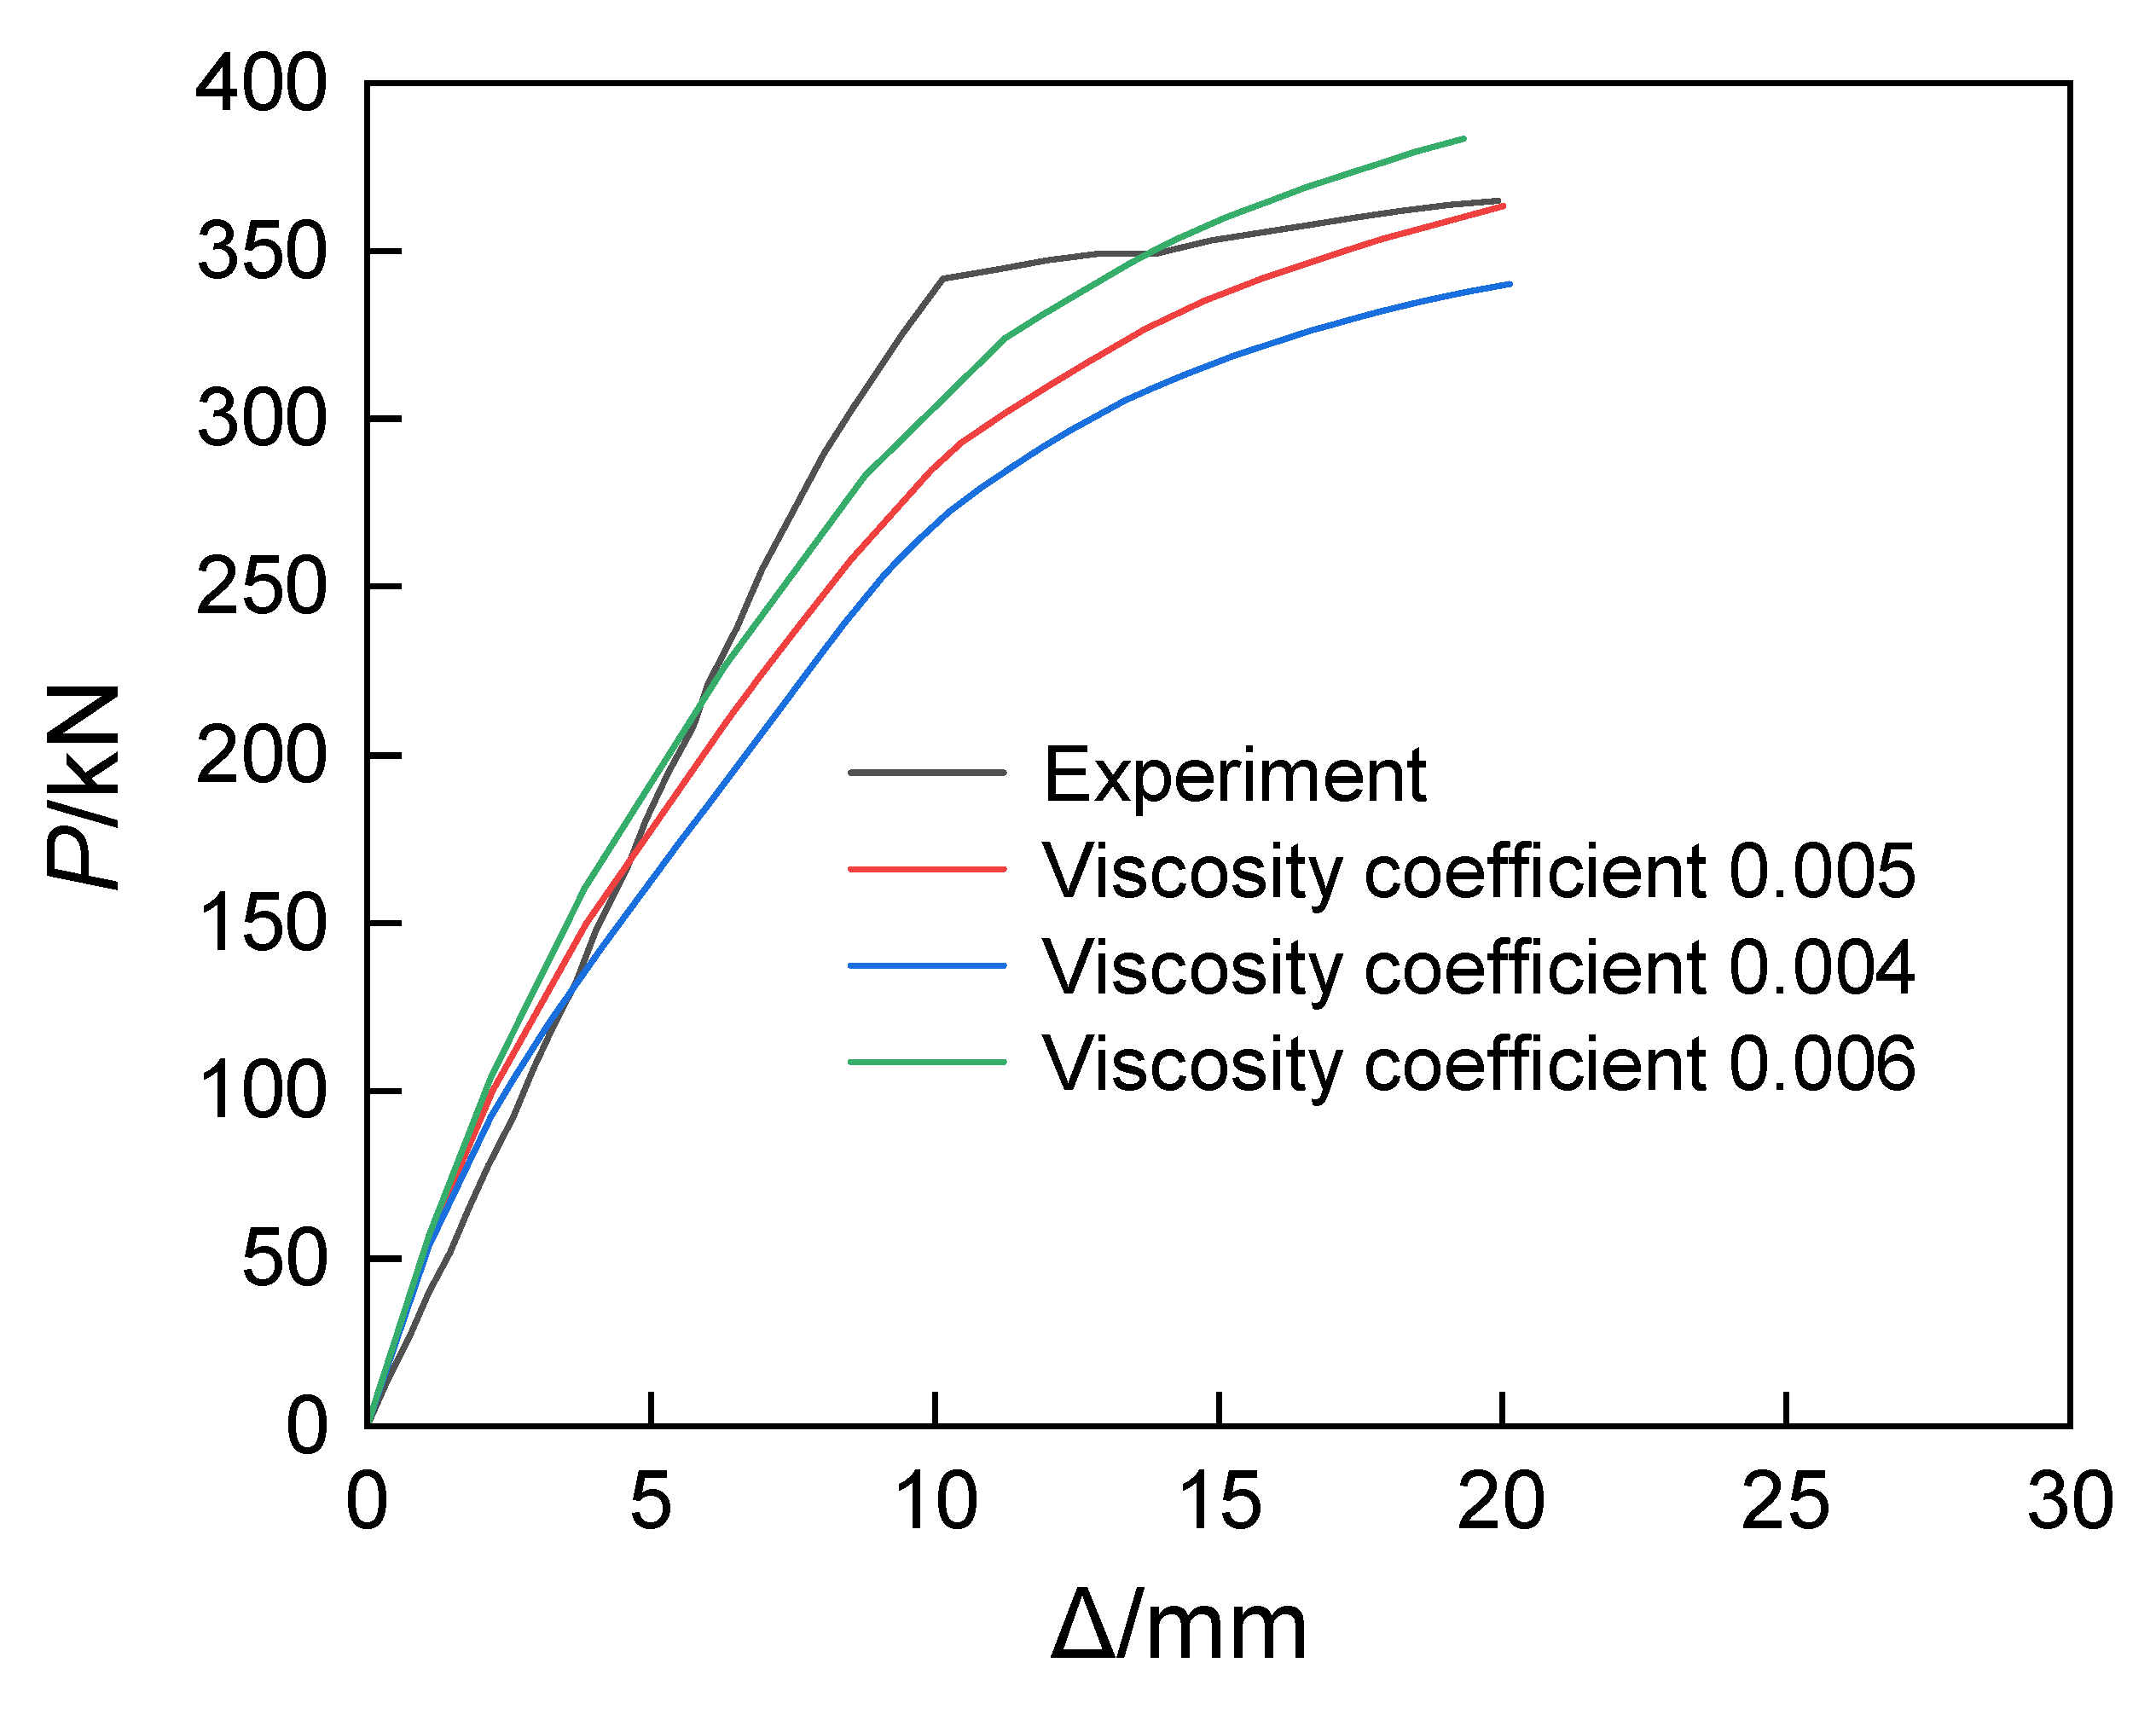
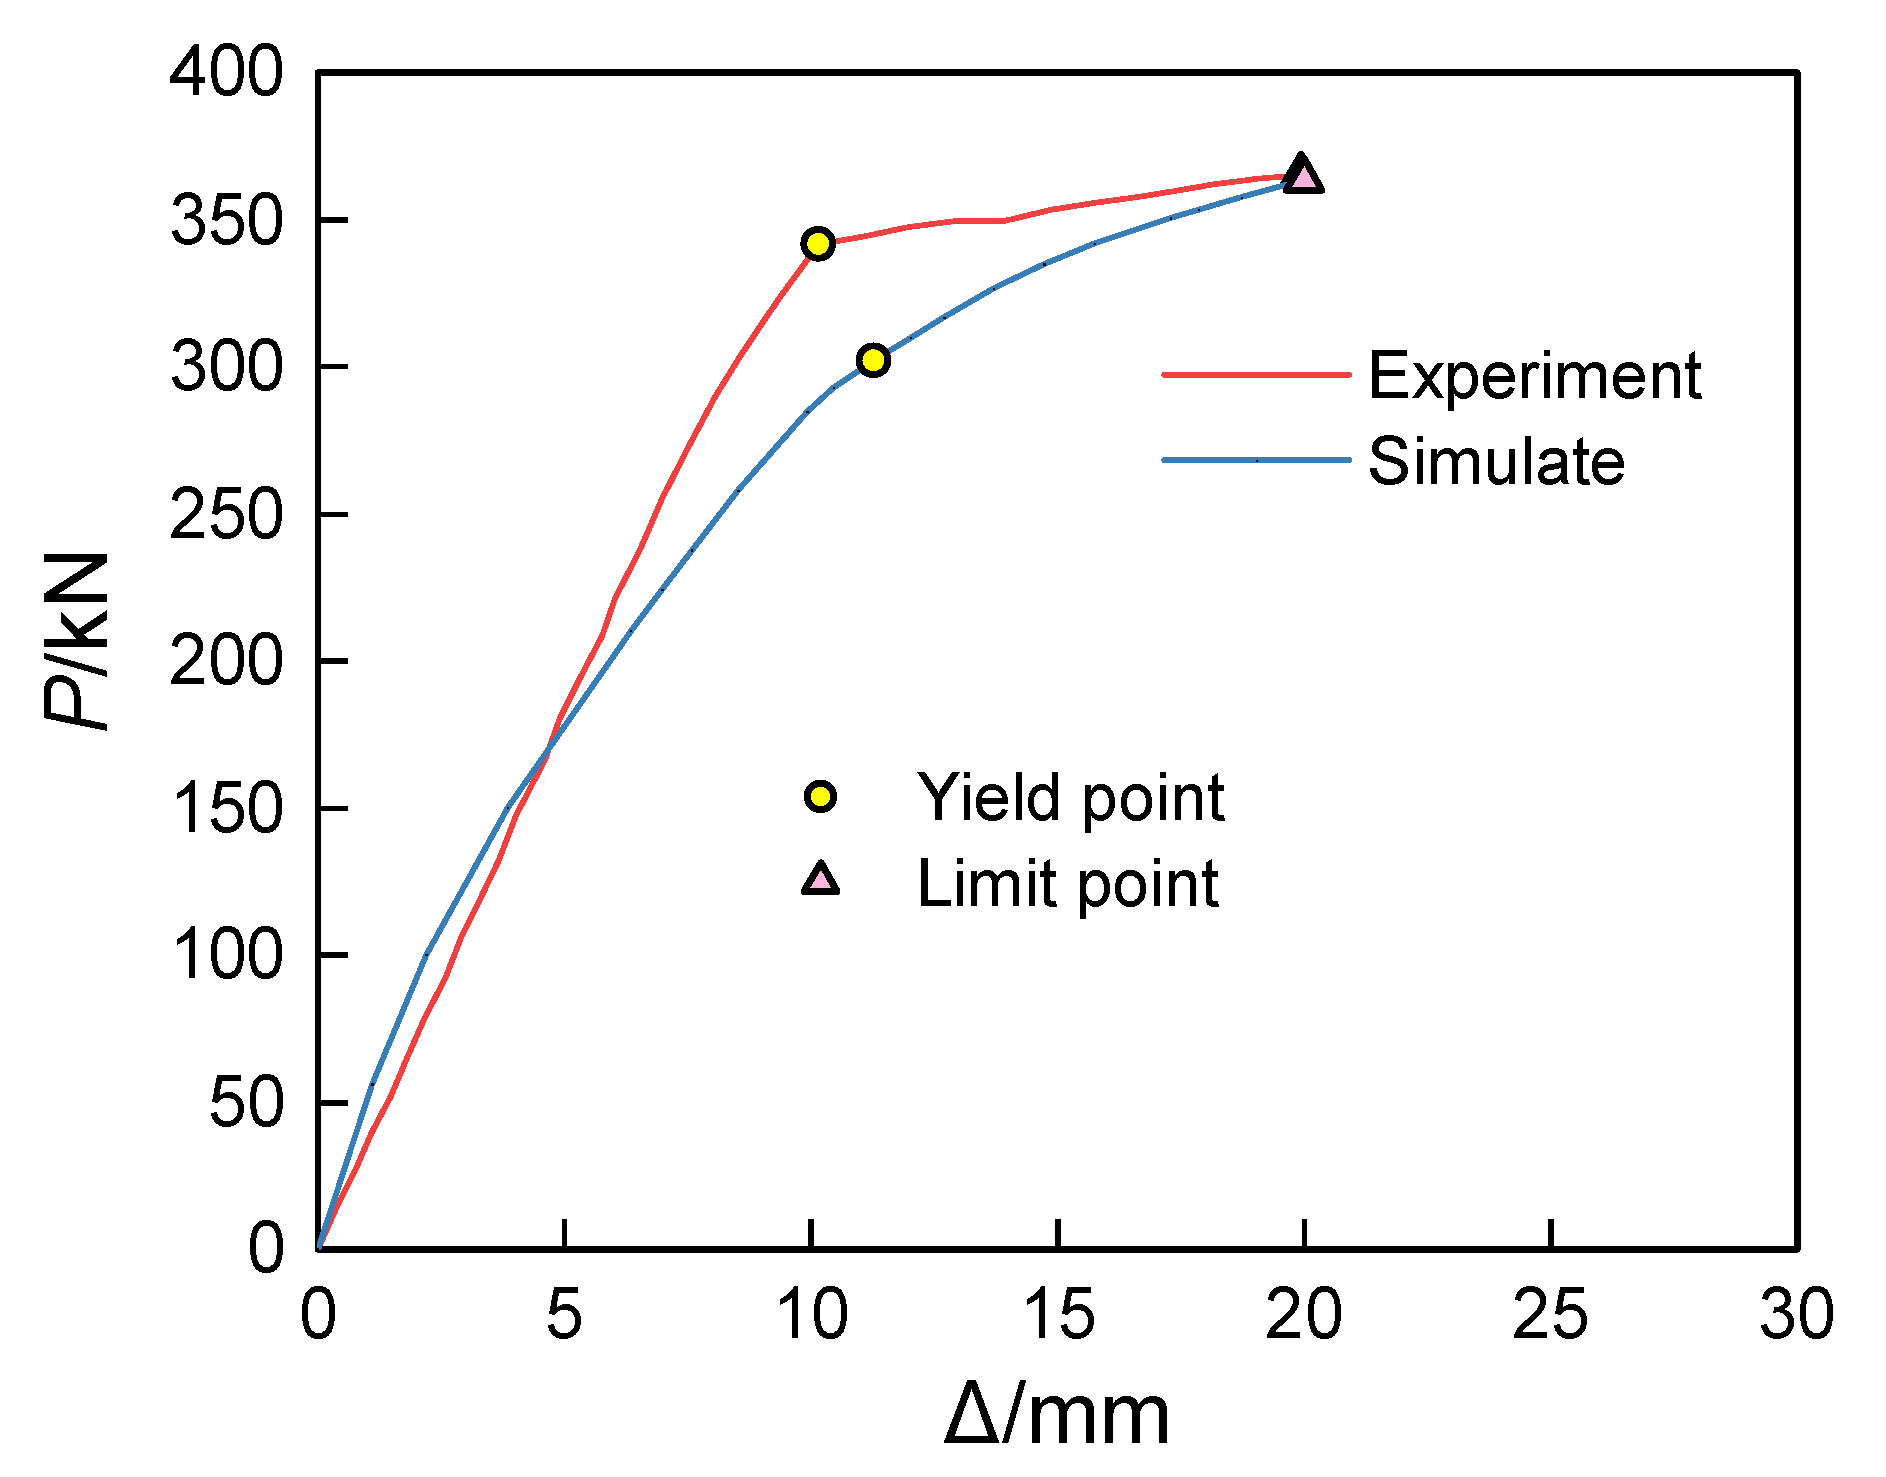
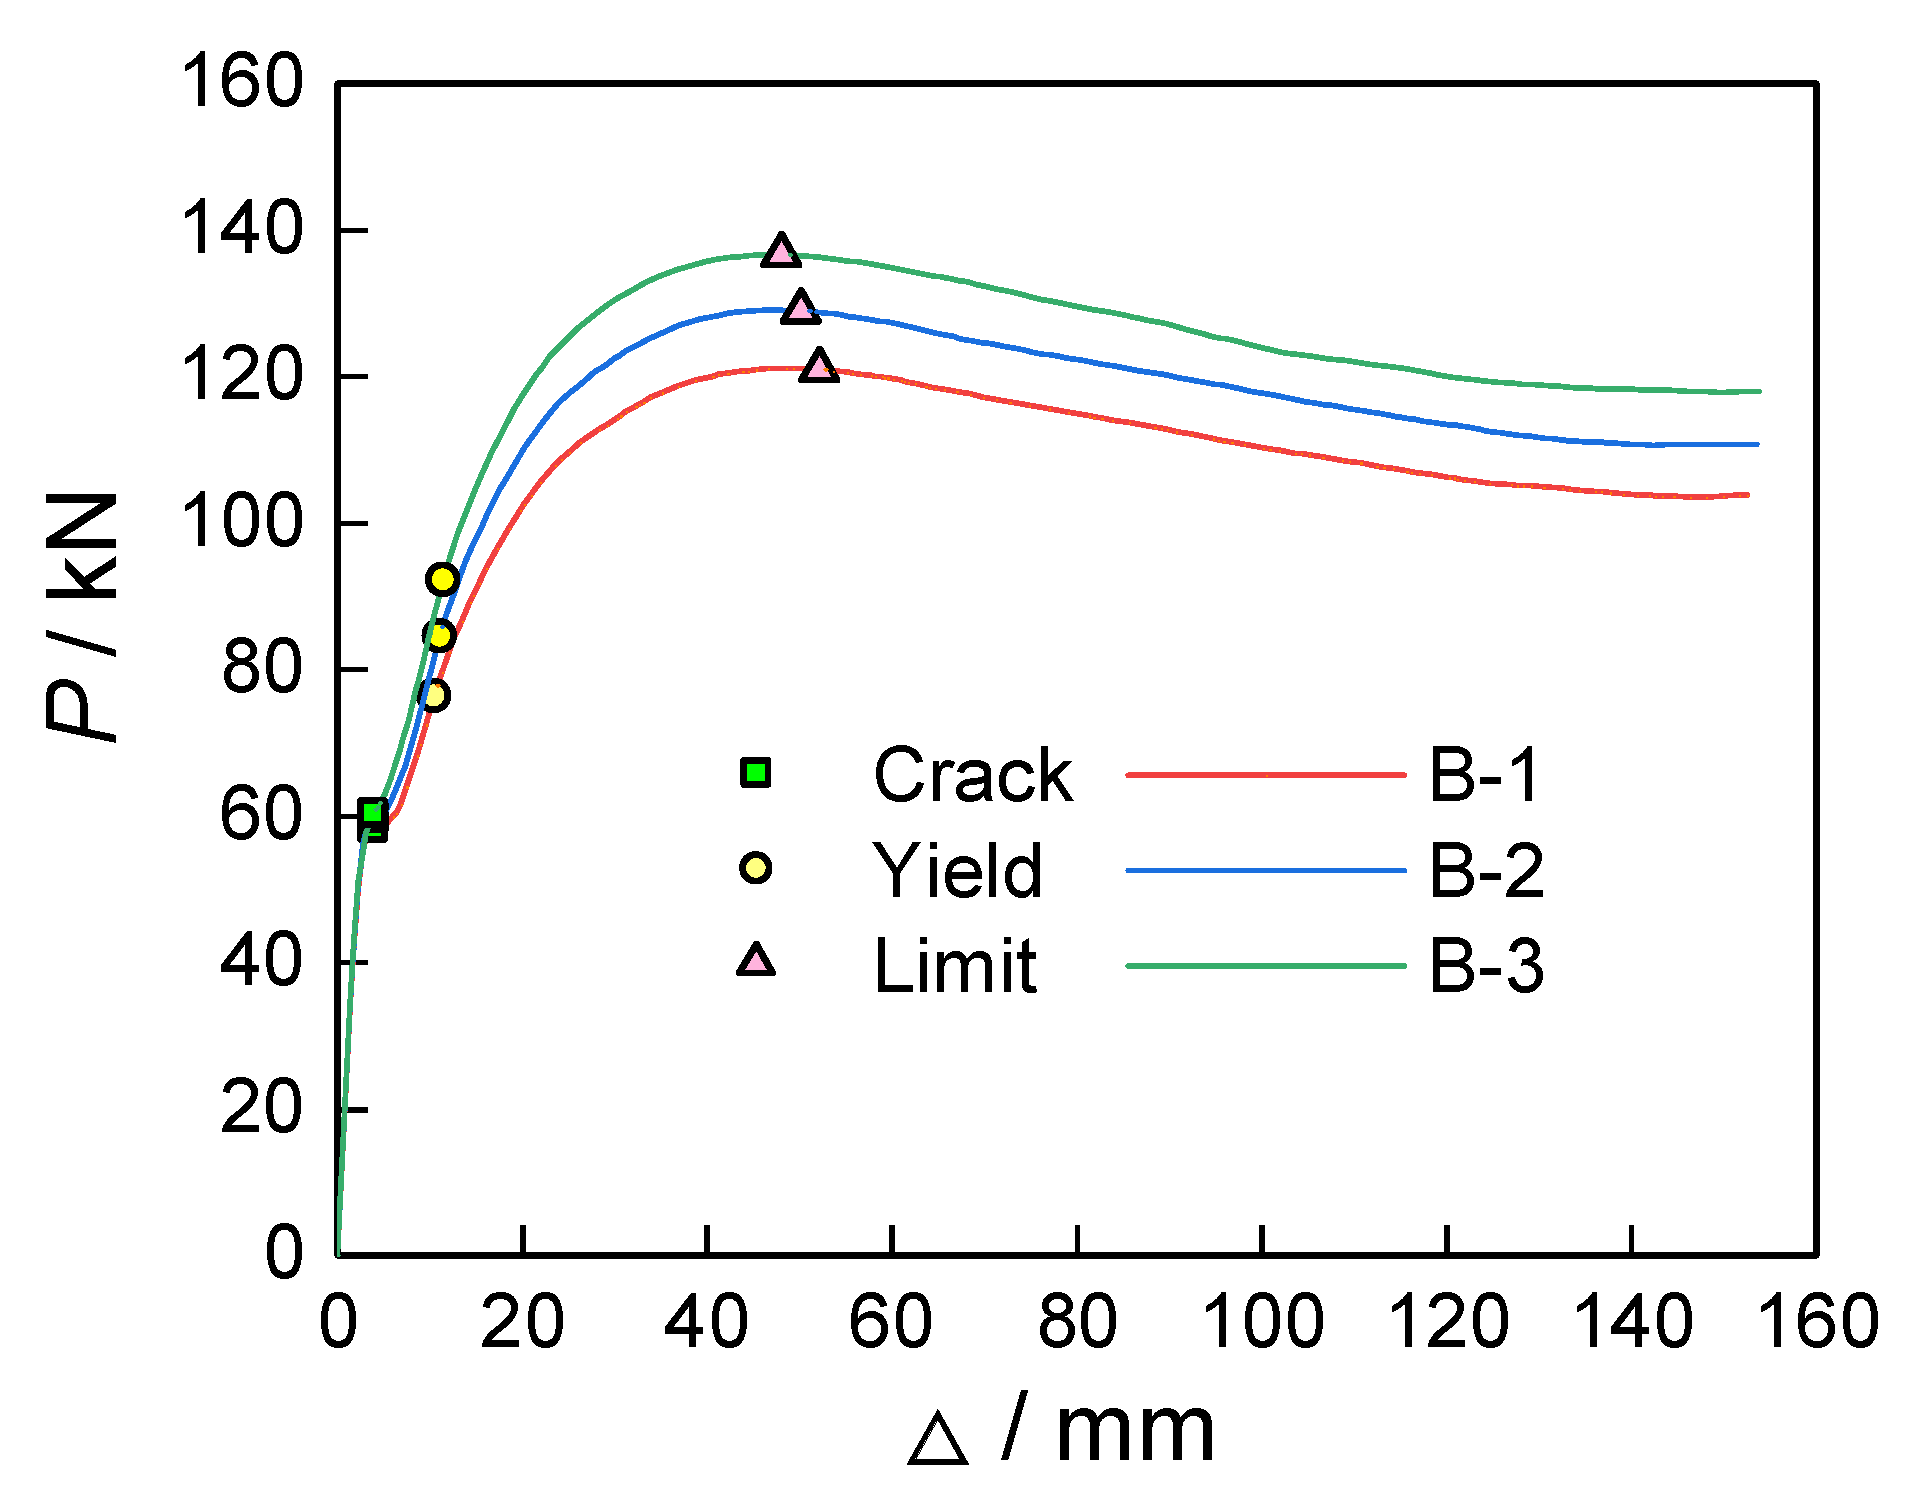
In Figure 10, the load–deflection (P − Δ) curves of the finite element simulation results are compared with the actual test data. By comparing these two curves, it can be observed that the yield load obtained from the experiment Pyt is 341.68 kN, while the ultimate load Put reaches 365.02 kN. Meanwhile, the yield load from the finite element simulation PyFE is 339.84 kN, and the ultimate load 
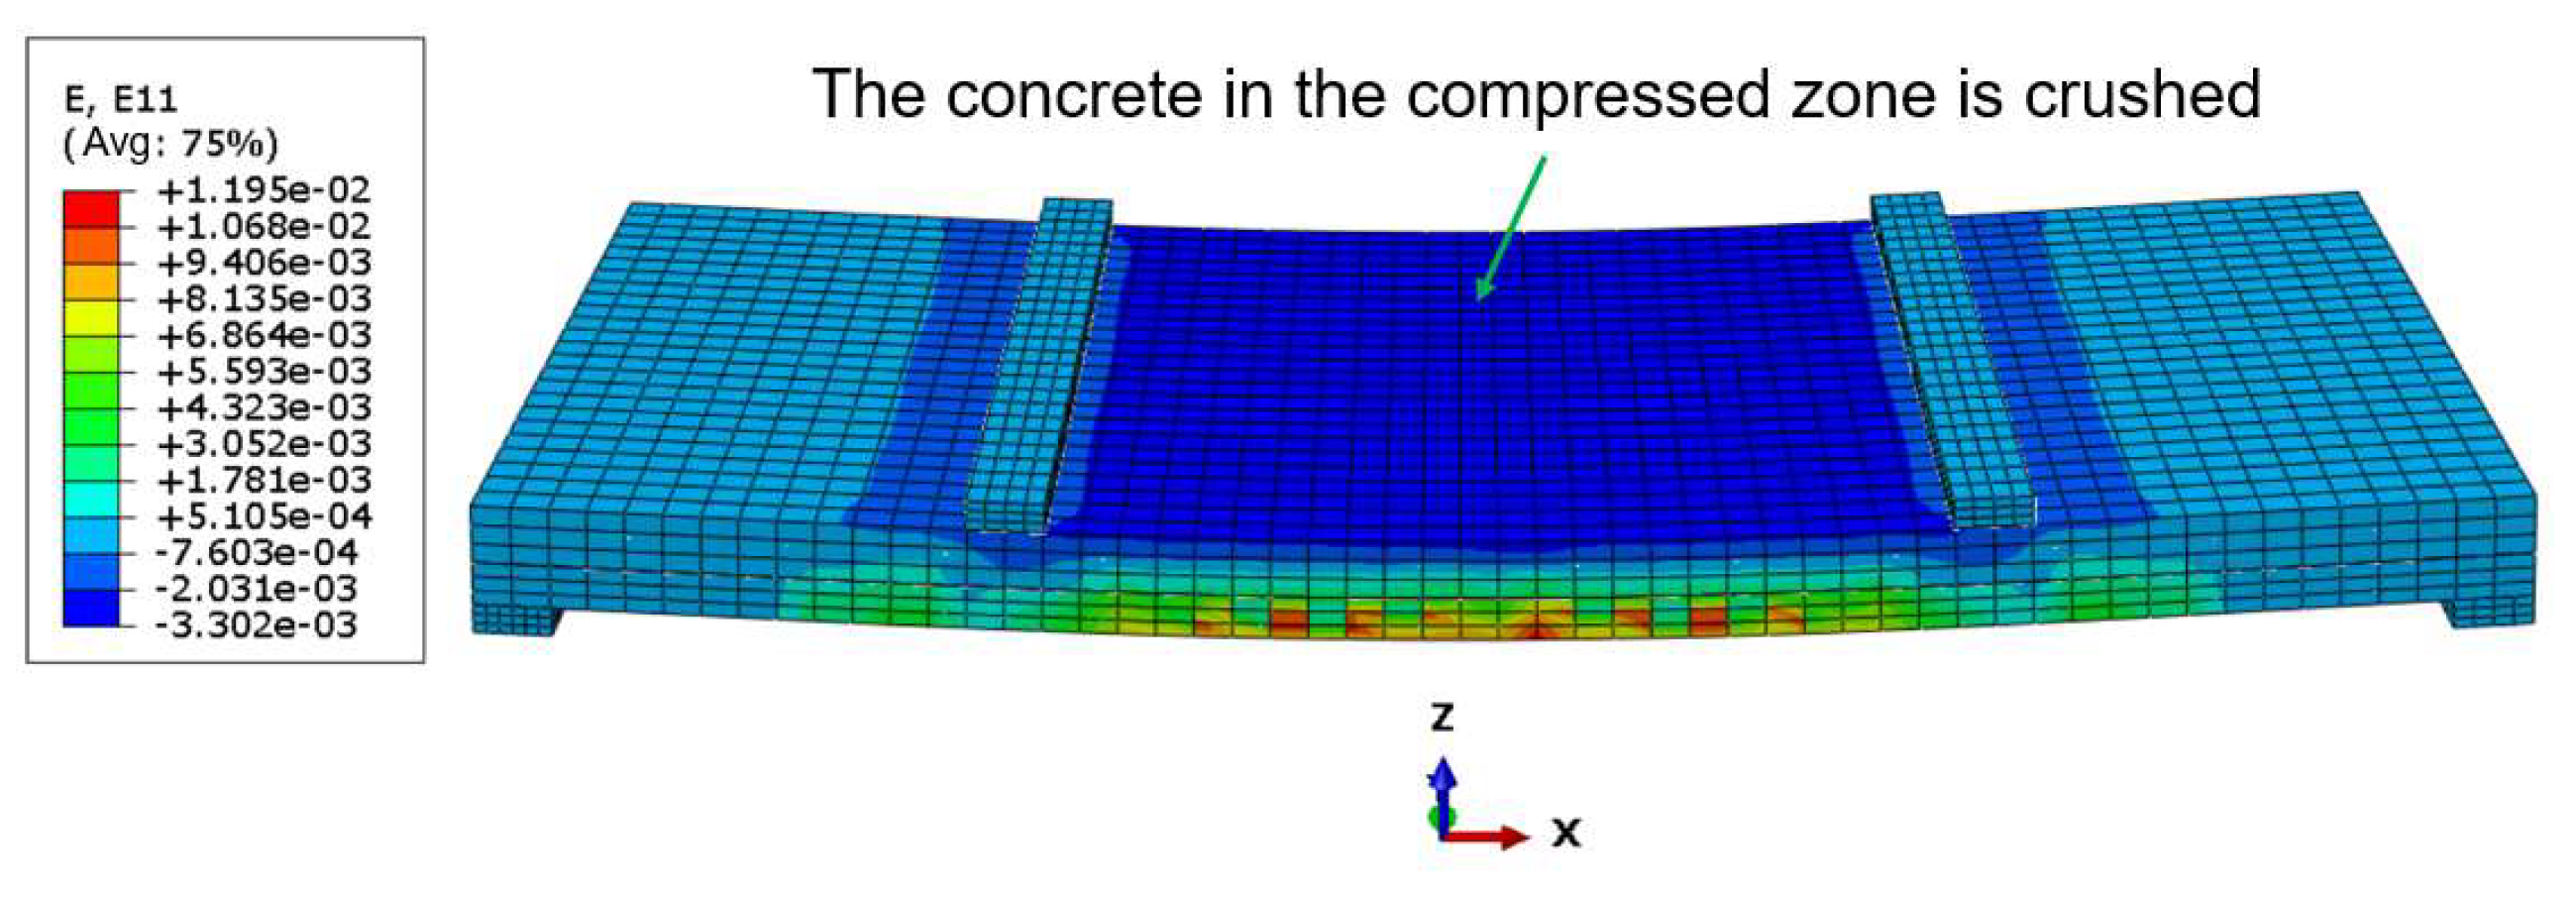
PuFE is 362.28 kN. Comparing these two sets of data, the ratio of the experimental yield point to the simulated value is approximately 1.01, with a deviation percentage of −0.54%. Although the predicted simulated yield load is slightly lower than the experimental value, the difference between the two is very small, indicating that the finite element simulation can accurately capture the yielding behavior of the material. At the ultimate state, the ratio approaches 1.01, with a deviation percentage of −0.75%, suggesting that the finite element simulation is also relatively accurate in predicting the ultimate load and is generally consistent with the experimental results. The finite element simulation results show a good agreement with the test data, further validating the reliability of the simulation method. From the overall development trend, the curve can be divided into three parts: the crack working stage, the yield strengthening stage, and the failure stage. In the initial loading phase, the deflection increases uniformly, and the slope of the curve remains basically unchanged, with minimal variation in the overall stiffness of the specimen; when the load reaches the yield load, the curve exhibits a turning point, and the slope decreases rapidly, leading to a reduction in the stiffness of the specimen, with the width of the concrete cracks continuously increasing and deflection persistently rising; when the ultimate load is reached, the concrete in the compressed region is crushed.

3.3. High-Strength Steel Ultra-High-Performance Concrete Beam

The literature [32] examines UHPC beams reinforced with high-strength steel, with a particular focus on specimen B-1. The three-dimensional structural schematic of this specimen is presented in Figure 11, while detailed elevation views and cross-sectional dimensions are provided in Figure 12 and 
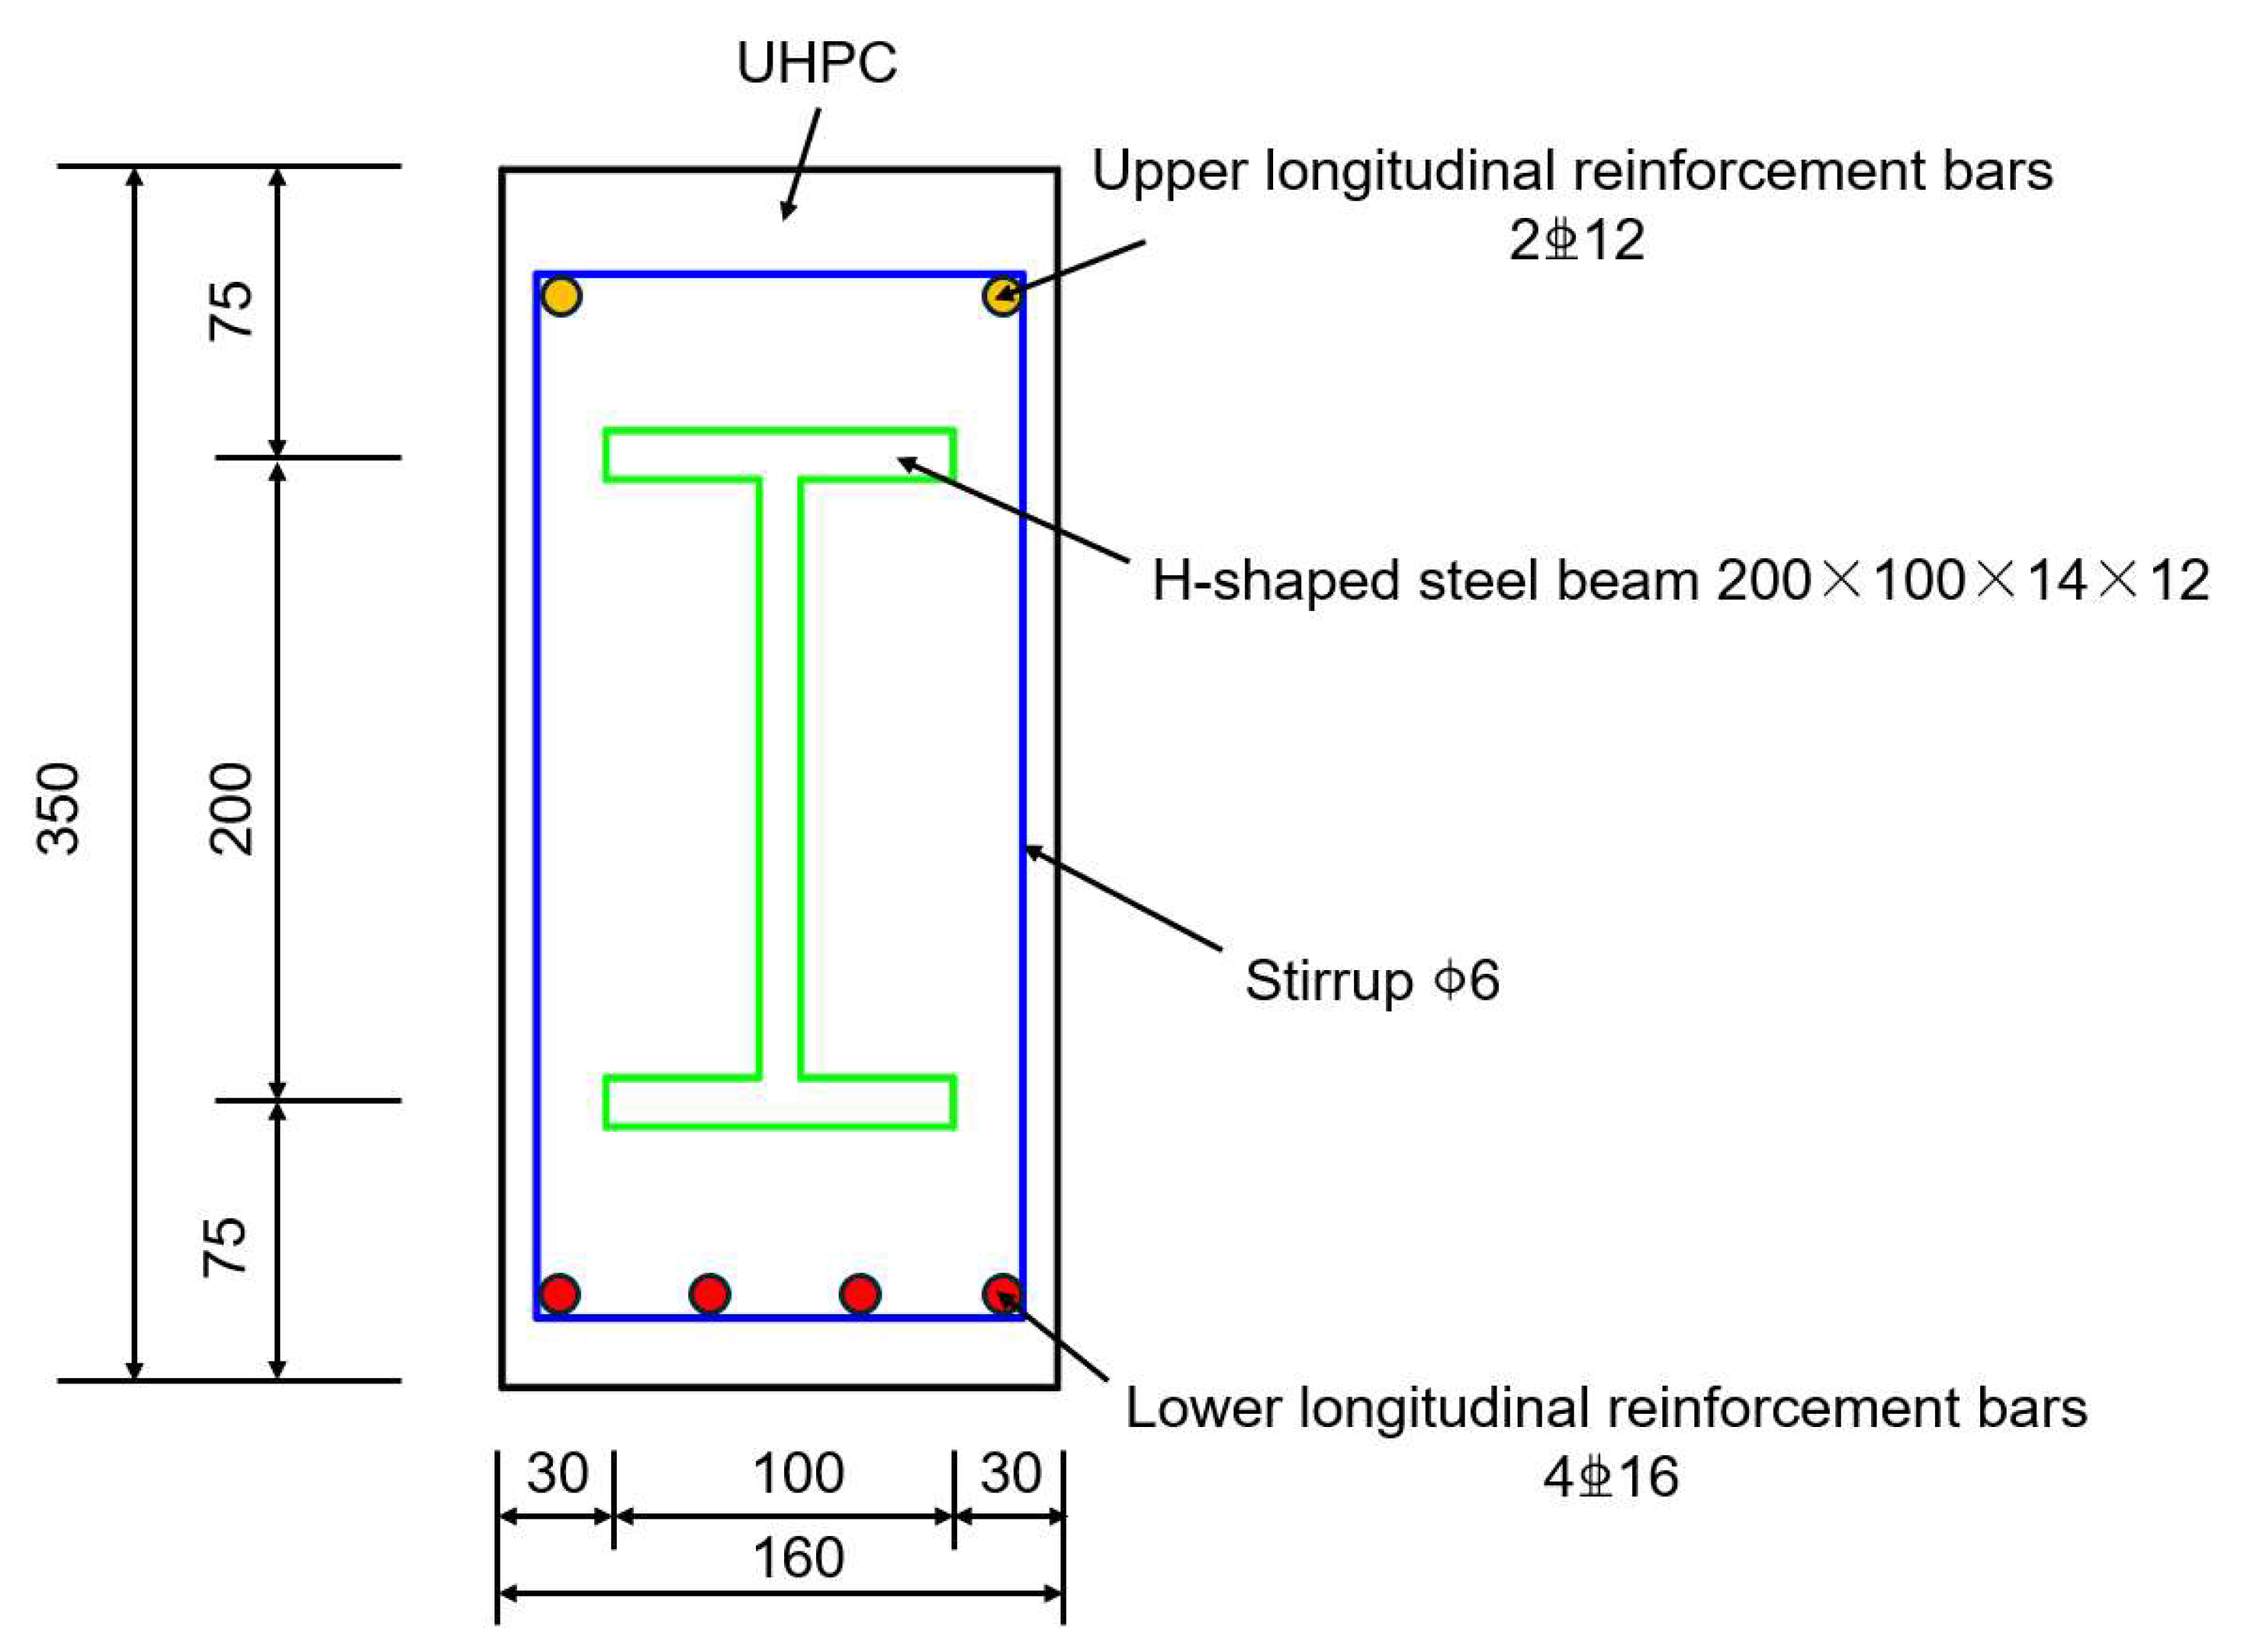
Figure 13. The specifications for the specimen include a total length of 2450 mm, a width of 160 mm, and a thickness of 350 mm, alongside an effective span of 2250 mm, which can be accurately determined. The tests were performed using a three-point loading method.
In relation to support and reinforcement, the distance between the specimen’s support block and the edge is established at 100 mm. Furthermore, the stirrup reinforcement is arranged at intervals of 100 mm, with a diameter of A6, and the outermost stirrup is located 75 mm from the edge of the concrete beam.
In terms of material performance, the UHPC utilized in the specimen is classified as C100, demonstrating a measured cube compressive strength fcu of 101.0 MPa. The reinforcement selection includes a C12 rebar, which has a measured yield strength fy of 414 MPa, and a C16 rebar, with a yield strength fy of 441 MPa, slightly exceeding that of the C12 rebar. Additionally, the H-beam in the specimen displays high strength characteristics, exhibiting a measured yield strength fy of 573 MPa in the flange section and 553 MPa in the web section.
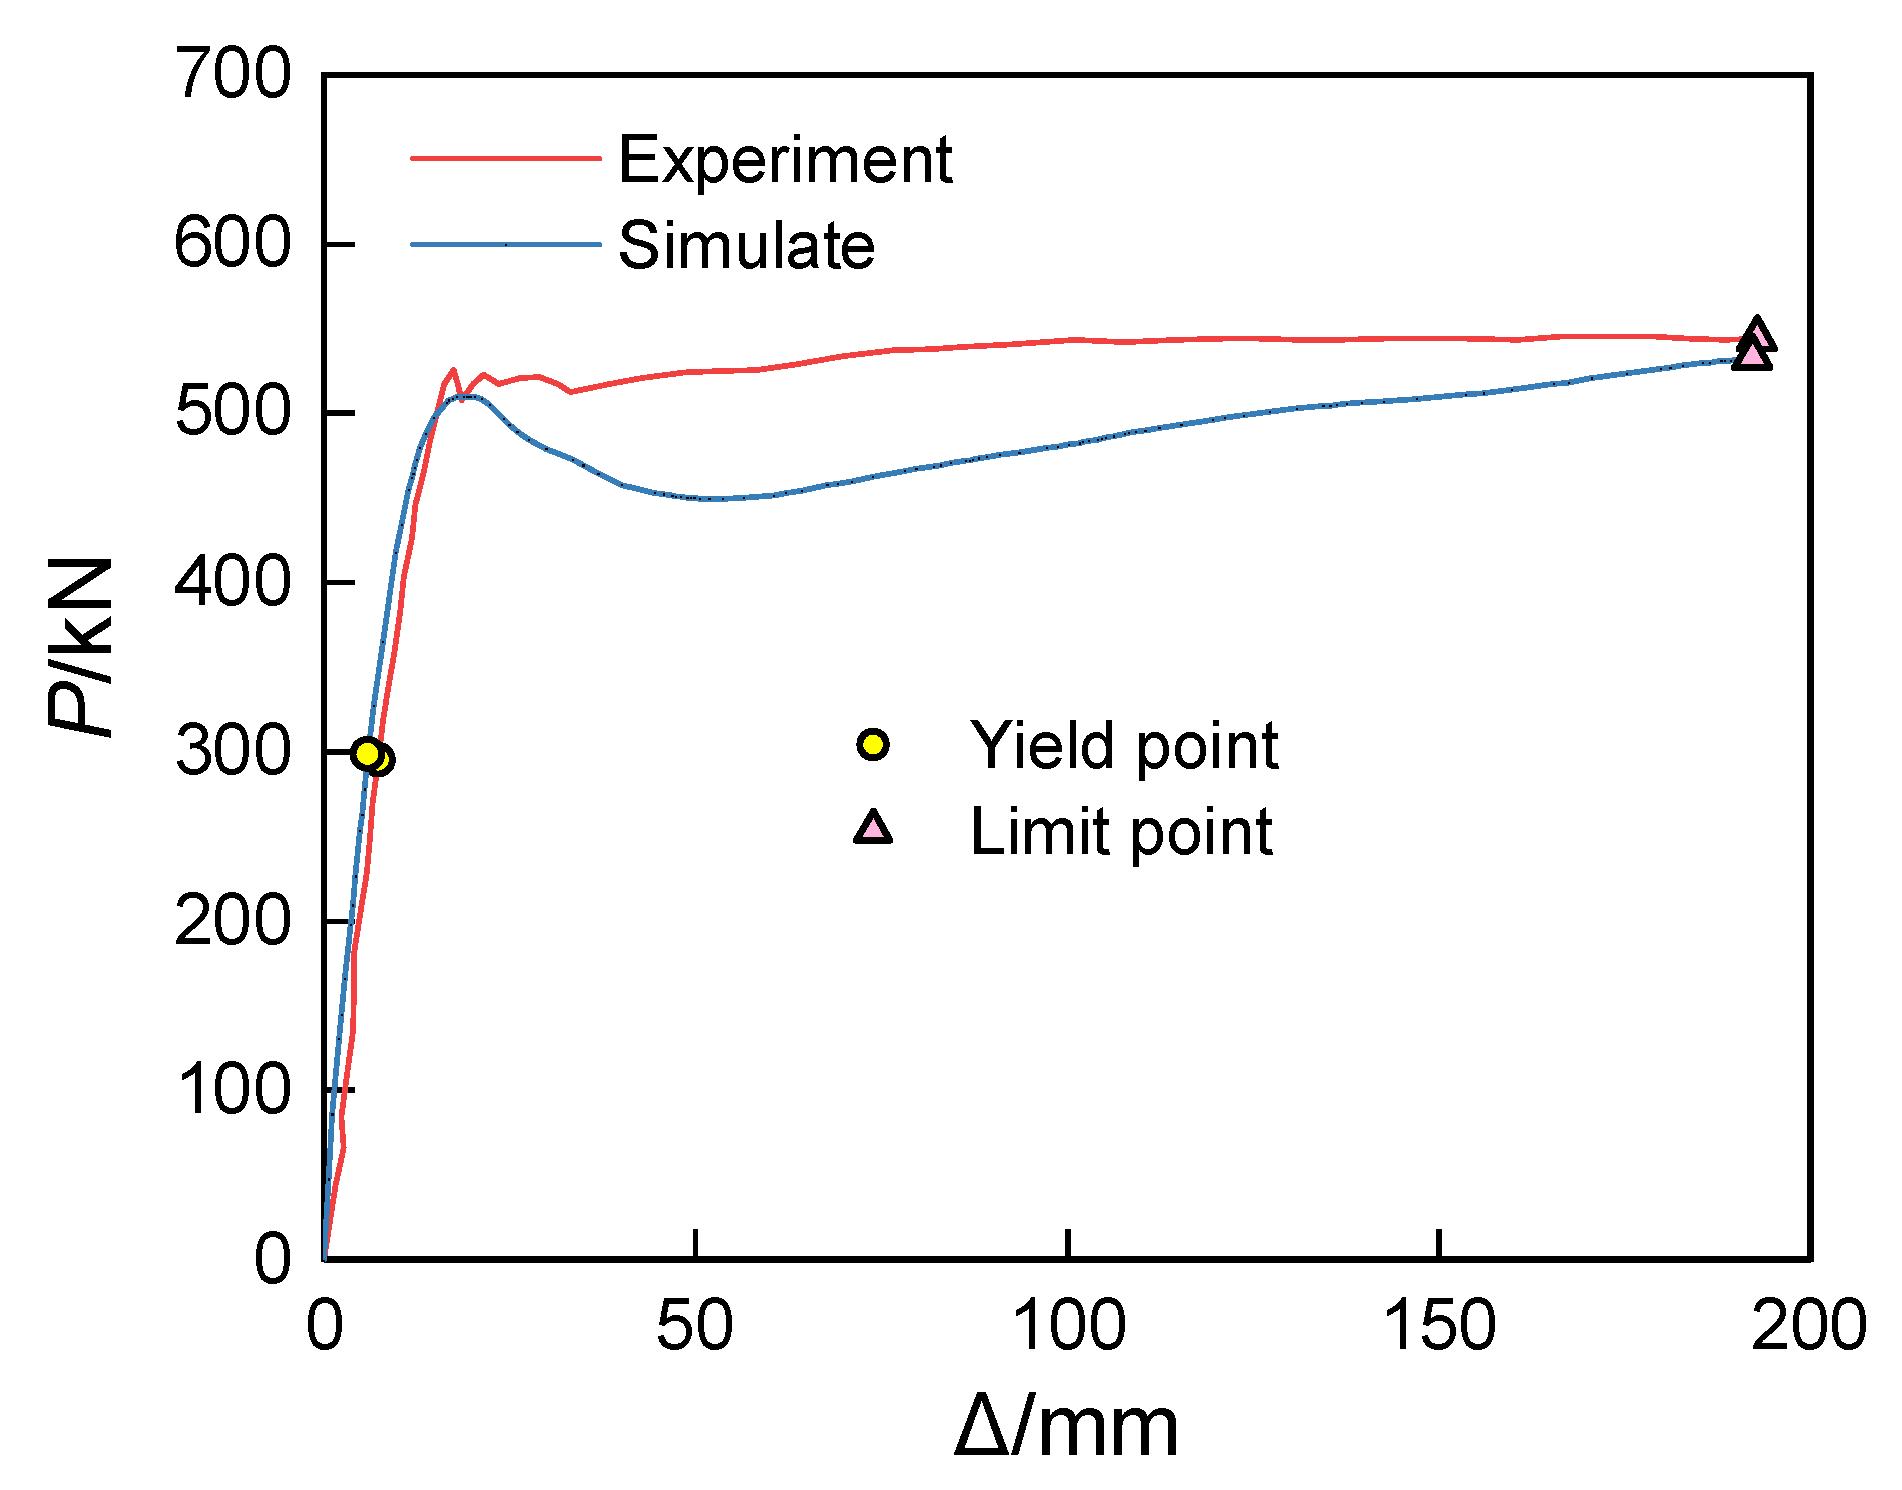
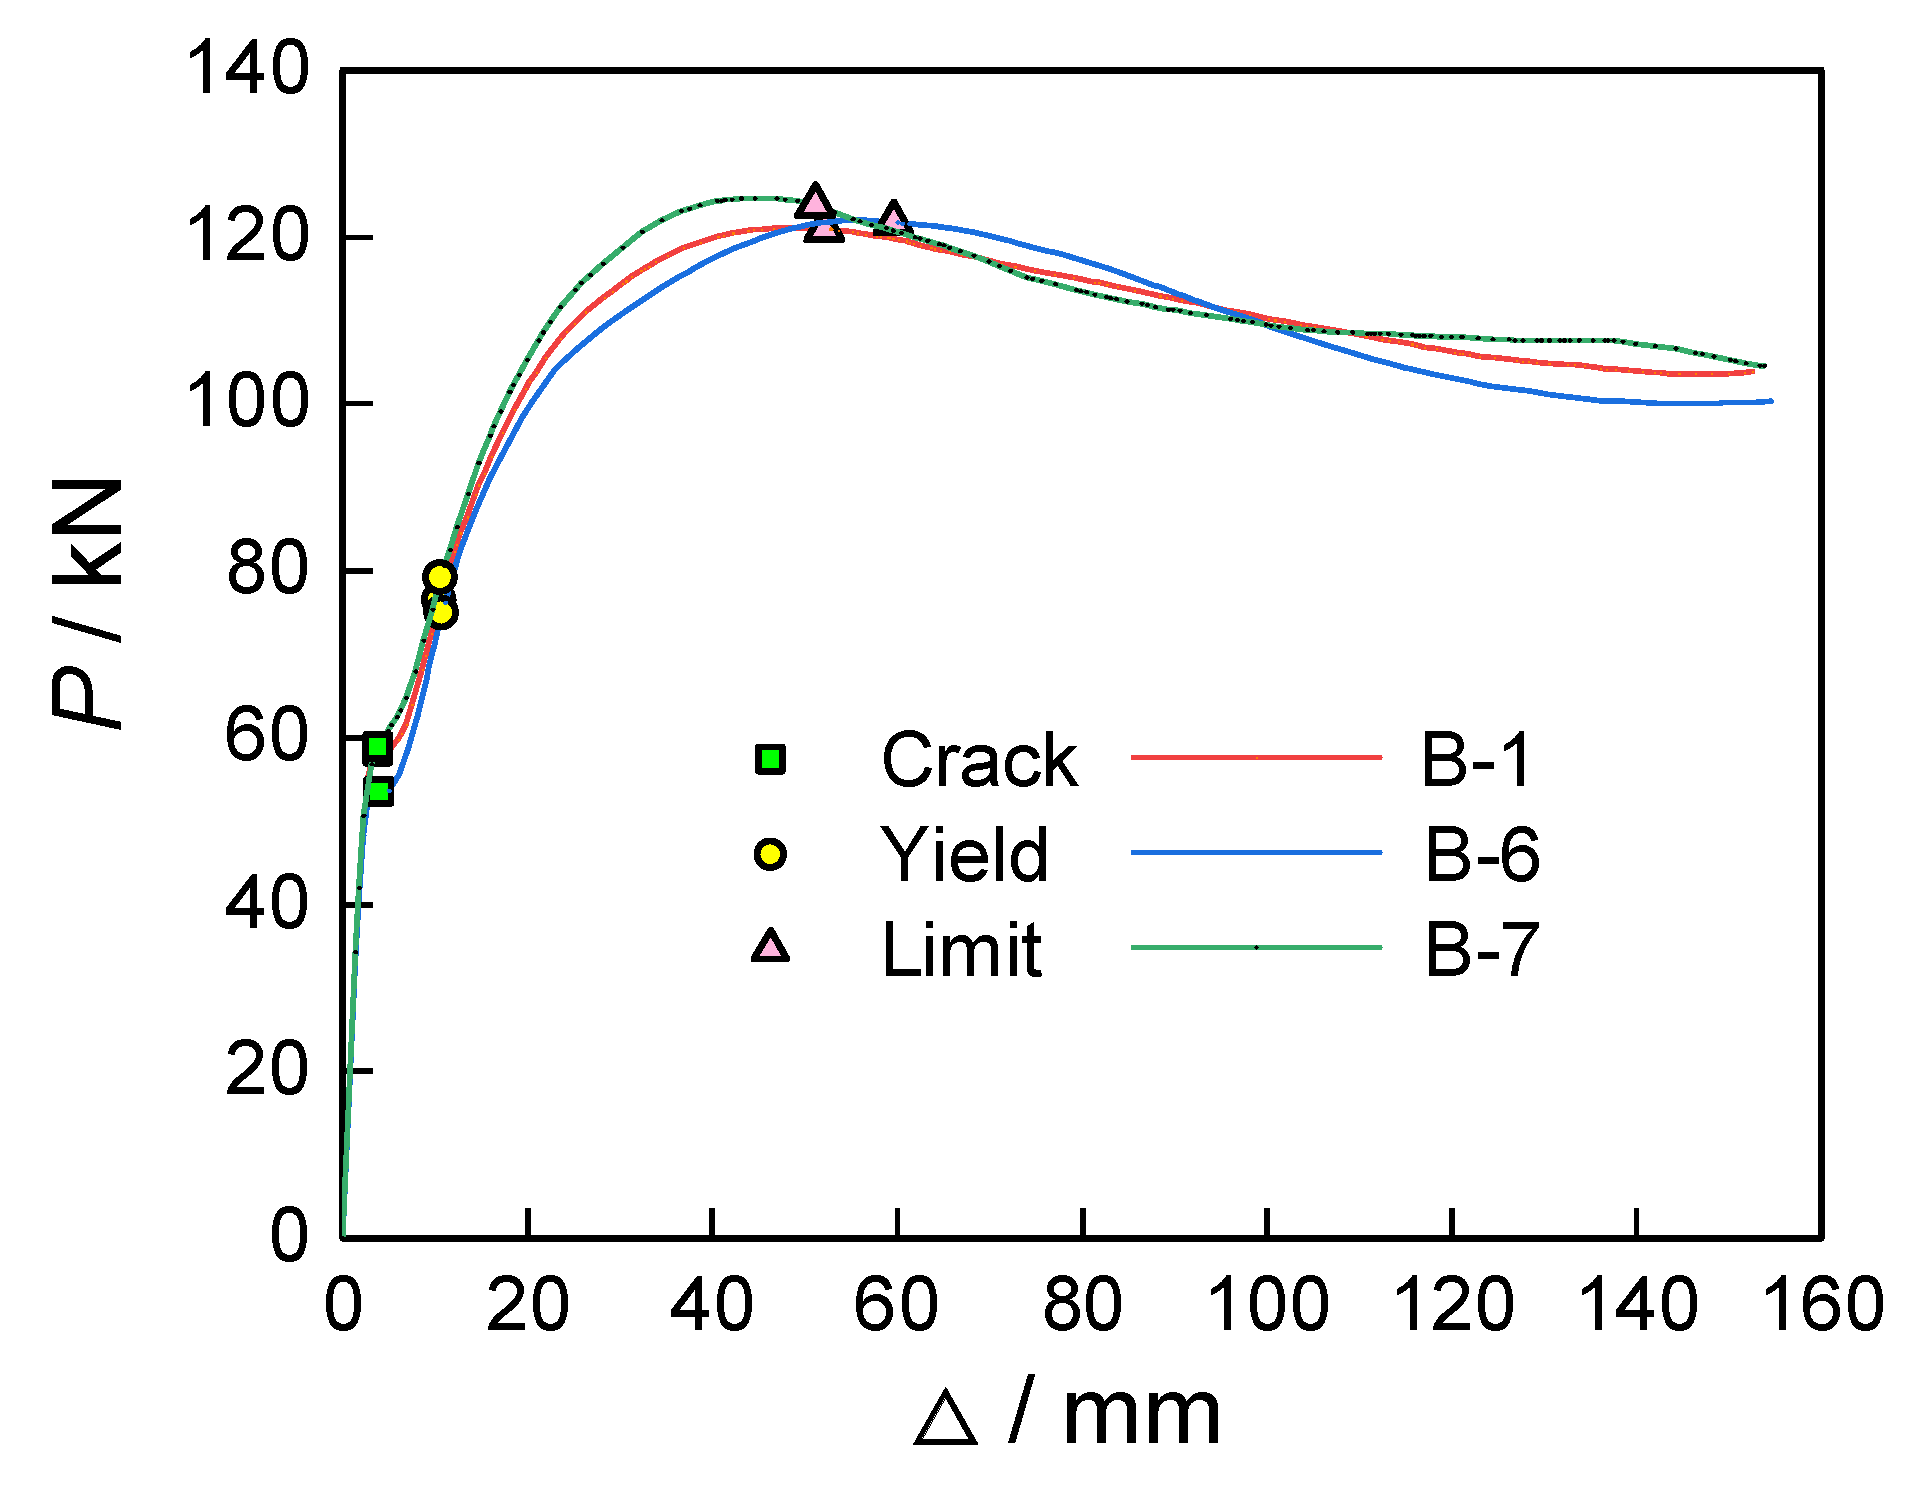
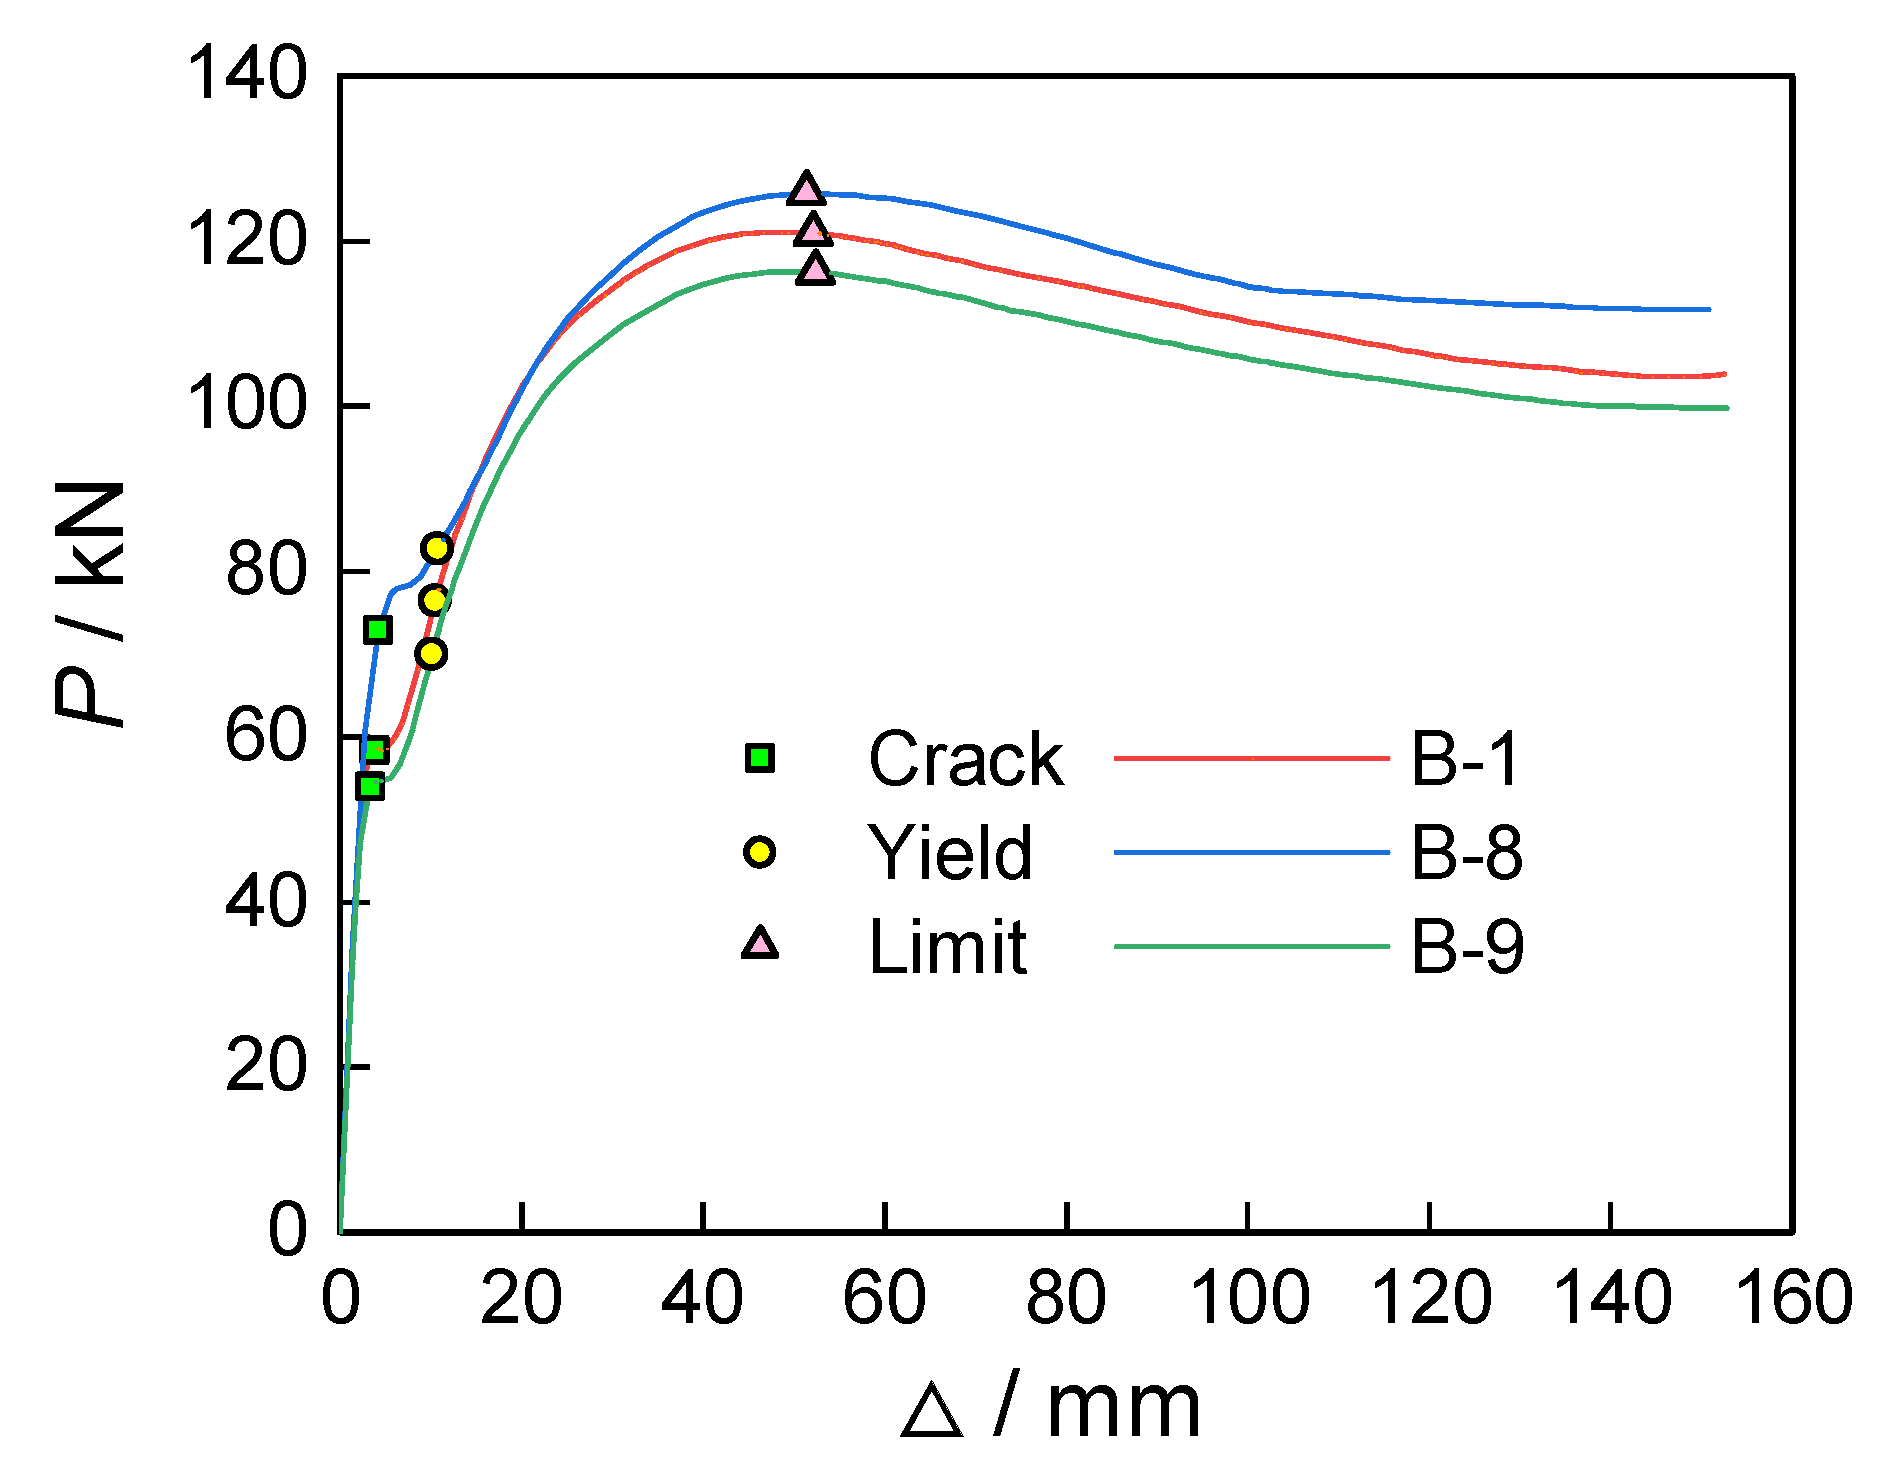
Figure 14 shows the comparison between the finite element simulation results and the actual test-derived mid-span deflection–load curve (P − Δ). This figure visually reflects the deformation characteristics of both under load, providing an important basis for subsequent result analysis. Through experimentation, the actual yield load Pyt measured was 295.19 kN, and the ultimate load Put was 544.48 kN. From finite element analysis, the yield load PyFE was 298.79 kN, and the ultimate load PuFE was 533.26 kN. The comparison reveals that the ratio of the experimentally obtained yield load to the simulated value is approximately 0.99, with a deviation percentage of 1.22%; meanwhile, the ratio for the ultimate load is close to 1.02, with a deviation percentage of −2.06%. This indicates that the error between the two is very small, demonstrating a high consistency between the finite element model and the experimental results. Overall, the (P − Δ) relationship curve predicted by the finite element model aligns closely with the experimental observation data, confirming the model’s effectiveness and reliability in describing structural responses. Based on the analysis of the load process of ultra-high-performance concrete beams reinforced with high-strength steel, the process can be roughly divided into three stages. The first stage (uncracked stage): In the early loading phase, the load–displacement curve increases proportionally, displaying no inflection point. The stress and strain in the beam cross-section are small, and the entire cross-section participates in the load-bearing, with the ultra-high-performance concrete, steel shapes, and longitudinal reinforcements all in an elastic working state. The second stage (cracked stage): After cracking of the beam, although the cross-section’s stiffness decreases, the substantial stiffness of the steel shape significantly constrains the core concrete, such that the load-mid-span degree curve shows no noticeable inflection point; the slope slightly decreases, but the curve remains approximately linear. The third stage (failure stage): Although the compressive strength of ultra-high-performance concrete is very high and steel fibers have been added, it still exhibits considerable brittleness, causing the beam’s bearing capacity to rapidly drop from its peak, leading to fluctuations in the curve. However, due to the presence of steel shapes in the cross-section, the beam does not fail, continues to carry loads, and its bearing capacity rises again after undergoing significant deformation while the curve maintains a stable change. At this point, the ultimate load is reached, and the compression zone of the concrete experiences crushing phenomena.
Table 3 compares the experimental yield load Pyt and ultimate load Put data with the finite element simulation results (PyFE and PuFE). The average ratio of experimental values to simulated values is 1.000, with a standard deviation of 0.0141 and a coefficient of variation of 0.0141. These statistics indicate that the finite element simulation results closely align with the experimental data, demonstrating a high degree of consistency. The constitutive model of materials under different loads may not fully account for all nonlinear factors. There is a discrepancy between the actual loading conditions of the structure and the idealized conditions assumed in the model. The setting of boundary conditions in the finite element model, whether it accurately reflects the real situation, may affect the analysis results. Overall, there is a high degree of consistency between the results of finite element analysis and experimental measurements. However, it is noteworthy that, despite the small deviations, continuous validation and calibration of the finite element model are needed to enhance the accuracy of predictions and the reliability of the model. Future work could consider gathering more experimental data and conducting comprehensive analyses under various conditions to further improve the model’s accuracy.

4. Finite Element Analysis of UHPC-NC Prefabricated Hollow Composite Slabs

4.1. The Design Scheme of the Finite Element Analysis Model

This article develops finite element models for nine UHPC-NC prefabricated hollow composite slabs to investigate the impact of various factors on their load-bearing performance. The factors considered include the wall thickness of square steel tubes, the diameter of transverse reinforcement, the thickness of the precast bottom plate, and the concrete strength grade.
The fundamental dimensions and material properties of the composite slab are as follows: the length is 2600 mm, the width is 1200 mm, and the calculated span measures 2500 mm. The total thickness is 140 mm, comprising a precast base slab measuring 60 mm and a cast-in-place layer measuring 80 mm. Testing was conducted using a four-point loading method, with support pads placed securely against the transverse edges of the composite slab. The pads have a thickness of 40 mm and a width of 100 mm, positioned at a distance of 625 mm from the centers of the supporting pads to the centers of the loading pads. The concrete strength grade for the cast-in-place layer is C30. The embedded steel reinforcement framework consists of square steel pipes and rebars. Two square steel pipes, with a wall thickness of 4 mm, are longitudinally aligned along the inner edge of the precast base slab, spaced 600 mm apart. Transverse rebars are evenly distributed on both the upper and lower surfaces of the square steel pipes, maintaining a spacing of 200 mm; the protective layer thickness for the lower transverse rebars is 20 mm. The longitudinal rebars are symmetrically positioned on the inner sides of the upper and lower transverse rebars, employing a C8 rebar, also spaced at 200 mm. The square steel pipes are constructed from Q235 material, while both the transverse and longitudinal rebars are made from HRB400 material.
In finite element analysis, the axial compressive strength and tensile strength of UHPC and NC materials, along with the yield strength of the reinforcement, are derived from standard values. The elastic modulus of the reinforcement is 2 × 10⁵ MPa. Figure 15 illustrates the design schematic of the precast bottom slab, while Table 4 provides detailed information on the basic parameters for the composite slab model design.

4.2. Mid-Span Deflection-Load Curve of Finite Element Analysis

The mid-span deflection of the nine superimposed slabs, along with the load (P − Δ) curve, is illustrated in Figure 16, Figure 17, Figure 18 and Figure 19. Additionally, Table 5 presents the cracking load, yield load, ultimate load, and their corresponding displacement values derived from the finite element simulation.

4.2.1. Wall Thickness of Square Steel Tube

Figure 16 presents the performance of square steel tubes with varying wall thicknesses (B-1, B-2, and B-3) in terms of the relationship between deflection and load. The data indicate that increasing the wall thickness of the steel tubes from the initial 4 mm to 5 mm and 6 mm has a negligible effect on the initial cracking load. However, the enhancement in wall thickness significantly influences both the yield load and the ultimate load. Specifically, the yield loads for B-2 and B-3 improve substantially by 10.55% and 20.78%, respectively, when the wall thickness increases from 4 mm to 5 mm and 6 mm. Correspondingly, the ultimate load capacities of B-2 and B-3 also experience significant increases of 6.59% and 12.93%, respectively. This evidence suggests that augmenting the wall thickness of square steel tubes considerably enhances the overall load-bearing capacity of composite slabs. Thus, it can be concluded that in terms of cost, although increasing the wall thickness of square steel tubes directly raises material costs, in many cases, the structural performance improvements brought about by this increase can offset the additional expenses. Thick-walled square steel tubes can withstand greater loads, thereby reducing the demand for other structural components and achieving overall weight reduction. Furthermore, reducing support structures or lowering future maintenance needs can further alleviate the long-term economic burden of usage. Secondly, regarding material availability, thick-walled square steel tubes are generally more common in the market, especially in large-scale construction and infrastructure projects with higher supply chain stability. These materials are relatively easy to procure, which can minimize delays caused by special material procurement. When selecting materials, contractors can respond more flexibly to various project demands, and this adaptability is crucial for the smooth implementation of projects. Additionally, in terms of construction feasibility, thicker square steel tubes are generally less prone to damage during on-site construction because of their sturdier design. This means that the risk of damage during handling and installation is significantly reduced. This advantage not only protects the investment but also enhances construction efficiency. Engineers can design structural systems with greater confidence to ensure their safety under extreme weather conditions and construction environments. In summary, it can be noted that the engineering benefits brought by moderately increasing the wall thickness of square steel tubes are multifaceted. Through scientific design and calculations, it is possible to enhance structural load-bearing capacity while effectively utilizing resources to ensure the economic viability and feasibility of the project. Therefore, in the context of the increasingly diversified demands of modern construction, promoting and applying moderately thick-walled square steel tubes will provide strong support and guarantees for the sustainable development of the construction industry.

4.2.2. Transverse Rebar Diameter

As demonstrated in Figure 17, the comparison of deflection–load curves at mid-span for composite slabs with varying transverse rebar diameters (B-1, B-4, and B-5) reveals that the yield load exhibits only a marginal improvement with an increase in transverse rebar diameter. Specifically, the yield loads for specimens B-4 and B-5 increased by 4.17% and 4.51%, respectively, compared to specimen B-1. Although there is a noticeable increase, these values indicate that the performance enhancement associated with increasing the transverse rebar diameter did not meet anticipated expectations. The increase in the diameter of transverse reinforcement has a minimal impact on the yield load of composite slabs. This is primarily because, during the structural loading process, the compressive performance of concrete and the tensile performance of the reinforcement together determine the overall load-bearing capacity of the slab. Although increasing the diameter of transverse reinforcement can moderately enhance the tensile strength of the reinforcement, the overall behavior of the composite slab may be predominantly influenced by other factors, such as the strength of the concrete and the arrangement of the reinforcement. Additionally, excessively large diameters of reinforcement may lead to a decrease in the bonding effect at the interface, thereby affecting the synergy between the concrete and the reinforcement. Therefore, when designing composite slabs, it is necessary to comprehensively consider the balance between the diameter of transverse reinforcement and other structural characteristics to ensure improved load capacity and durability without compromising.

4.2.3. Thickness of the Precast Base Slab

This study presents a comparative analysis of the effects of various prefabricated base plate thicknesses (40 mm, 60 mm, and 80 mm) on the performance of composite slabs, as illustrated in Figure 18. The findings reveal that while the variation in ultimate load is minimal, there is a notable improvement in both the cracking load and the yield load. Specifically, the cracking loads for B-1 and B-7 exceed that of B-6 by 9.12% and 10.17%, respectively, whereas the yield loads increase by 1.97% and 5.70%. These results indicate that increasing the thickness of the prefabricated base plate positively affects the enhancement of cracking and yield loads; however, the overall improvement remains limited compared to the increase in the wall thickness of square steel tubes. In terms of costs, increasing the thickness of precast floor panels typically results in higher material usage, leading to increased initial investment. This is particularly significant in large-scale engineering projects, where even a millimeter of additional thickness can have a substantial impact on the overall budget. Therefore, designers must weigh structural safety against economic feasibility to find the optimal thickness choice. Additionally, material availability is an important consideration. In certain regions, specific thicknesses of precast floor panel materials may not be easily accessible, or there may be limitations in inventory. Thus, project teams need to understand the specifications of available materials in the market to determine feasible thickness options. Moreover, regional standards and regulations may also influence material availability. Finally, construction feasibility is another critical factor affecting the thickness selection of precast floor panels. As the thickness of the panels increases, the construction process may face higher technical requirements or operational complexity. For example, thicker panels may necessitate stronger construction equipment and higher labor costs, which can subsequently affect the project’s timeline and progress. Therefore, construction teams must evaluate this in advance. In summary, although increasing the thickness of precast floor panels can improve the cracking load and yield load of the composite slabs to some extent, various factors such as cost, material availability, and construction feasibility must be comprehensively considered during the design process to achieve better engineering outcomes. By making informed decisions about the thickness of the panels, engineers can ensure structural safety while controlling project costs, enhancing construction efficiency, and ultimately achieving the engineering objectives.

4.2.4. Strength Grade of Precast Slab Concrete

This study presents an in-depth analysis of UHPC at various strength levels, with a specific focus on the differences in the mid-span deflection–load curves of precast slabs B-8 (strength level C140) and B-9 (strength level C100), as illustrated in Figure 19. The results reveal that as the strength of UHPC increases, the cracking load, yield load, and ultimate bearing capacity of the components also demonstrate significant enhancement, underscoring the strong correlation between concrete strength and structural performance. Specifically, the data show that the cracking load of precast slab B-1 is 8.27% higher than that of B-9, while the cracking load of B-8 is 35.30% greater than that of B-9. In terms of yield load, B-1 and B-8 exhibit impressive performance, with increases of 9.17% and 18.19%, respectively. Furthermore, the improvements in ultimate load are substantial, with the ultimate loads of B-1 and B-8 increasing by 4.07% and 8.22% compared to B-9, respectively. These findings clearly suggest that utilizing UHPC with higher strength levels can effectively enhance the bearing capacity and durability of structures. Despite the benefits of increasing concrete strength, it is important to note that the preparation process for UHPC is relatively complex and costly. Consequently, relying solely on high concrete strength does not necessarily offer advantages in terms of economic viability and practicality.

4.3. Analysis of the Entire Process of Force Application

Based on the P − Δ curve analysis of specimen B-1, the loading process can be categorized into three primary stages: (1) The first stage spans from initial loading to just prior to concrete cracking. During this phase, the composite slab undergoes only minor deformations, showing no visible cracks. The relationship between stress and strain remains linear, indicating a high initial stiffness. The mechanical behavior in this phase closely resembles that of elastic materials, signifying robust deformation resistance at the outset. (2) The second stage commences the moment the concrete cracks and continues until the yielding of the square steel tube. As the load increases, the concrete starts to experience tensile forces until it reaches its tensile limit, resulting in cracking. This phenomenon leads to a temporary drop in the load–deflection curve, reflecting a reduction in structural stiffness. However, as the square steel tube begins to accommodate additional tensile force, the curve swiftly rebounds, suggesting that the load-bearing capacity of the structure has been restored. (3) The third stage follows the yielding of the square steel tube. Although the overall stiffness of the composite slab diminishes and deformation significantly increases, its load-bearing capacity actually improves. Once the ultimate load is achieved, the concrete in the compression zone fails, leading to a loss of stability and load-carrying capacity, at which point stiffness experiences a sharp decline. The mechanical behavior during this stage indicates that while the component displays some plastic deformation capacity before failure, it ultimately cannot avoid failure.

4.3.1. Cracking Stage

In the ABAQUS post-processing module, the DAMAGET variable is a critical parameter used to represent the tensile damage of the material. Analyzing the value of DAMAGET enhances our understanding and evaluation of UHPC under external loading conditions. Specifically, when the DAMAGET value exceeds 0.75, it indicates the onset of cracking in the UHPC material; this threshold serves as a vital reference for assessing the safety of concrete structures. As the external load increases, the upward trend of the tensile damage factor further illustrates the development of cracks within the concrete.
The crack conditions observed at the bottom of the UHPC prefabricated slab, depicted in Figure 20a, illustrate the crack patterns resulting from applied loads. The presence of these cracks not only signifies material damage but may also compromise the structural integrity and stability. Figure 20b highlights that the maximum stress experienced by the lower section of the square steel tube is 73.60 MPa, concentrated in the central span area. Although this stress level has reached a notable value, it remains within a relatively low range overall. This finding suggests that, despite the UHPC material experiencing some load, the load-bearing structure remains robust and has not yet approached the failure threshold.

4.3.2. Yielding Stage

Equivalent plastic strain (PEEQ) serves as a critical indicator for assessing the yield state of square steel pipes. Effective monitoring and analysis of this parameter offer substantial assurance regarding the safety of engineering structures. A PEEQ value exceeding zero signifies that the material has entered a phase of irreversible plastic deformation, a crucial change for evaluating the actual load-bearing capacity of square steel pipes. By continuously monitoring PEEQ variations, researchers can accurately determine whether a square steel pipe has reached its yield point, which is vital for preventing structural failure. Figure 21a visually depicts the distribution of equivalent plastic strain within the square steel pipe under specific loading conditions, revealing that yielding first occurs at the bottom of the mid-span region, with a load value of 76.42 kN at that time.
Further analysis of the concrete’s performance indicates that the compressive strain in the cast-in-place layer consistently remains below the ultimate compressive strain, suggesting that the concrete has not sustained any damage. This observation implies that the concrete structure maintains a robust load-bearing capacity at the current loading stage. The specific strain distribution and its variations are illustrated in Figure 21b.

4.3.3. Limit Stage

The research results indicate that a comprehensive analysis was performed on the mechanical properties of cast-in-place ordinary concrete. It was observed that the compressive strain of this concrete reached an ultimate value of 0.0033. This measurement reflects the maximum deformation that concrete in the compressive zone can endure when subjected to axial pressure.
Upon reaching a mid-span displacement (the vertical displacement at the center of the bottom of the laminated board under load) of 52.13 mm, the ordinary concrete in the composite slab attained its ultimate compressive strain, resulting in crushing failure (it refers to a failure mode that occurs when concrete materials reach their compressive strength limit under significant loading, leading to damage due to compressive stress), as illustrated in Figure 22. This event signifies the onset of failure for the composite slab. Furthermore, the maximum load sustained by the specimen during testing was 120.98 kN, a value that serves as a significant reference for evaluating the bearing capacity of the composite slab. It is important to note that the strain distribution of the embedded steel reinforcement conveys critical insights, as demonstrated in Figure 23, where the yield zone progressively extends from the mid-span toward the loading supports. This observation indicates that as the load escalates, the yielding region of the component continues to enlarge, reflecting changes in the internal stress distribution and deformation patterns within the concrete.

5. Calculation of Bending Capacity of the Cross-Section

5.1. Basic Assumptions

The calculation of the flexural bearing capacity of the cross-section is predicated on several assumptions: (1) the strains within the section remain planar; (2) there is an effective bond between the steel pipe, reinforcement, and UHPC, preventing any relative slip; (3) the tensile strength of UHPC is acknowledged; (4) the analysis of the square steel pipe is simplified to an equivalent rectangular stress diagram; (5) the ultimate compressive strain εcu of the concrete at the compressed edge is considered to be 0.0033, with the maximum compressive stress defined as the standard axial compressive strength of concrete fc multiplied by the influence coefficient α1 for the compressive region’s concrete stress. In this study, the concrete strength grade is C30 and does not exceed C50, leading to a selection of α1 equal to 1.0. The stress diagram for the compressive region is further simplified to an equivalent rectangular stress diagram, with the height determined by the product of the neutral axis height, as derived from the plane section assumption, and the influence coefficient β for the concrete compressive stress diagram. When the concrete strength grade in the compressive region does not exceed C50, β is established at 0.8. (6) The stress–strain relationship of UHPC presented in the second section is utilized for these calculations.

5.2. Calculation Formula for the Bending Load-Bearing Capacity of a Normal Section

The stress diagram for the calculation of the bending bearing capacity of UHPC-NC prefabricated hollow composite slabs under ultimate load is shown in Figure 24. In the figure, b is the width of the composite slab section; x is the height of the equivalent compression zone; fy′ is the standard yield strength of the compression zone steel bars; As′ is the cross-sectional area of the compression steel bars; fa′ is the standard yield strength of the square steel tube; Aaf′ is the cross-sectional area of the compressed flange of the square steel tube; k is the coefficient of the equivalent rectangular stress diagram in the tension zone; ft is the standard axial tensile strength of ultra-high-performance concrete; fy is the standard yield strength of the tensile zone steel bars; As is the cross-sectional area of the tensile steel bars; fa is the standard axial tensile strength of the square steel tube; Aaf is the cross-sectional area of the tensile flange of the square steel tube; aa is the distance from the point of action of the resultant force of the tensile zone steel bars and the flange of the square steel tube to the edge of the tensile zone; h0 is the distance from the point of action of the resultant force of the tensile zone steel bars and the flange of the square steel tube to the edge of the compression zone, which is the effective height of the section; aa′ is the distance from the point of action of the resultant force of the compression zone steel bars and the flange of the square steel tube to the edge of the compression zone; Naw is the axial resultant force acting on the web of the square steel tube; Maw is the moment of the axial resultant force acting on the web of the square steel tube about the point of the resultant force of the tensile flange and the longitudinal tensile steel bars; δ1 is the ratio of the distance from the upper end of the square steel tube web to the edge of the concrete compression zone to h0; δ2 is the ratio of the distance from the lower end of the square steel tube web to the edge of the concrete compression zone to h0; tw is the thickness of the square steel tube.
This article formulates the static equilibrium equations by examining the balance between the axial force and the bending moment (refer to Equations (5) and (6)). It discusses the resultant force acting on the web of the square steel tube and the moment generated by this resultant force around the tensile flange and the longitudinal reinforcing steel of the square steel tube (refer to Equations (7) and (8)). The symbols in Equations (5)–(8) are illustrated in numbers 12–30 in Nomenclature.
α 1 f c bx + f y A s + f a A af + N aw = k f t b ( h x / β ) + f y A s + f a A af
M u = α 1 f c bx h 0 0.5 x + f y A s h 0 a a + f a A af h 0 a a k f t b ( h x / β ) 0.5 ( h x / β ) a a + M aw
N aw = 4 2.5 x / h 0 δ 1 + δ 2 t w h 0 f a
M aw = 4 0.5 δ 1 2 + δ 2 2 δ 1 + δ 2 + 2.5 x / h 0 1.25 x / h 0 2 t w h 0 f a

5.3. Comparison of Calculation Results

This article analyzes the cross-sectional dimensions and reinforcement area of nine composite slabs to calculate their flexural load-bearing capacity. Based on Equation (6), the theoretical flexural load-bearing capacity (denoted as Mup) was derived. Meanwhile, the corresponding ultimate load-bearing capacity (denoted as PuFE) was obtained through finite element simulation, leading to the calculated simulated flexural load-bearing capacity (denoted as MuFE). Finally, a comparative analysis was conducted between the theoretical and simulated results, with specific data detailed in Table 6. To further verify the consistency between the two, a ratio t = MuFE/Mup was defined and statistically analyzed. The results indicated that the average of this ratio reached 0.987, with a standard deviation of 0.0221 and a coefficient of variation of 0.0224. These data suggest that there is a high consistency between the bending performance of UHPC-NC prefabricated hollow composite slabs in practical use and their theoretical expectations. Therefore, it can be concluded that the method used in this study is capable of accurately predicting the actual load-bearing capacity of such components.

6. Conclusions

The main objective of this study is to investigate the flexural load-bearing capacity of prefabricated hollow composite slabs constructed from ultra-high-performance concrete (UHPC) and Normal Concrete (NC). By employing finite element modeling and validation comprehensively, this study aims to overcome the limitations of traditional composite slab design and optimize structural performance under modern building demands. The main conclusions of this study are as follows: (1) The application of UHPC significantly enhances the flexural performance and structural integrity of the composite slab. The results indicate that factors such as the wall thickness of square steel tubes and the strength of UHPC have a direct positive impact on the yield load and ultimate bearing capacity. (2) The research process identified the behavior at different stages during loading, including the cracking stage, yielding stage, and ultimate stage, providing key insights for understanding the response of composite slabs under different loads. (3) A new set of formulas was developed in this study for calculating the flexural capacity of the UHPC-NC composite slab, providing practical tools to assist engineers in design and analysis for real-world applications. Looking to the future, this research opens up multiple directions for further exploration. Future studies may include the performance of UHPC-NC composite slabs under different environmental conditions, the long-term durability and maintenance requirements of these structures, and the integration of potentially additional materials to further enhance their performance. The practical significance of this work lies in improving the efficiency, safety, and sustainability of building design. By combining the superior performance of UHPC with traditional materials, this innovative approach can meet the growing demand for high-strength and large-span structures in contemporary architecture. Ultimately, this research contributes to the ongoing development of prefabricated construction techniques and paves the way for more resilient and cost-effective building solutions in the future.

Author Contributions

Methodology, K.W.; Software, R.W. and Y.Z.; Validation, R.W.; Formal analysis, R.W., T.S. and Y.Z.; Resources, K.W.; Data curation, R.W., T.S. and Y.Z.; Writing—original draft, R.W.; Writing—review & editing, K.W.; Visualization, R.W. and T.S.; Funding acquisition, Y.Z. and K.W. All authors have read and agreed to the published version of the manuscript.

Funding

The authors gratefully acknowledge the support provided by the Yangzhou University graduate research and practice innovation program (KYCX23-3541), the Science and Technology Planning Project of Yangzhou City (YZ2024223), and the Open Fund of Key Lab of Structures Dynamic Behavior and Control of the Ministry of Education by the Harbin Institute of Technology (HITCE202105).

Data Availability Statement

The original contributions presented in this study are included in the article. Further inquiries can be directed to the corresponding authors.

Conflicts of Interest

Author Ruochen Wang was employed by the company Jiangsu Testing Center for Quality of Construction Engineering Co., Ltd. Author Tianyu Shi was employed by the company The Third Engineering Co., Ltd. of CCCC Fourth Harbor Engineering Co., Ltd. The remaining authors declare that the research was conducted in the absence of any commercial or financial relationships that could be construed as a potential conflict of interest.

Nomenclature

The article involves symbols in equations.
NumberSymbol NameSymbol Explanation
1fUcUnidirectional compression strength of UHPC
2εUc0Strain corresponding to the unidirectional compression strength of UHPC
3fUtUniaxial tensile strength of UHPC
4εUt0Strain corresponding to the uniaxial tensile strength of UHPC
5fcCompressive strength of plain concrete prism
6ε0The strain corresponding to the compressive strength of ordinary concrete prism
7αThe coefficient of the ascending segment of the uniaxial compression curve
8βThe coefficient of the descending segment of the uniaxial compression curve
9ftUniaxial tensile strength of concrete
10εt0Strain corresponding to the uniaxial tensile strength of ordinary concrete
11γCoefficient of the descending segment of the uniaxial tension curve
12bThe width of the composite slab section
13xThe height of the equivalent compression zone
14fy′The standard yield strength of the compression zone steel bars
15As′The cross-sectional area of the compression steel bars
16fa′The standard yield strength of the square steel tube
17Aaf′The cross-sectional area of the compressed flange of the square steel tube
18kThe coefficient of the equivalent rectangular stress diagram in the tension zone
19fyThe standard yield strength of the tensile zone steel bars
20AsThe cross-sectional area of the tensile steel bars
21faThe standard axial tensile strength of the square steel tube
22AafThe cross-sectional area of the tensile flange of the square steel tube
23aaThe distance from the point of action of the resultant force of the tensile zone steel bars and the flange of the square steel tube to the edge of the tensile zone
24h0The distance from the point of action of the resultant force of the tensile zone steel bars and the flange of the square steel tube to the edge of the compression zone
25aa′The distance from the point of action of the resultant force of the compression zone steel bars and the flange of the square steel tube to the edge of the compression zone
26NawThe axial resultant force acting on the web of the square steel tube
27MawThe moment of the axial resultant force acting on the web of the square steel tube about the point of the resultant force of the tensile flange and the longitudinal tensile steel bars
28δ1the ratio of the distance from the upper end of the square steel tube web to the edge of the concrete compression zone to h0
29δ2the ratio of the distance from the lower end of the square steel tube web to the edge of the concrete compression zone to h0
30twThe thickness of the square steel tube

References

  1. Umoh, A.A.; Adefemi, A.; Ibewe, K.I.; Etukudoh, E.A.; Ilojianya, V.I.; Nwokediegwu, Z.Q. Green Architecture and Energy Efficiency: A Review of Innovative Design and Construction Techniques. Eng. Sci. Technol. J. 2024, 5, 185–200. [Google Scholar] [CrossRef]
  2. Mansourimajoumerd, P.; Bazazzadeh, H.; Mahdavinejad, M.; Nia, S.N. Energy Efficiency and Building’s Envelope: An Integrated Approach to High-Performance Architecture. In Urban and Transit Planning; Alberti, F., Matamanda, A.R., He, B.-J., Galderisi, A., Smol, M., Gallo, P., Eds.; Springer International Publishing: Cham, Switzerland, 2023; pp. 25–33. [Google Scholar]
  3. Dixit, S.; Stefańska, A. Bio-Logic, a Review on the Biomimetic Application in Architectural and Structural Design. Ain Shams Eng. J. 2023, 14, 101822. [Google Scholar] [CrossRef]
  4. Alsakka, F.; Haddad, A.; Ezzedine, F.; Salami, G.; Dabaghi, M.; Hamzeh, F. Generative Design for More Economical and Environmentally Sustainable Reinforced Concrete Structures. J. Clean. Prod. 2023, 387, 135829. [Google Scholar] [CrossRef]
  5. Chen, C. Advantages and Barriers of Modular Construction Method in Constructing Buildings. Proc. Inst. Civ. Eng.-Smart Infrastruct. Constr. 2023, 176, 75–84. [Google Scholar] [CrossRef]
  6. Jayawardana, J.; Sandanayake, M.; Jayasinghe, J.A.S.C.; Kulatunga, A.K.; Zhang, G. A Comparative Life Cycle Assessment of Prefabricated and Traditional Construction—A Case of a Developing Country. J. Build. Eng. 2023, 72, 106550. [Google Scholar] [CrossRef]
  7. Sridhar, S.; Kumar, V.; Yamini, Y.; Cheran, C. Cheran State-of-the-Art Review on Precast Composite Sandwich Slab Panels. AIP Conf. Proc. 2023, 2766, 20079. [Google Scholar] [CrossRef]
  8. Sah, T.P.; Lacey, A.W.; Hao, H.; Chen, W. Prefabricated Concrete Sandwich and Other Lightweight Wall Panels for Sustainable Building Construction: State-of-the-Art Review. J. Build. Eng. 2024, 89, 109391. [Google Scholar] [CrossRef]
  9. Priyanga, R.; Muthadhi, A. Bending Analysis of Textile Reinforced Concrete Sandwich Panels: Experimental and Numerical Evaluation. Constr. Build. Mater. 2024, 439, 137213. [Google Scholar] [CrossRef]
  10. Nie, J.; Wang, J.; Gou, S.; Zhu, Y.; Fan, J. Technological Development and Engineering Applications of Novel Steel-Concrete Composite Structures. Front. Struct. Civ. Eng. 2019, 13, 1–14. [Google Scholar] [CrossRef]
  11. Jia, L.; Li, Q.; Zhang, Y.; Zhao, W.; Du, M. Experimental Study of the Hysteretic Behavior of Prefabricated Frame-Shear Wall Structures with Grouting Sleeve Connections. J. Build. Eng. 2022, 57, 104704. [Google Scholar] [CrossRef]
  12. Wang, F.-C.; Han, L.-H. Analytical Behavior of Carbon Steel-Concrete-Stainless Steel Double-Skin Tube (DST) Used in Submarine Pipeline Structure. Mar. Struct. 2019, 63, 99–116. [Google Scholar] [CrossRef]
  13. Nakahara, H.; Uchida, K.; Yanai, Y. Test and Analysis for Shearing Behavior of Circular CFST Columns. Buildings 2024, 14, 3871. [Google Scholar] [CrossRef]
  14. Qasim, M.; Lee, C.K.; Zhang, Y.X. Flexural Strengthening of Reinforced Concrete Beams Using Hybrid Fibre Reinforced Engineered Cementitious Composite. Eng. Struct. 2023, 284, 115992. [Google Scholar] [CrossRef]
  15. Zhu, Y.; Zhang, Y.; Hussein, H.H.; Chen, G. Numerical Modeling for Damaged Reinforced Concrete Slab Strengthened by Ultra-High Performance Concrete (UHPC) Layer. Eng. Struct. 2020, 209, 110031. [Google Scholar] [CrossRef]
  16. Xue, J.; Briseghella, B.; Huang, F.; Nuti, C.; Tabatabai, H.; Chen, B. Review of Ultra-High Performance Concrete and Its Application in Bridge Engineering. Constr. Build. Mater. 2020, 260, 119844. [Google Scholar] [CrossRef]
  17. Abo El-Khier, M.; Morcous, G. Precast Concrete Deck-to-Girder Connection Using Ultra-High Performance Concrete (UHPC) Shear Pockets. Eng. Struct. 2021, 248, 113082. [Google Scholar] [CrossRef]
  18. Wang, H.; Liu, X.; Yue, Q.; Wang, N.; Zheng, M. Longitudinal Shear Behavior and Design Method of UHPC Connection for Prefabricated Slabs in Composite Beams. Eng. Struct. 2023, 277, 115386. [Google Scholar] [CrossRef]
  19. Momeni, M.; Demetriou, D.; Papadakis, L.; Bedon, C.; Petrou, M.F.; Nicolaides, D. Damage Investigation of Blast Loaded UHPFRC Panels with Optimized Mixture Design Using Advanced Material Models. Results Eng. 2024, 23, 102518. [Google Scholar] [CrossRef]
  20. Zheng, W.; Li, L.; Lu, S. Experimental Research on Mechanical Performance of Normal Section of Reinforced Reactive Powder Concrete Beam. J. Build. Struct. 2011, 32, 125–134. [Google Scholar] [CrossRef]
  21. Wang, J. Test and Analysis of Flexural Bearing Capacity of Ultra High Performance Concrete Encased Steel Box Beam. Master’s Thesis, Yangzhou University, Yangzhou, China, 2024. [Google Scholar]
  22. Ji, B. Study on Flexural Performance of Steel Reinforced Ultra-High Performance Concrete Beams with Rectangular Section. Master’s Thesis, Fujian University of Technology, Fuzhou, China, 2023. [Google Scholar]
  23. Guo, Z. Strength and Deformation of Concrete-Experimental Basis and Constitutive Relationship; Tsinghua University Press: Beijing, China, 1977. [Google Scholar]
  24. Rong, X.; Zhang, Z.; Zhang, J. Mechanical Behavior of New Type Prefabricated High Strength Reinforced Concrete Frame Joints. Spat. Struct. 2023, 23, 88–96. [Google Scholar]
  25. Li, K.; Zheng, W.; Hou, C.; Wang, Y. Unified Equation of Confined Concrete Stress-Strain Curve under Axial Compression. J. Harbin Inst. Technol. 2021, 53, 10–30. [Google Scholar]
  26. Peng, X.; Yu, A.; Fang, Y. An Analysis on Parameters for Concrete Damage Plasticity Model. J. Suzhou Univ. Sci. Technol. 2010, 23, 40–43. [Google Scholar]
  27. Luo, B. Research on Designing Theory and Experimental among Flexural Performance of Precast Concrete Composite Slabs with Different Shapes. Ph.D. Thesis, Xi’an University of Architecture and Technology, Xi’an, China, 2019. [Google Scholar]
  28. Wang, R. Study on the Force Performance of New Assembled Reinforced Truss Concrete Laminated Slab. Master’s Thesis, Xi’an Technological University, Xi’an, China, 2023. [Google Scholar]
  29. Li, G.; Chen, B.; Zhang, G.; Wu, H. Numerical Analysis on Autoclaved Aerated Concrete Panel by Ansys. J. Build. Technol. 2018, 49, 41–43. [Google Scholar]
  30. Hu, P. Test and Analysis of the Flexural Behavior of the Concrete Beam Encased Grouted-Filled Square Steel Tube Truss. Master’s Thesis, Yangzhou University, Yangzhou, China, 2019. [Google Scholar]
  31. Kang, H. Research on Static and Fatigue Performance of Prefabricated Steel Reinforced Concrete Beams Strengthened with UHPC. Master’s Thesis, Henan University of Technology, Zhengzhou, China, 2024. [Google Scholar]
  32. Liu, Z.; Ren, B.; Xue, J. Experimental Study and Finite Element Analysis on Flexural Performance of High-Strength Steel Reinforced Ultra-High Performance Concrete Beam. Eng. Mech. 2023, 40, 102–115. [Google Scholar]
Figure 1. Schematic diagram of UHPC-NC prefabricated hollow composite slabs.
Buildings 15 00519 g001
Figure 2. The deflection–load curve under different viscosity coefficients.
Buildings 15 00519 g002
Figure 3. Finite element model of UHPC-NC modular hollow composite panels. (a) Load and boundary constraints. (b) Built-in steel reinforcement framework.
Buildings 15 00519 g003
Figure 4. The three-dimensional structural diagram of specimen B-5.
Buildings 15 00519 g004
Figure 5. B-5 specimen section dimensions and reinforcement diagram (unit: mm).
Buildings 15 00519 g005
Figure 6. Test and simulated values of mid-span deflection–load curves.
Buildings 15 00519 g006
Figure 7. The three-dimensional structural diagram of test piece RSPB-1-1.
Buildings 15 00519 g007
Figure 8. Elevation drawing of test piece RSPB-1-1.
Buildings 15 00519 g008
Figure 9. The cross-sectional dimensions of test piece RSPB-1-1 (unit: mm).
Buildings 15 00519 g009
Figure 10. Test and simulated values of mid-span deflection–load curves.
Buildings 15 00519 g010
Figure 11. The three-dimensional structural diagram of test piece B-1.
Buildings 15 00519 g011
Figure 12. Elevation drawing of test piece B-1.
Buildings 15 00519 g012
Figure 13. The cross-sectional dimensions of test piece B-1 (unit: mm).
Buildings 15 00519 g013
Figure 14. Test and simulated values of mid-span deflection–load curves.
Buildings 15 00519 g014
Figure 15. The design sketch of the prefabricated baseboard.
Buildings 15 00519 g015
Figure 16. Wall thickness of square steel pipe.
Buildings 15 00519 g016
Figure 17. Transverse rebar diameter.
Buildings 15 00519 g017
Figure 18. Thickness of the precast slab.
Buildings 15 00519 g018
Figure 19. Concrete strength class for precast base slabs.
Buildings 15 00519 g019
Figure 20. The prefabricated base plate is exhibiting cracks. (a) Damage diagram of laminated plates under tension. (b) Stress diagram of reinforced framework.
Buildings 15 00519 g020
Figure 21. Equivalent plastic strain of the square steel pipe framework and strain diagram in the long side direction of the specimen. (a) The equivalent plastic strain of the reinforced concrete framework. (b) The strain diagram of the composite panel.
Buildings 15 00519 g021
Figure 22. The ordinary concrete in the compressed zone reaches the ultimate compressive strain.
Buildings 15 00519 g022
Figure 23. Equivalent plastic strain distribution map of the embedded reinforced framework.
Buildings 15 00519 g023
Figure 24. The stress diagram for calculating the bending load-bearing capacity of UHPC-NC prefabricated hollow slab under ultimate load.
Buildings 15 00519 g024
Table 1. CDP model parameter settings.
Ψζfb0/fc0Kcμ
30°0.11.160.66670.005
Table 2. Comparison of load results.
NumberProcessing MethodsAdvantagesDisadvantages
1Tie① Fast computation speed;
② Easy to model as a whole;
③ Favorable for convergence.
① Neglect the bonding and slipping behavior;
② The difference in strength between the old and new concrete affects the calculation results.
2Spring unitIt can more accurately simulate the mechanical properties before the bonding failure.① Modeling is cumbersome and the computational load is high;
② It is difficult to accurately determine the failure criteria of springs.
3Cohesion unit① The damage and failure modes of the interface can be intuitively observed;
② Effectively simulating mechanical behavior.
The modeling process is complex and requires bonding multiple components together.
4Contact pairIt can better analyze the behavior of the bonding interface in the later stages of loading.The convergence is poor, and complex models require multiple adjustments.
5Cohesion–friction mixture model① Considering both cohesive force and frictional force;
② Can effectively simulate the mechanical behavior of concrete interface.
There may be a failure of cohesion and tangential forces, resulting in the inability to consider both simultaneously.
Table 3. Comparison of load results.
NumberPyt/kNPyFE/kNPyt/PyFEPut/kNPuFE/kNPut/PuFEAverage ValueStandard Deviation
Test Piece B-5110.00112.650.98196.00197.100.991.0000.0141
Test Piece RSPB-1-1341.68339.841.01365.02362.281.01
Test Piece B-1295.19298.790.99544.48533.261.02
Table 4. The basic parameter settings for the design of the composite board model.
NumberWall Thickness of the Square Steel Tubes/mmDiameter of the Transverse RebarThickness of the Precast Bottom Slab/mmStrength Grade of Precast Slab Concrete
B-14C660C120
B-25C660C120
B-36C660C120
B-44C860C120
B-54C1060C120
B-64C640C120
B-74C680C120
B-84C660C140
B-94C660C100
Table 5. The simulation results of the finite element analysis.
NumberCracking Load/kNCrack Displacement/mmYield Load/kNYield Displacement/mmUltimate Load/kNLimiting Displacement/mm
B-158.373.9176.4210.46120.9852.13
B-259.703.9384.4811.04128.9550.15
B-360.393.9092.3011.44136.6248.08
B-457.793.8979.6111.01121.4953.00
B-557.793.9279.8711.16120.7851.00
B-653.493.9674.9410.76121.7359.64
B-758.933.8679.2110.64123.8051.18
B-872.944.2082.7310.65125.8051.41
B-953.913.3770.0010.12116.2552.45
Standard Deviation5.330.205.940.385.562.99
Table 6. The comparison between the calculated and simulated bending bearing capacity values of UHPC-NC prefabricated hollow composite slabs.
NumberMup/kN·mMuFE/kN·mMuFE/Mup
B-176.6375.610.99
B-284.4480.590.95
B-386.3285.390.99
B-476.6375.930.99
B-576.6375.490.99
B-676.6376.080.99
B-776.6377.381.01
B-877.0678.631.02
B-976.1972.660.95
Disclaimer/Publisher’s Note: The statements, opinions and data contained in all publications are solely those of the individual author(s) and contributor(s) and not of MDPI and/or the editor(s). MDPI and/or the editor(s) disclaim responsibility for any injury to people or property resulting from any ideas, methods, instructions or products referred to in the content.

