Abstract
This study presents an innovative 4D digital model that integrates Bridge Information Modeling (BrIM) with several types of data to defect detection in complex bridge structures. The model promotes precise data preparation, navigation, visualization, integration, and monitoring, enabling the identification of defects, like material deterioration, condition changes, and structural clashes in components like trusses. Bridge model provides time-based access to maps, allowing users to explore changes over time and predict future conditions. The integration of time dimension into the 4D model provides dynamic tools for exploring changes over time, allowing for analysis and maintenance planning. Through the use of advanced 4D simulation technology, the study’s effectiveness is in visualizing workflows, identifying constraints, and supporting proactive decision-making in structural management. By incorporating various perspectives and enabling users to interact with detailed visualizations, the model enhances understanding and maintenance practices. This approach advances defect modeling and digitization, supporting automation in defect detection while significantly contributing to the long-term safety and sustainability of bridges. In order to obtain non-destructive images and films of the morphology of the sandstone’s internal structure at the bridge pier in addition to the stone’s grain texture and surface characteristics, this research applied X-ray computed tomography approach (CT scan) and XRF as NDT to the analysis of sandstone.
1. Introduction
Bridge piers are fundamental to the structural integrity of bridges, serving as load-bearing components that support spans and transfer loads to the foundation. Unlike other bridge elements, piers are subjected to unique environmental and operational challenges, including continuous exposure to water, sediment abrasion, and chemical degradation from salts and pollutants. These factors accelerate material deterioration, leading to defects such as cracking, spalling, and loss of structural integrity.
The assessment and maintenance of bridge piers are crucial for guaranteeing the long-term safety and stability of bridge structures. Traditional methods, such as manual inspections and periodic underwater surveys, are time-consuming, labor-intensive, and prone to human error. The study [1] proposes an innovative 4D digital model that integrates Bridge Information Modeling (BrIM) with advanced defect detection technologies to enhance the monitoring and treatment of pier-specific defects.
This research focuses on the use of nanomaterial-based consolidation methods, coupled with non-destructive techniques, like CT scanning and SEM analysis, to restore sandstone piers affected by environmental stresses. By incorporating time-based simulations and predictive tools, the 4D model offers a comprehensive framework for tracking changes in pier conditions and planning proactive maintenance.
While the methodologies discussed may benefit other bridge components, this study emphasizes bridge piers due to their critical role and susceptibility to unique challenges. The findings aim to advance defect detection and restoration practices, contributing to the long-term preservation of these vital structural elements.
The assessment of building conditions and related risks is a critical task for maintaining structural integrity and safety. Traditionally, identifying defects in buildings has relied heavily on manual inspection methods, which can be time-consuming, labor-intensive, and prone to human error [2,3,4]. The presence of construction defects, often resulting from human error or oversight, can significantly affect the building’s performance, durability, and overall safety [5,6,7]. To address this issue, the development of automated techniques for defect detection has gained significant attention [8,9,10,11].
Finding defects has always been crucial to assessing a building’s condition and risk. The sensors may be positioned anywhere and targeted at any part of the structure, and the photos they take can be quantitatively interpreted utilizing defect photography employing 3D range sensors from an external exposure position. Study [12] presented an enhancement of a recently developed technique for recovering 3D BIM objects from 3D range surveying data in order to detect object defects. A technique for modeling and 3D-altering building defects utilizing several types of data and sensors was developed in this study. The benefit of the method was the adaptability it offered in addressing complex defects for which a single method is inadequate.
At the moment, dimensional observing and defect modeling systems are restricted to building elements with regular shapes and uniform thickness. Additional research is needed to expand to other types of building elements and defects with more complex geometries (e.g., trusses, columns, piers, and supports) [12,13]. It is suggested to utilize advanced technologies, such as noncontact sensing systems, artificial intelligence, and machine learning, to accurately and efficiently identify defects, leading to next-generation measurement technology for structural health monitoring [14,15].
Recent advances have led to the investigation of non-contact approaches for dynamic behavior analysis. One such approach is 3D Laser Doppler Vibrometry (3D LVD), which measures surface vibrations with great precision and without causing any damage. This method employs laser interferometry to assess the velocity of surface points on a structure, facilitating the characterization of dynamic behavior under different loading conditions [16].
The contactless nature of 3D LVD makes it ideal for complicated geometries or circumstances where standard approaches may be impracticable. Further research into this approach and its applications in building flaw identification, coupled with other sophisticated technologies, such as Digital Image Correlation and UAV-based inspections, offers promise for a more complete knowledge of structural health and performance [17,18,19]. A combination of unmanned aerial vehicle (UAV) or unmanned aircraft system (UAS) flights and terrestrial laser scanner flights were carried out in [20] in order to thoroughly inspect such a complicated building. Large volumes of data were produced by the studies, offering a comprehensive and worldwide metric record of Italy’s Frinco Castle. However, it was essential to combine this data into coherent and consistent 2D and 3D outputs in order to speed up the restoration process. Therefore, this study’s main goals were to fuse point clouds from several sensors, align different datasets, refine metric data, and evaluate the correctness of these procedures.
Furthermore, the sandstone at bridge piers has been adversely affected by the combined impact of groundwater exposure and changing temperatures, both of which are characteristic environmental factors in the region. These factors have led to the disintegration of stone, detachment of layers, and mechanical damage caused by factors such as salt crystallization, fluctuations in relative humidity, and temperature variations. Moreover, air pollution and evaporation have led to chemical deterioration, causing colored crusts to form on stone surfaces and causing the presence of flaking forms. In addition to the effect of macro-scale agents, such as earthquakes, sandstone’s durability has been compromised by micro-scale weathering processes, including the effects of wind, rain, and temperature fluctuations. These processes have rapidly altered the stone’s petro-physical properties, leading to the formation of cracks, fissures, and exfoliation. As a result, these vital structures have suffered significant damage, affecting their structural integrity and aesthetic value.
Combining BIM data with 4D range images opens up a wide range of options. The necessity of precise and trustworthy information in the construction industry is emphasized by the significance of recording building modifications throughout their entire cycle. One useful technique for keeping pertinent data is Building Information Modeling (BIM). Data registration using the Iterative Closest Point (ICP) algorithm and the accuracy of 3D point cloud models was assessed in [21]. The article emphasized the importance of assessing the quality of 3D modeling.
The research team [22] introduced the use of machine learning in combination with 3D scanning techniques to identify defects in a variety of construction components, including walls, pillars, staircases, ceilings, and foundations. They took actual pictures of the exterior and interior building components using LiDAR and ZED camera systems. Because of its affordable solution, which offered a cheap initial speculation and reduced lifecycle costs, it was possible for both large construction businesses and smaller contractors.
In order to avoid disastrous failures, it is crucial to quickly detect and evaluate any possible structural damage to building structures. The requirement for a trustworthy technique to identify structural damage is emphasized by [23]. Early discovery can guarantee the long-term preservation and safety of structures and assist with stopping more damage. The recommendation was to focus on artificial intelligence. Advanced AI algorithms allow us to automate the process of analyzing point data and creating 4D Defects Information Models 4D DIM. This significantly speeds up the digitization process, which is important when examining larger and more complex buildings.
One of the most important areas for visualizing exact information is bridge structural modeling. It was recommended in [24] that global design reference and as-built data be registered. In that study, a unique Artificial Neural Network (ANN)-based registration method was presented. Due to the small amount of error between the as-built and design models, the results showed that the proposed registration method is achievable. As a result, the proposed technique may be used as a registration method for laser scanning bridge projects. Deep Learning (DL) was proposed as a way to enhance the registration process.
Study [25] represented an automated progression to form filtering data of the as-built truss model with its CAD model to identify and correct geometric defects and imprecision. Instead of processing the 3D model points by hand, the BPNN architecture offered the finest coordinates processing training. It was applied to improve the process of establishing points between the input scanned coordinates of the as-built model and the output of the genuine CAD coordinates. By lowering the mean square error between the network output and the intended output, this was achieved. The RMSE in x, y, xy, z, and space vector R for all processing jobs was computed in a way that was deemed acceptable.
Damages occur during the construction or transportation of the structure. However, because assessment systems are dependent on measurements at specific sites and times and are not part of full electronic approaches, they are unable to adequately detect problems that occur during the construction process. In order to avoid significant rework costs, it is crucial to constantly monitor building advancements. Through a case study of a bridge in Canada, [26] demonstrated an automated advancement to register remote sensing data of the as-built model with BrIM (Bridge Information Model) for a constructed bridge in order to validate the intended method for monitoring the structural defects.
Bridges are dynamic structures constantly exposed to time-dependent forces, such as wind, traffic, and seismic events, which necessitate advanced methods for understanding and mitigating their responses. Despite the significant advancements in digital modeling techniques, such as 4D BrIM (Bridge Information Modeling) systems, these models often lack the capability of performing structural dynamic analyses [27], limiting their application in assessing and predicting dynamic responses under various load conditions. To address this limitation, integrating structural dynamic analysis into digital models is crucial for evaluating behaviors such as oscillations, vibrations, and stress distribution caused by non-stationary and time-varying loads. Recent research offers promising methodologies to enhance this capability. For example, the study [28] by the Journal of Sound and Vibration presents a 2D interpolation-enhanced approach for the efficient buffeting analysis of long-span bridges under non-stationary winds, providing a framework to simulate fluctuating wind forces and their impact on structural elements. Similarly, research published in Mechanical Systems and Signal Processing demonstrates the utility of Kalman-type filtering algorithms to estimate the full-field dynamic response of floating bridges in real time, using sensor-based data to refine predictions and monitor responses dynamically.
Furthermore, the ASCE Journal of Structural Engineering [29] highlights the importance of analyzing time-varying wind spectra and coherences for typhoon-induced buffeting in long-span bridges, emphasizing the need for time-dependent modeling techniques to capture complex interactions between environmental loads and structural behavior. By incorporating these methodologies, digital models can be transformed into comprehensive tools for evaluating and mitigating the effects of dynamic forces, enhancing their utility in real-world applications. This integration would allow for predictive maintenance, improved safety, and the design of resilient infrastructure capable of withstanding the challenges posed by dynamic environmental and operational conditions.
In previous studies, researchers periodically scanned construction sites with a multi-source of data and sensors, produced models of each case study, and identified geometric irregularities as errors. A digital and automated inspection process is required to address variations and construction errors. Developing the usage of 4D CAD models to identify defects and errors in building components is another way to address this investigation.
This research offers an innovative approach to develop an integrated 4D digital model that combines Bridge Information Modeling (BrIM) with several types of data to enhance the detection of defects, particularly in complex geometries. It also examines the application of digital monitoring for comprehensive and structural continuous assessment, focusing on effective defect modeling in irregular and intricate construction elements, such as trusses.
Additionally, this study intends to explore the role of 4D digital defect detection and monitoring to integrate several types of data and designed models, ultimately improving the effectiveness of defect modeling, supporting the automation of defect identification and accelerating digitization, with a focus on long-term structure safety and maintenance. The integration of time dimension into the 4D model provides dynamic tools for exploring changes over time, allowing for analysis and maintenance planning.
Moreover, this study aims to introduce a sustainable method for consolidating buildings (bridge piers) using a nanocomposite combination. The CT scanning technique, XRF and SEM-EDX analysis have been applied for evaluating the efficacy of the nanocomposite’s consolidant and chemical composition. As a non-destructive technique, a CT scan offers precise details of the surface morphology and the interior structure [30,31,32,33,34,35], while SEM-EDX analysis [36,37,38,39,40] exposes the alteration in the surface morphology and stone characteristics. The properties of the sandstone were compared before and after applying the stone strengthener and nanomixture consolidants. By exploring the combined use of these technologies, this research endeavors to contribute to this emerging field by investigating the synergistic potential of these technologies in the development of a novel and sustainable approach to bridge infrastructure maintenance.
2. Data and Materials Classification
The observational information is distributed into several types of data, which can be classified as inspection reports, historical data, maintenance records, and geometrical drawings, as shown in Figure 1. Another type of data was used in this study: the design of a 3D CAD model of the bridge, as shown in Figure 2. In the case study results, these types of observations are combined and integrated together and represented as parts of the 4D BrIM to monitor the existing state of the bridge as it is.
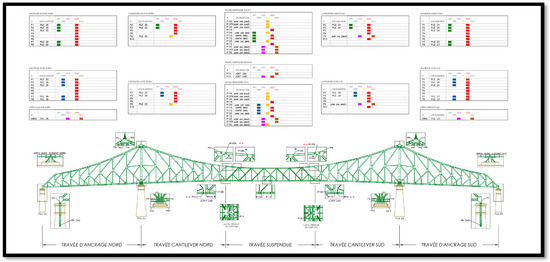
Figure 1.
Historical data, maintenance records, and geometrical drawings [27].
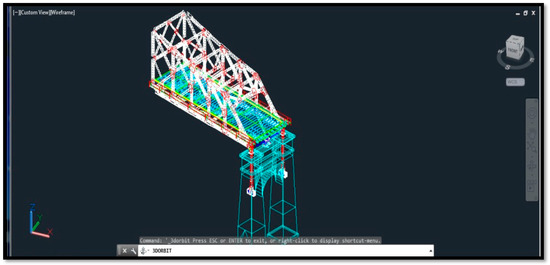
Figure 2.
3D CAD model of the bridge.
Samples Collection (Sampling): The sandstone samples were obtained from the site and subsequently shaped into 3 × 3 × 3 cm cubes, as per the specifications of the analysis apparatus.
3. Methodology
As mentioned above, all previous data were integrated together with the time into a 4D model of the bridge. In order to achieve this, adopting a clear method plan as indicated in Figure 3, was very necessary due to the complicated relationship between manual, schedule, and digital data. At this point, incorporating all available data, such as maintenance reports, related time events, and detailed drawings, into the 4D CAD model was the major priority of this work. The application of this practice will certainly help in ensuring compatibility among all inspectors who are interesting in direct accessing of the project’s data. Figure 3 clarifies the methodological steps followed in the study. Additional information, discussions, and results regarding the approach are provided in the ensuing sections.
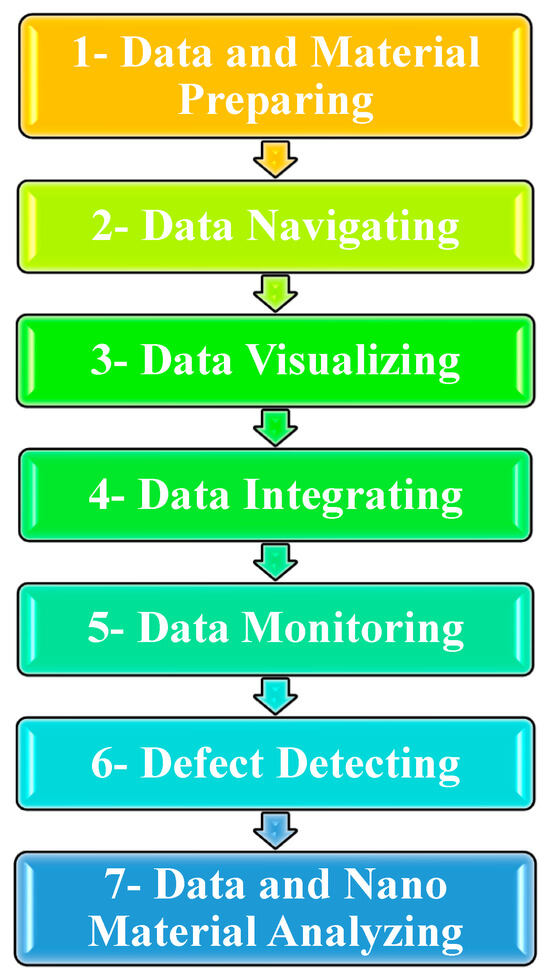
Figure 3.
Method plan.
3.1. Data and Material Preparing
The suggested method in this case study is related to the visualization concept. The management model system can be explored by interacting with the 4D model. Appropriate data are directly attached to the components of the 4D model. Inspectors can realize the model, check maintenance data, and issue effective decisions and attach them to the 4D model component.
The sandstone’s grain texture, material structure, and morphological properties were examined prior to and subsequent to treatment utilizing CT scanning, XRF, and SEM analysis. The samples underwent treatment with a nanomaterial mixture consisting of Nano-silica, tetraethoxysilane (TEOS), and the TEOS polymer.
Nanomaterials were utilized for the consolidation process. The Nano-silica, with an average size of 70 nanometers, was evenly distributed in a 1% concentration of ethanol. This mixture was then combined with TEOS in a 1:1 ratio. Next, the nanomixture underwent sonication by dispersing 10 grams per milliliter of Nano-silica powder in 1000 milliliters of ethanol for 20 min utilizing ultrasonic waves.
3.2. Data Navigating
By using the modeling software (Navisworks 2024), it is very simple to select any component of the 4D model to access required data. To illustrate, the modeling software allow the user to simply rotate, move, magnify and check the dimensions of the 4D model by using a keyboard and mouse in order to easily access any required point in the model.
3.3. Data Visualizing
The visualization concept in the modeling software aims to view objects in full dimensionality, providing a comprehensive understanding of their structure. This feature supports various visualization techniques. Ultimately, visualization enhances the user’s ability to interpret complex models with clarity and accuracy.
3.4. Data Integrating
As shown in Figure 4, in the data integrating process and basic information, such as the maintenance plan and history (detection records), are typically displayed in conventional forms or tables. These tables organize essential data, such as real-time data, providing a structured view (construction history) that users can quickly interpret. Furthermore, conventional methods often use 4D CAD drawings models to visualize any geometrical maps, making it easier for users to understand spatial relationships and design layouts. Statistical data are frequently provided in PDF format, ensuring that important figures and trends are preserved in a standardized and shareable form. This method organizes and presents diverse data types for quick reference and analysis.
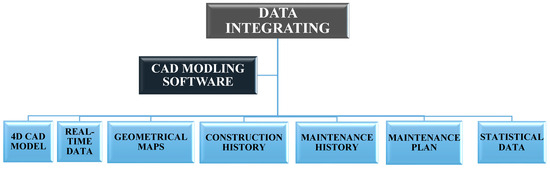
Figure 4.
Data integrating process.
Simulation-Based Corrosion Prediction: To evaluate the long-term effects of environmental factors on bridge trusses, this study employed predictive simulation techniques. Historical records indicate that steel trusses have been exposed to high humidity and salt spray for a lot of years, with material tests showing a surface morphology. Using these data, a predictive defected model integrates environmental parameters to simulate defects under various future scenarios, such as unchanged climate conditions or increased rainfall.
3.5. Data Monitoring
Contracts, regulations, and other written documents could be saved and explored in the 4D model or saved as image files after digitization through scanning. Consequently, these files could be approached in their original file formats and users can access it easily.
3.6. Defect Detecting
Four-Dimensional Defects Information Models (4DDIM) of structure objects are rapidly becoming more affordable in many fields, such as defect inspection, time visualization, animation, and defect identification. 4D CAD models of the defects are also needed for defect digital archiving. These models are beneficial in case of loss or damage of the structural objects.
The physical structural information of the bridge floor beam as shown in Figure 5, primarily encompasses its geometric configuration and material composition, which collectively influence its role in ensuring stability and load distribution. These data serve as a foundation for assessing the angle’s performance within the bridge framework, particularly under varying operational conditions.
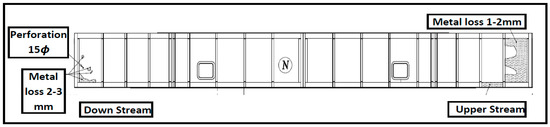
Figure 5.
Structural physical information of defected floor Beam [12].
3.7. Data and Nanomaterial Analysis
The findings of this research, as shown in Figure 6, are confirmed by the cross-examination employing a CT scan and SEM. The present research is a pioneering effort in the field of heritage conservation, as it is the first known instance of utilizing CT scanning for the treatment of sandstones.
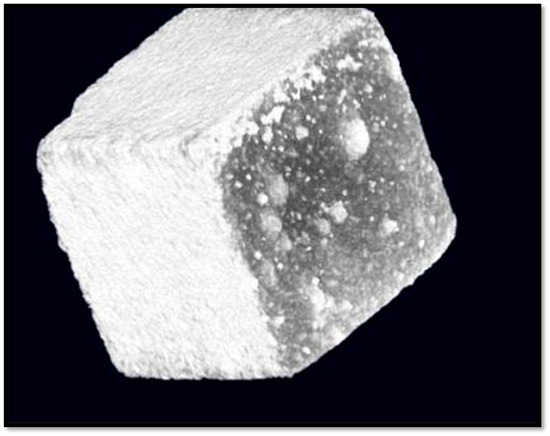
Figure 6.
3D CT image reveals the morphological characteristics of sandstone after treatment.
CT Scanning Imaging: The present investigation used CT scanning as a non-invasive approach to precisely analyze the surface morphology and evaluate the substrate prior to and subsequent to consolidation with a view of 20 mm and a scan period of 4.5 min.
SEM Investigation (morphological study): The sandstone samples were examined for surface morphology utilizing a scanning electron microscope (SEM) model JEOL/JSM-5500LV. The voltage of the Acel. Volt. was 30 kilovolts.
XRF Analysis (Spectroscopic study): X-ray fluorescence (XRF) was employed for the detection and characterization of the constituent components in sandstone. By irradiating the sandstone samples with X-rays, XRF can identify the different elements present in the sandstone, such as silica, iron, calcium, magnesium, and potassium.
Mechanical Testing: The uniaxial compression test was utilized to quantify the compressive strength (UCS) of the treated sandstone. The equation σ = P/A was used to calculate the maximal stress and compression load which causes the failure of the sample. For the test, it is imperative to position the sample accurately at the exact center of the loading plate.
4. Results and Discussions
4.1. Results of Data and Martial Preparing
The 4D Bridge model components had the appropriate data immediately attached to them inside the circles, as shown in Figure 7. After identifying the model and verifying the maintenance data, the research authors connected them to the bridge model component. The 4D Bridge model was used to investigate the bridge management system.
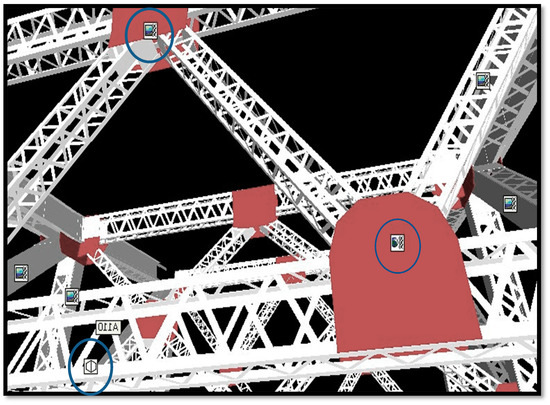
Figure 7.
Data links attached to bridge component as inside the circles.
Consolidation Process (Treatment) of the pier stone: The samples were prepared according to [9,11], and then the nano-mixture was applied to the sandstone surface through multiple-brushing once per day for five consecutive days.
4.2. Results of Data Navigating
The research authors performed navigation operations and measurements through the 4D Bridge model. They moved, zoomed, and checked the dimensions of the bridge model, as shown in Figure 8 and Figure 9. The resulted data provided suitability and flexibility for the users.
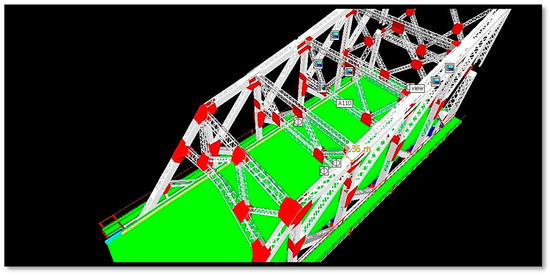
Figure 8.
Zooming in and checking dimensions of the bridge.
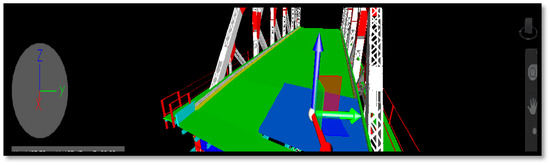
Figure 9.
The ability to move components in the navigating mode.
4.3. Results of Data Visualizing
Naviswork 2024 visualized the required data through cross-sectional views and direct-clicking on specific links as inside the circles in Figure 10. The maximum knowledge of the visual presentation of data, such as sectioning, enables the display of internal components and cross-sectional views, as shown in Figure 10. Exploring different angles and layers allows the users to comprehend them efficiently in order to issue successful decisions regarding the bridge maintenance information.
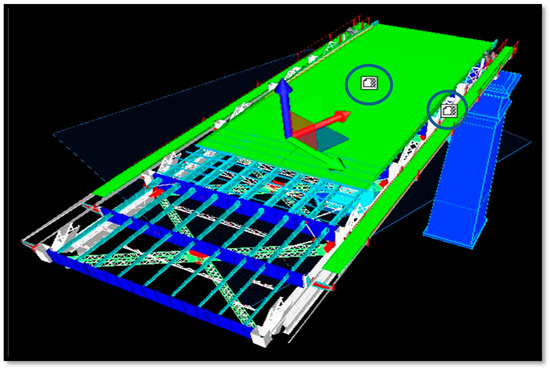
Figure 10.
Section plan view of the bridge model and clicking on links as inside the circles.
4.4. Results of Data Integrating
PDF files were attached to the 4D CAD drawings of the bridge model as shown in Figure 11, offering users direct access to related documents and datasets within the model, further enhancing usability and completeness. In addition to traditional methods, this approach results in incorporating the 4D Bridge model as the primary search material, thereby enhancing the data integration process. The 4D Bridge model provides time-based access to maps, allowing the research authors to explore changes over time and predict future conditions. The time dimension is especially valuable for maintenance planning and decision-making, as it enables research authors to view historical data and anticipate potential needs before finalizing their choices. By integrating the 4D Bridge model, users gain a dynamic, comprehensive view that supports more informed and proactive decision-making.
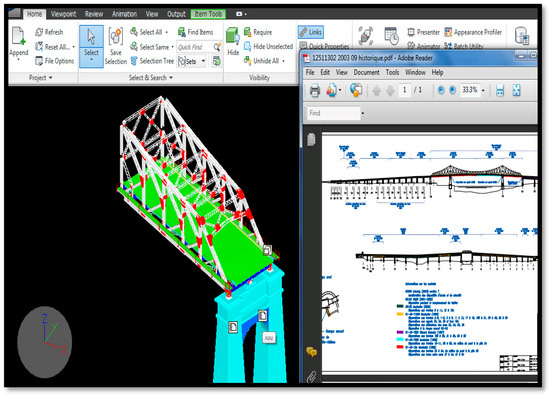
Figure 11.
Files attached to the 4D CAD drawings of the bridge model.
4.5. Results of Data Monitoring
This work result proved the ability of this system to classify material conditions in terms of maintenance work in different ways, such as the changing colors process as described in Figure 12.
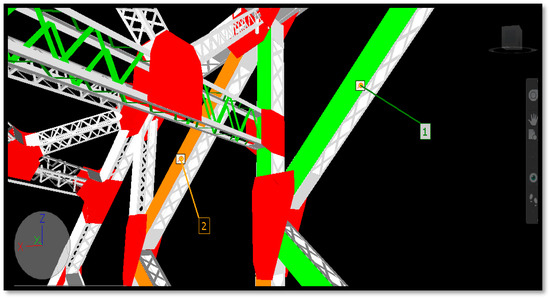
Figure 12.
Categorizing material condition by colors.
Furthermore, several practices have been implemented on the Bridge model in order to obtain a more comprehensive view of the expected outcomes of regular maintenance tasks, as well as to avoid uncertainties in the work field. To achieve this, the technology of 4D simulation was used, and it was very effective and dynamic in showing the opportunities and constraints that surround the maintenance work field considering the time factor as shown in Figure 13.
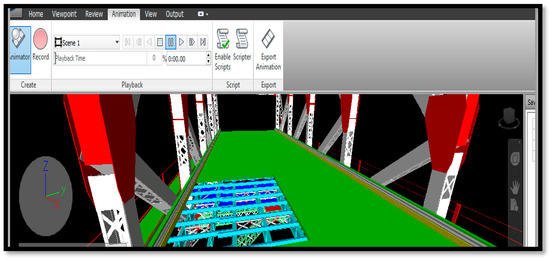
Figure 13.
4D monitoring indicating work stages through 4D simulation as animation.
4.6. Results of Defect Detecting
The bridge model defects were detected, their properties were determined, and the condition of their materials were checked in the CAD modeling software with linking of the attached digital realistic photo of the defect, as shown in Figure 14. The deterioration defect was defined as shown in Figure 15, as material deterioration in the truss angel with a yellow color in the detection mode. Clashes were detected in the truss I-beam by the green color in the 4D Bridge model, as shown in Figure 16.
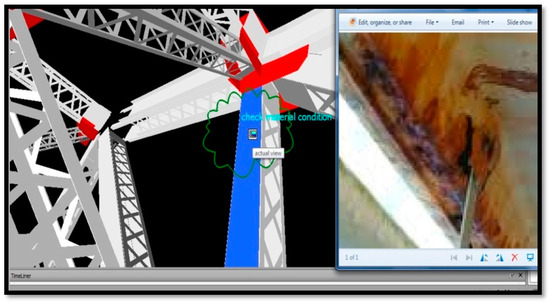
Figure 14.
Checking material condition on the bridge model.
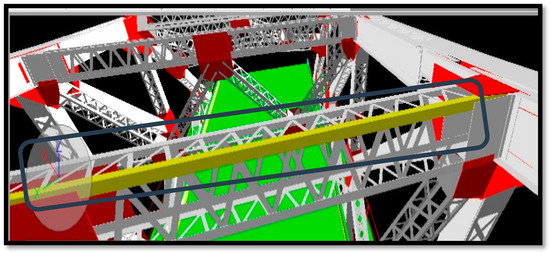
Figure 15.
Showing material deterioration in the angel by yellow color in the detection mode.
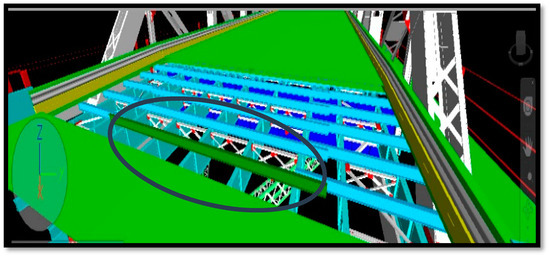
Figure 16.
Detecting clashes in I-beam by green color in the 4D Bridge model.
Using this approach, we effectively identified defects such as deterioration and clashes in complex structural elements like trusses. The 4D Bridge model enhanced defect modeling. This integration supports digitization and automation in defect detection, advancing both structural safety and the efficiency of long-term maintenance practices.
4.7. Results of Data and Nanomaterial Analysis
4.7.1. CT Scan Imaging
The CT scan imaging reveals that the consolidant has completely coated the stone surfaces and has been evenly distributed within the pores, as shown in Figure 17. The uniform dispersion on the surfaces and among the stone grains resulted in an enhancement of the stone’s mechanical characteristics. Furthermore, the CT scan pictures demonstrated the uniformity of the nanocomposite material composed of Nano-silica/TEOS polymer and its similarity to the composition of the sandstone.
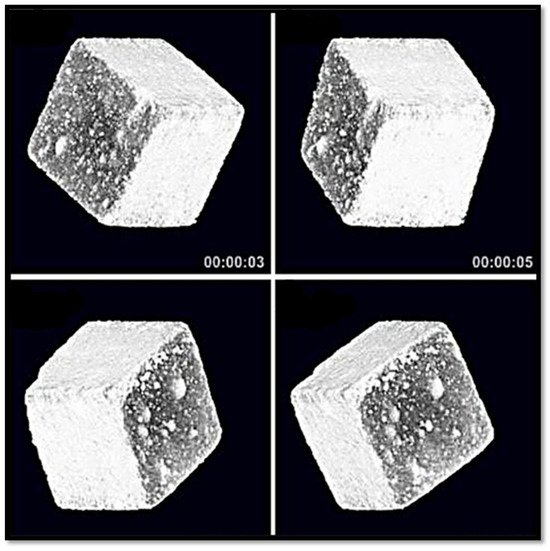
Figure 17.
3D CT pictures reveal the physical characteristics of the sandstone after treatment, viewed from various angles. The CT sections reveal the uniform distribution of the nanocomposite cover within the pores of the sandstone.
4.7.2. Scanning Electron Microscope SEM (Morphological Study)
The scanning electron microscopy (SEM) analysis verified that the physical structure and grain morphology underwent alterations following the consolidation process, as depicted in Figure 18.
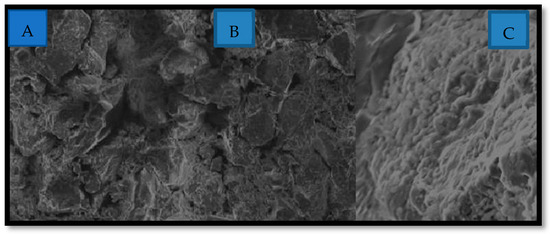
Figure 18.
SEM revealing the specimen prior to consolidation (A), the nanocomposite Nano-silica/TEOS clogging surfaces pore subsequent to consolidation and interaction with the stone grains (B), and the nanocomposite Nano-silica/TEOS covering surface pores after consolidation and interacting with the stone grains (C).
4.7.3. XRF Analysis
The objective of X-Ray Fluorescence analysis is to determine the elemental composition of the sandstone. The findings indicated the presence of proportions of aluminum (Al), quartz (Si), chloride (Cl), calcium (Ca), iron oxide (Fe), and small amounts of sulfur (S), which are outlined in Table 1 and visually presented in Figure 19.

Table 1.
XRF composition in wt. for a sample from the bridge pier.
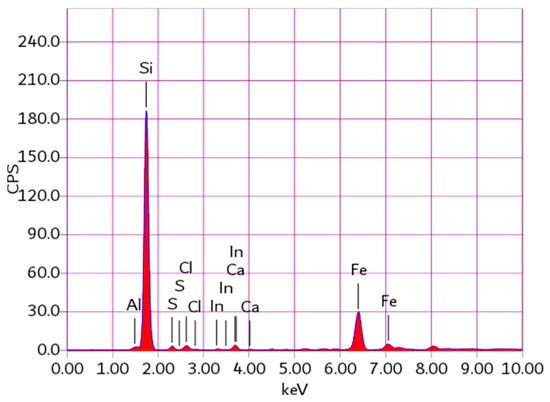
Figure 19.
XRF spectrum of stone sample.
4.7.4. Uniaxial Compressive Strength (UCS) and Young’s Modulus of the Sandstone
The findings of the five tested sandstone core samples’ compressive strength are displayed in Table 2. The ground water table and salt weathering in particular caused damage to the UCS, which ranged in values from 13.21 MPa to 17.52 MPa, making it poor to mediocre.
Table 2.
Engineering properties of the sandstone before and after the treatment with nano-polymers (Nano-silica/TEOS polymer).
The modulus of elasticity for brittle sandstone with a non-linear stress–strain relationship can be evaluated using the chord modulus [21,41]. The three examined sandstone samples have moduli of elasticity values of 10 GPa.
4.7.5. Splitting Tensile Strength of the Pier Sandstone Specimens
The average splitting tensile strength of the sandstone, which ranges from 2.3 MPa to 2.9 MPa, was determined by testing three samples. The test findings are detailed in Table 2.
4.7.6. Shear Strength of the Sandstone Specimens
To ascertain the sandstone’s shear strength factors, three samples underwent single shear testing, and 4 to 5.5 MPa was the achieved shear strength. The shear test outcomes are presented in Table 2.
Upon contrasting the mechanical characteristics of the material prior to and following treatment with nanomaterials, as indicated in Table 2, the findings indicate that the nanocomposite Nano-silica/TEOS polymer that was successfully dispersed within the pores, exhibited a significant improvement in its mechanical characteristics. The procedure additionally applied a protective coating to the surface of the sandstone.
5. Conclusions and Recommendations
This study demonstrates the potential of a 4D digital model that integrates Bridge Information Modeling (BrIM) with multiple data sources, offering an innovative approach to defect detection in complex bridge structures. The model enabled precise data preparation, navigation, visualization, integration, and monitoring, enhancing the detection of defects such as material deterioration, structural clashes, and condition changes, particularly in intricate elements like trusses. By allowing users to explore different angles and layers, the 4D Bridge model facilitates a comprehensive understanding of maintenance information, enabling informed decision-making. Moreover, the model provides time-based access to data, empowering users to track changes over time and predict future conditions, making it particularly valuable for maintenance planning and proactive management.
The inclusion of the time as the fourth dimension in the model significantly enhances its utility for assessing the outcomes of regular maintenance tasks while mitigating uncertainties in the field. Through the use of 4D simulation technology, this study showcased the dynamic and effective visualization of maintenance opportunities and constraints, incorporating the time factor as a crucial element. This approach not only supports effective defect modeling but also promotes the digitization and automation of defect detection, advancing both structural assessment and long-term safety.
Additionally, this study introduced a sustainable approach for sandstone consolidation using a nanocomposite combination. Techniques such as CT scanning were employed as non-destructive methods for evaluating the efficacy of the nanocomposite consolidant and the sandstone structure. The research demonstrates that CT scanning provides a non-invasive and highly informative means of examining the interior structures of cultural heritage elements and assessing their long-term restoration potential. The nanocomposite, formulated with a TEOS polymer mixture and Nano-silica dispersed in ethanol, significantly improved the mechanical properties of the sandstone used in bridge piers. Post-treatment SEM scans revealed that the nanocomposite effectively interacted with the stone grains, occluding surface pores, while XRF analysis confirmed the composition, with silica (Si) as the primary element and iron oxide (Fe) as a minor component.
This study suggests that nanocomposites are a promising treatment for sandstone. Future research could build upon these findings by applying MATLAB-based modeling to develop more effective and sustainable conservation strategies for sandstone components.
Despite these advancements, several objectives remain as future directions for development. These include improving real-time processing capabilities within the 4D digital model to enable continuous updates and immediate feedback during inspections. Another promising avenue is to explore the role of 4D digital registering in enhancing the registration accuracy between as-built laser data and designed models. The integration of advanced laser scanning technologies is essential for improving defect measurement in buildings. Moreover, incorporating machine-learning algorithms could further enhance defect detection by identifying patterns and predicting potential issues based on historical data. Addressing these aspects will facilitate defect automation, improve precision, and strengthen infrastructure safety and maintenance practices.
Author Contributions
Conceptualization, G.A.A., M.S.S. and M.B.; methodology, A.O., A.M. and A.S.; software, A.S. and G.A.A.; validation, A.M. and A.O.; formal analysis, G.A.A. and M.T.; investigation, A.S. and G.A.A.; resources, G.A.A. and M.T.; data curation, M.S.S. and A.O.; writing—original draft preparation, M.T.; writing—review and editing, A.S., G.A.A. and M.T.; visualization, M.T.; supervision, A.S. and G.A.A. All authors have read and agreed to the published version of the manuscript.
Funding
This research was funded by the Deanship of Scientific Research at the University of Ha’il, Saudi Arabia, under the contract: RG-23238.
Data Availability Statement
All of the study’s data are contained in this article.
Acknowledgments
The authors would like to express their deepest gratitude to the Deanship of Scientific Research at the University of Ha’il for providing the necessary support to conduct this research.
Conflicts of Interest
The authors declare no conflicts of interest.
References
- Jeon, C.-H.; Nguyen, D.-C.; Roh, G.; Shim, C.-S. Development of BrIM-Based Bridge Maintenance System for Existing Bridges. Buildings 2023, 13, 2332. [Google Scholar] [CrossRef]
- Berg Oppedal, L.; Kvande, T. Lessons Learned from Information Sources on Building Defect Studies. Buildings 2024, 14, 1231. [Google Scholar] [CrossRef]
- Tarekegn Gurmu, A.; Shooshtarian, S.; Mahmood, M.N. Critical Evaluation of Building Defects Research: A Scientometric Analysis. J. Perform. Constr. Facil. 2022, 36, 03122001. [Google Scholar] [CrossRef]
- Faqih, F.; Zayed, T. Defect-Based Building Condition Assessment. Build. Environ. 2021, 191, 107575. [Google Scholar] [CrossRef]
- Felipo, R.; Charpin, D. Structural Home Defects Are the Leading Cause of Mold in Buildings: The Housing and Health Service Experience. Int. J. Environ. Res. Public Health 2022, 19, 16692. [Google Scholar] [CrossRef]
- Lee, S.; Lee, S.; Kim, J. Evaluating the Impact of Defect Risks in Residential Buildings at the Occupancy Phase. Sustainability 2018, 10, 4466. [Google Scholar] [CrossRef]
- Van Den Bossche, N.; Blommaert, A.; Daniotti, B. The Impact of Demographical, Geographical and Climatological Factors on Building Defects in Belgium. Int. J. Build. Pathol. Adapt. 2022, 41, 549–573. [Google Scholar] [CrossRef]
- Kang, S.; Kim, S.; Kim, S. Automatic detection and classification process for concrete defects in deteriorating buildings based on image data. J. Asian Archit. Build. Eng. 2024, 1–15. [Google Scholar] [CrossRef]
- Agnisarman, S.; Lopes, S.; Madathil, K.C.; Piratla, K.; Gramopadhye, A. A Survey of Automation-Enabled Human-In-The-Loop Systems for Infrastructure Visual Inspection. Autom. Constr. 2019, 97, 52–76. [Google Scholar] [CrossRef]
- Galantucci, R.A.; Fatiguso, F. Advanced Damage Detection Techniques in Historical Buildings Using Digital Photogrammetry and 3D Surface Anlysis. J. Cult. Herit. 2019, 36, 51–62. [Google Scholar] [CrossRef]
- Guo, J.; Liu, P.; Xiao, B.; Deng, L.; Wang, Q. Surface Defect Detection of Civil Structures Using Images: Review from Data Perspective. Autom. Constr. 2024, 158, 105186. [Google Scholar] [CrossRef]
- Seo, J.; Duque, L.; Wacker, J. Drone-Enabled Bridge Inspection Methodology and Application. Autom. Constr. 2018, 94, 112–126. [Google Scholar] [CrossRef]
- Viswanathan, V.K.; Lindqvist, B.; Satpute, S.G.; Kanellakis, C.; Nikolakopoulos, G. Towards Visual Inspection of Distributed and Irregular Structures: A Unified Autonomy Approach. J. Intell. Robot. Syst. 2023, 109, 32. [Google Scholar] [CrossRef]
- Sony, S.; LaVenture, S.; Sadhu, A. A literature review of next-generation smart sensing technology in structural health monitoring. Struct. Control Health Monit. 2019, 26, e2321. [Google Scholar] [CrossRef]
- Baduge, S.K.; Thilakarathna, S.; Perera, J.S.; Arashpour, M.; Sharafi, P.; Teodosio, B.; Shringi, A.; Mendis, P. Artificial intelligence and smart vision for building and construction 4.0: Machine and deep learning methods and applications. Autom. Constr. 2022, 21, 104440. [Google Scholar] [CrossRef]
- Scisloa, L.; Drygalab, L. 3D Vibration Measurements with Optical Systems: Selected Methods for Measurement Enhancements. Procedia Struct. Integr. 2024, 64, 2246–2253. [Google Scholar] [CrossRef]
- Chan, B.; Guan, H.; Jo, J.; Blumenstein, M. Towards UAV-based bridge inspection systems: A review and an application perspective. Struct. Monit. Maint. 2015, 2, 283–300. [Google Scholar] [CrossRef]
- Chou, J.S.; Liu, C.U.; Guo, P.J. Deploying UAV-based detection of bridge structural deterioration with pilgrimage walk optimization-lite for computer vision. Case Stud. Constr. Mater. 2024, 21, e04048. [Google Scholar] [CrossRef]
- Feroz, S.; Abu Dabous, S. UAV-Based Remote Sensing Applications for Bridge Condition Assessment. Remote Sens. 2021, 13, 1809. [Google Scholar] [CrossRef]
- da Silva Ruiz, P.R.; Almeida, C.M.D.; Schimalski, M.B.; Liesenberg, V.; Mitishita, E.A. Multi-approach integration of ALS and TLS point clouds for a 3-D building modeling at LoD3. Sage J. 2023, 21, 652–678. [Google Scholar] [CrossRef]
- Sedek, M.S.; Touahmia, M.; Albaqawy, G.A.; Latifee, E.; Mahioub, T.; Sallam, A. Four-Dimensional Digital Monitoring and Registering of Historical Architecture for the Preservation of Cultural Heritage. Buildings 2024, 14, 2101. [Google Scholar] [CrossRef]
- Mariniuc, A.M.; Cojocaru, D.; Abagiu, M.M. Building Surface Defect Detection Using Machine Learning and 3D Scanning Techniques in the Construction Domain. Buildings 2024, 14, 669. [Google Scholar] [CrossRef]
- Roggero, M.; Diara, F. Multi-Sensor 3D Survey: Aerial and Terrestrial Data Fusion and 3D Modeling Applied to a Complex Historic Architecture at Risk. Drones 2024, 8, 162. [Google Scholar] [CrossRef]
- Sedek, M.S.; Serwa, A. Semi-Automatic Approach for Forming and Processing Laser Sensing Data of Urban Truss. SVU 2021, 2, 1–8. [Google Scholar] [CrossRef]
- Serwa, A.; Saleh, M. New semi-automatic 3D registration method for terrestrial laser scanning data of bridge structures based on artificial neural networks. Sci. Direct 2021, 24, 787–798. [Google Scholar] [CrossRef]
- Sedek, M.S.; Serwa, A. Development of new system for detection of bridges construction defects using terrestrial laser remote sensing technology. Sci. Direct 2016, 19, 273–283. [Google Scholar] [CrossRef][Green Version]
- Sedek, M.; Hammad, A.; El-Nokrashy, M.; Abdelhafiz, A.; Khodary, F. 3D Range Sensors Capture, Transform and Modeling of Defects. In International Conference on Aerospace Sciences and Aviation Technology; The Military Technical College: Cairo, Egypt, 2015. [Google Scholar]
- Tao, T.; Wang, H. Efficient buffeting analysis of long-span bridges under non-stationary winds: A 2D interpolation enhanced approach. J. Sound Vib. 2023, 559, 117754. [Google Scholar] [CrossRef]
- Petersen, Ø.W.; Øiseth, O.; Nord, T.S.; Lourens, E. Estimation of the full-field dynamic response of a floating bridge using Kalman-type filtering algorithms. Mech. Syst. Signal Process. 2018, 107, 12–28. [Google Scholar] [CrossRef]
- Tao, T.; Xu, Y.L.; Huang, Z.; Zhan, S.; Wang, H. Buffeting analysis of long-span bridges under typhoon winds with time-varying spectra and coherences. ASCE J. Struct. Eng. 2020, 146, 04020255. [Google Scholar] [CrossRef]
- El-Gohary, M.; El-Magd, M.A. Influence of Acrylic Coatings and nanomaterials on the Interfacial, Physical and mechanical, Properties of Limestone based Monuments. Case Study “AMENEMHAT II TEMPLE”. Int. J. Conserv. Sci. 2018, 9, 219–234. [Google Scholar]
- Sallam, A.; Albaqawy, G.A.; Touahmia, M.; Boukendakdji, M.; Khalil, M.M.E. Improving Mud Brick Durability in Ancient Closed-Box Tombs: A Graphene Oxide Nanoparticle Approach. Buildings 2024, 14, 2248. [Google Scholar] [CrossRef]
- Kamh, G.; Klitzsch, N. Testing Single and Mixed Resins for consolidating Moderately Weathered Limestone of Archaeological Sites, New applied Techniques. Int. J. Conserv. Sci. 2018, 9, 599–610. [Google Scholar]
- Sallam, A.; Zhao, Y.; Hassan, M.; Toprak, M.S.; Muhammed, M.; Uheida, A. Studies on the Deterioration of Coptic Mural Paintings in the Monastery of Martyrs and the Luxor Temple. Int. J. Conserv. Sci. 2016, 7, 493–500. [Google Scholar]
- Re, A.; Corsi, J.; Demmelbauer, M.; Martini, M.; Mila1, A.; Ricci, C. X-ray tomography of a soil block: A useful tool for the restoration of archaeological finds. Herit. Sci. 2015, 2, 7. [Google Scholar] [CrossRef]
- Hughes, S. CT Scanning in Archaeology. Computed Tomography—Special Applications. 2011. Available online: https://www.intechopen.com/chapters/24019 (accessed on 30 November 2024).
- Khalil, M.M.; Sallam, A.; Shenouda, R.; Alsubaie, M.S. Weathering of monumental Islamic marble in Egypt: A contribution to heritage studies. Conserv. Sci. Cult. Herit. 2022, 22, 147–170. [Google Scholar] [CrossRef]
- Aldoasri, M.A.; Darwish, S.S.; Adam, M.A.; Elmarzugi, N.; Ahmed, S.M. Enhancing the Durability of Calcareous Stone Monuments of Ancient Egypt Using CaCO3 Nanoparticles. Sustainability 2017, 9, 1392. [Google Scholar] [CrossRef]
- Alhilo, E.A.; Kuba, S.; Dirweesh, A.F. Nanotechnology use to preserve the durability of archaeological brick buildings in Al-Najaf city. IOP Conf. Ser. Mater. Sci. Eng. 2021, 1067, 012044. [Google Scholar] [CrossRef]
- Khalil, M.M.E.; Khodary, S.M.; Youssef, Y.M.; Alsubaie, M.S.; Sallam, A. Geo-Environmental Hazard Assessment of Archaeological Sites and Archaeological Domes—Fatimid Tombs—Aswan, Egypt. Buildings 2022, 12, 2175. [Google Scholar] [CrossRef]
- Alsubaie, M.S.; Almutery, S.B.; Almoufleh, A.A.; Khalil, M.M.E.; Sallam, A. Architectural Heritage Conservation in the City of Qurh: Assessing and Stabilizing Islamic Era Mud Brick Structures. Mediterr. Archaeol. Archaeom. 2024, 24, 50–73. [Google Scholar] [CrossRef]


Disclaimer/Publisher’s Note: The statements, opinions and data contained in all publications are solely those of the individual author(s) and contributor(s) and not of MDPI and/or the editor(s). MDPI and/or the editor(s) disclaim responsibility for any injury to people or property resulting from any ideas, methods, instructions or products referred to in the content. |
© 2025 by the authors. Licensee MDPI, Basel, Switzerland. This article is an open access article distributed under the terms and conditions of the Creative Commons Attribution (CC BY) license (https://creativecommons.org/licenses/by/4.0/).