Article

Exploring Factors Influencing Speech Intelligibility in Airport Terminal Pier-Style Departure Lounges

State Key Laboratory of Subtropical Building and Urban Science, School of Architecture, South China University of Technology, Guangzhou 510641, China
*
Author to whom correspondence should be addressed.
Buildings 2025, 15(3), 426; https://doi.org/10.3390/buildings15030426
Submission received: 15 December 2024 / Revised: 18 January 2025 / Accepted: 20 January 2025 / Published: 29 January 2025
(This article belongs to the Section Building Energy, Physics, Environment, and Systems)

Abstract

:
This study investigates speech intelligibility and its influencing factors within pier-style airport lounges and assesses the applicability of the Speech Transmission Index (STI) in these large, elongated spaces. Field impulse response measurements were conducted in two pier-style departure lounges with volumes of 98,099 m3 and 60,414 m3, respectively, complemented by simulated binaural room impulse responses for subjective speech intelligibility testing in Mandarin. The research explores the correlations between various acoustic parameters—Early Decay Time (EDT), Reverberation Time (T30), and Definition(D50)—and speech intelligibility scores under different Signal-to-Noise Ratios (SNRs). Findings indicate a significant impact of SNR on speech intelligibility, with a coefficient of determination (R2) of 0.849, suggesting substantial variability explained by SNR. As SNR increases to 10 dB(A), speech intelligibility scores improve significantly; however, further enhancements in clarity diminish beyond this threshold. Additionally, the study reveals a significant relationship between room acoustic parameters, particularly EDT and D50, and speech intelligibility scores, with EDT having a negative impact and D50 a positive impact on speech clarity. The results confirm the suitability of STI in evaluating speech intelligibility in these specific architectural contexts. This study recommends maintaining an SNR of 10 dB(A) and a minimum STI of 0.45 for public address broadcasts in pier-style departure lounges to ensure that announcements are clearly audible to passengers.

1. Introduction

Departure lounges in airport terminals play a pivotal role in enhancing passenger experience and improving operational efficiency [1,2]. With the rapid development of the aviation industry, the architectural complexity of departure lounges has significantly increased. Among these, pier-style departure lounges have emerged as a prevalent design choice due to their unique structural and functional characteristics [3,4]. However, while these expansive and elongated spaces offer distinct functional advantages, they also present significant acoustic challenges, particularly concerning speech intelligibility, warranting further investigation into their influencing factors.
The acoustic environment of pier-style departure lounges faces numerous challenges [5,6,7]. These spaces often adopt open-plan designs and extensively utilize hard materials such as glass and metal [8,9], which exacerbate issues related to sound reflection and propagation. Research indicates that, compared to other environmental factors such as thermal comfort, lighting, and indoor air quality, the acoustic comfort of these lounges is often rated lower [5]. The high volume of passengers and overlapping operational noises further complicate the acoustic environment [6,7,10,11]. Elevated noise levels not only diminish passenger comfort [12] but also significantly impair the speech intelligibility of airport public address systems [13,14], thereby affecting the efficiency and accuracy of information dissemination [15]. Clear broadcast announcements are crucial for facilitating smooth boarding processes [16] and responding to emergencies [17,18]. Consequently, identifying key factors affecting public address system intelligibility and optimizing the Signal-to-Noise Ratio (SNR) in high-noise pier-style departure lounges are essential for improving passenger experience and ensuring safe operations.
The architectural characteristics of pier-style departure lounges further exacerbate acoustic issues. Their elongated and large-scale structures render their acoustic properties distinct from traditional rectangular rooms [19,20,21] and conventional small-scale elongated spaces [22,23,24]. Traditional rectangular rooms, with shorter sound propagation paths, typically encounter fewer echo problems [25], while large-scale spaces exhibit uneven sound energy distribution and non-exponential decay patterns [26,27]. The unique geometry of elongated spaces results in significant variations in acoustic parameters along their longitudinal axis [28,29]. Pier-style departure lounges, combining features of both large-scale and elongated spaces, present increased complexity in sound reflection and refraction, leading to intricate sound field variations that critically impact speech perception.
Variations in indoor acoustic conditions can significantly impact the applicability of the Speech Transmission Index (STI) [21,30]. Previous studies have demonstrated notable differences in the relationship between speech intelligibility scores and STI in medium-to-small-sized rectangular spaces [21]. Moreover, for a given STI, elongated spaces of comparable volume typically exhibit higher speech intelligibility scores than standard rectangular rooms [24]. This finding underscores the necessity of further investigating the applicability of STI across diverse spatial configurations. However, existing research has primarily focused on medium-to-small-scale elongated spaces, such as building corridors [31,32] and subway stations [22,33,34]. Systematic studies examining the relationship between STI and speech intelligibility scores in large-scale elongated spaces, particularly in pier-style departure lounges, remain limited. Whether the relationship between STI and speech intelligibility scores defined in IEC 60268-16 (5th edition) [35] is applicable to such complex architectural forms requires further validation. Therefore, investigating the key factors influencing speech intelligibility in large-scale elongated spaces such as pier-style departure lounges and validating the applicability of STI in these unique architectural environments holds both significant theoretical value and practical implications.
This research aims to thoroughly investigate speech intelligibility within pier-style departure lounges by conducting field measurements, computer simulations, and laboratory tests. The goal is to identify principal factors impacting intelligibility and develop focused improvement strategies to enhance both the acoustic quality and passenger experience within these critical airport areas.

2. Methodology

This study is dedicated to assessing the intelligibility of Mandarin speech and its influencing factors within airport terminal pier-style departure lounges, as well as evaluating the applicability of the STI in such large, elongated spaces. By integrating field measurements of impulse responses with subjective evaluations of speech intelligibility in the laboratory, this research aims to gain a comprehensive understanding of the acoustic environment and speech clarity within these spaces.
Measurements of impulse responses under the excitation of a single omnidirectional sound source are conducted in two departure lounges at a large hub airport in China, to obtain precise data on the acoustic environment of the pier-style lounges. Subsequently, detailed models of these lounges are constructed using ODEON 12.0 acoustic modeling software [36]. Material and source parameters are adjusted within the software to align the simulated acoustic field data with the actual measured impulse responses. Within Odeon, by altering the type and parameters of sound sources, the acoustic environment under the influence of multiple sources within the lounge is simulated, obtaining corresponding impulse responses and STI values. Finally, using the impulse responses derived from the Odeon simulations, subjective speech intelligibility listening tests are conducted in a controlled laboratory setting. These tests evaluate the clarity of Mandarin speech under various acoustic parameters and signal-to-noise ratios in the lounges and explore the factors influencing it. This methodology, adhering to the IEC 60268-16 standard [35], is validated by prior research [37,38] to accurately replicate on-site speech intelligibility measurements, effectively mirroring real-world conditions.

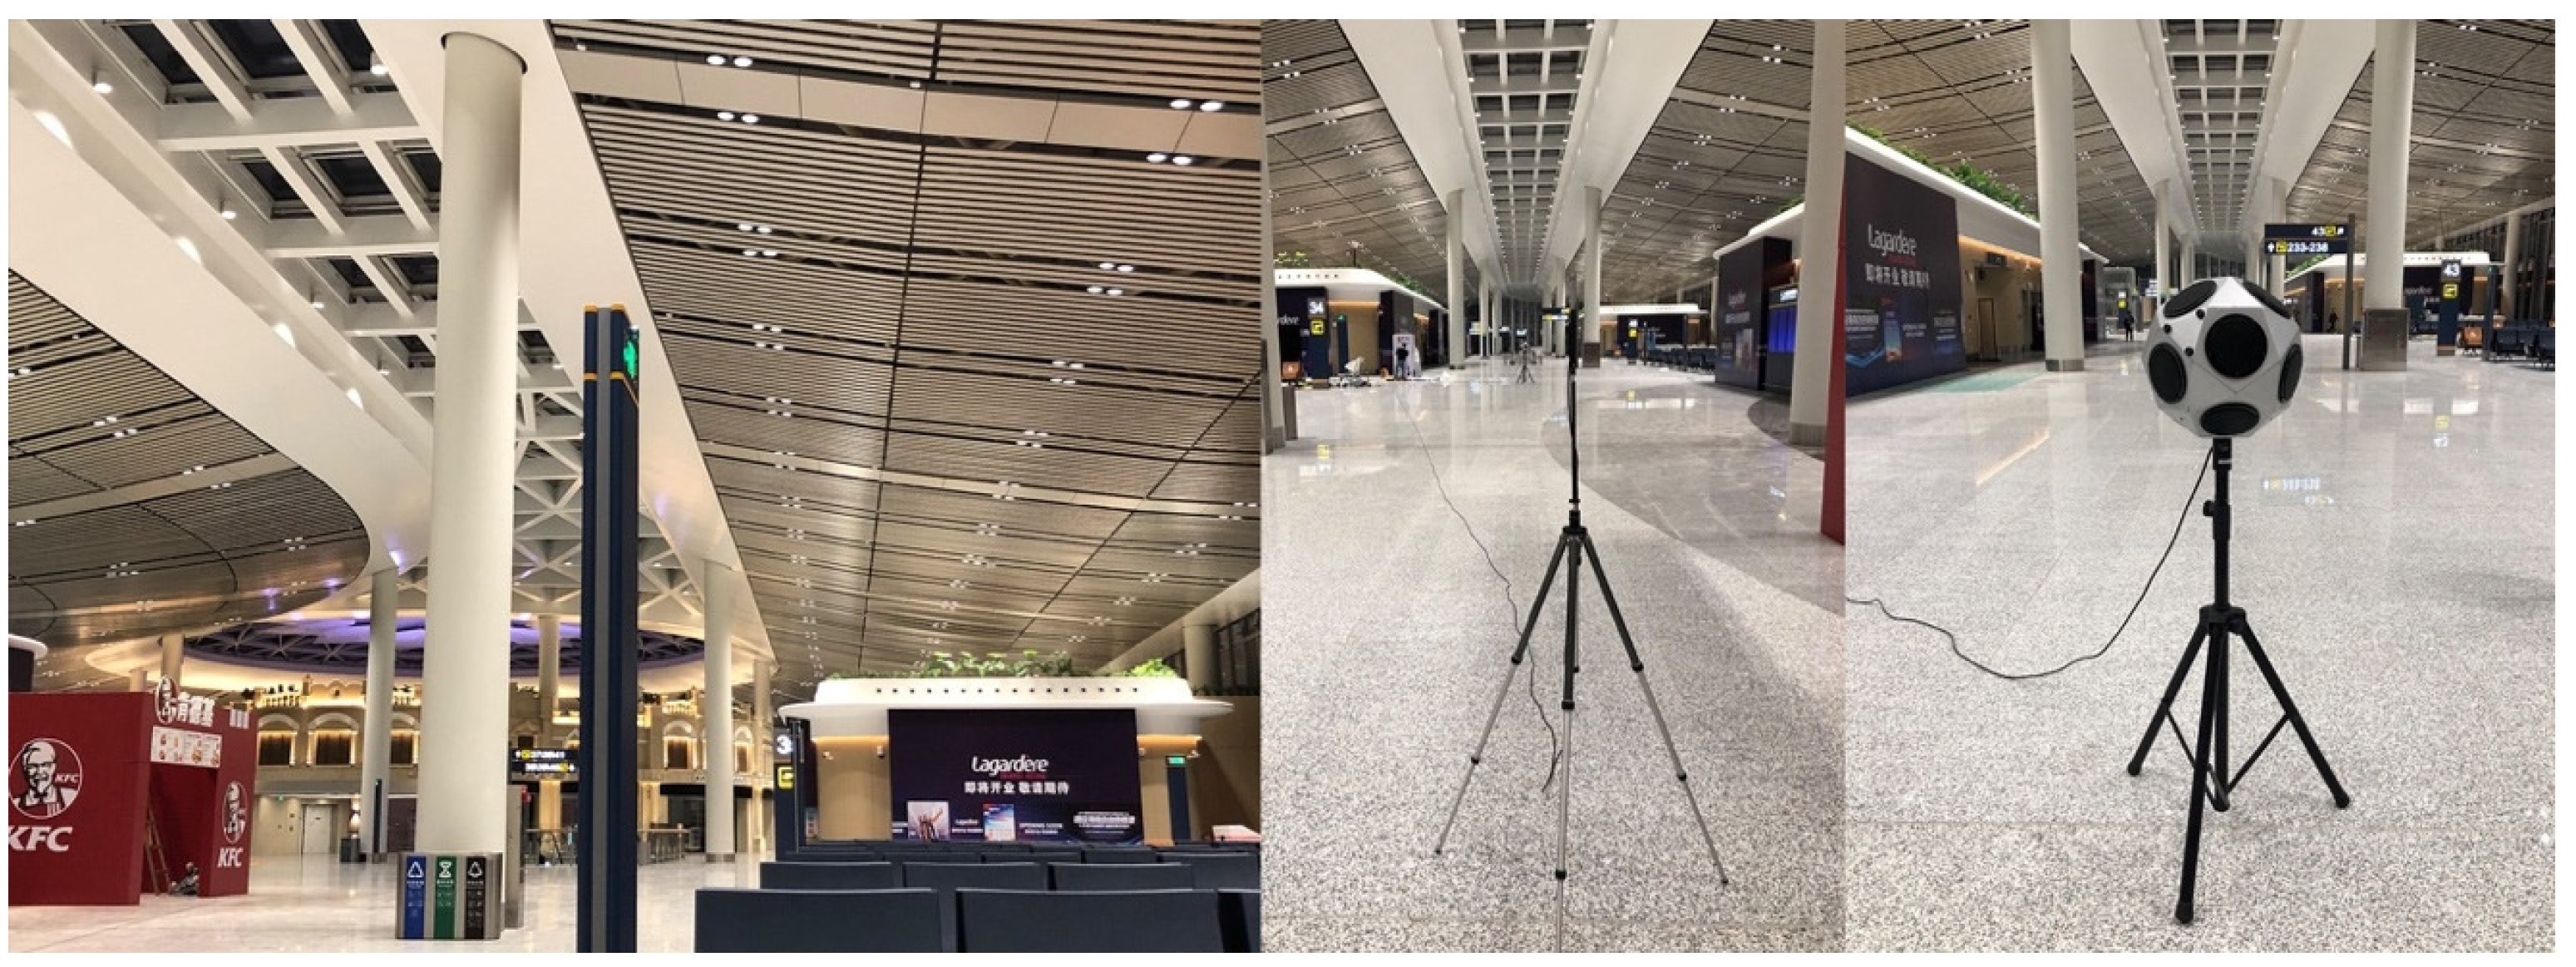
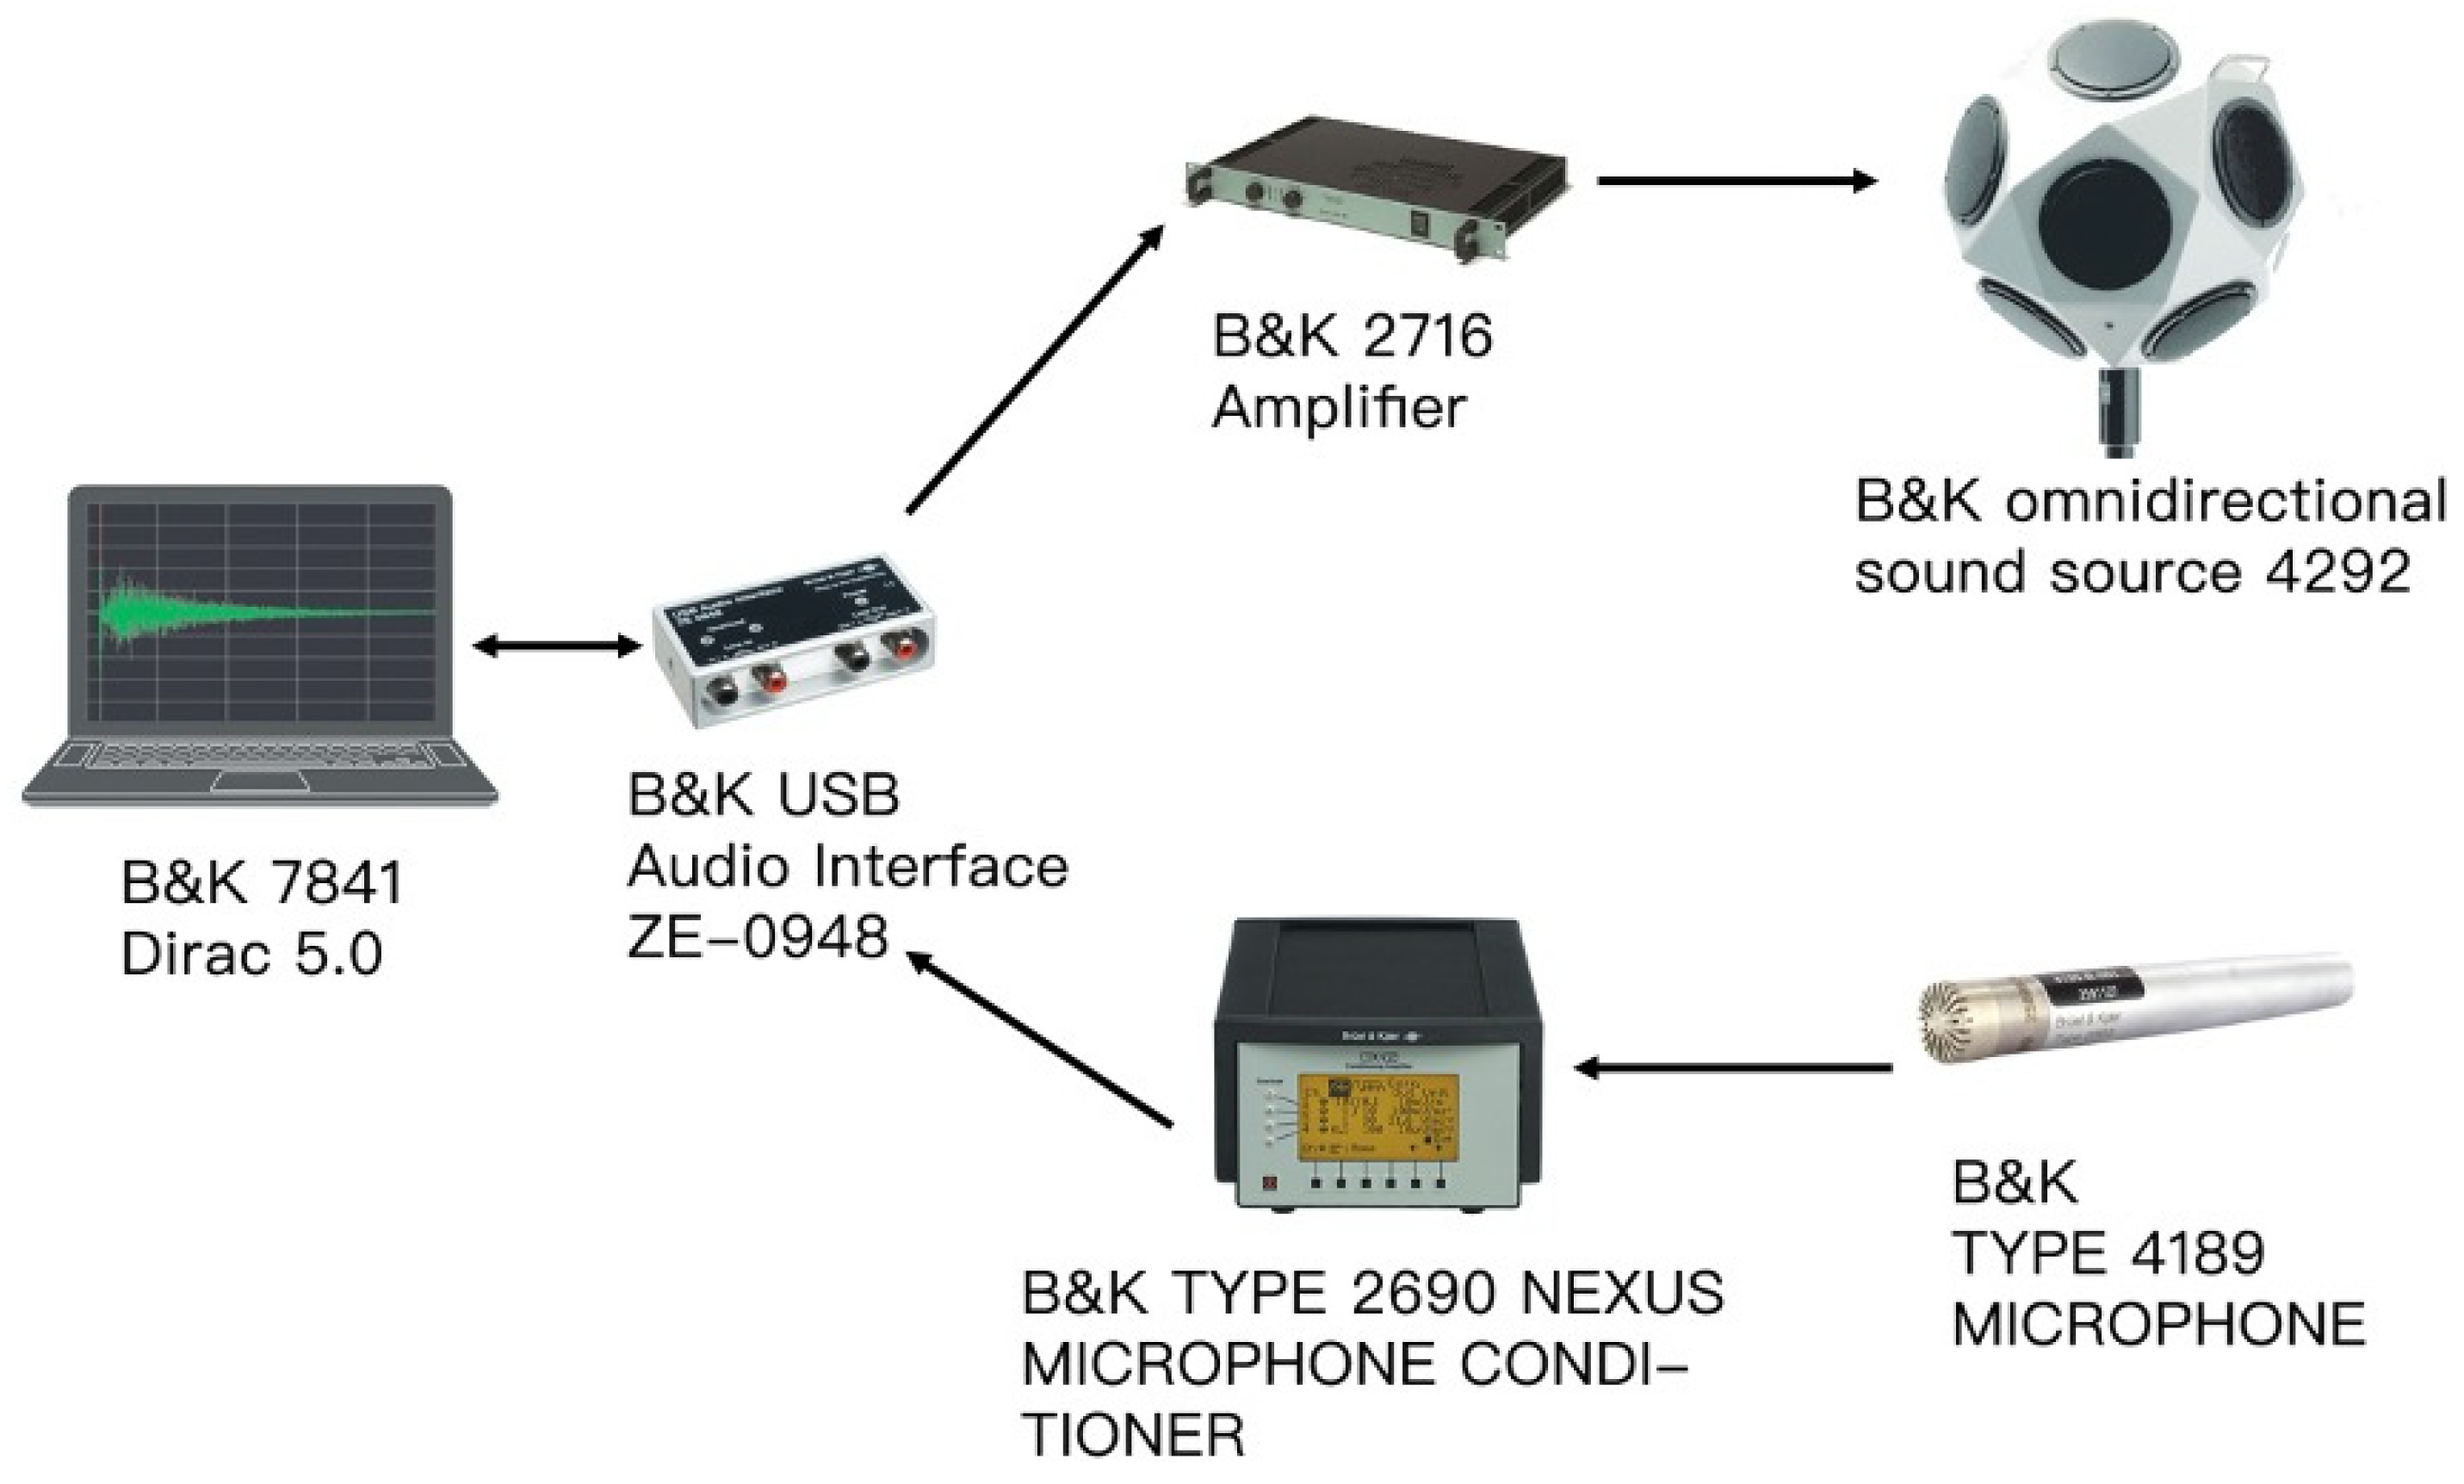
2.1. Field Impulse Response Measurements

Impulse response measurements were conducted in two architecturally distinct departure lounges at Haikou Meilan International Airport (HAK), designated as Lounge A and Lounge B. Lounge A features a dual-sided pier configuration, with a total length of 220 m, a base width of 40 m, and an expanded terminal width of 60 m. Its roof design includes an arched structure reaching a central height of 12 m and sloping to 8.2 m at the sides. The floor area is 10,286 m2, the surface area is 20,783 m2, and the volume is 98,099 m3. The lounge incorporates longitudinal skylights and accommodates eight boarding gates. The average sound absorption coefficient of the pier-style concourse is 0.11. In contrast, Lounge B adopts a single-sided pier design. It has a length of 160 m, a consistent base width of 40 m that tapers to 32 m at the terminal. Like Lounge A, it also features an arched roof, with a minimum height of 8.2 m and a maximum height of 12 m. The floor area is 5565 m2, the surface area is 87,495 m2, and the volume is 60,414 m3. This lounge includes central skylights and has four boarding gates, with an average sound absorption coefficient of 0.11. Objective measurement photographs illustrating the acoustic environments of each lounge are displayed in Figure 1. In Pier A, twenty receiver points are strategically distributed to maximize data coverage and accuracy; Pier B includes sixteen receiver points. The placement of receivers and sound sources, depicted in Figure 2 with ‘R’ marking the receiver locations and ‘S’ the signal sound sources, complies with ISO 3382-2:2008 standards [39].
In compliance with ISO 3382-2:2008 [39], this study employed a dodecahedral sound source B&K 4292 (powered by B&K 2716 amplifier), centrally positioned in each departure lounge. The audio signals were received by a B&K 4189 omnidirectional microphone, amplified via the B&K 2690 NEXUS microphone conditioner, and subsequently collected using the B&K USB audio interface sound card, enabling the transfer to a computer. Following this, the signals underwent deconvolution processing employing Dirac 5.0 software, yielding impulse response data ready for analysis. The configuration of the experimental apparatus is illustrated in Figure 3, detailing the setup of the audio capture and processing equipment used in the study. Specific acoustic parameters, such as EDT, T30, and D50, were calculated from these impulse responses. Appendix A, Table A1, provides detailed dimensions (length, width, height) of Piers A and B, along with the average absorption coefficient at 1000 Hz. Additionally, it includes the average EDT and T30 within the octave bands centered at 500 Hz and 1000 Hz, as well as the average D50 across four octave bands centered at 500 Hz and 4000 Hz. The selection of these specific octave bands aligns with established studies [27,40], enhancing the robustness and comparability of the research findings.

2.2. Virtual Room Modelling

Using ODEON 12.0 indoor acoustics software, this study developed detailed virtual models of two distinct pier-style departure lounges. During the simulations, a virtual omnidirectional sound source was utilized, with ‘+EQ’ adjustments made for each octave band. This calibration ensured that the Sound Pressure Level (SPL) at 1 m on the front axis—set to be 20 dB(A) higher than at 10 m—matched the measured omnidirectional source SPLs across the frequency range of 125 Hz to 8000 Hz.
The acoustic parameters for the pier departure lounges were derived using a sophisticated hybrid methodology that combines ray tracing with image source modeling [41]. To ensure accuracy and consistency, the absorption and scattering coefficients of materials within the two pier models were carefully calibrated. This meticulous adjustment aimed to harmonize the simulated and measured acoustic parameters at each receiver location across the lounges. Appendix B, Table A2, presents the average simulated and measured values of EDT, T30, and D50 across each octave band from 125 Hz to 4000 Hz for the entire lounge, along with the differences between these values.
The data analysis demonstrates a high degree of correlation between the measured and simulated values across the octave bands for both pier lounges, affirming the efficacy of the acoustic modeling. Specifically, in Pier A, deviations in T30 and D50 values across all frequency bands fall below the Just Noticeable Difference (JND), suggesting minimal perceptual discrepancies between the simulated and actual acoustic environments. For EDT, simulated values at the lower frequencies of 125 Hz and 250 Hz are approximately two to three times the JND above the measured values, while in other frequency bands, the differences remain within the JND threshold. In Pier B, the variations in T30 across all frequency bands consistently stay below the JND threshold. However, for EDT and D50 at the low frequency of 125 Hz, the simulated values are about twice the JND higher than the measured values, indicating minor deviations in simulation accuracy at lower frequencies. Existing studies [42,43,44,45] indicate that speech intelligibility is predominantly influenced by mid-to-high frequency bands (500 Hz to 4 kHz), while low-frequency bands (125 Hz and 250 Hz) mainly contribute to tonal quality and perceived speech fullness, with minimal impact on intelligibility. Given the strong alignment between simulated and measured results in the critical mid-to-high frequency range, the low-frequency discrepancies of up to two JNDs are unlikely to significantly influence the assessment of speech intelligibility. Overall, the simulations effectively replicate the acoustic characteristics of the sound field, providing reliable data to support conclusions on speech intelligibility. This corroborates that ODEON software renders a trustworthy simulation for constructing the comprehensive acoustic environment of pier-style departure lounges, efficiently emulating the precise acoustic parameters, albeit with a few constraints in specific low-frequency situations.
Further statistical analysis was conducted to evaluate these discrepancies rigorously. A paired sample T-test was performed on the simulated and measured values at all receiver points in both piers, utilizing SPSS 26.0 [46], as detailed in Table 1. The results of the T-tests for the four acoustic parameters across both piers yielded p-values greater than 0.05, suggesting no statistically significant evidence at the 95% confidence level to reject the null hypothesis, which posits no difference between the group means. Consequently, the statistical analysis confirmed that on average, there were no significant deviations between the simulated and actual measurements of EDT, T30, and D50 in the two pier departure lounges, substantiating the reliability of the simulation approach employed in this study.

2.3. Multi-Source Simulation

To more accurately simulate the acoustic conditions of airport terminals and assess the performance of public address systems, this study utilized ODEON software to model the sound fields in those two pier-style departure lounges, considering multi-source configurations and complex crowd noise scenarios. The simulation incorporated varying SNRs to represent different levels of passenger flow and their impact on the acoustic environment. In these simulations, multi-source acoustic environments were modeled, and corresponding impulse responses were generated for the two pier-style departure lounges. The STI was then calculated based on these impulse responses, using predefined SNRs.
In the precisely calibrated models of these two pier-style departure lounges, multiple wall-mounted columnar loudspeakers, commonly used in terminal lounges, were configured as sound sources. A previous study [47] has shown that in spaces with non-exponential decay, speech intelligibility is significantly related to the distance between the receiver points, sound sources, and absorbent materials. Even within the same space, differences in the initial part of sound attenuation can lead to perceptual variations in speech intelligibility among different receiver points. Consequently, this study varied the types and distributions of sound sources within the two pier-style lounges to establish four typical listening positions with distinct room acoustic parameters, designated as A, B, C, and D. For each listening position, six different SNR scenarios were created: −5 dB(A), 0 dB(A), 5 dB(A), 10 dB(A), 15 dB(A), and a noise-free condition. Subsequently, binaural room impulse responses were generated for these positions under each SNR setting, serving as experimental data for subsequent laboratory analysis of speech intelligibility at each location. The STIs for each position were computed within Odeon by adjusting the background noise levels in the lounges according to the sound pressure levels and SNRs across different octave bands for each specified listening position. Table 2 provides detailed descriptions of the acoustic properties and STI for each listening position under varying SNR conditions.

2.4. Speech Intelligibility Test

2.4.1. Speech Materials

In this study, subjects participated in subjective speech intelligibility assessments in a controlled laboratory setting using the Mandarin Chinese Phonetically Balanced (PB) word list, as delineated in GB/T 15508-1995 [48]. This PB word list is preferred over the commonly utilized Diagnostic Rhyme word list for its superior differentiation capabilities at higher clarity levels [37], thus offering a more precise reflection of the correlation between subjective and objective assessments. The list consists of 75 syllables, randomly organized into 25 sets of three syllables each. Recordings were made in an anechoic chamber at a cadence of four words per second by both a male and a female speaker, with a 10 s pause between each set to facilitate auditory processing by the subjects. In this investigation, speech was reproduced through headphones at a calibrated volume of approximately 70 dB(A). This volume setting is supported by prior research [49] indicating its suitability for conducting speech intelligibility assessments. Further, empirical evidence from an earlier study [7] has demonstrated that ambient noise levels in airport departure lounges can reach up to 65 dB(A) during peak traffic times with high noise conditions. Conversely, during periods of normal passenger flow in relatively quiet settings, ambient noise levels approximate 55 dB(A). Thus, by setting the headphone volume to 70 dB(A), this study effectively simulated more challenging acoustic environments in the airport lounges when the SNR was at 5 dB(A), and more favorable conditions when the SNR was at 15 dB(A). Other SNR settings provide a robust framework for assessing speech intelligibility in different ambient noise scenarios within terminal lounges.

2.4.2. Subjects

A total of 24 individuals (8 males and 16 females) aged 22 to 55 years were recruited for this study. All participants were university students or staff members, were native Mandarin speakers, and had normal hearing as confirmed by pure-tone audiometry screening. This sample size satisfies the requirement of the Chinese National Standard for Speech Intelligibility Testing (GB/T 15508-1995) [48], which stipulates a minimum of 10 participants. In line with the demographic composition commonly seen in airport departure lounges, where over 90% of passengers are under 55 years old [7], most participants (83.3%) in this study fell between 22 and 40 years of age, with 12.5% between 40 and 50, and 4.2% above 50. Although more females (16) than males (8) participated, previous research [50,51] indicates no significant gender-related differences in speech recognition or discrimination among normal-hearing individuals, so precise gender balance was not essential. Before the main experiment, all participants underwent standardized training and a preliminary test to ensure they could achieve a speech clarity score of at least 95% in the absence of noise and reverberation. During formal testing, each acoustic scenario was evaluated by at least ten participants, who listened to word lists spoken by both male and female voices. Following the guideline in GB/T 15508-1995 [48], which requires at least eight valid word lists for each scenario, this study collected twenty word lists per scenario. The final speech intelligibility score was calculated by averaging all valid word lists completed by the participants.

3. Results

3.1. Effect of the SNR

The SNR and room acoustic parameters are pivotal determinants of speech intelligibility. In this study, subjective speech intelligibility scores were gathered from four listening positions within the simulated environment of the departure lounge, under various SNRs ranging from −5 dB(A) to 15 dB(A) and in a noise-free condition. These results are displayed in Figure 4. Analysis of the data demonstrates a robust positive correlation between speech intelligibility and SNR at each of the listening positions, indicating that speech clarity scores improve as SNRs increase. This correlation is quantitatively modeled through a third-order polynomial fit, with determination coefficients (R-squared values) reported as 0.98, 0.99, 0.99, and 0.98, respectively, underscoring the strong predictive power of the SNR in assessing speech intelligibility across diverse acoustic settings.
Figure 5 presents a detailed analysis of the experimental data, showcasing the mean values and standard deviations of speech intelligibility scores within pier-style departure lounges under various SNR conditions. A one-way Analysis of Variance (ANOVA), conducted using SPSS 26.0, revealed a significant impact of SNR on speech intelligibility within these acoustic environments (F = 20.808, p < 0.001). Further insights from post hoc analysis using the Least Significant Difference (LSD) test are also depicted in Figure 5. This analysis highlights that under lower SNR conditions (−5, 0, and 5 dB(A)), speech intelligibility scores are significantly reduced compared to higher SNR conditions (10, 15 dB(A), and noise-free). Additionally, the analysis indicates no significant variance in speech intelligibility scores among the higher SNR settings (10, 15 dB(A), and noise-free). These findings imply that speech intelligibility improves markedly as SNR increases up to 10 dB(A); however, increments beyond this threshold do not contribute significantly to further enhancements in speech clarity. This observation aligns with previous study [25] in conventional rectangular spaces, varying from 342 to 41,656 m3 in volume. For larger rectangular spaces, approximately 97,000 m3 in size, the research in [27] identifies a critical threshold of 14.4 dB(A).

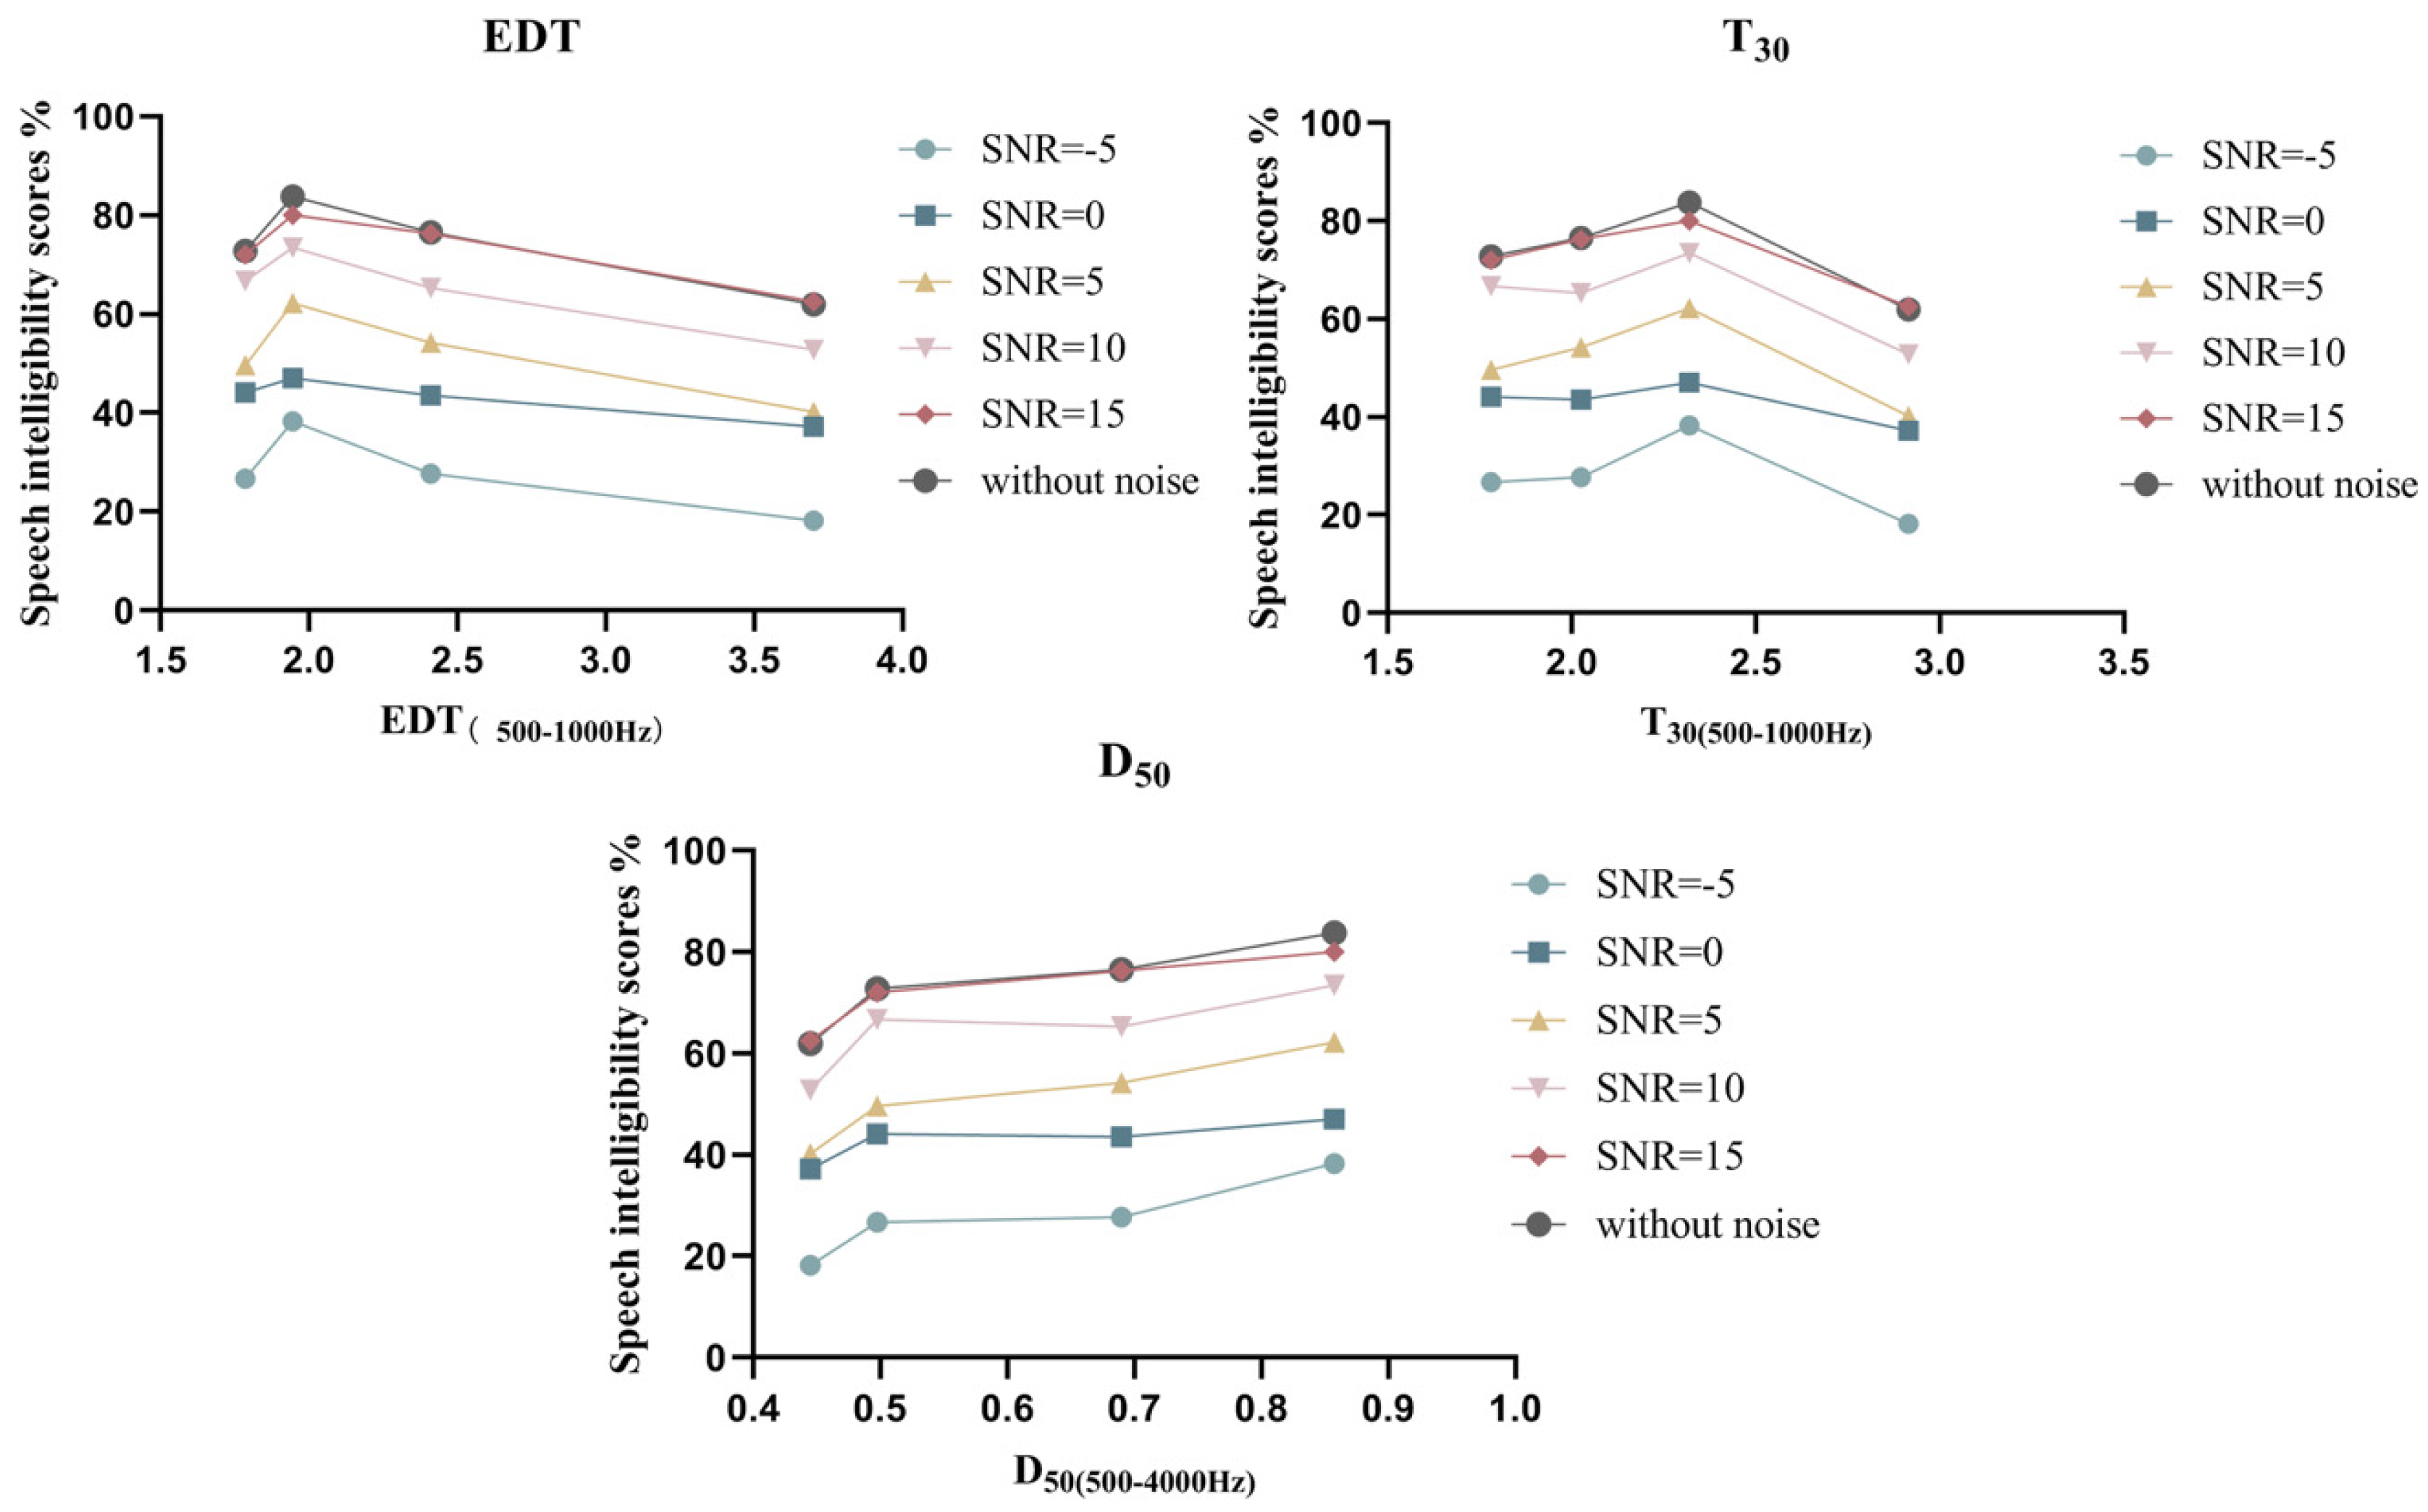
3.2. Effect of the Room Acoustic Parameters

Room acoustic parameters are pivotal in influencing speech intelligibility. Field impulse response measurements conducted within departure lounges, as documented in Appendix A, reveal that airport terminal piers, due to their extended lengths and substantial volumes, exhibit systematic variations in acoustic parameters both longitudinally and laterally. These variations are distinctly different from those observed in typical and traditional elongated spaces. Due to the complex nature of sound attenuation within the departure lounge, three specific parameters have been selected to elucidate the relationship between room acoustic characteristics and speech intelligibility: EDT, reflecting the early decay of sound energy; T30, indicating the decay of sound energy; and D50, denoting the ratio of early sound energy to total sound energy.
Figure 6 illustrates the relationship between speech intelligibility scores and room acoustic parameters (EDT, T30, and D50) under various SNR conditions. In the departure lounges, EDT (500–1000 Hz) ranges from 1.79 to 3.70 s, T30 (500–1000 Hz) spans 1.78 to 2.91 s, and D50 (500–4000 Hz) lies between 0.45 and 0.86. The data reveal a decline in speech intelligibility scores as EDT increases, while no clear trend emerges with T30. This finding deviates from typical observations in many conventional spaces, where increases in both EDT and T30 usually reduce speech intelligibility [52]. Consistent with prior study [27] on large rectangular venues like stadiums, this study highlights that speech intelligibility in such expansive spaces is more sensitive to EDT than T30. Additionally, Figure 6 shows a significant rise in speech intelligibility scores with increasing D50 across different SNR conditions, corroborating earlier findings [27,40] and indicating a strong correlation between D50 and speech clarity in reverberant environments.
To investigate the specific effects of EDT, T30, and D50 on speech intelligibility under different SNR conditions, regression analyses were conducted. These analyses integrated SNR with room acoustic parameters to develop multiple predictive models for evaluating speech clarity (see Table 3). The results show that incorporating EDT, T30, or D50 (Equations (2)–(4)) significantly enhances predictive accuracy compared to a model based solely on SNR (Equation (1)), as reflected by higher R2 values. Notably, Equation (4), which includes D50 in addition to SNR, achieved the highest coefficient of determination, highlighting D50’s strong predictive capability. The findings suggest that enhancing SNR, reducing EDT, and increasing D50 are strategic measures to augment speech intelligibility in pier departure lounges. In such expansive and elongated environments, EDT effectively captures the influence of early reflections from proximal surfaces like walls, ceilings, and floors on speech intelligibility, while T30, which encompasses more prolonged delayed reflections, exerts a lesser impact. Therefore, prioritizing the improvement of EDT and D50 over adjustments to T30 proves to be a more efficacious approach for optimizing speech intelligibility within these terminal pier-style departure lounges. Notably, Equation (4) demonstrates the highest R2 value, suggesting that the combination of SNR and D50 represents the most efficacious method for predicting speech intelligibility. Specifically, Equation (1) in Table 3 reveals a positive influence of SNR on speech intelligibility, with a linear term coefficient of 2.731 indicating that an increase in SNR enhances speech intelligibility. Conversely, the quadratic term coefficient is negative (−0.054), implying that the benefits of increasing SNR diminish after reaching a certain threshold. Equations (2) and (3) further demonstrate that negative coefficients for EDT and T30 are associated with improved speech intelligibility, suggesting that reduced early decay times and less reverberation are beneficial. Meanwhile, Equation (4) shows a positive coefficient for D50, indicating that higher D50 values, which denote a larger proportion of beneficial early reflected sound energy, are correlated with enhanced speech intelligibility.
A stepwise regression analysis conducted using SPSS 26.0 quantified the effects of the acoustic parameters on speech intelligibility. The results revealed that SNR accounted for the largest portion of variance in speech intelligibility, while the inclusion of EDT and D50 provided additional significant contributions. In contrast, T30 showed a non-significant impact and was subsequently excluded from the final regression model. The resulting Equation (5), which integrates SNR, EDT, and D50, achieved an R2 of 0.978, a standard error of 4.48, and a p-value below 0.001, indicating robust predictive accuracy and strong statistical significance.
S I = 40.259 + 2.731 × S N R 0.054 × S N R 2 5.072 × E D T + 23.322 × D 50
The findings indicate that raising SNR, reducing EDT, and increasing D50 are key strategies for enhancing speech intelligibility in pier-style departure lounges. In large, elongated spaces, such as those found in airport terminals, high ceilings often weaken direct sound energy, making early arriving sound energy (both direct sound and early reflections) critical for clear speech. Since EDT effectively captures the influence of early reflections from nearby surfaces—walls, ceilings, and floors—on speech intelligibility, it demonstrates greater sensitivity as a predictive parameter. By contrast, T30 describes the overall decay of the reverberant field, with its primary effect on intelligibility arising from the masking caused by late reflections. Because this effect is relatively indirect, T30’s impact on clarity is less significant than that of EDT [53,54]. Meanwhile, D50, which measures the proportion of early sound energy within the first 50 ms relative to the total sound energy, closely mirrors the temporal window of human speech perception [55]. Consequently, D50 excels in predicting speech clarity in large-scale spaces like airport terminals. Thus, focusing on improving EDT and D50 rather than adjusting T30 proves more effective for optimizing speech intelligibility in terminal pier-style departure lounges.

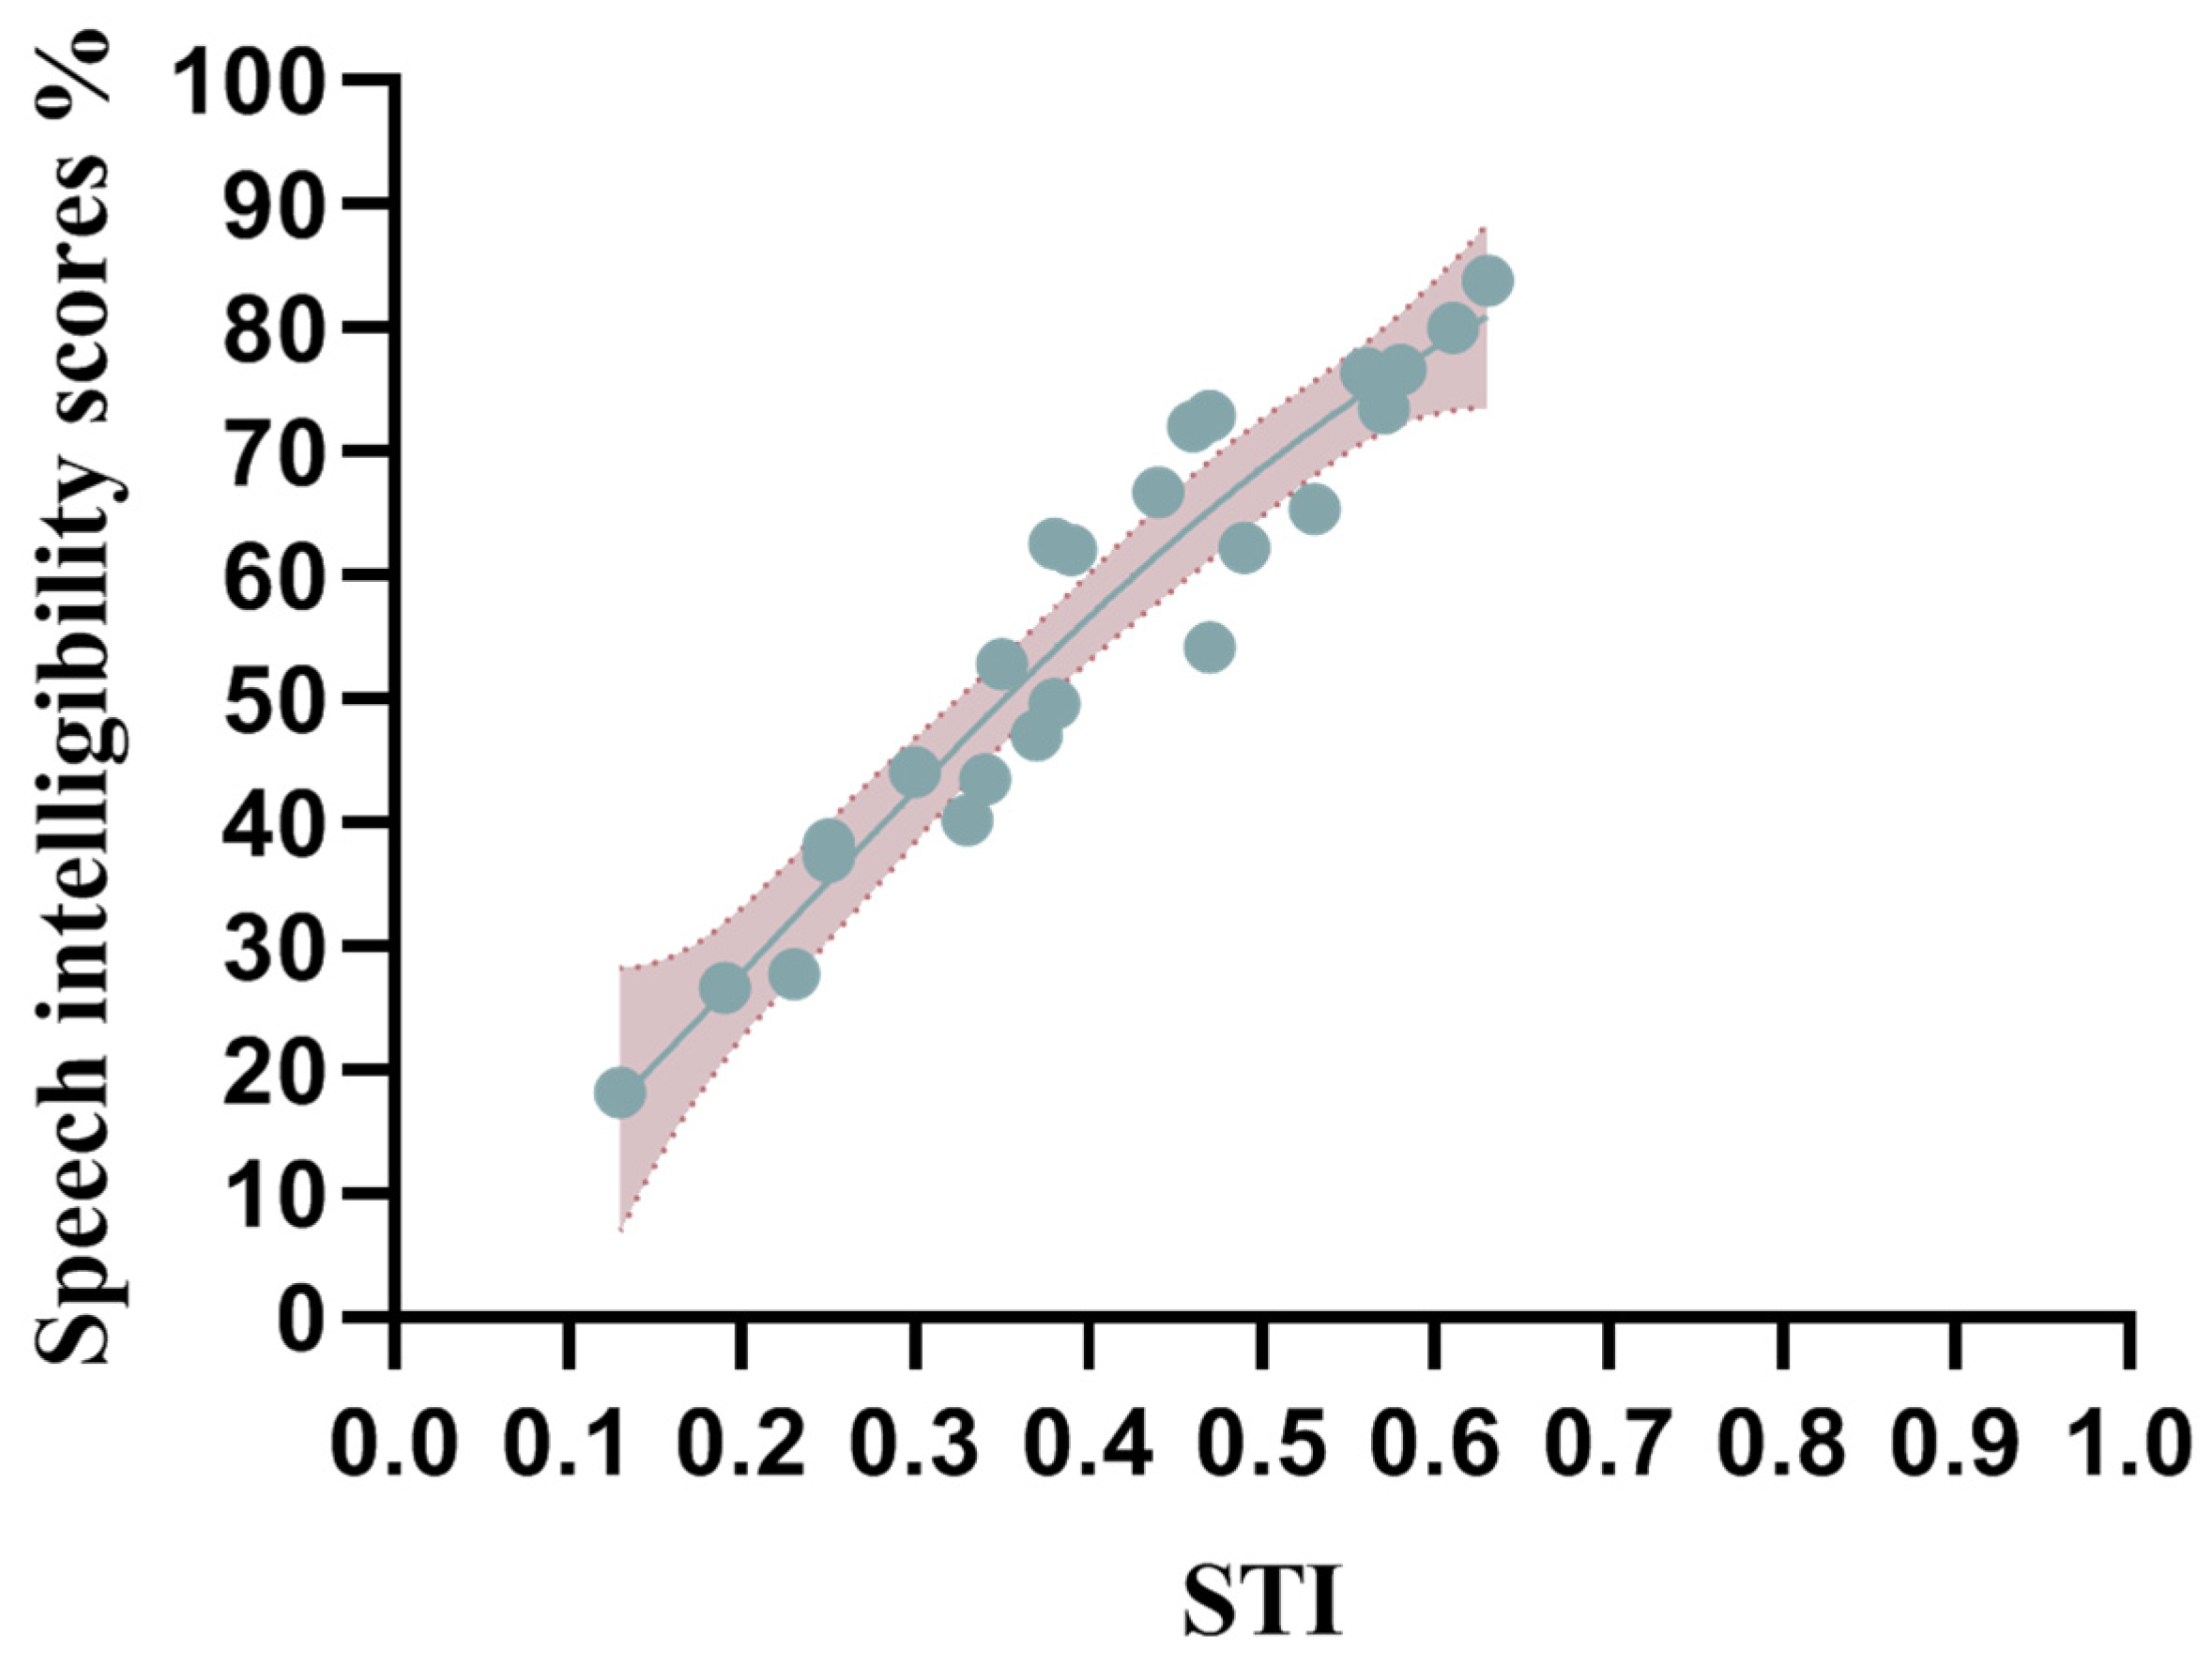
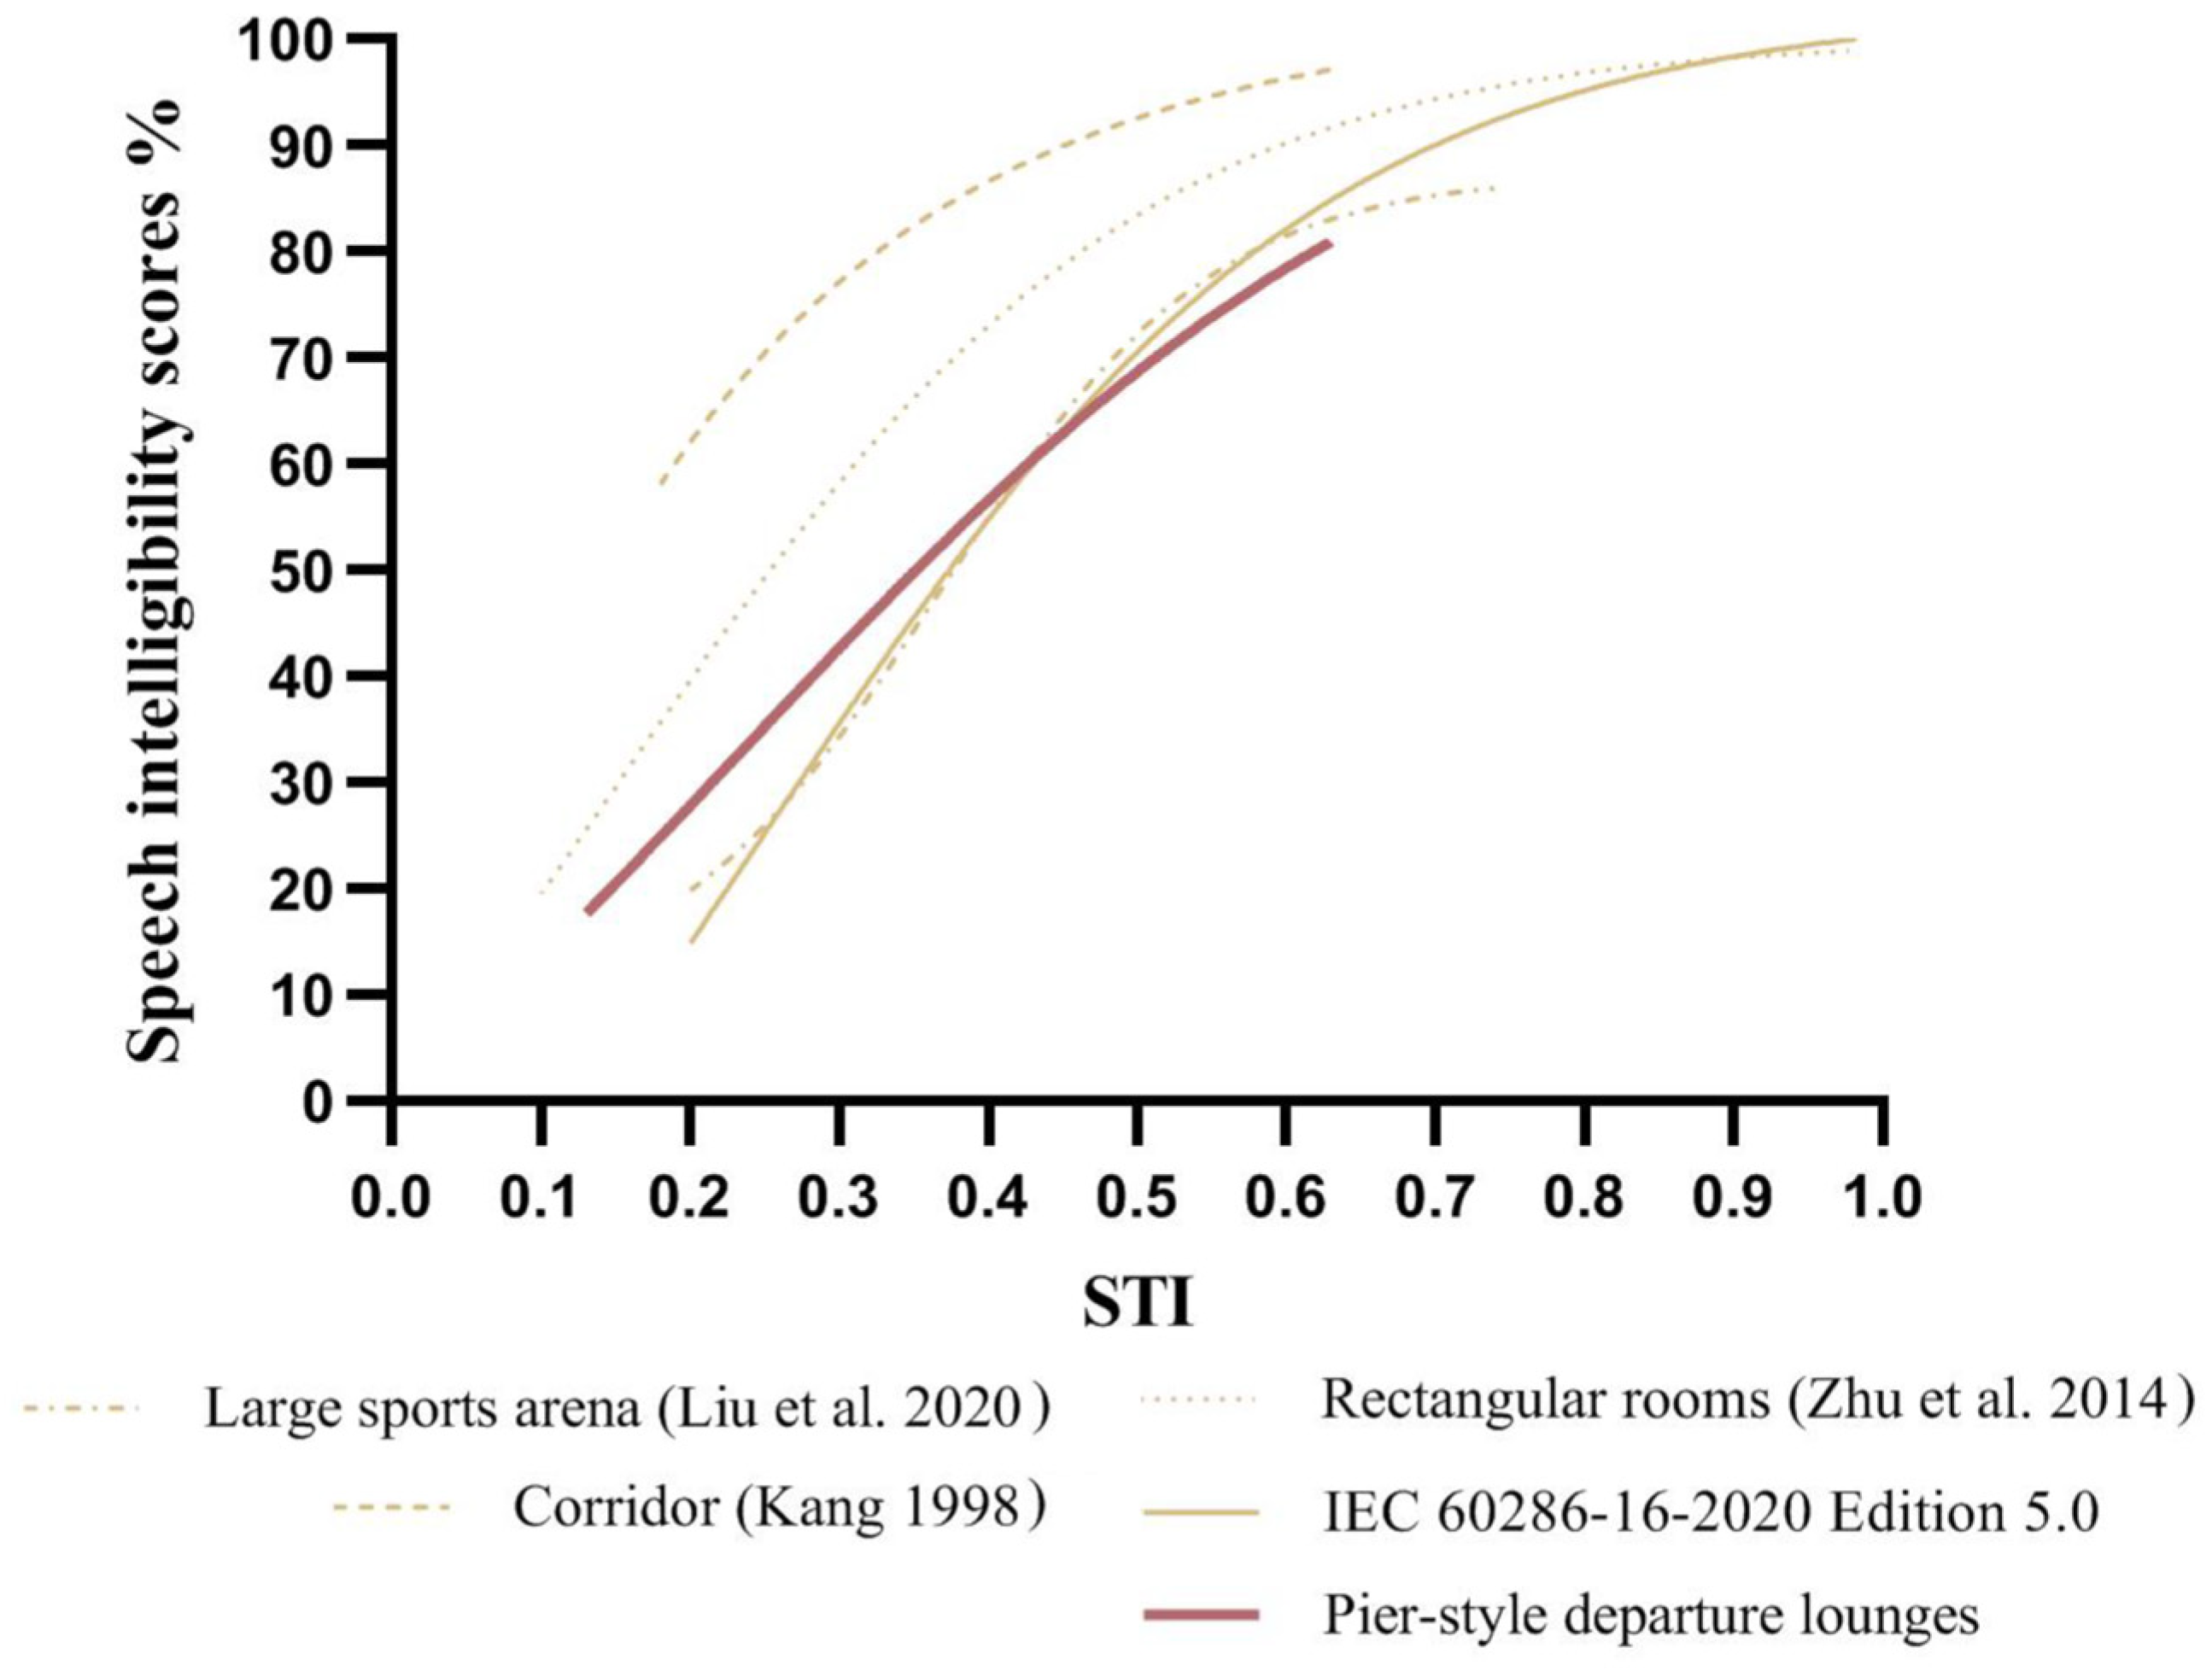
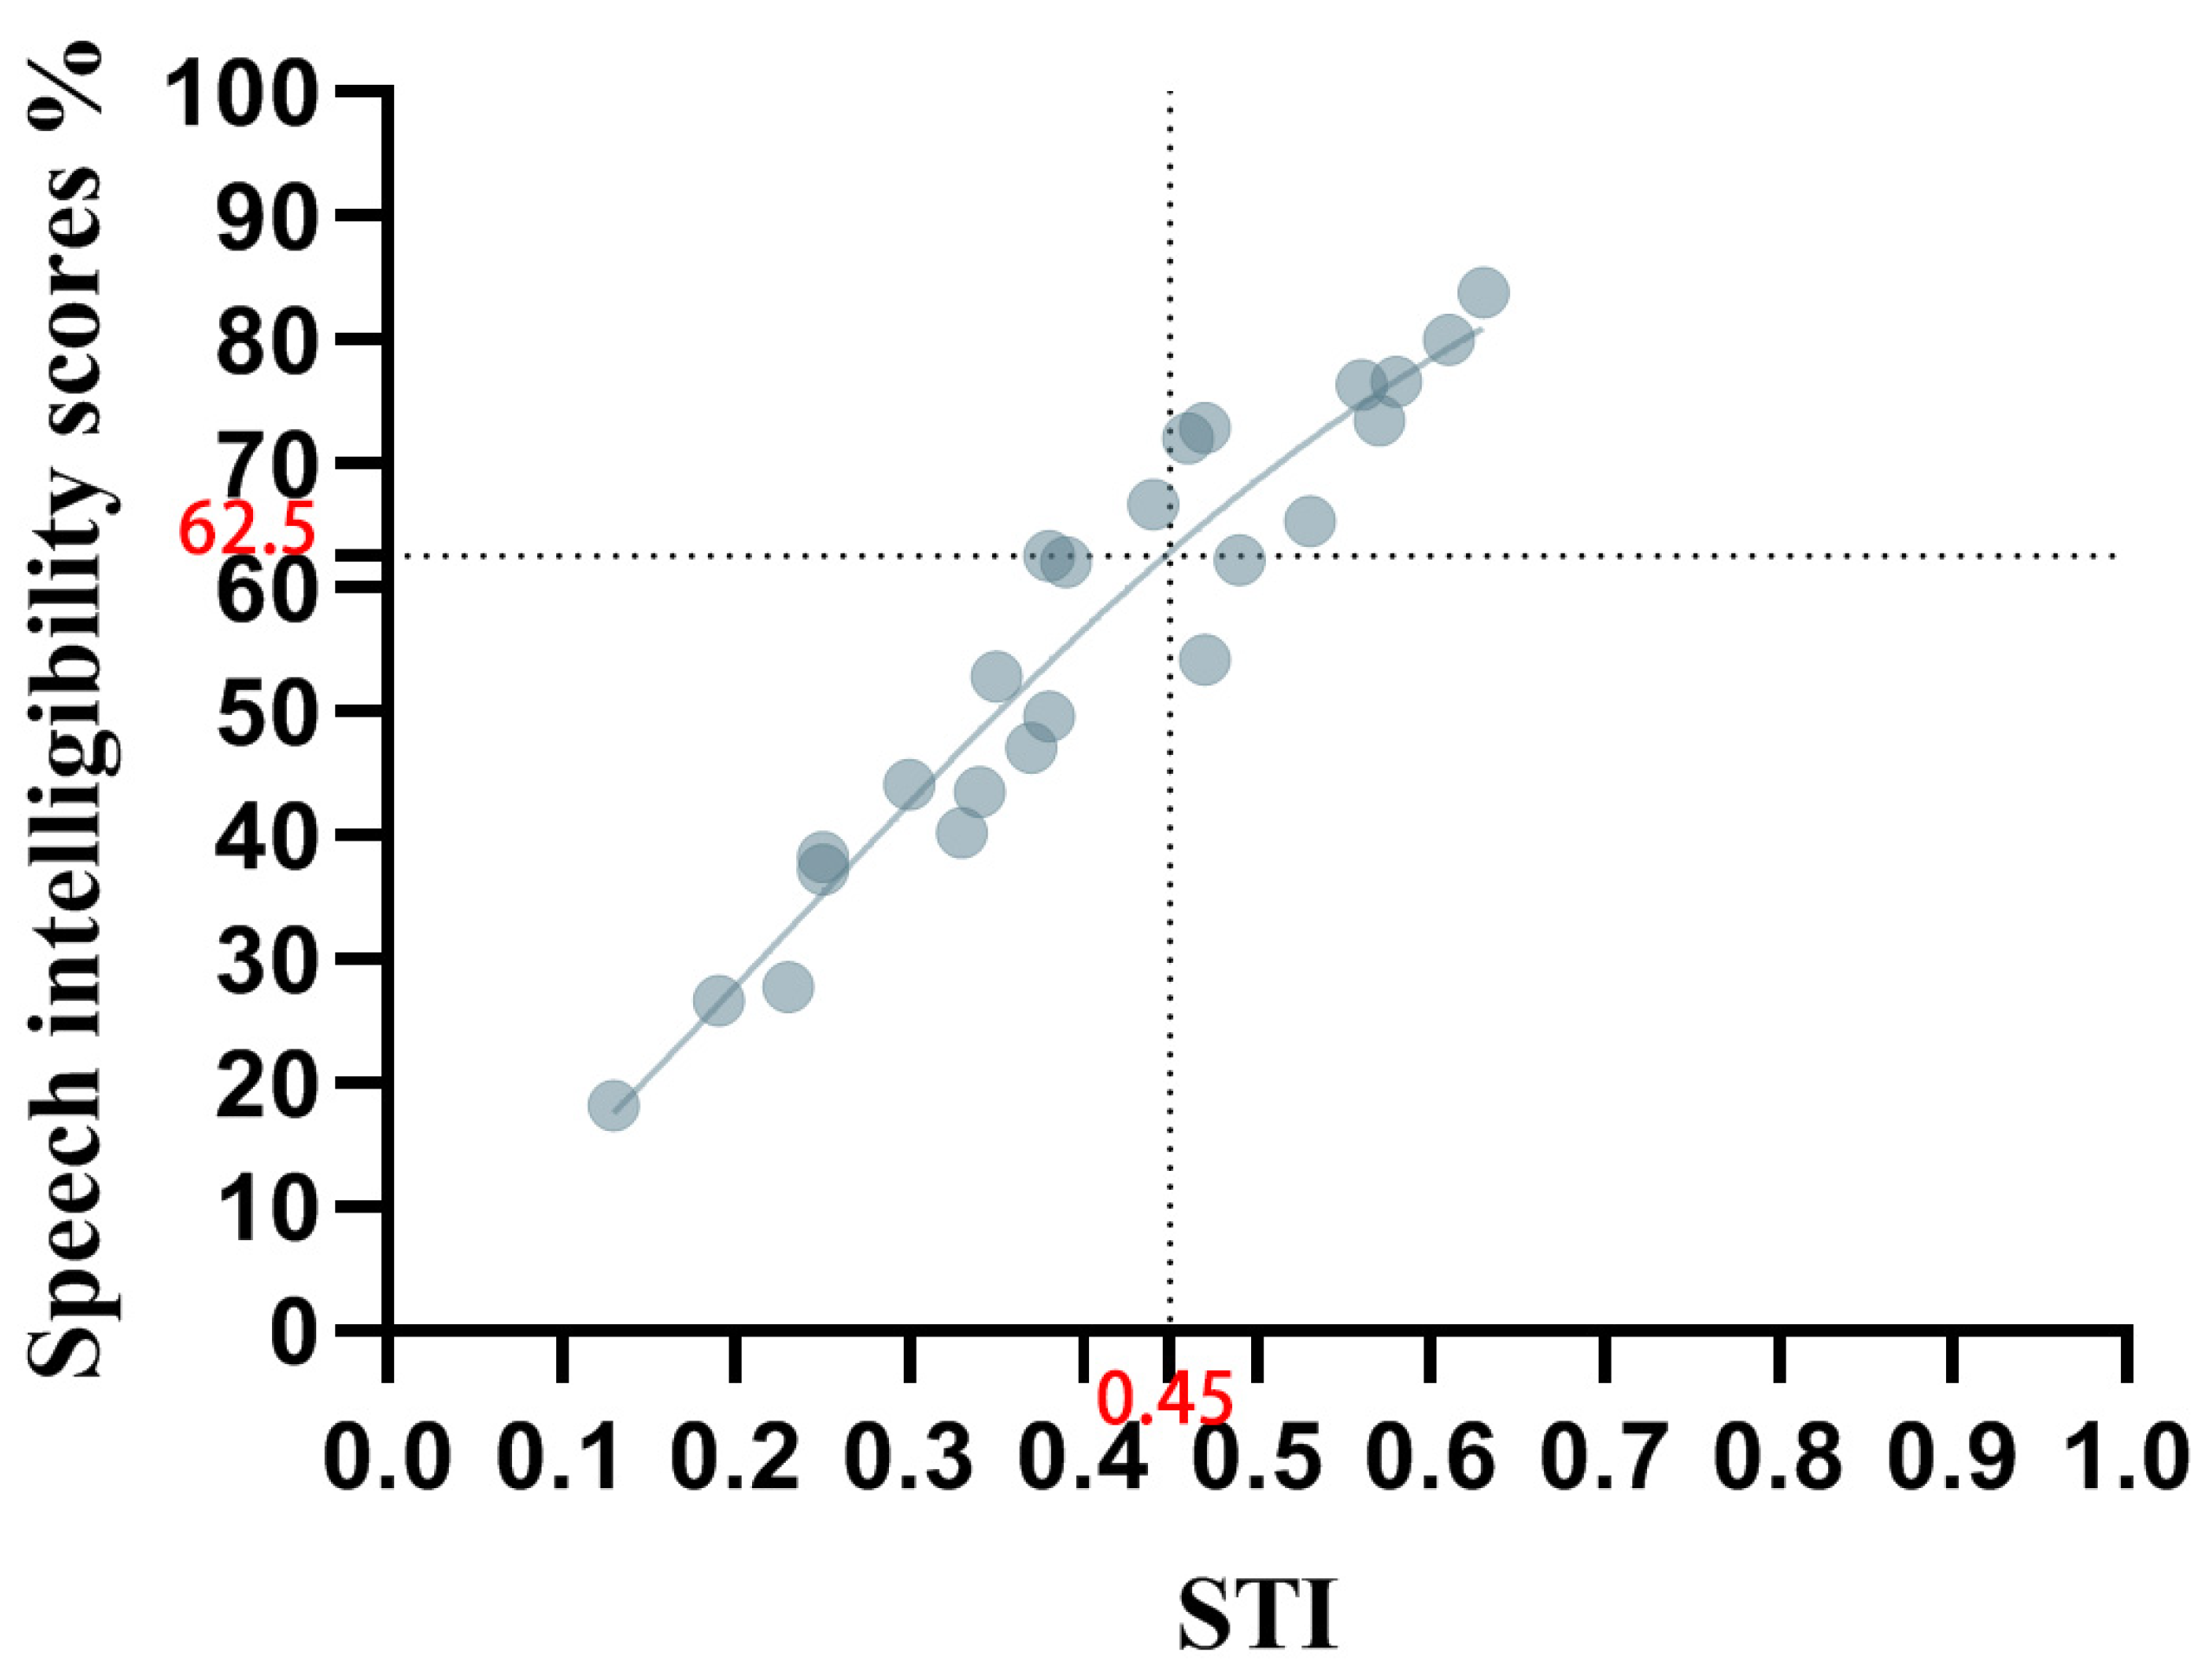
3.3. Relationship Between STI and Speech Intelligibility Score

Figure 7 depicts the relationship between speech intelligibility scores and the STI within pier-style departure lounges, highlighted by a 95% confidence interval shown in red.
To model the nonlinear relationship between STI and speech intelligibility, a third-order polynomial regression was applied, aligning with methodologies from prior research [21,27,35] to enable direct comparisons. The regression model, presented in Equation (6), achieved an R2 value of 0.918, a standard error of 5.66, and a statistically significant p-value (p < 0.001). These statistics indicate that STI explains 91.8% of the variance in speech intelligibility scores, confirming the model’s robust predictive accuracy. Equation (6) elucidates the impact of STI on speech intelligibility. The linear coefficient of STI is positive, indicating that increases in STI substantially improve speech clarity at lower levels of STI. Conversely, the cubic and quadratic coefficients are negative, suggesting that the benefits of increasing STI diminish as STI values rise, indicating a non-linear relationship where improvements in speech intelligibility plateau at higher STI levels.
S I = 58.383 × S T I 3 6.972 × S T I 2 + 162.504 × S T I 3.745
To assess the applicability of the STI in large, elongated spaces such as pier-style departure lounges, this study evaluates the correlation between STI and speech intelligibility scores across diverse architectural configurations and sizes. The findings are analyzed in conjunction with the revised STI–speech intelligibility curve [56] from the 2020 edition of the IEC 60268-16 standard [35], as depicted in Figure 8. The study selected a large sports arena with a volume of 97,000 m3 [27] as a representative of large rectangular spaces, comparing it against a modeled and measured pier-style departure lounge with a volume of 100,000 m3. Additionally, a pair of conventional-sized rectangular and elongated spaces were chosen as control groups; conventional rectangular spaces included office and classroom environments ranging from 108 to 1674 m3 [21], and the conventional elongated space was an architectural corridor measuring 109 m3, with dimensions of 25.3 m by 1.86 m by 2.34 m [24]. It is important to note that while the IEC 60268-16 standard utilizes an English PB word list, all other evaluations in this research use a Mandarin PB word list for subjective speech intelligibility assessments.
The speech intelligibility curves derived from this study were compared with the IEC 60268-16 standard [35] to identify similarities and differences. The comparison revealed an overall consistent trend between the two, with minor variations in specific STI value ranges. The most significant deviation occurs at an STI of 0.2, where the speech intelligibility scores differ by approximately 10%. As the STI value increases, the discrepancy decreases, narrowing to 7% at an STI of 0.3, and remains consistently below 3% once the STI exceeds 0.35. This indicates that STI, as a critical parameter for measuring speech intelligibility, generally maintains good applicability in large spaces such as pier-style departure lounges, except for slight deviations at lower STI values.
In the comparison between large rectangular spaces and pier-style departure lounges, there are observable differences in speech intelligibility scores at lower STI values (below 0.4), with the maximum difference reaching 10%. This disparity diminishes as the STI increases. Specifically, at lower STI levels, the speech intelligibility in pier-style lounges (elongated spaces) is slightly better than that in sports arenas (rectangular spaces). However, at higher STI values (above 0.4), the speech intelligibility scores are comparable, showing no significant differences. The control group comparison reveals a consistent pattern where corridors (conventional elongated spaces) exhibit better speech intelligibility than typical rooms (conventional rectangular spaces). This phenomenon is largely attributed to the unique geometric properties of elongated spaces, which promote longitudinal sound propagation, thus resulting in a more focused and clearer integration of direct and early reflected sounds. Nevertheless, the conventional STI calculation methodology may not possess the requisite sensitivity to fully capture the acoustic benefits offered by these spatial configurations, particularly in terms of sound propagation and reflection dynamics over extended distances. Hence, the acoustic advantages of elongated spaces are not completely represented in standard STI evaluations. At equivalent STI values, speech intelligibility scores in elongated spaces tend to be higher than in rectangular spaces.
Moreover, at the same STI values, speech intelligibility scores in large elongated rectangular spaces are notably lower than in smaller elongated rectangular spaces. This disparity may stem from the greater distances sound must travel in larger areas, resulting in numerous delayed reflections and prolonged intervals. The STI quantitatively assesses speech intelligibility through the modulation transfer function (MTF) across different frequency bands, focusing on modulation depth and frequency response during signal transmission. Although STI is effective in capturing the impacts of direct and early reflections, its ability to address late reflections is significantly limited [35]. Consequently, due to STI’s inadequate consideration of the detrimental effects of late reflections on auditory perception, these reflections in large spaces, though not distinctly perceived as echoes, blur acoustic signals, complicating the perception of direct and early reflected sounds. This complexity reduces the resolution of speech components, thus diminishing speech intelligibility scores in large spaces.

4. Discussion

4.1. SNR for Public Announcements

Prolonged background noise assessments at Amsterdam Schiphol Airport in the Netherlands demonstrated that the 15 min average noise levels varied between 55 and 70 dB(A), with peaks during high-traffic periods reaching 61–68 dB(A) [10]. Similarly, systematic environmental noise evaluations across eight major airports in China revealed that terminal noise levels averaged between 55 dB(A) and 70 dB(A) [6]. Notably, Guangzhou Baiyun International Airport (CAN) usually registers noise levels between 55 and 65 dB(A) [7], while Tianjin Binhai International Airport (TSN) records 60 to 65 dB(A) with minimal fluctuation from morning to evening [11]. These collective data indicate that noise levels within airport departure lounges typically span from 55 to 70 dB(A), with peaks during busy periods ranging from 60 to 70 dB(A).
Given the heightened noise levels in pier-style departure lounges, selecting an appropriate SNR for public announcements is critical. Excessively high SNRs can exacerbate auditory strain and reduce environmental comfort, whereas insufficient SNRs can undermine speech clarity. Consequently, it is imperative to strike a balance between auditory comfort and clarity of communication.
Investigations into the SNR of public announcements within pier-style departure lounges reveal SNRs ranging from −1.0 dB(A) to 13.9 dB(A) [7]. These evaluations were conducted in five pier-style lounges at Guangzhou Baiyun Airport, comparable in design, volume, and materials to the lounges examined in this study. The relationship between passengers’ subjective evaluations of announcement clarity and SNR, derived from these surveys, is juxtaposed against laboratory-derived speech intelligibility scores and SNR relationships in this research (refer to Figure 9). The blue curve depicts the correlation between speech intelligibility scores and SNR, aligned with the left Y-axis; the yellow curve, corresponding to the right Y-axis, illustrates the subjective evaluations of broadcast clarity in relation to SNR. This curve demonstrates that passenger assessments of announcement clarity improve with rising SNR levels. Notably, when lounge announcements are rated as clear at a score of 4, the corresponding SNR is 9.3 dB(A), indicating that this SNR level is deemed satisfactory by passengers.
Furthermore, as detailed in Section 3.1 of this analysis, increments in SNR above 10 dB(A) do not significantly enhance speech intelligibility within the lounges. Thus, maintaining an SNR of 10 dB(A) in pier-style lounges efficiently balances the needs for a tranquil and comfortable resting environment with the imperative for clear broadcast communication.

4.2. Discussion on Required Speech Intelligibility Scores

The necessary speech intelligibility scores within pier-style lounges also merit further discussion. In spaces where high speech clarity is crucial, such as elementary classrooms, studies [20,57] suggest that speech intelligibility scores need to reach 95% for most children to easily grasp the information taught by teachers. However, in pier-style lounges, achieving a 90% speech intelligibility score is challenging, even with a high SNR.
Analysis of the two curves in Figure 9 reveals that at an SNR of 9.3 dB(A), the blue curve indicates a speech intelligibility score of 62.5%. This suggests that for airport departure lounge public service announcements, which typically involve fixed simple phrases, a speech intelligibility score of approximately 62.5% is generally satisfactory for passengers. However, according to Equation (1) in Table 3, the coefficient of determination in the regression analysis between SNR and speech intelligibility scores in pier-style departure lounges is 0.849, indicating that it only explains 84.9% of the variance in speech intelligibility scores. Additionally, since the participants and the lounges evaluated for the two curves differ, this derived value should not be regarded as definitive but rather as a rough guideline.

4.3. STI Rating for Terminal Pier-Style Departure Lounges

The regression analysis in Figure 10 shows that, in pier-style departure lounges, a speech intelligibility score of 62.5% corresponds to an STI of 0.45. This result indicates that an STI of at least 0.45 should be maintained to meet passengers’ needs for clear announcements. The STI threshold of 0.45 and the corresponding speech intelligibility score of 62.5% identified in this study align with international standards, ensuring effective public address announcements within these pier-style departure lounges.
ISO 9921:2003, Ergonomics—Assessment of Speech Communication [58], provides guidelines for ensuring speech intelligibility in noisy or challenging conditions, such as during alerts or warnings. It specifies that individuals should be able to correctly understand simple sentences in such scenarios. The standard sets a minimum acceptable rating of “Poor”, corresponding to an STI range of 0.45–0.60 and a speech intelligibility score of 60–80%. The findings of this study, with an STI threshold of 0.45 and a corresponding intelligibility score of 62.5%, fall within these parameters, satisfying the baseline requirements for emergency communication systems in pier-style departure lounges.
IEC 60268-16 [35] provides a qualification system for STI, ranging from “A+” (excellent) to “U” (unacceptable). Within this framework, the “H” band (STI 0.44–0.48) is recommended for voice alarm (VA) and public address (PA) systems operating in reverberant or acoustically complex environments. Pier-style departure lounges, characterized by their tall ceilings, smooth reflective surfaces, and complex acoustics, align with these conditions. However, the public announcements in such spaces typically consist of simple, repetitive messages familiar to passengers, making the “H” band suitable for effective communication. This STI band also represents the normal lower limit for VA systems, ensuring intelligibility in challenging environments. STI levels below 0.4, classified in the “J” band or lower, are considered inadequate for public address systems. Consequently, an STI of 0.45, falling within the “H” band, is a reasonable and effective target for ensuring intelligibility in pier-style lounges.
Based on the international standards and experimental results from this study, the recommended minimum STI requirement for terminal pier-style departure lounges is set at 0.45, with a corresponding speech intelligibility score of 62.5%. This threshold meets passengers’ clarity needs for broadcast systems and complies with the minimum safety-critical communication standards outlined in ISO 9921 and IEC 60268-16. By ensuring the effective transmission of emergency information, this minimum recommended standard not only enhances safety but also aligns with the unique acoustic conditions of terminal environments.

5. Conclusions

This study explored the factors affecting Mandarin speech intelligibility in pier-style departure lounges through on-site measurements, simulations, and laboratory tests. The results indicate that the SNR significantly impacts speech intelligibility scores. Speech intelligibility scores increase notably with SNR up to 10 dB(A); however, further increases in SNR above this threshold do not significantly enhance clarity. There is a significant relationship between room acoustic parameters—specifically, EDT and D50—and speech intelligibility scores, with EDT negatively impacting and D50 positively affecting speech clarity. This research established a relationship curve between Mandarin speech intelligibility and the STI in pier-style departure lounges. The findings demonstrate that STI effectively measures speech intelligibility scores in large, elongated spaces such as pier-style lounges, with high applicability and good conformity, showing only minor deviations (not exceeding 10%) when STI values are low (below 0.35). Further analysis revealed that passengers are satisfied with the clarity of public announcements when the broadcast signal-to-noise ratio is 9.3 dB(A) and the speech intelligibility score is 62.5%. Therefore, this study recommends maintaining a signal-to-noise ratio of 10 dB(A) and a minimum STI value of 0.45 for broadcasting public announcements in pier-style departure lounges to ensure that passengers clearly hear the announcements.

Author Contributions

X.L.: Writing—original draft, Visualization, Software, Methodology, Investigation, Formal analysis, Data curation, Conceptualization. Y.Z.: Validation, Supervision, Methodology, Conceptualization. All authors have read and agreed to the published version of the manuscript.

Funding

This research was supported by the National Natural Science Foundation of China (Grant No. 51378215).

Data Availability Statement

The original contributions presented in the study are included in the article, further inquiries can be directed to the corresponding author.

Conflicts of Interest

The authors declare no conflict of interest.

Appendix A

Table A1. Acoustical characteristics of the two-pier departure lounge.
Departure LoungeLength/Width/Height (m) a ¯ EDT (500–1 k) (s)T30 (500–1 k)(s)D50 (500–4 k)
Pier AR1220 m, 40 m, 8.2 m~12 m,0.112.63 3.93 0.42
R23.26 3.89 0.35
R32.99 3.80 0.27
R43.98 3.90 0.18
R53.46 4.23 0.23
R63.95 3.49 0.13
R74.41 3.76 0.30
R84.52 4.34 0.23
R94.91 4.59 0.06
R104.58 3.68 0.08
R112.28 3.82 0.39
R123.06 3.66 0.38
R133.03 3.80 0.24
R143.50 3.85 0.24
R153.27 3.87 0.21
R163.84 3.78 0.19
R174.31 3.97 0.09
R184.71 4.06 0.05
R194.92 4.40 0.02
R204.06 3.89 0.19
Pier BR1160 m, 32 m~40 m, 8.2 m~12 m,0.112.37 3.43 0.51
R22.44 2.93 0.54
R33.57 3.49 0.32
R43.78 3.50 0.24
R53.90 3.56 0.11
R63.84 3.52 0.14
R73.18 3.47 0.31
R82.70 3.41 0.52
R93.12 3.60 0.32
R103.46 3.59 0.33
R113.81 3.83 0.29
R124.08 3.97 0.25
R134.66 4.11 0.20
R144.75 4.20 0.07
R154.15 4.10 0.13
R164.24 3.89 0.08

Appendix B

Table A2. The average simulated and measured values of EDT, T30, and D50 across each octave band from 125 Hz to 4000 Hz for the entire lounge in Pier A and Pier B.
Departure LoungeAcoustic ParametersFrequency Bands (Hz)
125250500100020004000
Pier AEDTMeasured2.04 2.88 3.79 3.78 3.82 2.98
Simulated2.44 3.21 3.87 3.84 3.80 3.10
Difference (JND)3.302.070.43 0.30 0.09 0.76
T30Measured2.53 3.32 3.96 3.91 3.82 3.01
Simulated2.58 3.30 3.95 3.89 3.83 3.05
Difference (JND)0.36 0.11 0.07 0.10 0.03 0.28
D50Measured0.27 0.26 0.19 0.20 0.19 0.26
Simulated0.32 0.26 0.22 0.21 0.20 0.23
Difference (JND)1.00 0.00 0.60 0.20 0.20 0.60
Pier BEDTMeasured2.31 2.89 3.60 3.66 3.57 2.75
Simulated2.71 3.08 3.78 3.82 3.76 2.89
Difference (JND)2.991.230.96 0.86 1.03 0.99
T30Measured2.56 3.15 3.70 3.63 3.56 2.86
Simulated2.45 3.13 3.66 3.66 3.61 2.88
Difference (JND)0.900.13 0.22 0.16 0.28 0.14
D50Measured0.41 0.32 0.26 0.26 0.24 0.32
Simulated0.32 0.28 0.23 0.23 0.23 0.27
Difference (JND)1.800.80 0.60 0.60 0.20 1.00
In the table, the “difference” row highlights the values in italics when the difference between the simulated and measured values exceeds 1 JND.

References

  1. Edwards, B. The Modern Airport Terminal: New Approaches to Airport Architecture; Taylor & Francis: London, UK, 2004. [Google Scholar]
  2. Huang, H.; Chen, L.; Hu, E. A new model predictive control scheme for energy and cost savings in commercial buildings: An airport terminal building case study. Build. Environ. 2015, 89, 203–216. [Google Scholar] [CrossRef]
  3. Bandara, S.; Wirasinghe, S.C. Walking distance minimization for airport terminal configurations. Transp. Res. Part A Policy Pract. 1992, 26, 59–74. [Google Scholar] [CrossRef]
  4. Hanaoka, S.; Saraswati, B. Low cost airport terminal locations and configurations. J. Air Transp. Manag. 2011, 17, 314–319. [Google Scholar] [CrossRef]
  5. Wang, Z.; Zhao, H.; Lin, B.; Zhu, Y.; Ouyang, Q.; Yu, J. Investigation of indoor environment quality of Chinese large-hub airport terminal buildings through longitudinal field measurement and subjective survey. Build. Environ. 2015, 94, 593–605. [Google Scholar] [CrossRef]
  6. Geng, Y.; Yu, J.; Lin, B.; Wang, Z.; Huang, Y. Impact of individual IEQ factors on passengers’ overall satisfaction in Chinese airport terminals. Build. Environ. 2017, 112, 241–249. [Google Scholar] [CrossRef]
  7. Li, X.; Zhao, Y. Evaluation of sound environment in departure lounges of a large hub airport. Build. Environ. 2023, 232, 110046. [Google Scholar] [CrossRef]
  8. Saffarzadeh, M.; Braaksma, J.P. Optimum design and operation of airport passenger terminal buildings. Transp. Res. Rec. 2000, 1703, 72–82. [Google Scholar] [CrossRef]
  9. Kotopouleas, A.; Nikolopoulou, M. Evaluation of comfort conditions in airport terminal buildings. Build. Environ. 2018, 130, 162–178. [Google Scholar] [CrossRef]
  10. van Wijngaarden, S.J.; Atsma, R. Ambient noise inside airport terminals: A detailed survey of the background noise at Amsterdam Airport Schiphol. In Proceedings of the INTER-NOISE and NOISE-CON Congress and Conference Proceedings, Seoul, Republic of Korea, 23–26 August 2020; Institute of Noise Control Engineering: Seoul, Republic of Korea, 2020; pp. 1588–1595. [Google Scholar]
  11. Liu, M.; Gao, Z.; Chang, F.; Zhao, W.; Wang, J.; Ma, H.; Wang, C. Passengers’ Perception of Acoustic Environment in the Airport Terminal: A Case Study of Tianjin Binhai International Airport. Buildings 2023, 13, 2585. [Google Scholar] [CrossRef]
  12. Yang, L.; Chen, Z.; Zhen, M. Effects of thermal-acoustic interaction on airport terminal’s indoor thermal comfort: A case study in cold region of China. J. Build. Eng. 2024, 86, 108834. [Google Scholar] [CrossRef]
  13. Venetjoki, N.; Kaarlela-Tuomaala, A.; Keskinen, E.; Hongisto, V. The effect of speech and speech intelligibility on task performance. Ergonomics 2006, 49, 1068–1091. [Google Scholar] [CrossRef] [PubMed]
  14. Dubbelboer, F.; Houtgast, T. A detailed study on the effects of noise on speech intelligibility. J. Acoust. Soc. Am. 2007, 122, 2865–2871. [Google Scholar] [CrossRef] [PubMed]
  15. Schlittmeier, S.J.; Hellbrück, J.; Thaden, R.; Vorländer, M. The impact of background speech varying in intelligibility: Effects on cognitive performance and perceived disturbance. Ergonomics 2008, 51, 719–736. [Google Scholar] [CrossRef]
  16. Borille, G.M.R.; da Silva, E.J.; Nascimento, M.V.D.; Bandeira, M.C.G.D.S.P.; Rendhol, A.L.M.; da Silva, L.M.; Ansélmo, C.S.; Gomes, R.D.A. Airport passenger building assessment of circulation facilities for smooth traffic and efficient design. Simul. Model. Pract. Theory 2022, 119, 102555. [Google Scholar] [CrossRef]
  17. Bateman, G.; Majumdar, A. Characteristics of emergency evacuations in airport terminal buildings: A new event database. Saf. Sci. 2020, 130, 104897. [Google Scholar] [CrossRef]
  18. Tang, G.; Zhao, Z.; Yu, J.; Sun, Z.; Li, X. Simulation-based framework for evaluating the evacuation performance of the passenger terminal building in a Ro-Pax terminal. Autom. Constr. 2021, 121, 103445. [Google Scholar] [CrossRef]
  19. Bistafa, S.R.; Bradley, J.S. Reverberation time and maximum background-noise level for classrooms from a comparative study of speech intelligibility metrics. J. Acoust. Soc. Am. 2000, 107, 861–875. [Google Scholar] [CrossRef]
  20. Bradley, J.S.; Sato, H. The intelligibility of speech in elementary school classrooms. J. Acoust. Soc. Am. 2008, 123, 2078–2086. [Google Scholar] [CrossRef]
  21. Zhu, P.; Mo, F.; Kang, J. Relationship between Chinese speech intelligibility and speech transmission index under reproduced general room conditions. Acta Acust. United Acust. 2014, 100, 880–887. [Google Scholar] [CrossRef]
  22. Kang, J. Speech intelligibility improvement for multiple loudspeakers by increasing loudspeaker directionality architecturally. Build. Serv. Eng. Res. Technol. 1996, 17, 203–208. [Google Scholar] [CrossRef]
  23. Kang, J. Acoustics in long enclosures with multiple sources. J. Acoust. Soc. Am. 1996, 99, 985–989. [Google Scholar] [CrossRef]
  24. Kang, J. Comparison of speech intelligibility between English and Chinese. J. Acoust. Soc. Am. 1998, 103, 1213–1216. [Google Scholar] [CrossRef]
  25. Jianxin, P. Chinese syllable and phoneme identification in noise and reverberation. Arch. Acoust. 2014, 39, 483–488. [Google Scholar] [CrossRef]
  26. Wang, C.; Ma, H.; Wu, Y.; Kang, J. Characteristics and prediction of sound level in extra-large spaces. Appl. Acoust. 2018, 134, 1–7. [Google Scholar] [CrossRef]
  27. Liu, H.; Ma, H.; Kang, J.; Wang, C. The speech intelligibility and applicability of the speech transmission index in large spaces. Appl. Acoust. 2020, 167, 107400. [Google Scholar] [CrossRef]
  28. Kang, J. The unsuitability of the classic room acoustical theory in long enclosures. Archit. Sci. Rev. 1996, 39, 89–94. [Google Scholar] [CrossRef]
  29. Kang, J. Sound attenuation in long enclosures. Build. Environ. 1996, 31, 245–253. [Google Scholar] [CrossRef]
  30. Jianxin, P. Relationship between Chinese speech intelligibility and speech transmission index using diotic listening. Speech Commun. 2007, 49, 933–936. [Google Scholar] [CrossRef]
  31. Kang, J. A method for predicting acoustic indices in long enclosures. Appl. Acoust. 1997, 51, 169–180. [Google Scholar] [CrossRef]
  32. Li, K.M.; Lam, P.M. Prediction of reverberation time and speech transmission index in long enclosures. J. Acoust. Soc. Am. 2005, 117, 3716–3726. [Google Scholar] [CrossRef]
  33. Kang, J. Improvement of the STI of multiple loudspeakers in long enclosures by architectural treatments. Appl. Acoust. 1996, 47, 129–148. [Google Scholar] [CrossRef]
  34. Kim, Y.H.; Soeta, Y. Architectural treatments for improving sound fields for public address announcements in underground station platforms. Appl. Acoust. 2013, 74, 1205–1220. [Google Scholar] [CrossRef]
  35. IEC 60286-16; Sound System Equipment-Part 16: Objective Rating of Speech Intelligibility by Speech Transmission Index. International Electrotechnical Commission: Geneva, Switzerland, 2020.
  36. Odeon-Room Acoustics Software. Available online: http://odeon.dk (accessed on 10 January 2025).
  37. Zhu, P.; Mo, F.; Kang, J.; Zhu, G. Comparisons between simulated and in-situ measured speech intelligibility based on (binaural) room impulse responses. Appl. Acoust. 2015, 97, 65–77. [Google Scholar] [CrossRef]
  38. Zhu, P.; Tao, W.; Mo, F.; Lu, X.; Zhang, H. Experimental comparisons of speech transmission index prediction methods. Appl. Acoust. 2024, 220, 109985. [Google Scholar] [CrossRef]
  39. ISO 3382-2; Acoustics—Measurement of Room Acoustic Parameters—Part 2 Reverberation Time in Ordinary Rooms. ISO: Geneva, Switzerland, 2008.
  40. Jianxin, P. Chinese speech intelligibility at different speech sound pressure levels and signal-to-noise ratios in simulated classrooms. Appl. Acoust. 2010, 71, 386–390. [Google Scholar] [CrossRef]
  41. ODEON Room Acoustics Software User’s Manual. Available online: https://odeon.dk/downloads/user-manual/ (accessed on 10 January 2025).
  42. Riener, K.R.; Warren, R.M.; Bashford, J.A., Jr. Novel findings concerning intelligibility of bandpass speech. J. Acoust. Soc. Am. 1992, 91 (Suppl. 4), 2339. [Google Scholar] [CrossRef]
  43. Stickney, G.S.; Assmann, P.F. Intelligibility of bandpass-filtered speech. J. Acoust. Soc. Am. 1997, 102 (Suppl. 5), 3134. [Google Scholar] [CrossRef]
  44. Wang, X.; Ge, J.; Meller, L.; Yang, Y.; Zeng, F.-G. Speech intelligibility and talker identification with non-telephone frequencies. JASA Express Lett. 2024, 4, 075202. [Google Scholar] [CrossRef]
  45. Bhargava, P.; Başkent, D. Effects of low-pass filtering on intelligibility of periodically interrupted speech. J. Acoust. Soc. Am. 2012, 131, EL87–EL92. [Google Scholar] [CrossRef]
  46. IBM SPSS Software. Available online: https://www.ibm.com/spss (accessed on 10 January 2025).
  47. Yegnanarayana, B.; Ramakrishna, B. Intelligibility of speech under nonexponential decay conditions. J. Acoust. Soc. Am. 1975, 58, 853–857. [Google Scholar] [CrossRef]
  48. GB/T 15508-1995; Acoustics-Speech Articulation Testing Method. Standard of PR China. CAS (Chinese Academy of Sciences); State Bureau of Technical Supervision: Beijing, China, 1995.
  49. Brachmański, S. Effect of additive interference on speech transmission. Arch. Acoust. 2002, 27, 95–108. [Google Scholar]
  50. Richie, C.; Kewley-Port, D.; Coughlin, M. Vowel perception by noise masked normal-hearing young adultsa). J. Acoust. Soc. Am. 2005, 118, 1101–1110. [Google Scholar] [CrossRef] [PubMed]
  51. Coughlin, M.; Kewley-Port, D.; Humes, L.E. The relation between identification and discrimination of vowels in young and elderly listeners. J. Acoust. Soc. Am. 1998, 104, 3597–3607. [Google Scholar] [CrossRef]
  52. Tang, S.K. Speech related acoustical parameters in classrooms and their relationships. Appl. Acoust. 2008, 69, 1318–1331. [Google Scholar] [CrossRef]
  53. Martellotta, F. The just noticeable difference of center time and clarity index in large reverberant spaces. J. Acoust. Soc. Am. 2010, 128, 654–663. [Google Scholar] [CrossRef]
  54. Ferguson, S.H.; Morgan, S.D. Acoustic and perceptual correlates of subjectively rated sentence clarity in clear and conversational speech. J. Acoust. Soc. Am. 2015, 138 (Suppl. 3), 1839. [Google Scholar] [CrossRef]
  55. Bradley, J.S. Predictors of speech intelligibility in rooms. J. Acoust. Soc. Am. 1986, 80, 837–845. [Google Scholar] [CrossRef]
  56. Morales, L.; Li, F.F. A new verification of the speech transmission index for the English language. Speech Commun. 2018, 105, 1–11. [Google Scholar] [CrossRef]
  57. Bradley, J.S. Speech intelligibility studies in classrooms. J. Acoust. Soc. Am. 1986, 80, 846–854. [Google Scholar] [CrossRef]
  58. ISO 9921:2003; Ergonomics—Assessment of Speech Communication. Edition 1; ISO: Geneva, Switzerland, 2003.
Figure 1. Interior view and measurement photos of the pier-style departure lounge at Haikou Meilan International Airport (HAK).
Buildings 15 00426 g001
Figure 2. Layout of the receiver positions and sound sources in the two departure lounges.
Buildings 15 00426 g002
Figure 3. Terminal acoustic parameter measurement instrument connection solution.
Buildings 15 00426 g003
Figure 4. Relation between speech intelligibility scores and the SNR of four listening positions in pier-style departure lounges.
Buildings 15 00426 g004
Figure 5. Relation between speech intelligibility scores and the SNR in pier-style departure lounges.
Buildings 15 00426 g005
Figure 6. The relationship between speech intelligibility scores of different SNRs and T30, EDT and D50 in pier-style departure lounges.
Buildings 15 00426 g006
Figure 7. Relation between speech intelligibility scores and STI in pier-style departure lounges.
Buildings 15 00426 g007
Figure 8. Relation between speech intelligibility scores and STI in pier-style departure lounges and other spaces [21,24,27].
Buildings 15 00426 g008
Figure 9. The relationship between SNR and both speech intelligibility scores and subjective evaluations of broadcast clarity.
Buildings 15 00426 g009
Figure 10. Regression curve of STI to speech intelligibility scores and optimal STI value for pier-style departure lounges.
Buildings 15 00426 g010
Table 1. Results of paired sample T-tests for all measured and simulated values at all receiver points in two piers.
Departure LoungeAcoustic ParametersAverage ValueStandard DeviationSig.
Pier AEDTMeasured3.79850.81860.747
Simulated3.83750.4402
T30Measured3.90540.26950.791
Simulated3.89050.1050
D50Measured0.19850.13370.618
Simulated0.20800.1258
Pier BEDTMeasured3.65470.81280.175
Simulated3.82440.5377
T30Measured3.66310.33690.659
Simulated3.63380.1301
D50Measured0.26130.18630.261
Simulated0.23190.1317
Table 2. The acoustic characteristics and STI of the four listening positions under different SNRs.
No.Listening PositionsEDT (500–1000 Hz)T30 (500–1000 Hz)D50 (500–4000 Hz)SNRSTI
1A1.791.780.49−50.19
200.3
350.38
4100.44
5150.46
6without noise0.47
7B1.952.320.86−50.25
800.37
950.49
10100.57
11150.61
12without noise0.63
13C2.412.0250.69−50.23
1400.34
1550.47
16100.53
17150.56
18without noise0.58
19D3.702.9150.45−50.13
2000.25
2150.33
22100.35
23150.38
24without noise0.39
Table 3. Different predictive equations for speech intelligibility scores considering SNR and room acoustic characteristic parameters.
Formula NumberAcoustic Parameter IndicatorsExpressionDetermination Coefficient R2
(1)SNR S I = 42.196 + 2.731 × S N R 0.054 × S N R 2 0.849
(2)SNR, EDT S I = 61.165 + 2.731 × S N R 0.054 × S N R 2 7.719 × E D T 0.950
(3)SNR, T30 S I = 63.727 + 2.731 × S N R 0.054 × S N R 2 9.538 × T 30 0.897
(4)SNR, D50 S I = 20.25 + 2.731 × S N R 0.054 × S N R 2 + 35.54 × D 50 0.957
Disclaimer/Publisher’s Note: The statements, opinions and data contained in all publications are solely those of the individual author(s) and contributor(s) and not of MDPI and/or the editor(s). MDPI and/or the editor(s) disclaim responsibility for any injury to people or property resulting from any ideas, methods, instructions or products referred to in the content.

