Article

Prediction of Strength Properties of Reinforced and Stabilized Sandy Soil as a Building Foundation Material

by
Mohammad Mostafa Jafari
1,
Mohammad Hossein Bagheripour
1 and
Ehsan Yaghoubi
2,*
1
Department of Civil Engineering, Shahid Bahonar University of Kerman, Kerman 7616913439, Iran
2
College of Sport, Health and Engineering, Victoria University, Melbourne 3011, Australia
*
Author to whom correspondence should be addressed.
Buildings 2025, 15(3), 382; https://doi.org/10.3390/buildings15030382
Submission received: 2 December 2024 / Revised: 15 January 2025 / Accepted: 23 January 2025 / Published: 26 January 2025
(This article belongs to the Special Issue The Durability of Innovative Construction Materials and Structures)

Abstract

:
Sandy soils are a type of geomaterial that may require improvements due to lack of cohesion. In this study, first, the lack of cohesion of sand was resolved using clay, and the soil was stabilized with cement and lime (4% and 3% of the dry weight of materials, respectively) and finally reinforced with recycled tire fibers of 20 to 30 mm in length for improved strength and ductility. Next, 747 samples with different fiber contents at different curing temperatures and ages were prepared and a unconfined compressive strength (UCS) test was carried out. Next, a novel approach employing multivariate nonlinear regression techniques and obtained empirical data was applied to formulate a mathematical model for predicting the UCS and the modulus of elasticity (Es) of the reinforced and stabilized soil. This model can serve as a valuable tool for building engineers in designing building foundations. The comparison of the obtained UCS and Es results and those predicted using the proposed model showed a correlation of >95% (R2 ≥ 0.95). The fibers effectively increased the failure strain, thus resulting in the greater ductility of the samples. As an example, in 14-day samples cured at 60 °C with 0%, 0.4%, 1%, 1.7%, and 2.5% fibers, the failure strain showed an incremental trend of 1.47%, 1.87%, 2.08%, 2.20%, and 2.92%, respectively. Scanning electron microscopy (SEM) was used to study the microstructure of the samples and to explain the strength experimental outcomes. SEM images showed a desirable interaction between the fiber surfaces with the soil mass and the reduction in porosity and the occurrence of pozzolanic reactions through stabilization. The results also showed that the reinforcement effectively improved the ductility, as desired for building foundations; however, it resulted in reduced strength, although a greater strength compared to the untreated soil was achieved. Although soil stabilization has been widely studied, limited research focuses on stabilizing soil with clay, lime, cement, and recycled tire fibers. This study offers design engineers an estimation scheme of the strength properties of stabilized and reinforced foundations.

1. Introduction

Geotechnical engineers generally deal with natural soils or rocks, which are inherently inhomogeneous, layered, anisotropic, and display complex behavior. Today, due to the increasing population and the lack of suitable and sufficient land for construction, human societies are forced to improve and stabilize the often problematic soil on site instead of changing the project location. There are different methods for improving weak and problematic soils. Traditionally, cement and lime have been used to improve soil behavior and increase its load-bearing capacity [1,2]. Lime, a material that has been used for a long time to stabilize fine-grained soils, has an unfavorable performance in dealing with the rise of underground water [3]. To fix this problem, cement has been used along with lime to stabilize the soil [4]. When the soil is mixed with stabilizers such as cement and lime, its strength increases in different humidity conditions; however, its ductility decreases [5]. One of the methods that exists to improve the ductile behavior of the stabilized soil is the use of fibers or geogrids [1].
Baadiga and Balunaini conducted large-scale experiments to investigate the benefits of using geosynthetics in reinforced pavements [6]. They used biaxial and triaxial geogrids to improve the soft subgrade soil. They calculated the modulus improvement factor (MIF) and layer coefficient ratio (LCR) as a measure to reduce costs in the project. The results showed that the use of geogrid as a subgrade stabilizer has been able to effectively increase the CBR. They also concluded that the stabilized pavement system performs better when the geogrid’s tensile strength is higher.
Several studies have been conducted on reusing waste materials to enhance soil properties and make its behavior more ductile [7,8,9]. Some studies have utilized toxic and hazardous materials in construction applications [10,11]. Soil stabilization with recycled car tire fibers reduces the amount of waste that must be disposed of in landfills and is known to improve the engineering parameters of the stabilized soil. Both developed and developing nations have significant tire waste that includes scrap tires. An ever-increasing volume of waste tires has led to serious challenges in waste disposal and management [12]. Because waste tires are not environmentally degradable, they can remain in the environment for years without severe decomposition. Due to the geometric shape of waste tires, they occupy a significant amount of space in the environment. Because of their dark color, in the hot seasons of the year, they may spontaneously combust and produce toxic fumes, which can pollute the environment up to a radius of 10–15 km through the wind [13]. Tire landfills in Victoria, Australia, have been moved away from residential areas due to the grave health risks associated with burning tires and their toxic fumes [13]. Additionally, tire burning, which causes similar air pollution, has been banned in many developed countries following the Paris Agreement. To address these issues, waste tire recycling and related technologies have been explored, with significant resources allocated by organizations such as the U.S. Tire Manufacturers Association (USTMA) and the European Tire Recycling Association (ETRA) [14]. Waste tire products, such as tire chips [15], tire shreds [16], tire-derived aggregates [17], and waste/scrap tire rubber fibers [18], have been used for soil reinforcement as a potential sustainable solution. Narani et al. mixed sandy soil with different percentages of recycled tire fibers (i.e., 0%, 0.5%, 1%, 2%, 3%, and 4%) and conducted repeated load triaxial tests on them. They studied various parameters of the reinforced soil, such as permanent strain, resilient modulus, dissipated energy, and damping ratio. The findings demonstrated that the addition of fiber results in an increase in permanent strain and with an optimum fiber content of 2%, the resilient modulus could be raised to 744%. Furthermore, the results showed that the inclusion of fiber could also lead to an increase in dissipated energy and the damping ratio [7].
In addition to the conventional stabilization methods of using lime and cement, researchers have tried using green alternative reinforcement or stabilizing materials to improve the strength properties of soils [19,20,21,22,23]. These studies often propose mathematical expressions to predict strength properties such as UCS using various physical or mechanical parameters, such as the modulus of elasticity or the percentage of the additives and fibers used. Another approach has been to use common and available tests such as UCS and to utilize the results to predict more complicated properties and characteristics. Xiao et al. used glass powder and class F fly ash as additives to improve soil behavior [24]. The mechanical behaviors prior to and following geopolymer stabilization were assessed in their study; this involved substituting recycled waste glass aggregate for virgin aggregate (VA) in varied replacement ratios as the pavement base materials. The findings demonstrated that although the mechanical properties were compromised, the use of glass aggregate decreased the drying shrinkage of base samples. They also concluded that during the sample preparation, a higher curing temperature and relative humidity resulted in better mechanical behaviors, and the surface of glass aggregate could dissolve in alkaline solution and was involved in the geopolymerization at 40 °C. Finally, they stated that their study confirmed the potential of using waste glass-based pavement base materials as green substitutes and the potential synergy between waste glass recycling and the pavement industry.
Abed Hamid et al. examined the effects of adding granulated blast-furnace slag (GGBS) on the durability and mechanical characteristics of stabilized clayey soil [25]. They made geopolymer in two ways: mechanochemically activated geopolymer (MAG) and conventionally activated geopolymer (CAG). They investigated how the amount of GGBS affects the long-term durability properties of geopolymer-stabilized soil by immersing samples into a 1% magnesium sulfate solution. The findings demonstrated that the soil stabilized via mechanochemically activated geopolymers was more resistant to sulfate erosion than the soil stabilized through conventionally activated geopolymer. Jahandari et al. mixed lean clay with 3, 5, and 8% lime and prepared 7- and 28-day-cured UCS samples. Half of their samples were reinforced with geogrids and the other half had no reinforcement. Using the UCS test results, they estimated the secant modulus, the failure strain, the deformability index, the brittleness index, the bulk modulus, the shear modulus, and the resilient modulus for the manufactured samples. The results showed that the geotechnical properties of clay improved with the addition of lime and geogrids. Also, based on the test data, a mathematical model was developed to predict the properties of the improved soil [3]. Cong et al. mixed low plasticity clay (CL) with cement and supplementary binders such as sodium silicate and a one-to-one mixture of sodium hydroxide and calcium chloride. They created samples with different percentages of cement and the aforementioned adhesives [26]. The samples prepared using different curing times and temperatures were subjected to the UCS test. The stress–strain behavior, strength, modulus of elasticity, and failure strain of the samples were investigated. Finally, they introduced a mathematical model that accurately estimated the mechanical parameters of stabilized soil using the experimentally obtained data as above. The difference between the experimentally achieved data and the predicted data was about 10% [26]. Cong et al. also revealed that the failure strain value of stabilized samples had no significant relationship with the ratio of water to cement in the samples [26]. However, it should be noted that the predictive models do not always yield accurate estimations. For instance, Yonekura and Kaga presented a linear model to predict the failure strain for geopolymer stabilized soil which estimated the failure strains of samples but did not exhibit a high level of accuracy (the coefficient of determination, R2 < 0.8) [27]. Table 1 provides a summary of recent studies that have used different additives and fibers for soil reinforcement. The classification of the utilized soil in the Unified Soil Classification System (USCS) is presented in Table 1.
Several studies have utilized the power function to develop models that generated promising estimations. Horpibulsuk et al. mixed Bangkok clay with percentages of fly ash and biomass ash as binders and carried out UCS tests. In their study, they used the power function to develop models in which the clay water content to cement ratio was used as an independent variable to predict the UCS of the samples [28]. Saberian et al. mixed the peat soil of Chaghakhor, an area in western Iran, with 0 to 20% of 20 × 15 × 0.5 mm shredded tire chips, and carried out UCS tests. Using the results, they determined several parameters including the modulus of elasticity, the shear modulus, the resilient modulus, the brittleness index, and the ductility index. Using these parameters, they proposed mathematical models that included the quadratic polynomial function to estimate each of the above-mentioned parameters [15]. Jahandari et al. mixed CL with different percentages (0, 1, 3, 5, 8, and 10%) of lime, created samples with and without geogrids, and cured them for 365 days at a temperature of 17 °C and a relative humidity of 30% [29]. Next, samples were investigated using the UCS test, and several parameters were obtained. The authors used a series of power functions for the soil stabilized with lime and reinforced with four layers of geogrids and another series of power functions for soil stabilized with lime to estimate the UCS, the secant modulus, and the deformability index with respect to lime content as an independent variable of stabilized and reinforced soil [29].
Table 1. A summary of recent investigations on soil reinforcement using different fibers and additives.
Soil Classification (USCS)ObjectiveFiber TypeChemical AdditiveTesting ProgramResultsRef.
SC-SM
(Clayey Sand–Silty Sand)
Improved long-term dynamic behavior of a sandy subgrade reinforced by waste tire textile fibers.Recycled tire fiber-Compaction and
repeated load triaxial (RLT) test.
  • Increase in permanent strain due to increase in the fiber content.
  • Based on the shakedown theory, rutting was not anticipated because all soil–fiber mixtures were placed into groups A (plastic shakedown) and B (plastic creep).
  • With the optimal fiber content of 2%, the elastic modulus increased by 744%.
[7]
CLClay reinforcement using recycled tire fibers and glass fibers.Recycled tire fiber and glass fiber-Compaction, UCS, and direct shear test.
  • The addition of fibers caused the ductile behavior of the reinforced samples.
  • The optimal percentage of recycled tire and glass fibers, which yielded the highest UCS of the samples, were 0.5% and 1%, respectively.
[14]
CLImproved mechanical properties of fiber-reinforced and geopolymer-stabilized clay soil.Basalt fiberMetakaolin, quicklime, sodium silicateUCS, direct shear, and indirect tensile test. Diffraction analysis, and microstructural
analysis.
  • The UCS of alkali-activated binders first increased and then decreased with the contents of metakaolin and the activator.
  • The optimum content and length of basalt fiber in geopolymer-stabilized clay soil were 0.4% and 12 mm, respectively.
[30]
CLImproved mechanical and microstructural properties of waste tire improved cemented clay.Tire rubber fiberCementUCS, SEM, and ultrasonic pulse velocity test.
  • A 2.5% tire rubber fiber content was proposed as the optimum dosage to improve the cemented soils’ mechanical properties.
[31]
It is important to note that both lime and cement are prone to CO2 emissions. But it is necessary to pay attention to this point as due to many issues, including the lack of specific standards in the field in regard to geopolymeric materials and green cements, cement and lime (especially cement) are still used as available materials for soil stabilization purposes in many developing countries and even developed countries. For this reason, in the present study, cement and lime were used to stabilize the soil. Also, while there are several studies on soil stabilization and/or reinforcement, our review of the literature did not reveal any studies that developed a mathematical model to estimate the strength properties of sandy soil stabilized with clay, lime, and cement and reinforced with recycled tire fibers (RTFs). The primary objective of this study is to develop mathematical relationships capable of predicting the strength parameters of stabilized sandy soil under varying temperatures and curing durations. This allows design engineers to use more realistic strength parameters when designing stabilized and reinforced sandy soils. In essence, the motivation behind this research is to assist engineers working in soil stabilization by providing reliable predictions of strength parameters prior to project construction. In order to predict strength characteristics, including the UCS and the modulus of elasticity of sandy soil reinforced with clay, lime, cement, and recycled tire fibers at various curing ages, temperatures, and fiber contents, the current study set out to create a mathematical model using two approaches, namely physical and chemical. Physical strengthening included the use of RTFs and clay in the structure of the sandy soil. Fibers reinforced and increased the ductility of the soil [32], and clay also filled the voids in the soil structure, leading to greater strength against the incoming loads. The utilization of fibers obtained through the recycling of used car tires in the mixture is useful for reducing environmental impacts by limiting the need for disposing of such waste in landfills. The chemical approach includes using lime and cement for stabilization, which through chemical reactions causes bonding between soil particles and increases the strength of stabilized soil. As mentioned previously, lime exhibits poor performance in regard to ground-water level increments. However, a combination of cement and lime was utilized to enhance soil behavior and increase its load-bearing capacity. The advantage of using cement in addition to lime is that the increased degree of saturation in cement-stabilized soil does not result in a rapid and significant decrease in the strength of soil [4]. An increase in the saturation of the soil can occur as a result of a rise in the water level table, precipitation, and flooding.

2. Scope and Limitations

2.1. Scope

The main objective of the present study was to present a mathematical model to predict the strength characteristics of stabilized and reinforced soil, including the UCS and the modulus of elasticity (Es) at different curing ages, temperatures, and fiber contents. Thus, the UCS samples of the sandy soil with lime, cement, and clay that were reinforced with varying proportions of fibers at varying ages and curing temperatures were prepared, examined, and tested in the current study.

2.2. Limitations

The present study, being an applied research study, faces limitations due to two important factors, namely time and economy. Based on these factors, the limitations of the present study fall into two general categories: (a) limitations due to the types of laboratory tests and (b) limitations due to curing times and ages, as well as the percentages of cement, lime, and fiber. These are further described below.
The unconfined compressive strength test was used to determine the UCS and the modulus of elasticity of the samples. Also, as shown in Section 3.2, the percentages of stabilizers such as cement and lime were considered to be 4% and 3% of the weight of dry materials, respectively. The amount of clay was 23% of the weight of dry soil, and the amount of water was 24% of the total weight of dry materials. The ranges of fiber content, curing temperature, and curing age are indicated in Section 3.3. To develop mathematical relationships capable of predicting the strength parameters of stabilized sandy soil under varying conditions, this study selected a broad range of curing ages (3 to 90 days), curing temperatures (30 to 60 °C), and fiber content (0.4% to 2.5%) to encompass a wide spectrum of potential scenarios. The target soil type for stabilization was sand, while clay was used to fill the voids. The grading curves of soils are shown in Figure 1, and their properties are reported in Table 2. The samples were made in the form of cylinders with a diameter of 60 mm and a height of 120 mm. It is obvious that if the dimensions of the laboratory samples change, the scale effect may need to be considered. It should be noted that the mathematical model introduced in the present study also has limitations. For example, other parameters such as the moisture content or degree of saturation of samples during the test can affect the coefficients in the model. It is also clear that the mathematical model is applicable to the age and curing temperature ranges, as well as the fiber contents and the mix design used in the current study.

3. Materials and Methods

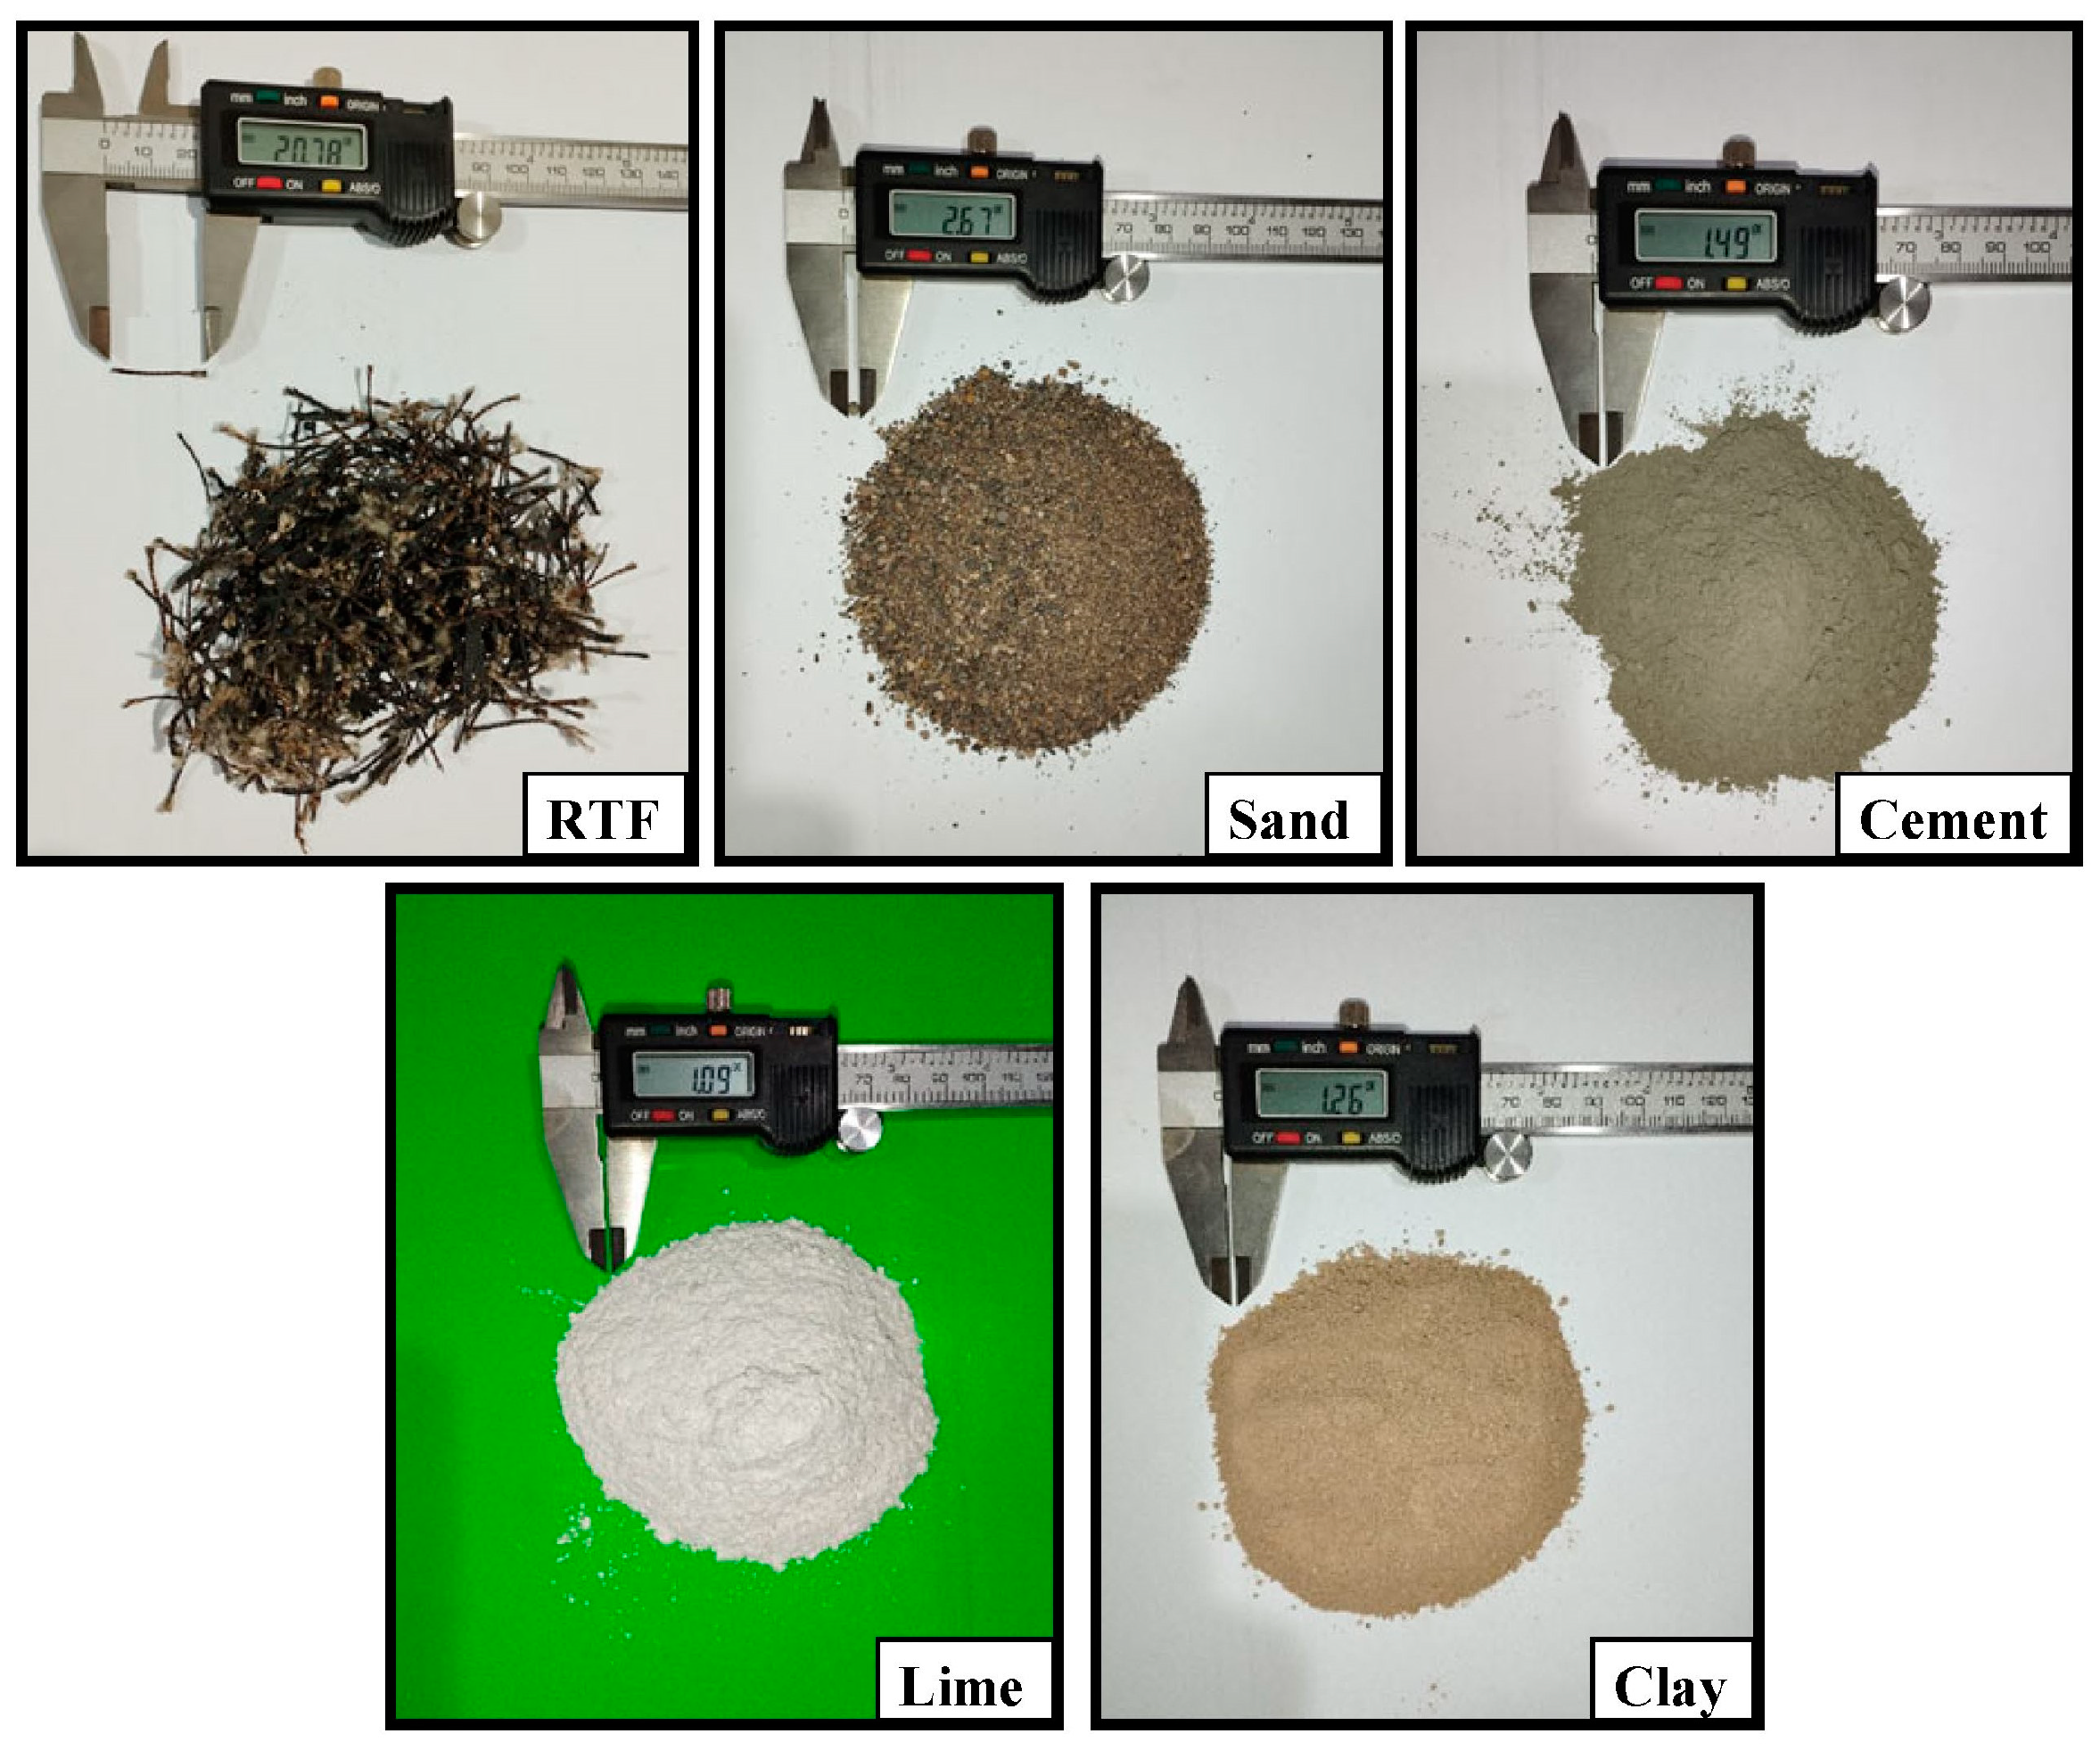
3.1. Natural Soils and Stabilizers

The natural soil of interest in this study was a type of sand. Based on the results presented in Table 2, the soil is classified as silty sand (SM) according to the Unified Soil Classification System (USCS). Sandy soils are typically considered weak soils due to the absence of cohesive grains, and if used in construction projects, they require stabilization. In the current research, in order to improve the structure and strength of the soil, as well as to reduce the number of voids and create better reactions with lime, a percentage of clay (CL) was added to the sandy soil. The particle size distribution curves of sandy soil (coarse-grained) and clay (fine-grained) are shown in Figure 1, and their corresponding physical characteristics are presented in Table 2, as well as the specific gravity (Gs) and standard Proctor’s compaction test results (maximum dry density, γdmax, and optimum moisture content, ωopt).
In the present study, hydrated lime (Type A), with a purity of over 70% and which conformed to the requirements of ASTM C977-18 [39], and Type 1 Ordinary Portland Cement (OPC) were commercially supplied. In order to determine the amount of oxides in the raw materials, an X-ray fluorescence (XRF) test was carried out. The chemical compositions of clay, sand, cement, and lime are presented in Table 3.

3.2. Recycled Tire Fibers

The recycled tire fibers (RTFs) used in this study were obtained from a recycling center in Yazd Tire Industries, Iran. Unlike granular particles, when measuring and reporting the dimensions of fibers, accuracy as well as measuring the complete geometry of the fiber is known to be important. The length and thickness must be measured with a precise instrument such as a digital caliper. For a better demonstration to provide a sense of scale of the dimension differences between fibers and other materials, in Figure 2, a digital caliper was placed next to each material. The color of these fibers was dark brown to black, and they had an average length and diameter of 20 and 0.75 mm, respectively (Figure 2). In every experimental work, materials and methods must be tested according to a standard in a reproducible manner, and the standard should be cited so that interested readers can reconstruct and test the samples and compare the data. In this study, previous research in the field was reviewed [7,32,40,41], and relevant standards for fiber testing were identified and followed. Tests, such as tensile strength, elongation, modulus of elasticity, and fiber dimension tests, were conducted in the Mechanical Engineering Department of the Shahid Bahonar University of Kerman, Iran, where the experimental work was performed. The tensile test, according to the ASTM D885-02 [42], was performed on a select number of fibers and exhibited an estimated modulus of elasticity and a tensile strength of 4.6 GPa and 520 MPa, respectively. The properties of the RTFs varied slightly between individual fibers. To address this, the characteristics listed in Table 4 were determined by testing a large number of fibers, and the variation range was measured. For each characteristic, the value that appeared most frequently, i.e., the most commonly occurring result, is shown in the column labeled “The Most Frequent” in Table 4. The other properties of the RTFs were supplied by the technical unit of Yazd Tire Industries (the manufacturer) and are presented in Table 4.

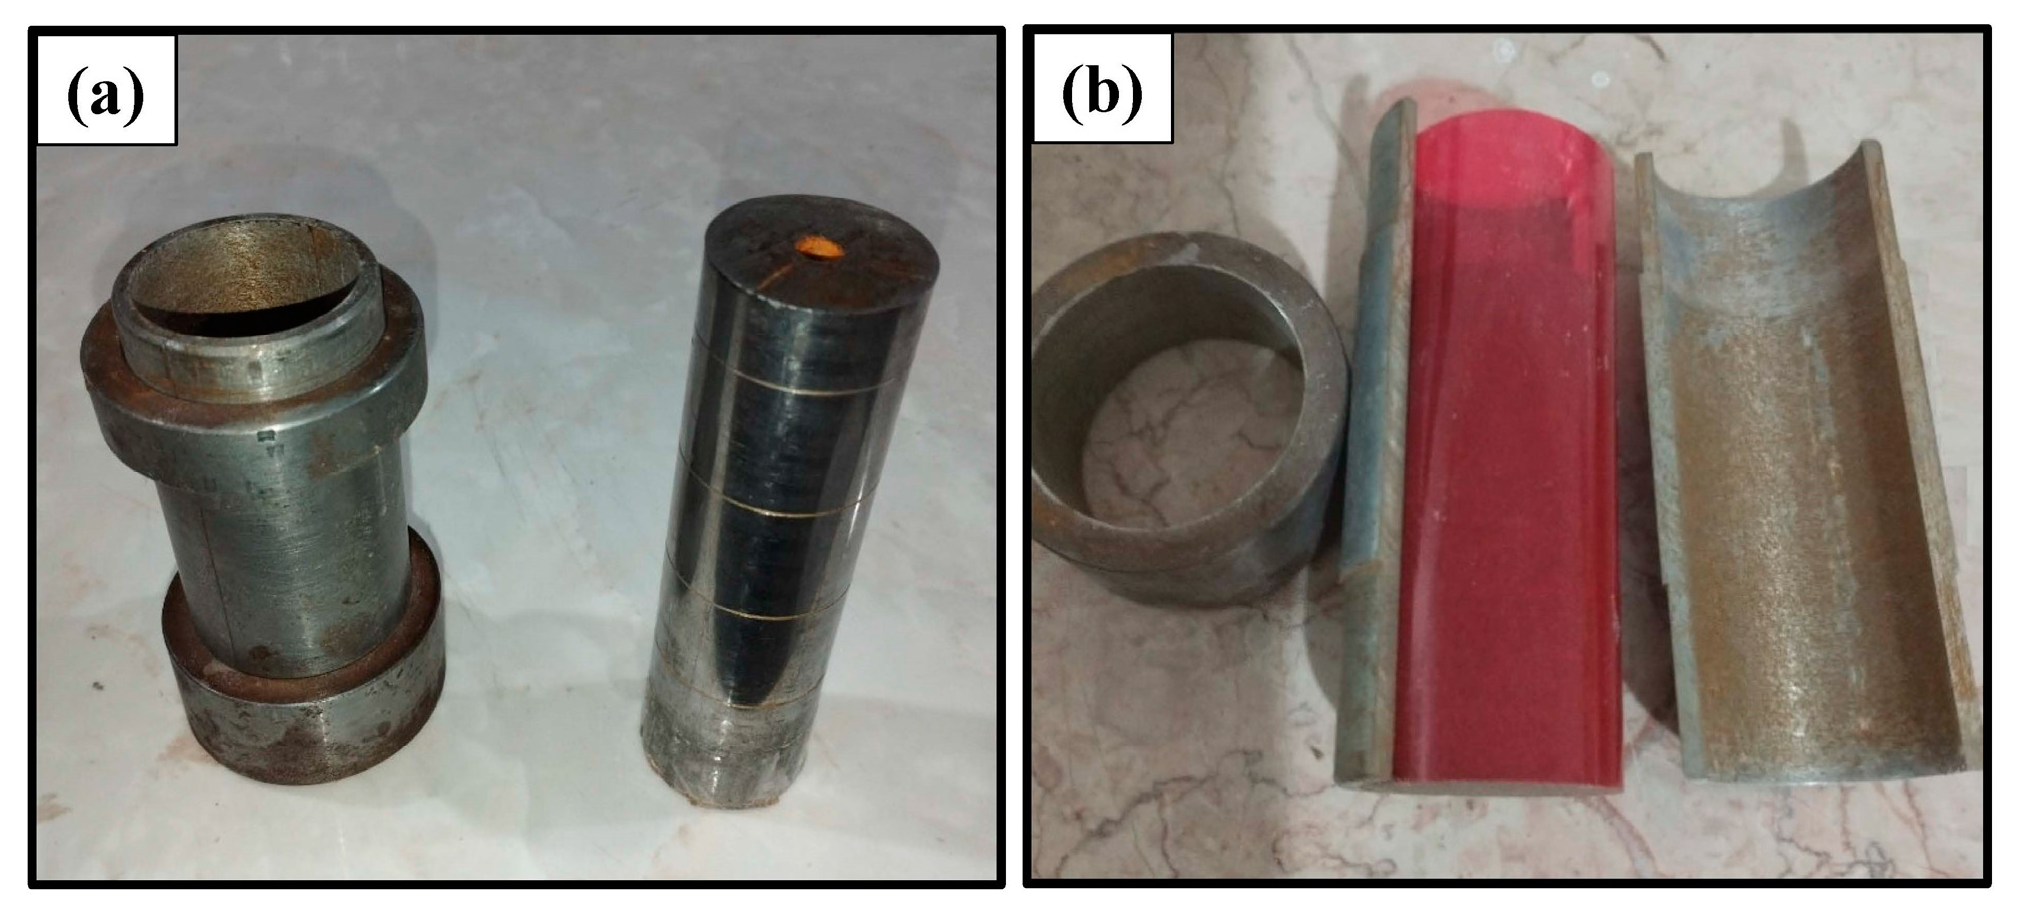
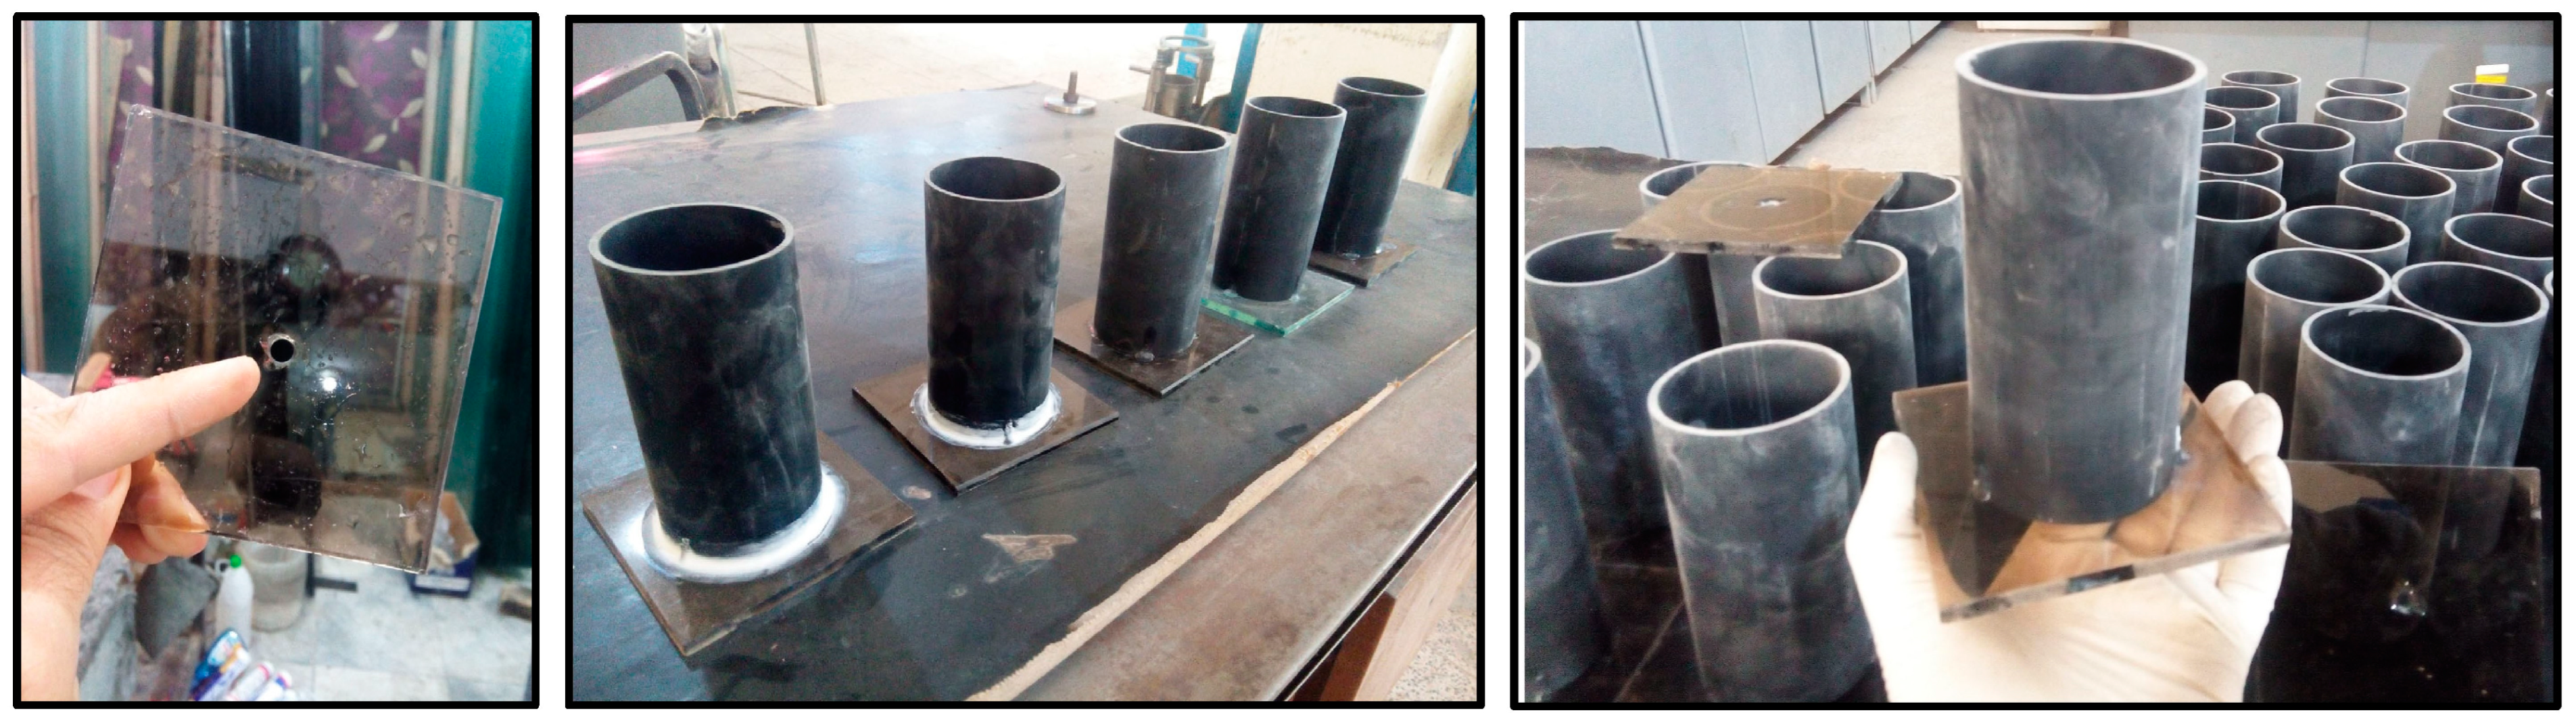
3.3. Mixtures, Sample Preparation, and UCS Testing

The UCS test was carried out to determine the mechanical properties of the stabilized/reinforced soil. To prepare the UCS specimens, first, the soil was air-dried for 3 days. Next, the lumps of soil were crushed using a rubber hammer and were passed through a 4.75 mm sieve. The main goal of this research was to develop a mathematical model to estimate the UCS and Es of stabilized and reinforced sandy soil. For this, an optimum mix design was adopted from previous studies [4,43]. Accordingly, all samples were prepared using 23% clay (of the dry weight of the sand), 3% lime (of the dry weight of the mixture of clay and sand), 4% cement (of the dry weight of the mixture of clay and sand), and 24% moisture (of the dry weight of the whole mixture). Also, in order for the mathematical model to be capable of predicting the strength parameters of the soil reinforced with various amounts of fibers, a range of fiber contents (0%, 0.4%, 1%, 1.7%, and 2.5%) were examined [44]. The untreated samples were compacted in three 25 mm thick layers using a split mold (Figure 3) in order to reach the maximum dry density with the optimum moisture content, as shown in Table 2. Images of the mold and rubber film are shown in Figure 3. The rubber film was used to prevent the adhesion between the sample and the mold wall and thus to easily retrieve the sample after compaction. After retrieving the sample, the rubber film was left wrapped around the sample as it dried in an oven. Although the UCS test is generally not suitable for cohesionless sands, the sand used in this study displayed cohesive characteristics due to the presence of small percentages of silt and clay. Furthermore, the UCS test was performed on the untreated soil to serve as a strength and behavior benchmark for the treated samples.
Morin and Fricarazzo (2006) suggested that due to the inhomogeneity and uniformity of soil and rock samples, to determine their UCS, several samples should be tested and the average strength should be considered as the UCS [45]. Therefore, in the present study, in order to develop a model with reliable accuracy at different temperatures, curing ages, and fiber contents, three replicates with heights of 120 mm and height to diameter ratios of 2 were created for each mix group. Furthermore, the water content utilized in the mixing process of the mortar was selected as it facilitated the easy placement of the samples into the molds [4]. Consequently, the samples were labeled Cement Concrete (CC), Lime Concrete (LC), and Lime–Cement Concrete (LCC). The mixtures proposed and prepared in this study are described in Table 5.
To prepare test specimens, dry materials, including the sand, clay, cement, lime, and fibers, were completely mixed to create a uniform mixture. Next, a predetermined water content (24%) was added to the mixture. Because of the high slump level of the mortar, the fibers did not adhere to each other during the sample preparation and mixing, leading to a uniform distribution. In lime concrete projects, the amount of lime per cubic meter of mortar volume usually varies from 150 to 200 kg [43]. Accordingly, in the mix design of the current project, the total weight of cement and lime, as shown in Table 5, was considered to be 170 kg per cubic meter, equal to 7% of the weight of the dry soil mixture [4]. The materials were thoroughly mixed in the laboratory mixer for 3 min to achieve a homogeneous mix. Next, the samples, in the form of mortar, were placed in cylindrical molds made of Polyvinylchloride (PVC) pipes of 60 mm in diameter and 120 mm in height in three layers. During the construction of all samples, after pouring each layer into the mold, the mortar was rodded to release any potential trapped air. After the mold was filled, the head of the sample was flattened using a plate with smooth edges. Next, the samples were kept for three days at an ambient temperature of 20 °C to reach their initial strength. This was practiced by several other researchers (e.g., ref. [46]) who also kept reinforced soil samples at 20 °C for a certain period of time after construction for initial setting. The unit weight of the samples after demolding was about 16.3 kN/m3. To demold the samples without the induced suction causing damage, an opening was created at the bottom of the glass base, as demonstrated in Figure 4. To prevent the mortar sample from spilling out of the opening, a piece of waterproof paper was used. Next, the samples were taken out of the molds and placed inside airtight plastic membranes. The samples were then kept in an oven at temperatures of 30, 35, 40, 45, 50, 55, and 60 °C until they reached the desired age, as shown in Table 5. After curing to the desired age, samples were removed from the oven and after removing the plastic membrane, the samples were subjected to UCS tests immediately after they were weighed and their geometric dimensions were measured. Many researchers have followed a similar process to fabricate specimens for UCS testing (e.g., refs. [29,47,48]).

3.4. Determination of Strength Properties

A uniaxial testing machine with a ring capacity of 20 kN and a loading speed of 1 mm/min was used to test the uniaxial compressive strength of the samples. In this study, the peak of the stress–strain diagram was identified as the UCS, and stress–strain diagram’s slope in the linear region resulting from the uniaxial compressive strength test was used to determine the modulus of the elasticity of materials [49].

3.5. Scanning Electron Microscopy (SEM)

In order to study the microstructure of the stabilized and reinforced specimens, the SEM imaging was performed on selected specimens including stabilized and reinforced samples as well as the control soil specimen using a MIRA3, LMH/LMU equipment (TESCAN, Brno-Kohoutovice, Czech Republic). Small pieces of specimens for SEM imaging were provided from fractured parts of the failed samples after UCS tests. The samples were dried, mounted on the aluminum tape and then coated with gold. Next, SEM analysis was performed in the backscattered electron (BSE) mode at an accelerated voltage of 25 kV using the FE-SEM method.

4. Results and Discussion

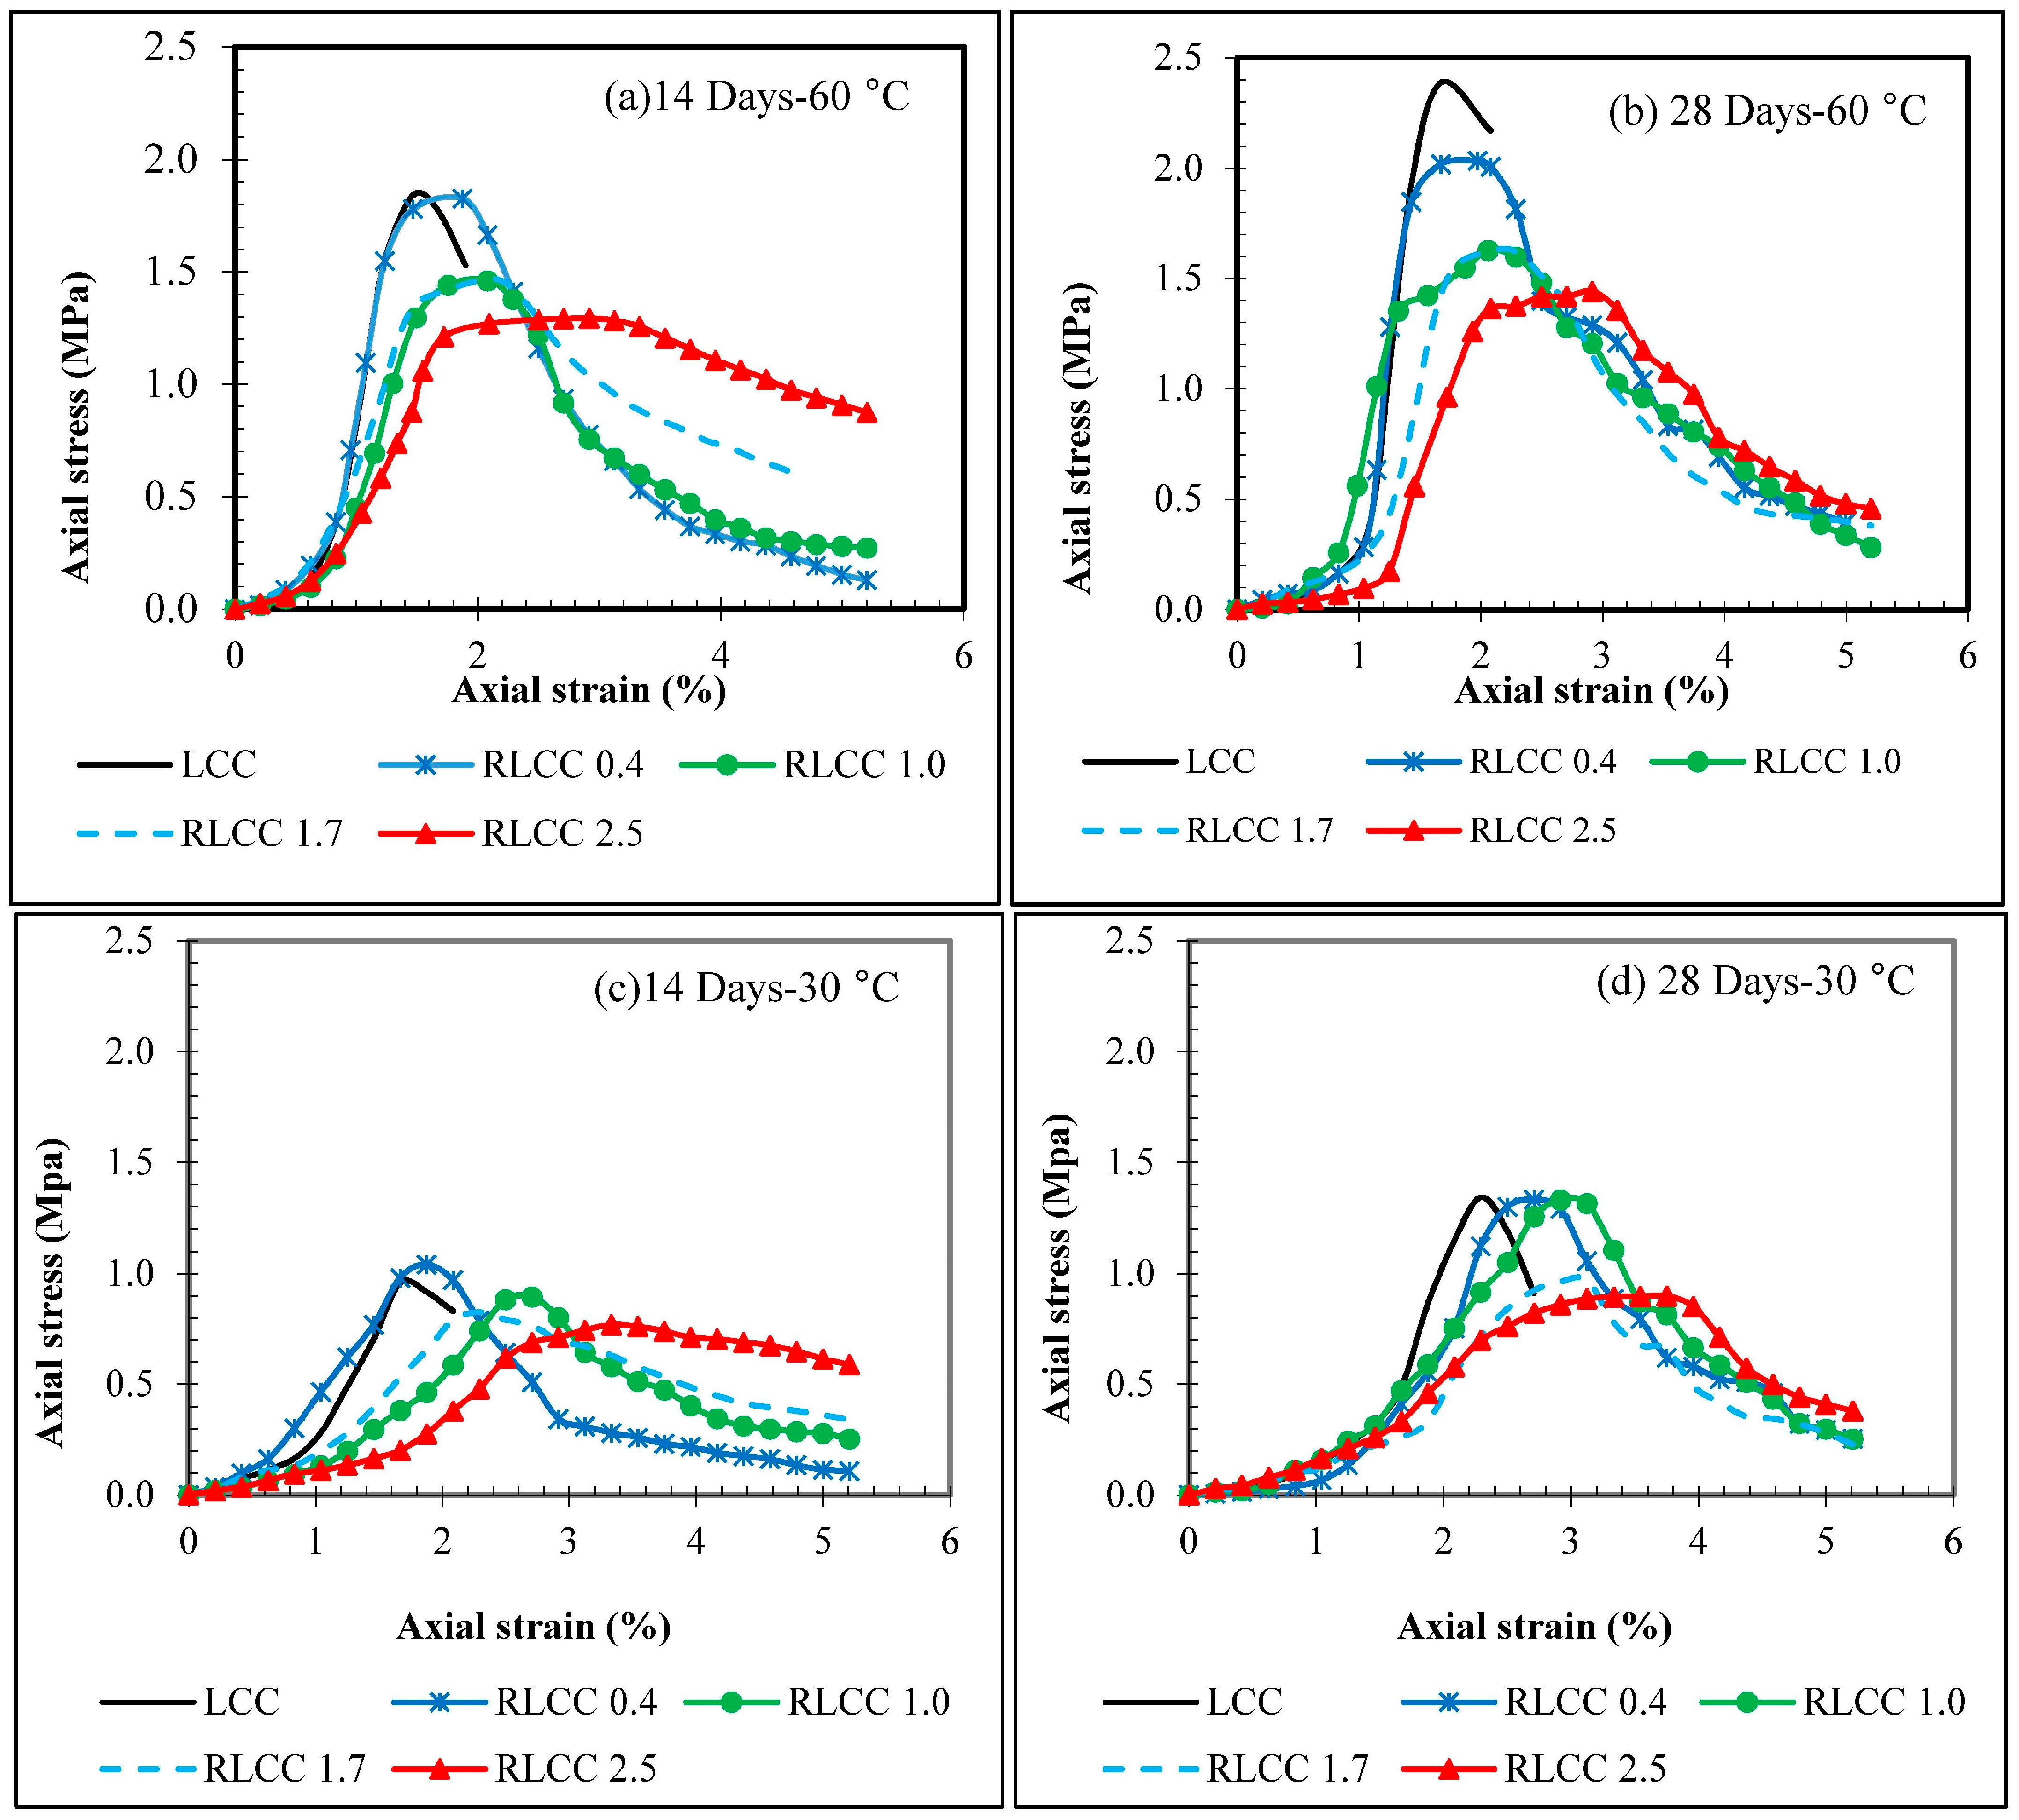
4.1. Uniaxial Compressive Strength

The samples shown in Table 5, marked as Groups 1, 2, 3, and 4, were prepared for UCS testing as control samples. The stress–strain diagrams of these specimens are demonstrated in Figure 5, in which the UCS of the untreated sandy soil is 0.23 MPa. Also, in the LC, CC, or LCC samples, it can be seen the stress–strain diagram moved from its initial point to reach its maximum point, namely the UCS, after which the sample suddenly broke. This behavior indicates the brittleness of the samples.
The stress–strain diagram can generally be divided into four regions, as illustrated in one of the curves in Figure 5 as an example.
  • Initial Compression Region (AB): This region represents the initial compression of the stress–strain curve, where uneven surfaces in contact with the loading jaw are leveled and voids are compressed. In this region, the strain increases rapidly but the stress grows at a slower rate.
  • Linear Region (BC): In this region, the stress–strain curve exhibits a linear increase, indicating the stable development of cracks in the sample. Compared to the AB region, the strain increases at a slower rate, and the stress–strain curve has a steeper slope. As shown in Figure 5, increasing the cement content in the mix leads to a steeper slope in this region.
  • Nonlinear Region (CD): This region corresponds to the accelerated expansion of cracks, where the stress–strain curve becomes nonlinear. Strain increases at a faster rate compared to the BC region. The stress reaches its maximum value at the end of this region, referred to as the unconfined compressive strength (UCS), and the corresponding strain is called the failure strain.
  • Failure Region (DE): Beyond the failure strain, the stress–strain curve descends as the strain increases, indicating a reduction in the sample’s load-bearing capacity.
These regions collectively illustrate the behavior and mechanical performance of the specimen under loading conditions.
The plot of Figure 5 demonstrates that by adding lime to the soil, the UCS of the sandy soil (SM) increases by 1.6 times. With the addition of cement, the UCS increased to 3.7 times that of untreated SM. Figure 5 also shows that if lime and cement are used simultaneously, the UCS of the specimen is 4.2 times that of untreated soil and is thus greater than when cement or lime are used individually.
Figure 6 illustrates the stress–strain diagrams of a selection of tested specimens, in which the number after RLCC refers to the fiber content. Due to the large number of stress–strain diagrams and for brevity, only the lowest and highest curing temperatures of the specimens are provided in Figure 6. The results in Figure 6 show that the UCSs of the 14-and 28-day LCC samples cured at 30 °C are 0.96 and 1.34 MPa, respectively. When the curing temperature reached 60 °C, the UCS of 14- and 28-day LCC samples reached 1.84 and 2.39 MPa, respectively. In other words, the UCSs of 14- and 28-day LCC samples cured at 30 °C were 4.2 and 5.8 times that of the untreated soil, respectively. Also, the UCSs of 14- and 28-day LCC samples cured at 60 °C were 8 and 10.4 times that of the untreated soil, respectively. This increase in the UCS of samples showed the significant effect of stabilization, curing age, and temperature on their strengths. In simpler terms, pozzolanic reactions occurred more quickly as the curing temperature increased, and as the curing age extended, the production of bonding materials from these reactions also increased. Furthermore, the UCS of 28-day LCC samples at curing temperatures of 60 °C and 30 °C were 30% and 40% higher than similar 14-day samples, respectively. Based on Figure 6 the UCS of mixtures generally increased with age and curing temperature, and as the amount of fibers in the samples increased, the UCS of the samples decreased and failure occurred at higher strains, which caused an increase in the ductility of the samples. The increases in age and curing temperature resulted in more effective pozzolanic chemical reactions and thus a stronger bond between soil particles [2]. According to Figure 6, it can be seen that with the increase in the amount of fibers in the samples, the loss after failure in stress–strain diagram is reduced, and this indicates the change in behavior from the strain softening to the strain hardening. Various parameters obtained from UCS tests for 14- and 28-day cured samples, with different fiber contents and different curing temperatures, are shown in Table 6. As indicated in Table 6, while there was a minor improvement in the UCS of some of the samples with the addition of more fibers, the overall trend suggests that increasing the fiber content led to a decrease in UCS across the samples. With the increase in fiber content, there was a greater separation between soil particles. Consequently, the presence of fibers connects these particles, albeit with weaker frictional bonds compared to cementation. As the amount of fibers increases, the soil particles are pushed further apart, reducing the friction and connection between the grains, which in turn lowers the force transferred between them. This phenomenon contributes to a decrease in strength as fiber content increases. However, on a positive note, the interaction of soil particles with the fiber walls led to failures occurring at higher strains, thereby improving ductility. This trend is consistent with the results of recent studies [14,50].

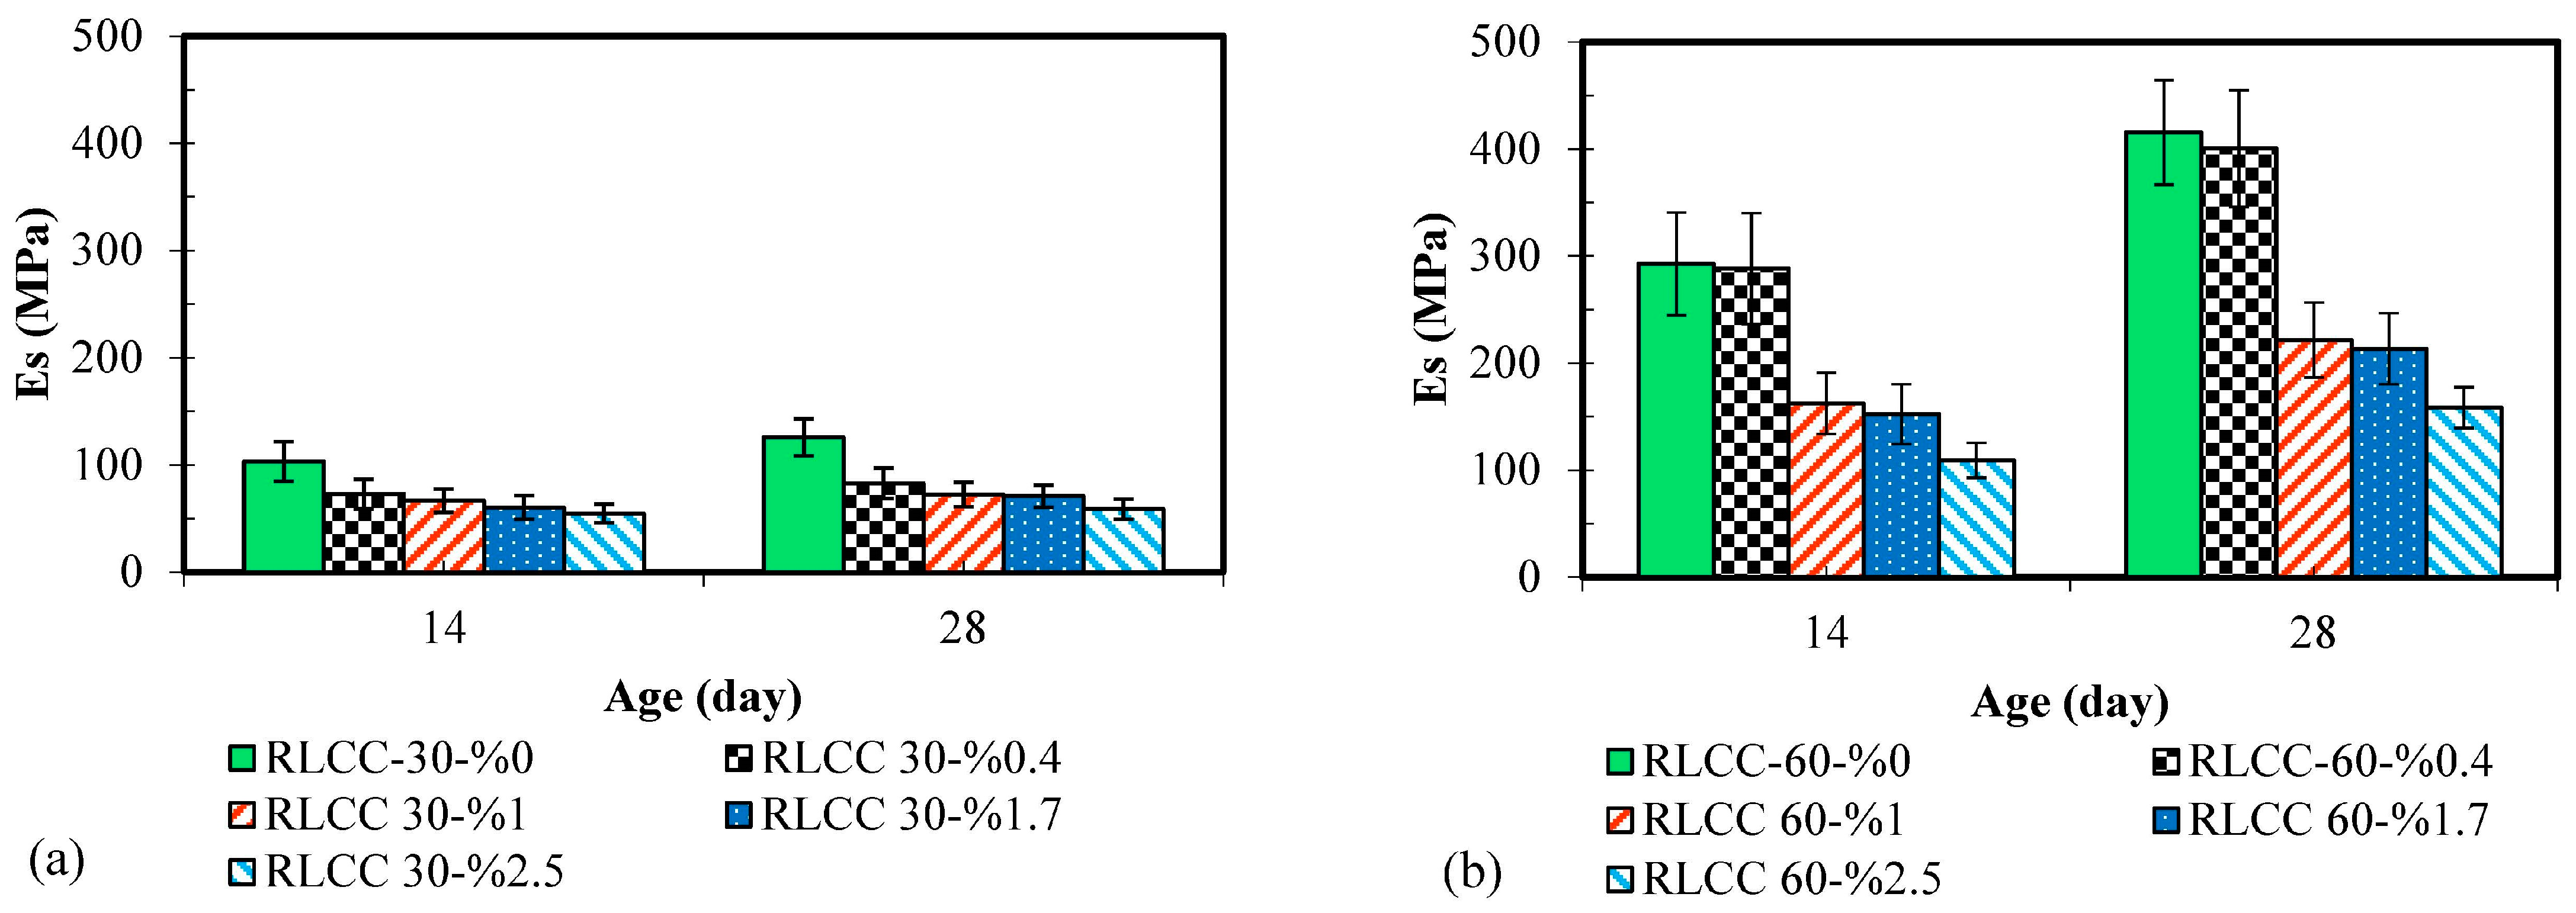
4.2. Modulus of Elasticity

According to Figure 5, the modulus of elasticity of sandy soil (Group 1 in Table 5) is 14.87 MPa. It can also be seen that with the addition of 3% lime to the soil, the modulus of elasticity significantly increased (170%) compared to the untreated soil and reached 40.1 MPa. When 4% cement was used instead of 3% lime, this increase was much higher and the modulus of elasticity exhibited an increase of about 514% compared to the untreated soil, reaching 91.3 MPa. Samples with 3% lime and 4% cement had an elasticity modulus of 67.4 MPa, which was lower than the samples stabilized with cement and higher than the samples stabilized with lime.
Figure 7 shows the changes in modulus of elasticity of 14- and 28-day RLCC samples cured at 30 °C and at 60 °C with different percentages of fibers. The numbers after RLCC represent the curing temperature and fiber content, respectively. For example, RLCC-30-1% corresponds to the sample cured at 30 °C and reinforced with 1% fiber content. According to Figure 7, all three factors, namely fiber content, curing age, and curing temperature, affect the modulus of elasticity of samples. By increasing the fiber content in the stabilized soil, the modulus of elasticity decreased. According to the data in Table 6 and Figure 7, adding 0.4% of fibers to the mixture in the 14-day samples cured at 30 °C caused the modulus of elasticity to decrease by 30.2 MPa and decrease from 103.21 MPa to 73 MPa for samples without fibers. Conversely, in the 28-day samples, the modulus of elasticity decreased from 125.7 MPa for non-reinforced samples to 83 MPa for samples reinforced with 0.4% of fibers. The decrease in the modulus of elasticity as a result of the increase in the amount of fibers is due to the fact that the fibers are placed between the soil particles, thus reducing their interaction and internal friction [43]. As the amount of fibers increases and soil particles are spaced further apart, the fibers potentially take on a larger role in bearing the load, while the contribution of the soil grains decreases. Under these conditions, the load is primarily transferred through the fibers between the particles. Also, with the increase in age and curing temperature, the modulus of elasticity increased. The reason for this increase is that with the increase in age and curing temperature, pozzolanic reactions developed greater bonds between soil particles, leading to an increase in the modulus of elasticity of materials and thus the stiffness.

4.3. Scanning Electron Microscope Images

Figure 8 shows the scanning electron microscope (SEM) images of the sandy soil and the soil stabilized with lime and cement and reinforced with fibers. Figure 8a,d show the natural soil and were taken at 100 and 10k magnifications, respectively. Figure 8b,c,e,f shows the stabilized and reinforced soil at 100, 100, 4k, and 4k magnifications, respectively. According to the results of SEM images, sandy soil contained significantly more pores (Figure 8d). By adding stabilizers and producing pozzolanic needle-shaped bonds (Figure 8e), which are products of pozzolanic reactions and are aluminosilicate-hydrated (N-A-S-H) and calcium silicate-hydrated (C-S-H) gels, the percentage of pores decreased and the soil formed a different structure from that of natural soil, as shown in Figure 8b. Figure 8c shows a string of fiber surrounded by material. Based on SEM images of Figure 8, the needle-shaped bonds as a result of pozzolanic reactions could not penetrate well into the fibers and develop a reasonable bond. As a result, the addition of stabilizers increased the UCS and the modulus of elasticity which is consistent with the results of Table 6 and of previous studies [29,51,52,53]. However, adding fibers to the mixture reduced the above parameters and increased the ductility of the material. Such a trend was seen in the studies of several other researchers [14,54,55,56,57].

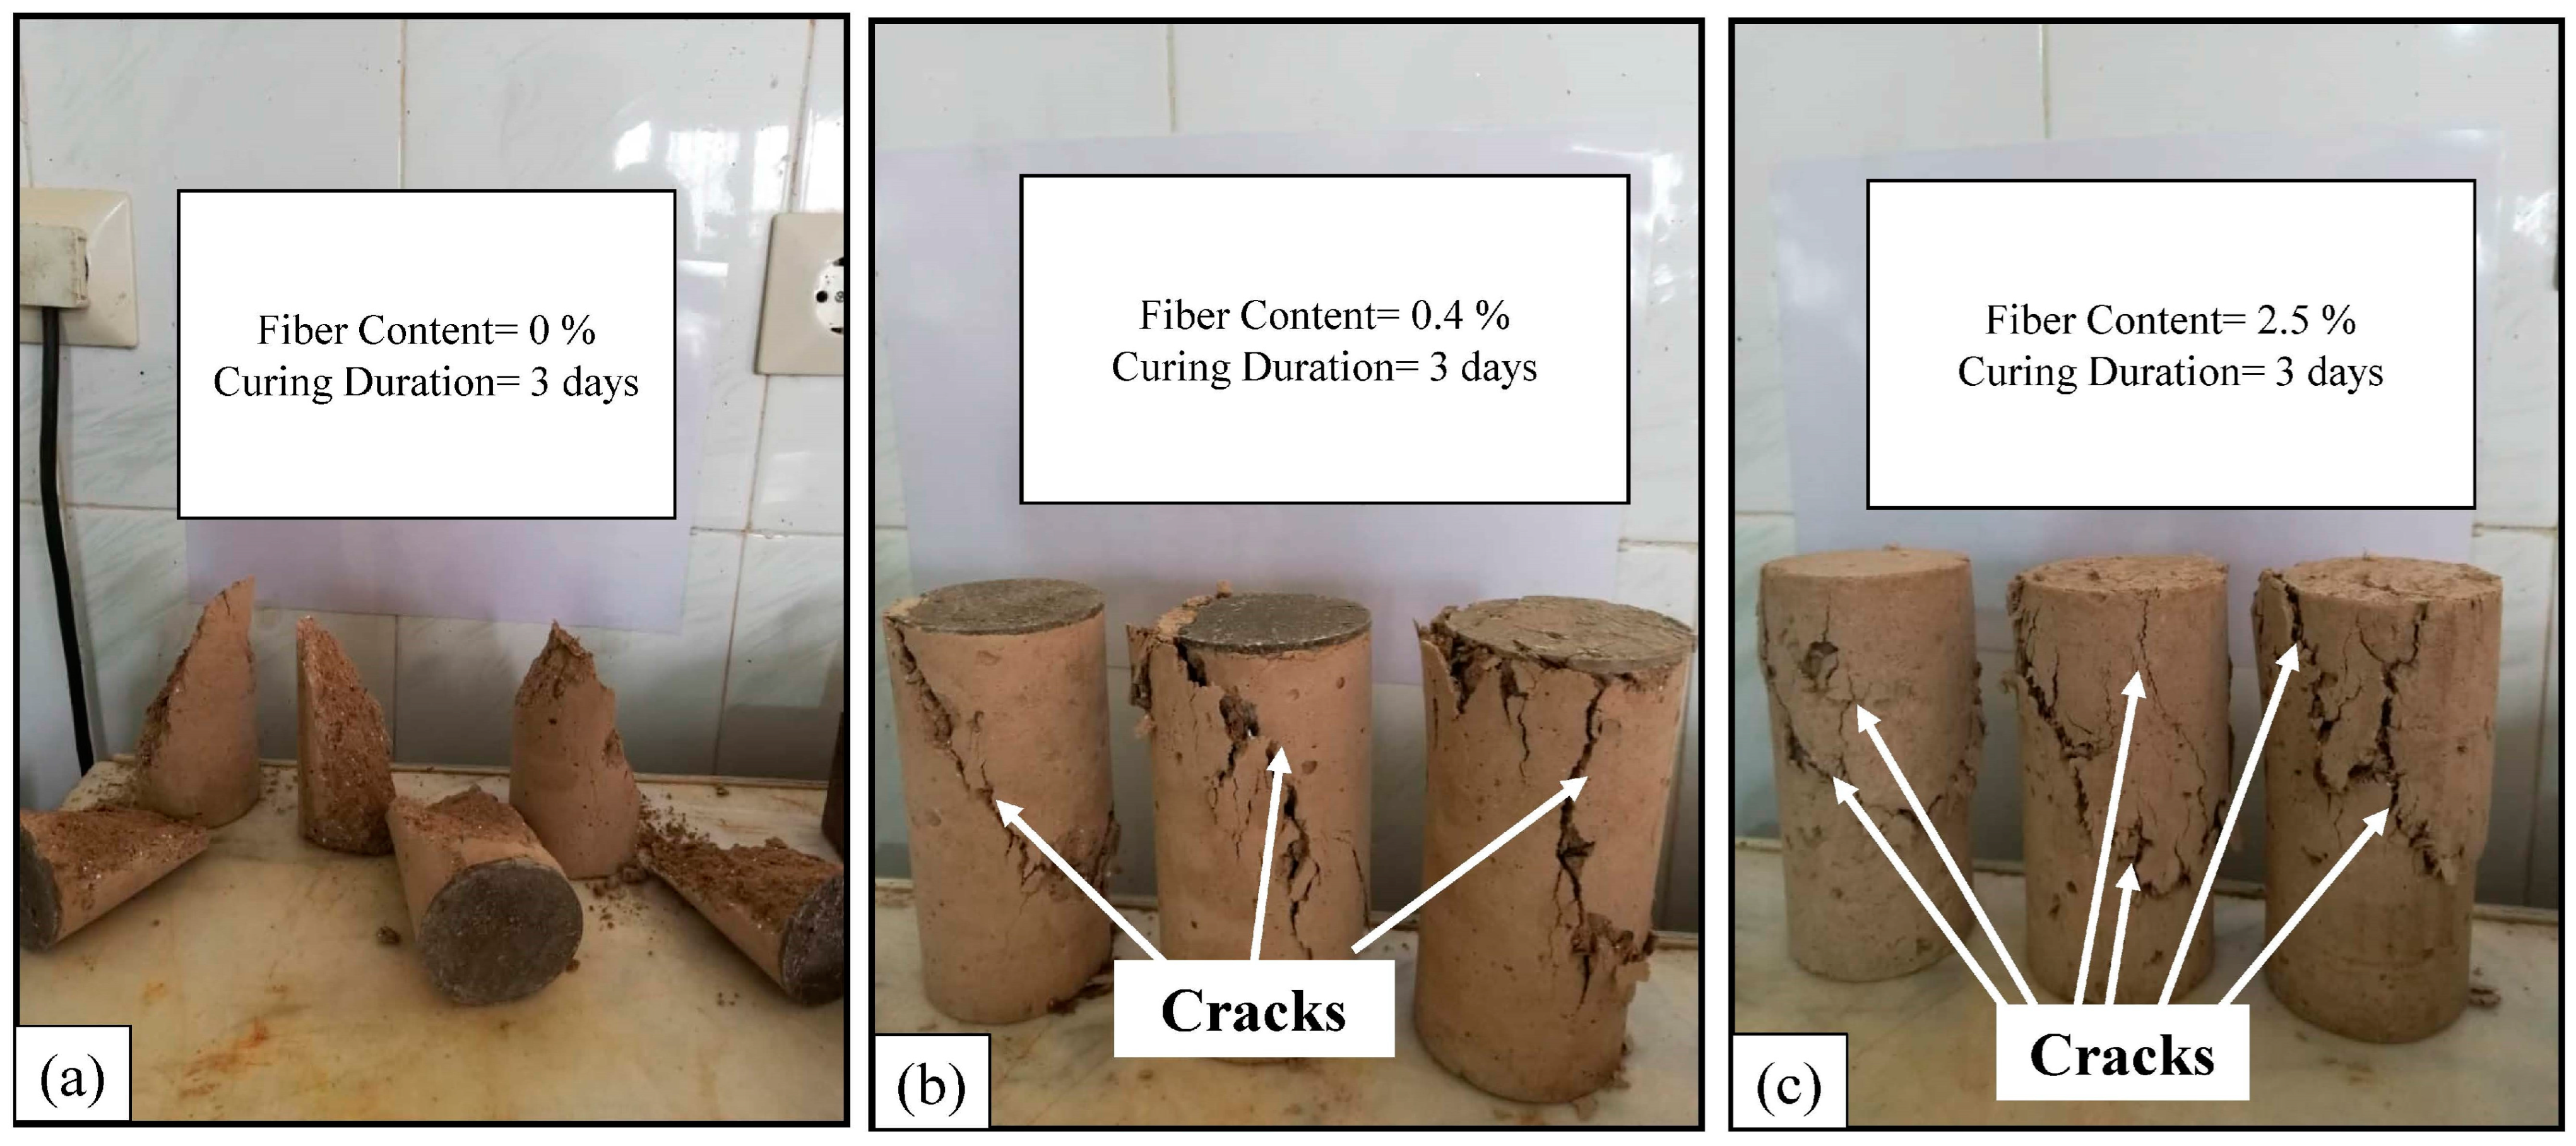
4.4. Effect of Fibers on the Failure Pattern of Samples

As outlined in Table 5, the curing age and temperature ranged from 3 to 90 days and 30 to 60 °C, respectively. However, due to space constraints, only a few images could be presented. To illustrate the failure pattern of the samples, those cured for 3 days at 60 °C were randomly selected from the larger dataset. According to the objective observations of the laboratory tests as demonstrated in the images of Figure 9, the stabilized sand without fibers has a brittle behavior (Figure 9a). That is, when the specimens are loaded, eventually small cracks are generated which immediately develop into wider cracks, and thus the specimen fails. Figure 9a shows that the crack in this type of specimen is wide and long and spread from the top to the bottom of the sample. As can be seen in Figure 6, samples without fibers (LCC) compared to samples with fibers (RLCC) exhibit lower failure deformations, which align with the measured failure strains. For example, the failure strain in 14-day samples cured at 60 °C (Figure 6a) in the sample without fibers was 1.466%. By increasing the percentages of fibers to 0.4%, 1%, 1.7%, and 2.5%, the failure strain increased and reached 1.874%, 2.082%, 2.199%, and 2.915%, respectively. It can be concluded that the fibers played an effective role in controlling the width of the cracks by sewing the walls of the cracks together. This indicated that with the increase in the fiber content in the soil, failure was postponed and occurred in larger strains. This changed the behavior of the samples from brittle to ductile. The aforementioned trend was seen in all samples of all ages and curing temperatures. Other researchers have also reported similar results when increasing the amount of fibers in soil (e.g., refs. [50,58]). Also, as shown in Figure 6, the stress declines after failure in the stress–strain curves decreases with higher fiber contents. This indicates that fibers shift the stabilized soil’s behavior from strain softening to strain hardening, and this change becomes more pronounced as the fiber content increases in the samples. In the reinforced samples, several tensile cracks appear in the specimen before failure, and the fibers act as a tensile member that prevents the cracks from widening. Looking at the images of Figure 9a–c reveals that with the increase in the fiber content, the number of cracks increased, but the width of cracks decreased. This resulted in an increase in the failure strain and the ductility of the behavior of the stabilized soil samples. As the fiber content increased, the number of cracks observed also increased; however, their width decreased. This phenomenon explains why failure occurred at higher strain levels in the stress–strain diagrams presented in Figure 6. Consequently, the mechanical analysis aligns well with the observed failure patterns. As global waste production, including waste tires, continues to increase, using these materials for soil reinforcement offers an efficient solution for both enhancing soil properties and managing waste.

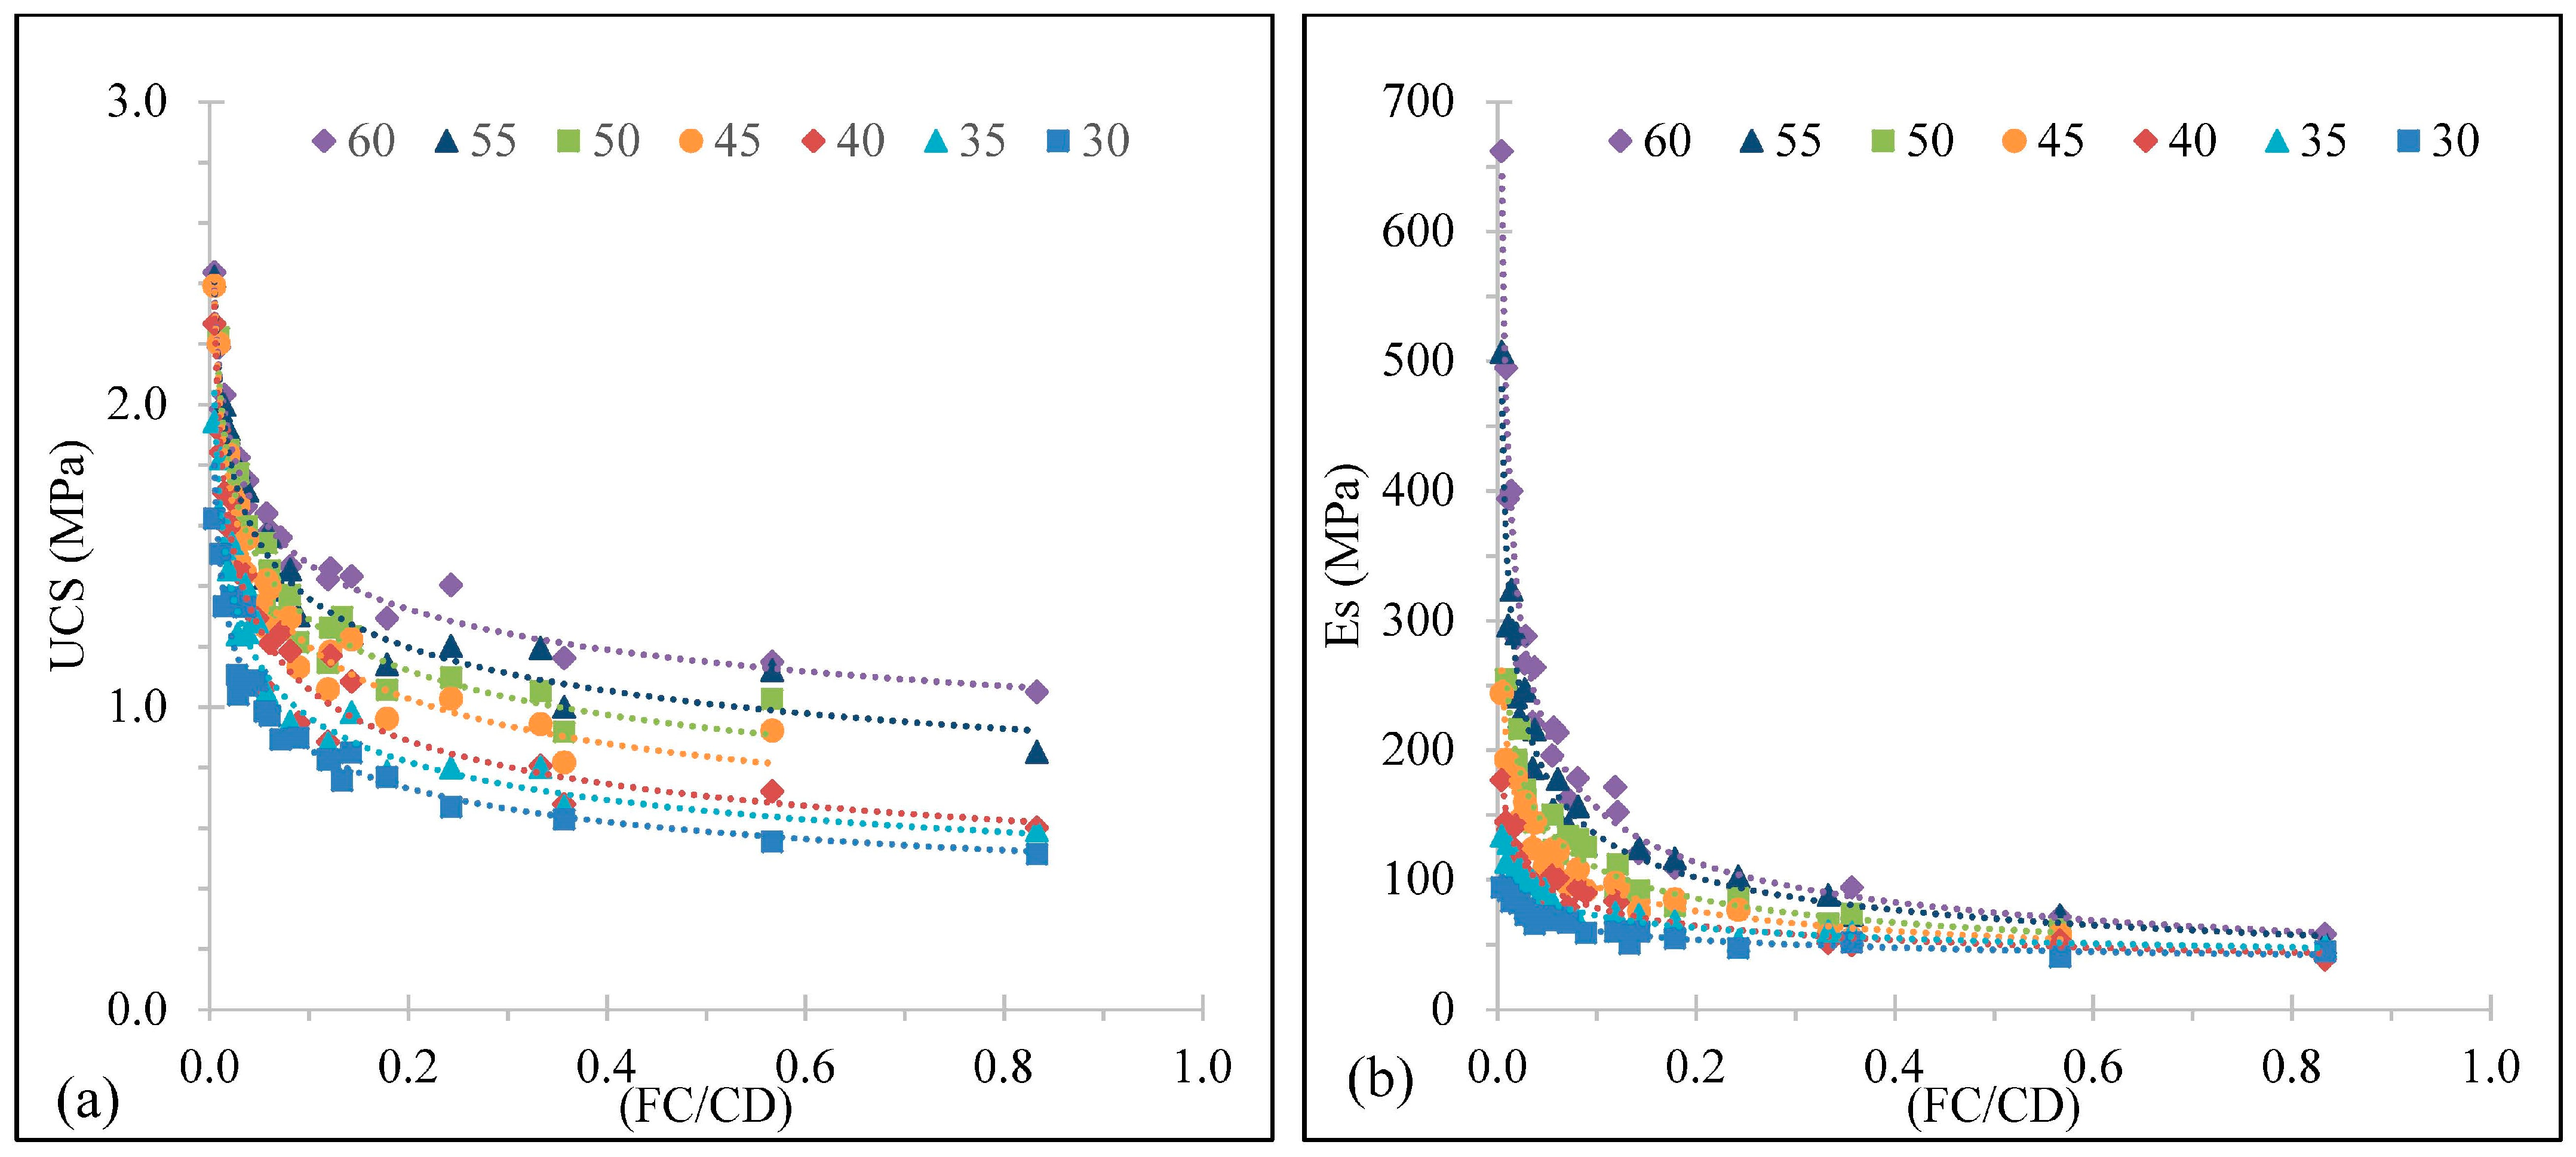
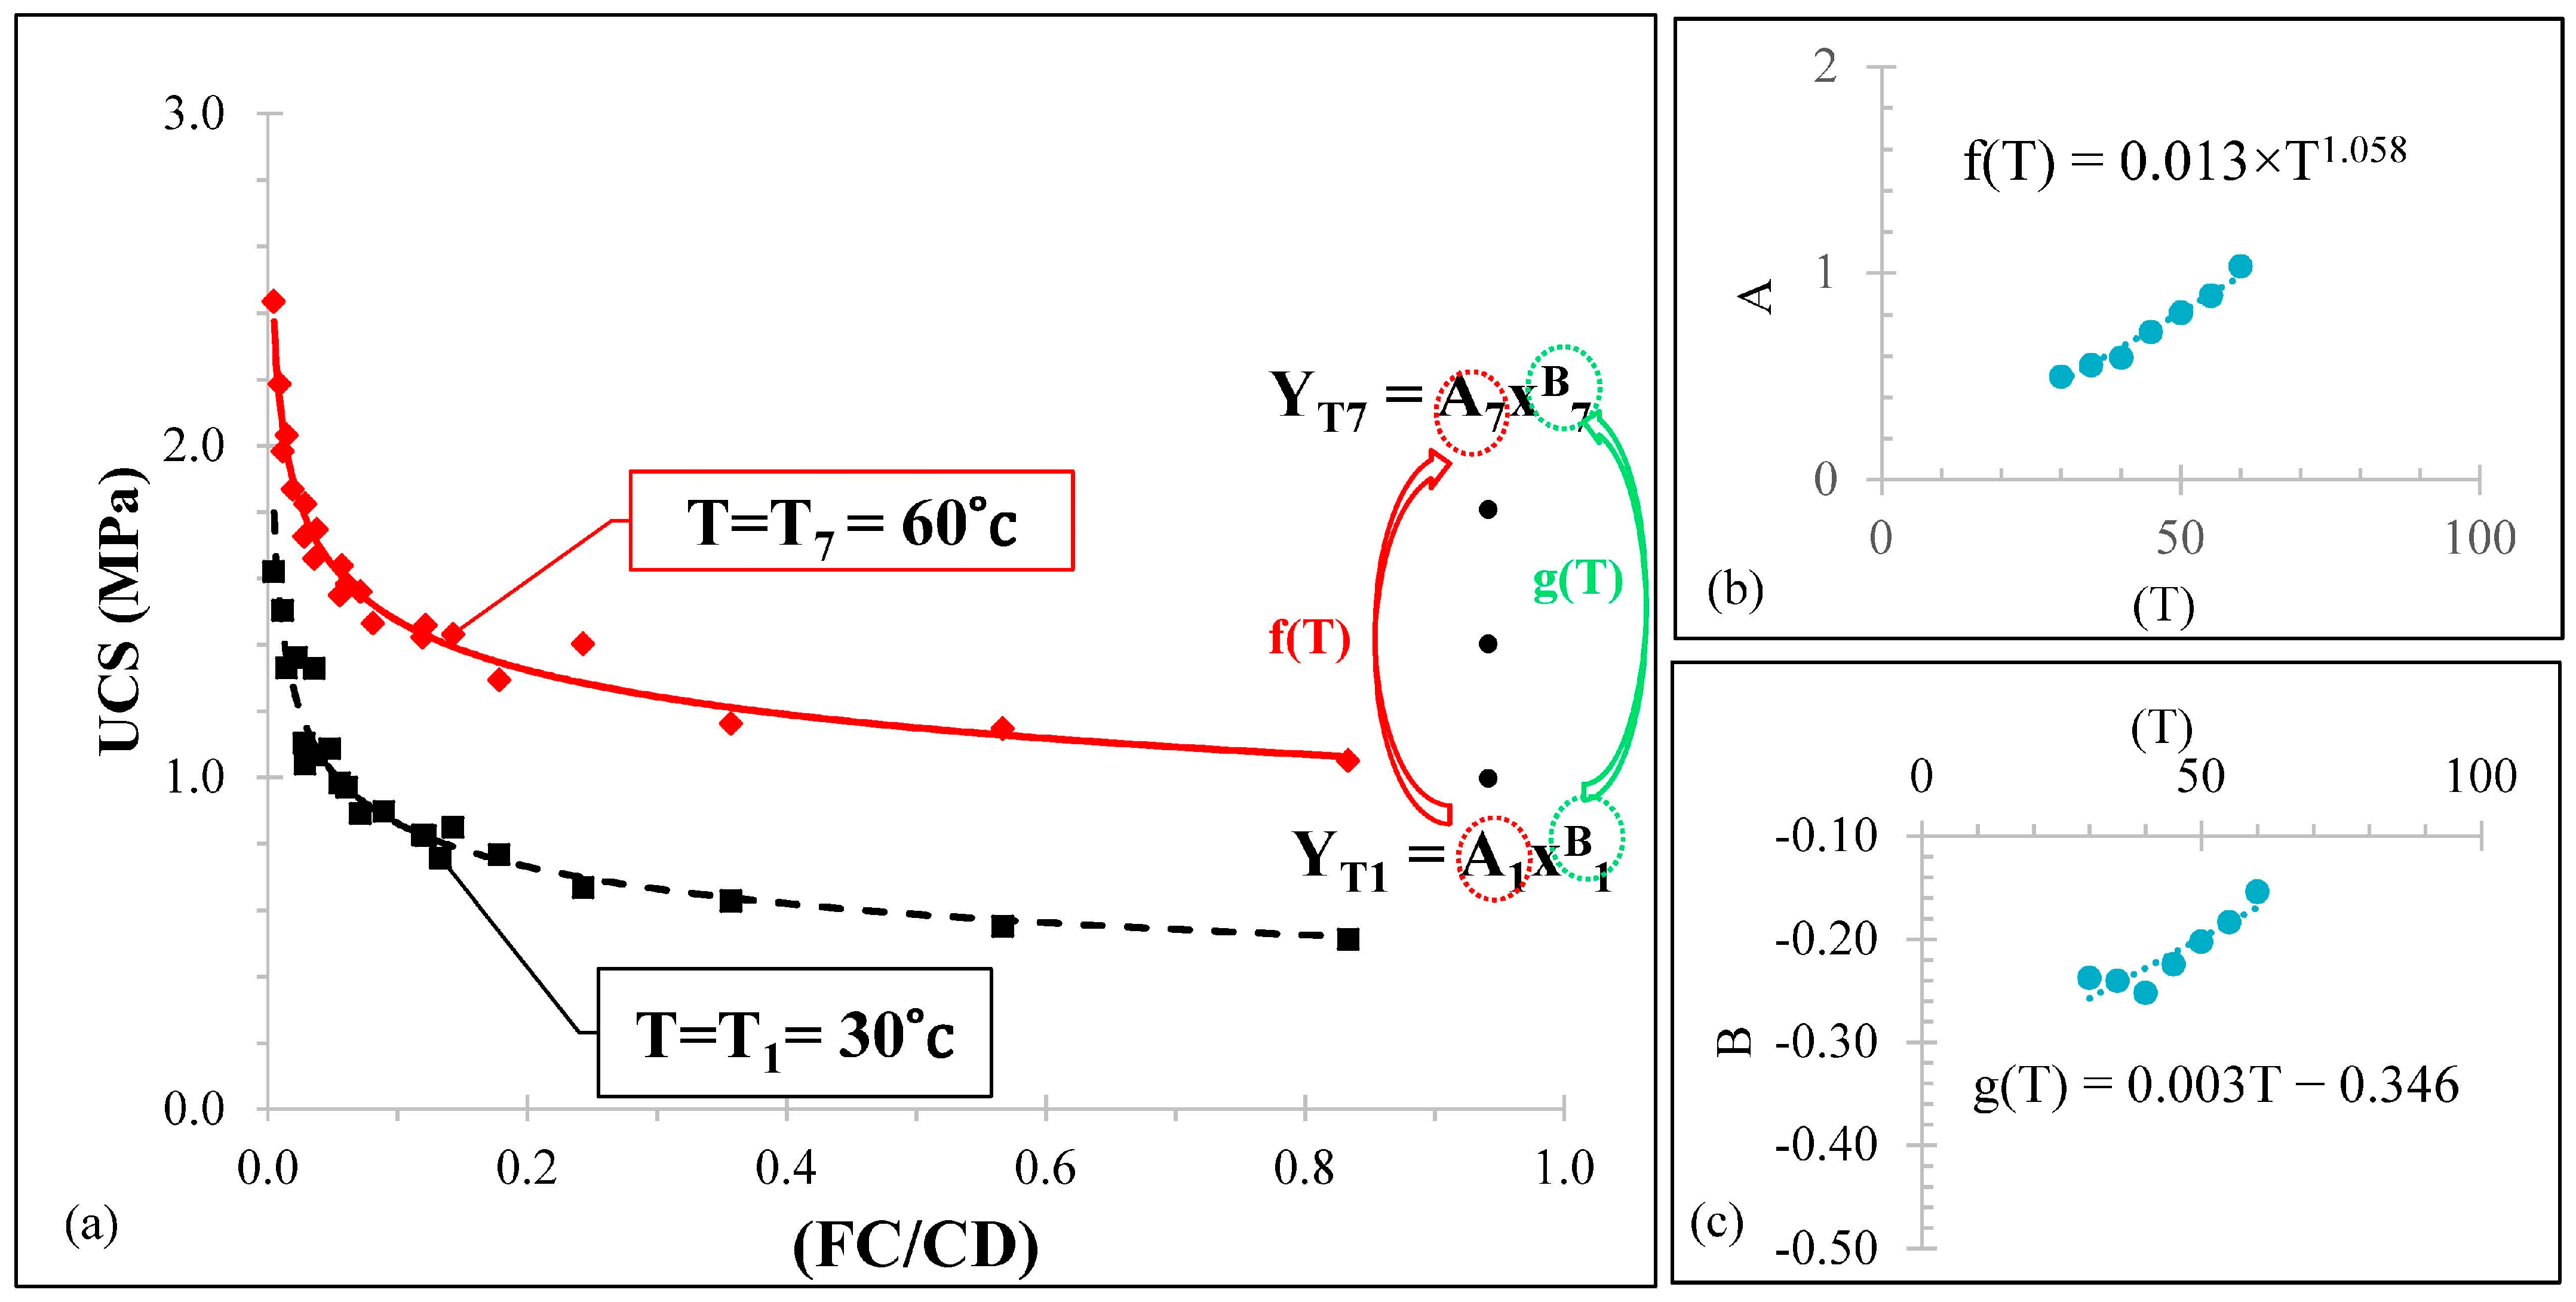
4.5. Mathematical Model for Predicting Strength Properties

As discussed in Section 2, the main goal of this study was to provide a mathematical model for predicting the strength properties of reinforced and stabilized sandy soil, including the modulus of elasticity (Es) and UCS, at various curing ages, temperatures, and fiber content. Thus, the focus in the current study was UCS testing and result analyses of the treated soils with lime, cement, and clay that were reinforced with different proportions of fibers at different curing ages and curing temperatures. As a result of the experiments and the translation of the results, 196 datasets were achieved. These datasets were used to perform a statistical analysis using Microsoft Excel 2016 to develop predictive relationships in the form of mathematical–experimental models. The numerous UCS tests carried out on the samples of this study showed that the curing age, curing temperature, and fiber content had significant effects on the strength properties of the stabilized/reinforced soil. The investigated properties were UCS and Es. Consequently, the fiber content (FC) in the mixing design and the curing age in days (CD) were used to predict the UCS and Es of the materials at different temperatures. To develop a predictive mathematical model with acceptable accuracy, the average test results of three replicates of each mixture were used.
In references [15,29,59,60,61,62], a power function, as expressed in Equations (1)–(3), was used to predict the mechanical properties of stabilized and reinforced soil. The selection of the power function was due to its simplicity and high statistical correlation coefficient of >90%.
Y = A X B
Y = A ( F C C D ) B
Y = f ( T ) ( F C C D ) g ( T )
In Equations (1) and (2), “A” and “B” are constants, X is an independent variable (in this case, FC/CD), and Y is a dependent variable with the strength characteristic of interest, such as UCS and Es. Equation (1) is the general form of the relationship that governs the UCS and Es of samples, and Equation (2) shows that FC/CD is used as an independent variable, which is the case in the current study. Typically, a data range of 70–90% is used for the development of the model and the remaining portion of the data are used for validation [63,64]. In this study, 80% of the obtained data were randomly selected and used for the development of the model, and the remaining 20% were used for the validai tion of the model.
Figure 10 shows the data obtained from the tests on 80% of all samples of this study. In Figure 10, the legends refer to the curing temperature. For each curing temperature (in °C), the power curve of Equation (2) was developed. For brevity, only the equations resulting from regression for curing temperatures of 30 °C to 60 °C are presented in Table 7 and Table 8, respectively, which show the mathematical expressions obtained to predict the values of UCS and Es for stabilized and reinforced cured samples with different fiber contents. According to Figure 10 and the correlation of the equations in Table 7 and Table 8, where R2 > 90%, it can be concluded that the power function, due to its simple form and high accuracy, is suitable for estimating the UCS and Es values well. Figure 10 also shows that the UCS and Es values of the samples have a direct relationship with the curing age and an inverse relationship with the fiber content. Also, with increasing temperature, the UCS and Es of the samples tend to increase. It seems that the function of the UCS and Es versus FC/CD yields two horizontal and vertical asymptotes. This means that as the fiber content decreases or the curing age increases, the function moves towards the vertical asymptote and the values of UCS and Es are increased. Also, according to Figure 10, as the fiber content increases or the curing age decreases, the target function tends towards a horizontal asymptote and the values of UCS and Es decrease.
In order to achieve a comprehensive predictive equation for the UCS and Es of the stabilized and reinforced soil by including both the temperature (T) and FC/CD, a multivariable nonlinear regression analysis was performed on 80% of all datasets that were randomly selected. The steps of constructing the mathematical model are shown in Figure 11. To achieve a comprehensive prediction equation, after determining the predictive model for each curing temperature (Figure 11a), a curve was fitted using the constants “A” (Figure 11b) and “B” (Figure 11c) in the equations shown in Table 6 and Table 7 at specific curing temperatures (30, 35, 40, 45, 50, 55, and 60 °C). This curve was a function of curing temperature and was able to estimate the model constants with a high accuracy (R2 > 0.95). Various functions were used for fitting, of which, due to its high accuracy in data regression and the simplicity of the form of the equation, the power function (f(T)) with R2 = 0.97 was chosen for the constant “A” and the linear function (g(T)) with R2 = 0.82 was chosen for the constant “B”. In the second step, for each of the UCS and Es, a comprehensive function in the form of Equation (3), was developed as presented in Table 9. Figure 12 demonstrates the experimentally measured versus predicted strength properties of the mixtures using the equations given in Table 9 and the 20% of the data that were selected for validation of the model. The R2 ≥ 95% values show that there is a strong correlation between the predicted and the actual properties obtained from the experiments. It should be noted that the model was limited to curing days between 3 and 90 days, curing temperatures between 30 °C and 60 °C and fiber contents of between 0.4% and 2.5%.

4.6. Discussion on the Scale Effect

Scaled model tests are usually developed to simulate and study the behavior of a large prototype of a geotechnical system which cannot be accommodated in the laboratory space. The scale effect is one of the most important issues which has to be considered in such studies since it provides the possibility of investigating the behavior of large- and full-scale prototypes in a comparable manner. Theoretically, the scale effect is taken into account using dimensional analysis introduced by Buckingham [65] and also the scaling law proposed by Langhaar [66]. In fact, scaling laws originate from dimensional analysis, which allow one to set a scaling factor of, say, λ to convert design parameters from a laboratory model to the corresponding parameters for a large prototype. The factor is initially considered to be the geometric scaling while other scaling laws (i.e., non-dimensional parameters πi) are adjusted based upon λ. We found extensive studies in the literature which have been conducted on this issue; of all of these, some are worth mentioning (e.g., refs. [67,68,69,70,71,72,73,74]).
It should be noted that the main scope of the current work is not to study the behavior of large prototypes of geotechnical systems using the models of the reduced scales in the lab. Rather, the primary goal of the current study is to investigate “a multi-factor mathematical model for the prediction of the strength properties of reinforced stabilized sand as a building foundation material”. To achieve this, equal-sized samples were developed, cured, and then tested. Results were analyzed and the effects of variables such as fiber content, curing temperature, and curing age on the behavior of various samples were examined. They further imply that material properties and qualities rather than their geometrical characteristics should have been given priority. This is because the samples all had same dimensions, and the geometrical scaling factor was considered to have been removed.
In dealing with the scale effect, one should be aware of important limitations and challenges. The scale effect makes it hard to directly compare a model test carried out at a reduced scale to a full-scale prototype. Based on dimensional analysis, the scale effect may provide a better comprehension on the issue and assist in the creation of more plausible models, but it concurrently develops (or imposes) new secondary boundaries on the areas within which different influential factors exist. This is a critical point where a variety of geometrical parameters, including the size of the soil grain, the model’s dimensions, and the dimensions of the reinforcement elements, are significant.
In conclusion, since we did not have a large geotechnical prototype system to examine, the experiments within the current research were carried out in a laboratory and on the samples of fixed geometry, removing the geometrical factor and thereby eliminating the need for a scale-effect study.

5. Conclusions

In the present research, several UCS tests were carried out to investigate the effect of various factors, such as curing duration and temperature, as well as the fiber content on the strength properties of a mixture of sand and clay, stabilized with cement and lime and reinforced with recycled tire fibers. To complement the strength testing results, the effect of pozzolanic reactions and the interaction between fibers and the soil was studied using scanning electron microscopy (SEM). In addition to investigating the effect of the abovementioned factors on the strength properties of the stabilized and/or reinforced soil, the main goal of the present study was to propose and validate a mathematical model that can predict two important strength properties, namely UCS and Es. The novelty of this study lies in the combined stabilization of sandy soil using both physical factors (fibers) and chemical factors (lime and cement). Additionally, the study presents a mathematical model for estimating the strength parameters of stabilized soil at varying curing ages, curing temperatures, and fiber contents. Below are the major findings of this study.
  • The curing age was one of the most important factors in governing the behavior of mixtures. As an example, the UCS of the 28-day Lime Cement Concrete (LCC) samples cured at 30 °C was 40% higher than the corresponding 14-day samples. Also, the modulus of elasticity (Es) of the 28-day LCC samples cured at 30 °C was 1.22 times greater than that of the 14-day samples.
  • The curing temperature was another factor that significantly influenced the behavior of materials. As an example, the UCS of LCC samples that were cured for 14 and 28 days at 60 °C was 1.92 and 1.78 times the corresponding samples that were cured for 14 and 28 days at 30 °C, respectively. Also, the modulus of elasticity of the LCC samples cured at 60 °C was 183.7% and 230.5% greater than that of the 14- and 28-day samples cured at 30 °C.
  • The addition of fibers increased the ductility of samples; however, it also decreased their strength. Thus, an important positive role of fibers was controlling the width of cracks and preventing their expansion. This resulted in changing the behavior of mixtures from a brittle to a ductile building material, which prevents a sudden and catastrophic failure due to loading. For example, the failure strain in 14-day samples cured at 60 °C without fibers was 1.466%. By introducing 0.4%, 1%, 1.7%, and 2.5% of fiber content, the failure strain increased to reach 1.874%, 2.082%, 2.199%, and 2.915%, respectively. The issue of ductility is important when constructing retaining walls and building foundations, as it allows the structure to withstand a greater level of deformation before causing structural failure.
  • Microstructural studies supported the strength testing outcomes. Based on scanning electron microscopy (SEM) results, the addition of clay, cement, and lime to the soil greatly reduced the pores in the soil, resulting in the improvement of various properties of the stabilized soil. SEM images also revealed that the bonds formed from pozzolanic reactions did not effectively penetrate the fibers to establish a strong bond. Consequently, the addition of fibers to the mixture did not effectively increase the strength properties, although it did enhance the ductility.
  • The role of fibers in controlling the width of cracks and preventing their expansion is an effective factor in changing the behavior of materials from brittle to ductile and from strain-softening to strain-hardening.
  • The developed predictive mathematical model is capable of predicting the UCS and Es of stabilized and reinforced sandy soil. The proposed equations are able to provide building designers with an initial estimation of the strength properties of stabilized and reinforced sandy soil in applications such as foundation stabilization, the guarding of retaining walls, or in soil reinforcement projects, using commonly available laboratory tests.
  • Using fiber for soil stabilization is a method that has the advantages of both reinforcement and stabilization, and this method can be used in construction projects that require soil improvement.

Author Contributions

Conceptualization, M.H.B.; Methodology, M.M.J. and E.Y.; Formal analysis, M.M.J.; Investigation, M.M.J.; Resources, M.H.B.; Writing—original draft, M.M.J.; Writing—review & editing, M.H.B. and E.Y.; Visualization, E.Y.; Supervision, M.H.B. and E.Y. All authors have read and agreed to the published version of the manuscript.

Funding

This research received no external funding.

Data Availability Statement

The original contributions presented in this study are included in the article. Further inquiries can be directed to the corresponding author.

Conflicts of Interest

The authors declare no conflicts of interest.

Notations and Abbreviations

γdmaxMaximum dry density
ωoptOptimum moisture content
CcCoefficient of curvature
CuCoefficient of uniformity
D10Effective particle size
EsModulus of elasticity (MPa)
GsSpecific gravity
LLLiquid limit
PIPlasticity Index
TTemperature (°C)
BSEBackscattered electrons
CACuring age (day)
CCCement concrete
CLClay with low plasticity
CTCuring temperature (°C)
FCFiber content (% of total dry weight of materials)
LCLime Concrete
LCCLime–Cement Concrete
LOILoss on ignition
NOSNumber of samples
OPCOrdinary Portland cement
RLCCReinforced Lime–Cement Concrete
RTFRecycled tire fiber
SEMScanning electron microscopy
SMSilty sand
UCSUnconfined compressive strength
USCSUnified soil classification system
% DWM% of dry weight of materials

References

  1. Jafari, M.M.; Bagheripour, M.H.; Lakzadeh, M. Experimental Study of the Effect of Polypropylene Fiber on Mechanical Properties of Lime and Cement Stabilized Soil. Karafan J. 2021, 19, 59–81. [Google Scholar]
  2. Yaghoubi, E.; Azadegan, O.; Li, J. Effect of surface layer thickness on the performance of lime and cement treated aggregate surfaced roads. Electron. J. Geotech. Eng. 2013, 18, 1081–1094. [Google Scholar]
  3. Jahandari, S.; Saberian, M.; Zivari, F.; Li, J.; Ghasemi, M.; Vali, R. Experimental study of the effects of curing time on geotechnical properties of stabilized clay with lime and geogrid. Int. J. Geotech. Eng. 2019, 13, 172–183. [Google Scholar] [CrossRef]
  4. Jahandari, S.; Saberian, M.; Tao, Z.; Mojtahedi, S.F.; Li, J.; Ghasemi, M.; Rezvani, S.S.; Li, W. Effects of saturation degrees, freezing-thawing, and curing on geotechnical properties of lime and lime-cement concretes. Cold Reg. Sci. Technol. 2019, 160, 242–251. [Google Scholar] [CrossRef]
  5. Jafari, M.M.; Bagheripour, M.H. Laboratory study of the effect of age, temperature and fiber content on the behavior of environmentally friendly Reinforced Lime-Cement Concrete (RLCC). J. Civ. Environ. Eng. 2022, 53, 61–75. [Google Scholar]
  6. Baadiga, R.; Balunaini, U. Evaluation of pavement design input parameters of biaxial and triaxial geogrid stabilized flexible pavements overlying soft subgrades. Clean. Mater. 2023, 9, 100192. [Google Scholar] [CrossRef]
  7. Narani, S.; Abbaspour, M.; Hosseini, S.M.M.; Nejad, F.M. Long-term dynamic behavior of a sandy subgrade reinforced by Waste Tire Textile Fibers (WTTFs). Transp. Geotech. 2020, 24, 100375. [Google Scholar] [CrossRef]
  8. Mirzababaei, M.; Miraftab, M.; Mohamed, M.; McMahon, P. Unconfined Compression Strength of Reinforced Clays with Carpet Waste Fibers. J. Geotech. Geoenv. Eng. 2013, 139, 483–493. [Google Scholar] [CrossRef]
  9. Bilondi, M.P.; Toufigh, M.M.; Toufigh, V. Using calcium carbide residue as an alkaline activator for glass powder–clay geopolymer. Constr. Build. Mater. 2018, 183, 417–428. [Google Scholar] [CrossRef]
  10. Koley, S. Arsenic calamity in India’s West Bengal: A critical review of mitigation scenarios. Proc. Inst. Civ. Eng.-Eng. Sustain. 2023, 176, 198–213. [Google Scholar] [CrossRef]
  11. Silva, S.S.; Mendes, B.C.; da Silva, T.O.; Lopes, E.C.; Ferreira, F.A.; Pedroti, L.G. Use of Red Mud in Soil Stabilization for Pavement Through Alkali Activation. In TMS Annual Meeting & Exhibition; Springer: Cham, Switzerland, 2024; pp. 693–700. [Google Scholar] [CrossRef]
  12. Mohajerani, A.; Burnett, L.; Smith, J.V.; Markovski, S.; Rodwell, G.; Rahman, M.T.; Kurmus, H.; Mirzababaei, M.; Arulrajah, A.; Horpibulsuk, S.; et al. Recycling waste rubber tyres in construction materials and associated environmental considerations: A review. Resour. Conserv. Recycl. 2020, 155, 104679. [Google Scholar] [CrossRef]
  13. Mohammadinia, A.; Disfani, M.M.; Narsilio, G.A.; Aye, L. Mechanical behaviour and load bearing mechanism of high porosity permeable pavements utilizing recycled tire aggregates. Constr. Build. Mater. 2018, 168, 794–804. [Google Scholar] [CrossRef]
  14. Valipour, M.; Shourijeh, P.T.; Mohammadinia, A. Application of recycled tire polymer fibers and glass fibers for clay reinforcement. Transp. Geotech. 2021, 27, 100474. [Google Scholar] [CrossRef]
  15. Saberian, M.; Khotbehsara, M.M.; Jahandari, S.; Vali, R.; Li, J. Experimental and phenomenological study of the effects of adding shredded tire chips on geotechnical properties of peat. Int. J. Geotech. Eng. 2018, 12, 347–356. [Google Scholar] [CrossRef]
  16. Hataf, N.; Rahimi, M.M. Experimental investigation of bearing capacity of sand reinforced with randomly distributed tire shreds. Constr. Build. Mater. 2006, 20, 910–916. [Google Scholar] [CrossRef]
  17. Arulrajah, A.; Mohammadinia, A.; Maghool, F.; Horpibulsuk, S. Tire derived aggregates as a supplementary material with recycled demolition concrete for pavement applications. J. Clean. Prod. 2019, 230, 129–136. [Google Scholar] [CrossRef]
  18. Kalkan, E. Preparation of scrap tire rubber fiber-silica fume mixtures for modification of clayey soils. Appl. Clay Sci. 2013, 80–81, 117–125. [Google Scholar] [CrossRef]
  19. Huang, J.; Kogbara, R.B.; Hariharan, N.; Masad, E.A.; Little, D.N. A state-of-the-art review of polymers used in soil stabilization. Constr. Build. Mater. 2021, 305, 124685. [Google Scholar] [CrossRef]
  20. Abdeldjouad, L.; Asadi, A.; Nahazanan, H.; Huat, B.B.K.; Dheyab, W.; Elkhebu, A.G. Effect of Clay Content on Soil Stabilization with Alkaline Activation. Int. J. Geosynth. Ground Eng. 2019, 5, 4. [Google Scholar] [CrossRef]
  21. Kastiukas, G.; Zhou, X. Effects of waste glass on alkali-activated tungsten mining waste: Composition and mechanical properties. Mater. Struct. 2017, 50, 194. [Google Scholar] [CrossRef]
  22. Adeyanju, E.A.; Okeke, C.A. Clay soil stabilization using cement kiln dust. IOP Conf. Ser. Mater. Sci. Eng. 2019, 640, 012080. [Google Scholar] [CrossRef]
  23. Kermanipour, M.J.; Bagheripour, M.H.; Yaghoubi, E. Mechanical and Microstructural Characterization of a Nano-stabilized Sandy Soil. Geotech. Geol. Eng. 2024, 42, 6131–6146. [Google Scholar] [CrossRef]
  24. Xiao, R.; Polaczyk, P.; Zhang, M.; Jiang, X.; Zhang, Y.; Huang, B.; Hu, W. Evaluation of Glass Powder-Based Geopolymer Stabilized Road Bases Containing Recycled Waste Glass Aggregate. Transp. Res. Rec. 2020, 2674, 22–32. [Google Scholar] [CrossRef]
  25. Abed, M.H.; Abed, F.H.; Zareei, S.A.; Abbas, I.S.; Canakci, H.; Kurdi, N.H.; Emami, A. Experimental feasibility study of using eco- and user-friendly mechanochemically activated slag/fly ash geopolymer for soil stabilization. Clean. Mater. 2024, 11, 100226. [Google Scholar] [CrossRef]
  26. Cong, M.; Longzhu, C.; Bing, C. Analysis of strength development in soft clay stabilized with cement-based stabilizer. Constr. Build. Mater. 2014, 71, 354–362. [Google Scholar] [CrossRef]
  27. Yonekura, R.; Kaga, M. Current Chemical Grout Engineering in Japan. In Grouting, Soil Improvement and Geosynthetics; American Society of Civil Engineers: Reston, VA, USA, 1992. [Google Scholar]
  28. Horpibulsuk, S.; Rachan, R.; Suddeepong, A. Assessment of strength development in blended cement admixed Bangkok clay. Constr. Build. Mater. 2011, 25, 1521–1531. [Google Scholar] [CrossRef]
  29. Jahandari, S.; Mojtahedi, S.F.; Zivari, F.; Jafari, M.; Mahmoudi, M.R.; Shokrgozar, A.; Kharazmi, S.; Hosseini, B.V.; Rezvani, S.; Jalalifar, H. The impact of long-term curing period on the mechanical features of lime-geogrid treated soils. Géoméch. Geoengin. 2022, 17, 269–281. [Google Scholar] [CrossRef]
  30. Wang, S.; Xue, Q.; Ma, W.; Zhao, K.; Wu, Z. Experimental study on mechanical properties of fiber-reinforced and geopolymer-stabilized clay soil. Constr. Build. Mater. 2021, 272, 121914. [Google Scholar] [CrossRef]
  31. Al-Subari, L.; Ekinci, A. Evaluation of Mechanical and Microstructural Properties of Waste Tire Improved Cemented Clay. J. Nat. Fibers 2024, 21, 2349750. [Google Scholar] [CrossRef]
  32. Habibi, A.A.; Tafti, M.F.; Narani, S.; Abbaspour, M. Effects of waste tire textile fibres on geotechnical properties of compacted lime-stabilized low plastic clays. Int. J. Geotech. Eng. 2021, 15, 1118–1134. [Google Scholar] [CrossRef]
  33. ASTM D422-63; Standard Method for Particle-Analysis of Soils. ASTM International: West Conshohocken, PA, USA, 2002.
  34. ASTM D2487-11; Standard Practice for Classification of Soils for Engineering Purposes. ASTM International: West Conshohocken, PA, USA, 2013.
  35. ASTM D423-66; Standard Test Method of Test for Liquid Limit of Soil. ASTM International: West Conshohocken, PA, USA, 1972.
  36. Das, B.M. Advanced Soil Mechanics; CRC Press: Boca Raton, FL, USA, 2013. [Google Scholar] [CrossRef]
  37. ASTM D 854-10; Standard Test Methods for Specific Gravity of Soil Solids by Water Pycnometer. ASTM International: West Conshohocken, PA, USA, 2010.
  38. AASHTO T 99; Standard Method of Test for Moisture-Density Relations of Soils Using a 2.5-kg (5.5-lb) Rammer and a 305-mm (12-in.) Drop. American Association of State Highway and Transportation Officials (AASHTO): Washington, DC, USA, 2022.
  39. ASTM C977-18; Standard Specification for Quicklime and Hydrated Lime for Soil Stabilization. ASTM International: West Conshohocken, PA, USA, 2018.
  40. Abbaspour, M.; Narani, S.S.; Aflaki, E.; Nejad, F.M. Dynamic characteristics of a sandy subgrade reinforced by waste tire textile fibres. Int. J. Pavement Eng. 2022, 23, 2293–2308. [Google Scholar] [CrossRef]
  41. Abbaspour, M.; Narani, S.S.; Aflaki, E.; Nejad, F.M.; Hosseini, S.M.M.M. Strength and swelling properties of a waste tire textile fiber-reinforced expansive soil. Geosynth. Int. 2020, 27, 476–489. [Google Scholar] [CrossRef]
  42. ASTM D885 -02(2017); Standard Test Methods for Tire Cords, Tire Cord Fabrics, and Industrial Filament Yarns Made from Manufactured Organic-Base Fibers. ASTM International: West Conshohocken, PA, USA, 2017.
  43. Jahandari, S.; Toufigh, M.M.; Li, J.; Saberian, M. Laboratory Study of the Effect of Degrees of Saturation on Lime Concrete Resistance Due to the Groundwater Level Increment. Geotech. Geol. Eng. 2018, 36, 413–424. [Google Scholar] [CrossRef]
  44. Abbaspour, M.; Narani, S.S.; Aflaki, E.; Nejad, F.M. Behavior of a Subgrade Soil Reinforced by Waste Tire Textile Fibers under Static and Cyclic Loading. J. Mater. Civ. Eng. 2020, 32, 04020208. [Google Scholar] [CrossRef]
  45. Morin, M.A.; Ficarazzo, F. Monte Carlo simulation as a tool to predict blasting fragmentation based on the Kuz–Ram model. Comput. Geosci. 2006, 32, 352–359. [Google Scholar] [CrossRef]
  46. Liu, J.; Feng, Q.; Wang, Y.; Zhang, D.; Wei, J.; Kanungo, D.P. Experimental Study on Unconfined Compressive Strength of Organic Polymer Reinforced Sand. Int. J. Polym. Sci. 2018, 2018, 3503415. [Google Scholar] [CrossRef]
  47. Saberian, M.; Jahandari, S.; Li, J.; Zivari, F. Effect of curing, capillary action, and groundwater level increment on geotechnical properties of lime concrete: Experimental and prediction studies. J. Rock Mech. Geotech. Eng. 2017, 9, 638–647. [Google Scholar] [CrossRef]
  48. Mohammadifar, L.; Miraki, H.; Rahmani, A.; Jahandari, S.; Mehdizadeh, B.; Rasekh, H.; Samadi, P.; Samali, B. Properties of Lime-Cement Concrete Containing Various Amounts of Waste Tire Powder under Different Ground Moisture Conditions. Polymers 2022, 14, 482. [Google Scholar] [CrossRef]
  49. Tang, L.; Cong, S.; Geng, L.; Ling, X.; Gan, F. The effect of freeze-thaw cycling on the mechanical properties of expansive soils. Cold Reg. Sci. Technol. 2018, 145, 197–207. [Google Scholar] [CrossRef]
  50. Park, S.-S. Effect of fiber reinforcement and distribution on unconfined compressive strength of fiber-reinforced cemented sand. Geotext. Geomembr. 2009, 27, 162–166. [Google Scholar] [CrossRef]
  51. Guleria, S.; Dutta, R. Effect of addition of tire chips on the unconfined compressive strength of fly ash-lime-gypsum mixture. Int. J. Geotech. Eng. 2012, 6, 1–13. [Google Scholar] [CrossRef]
  52. Singh, S.P.; Roy, N.; Sangita, S. Strength and hydraulic conductivity of sedimented ash deposits treated with lime column. Int. J. Geotech. Eng. 2017, 11, 217–224. [Google Scholar] [CrossRef]
  53. Yi, Y.; Gu, L.; Liu, S. Microstructural and mechanical properties of marine soft clay stabilized by lime-activated ground granulated blastfurnace slag. Appl. Clay Sci. 2015, 103, 71–76. [Google Scholar] [CrossRef]
  54. Bekhiti, M.; Trouzine, H.; Rabehi, M. Influence of Waste Tire Rubber Fibers on Swelling Behavior, Unconfined Compressive Strength and Ductility of Cement Stabilized Bentonite Clay Soil. Constr. Build. Mater. 2019, 208, 304–313. [Google Scholar] [CrossRef]
  55. Consoli, N.C.; Prietto, P.D.M.; Ulbrich, L.A. Influence of Fiber and Cement Addition on Behavior of Sandy Soil. J. Geotech. Geoenv. Eng. 1998, 124, 1211–1214. [Google Scholar] [CrossRef]
  56. Hejazi, S.M.; Sheikhzadeh, M.; Abtahi, S.M.; Zadhoush, A. A simple review of soil reinforcement by using natural and synthetic fibers. Constr. Build. Mater. 2012, 30, 100–116. [Google Scholar] [CrossRef]
  57. Duan, X.L.; Zhang, J.S. Mechanical Properties, Failure Mode, and Microstructure of Soil-Cement Modified with Fly Ash and Polypropylene Fiber. Adv. Mater. Sci. Eng. 2019, 2019, 9561794. [Google Scholar] [CrossRef]
  58. Tang, C.; Shi, B.; Gao, W.; Chen, F.; Cai, Y. Strength and mechanical behavior of short polypropylene fiber reinforced and cement stabilized clayey soil. Geotext. Geomembr. 2007, 25, 194–202. [Google Scholar] [CrossRef]
  59. Bearce, R.G.; Mooney, M.A. Seismic Modulus Maturity Function for Lime and Lime–Cement Stabilized Clay. J. Mater. Civ. Eng. 2016, 28, 4015150. [Google Scholar] [CrossRef]
  60. Consoli, N.C.; Samaniego, R.A.Q.; Villalba, N.M.K. Durability, Strength, and Stiffness of Dispersive Clay–Lime Blends. J. Mater. Civ. Eng. 2016, 28, 4016124. [Google Scholar] [CrossRef]
  61. Saldanha, R.B.; Consoli, N.C. Accelerated Mix Design of Lime Stabilized Materials. J. Mater. Civ. Eng. 2016, 28, 6015012. [Google Scholar] [CrossRef]
  62. Jahandari, S.; Li, J.; Saberian, M.; Shahsavarigoughari, M. Experimental study of the effects of geogrids on elasticity modulus, brittleness, strength, and stress-strain behavior of lime stabilized kaolinitic clay. GeoResJ 2017, 13, 49–58. [Google Scholar] [CrossRef]
  63. Ren, Q.; Ding, L.; Dai, X.; Jiang, Z.; De Schutter, G. Prediction of Compressive Strength of Concrete with Manufactured Sand by Ensemble Classification and Regression Tree Method. J. Mater. Civ. Eng. 2021, 33, 4021135. [Google Scholar] [CrossRef]
  64. Ghorbani, B.; Yaghoubi, E.; Arulrajah, A. Thermal and mechanical characteristics of recycled concrete aggregates mixed with plastic wastes: Experimental investigation and mathematical modeling. Acta Geotech. 2022, 17, 3017–3032. [Google Scholar] [CrossRef]
  65. Buckingham, E. On Physically Similar Systems; Illustrations of the Use of Dimensional Equations. Phys. Rev. B 1914, 4, 345–376. [Google Scholar] [CrossRef]
  66. Langhaar, H.L. Dimensional Analysis and Theory of Models; Wiley: New York, NY, USA, 1951. [Google Scholar]
  67. Love, J.P. Model Testing of Geogrids in Unpaved Roads. Ph.D. Thesis, University Oxford, Oxford, UK, 1984; p. 219. [Google Scholar]
  68. Fakher, A.; Jones, C. A New Unit-Cell to Study the Deformation Mechanism of Super Soft Clay Overlaid by Geogrid and Sand. Geosynth. Int. 1996, 3, 349–367. [Google Scholar] [CrossRef]
  69. Fakher, A. Laboratory and Analytical Investigation into Construction over Super Soft Clays. Ph.D. Thesis, University of Newcastle upon Tyne, Newcastle upon Tyne, UK, 1997. [Google Scholar]
  70. El-Emam, M.M.; Bathurst, R.J. Influence of reinforcement parameters on the seismic response of reduced-scale reinforced soil retaining walls. Geotext. Geomembr. 2007, 25, 33–49. [Google Scholar] [CrossRef]
  71. Tafreshi, M.S.N.; Mehrjardi, G.T.; Ahmadi, M. Experimental and numerical investigation on circular footing subjected to incremental cyclic loads. Int. J. Civ. Eng. 2011, 9, 265–274. [Google Scholar]
  72. Di Filippo, G.; Casablanca, O.; Biondi, G.; Cascone, E. Calibration of a large shaking table equipment for testing geotechnical physical models under plane strain conditions. Soil Dyn. Earthq. Eng. 2023, 166, 107726. [Google Scholar] [CrossRef]
  73. Ma, W.; Yang, Y.; Yang, W.; Lv, C.; Yang, J.; Song, W.; Sun, H.; Zhang, L.; Zhang, K.; Yao, J. Digital Rock Mechanical Properties by Simulation of True Triaxial Test: Impact of Microscale Factors. Geotechnics 2023, 3, 3–20. [Google Scholar] [CrossRef]
  74. Ye, H.; Zhu, S.; Pan, J.; Zhong, C.; Han, C.; Jia, Y. Study on scale effect and particle crushing characteristics of continuously graded coarse-grained soil. Eur. J. Environ. Civ. Eng. 2024, 28, 2475–2506. [Google Scholar] [CrossRef]
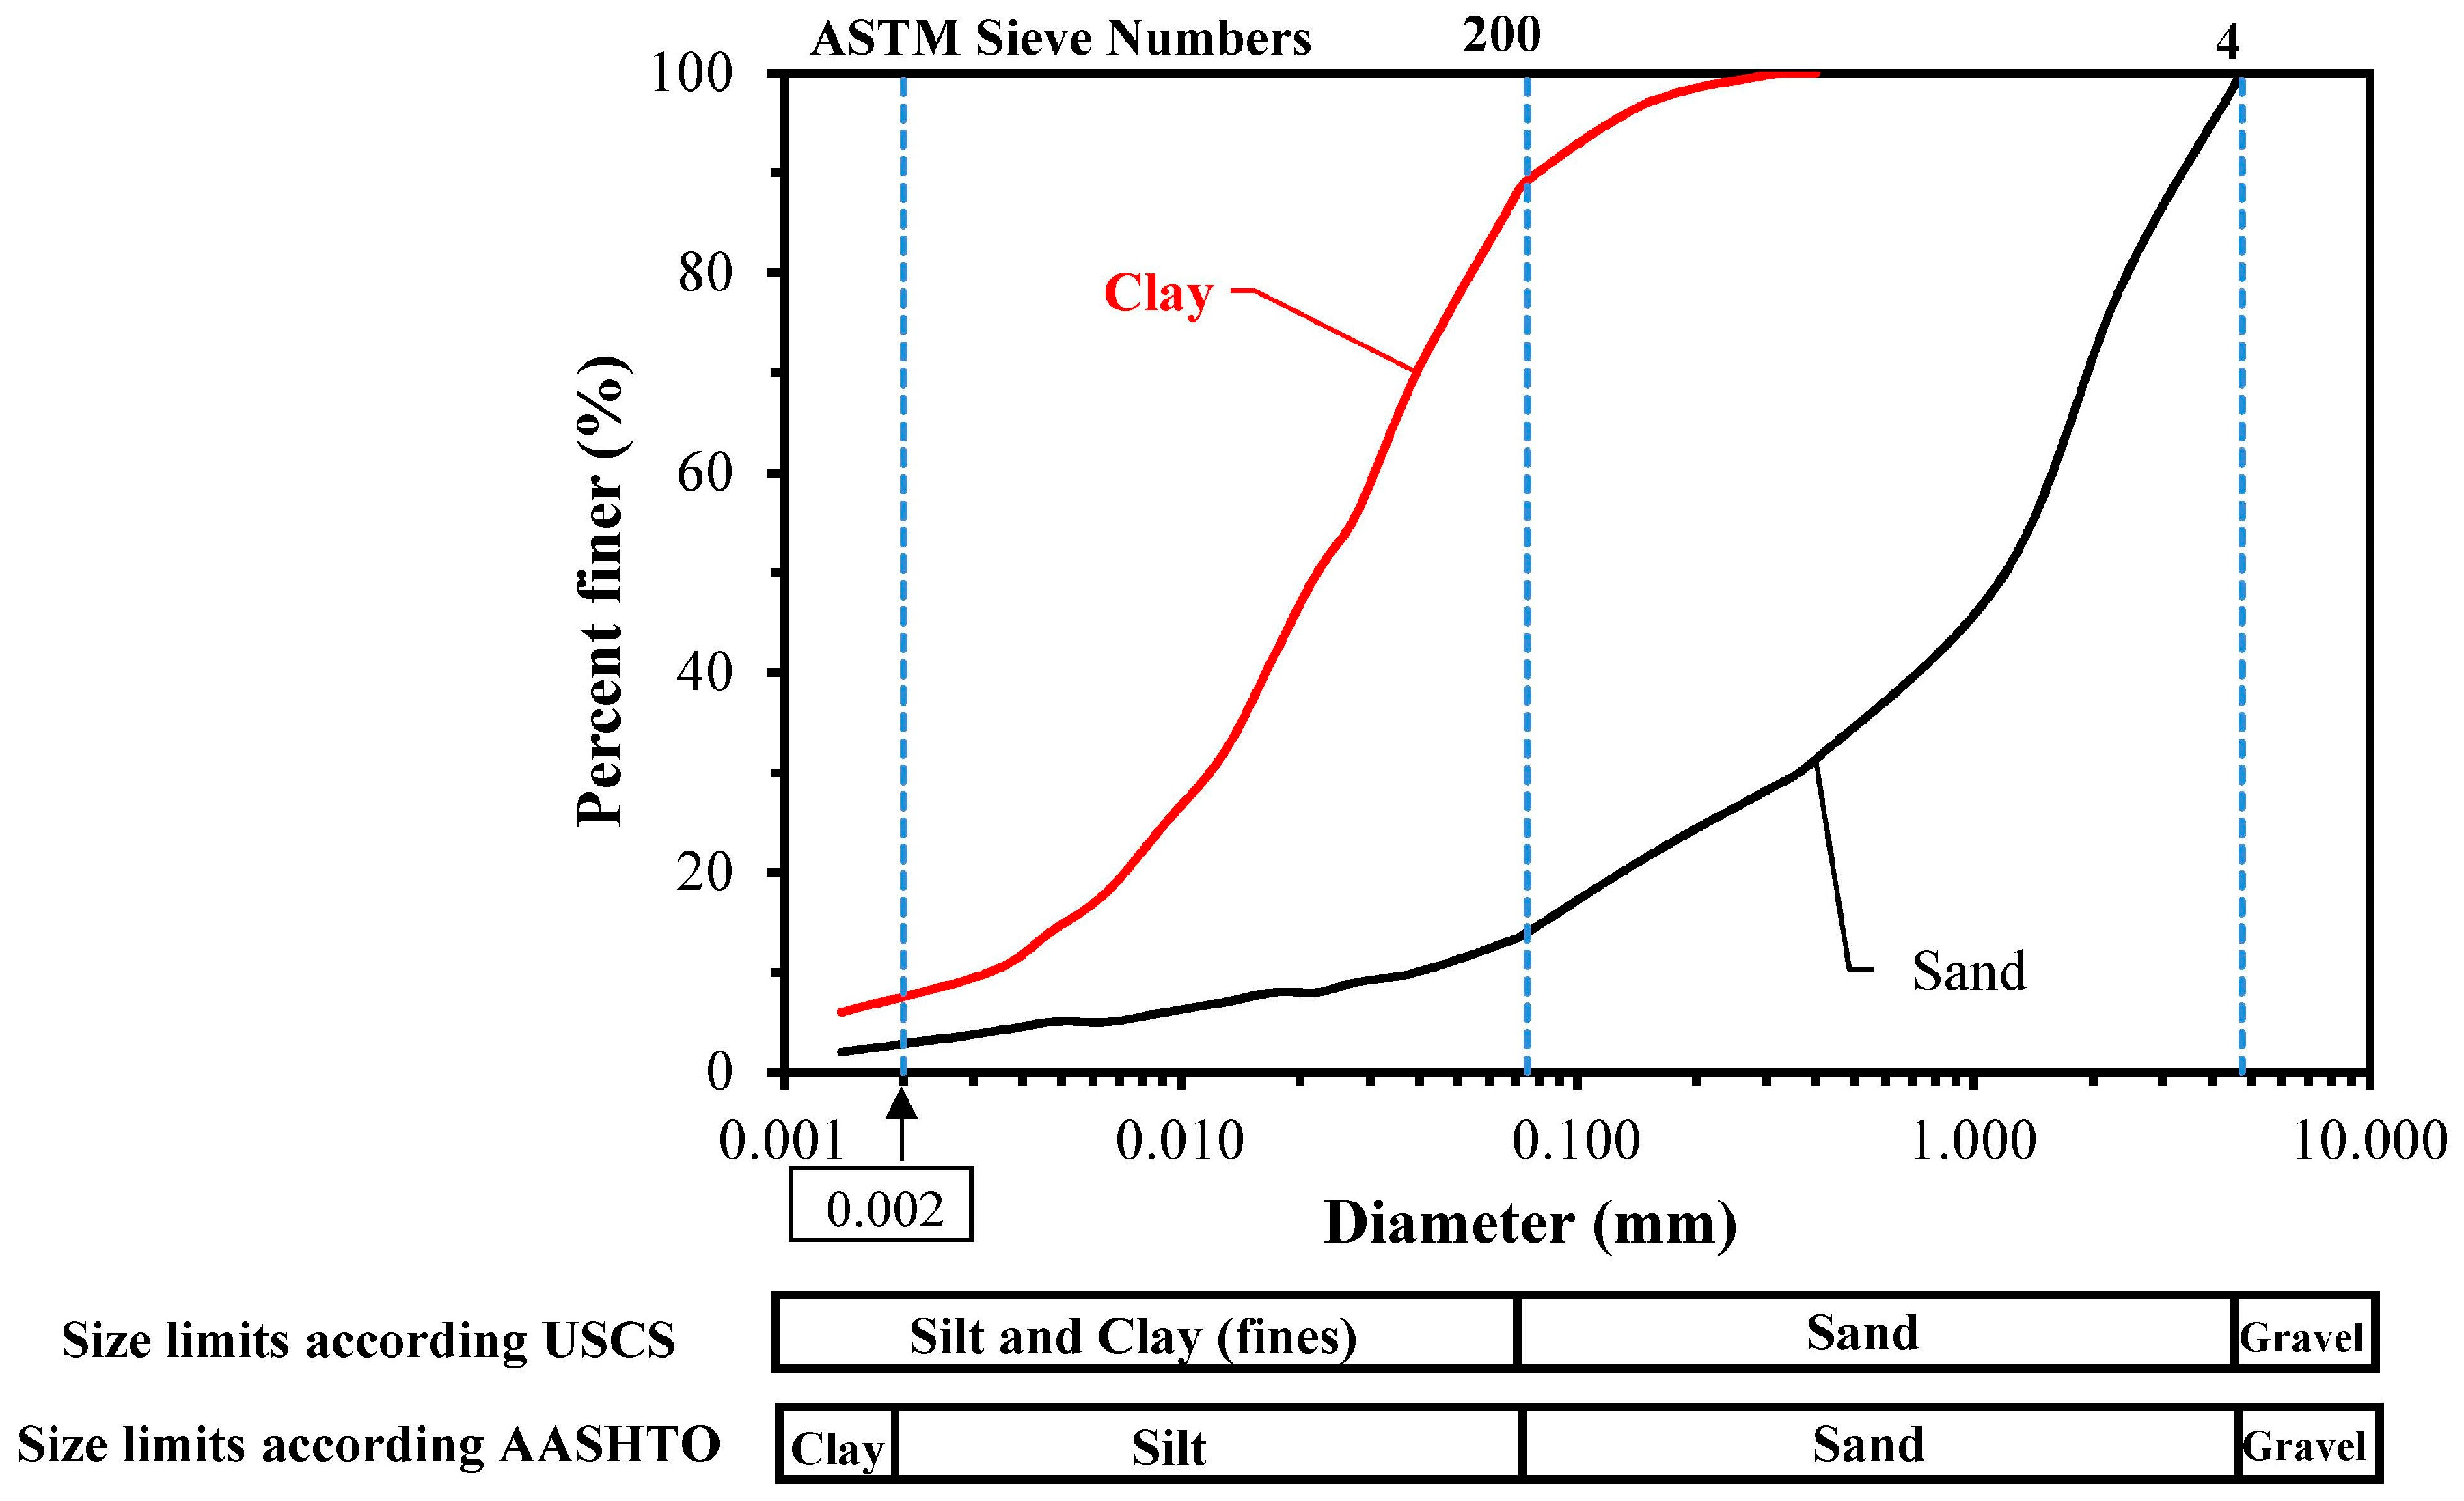
Figure 1. The particle size distribution in soils.
Buildings 15 00382 g001
Figure 2. Raw materials used in the present study.
Buildings 15 00382 g002
Figure 3. Stages of preparing the untreated sand for the UCS test. (a) Compaction mold and hammer, and (b) the rubber film inside the mold.
Buildings 15 00382 g003
Figure 4. PVC molds and the opening at the embedded glass base used for sample preparation.
Buildings 15 00382 g004
Figure 5. The stress–strain plot of control samples. (A,B) Initial Compression Region, (B,C) Linear Region, (C,D) Nonlinear Region, and (D,E) Failure Region.
Buildings 15 00382 g005
Figure 6. The stress–strain diagrams obtained using UCS testing of samples in different curing temperatures and different curing ages.
Buildings 15 00382 g006
Figure 7. The effect of the fiber content, age, and curing temperature on the modulus of elasticity of the cured samples at (a) 30 °C and (b) 60 °C.
Buildings 15 00382 g007
Figure 8. SEM images: (a,d) the sandy soil, (b,c) Pozzolanic Products (PP), and (e,f) surrounded Fiber and pozzolanic products.
Buildings 15 00382 g008
Figure 9. The failure pattern of samples (a) wide and long cracks in samples without fibers, (b) and (c) non-continuous, short and narrow cracks due to the use of 0.4% and 2.5% of fibers, respectively.
Buildings 15 00382 g009
Figure 10. Plots of FC/CD versus (a) the UCS and (b) the modulus of elasticity using 80% of the data for developing the model.
Buildings 15 00382 g010
Figure 11. The steps taken for developing the mathematical model. (a) Predictive models for each curing temperature, Calculation of (b) f(T) and (c) g(T) as functions of curing temperature.
Buildings 15 00382 g011
Figure 12. Plots of the predicted versus the observed (a) UCS and (b) the modulus of elasticity for the 20% validation.
Buildings 15 00382 g012
Table 2. Physical parameters of clay and sand.
PropertiesClaySandReference
% finer than 4.75 mm100%100%[33]
% finer than 75 μm89.2%14%[33]
Classification (USCS)CLSM[34]
Effective Particle Size (D10)0.0033 mm0.0395 mm[33]
Average Particle Size (D50)0.022 mm1.190 mm[33]
Coefficient of Uniformity (Cu)-41.1[33]
Coefficient of Curvature (Cc)-2.0[33]
Liquid Limit (LL)33%-[35]
Plasticity Index (PI)12%-[36]
Specific Gravity (Gs)2.7272.673[37]
γdmax − ωopt18.38 kN/m3—15.9%16.04 kN/m3—12.9%[38]
Table 3. Compositions of clay, sand, cement, and lime used (percentage of total weight).
Available OxidesClay (%)Sand (%)Cement (%)Lime (%)
CaO63.419.719.0562.96
SiO221.6656.941.754.78
Al2O34.2113.214.473.90
Fe2O33.104.77.081.21
MgO2.821.71.403.97
SO32.610.10.030.016
Mn-0.07-0.006
LOI *0.818.4813.4823.15
* LOI = Loss on ignition.
Table 4. Physical and technical characteristics of the RTFs.
CharacteristicValuesUnitReference
The Most FrequentTypical Range
Diameter0.750.03–1.50mm[42]
Length20–300–60mm[42]
Elongation at break1311–17%[42]
Elastic modulus4.64.3–4.8GPa[42]
Water absorption94–14%[42]
Melting point255250–260°C[42]
Table 5. Composition of the mixtures used in this study.
GroupAbb.CTFCCANOSCement
(% DWM)
Lime
(% DWM)
1SM30014300
2LC30014303
3CC30014340
4LCC30014343
5RLCC-30300-0.4-1-1.7-2.53-7-14-21-28-45-9010543
6RLCC-35350-0.4-1-1.7-2.53-7-14-21-28-45-9010543
7RLCC-40400-0.4-1-1.7-2.53-7-14-21-28-45-9010543
8RLCC-45450-0.4-1-1.7-2.53-7-14-21-28-45-9010543
9RLCC-50500-0.4-1-1.7-2.53-7-14-21-28-45-9010543
10RLCC-55550-0.4-1-1.7-2.53-7-14-21-28-45-9010543
11RLCC-60600-0.4-1-1.7-2.53-7-14-21-28-45-9010543
Abb. = abbreviation; CT = curing temperature (°C); FC = fiber content (% of total dry weight of materials); CA = curing age (day); NOS = number of samples; CC = cement concrete; LC = lime concrete; LCC = lime–cement concrete; and RLCC = reinforced lime–cement concrete; % DWM = % dry weight of materials.
Table 6. Calculated strength properties from the UCS tests in 14- and 28-day samples cured at 30 °C and 60 °C with different fiber contents.
Fiber Cont. (%)Curing Age (Day)UCS (MPa)Es (MPa)
30 °C60 °C30 °C60 °C
0140.961.84103.2292.8
0.4141.041.8373.0288.2
1.0140.891.5666.7162.5
1.7140.831.4660.2152.4
2.5140.771.2954.6109.1
0281.342.39125.7415.5
0.4281.332.0383.0400.3
1.0281.331.6672.4221.5
1.7280.971.5870.8213.5
2.5280.901.4458.9158.5
Table 7. UCS (MPa) prediction models for stabilized and reinforced sandy soil cured at T °C as a function of the ratio (FC/CD).
Predictive Mathematical ModelT °CR2
UCS = 0.499 × (FC/CD)−0.237300.955
UCS = 0.556 × (FC/CD)−0.240350.950
UCS = 0.592 × (FC/CD)−0.252400.950
UCS = 0.716 × (FC/CD)−0.224450.942
UCS = 0.810 × (FC/CD)−0.202500.925
UCS = 0.891 × (FC/CD)−0.183550.949
UCS = 1.033 × (FC/CD)−0.154600.975
Table 8. Es (MPa) prediction models for stabilized and reinforced sandy soil cured at T °C as a function of the ratio (FC/CD).
Predictive Mathematical ModelT °CR2
Es = 40.802 × (FC/CD)−0.170300.926
Es = 45.779 × (FC/CD)−0.199350.910
Es = 41.602 × (FC/CD)−0.274400.945
Es = 44.900 × (FC/CD)−0.325450.949
Es = 48.444 × (FC/CD)−0.353500.955
Es = 52.818 × (FC/CD)−0.407550.973
Es = 54.471 × (FC/CD)−0.456600.981
Table 9. Comprehensive functions predicting the mechanical behavior of stabilized and reinforced sand at different curing days, temperatures, and with different fiber contents.
PropertyPredictive Mathematical ModelR2
UCS UCS (MPa) = (0.01 × T1.058) × (FC/CD)(0.003T − 0.35)0.95
Modulus of ElasticityEs (MPa) = (10.51 × T0.395) × (FC/CD)(−0.0098T + 0.1275)0.97
Disclaimer/Publisher’s Note: The statements, opinions and data contained in all publications are solely those of the individual author(s) and contributor(s) and not of MDPI and/or the editor(s). MDPI and/or the editor(s) disclaim responsibility for any injury to people or property resulting from any ideas, methods, instructions or products referred to in the content.

