Article

A Deformation Prediction Model for Concrete Dams Based on RSA-VMD-AttLSTM

1
The National Key Laboratory of Water Disaster Prevention, Hohai University, Nanjing 210098, China
2
College of Water Conservancy and Hydropower Engineering, Hohai University, Nanjing 210098, China
3
National Engineering Research Center of Water Resources Efficient Utilization and Engineering Safety, Hohai University, Nanjing 210098, China
*
Author to whom correspondence should be addressed.
Buildings 2025, 15(3), 357; https://doi.org/10.3390/buildings15030357
Submission received: 30 October 2024 / Revised: 18 January 2025 / Accepted: 22 January 2025 / Published: 24 January 2025

Abstract

This paper presents a deformation prediction model for concrete dams that integrates a reptile search algorithm (RSA), a Variational Mode Decomposition (VMD) algorithm, and a long short-term memory network model with attention mechanism (AttLSTM). This model utilizes the RSA to optimize the parameters K and α of the VMD algorithm. It combines the variance of the modified mode with the sample entropy of these data as the objective function, effectively converting monitoring data into a stable signal while retaining essential characteristic variation. Data are reformatted into a three-dimensional structure and partitioned into training and testing sets. The AttLSTM network was applied to forecast deformation, and results were validated using practical engineering cases. The performance of the proposed model was compared against that of four other models: LSTM, VMD-LSTM, attention LSTM, and VMD-AttLSTM models. Analysis of the five evaluation criteria revealed that the RSA can better optimize the parameters of the VMD algorithm. Consequently, the proposed model demonstrates superior noise reduction capabilities and improved prediction accuracy.

1. Introduction

Deformation is a critical indicator of dam safety monitoring [1]. Deformation data provide an intuitive reflection of dam operational behavior and are frequently utilized to assess a dam’s safety status [2,3]. However, as the service life of a dam increases, the high-frequency collection of safety monitoring data and environmental interference with sensors [4] lead to challenges such as large data volumes and significant noise pollution. These issues hinder accurate diagnosis of dam safety [5,6].
Traditional statistical models for dam deformation prediction typically account for hydrostatic, seasonal, and temporal effects [7]. With advancements in computer technology, deterministic models based on finite element simulations [8] and hybrid models [9,10,11] have gained widespread application. In recent years, artificial intelligence algorithms, such as machine learning and deep learning, have been successively introduced into dam deformation prediction models, which greatly improve the prediction accuracy and generalization ability of these models. Gu et al. [12] used an optimized random forest model to deeply excavate the deformation monitoring factors of concrete dams. Zhang et al. [13] established an online learning prediction model based on an OS-ELM algorithm using the mean squared variance estimation with the forgetting mechanism and established a comprehensive evaluation system involving point prediction and interval prediction. Song et al. [14] coupled the tree-structure Bayesian optimization algorithm (TPE) and the seasonal and trend decomposition (STL) of the yellow diagram combined with the long short-term memory network model (LSTM) to realize the automatic modeling of multiple measurement points of concrete dams. Pan et al. [15] proposed a uniform and scalable spatio-temporal deformation field model for arch dams based on a convolutional neural network (CNN) that greatly improved the deformation prediction accuracy of arch dams. Despite significant advancements in computational efficiency and prediction accuracy, these models exhibit limitations in handling noisy data, with room for improvement in noise resistance and robustness. Furthermore, these models primarily emphasize the training and fitting of data sample sets, often neglecting the preprocessing and in-depth analysis of monitoring data. This focus results in limitations in effectively capturing the intrinsic characteristic information of these data.
In view of the complexity and large amount of dam monitoring data, VMD has gradually become a key method for processing and analyzing dam monitoring data. VMD has a better effect on data noise reduction and retaining the original characteristics of data. Lu et al. [16] introduced a denoising method combining adaptive variational mode decomposition (AVMD) and improved multi-channel singular spectral analysis (MSSA), which has strong denoising ability. Fang et al. [17] employed variational mode decomposition (VMD) to decompose modes into deformation subsequences and combined it with an improved deep residual network (ResNetPlus) and bidirectional neural network (BiLSTM) to address network degradation, ultimately developing an intelligent dam deformation prediction model. Yang et al. [18] used VMD to decompose monitoring data at the early stage of dam impoundment combined with a time convolution network (TCN) to iteratively learn and train the trend, and induced components in displacement monitoring data to accurately predict the deformation of the dam foundation. Cao et al. [19] innovatively proposed the use of sample entropy (SE) to determine the decomposition modulus in VMD decomposition and utilize an extreme learning machine (ELM) based on parameter optimization to predict the subsequence and reflect characteristics of original data. The selection of parameters for VMD is critical in practical applications, as inaccuracies can lead to either over-decomposition or under-decomposition of data [20]. The primary parameters of VMD are the number of modes K and the second-order penalty factor ( α ). An excessively large K value leads to over-decomposition, resulting in redundant modes, while a too-small value may cause under-decomposition, mixing high-frequency and low-frequency information within the same mode, which can lead to information loss. The second-order penalty term coefficient significantly influences the denoising level and smoothness of VMD decomposition. Therefore, optimizing the parameters of VMD reasonably is the key to improving the noise reduction efficiency of VMD decomposition.
Therefore, this paper proposes a VMD-AttLSTM model based on RSA optimization, which optimizes parameters K and α in VMD through an RSA, and takes the variance and sample entropy of smoothed data as the objective function. Optimized VMD decomposition reduces the noise of the original monitoring data and preserves their complex features. An LSTM model equipped with an attention mechanism was employed to weight the modes obtained from VMD decomposition, and subsequently, the dataset was divided into training and testing sets for modeling and prediction. By calculating four distinct evaluation metrics and comparing them with similar models, this study validated the proposed model’s denoising capability, predictive accuracy, and applicability.

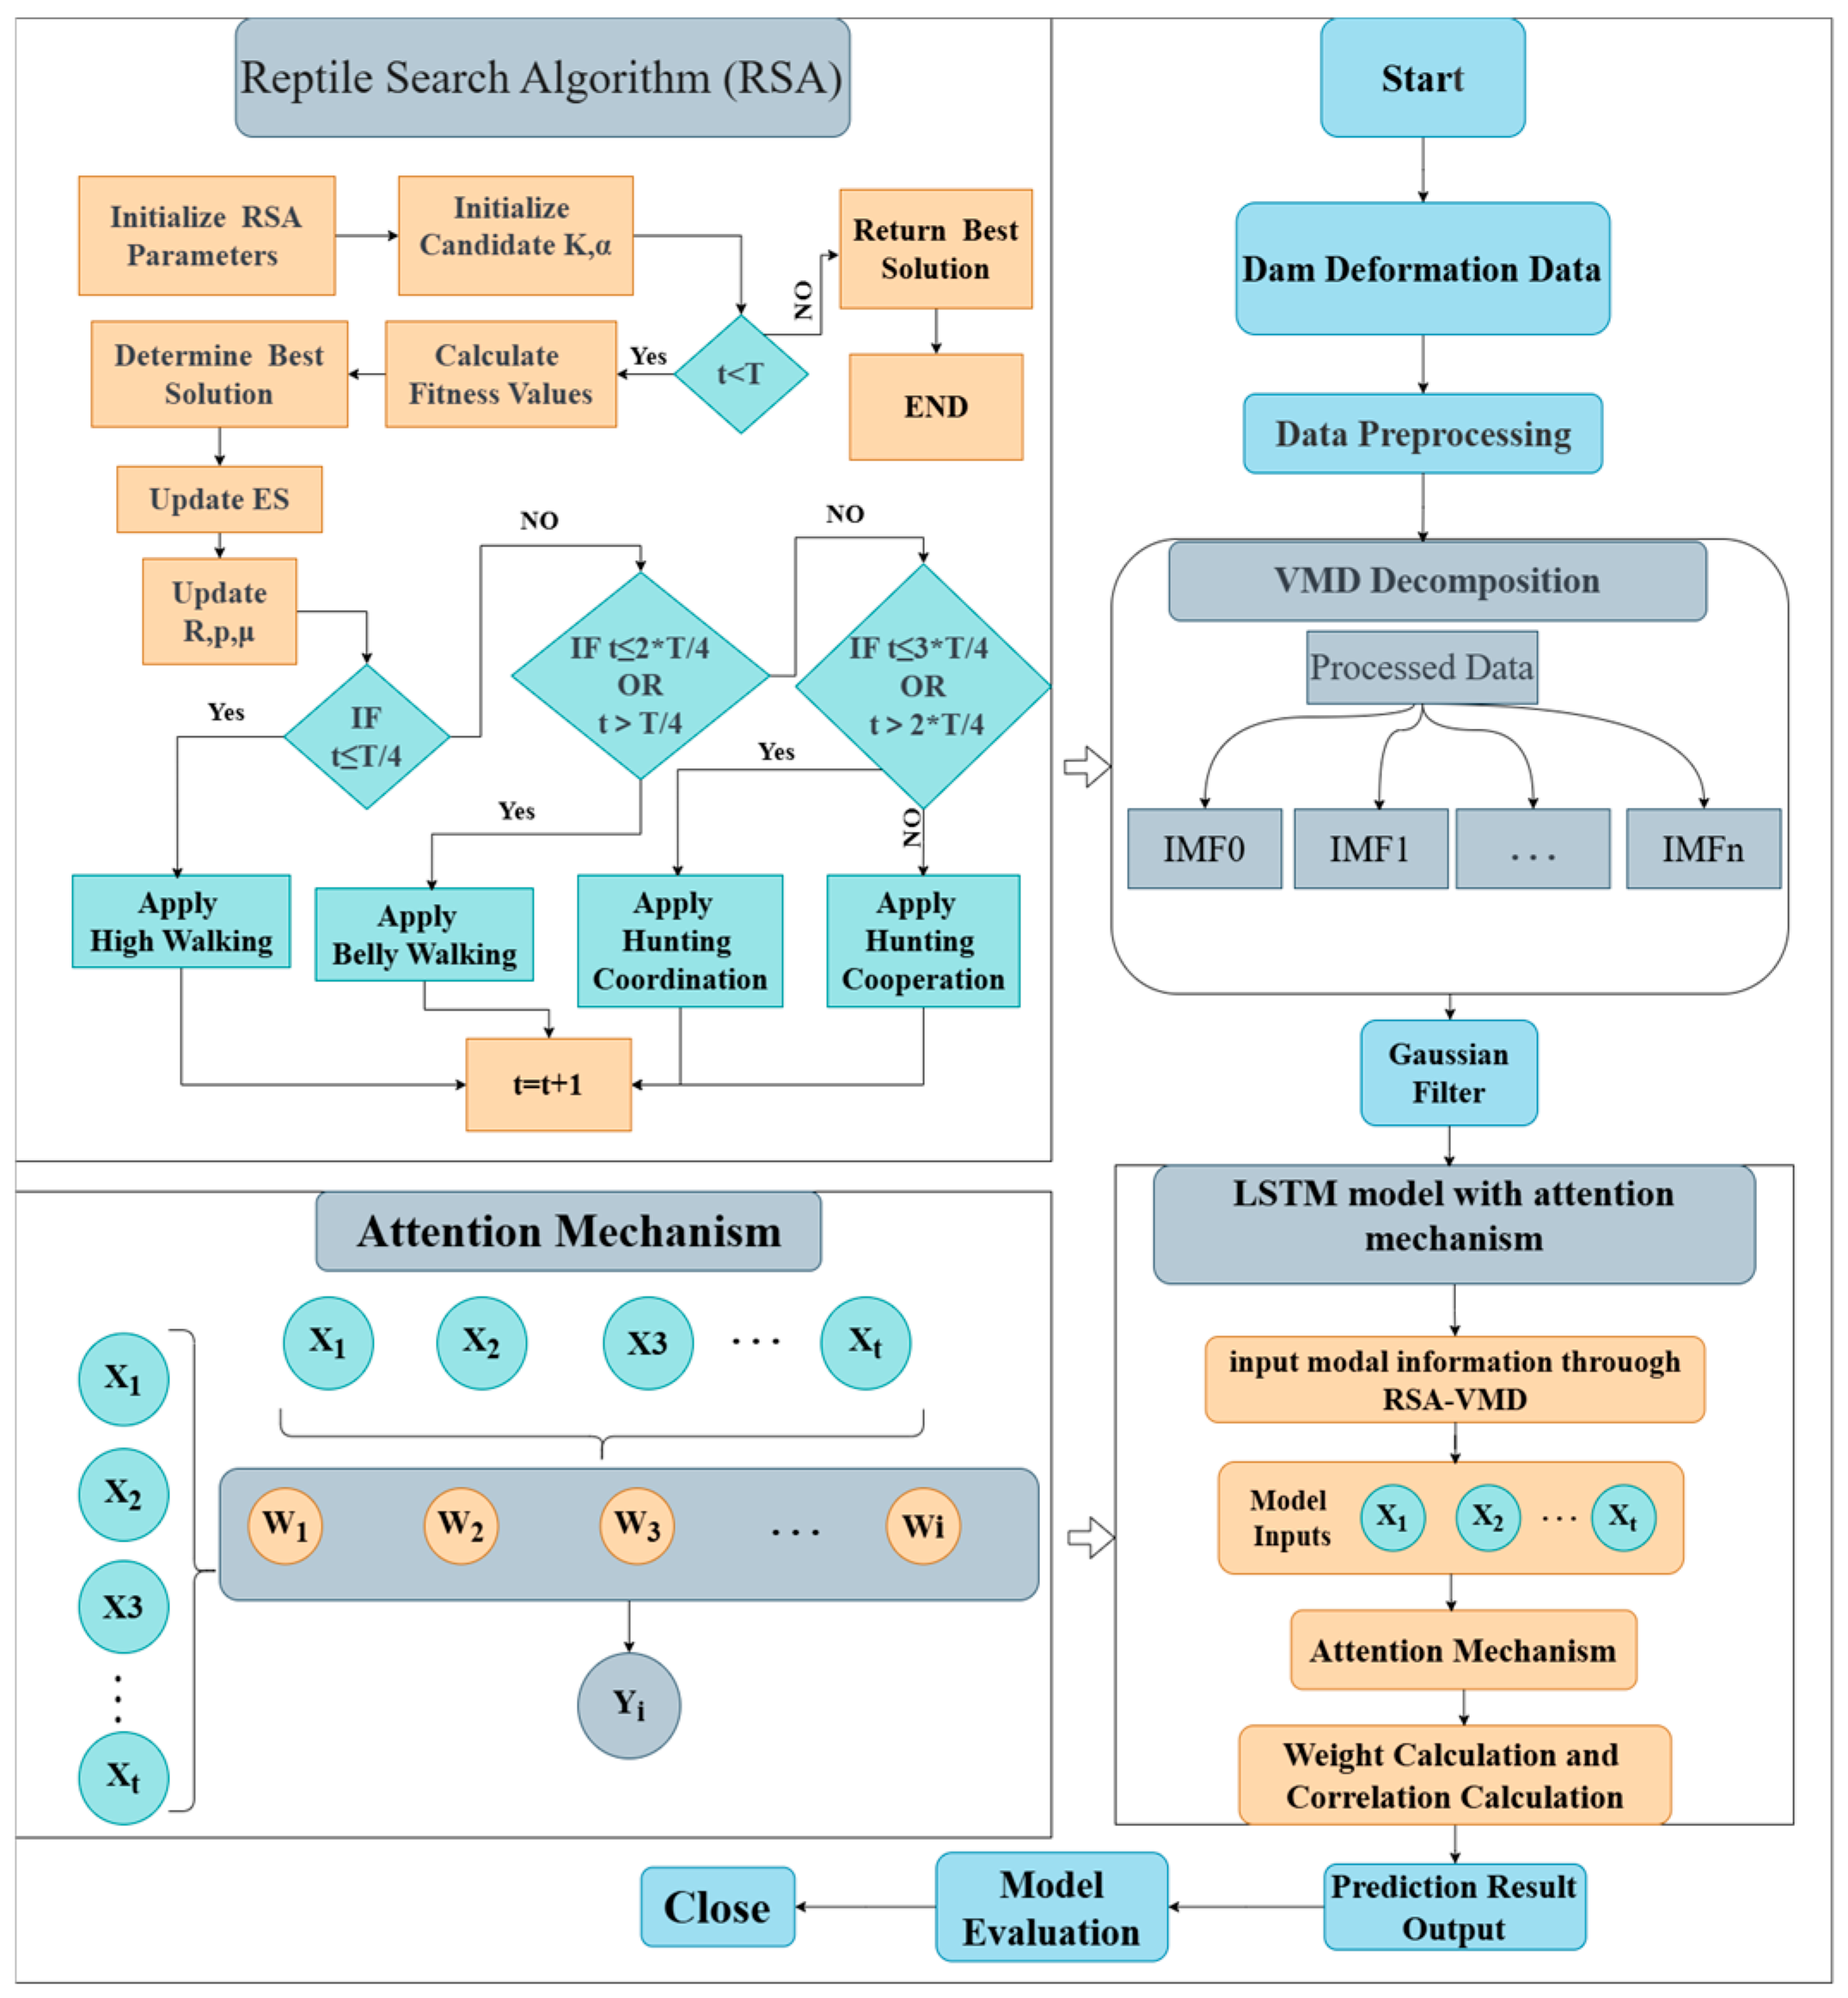
2. Fundamentals of a Deformation Prediction Model for Concrete Dams Based on RSA-VMD-AttLSTM

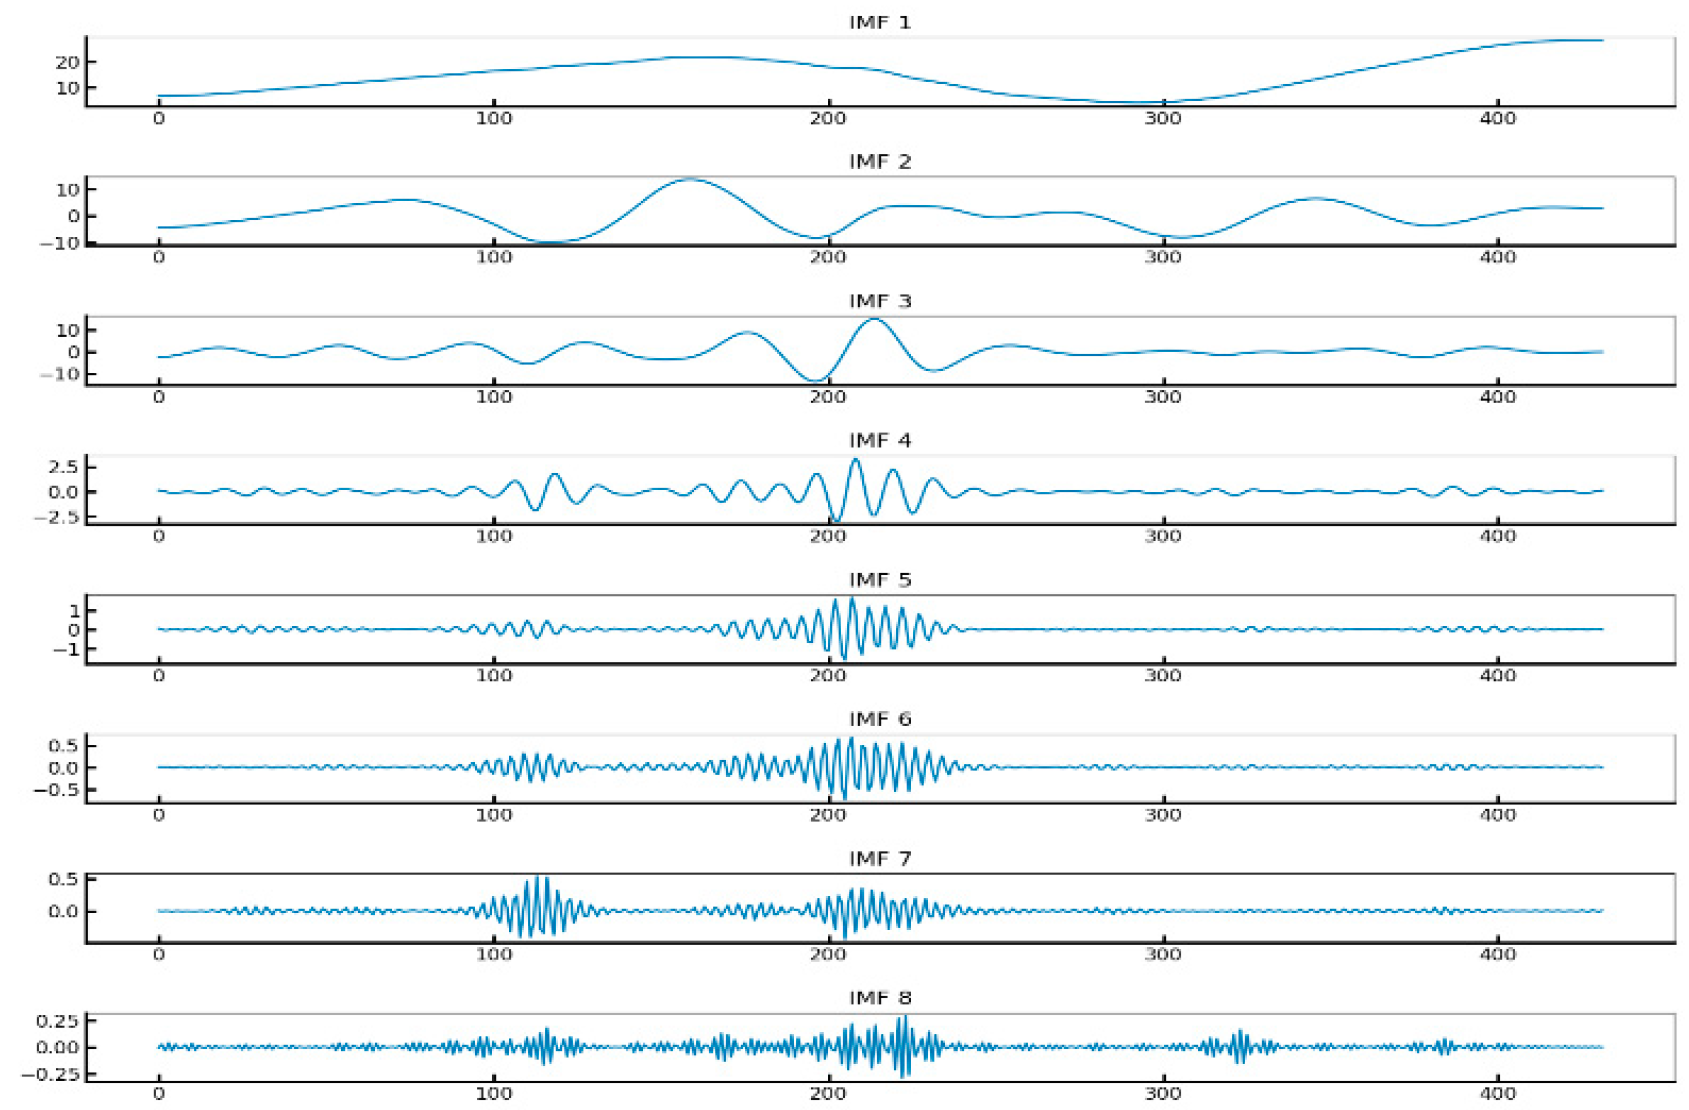
2.1. VMD Metamodal Decomposition

VMD is an adaptive signal processing method that was proposed by Dragomiretskiy in 2014 [21]. It is mainly used to decompose complex signals into several intrinsic mode functions (IMFs) that possess physical significance, facilitating the extraction of low-frequency and high-frequency patterns for signal analysis and processing [22]. Unlike traditional decomposition methods such as empirical mode decomposition (EMD), VMD employs a variational optimization framework to directly decompose the signal in the frequency domain. The mathematical model of VMD can be expressed as follows:
min μ k , ω k k t δ t + j π t × μ k t e j ω t 2 2 f = k = 1 K μ k
where μ k = μ 1 , μ 2 , μ k ,   k = 1 , 2 , , K represents the set of modes; ω k = ω 1 , ω 2 , , ω k ,   k = 1 , 2 , , K denotes the center frequency of each modal component; f is the original signal; K indicates the number of modes; t is a partial derivative; δ t is the Dirac delta function; and ω represents frequency. In order to reconstruct the constraints, the Lagrange multiplier λ and the second-order penalty factor α are introduced to find the optimal solution, the Lagrange multiplier is used to strengthen the constraints, while the secondary penalty factor is used to enhance the convergence. The augmented Lagrangian expressions are as follows:
L μ k , ω k , λ = α k t δ t + j π t μ k t e j ω k t 2 2 + f t k μ k t 2 2 + λ t , f t k μ k t
By introducing the Lagrange multiplier and the second-order penalty factor, the original optimization problem is transformed into the alternating direction method of Multipliers (ADMM) [23], and the iteration equations are as follows:
μ ^ k n + 1 ω = f ^ ω i k μ ^ i ω + λ ^ ω 2 1 + 2 α ω ω k 2
ω k n + 1 = 0 ω μ ^ k ω 2 d ω 0 μ ^ k ω 2 d ω
λ ^ n + 1 ω λ ^ n ω + τ f ^ ω k μ ^ k n + 1 ω
Among these, τ represents noise and the VMD algorithm n 0 is continuously iteratively generated from the beginning,  μ ^ k n + 1 , ω ^ k n + 1 , and at the same time, λ ^ n + 1 is constantly updated until the following convergence conditions are reached:
k μ ^ k n + 1 μ ^ k n 2 2 / μ ^ k n 2 2 < ε
where ε denotes the convergence tolerance limit. Upon reaching the convergence condition, VMD will produce K intrinsic mode functions.

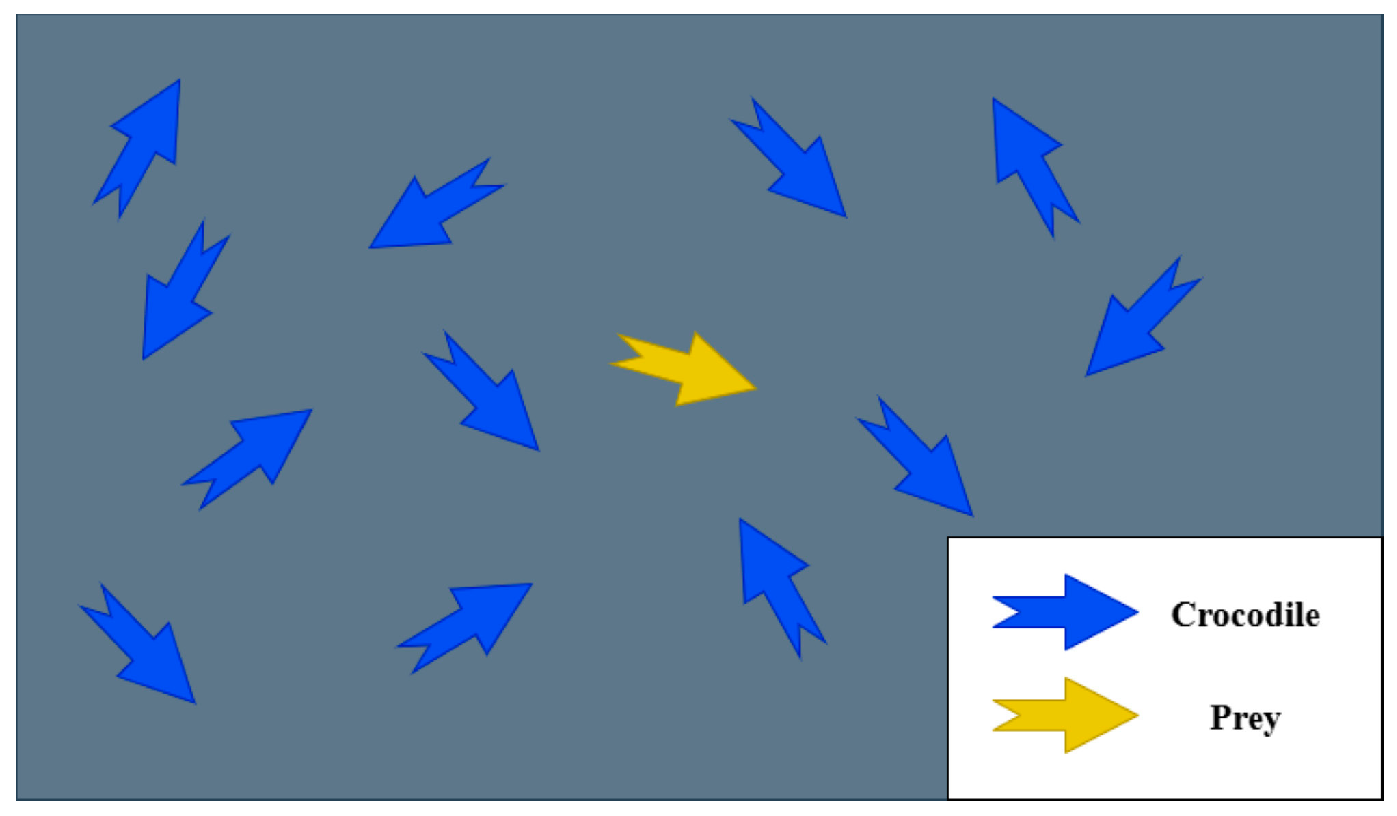
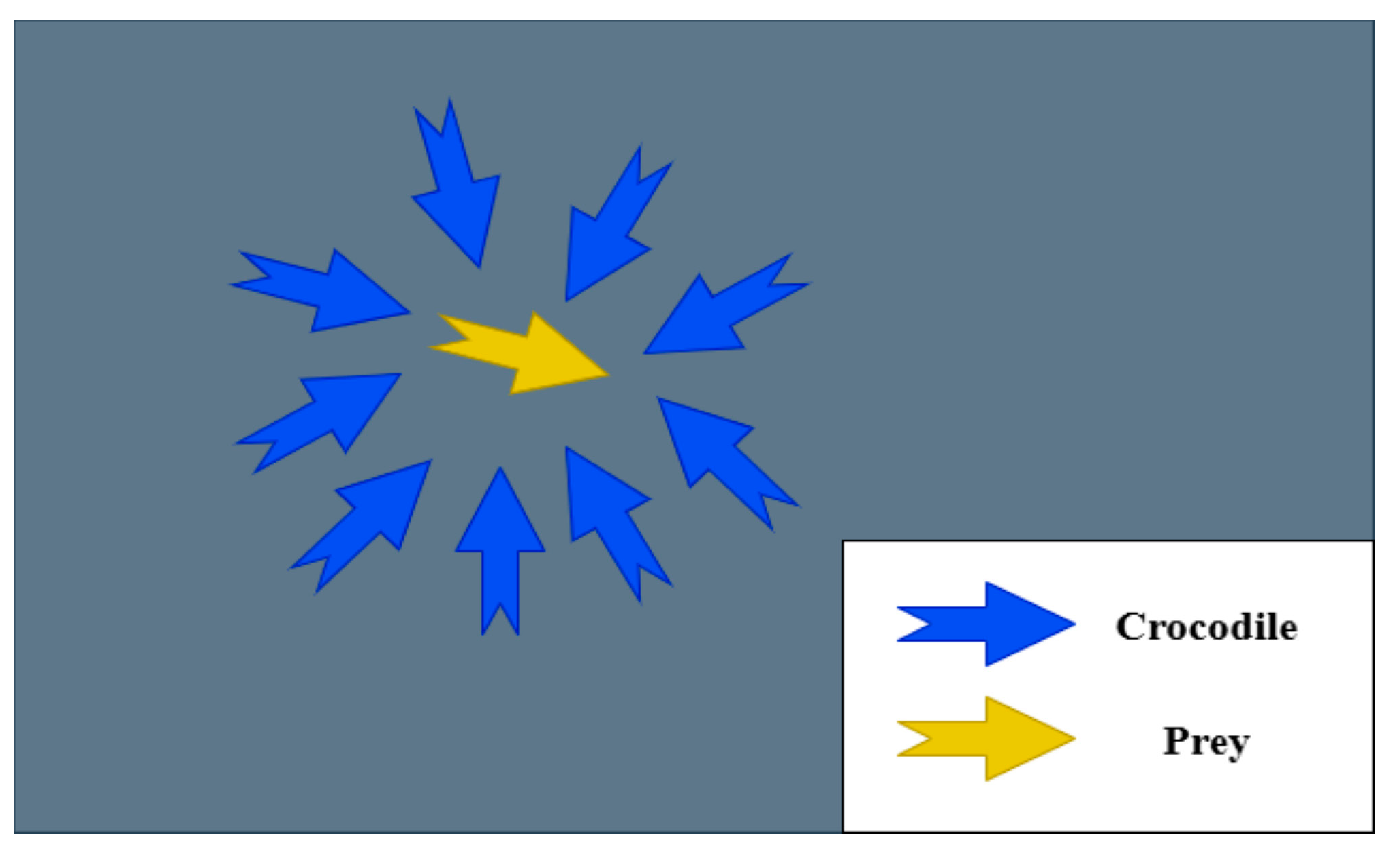
2.2. Reptile Search Optimization Algorithm

The RSA is a nature-inspired meta-heuristic optimizer derived from the encirclement and hunting behavior of crocodiles in nature [24]. The RSA consists of three phases, namely “initialization-encirclement-hunting”. The core of the algorithm is to search and find a better solution by simulating the two encircling movements of the crocodile. Initially, a set of candidate solutions is randomly generated, and the algorithm simultaneously implements the searching and encircling processes based on the crocodile’s two search modes, ultimately employing a hunting mechanism to lock in the optimal solution. In the application of dam deformation prediction, the RSA effectively optimizes model parameters, enabling better fitting of the complex features within monitoring data, thus enhancing the accuracy of deformation predictions. Compared to other intelligent algorithms, the RSA is more dynamic and efficient, allowing for transitions between the encircling (exploration) and hunting (exploitation) phases, which strengthen the algorithm’s robustness against noise in dam deformation monitoring data. Research by Sasmal et al. [25] demonstrates that the RSA has a more efficient convergence rate and faster execution time. The stages of the RSA are as follows:
(1) Initialization stage
At this stage, the RSA randomly generates a set of candidate solutions X, and the best solution obtained in each iteration is considered nearly optimal.
X = x 1 , 1 x 1 , j x 1 , n 1 x 1 , n x 2 , 1 x 2 , j x 2 , n x i , j x N 1 , 1 x N 1 , j x N 1 , n x N , 1 x N , J x N , n 1 x N , n
where X represents a set of candidate solutions randomly generated by Equation (8); x i , j denotes the i t h position of the j t h solution; N is the number of candidate solutions; and n refers to the dimensionality of the given problem.
x i , j = r a n d × U B L B + L B , j = 1 , 2 , , n
where r a n d is a random value and L B and U B represent the lower and upper bounds of a given problem, respectively.
(2) Encirclement phase (Exploration)
This phase represents the exploration behavior of the RSA. Crocodiles exhibit two types of walking modes during the search and hunting process: the high walk and the belly walk. The high walk refers to the crocodile’s ability to maintain its legs in a more straight and direct position beneath its body when moving rapidly, while the belly walk refers to the slow movement of crocodiles when hunting. These two displacement modes represent the algorithm’s search for the global optimal solution and the locking of the current optimal solution, respectively. The exploration mechanism of the RSA is based on these two primary search strategies (the high walk strategy and the belly walk strategy), which are used to explore the search space and methods to find better solutions. These strategies allow the RSA to transition between the encircling (exploration) phase and the hunting (exploitation) phase. This transition between these two behaviors is determined by four conditions, dividing the iterative process into four stages. The specific condition is the relationship between the current iteration number and the maximum iteration number. The algorithm gradually shifts from emphasizing a global search to achieving a balance between exploration and exploitation of the search space, ultimately determining the optimal solution through local search and fine-tuning. The high walking strategy is constrained to t T 4 , while belly walking is confined to t 2 T 4 ,   t > T 4 . The position update equation for the search is as follows:
x i , j t + 1 = B e s t j t × η i , j t × β R i , j t × r a n d ,             t T 4 B e s t j t × x r 1 , j × E S t × r a n d ,                   t 2 T 4   a n d   t > T 4
where t is the number of the current iteration; T is the maximum number of iterations; B e s t j t represents the j t h position of the current best solution; r a n d denotes a random number between 0 and 1; t is the current iteration; T is the maximum number of iterations; n i , j represents the optimization operator for the j t h position in the i t h solution, which is calculated by Equation (10); β is a sensitive parameter that controls the exploration accuracy of the orbiting phase in the iteration process, which is fixed at 0.1 to maintain a high exploration accuracy; the reduce function R i , j is used to limit the search area, which is calculated by Equation (11); r 1 is a random number between 1 and N ; x r 1 , j represents an i t h solution at a random position; N is the number of candidate solutions; and E S t is the probability ratio, which takes values between −2 and 2 in a decreasing manner, and is computed by Equation (12).
η i , j = B e s t j t × P i , j
R i , j = B e s t j t x r 2 , j B e s t j t + ε
E S t = 2 × r 3 × 1 1 T
where ε is a small variable; r 2 is a random number between −1 and N ; in Equation (12), the value 2 serves as a correlation factor, representing values between 2 and 0; r 3 represents a random integer between −1 and 1; and P i , j represents the proportional difference between the i t h position of the optimal solution and the j t h position of the current solution.
(3) Hunting phase (Exploitation)
The RSA simulates two strategies in the process of crocodile hunting: hunting coordination and cooperation. When t 3 T 4 and t > 2 T 4 , the hunting coordination strategy is adopted, otherwise search cooperation is executed, which simultaneously determines the optimal solution and explores the optimal solution space. The modeling approach is expressed in Equation (13).
x i , j t + 1 = B e s t j t × P i , j t × r a n d ,                         t 3 T 4   a n d   t > 2 T 4 B e s t j t η i , j t × ε R i , j t × r a n d ,             t T   a n d   t > 3 T 4
The exploitation search mechanism of the RSA (hunting, coordination, and cooperation) helps avoid being trapped in local optima. These processes facilitate the exploration of the search space to determine the optimal solution while maintaining diversity among candidate solutions. Random values are generated in each iteration, allowing the algorithm to continue exploration, not only during initial iterations, but also during the final ones. Figure 1 and Figure 2 illustrate the pattern of the algorithm simulating the crocodile encircling and hunting prey, respectively.

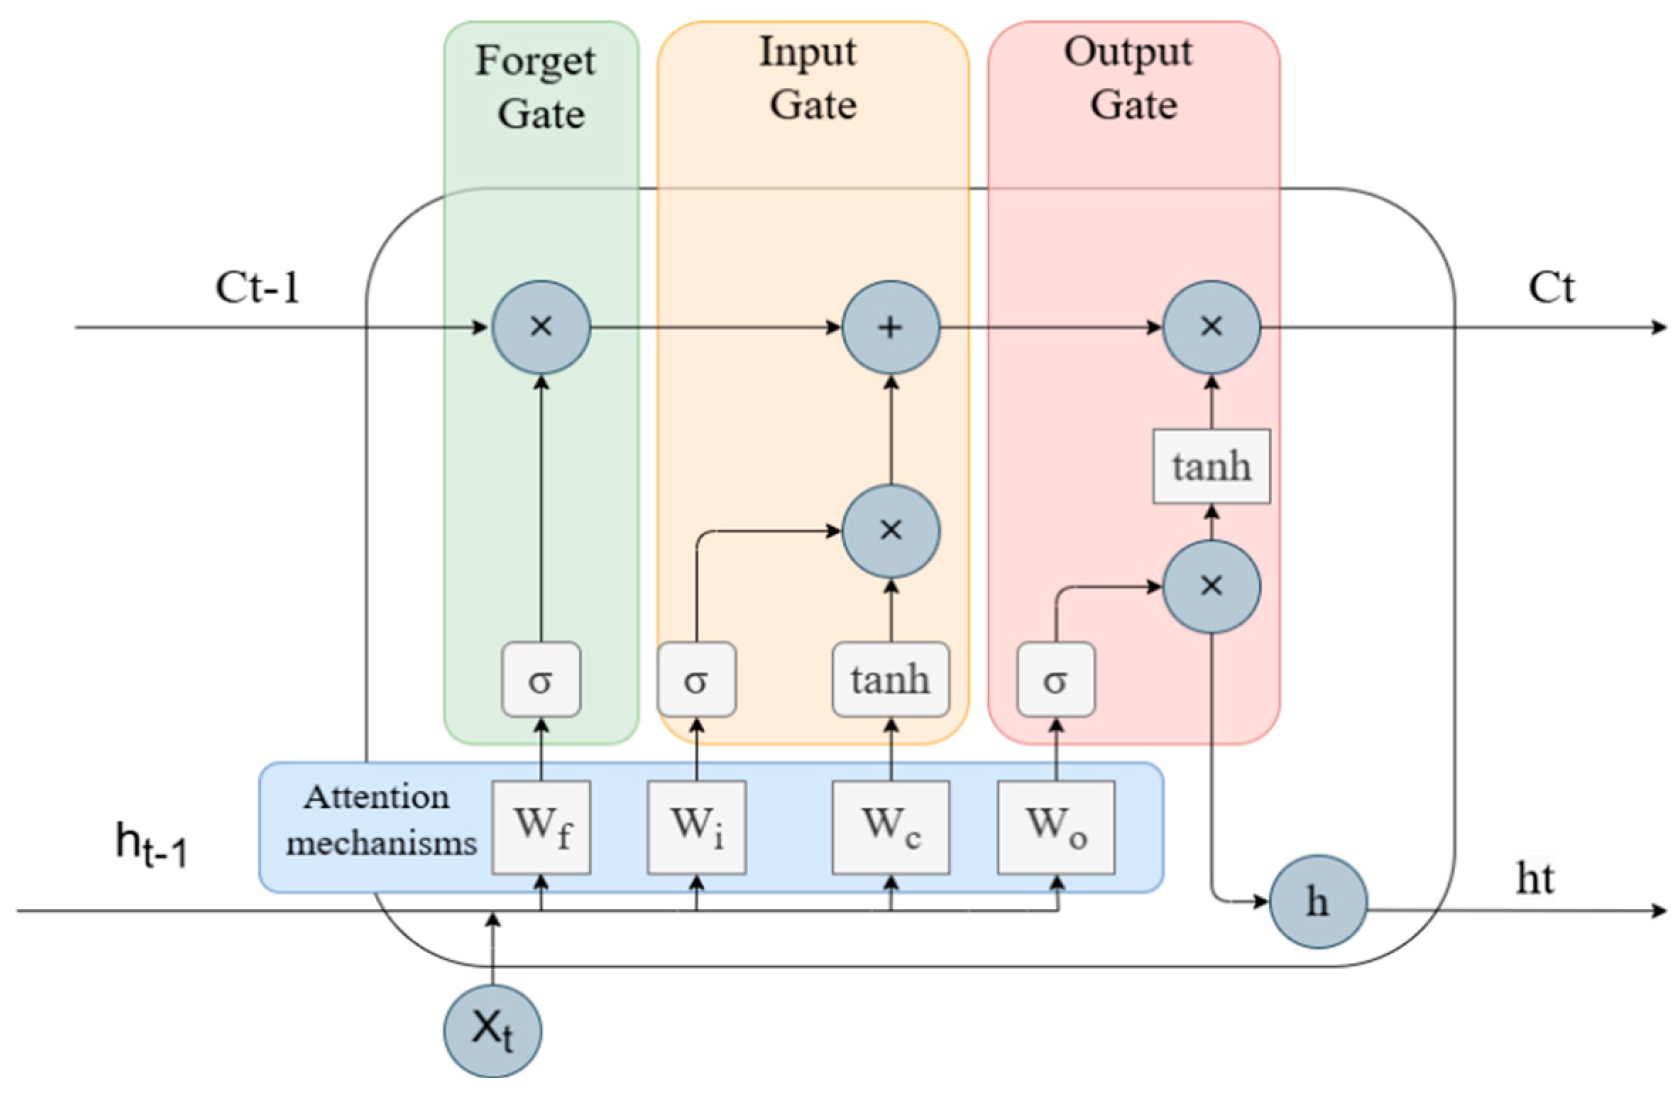
2.3. AttLSTM Prediction Model

LSTM is a special type of recurrent neural network (RNN) that aims to address the gradient vanishing and gradient explosion problems encountered by traditional RNNs when dealing with long sequences. LSTM introduces three gating mechanisms—the input gate, forget gate, and output gate—to control the flow of information and memory, enabling it to effectively capture long-term dependencies [26]. By incorporating the attention mechanism, an LSTM model can dynamically assign varying weights to different parts of the input during information processing, allowing it to capture the most critical information and identify key features by evaluating the relevance or importance of each input segment. The attention-based LSTM model has been demonstrated to achieve high accuracy in the analysis and modeling of dam deformation data, showing promise for data mining applications and the capacity to account for both global and local relationships between deformation and long-term influencing factors [27]. The basic structure of the model is shown in Figure 3.
The AttLSTM model consists of an input layer, an output layer, and two dropout layers to prevent the model from overfitting and improve the generalization ability of the model. It also contains an attention layer that performs correlation calculations and weight assignments for the hidden state at each time step. The AttLSTM network structure can be expressed by the following equations:
f t = σ W f h t 1 , x t + b f
i t = σ W i h t 1 , x t + b i
C ˜ t = tanh W C h t 1 , x t + b C
C t = f t C t 1 + i t C ˜ t
o t = σ W o h t 1 , x t + b o
h t = o t tanh C t
where the W f , W i , W C and W o are the weight matrix; b f , b i , b C and b o are bias terms; σ represents a sigmoid activation function; tanh denotes a hyperbolic tangent activation function; denotes the multiplication of elements; and C t 1 is the state of memory of the previous time step. Formulas for the attention mechanism are as follows:
e t , i = s c o r e h t , h i = h t T W a h i
α t , i = exp e t , i j = 1 T exp e t , j
C t = i = 1 T α t , i h i
The resulting prediction is:
o u t p u t t = W y h t , C t + b y
where W α and W y are the weight matrix and b y is a bias term.

3. Model Establishment
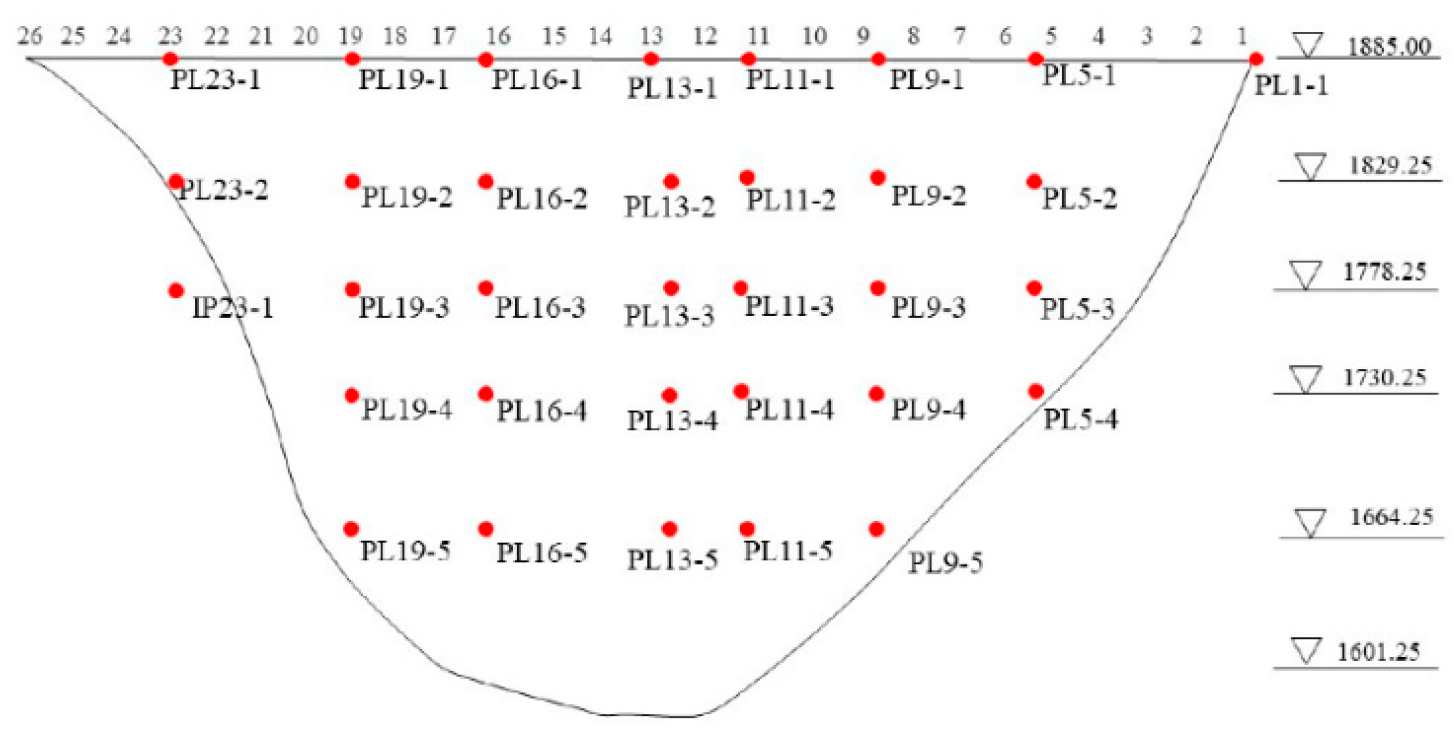
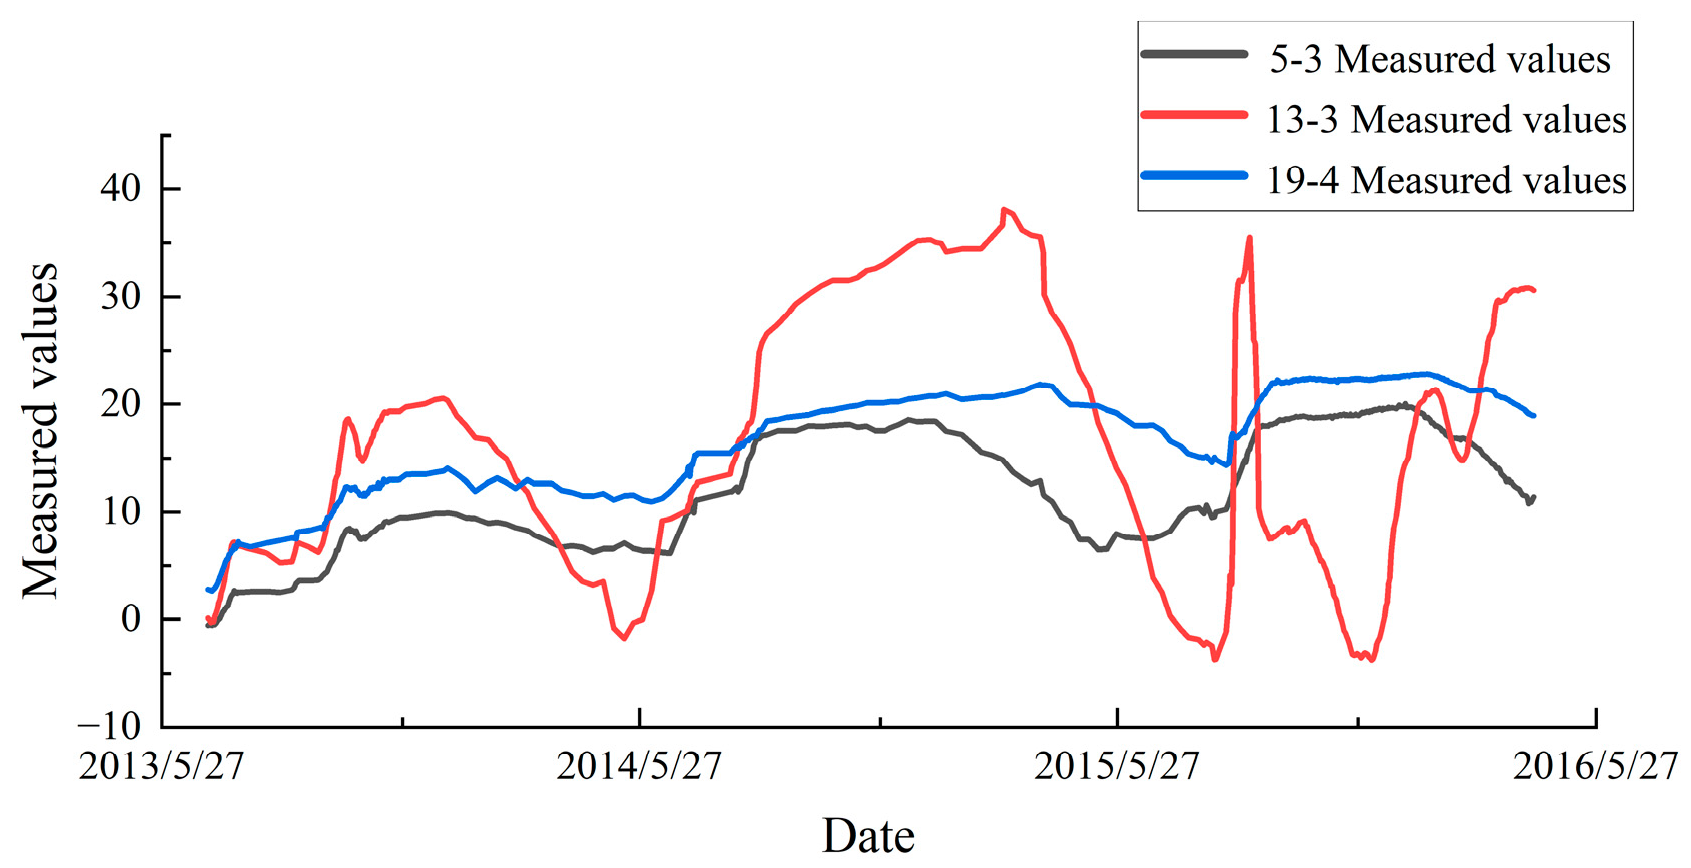
The establishment of the model consists of the following steps:
(1) Data Preprocessing
This step involves handling coarse errors, outlier detection, removal, and interpolation of missing values.
(2) RSA Optimization of VMD Parameters
The RSA is employed to optimize VMD parameters K and α . The negative value of the variance of the signal smoothed by a Gaussian filter and the sample entropy (SE) are used as the combined objective function. The parameters of the algorithm are set as follows: the number of prey (candidate solutions) for each iteration is 30; the total number of iterations is 100; the perturbation range during the exploration phase is set between −0.1 and 0.1; the range of the VMD parameter K is from 1 to 10; and the range for α is from 1000 to 10,000.
(3) VMD Decomposition, Smoothing, and Data Dimensionality Adjustment Using Optimal Parameters
After the optimal parameters K o p t , α o p t are obtained by the RSA, deformation-monitoring data are decomposed and smoothed by VMD, and the dimension of decomposed data is adjusted to meet the needs of the model, as the data dimension required by the attention LSTM model is three-dimensional.
(4) Data Splitting and Prediction Using Attention-based LSTM Model
Decomposed data are split into a training set and a prediction set for forecasting using the attention-based LSTM model. The model parameters are set as follows: the number of LSTM units is 50; the learning rate of the Adam optimizer is 0.001; and the number of iterations is 200.
(5) Model Evaluation and Validation
The model is evaluated using five metrics: mean squared error (MSE), mean absolute error (MAE), root mean squared error (RMSE), coefficient of determination (R2), and mean absolute percentage error (MAPE). Formulas for evaluation metrics are as follows:
M S E = 1 n i = 1 n y i y ^ i 2
M A E = 1 n i = 1 n y i y ^ i
R 2 = 1 i = 1 n y i y ^ i 2 i = 1 n y i y ¯ 2
R M S E = M S E = 1 n i = 1 n y i y ^ i 2
M A P E = 1 n i = 1 n y i y ^ i 2
Detailed steps of the RSA-VMD-AttLSTM model are shown in Figure 4.

4. Case Studies

A double-curved arch dam was taken as an example to verify the feasibility of the proposed model. The dam is located in the main stream of the Yalong River at the junction of Yanyuan County and Muli County in Liangshan Prefecture, Sichuan Province, and is a concrete double-curved arch dam with a height of 305.0 m and a normal water storage level of 1880 m. The thickness–height ratio is 0.207, the dam body was poured in 25 sections, and the horizontal radial displacement of the dam was detected in 7 sections through the plumb line [28]. The exact distribution of deformation measurement points is shown in Figure 5. In order to verify the effectiveness and versatility of the model in this paper, three measurement points near the dam abutment and arch crown beam were selected, which were PL5-3, PL13-3, and PL19-4, respectively. These three measuring points are located at the most important part of the dam deformation and are the key monitoring points for dam deformation. Deformation monitoring data from November 2012 to November 2016 were taken as the analysis object, and specific monitoring data are shown in Figure 6.

4.1. Optimized VMD for Noise Decomposition and Data Feature Preservation

The establishment of the model consisted of the following steps. The RSA was used to optimize VMD parameters K and α to achieve data feature retention and noise reduction smoothing. Taking the measurement point PL13-3 as an example, the number of prey (candidate solutions) of each iteration of the RSA was set to 30. The total number of iterations was 100. The perturbation range of the exploration stage was −0.1 to 0.1. The parameter range of VMD K was set from 1 to 10, and for α , the range was from 1000 to 10,000. The optimization result of measurement point PL13-3 was K = 8 and α = 6552 , and decomposition results of the measurement point are shown in Figure 7.
Figure 7 shows that data were decomposed into eight modes, among which IMF1, IMF2, IMF3, and IMF4 showed a smooth periodic fluctuation trend, which reflects that the RSA-optimized VMD decomposition had a certain noise reduction and smoothing ability, while IMF5, IMF6, IMF7, and IMF8 showed obvious fluctuations and changes in these data. Through RSA-optimized VMD decomposition, original monitoring data were denoised and smoothed while preserving their inherent variation features.

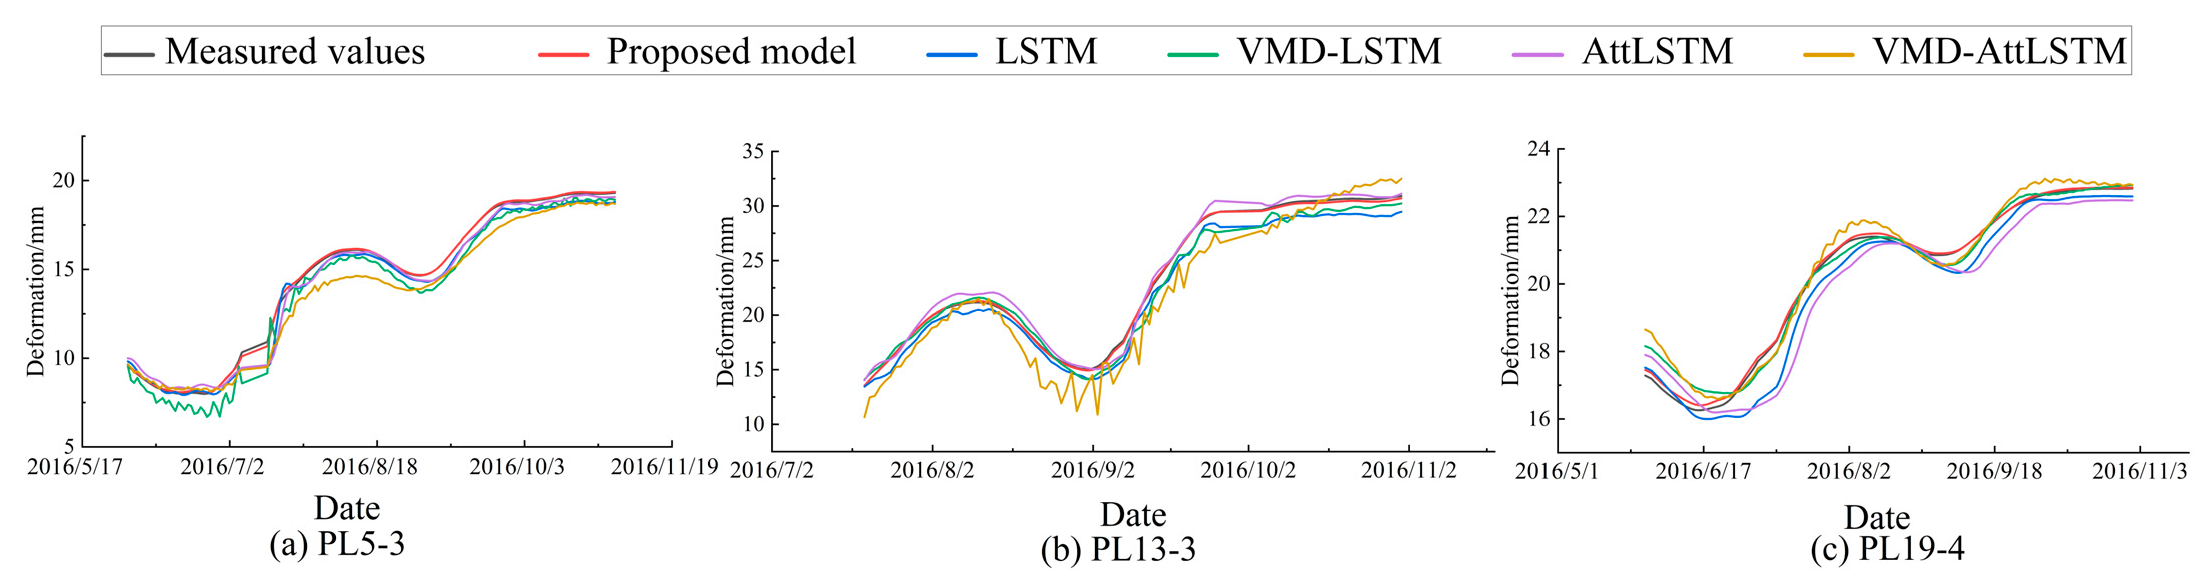
4.2. Prediction Using the AttLSTM Model

Monitoring data from November 2012 to November 2016 were divided into a training set and a prediction set, of which 75% of the sequences were training sets, and the rest were used as prediction sets to verify the prediction ability of the model. To demonstrate the superiority and general applicability of the model, the LSTM model, VMD-LSTM model, attention LSTM model, VMD-attention LSTM model, and the proposed model were compared across three measurement points: PL5-3, PL13-3, and PL19-4. The evaluation was conducted using five metrics: mean squared error (MSE), root mean squared error (RMSE), mean absolute error (MAE), coefficient of determination (R2), and mean absolute percentage error (MAPE). Prediction results from each model are shown in Figure 8, and evaluation metrics are summarized in Table 1.
Figure 8a,b and c represent prediction results for measurement points PL5-3, PL13-3, and PL19-4, respectively, while Table 1 presents the performance evaluation metrics of the proposed model compared to other models. The deformation prediction results of the proposed model align more closely with the actual measured deformation values. According to Table 1, the R2 values for measurement points PL5-3, PL13-3, and PL19-4 are 0.9997, 0.9951, and 0.9998, respectively, all approaching 1 and higher than those of other models, indicating an excellent prediction performance of the proposed model. Additionally, the MAE, MSE, and MAPE values of the proposed model are smaller compared to other models, showing that the model had lower minor errors, relative errors, and error fluctuations, which demonstrates its strong noise resistance. It can be concluded that the RSA-optimized VMD method has superior noise reduction capabilities, with the reconstructed modal signals exhibiting better smoothness while retaining these data’s variation characteristics. From Figure 7 and Figure 8, it can be inferred that the AttLSTM model provided more accurate prediction precision, and compared to the standard LSTM model, the AttLSTM model performed better in capturing the signal features of VMD-decomposed data.

5. Conclusions

This paper presents a model for predicting dam deformation based on denoising and processing monitoring data, with the dual objective of reducing noise while preserving the intrinsic characteristics of these data, thus enhancing prediction accuracy and improving noise robustness. The model utilizes the reptile search algorithm (RSA) to optimize the parameters of variational mode decomposition (VMD), enabling VMD to effectively denoise raw monitoring data while preserving these data’s essential features. The RSA-based parameter selection in modal decomposition ensures both noise reduction and feature smoothing. The smoothed modal information is subsequently weighted and reconstructed by an attention-based long short-term memory (AttLSTM) model for predictive analysis.
The proposed model demonstrated high accuracy and strong noise resistance, and its validity and generalization capability were further confirmed through comparisons with other similar models in engineering case studies. Compared to other models, the proposed model starts with denoising and feature preservation of data, providing a new approach to improve the prediction accuracy and robustness of deformation prediction models. The AttLSTM model incorporated in this study effectively captures modal signal features derived from RSA-optimized VMD decomposition, enhancing the model’s noise reduction and prediction accuracy. However, the model still has limitations, such as long training times and a tendency to become trapped in local optima. Additionally, when dealing with complex signals, the VMD method may require more advanced algorithms to further optimize the decomposition process. This study focused on a single measurement point for deformation prediction, which allowed for precise prediction of deformation at individual points. Future research could explore multi-point joint modeling to improve the model’s capability in spatial deformation analysis and prediction for dam structures.

Author Contributions

Conceptualization, P.L., H.G., C.G. and Y.W.; Methodology, P.L., H.G., C.G. and Y.W.; Software, P.L., H.G. and Y.W.; Validation, H.G.; Investigation, C.G.; Writing—original draft, P.L.; Supervision, H.G., C.G. and Y.W.; Funding acquisition, H.G. All authors have read and agreed to the published version of the manuscript.

Funding

This research was supported by the National Natural Science Foundation of China (Grant No. 52379122), Fundamental Research Funds for the Central Universities of Hohai (Grant No. B230201011), and the Jiangsu Young Science and Technological Talents Support Project (Grant No. TJ-2022-076).

Data Availability Statement

The original contributions presented in the study are included in the article, further inquiries can be directed to the corresponding author.

Conflicts of Interest

The authors declare no conflict of interest.

References

  1. Gu, C.S.; Su, H.Z.; Wang, S.W. Advances in calculation models and monitoring methods for long-term deformation behavior of concrete dams. J. Hydroelectr. Eng. 2016, 35, 1–14. [Google Scholar]
  2. Gu, C.; Cui, X.; Gu, H.; Yang, M. A New Hybrid Monitoring Model for Displacement of the Concrete Dam. Sustainability 2023, 15, 9609. [Google Scholar] [CrossRef]
  3. Chen, S.; Gu, C.; Lin, C.; Zhang, K.; Zhu, Y. Multi-kernel optimized relevance vector machine for probabilistic prediction of concrete dam displacement. Eng. Comput. 2021, 37, 1943–1959. [Google Scholar] [CrossRef]
  4. Wei, B.; Yuan, D.; Xu, Z.; Li, L. Modified hybrid forecast model considering chaotic residual errors for dam deformation. Struct. Control. Health Monit. 2018, 25, e2188. [Google Scholar] [CrossRef]
  5. Gu, C.; Wu, B.; Chen, Y. A High-Robust Displacement Prediction Model for Super-High Arch Dams Integrating Wavelet De-Noising and Improved Random Forest. Water 2023, 15, 1271. [Google Scholar] [CrossRef]
  6. Shao, C.; Zheng, S.; Gu, C.; Hu, Y.; Qin, X. A novel outlier detection method for monitoring data in dam engineering. Expert Syst. Appl. 2022, 193, 116476. [Google Scholar] [CrossRef]
  7. Salazar, F.; Morán, R.; Toledo, M.; Oñate, E. Data-Based Models for the Prediction of Dam Behaviour: A Review and Some Methodological Considerations. Arch. Comput. Methods Eng. 2015, 24, 1–21. [Google Scholar] [CrossRef]
  8. Belmokre, A.; Santillan, D.; Mihoubi, M.K. Improved Hydrostatic-Season-Time Model for Dam Monitoring: Inclusion of a Thermal Analytical Solution. In Proceedings of the 1st International Conference on Structural Damage Modelling and Assessment, Ghent, Belgium, 4–5 August 2020; pp. 67–78. [Google Scholar]
  9. Ran, L.; Yang, J.; Zhang, P.; Wang, J.; Ma, C.; Cui, C.; Cheng, L.; Wang, J.; Zhou, M. A hybrid monitoring model of rockfill dams considering the spatial variability of rockfill materials and a method for determining the monitoring indexes. J. Civ. Struct. Health Monit. 2022, 12, 817–832. [Google Scholar]
  10. Wei, B.; Chen, L.; Li, H.; Yuan, D.; Wang, G. Optimized prediction model for concrete dam displacement based on signal residual amendment. Appl. Math. Model. 2020, 78, 20–36. [Google Scholar] [CrossRef]
  11. Li, Y.; Bao, T.; Shu, X.; Chen, Z.; Gao, Z.; Zhang, K. A Hybrid Model Integrating Principal Component Analysis, Fuzzy C-Means, and Gaussian Process Regression for Dam Deformation Prediction. Arab. J. Sci. Eng. 2020, 46, 4293–4306. [Google Scholar] [CrossRef]
  12. Gu, H.; Yang, M.; Gu, C.-S.; Huang, X.-F. A factor mining model with optimized random forest for concrete dam deformation monitoring. Water Sci. Eng. 2021, 14, 330–336. [Google Scholar] [CrossRef]
  13. Zhang, Y.; Zhang, W.; Li, Y.; Wen, L.; Sun, X. AF-OS-ELM-MVE: A new online sequential extreme learning machine of dam safety monitoring model for structure deformation estimation. Adv. Eng. Inform. 2024, 60, 102345. [Google Scholar] [CrossRef]
  14. Song, S.; Zhou, Q.; Zhang, T.; Hu, Y. Automatic Concrete Dam Deformation Prediction Model Based on TPE-STL-LSTM. Water 2023, 15, 2090. [Google Scholar] [CrossRef]
  15. Pan, J.; Liu, W.; Liu, C.; Wang, J. Convolutional neural network-based spatiotemporal prediction for deformation behavior of arch dams. Expert Syst. Appl. 2023, 232, 120835. [Google Scholar] [CrossRef]
  16. Lu, Z.; Ding, Y.; Li, D. Coupling VMD and MSSA denoising for dam deformation prediction. Structures 2023, 58, 105503. [Google Scholar]
  17. Fang, W.; Liu, Y.; Hu, L.; Hu, H.; Tian, J. Intelligent deformation prediction model for concrete dams based on VMD-ResNetPlus-BiLSTM. In Proceedings of the 2024 International Academic Conference on Edge Computing, Parallel and Distributed Computing, Xi’an, China, 19–21 April 2024; pp. 258–264. [Google Scholar]
  18. Yang, J.; Lv, Z. Research on dam foundation deformation prediction based on VMD optimized temporal convolutional network. In Proceedings of the 2021 7th International Conference on Hydraulic and Civil Engineering & Smart Water Conservancy and Intelligent Disaster Reduction Forum (ICHCE & SWIDR), Nanjing, China, 6–8 November 2021; pp. 232–238. [Google Scholar]
  19. Cao, E.; Bao, T.; Gu, C.; Li, H.; Liu, Y.; Hu, S. A Novel Hybrid Decomposition—Ensemble Prediction Model for Dam Deformation. Appl. Sci. 2020, 10, 5700. [Google Scholar] [CrossRef]
  20. Kumar, A.; Zhou, Y.; Xiang, J.J.M. Optimization of VMD using kernel-based mutual information for the extraction of weak features to detect bearing defects. Measurement 2021, 168, 108402. [Google Scholar] [CrossRef]
  21. Dragomiretskiy, K.; Zosso, D. Variational Mode Decomposition. IEEE Trans. Signal Process. 2014, 62, 531–544. [Google Scholar] [CrossRef]
  22. Xie, Y.; Meng, X.; Wang, J.; Li, H.; Lu, X.; Ding, J.; Jia, Y.; Yang, Y. Enhancing GNSS Deformation Monitoring Forecasting with a Combined VMD-CNN-LSTM Deep Learning Model. Remote. Sens. 2024, 16, 1767. [Google Scholar] [CrossRef]
  23. Ahmadi, F.; Tohidi, M.; Sadrianzade, M. Streamflow prediction using a hybrid methodology based on variational mode decomposition (VMD) and machine learning approaches. Appl. Water Sci. 2023, 13, 135. [Google Scholar] [CrossRef]
  24. Abualigah, L.; Abd Elaziz, M.; Sumari, P.; Geem, Z.W.; Gandomi, A.H. Reptile Search Algorithm (RSA): A nature-inspired meta-heuristic optimizer. Expert Syst. Appl. 2022, 191, 116158. [Google Scholar] [CrossRef]
  25. Sasmal, B.; Hussien, A.G.; Das, A.; Dhal, K.G.; Saha, R. Reptile Search Algorithm: Theory, Variants, Applications, and Performance Evaluation. Arch. Comput. Methods Eng. 2023, 31, 521–549. [Google Scholar] [CrossRef]
  26. Yu, Y.; Si, X.; Hu, C.; Zhang, J. A review of recurrent neural networks: LSTM cells and network architectures. Neural Comput. 2019, 31, 1235–1270. [Google Scholar] [CrossRef] [PubMed]
  27. Yang, D.; Gu, C.; Zhu, Y.; Dai, B.; Zhang, K.; Zhang, Z.; Li, B. A Concrete Dam Deformation Prediction Method Based on LSTM with Attention Mechanism. IEEE Access 2020, 8, 185177–185186. [Google Scholar] [CrossRef]
  28. Cao, W.; Wen, Z.; Su, H. Spatiotemporal clustering analysis and zonal prediction model for deformation behavior of super-high arch dams. Expert Syst. Appl. 2023, 216, 119439. [Google Scholar] [CrossRef]
Figure 1. Schematic diagram of encircling prey.
Buildings 15 00357 g001
Figure 2. Schematic diagram of hunting prey.
Buildings 15 00357 g002
Figure 3. Schematic diagram of AttLSTM structure.
Buildings 15 00357 g003
Figure 4. Flow chart of RSA-VMD-AttLSTM model.
Buildings 15 00357 g004
Figure 5. Distribution map of concrete dam measurement points.
Buildings 15 00357 g005
Figure 6. Measured displacement values of PL5-3, PL13-3, and PL19-4.
Buildings 15 00357 g006
Figure 7. PL13-3 measurement point RSA-optimized VMD decomposition.
Buildings 15 00357 g007
Figure 8. Comparison of prediction results of each model at each measurement point.
Buildings 15 00357 g008
Table 1. Performance evaluation indicators of each prediction model.
Measuring PointsModelR2MAE/mmMSE/mm2RMSE/mmMAPE/%
PL5-3Proposed model0.99970.04690.04760.0690.54
LSTM0.98430.38320.18800.50272.56
VMD-LSTM0.98790.38690.29030.43365.34
AttLSTM0.98200.35600.29030.53882.66
VMD-AttLSTM0.98300.84630.96000.97985.69
PL19-4Proposed model0.99510.09230.00990.09960.42
LSTM0.95650.41400.26440.51421.89
VMD-LSTM0.96820.31320.19140.43751.23
AttLSTM0.98780.64600.62160.78842.81
VMD-AttLSTM0.96290.30790.22220.47131.74
PL13-3Proposed model0.99980.05870.00520.07200.50
LSTM0.99580.30980.15400.39244.34
VMD-LSTM0.98010.69480.70340.83873.26
AttLSTM0.99040.46460.35500.59582.59
VMD-AttLSTM0.98650.52670.31980.82208.02
Disclaimer/Publisher’s Note: The statements, opinions and data contained in all publications are solely those of the individual author(s) and contributor(s) and not of MDPI and/or the editor(s). MDPI and/or the editor(s) disclaim responsibility for any injury to people or property resulting from any ideas, methods, instructions or products referred to in the content.

