Article

The Application and Optimization of a New Tunnel Ventilation Method for the Control Room of Electric Submersible Pump Systems on Jack-Up Offshore Platforms

College of Safety and Environmental Engineering, Shandong University of Science and Technology, Qingdao 266590, China
*
Author to whom correspondence should be addressed.
Buildings 2025, 15(3), 325; https://doi.org/10.3390/buildings15030325
Submission received: 18 December 2024 / Revised: 14 January 2025 / Accepted: 17 January 2025 / Published: 22 January 2025
(This article belongs to the Special Issue Thermal Environment in Buildings: Innovations and Safety Perspectives)

Abstract

This study focused on the novel ventilation solution used in the control room of an electric submersible pump on a jack-up offshore platform, with the core objective of exploring the advantages of tunnel ventilation over the traditional ceiling-mounted ventilation system. At the beginning of the research, a three-dimensional physical model of the room’s air conditioning and ventilation system was constructed using Rhino 7 software. Subsequently, the computational fluid dynamics software Airpak 3.0 was employed to conduct detailed thermodynamic calculations on the model. Based on this, the study meticulously compared the performance of the two ventilation systems from multiple perspectives: one aspect examined the airflow and temperature distribution through temperature contour maps, velocity vector maps, and airflow streamlines; another focused on the comfort level of personnel, as reflected in the key indicators of the predicted mean vote and predicted percentage dissatisfied. The results demonstrated that tunnel ventilation is highly effective in reducing the indoor temperature and significantly improving personnel comfort. Further optimization analysis revealed that, under specific inlet conditions, namely when the inlet velocity reaches 1.16 m/s and the inlet temperature is 17 °C, the most ideal ventilation effect can be achieved, thereby fully and effectively meeting human thermal comfort requirements. Overall, the findings of this study not only provide a novel solution for the environmental control system design of offshore platforms but also lay a solid scientific foundation for continued exploration in related fields, offering a reliable reference for future research.

1. Introduction

In recent years, with the continuous advancement of offshore oil exploration and development technologies, jack-up offshore platforms have become key facilities for offshore oil and gas production facilities. Among these specialized offshore engineering structures, the control room of the electric submersible pump is a critical operational area. Electric submersible pumps generate significant heat during operation, and adequate ventilation is essential to dissipate this heat promptly. Proper ventilation ensures the equipment remains within an appropriate temperature range, facilitating stable and efficient operation, extending its service life, and maintaining the air quality in the control room. This reduces the accumulation of heat and odors from electrical components, creating a comfortable environment for operators. However, inadequate ventilation poses severe risks. On one hand, insufficient heat dissipation can cause a continuous rise in the pump’s internal temperature, leading to issues such as motor overheating, burnout, and damage to components due to thermal expansion and contraction. Frequent repairs not only increase operational costs but may also disrupt offshore platform activities. On the other hand, poor ventilation can degrade the air quality in the control room, increasing harmful gas concentrations and endangering operators’ health, causing symptoms such as dizziness and nausea, and reducing efficiency. In extreme cases, the combination of electrical faults and inadequate ventilation can result in fires or explosions, threatening the safety of the personnel and assets on the platform. Although the traditional ceiling-mounted ventilation system is widely used, it often struggles to meet the stringent temperature control requirements [1,2]. Given the increasingly demanding working conditions and the growing emphasis on personnel comfort, there is an urgent need to develop more efficient ventilation strategies [3].
Currently, scholars both domestically and internationally have conducted extensive research on ventilation issues in marine platform compartments. Some researchers have proposed improved top ventilation solutions. For instance, Liu C Qing [4] optimized the design of supply and exhaust fans in the main engine room of the Lufeng 14-4 platform, addressing the issue of excessive temperatures in the room. Using the computational fluid dynamics (CFD) software, Liu accurately simulated and predicted the airflow organization’s temperature and velocity fields, providing a reference for future ventilation system designs in main engine rooms. Similarly, Yu X Hong [5] and colleagues used FLUENT to study various ventilation schemes for offshore oil platform engine rooms, optimizing airflow patterns and validating the effectiveness of the improved designs, thereby offering valuable guidance for ventilation design in such settings.
Ma Z Lin and Xiong Z Yi [6] addressed the problem of abnormal generator shutdowns caused by high-temperature alarms in generator rooms on marine platforms due to poor heat dissipation. They proposed two solutions: a multi-outlet upper-level air supply and an increased air supply volume. Their findings indicated that the multi-outlet upper-level supply significantly reduced high-temperature zones and achieved better cooling effects. Sun D Qing [7] analyzed the heat dissipation components in electrical equipment rooms with high thermal loads on offshore platforms and proposed a novel independent ventilation and adjustable air damper design based on practical case studies.
Yang, S. and Ren, R. [8] investigated the impact of ventilation systems on the energy consumption and resistance loss during tunnel construction through theoretical calculations and field tests. They optimized the fan spacing and intermediate diaphragm designs. Wu, Chaofan and Ahmed, Noor A. [9] conducted numerical analyses to examine the effects of factors such as the ventilation temperature and airflow rate on the compartment ventilation performance, discovering that top-mounted exhaust outlets were more effective in reducing high temperatures compared to side-mounted ones. Xie Y Chun, Zheng Z, Wang H Bin, Xu Z, and Liu [10] constructed a three-dimensional (3D) physical model of the ventilation system for the main cabin of the JU-2000E platform and used CFD software to analyze the influence of ventilation factors on the performance, including humidity effects. Experimental testing provided further guidance for ventilation system design. Similarly, Jin Q and Ying C Xie [11] developed a scaled model of the main engine room ventilation system on an offshore platform based on similarity theory, analyzing factors influencing the ventilation characteristics. They found that a well-designed outlet layout accelerates heat dissipation and reduces temperature differentials, with an air supply rate of 600 m3/h meeting the cooling requirements of the engine room in the most economical manner.
However, these top ventilation solutions still present challenges, such as uneven indoor temperatures and stagnant zones in certain areas, which hinder the airflow and thermal comfort. In addition, some researchers have explored the applications of tunnel ventilation in other contexts. For example, Li X Song [12] applied a tunnel ventilation model to large-scale pigsties and used CFD techniques to numerically simulate a tunnel-based vertical ventilation system for gestation barns. The results demonstrated higher efficiency in removing gaseous pollutants and achieving lower pollutant concentrations. Wang C Qing [13] studied summer cooling effects in greenhouses using experimental and CFD simulation methods, comparing two vent configurations (side–bottom only vs. side–bottom plus top). The combined side–bottom and top vertical ventilation configuration proved significantly more effective. Liu T Jiao, He Shoubao [14], and colleagues examined the impact of bottom air inlets on the ventilation characteristics in high-speed train equipment compartments. Their research revealed that introducing ventilation through the floor increased the airflow and significantly reduced the average internal temperatures, enhancing the heat dissipation performance.
To sum up, in the field of ventilation for the electrical submersible pump control room on self-elevating offshore platforms, existing studies have primarily focused on the conventional optimization of traditional ventilation methods. There is a relative lack of exploration into novel ventilation technologies, particularly tunnel ventilation. Most studies have failed to adequately consider the comprehensive impact of the control room’s unique thermal load characteristics, equipment layout, and personnel activity patterns on the ventilation performance. As a result, traditional ventilation methods often fail to meet increasingly stringent environmental requirements in practical applications, such as issues with high indoor temperatures affecting the equipment stability and poor personnel comfort [15,16,17].
This study innovatively applied tunnel ventilation to the electrical submersible pump control rooms on self-elevating offshore platforms, distinguishing it from traditional ceiling-mounted ventilation. By utilizing underground ducts to deliver air, it fully exploited the advantages of natural cooling sources, optimized the airflow distribution within the room, and fundamentally changed the heat exchange and airflow patterns of ventilation. This approach provides a new solution for the ventilation challenges in specialized environments like offshore platforms. This study breaks through the limitations of traditional ventilation comparisons by delving into the quantitative analysis of personnel comfort. Through the exploration of key indicators such as the predicted mean vote (PMV) and predicted percentage dissatisfied (PPD), it accurately quantified personnel comfort under different ventilation systems. This fills a gap in the previous studies of ventilation in offshore platform cabins, offering a more comprehensive and scientific assessment of the ventilation effectiveness and taking the user experience into full consideration.
For the ease of quick reference, Table 1 summarizes the research overview of the CFD numerical simulation software, the novel tunnel ventilation method, and its ventilation optimization, presenting the current findings of related studies as well as the objectives and novelty of this research. Overall, this study aimed to fill the existing research gap by relying on innovative research methods and content, opening up new directions for the ventilation improvement of electrical submersible pump control rooms on self-elevating offshore platforms and more broadly for the ventilation of offshore cabins, contributing to the advancement of the industry [18].
The following sections are organized logically and systematically. Section 2 presents a detailed explanation of the research methodology, including the construction of the 3D physical model, the parameter settings for the Airpak 3.0 (Fluent Inc., New York, NY, USA), and independence tests. Section 3 focuses on presenting and comparing the simulation results of the two ventilation systems, providing a visual demonstration of the advantages of tunnel ventilation over traditional ceiling-mounted ventilation. It also identifies the optimal ventilation effect of tunnel ventilation under specific inlet conditions, namely, an inlet velocity of 1.16 m/s and an inlet temperature of 17 °C. Section 4 discusses limitations and prospects, and Section 5 provides a summary and conclusion, highlighting the significance of the research findings for the environmental control system design of offshore platforms and providing reliable benchmark references for future related studies.

2. Methods

2.1. Numerical Research
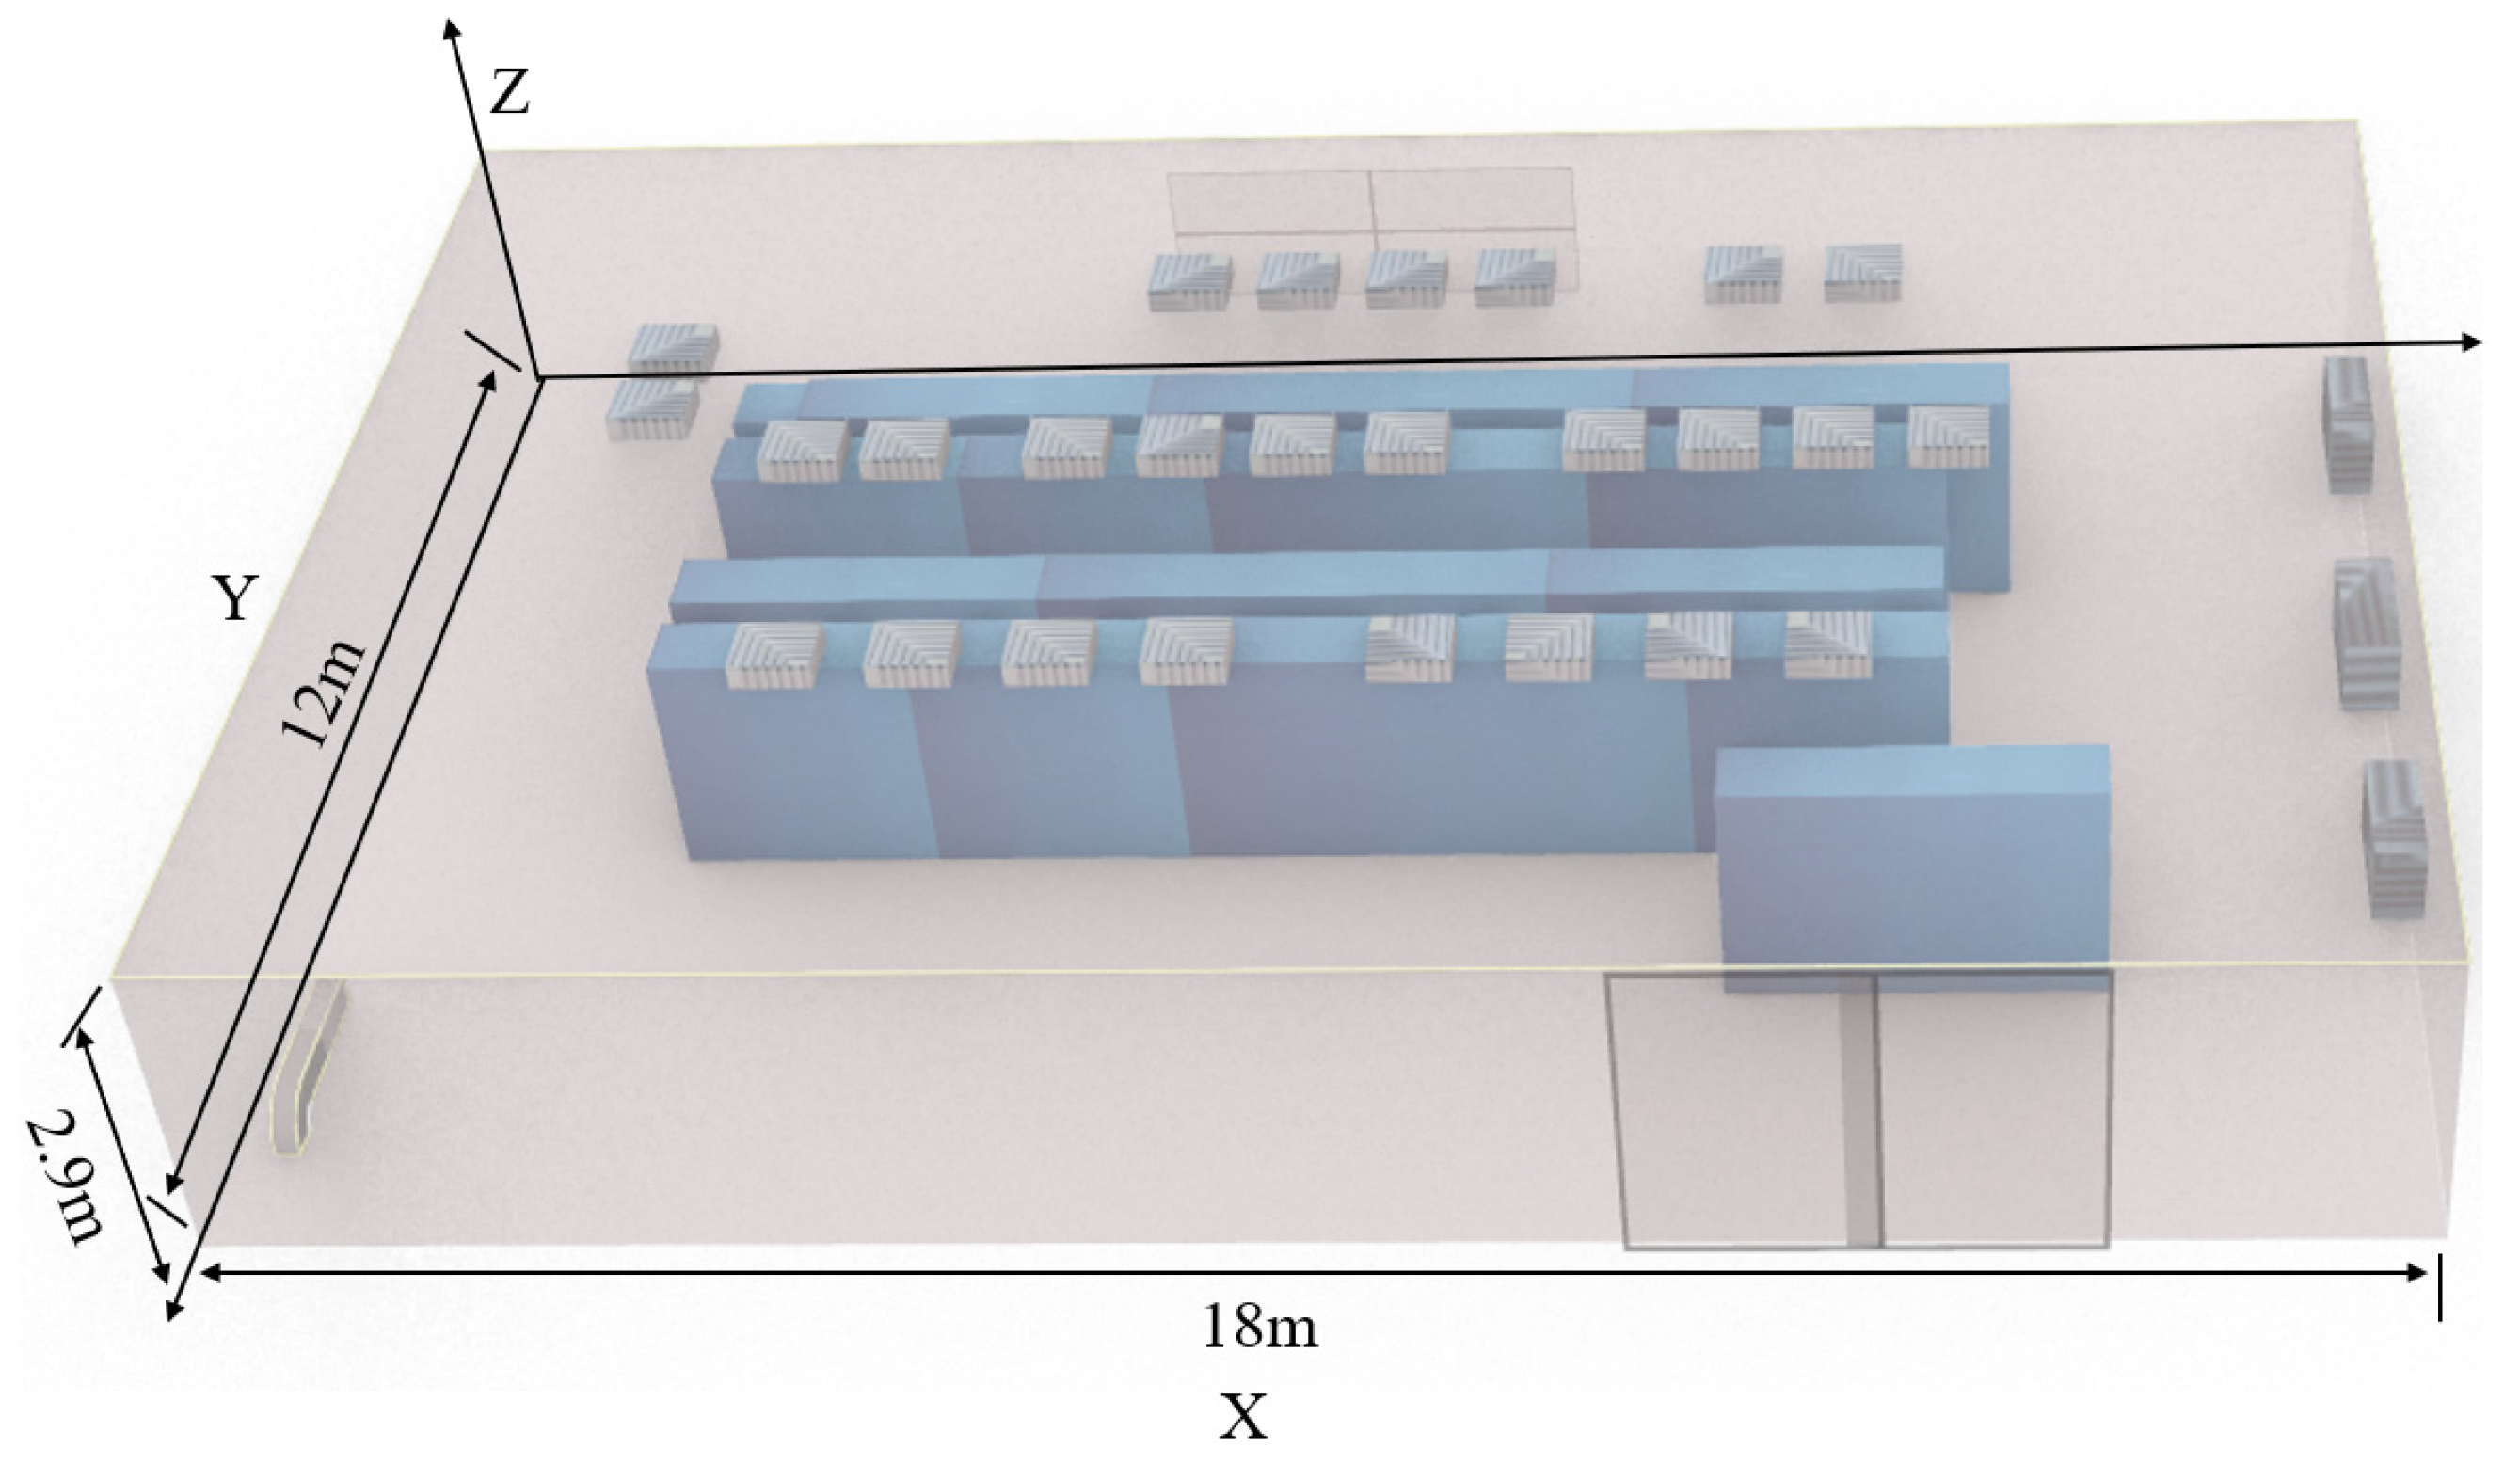
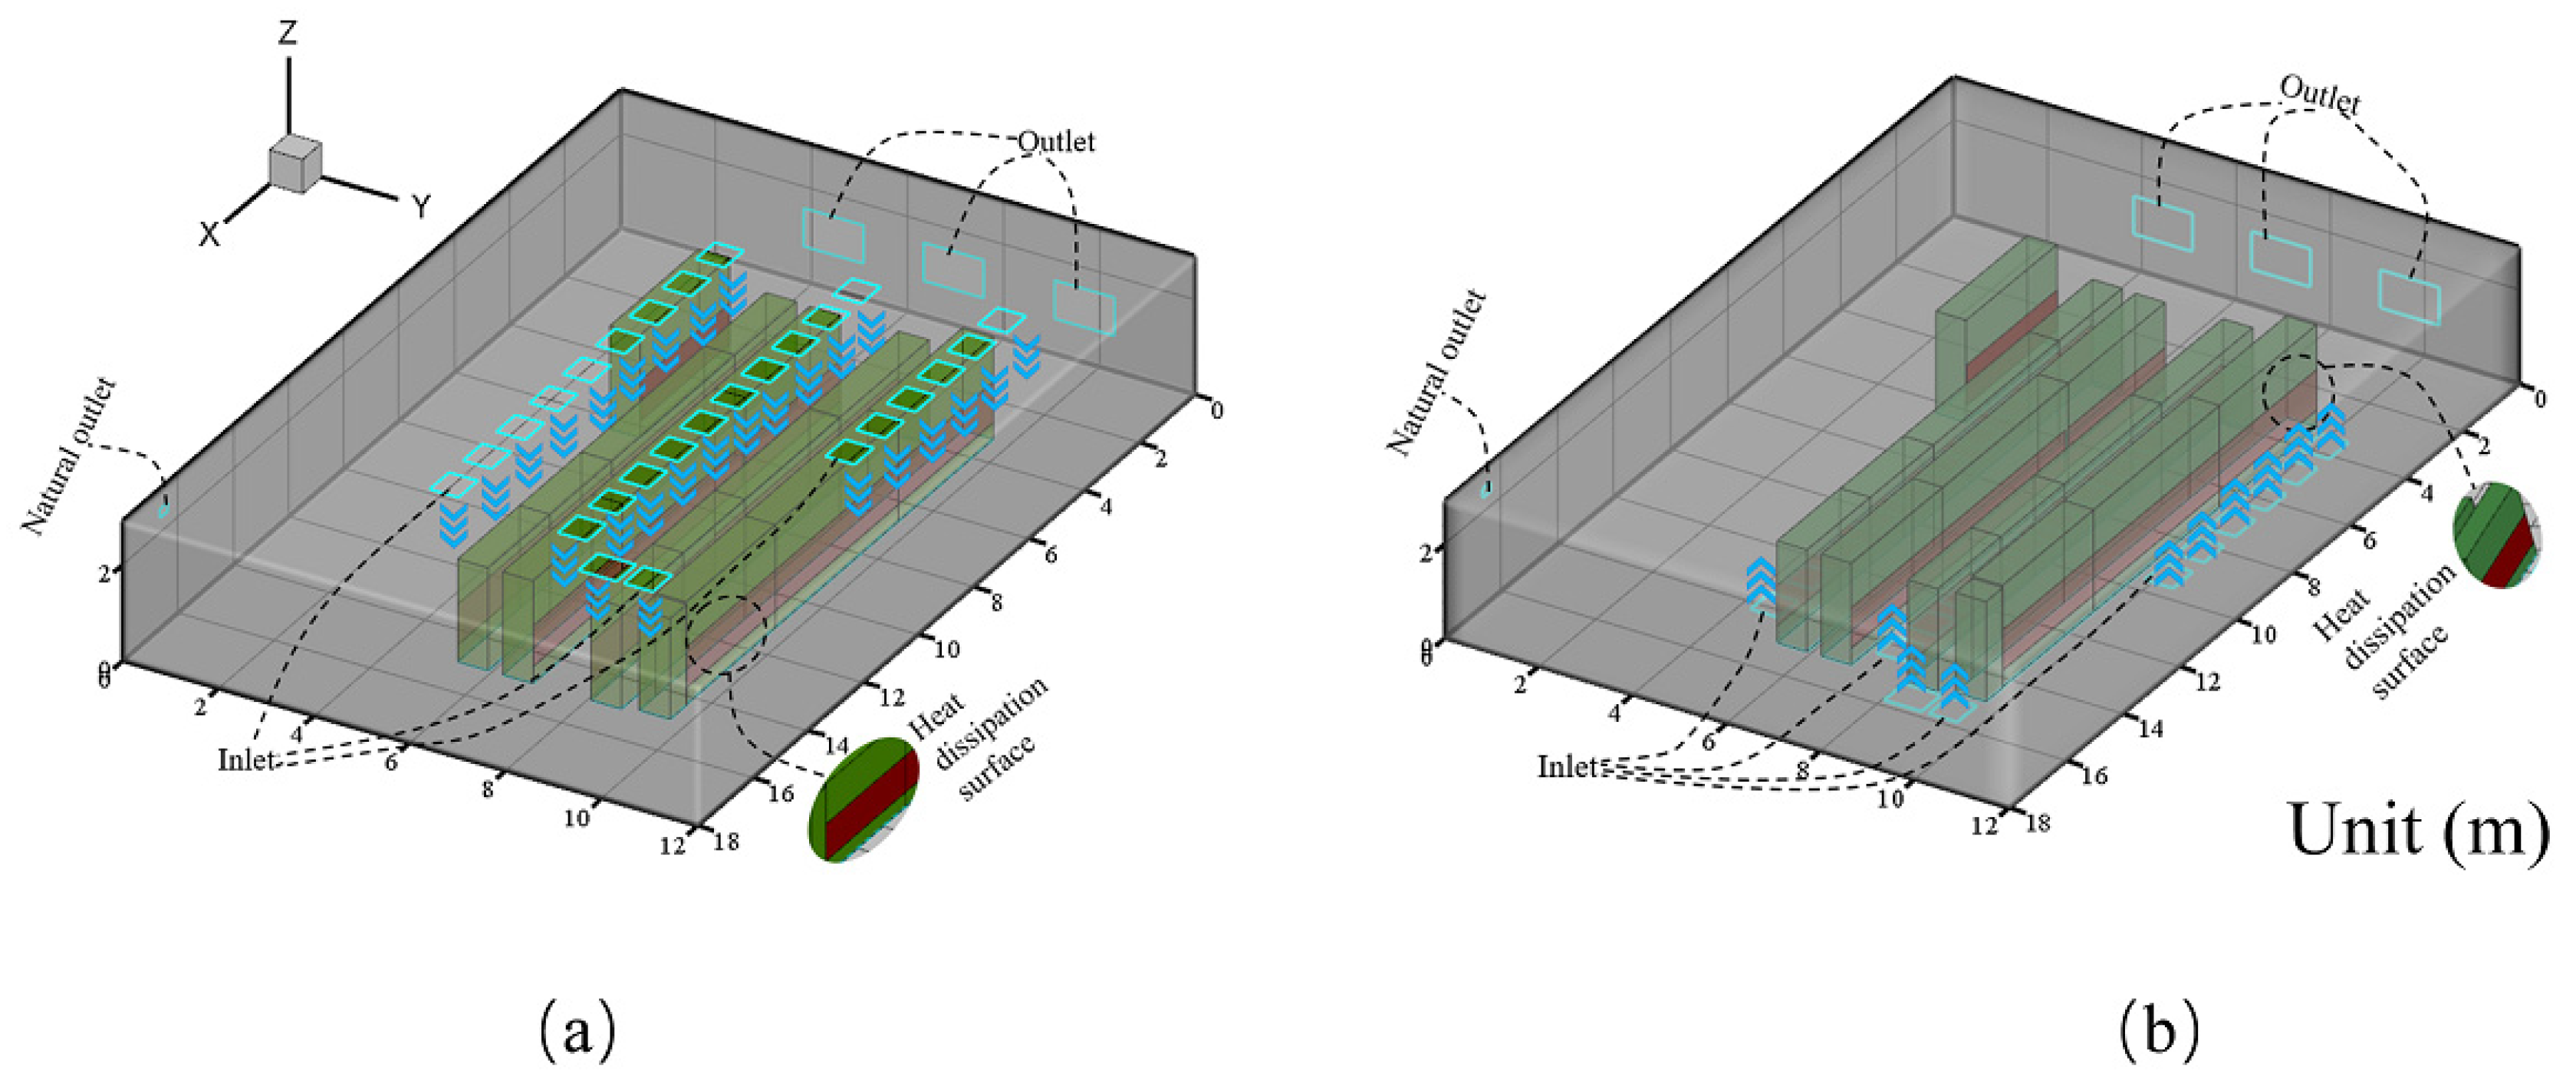
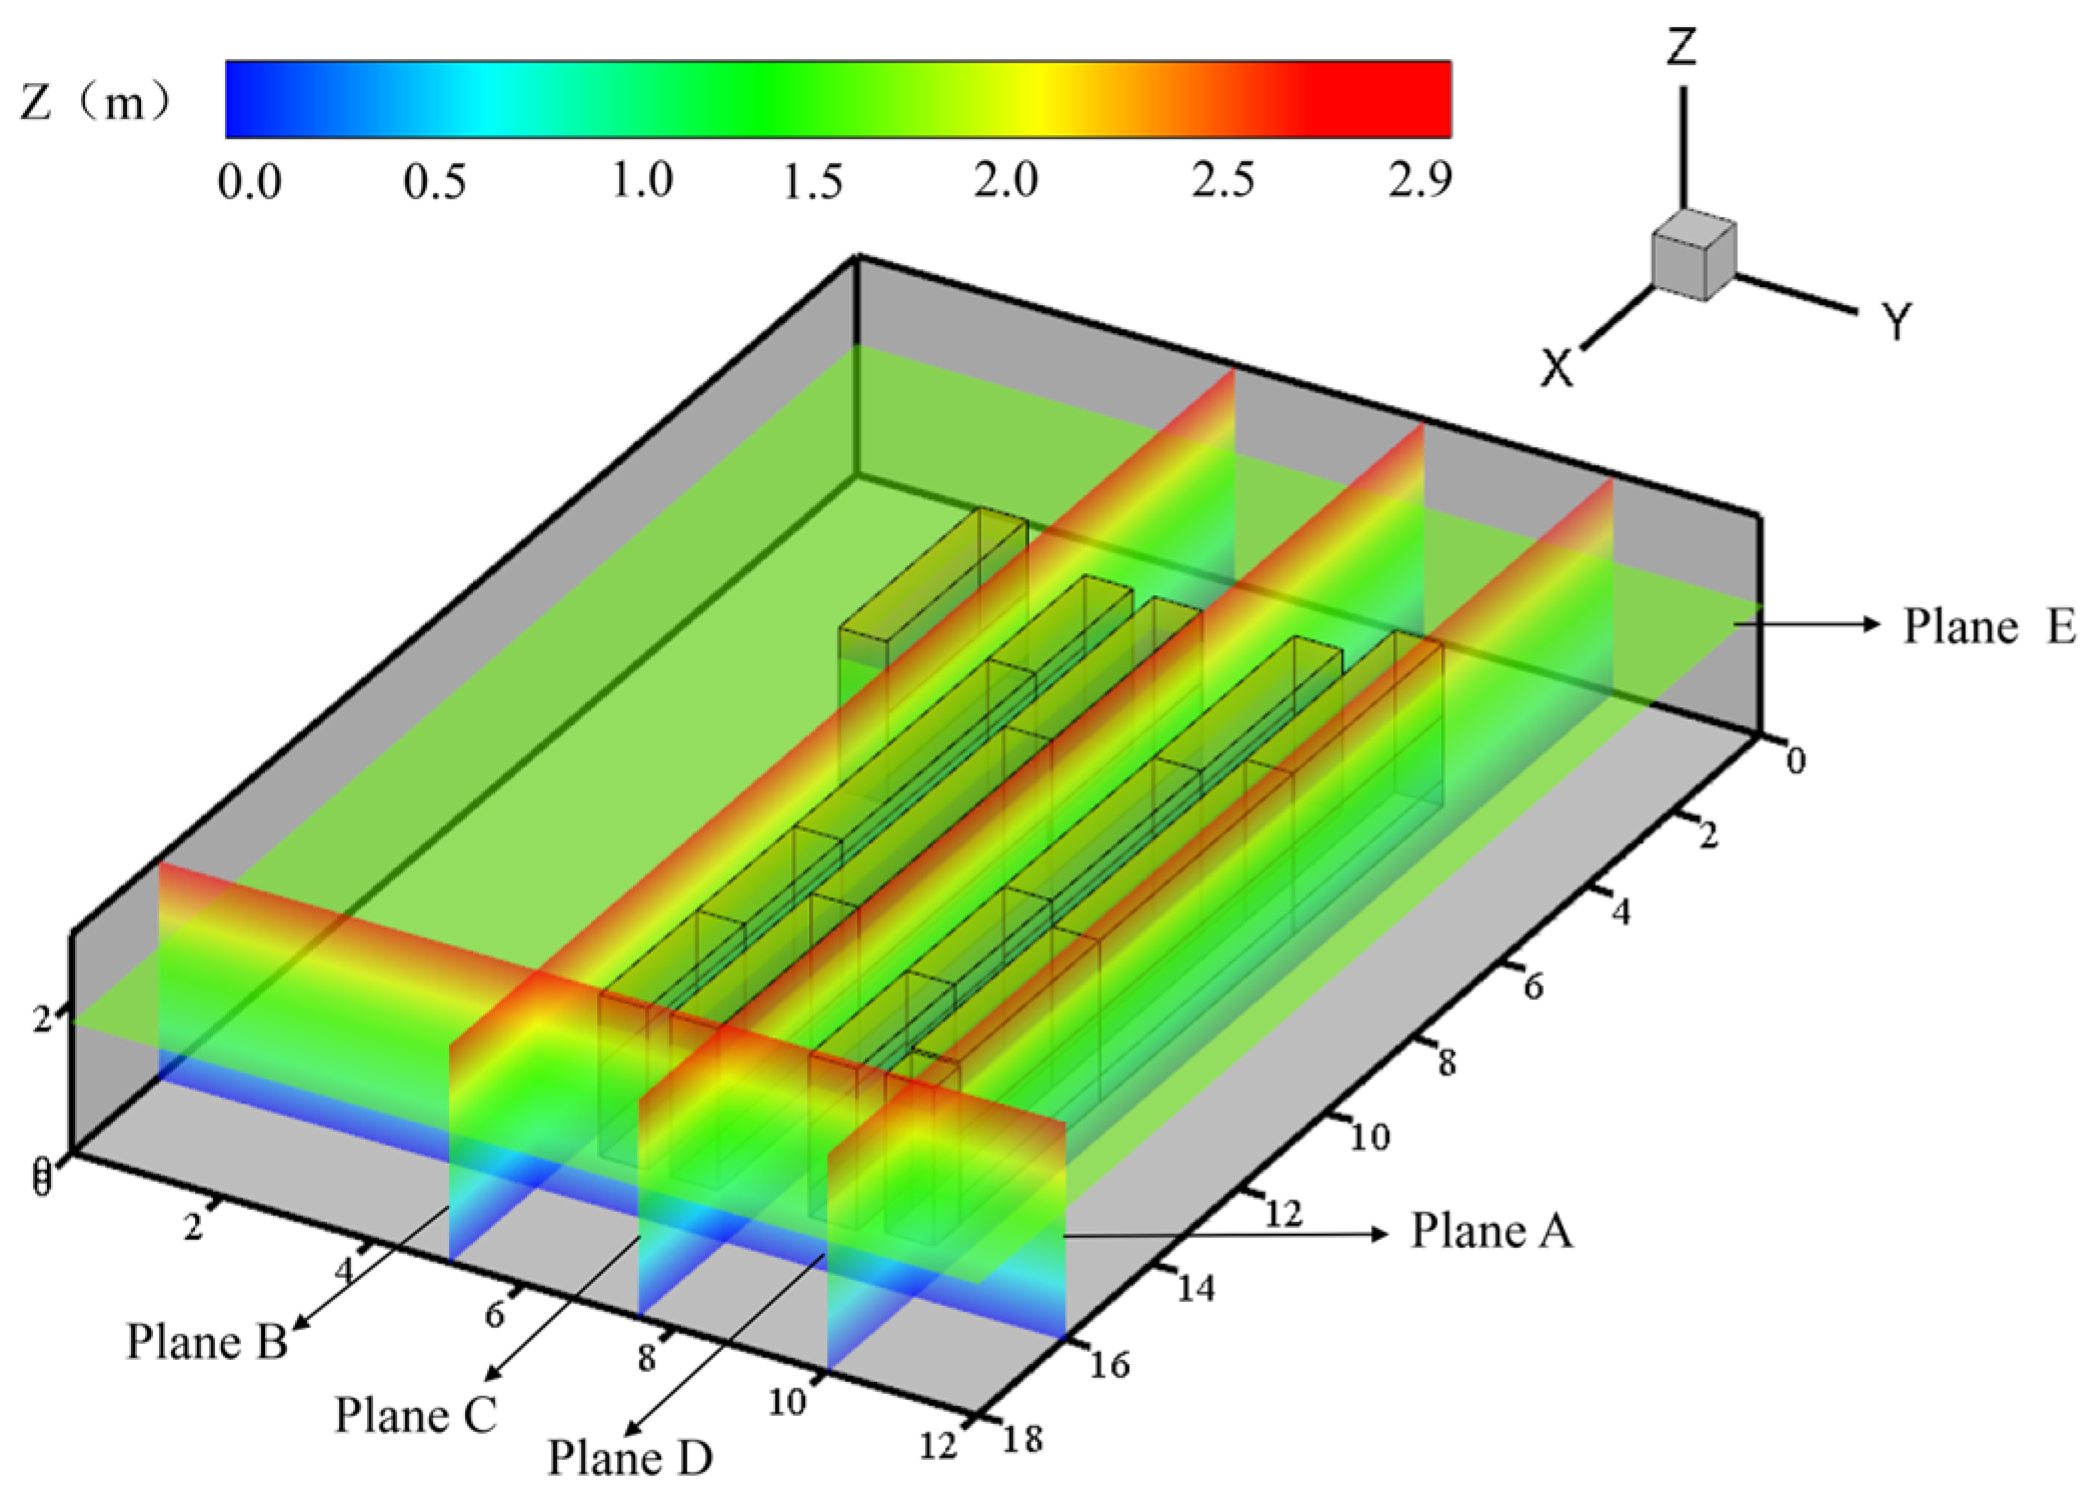
2.1.1. Geometry

In this study, two distinct ventilation inlet configurations were designed for comparative analysis: a ceiling-type air inlet system (Case 1) and a ground-level air inlet system (i.e., tunnel ventilation, Case 2), which was proposed in this study. Case 1 features air inlets positioned at the top of the indoor space, while Case 2’s inlets are located at the bottom of the room, which can be called tunnel ventilation. Numerical simulations were conducted to analyze the airflow velocities, the airflow temperature fields, and the thermal comfort distributions within the control rooms of the electric submersible pump systems on the jack-up offshore platforms in the South China Sea. The geometric model was based on the joint development project of the Enping and Panyu oilfields. The layout of the control room on the EL(+)28500 deck was constructed using field diagrams [19,20,21], as shown in Figure 1.
The control room involved in this study measures 18 m in length, 12 m in width, and 2.9 m in height. Its structure primarily consists of an air inlet channel, an exhaust channel, an emergency evacuation exit, heat generation devices, and surrounding partition walls. Based on field measurement data, a detailed 3D physical model of the control room was constructed using Rhino software (3D modeling software), as shown in Figure 2a. The model clearly delineates the spatial locations of each structural component. The model accounts for the high power output and significant heat generation characteristics of the equipment in the cabin, with the heat dissipation primarily concentrated in the middle and lower parts of the equipment. In the first step of this study, the only variable parameter was the position of the air inlets, which was simulated in two cases, as shown in Figure 2. Case 1 placed the air inlets at the top of the control room (Figure 2a), and Case 2 at the bottom (Figure 2b). In both cases, each inlet and outlet measured 60 cm × 60 cm, with a total of 27 air inlets and 3 air outlets. All other boundary conditions remained unchanged.

2.1.2. Turbulence Model

The characterization of flow regimes in indoor thermal environments primarily lies in turbulence modeling [22]. In this study, the room’s thermal environment was numerically simulated using Airpak 3.0, a commercial CFD software system. The software solved equations governing the mass conservation (continuity equation), momentum conservation (Navier–Stokes equations), energy transfer, and turbulent flow [23]. To model turbulence, the room’s thermal environment was simulated numerically using Airpak 3.0, and the Renormalization Group (RNG) K-Epsilon model was employed due to its robustness in handling flows with complex geometries and variable flow rates, especially in confined indoor spaces with multiple obstacles. Compared to the zero-equation (mixing length) model and the chamber-specific zero-equation model, the RNG K-Epsilon model incorporates additional physical parameters and flow considerations, offering a more detailed representation of turbulent phenomena. Furthermore, it has been shown to outperform the standard K-Epsilon model in terms of accurately capturing the flow separation, rapid flow variations, and curvature effects [24,25]. In addition, the Spalart–Allmaras model demonstrates strong performance in some aeronautical and external mobility applications; it is less suited for the detailed simulation of indoor environments.
Considering these factors, the RNG K-Epsilon model demonstrates significant advantages in capturing the details of the indoor airflow and was thus deemed the most appropriate turbulence model for this study [26,27,28].
In Airpak 3.0, the turbulence effects were modeled using the Reynolds averaging method, which assumes that the airflow behaves as a continuum. At steady state and for an incompressible airflow, the mass conservation equation is expressed as
· v = 0
The Boussinesq assumption was introduced in the RNG K-Epsilon model. Accordingly, the momentum conservation equation can be formulated as
· ρ v v = p + · τ ̿ + ρ g + F
The RNG K-Epsilon model was derived through rigorous statistical techniques [29,30]. The model calculates the turbulent viscosity μt as a function of k and ε by solving two additional transport equations (for the turbulent energy k and turbulent dissipation rate ε), Equations (3) and (4).
x i ρ k u i = x i α k μ e f f k x i + G k + G b ρ ϵ
x i ρ ϵ u i = x i α ϵ μ e f f ϵ x i + C 1 ϵ ϵ k G k + C 3 ϵ G b C 2 ϵ ρ ϵ 2 K R ϵ
In the Airpak 3.0, the high Reynolds number expression provided by Equation (5) was used to calculate the effective viscosity of the airflw (μeff):
μ e f f = μ + μ t
The main difference between the RNG and standard K-Epsilon models is the additional terms of Rϵ in Equation (4).
The energy equation is presented as follows:
x i u i ( ρ E + p ) = x i k e f f T x i + S h

2.2. Boundary Condition Settings

In the control room, natural convection arises from the density reduction due to the temperature increase triggered by an increase in the air temperature. In the simulation using Airpak 3.0, the Boussinesq model was applied to describe air density variations. The ambient pressure was set to the standard atmospheric pressure and the ambient temperature was set to 35 °C based on the typical meteorological data in the South China Sea area, which were referred to using the climatic statistics [31] and marine meteorological research results [32,33,34,35,36,37,38]. The RNG K-Epsilon model was selected as the turbulence model. The gravity was defined along the negative Z-axis with a magnitude of 9.81 m/s2. For the calculation of the turbulence, momentum, and energy terms, the second-order windward interpolation method was employed. To balance the computational accuracy and efficiency, the standard scheme was used for pressure discretization. The flow field within pedestrian activity zones in the control room was simulated using the SIMPLE algorithm for pressure–velocity coupling [39].
The air inlet was defined with a velocity inlet boundary condition [40], specifying an airflow velocity of 1.66 m/s and an inlet air temperature of 15 °C. These parameters were consistent with the specifications of the air conditioning ventilation system. The air outlet adopted a pressure outlet. The main heat source in the control room of the electric submersible pump is the 16 heat dissipation devices (i.e., the variable speed drives in the drilling and production platform (DPP-VSDs)) in the cabin, and the thermal boundary parameters of the equipment are shown in Table 2.
The DPP-VSD equipment in the control room has multiple key features in addition to heat dissipation. Its precise control function allows for parameter adjustment based on real-time operating conditions, ensuring the pump operates efficiently and stably, thereby enhancing the energy utilization. It exhibits strong operational stability with a self-protection mechanism that resists voltage fluctuations and electromagnetic interference, reducing the probability of failure. The system is user-friendly, with an intuitive interface that is easy to operate, facilitating smooth pump operation.
In summer, the radiant heat from the external environment has an insignificant impact on the control room of the electric submersible pump compared to the heat generated by the equipment. Therefore, this radiant heat flux can be considered negligible. To simplify the model and reduce the computational complexity, the temperature boundary condition for the inner wall was determined by averaging the inner wall temperature measurements taken in the control room between 12:00 noon and 2:00 pm during the measurement period.

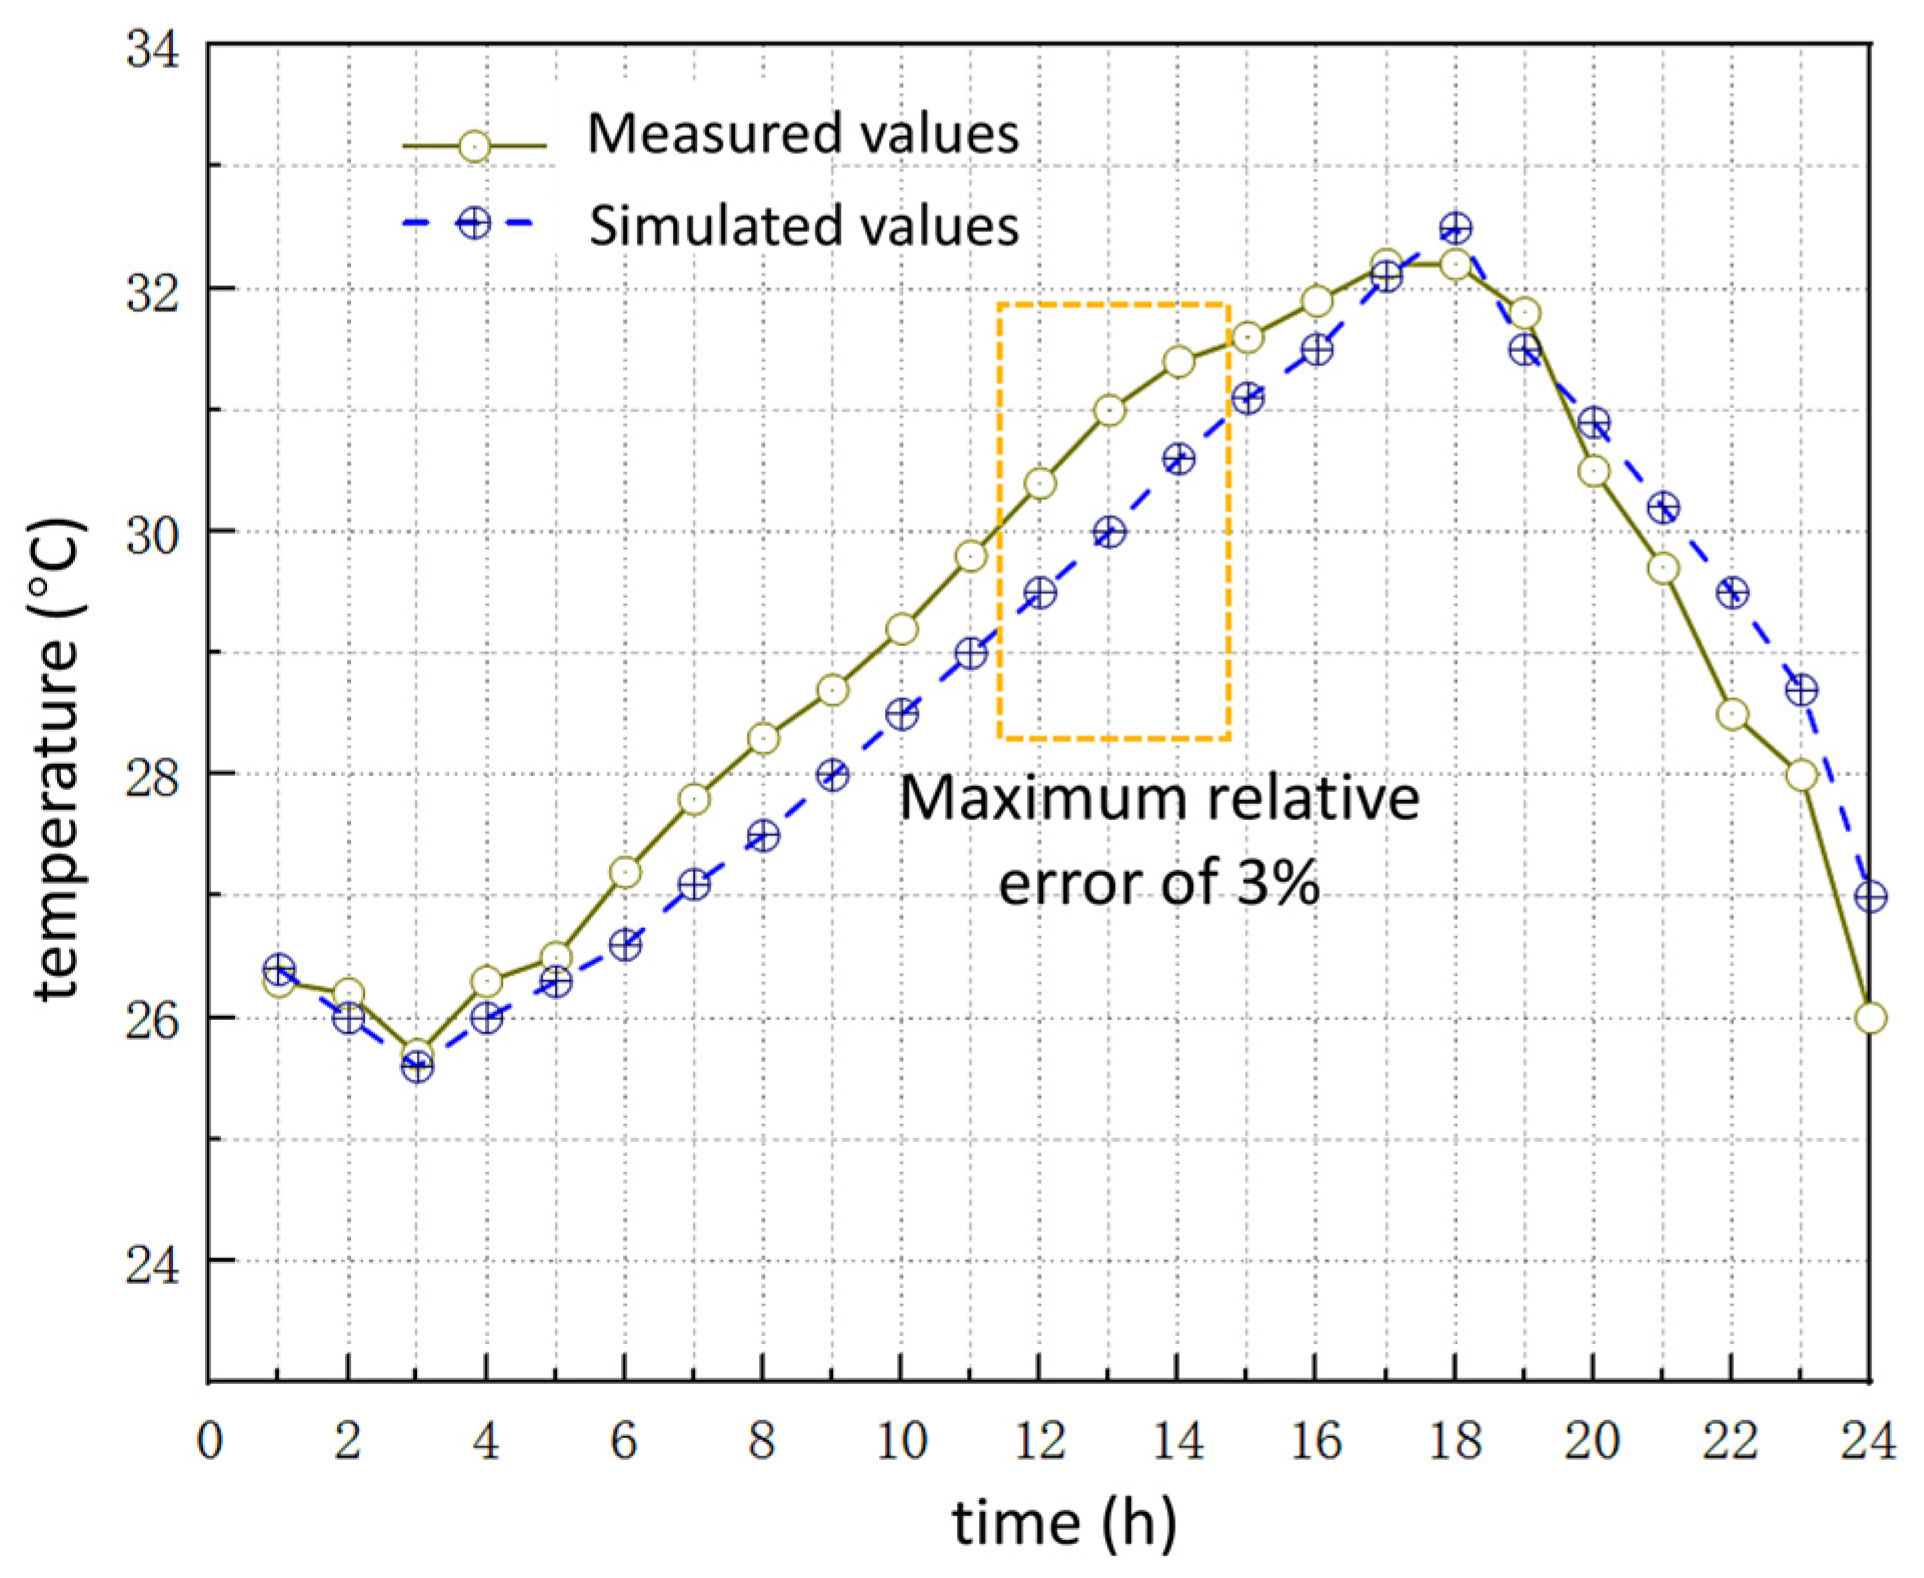
2.3. Field Measurements and Model Validation

Field measurements were conducted on 8, 10, and 12 July 2024. The temperature sensors (KE-COS-03, SiN Electronic Technology Co., Ltd., Jinan China) were used, with a temperature monitoring range of −5 to 45 °C and a basic error of ±1 °C. The device displays readings with three digits and a resolution of 0.1 °C, and it was also used for long-term temperature monitoring. The temperature-measuring instrument recorded a temperature reading at one-minute intervals. The measurement of the inner wall and airflow temperatures lasted for 3 days, with 24 h data collection at each measurement point per day. Figure 3 presents the layout of the measurement points. The measurement points were positioned at the height of Z = 1.75 m. The measuring points A (X = 15, Y = 0.2), B (X = 15, Y = 11.8), C (X = 3, Y = 0.2), and D (X = 3, Y = 11.8) were arranged to measure the inner wall temperatures, while the measuring points a (X = 15, Y = 1), b (X = 15, Y = 11), c (X = 3, Y = 1), and d (X = 3, Y = 11) were employed to measure the airflow temperatures in the control rooms. The average temperature and relative error for each point were calculated over the three-day period.
Figure 4 compares the measured airflow temperatures with the simulated data obtained using the RNG k-ε turbulence model in Case 1 for the varying inner wall temperatures over time. In this comparison, the numerical simulation results from the RNG k-ε model showed a good agreement with the temperature distribution observed at the measurement points in the field. The RNG k-ε model exhibited a small relative error, consistently below 3%. This model has been well validated through numerous studies on thermal environments. Therefore, the RNG k-ε model accurately reflects the temperature field characteristics within the control room and can be applied to subsequent research.

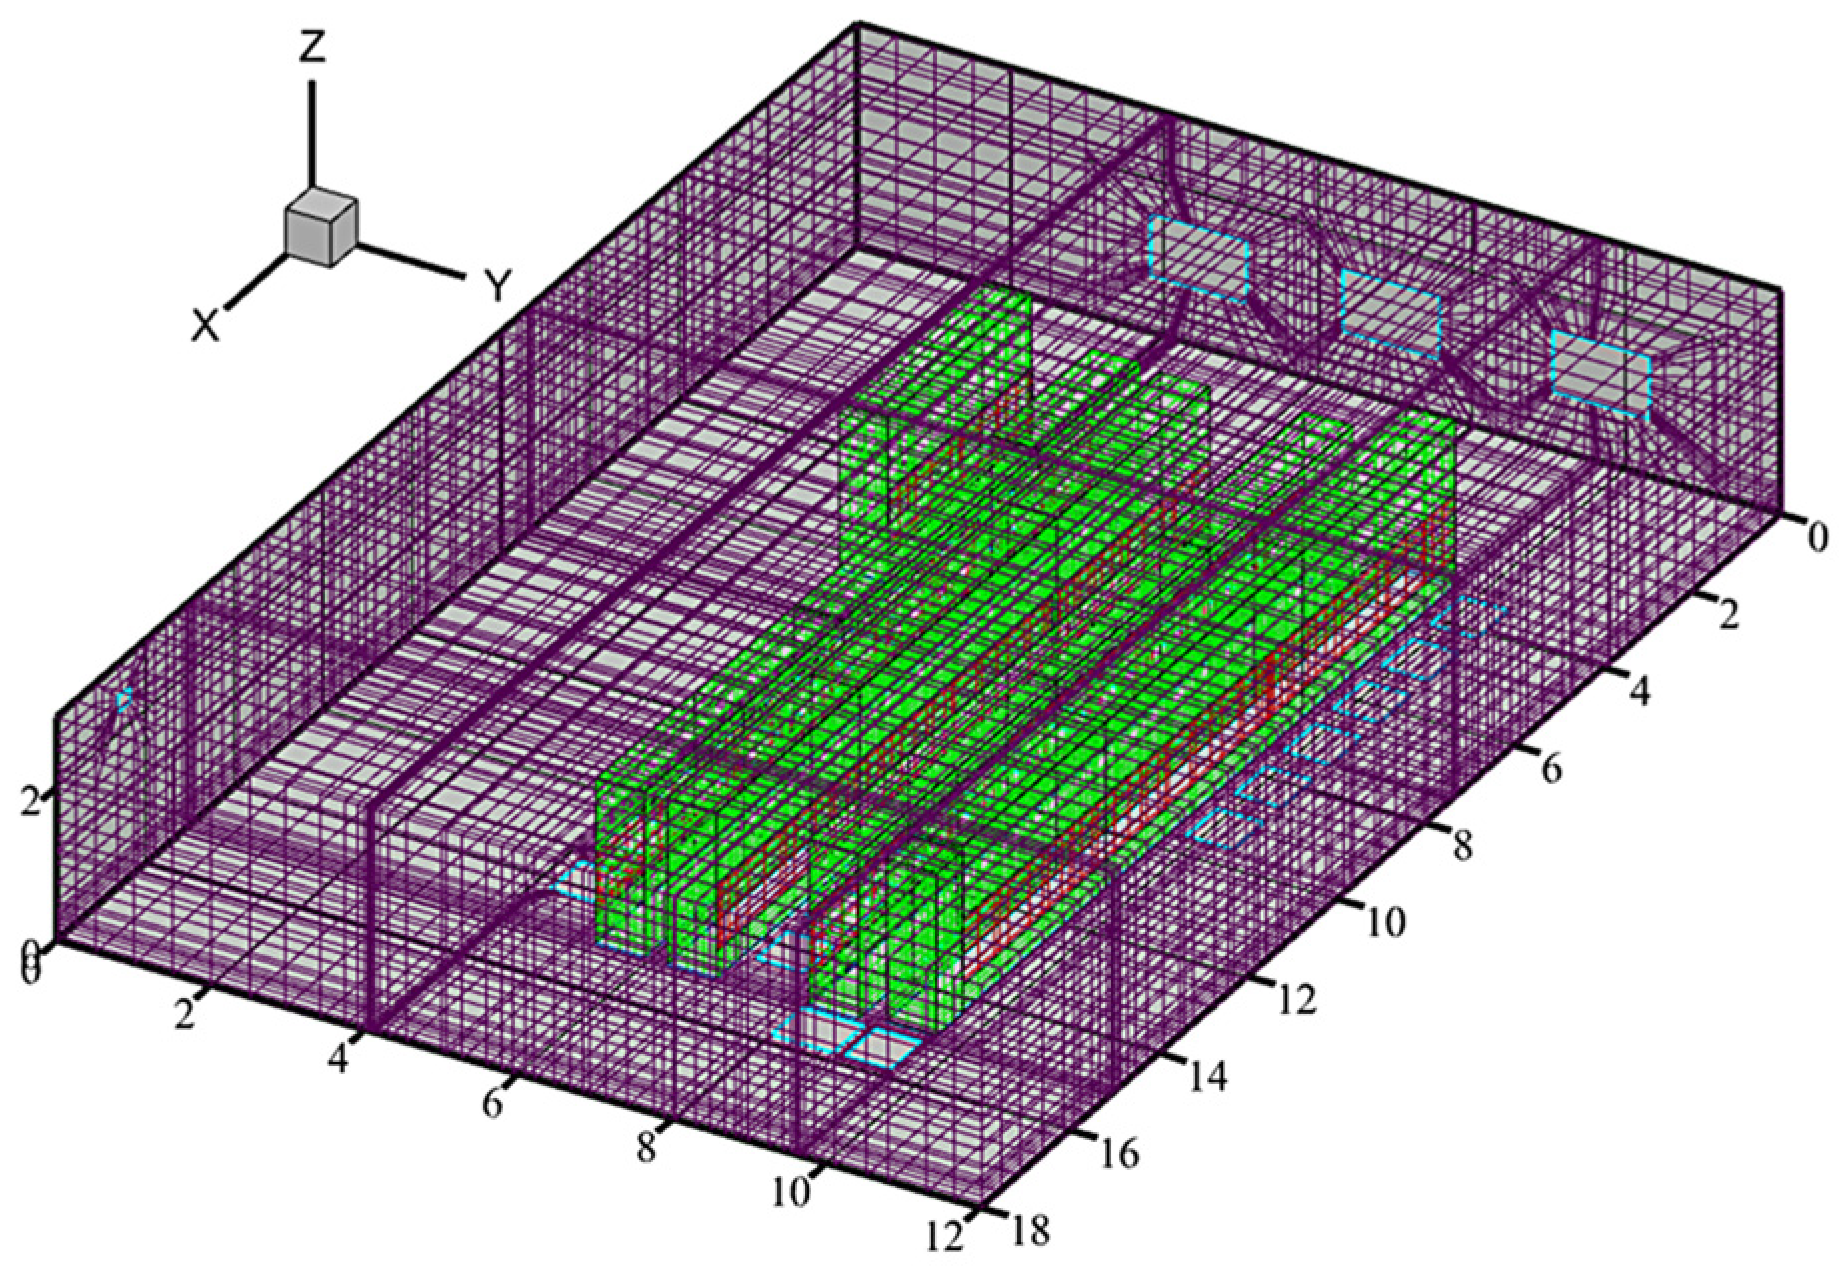
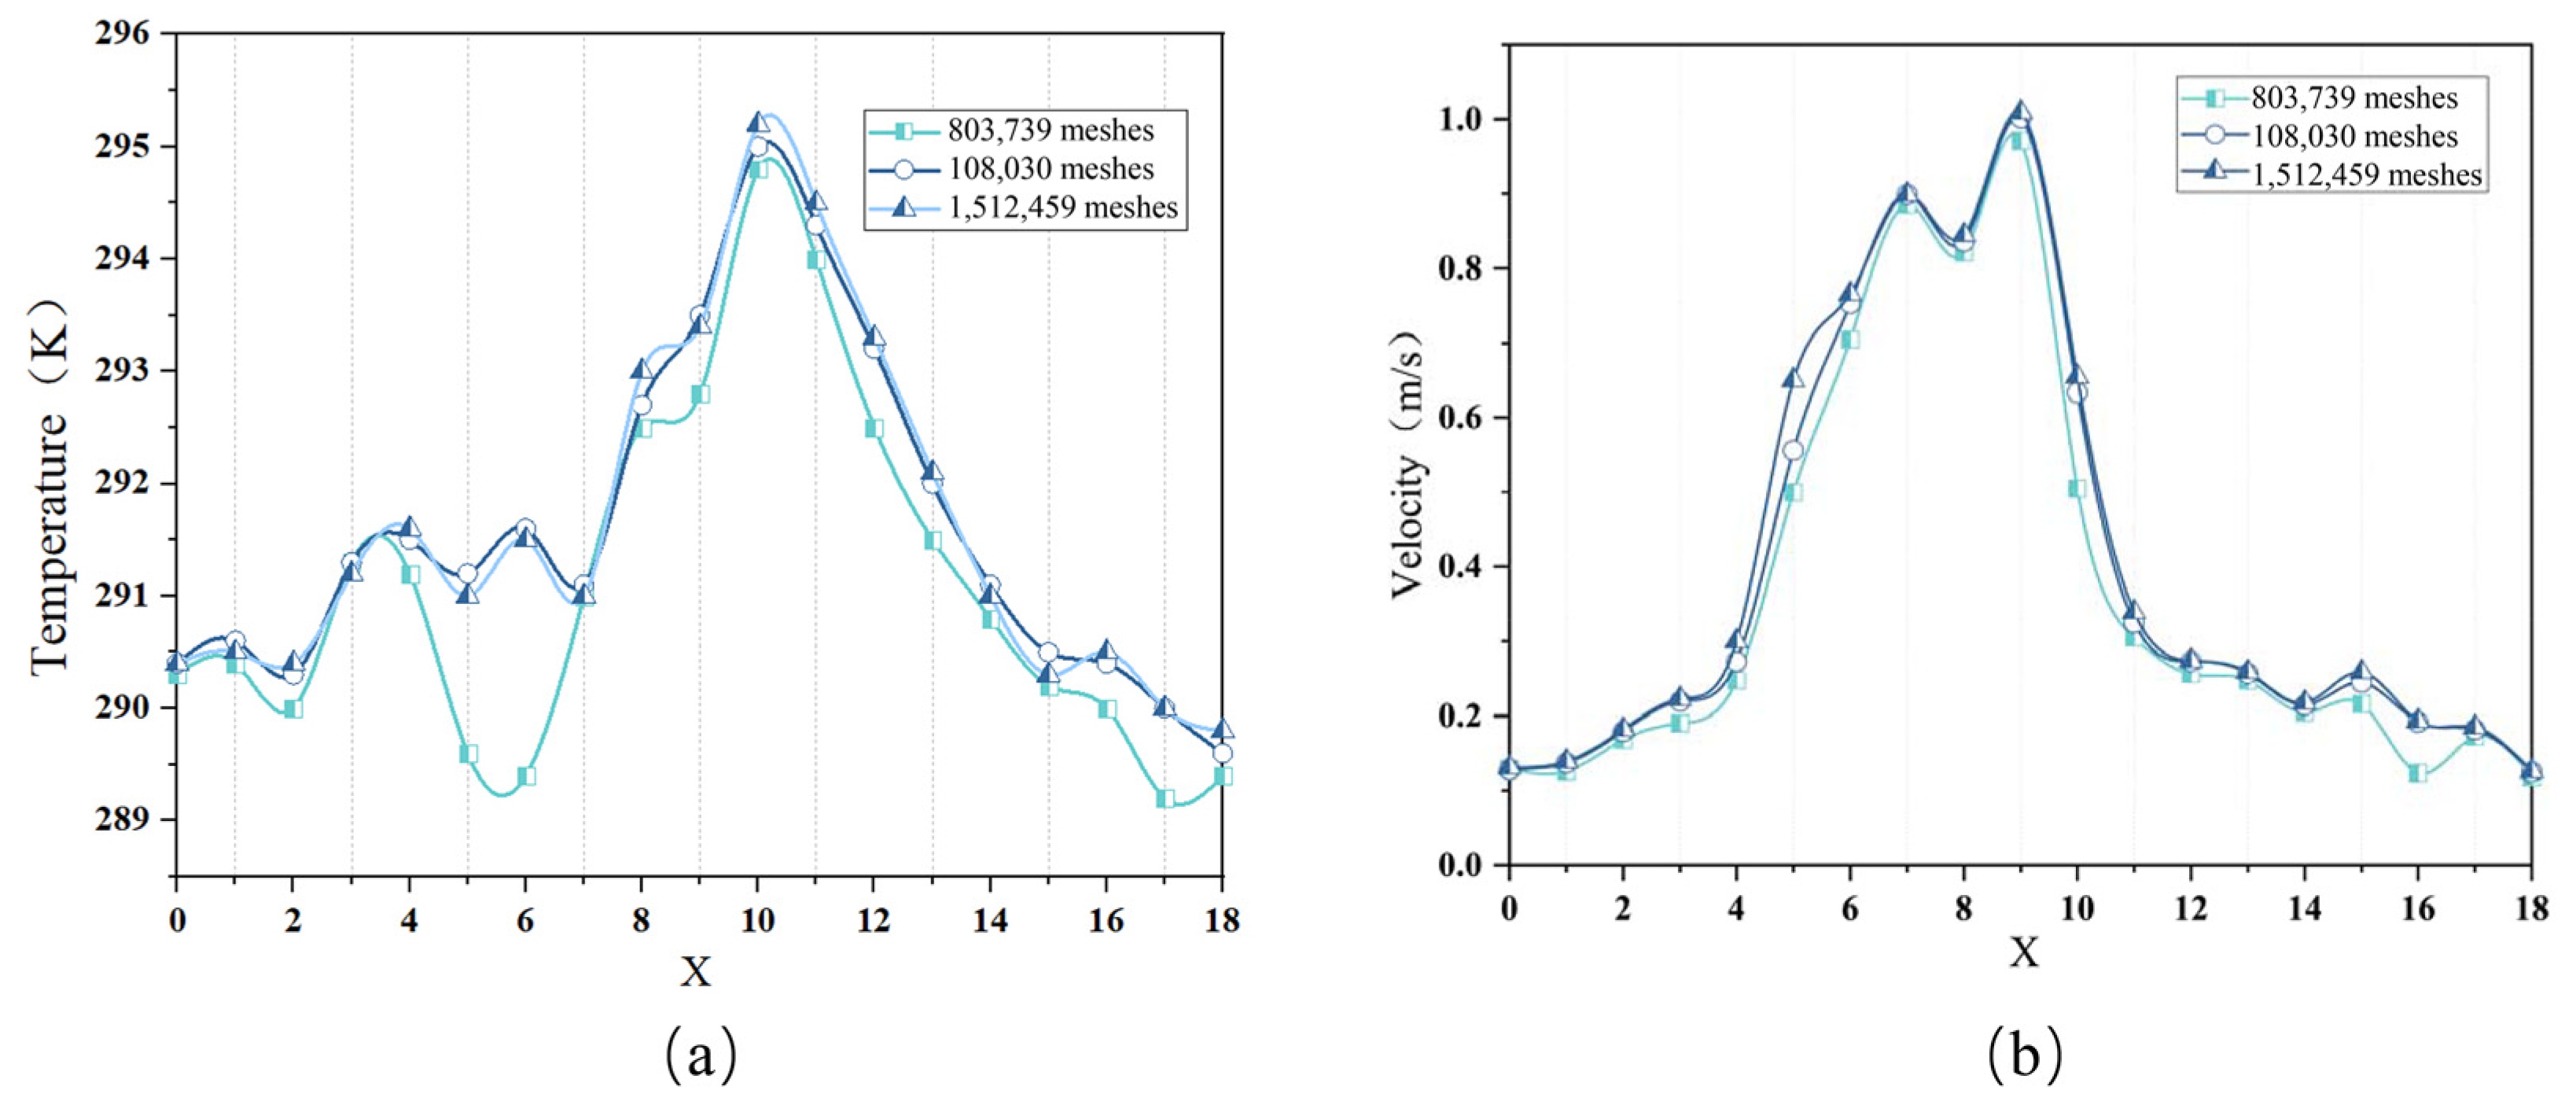
2.4. Mesh Generation and Independence Verification

A high-quality computational grid is the key to convergent and accurate results. If the grid is coarse, it may lead to low solution accuracy; on the other hand, if the mesh is too fine, it may significantly increase the computational cost [41]. The Airpak 3.0 provides three different mesh generation tools: hexahedral, tetrahedral, and hexagonal mesh generators. Among these, the unstructured hexahedral mesh generator is the default and is recommended for use in various scenarios due to its broad applicability [42,43]. Therefore, this generator was used. Airpak 3.0’s preset parameters were used to generate an initial mesh representing the minimum number of elements that represented the model geometry and met the default mesh criteria, as shown in Figure 5. A total of 108,030 elements were generated for Case 1.
To confirm the independence of the grid, we used different values for the maximum X, Y, and Z dimensions, resulting in the generation of two additional grids: a medium-density grid containing 803,739 elements and a high-density grid containing 1,512,459 elements. In addition, object-specific mesh refinement techniques to enhance the mesh quality in localized areas were utilized, as shown in Figure 6.
Figure 7 illustrates the airflow temperature and velocity distributions along a line parallel to the positive X-axis, starting at X = 0, Y = 11 m, and Z = 1.3 m, for three different mesh resolutions. The mesh with 803,739 elements deviated by approximately 2% compared to the finest mesh, which contained 1,512,459 elements. In contrast, the results obtained with the coarsest mesh of 108,030 elements differed by up to 15%. Consequently, a grid with 803,739 elements was deemed sufficiently accurate for numerical simulations.

3. Results and Analysis

To fully evaluate the effectiveness of these two ventilation solutions in achieving effective ventilation and cooling and ensuring occupant comfort, the simulation results are presented by focusing on five key planes, as shown in Figure 8. These planes, which cover the main pedestrian areas and the space representing the perceived head height of standing occupants, include the following: the X = 16 m plane (Plane A), perpendicular to the X-axis; the Y = 5 m plane (Plane B), perpendicular to the Y-axis; the Y = 7.5 m plane (Plane C), perpendicular to the Y-axis; the plane of Y = 10 m (Plane D), also perpendicular to the Y-axis; and finally the plane of Z = 1.75 m, perpendicular to the Z-axis (Plane E). These were selected taking into account the perceived average height of the worker’s head when standing.

3.1. The Comparative Analysis of the Simulated Results of Case 1 and Case 2

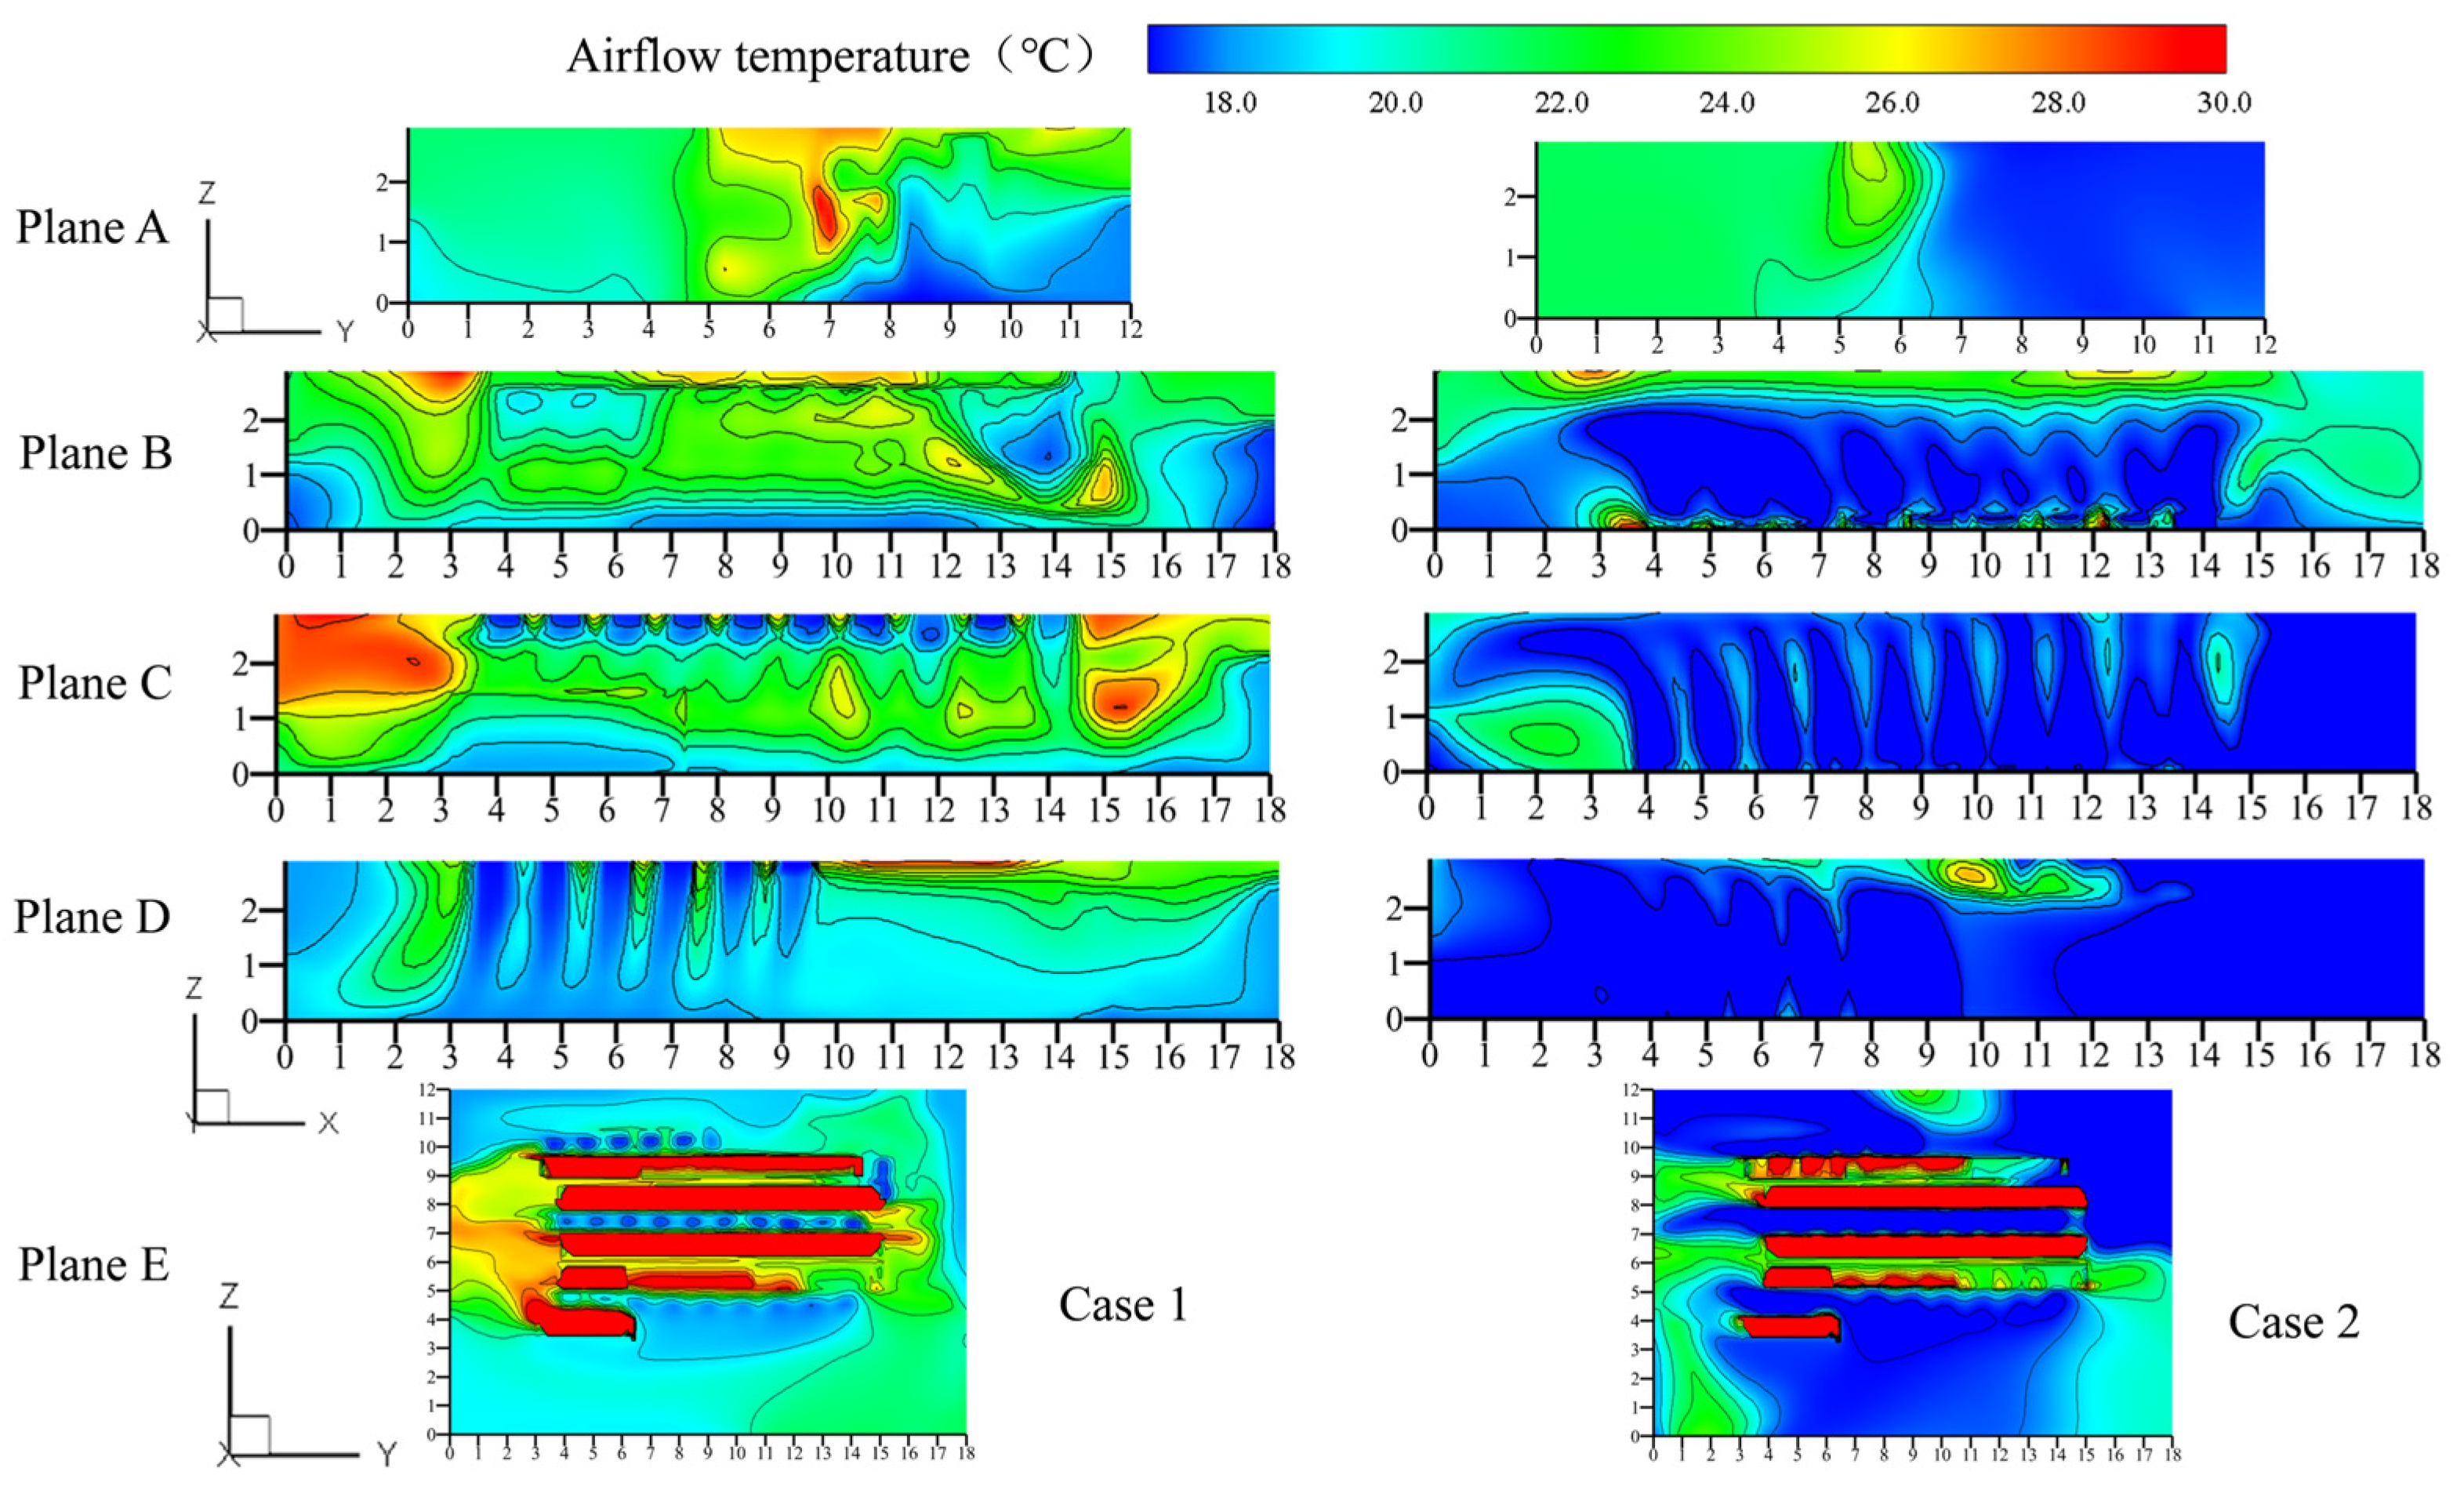
3.1.1. The Comparative Analysis of the Distributions of the Air Temperatures

The comparisons of the distributions of the air temperatures for the five planes in the control room for Case 1 and Case 2 are shown in Figure 9. In Case 1, the temperature in Plane A climbed to about 29 °C due to the heat sources and the obstructions of the airflow. In the aisle sections (Planes B, C, and D) of the room, the heat dissipation of the equipment was mainly concentrated in the side area at the bottom, and the top air intake failed to effectively remove the heat released by the equipment, resulting in a high temperature zone of more than 30 °C in these sections. Yang et al.’s research demonstrates the same trend [1]. At a height of 1.75 m, corresponding to the average height of a standing operator, the temperature in some pedestrian areas approached 30 °C. In contrast, Case 2 exhibited superior temperature control in all planes, with temperatures between 18 and 23 °C in most areas. This significant difference suggests that Case 2 is more effective in addressing the heat generated by the equipment, efficiently removing heat from the middle and lower parts of the equipment in a timely manner, providing a more uniform cooling effect in the room.

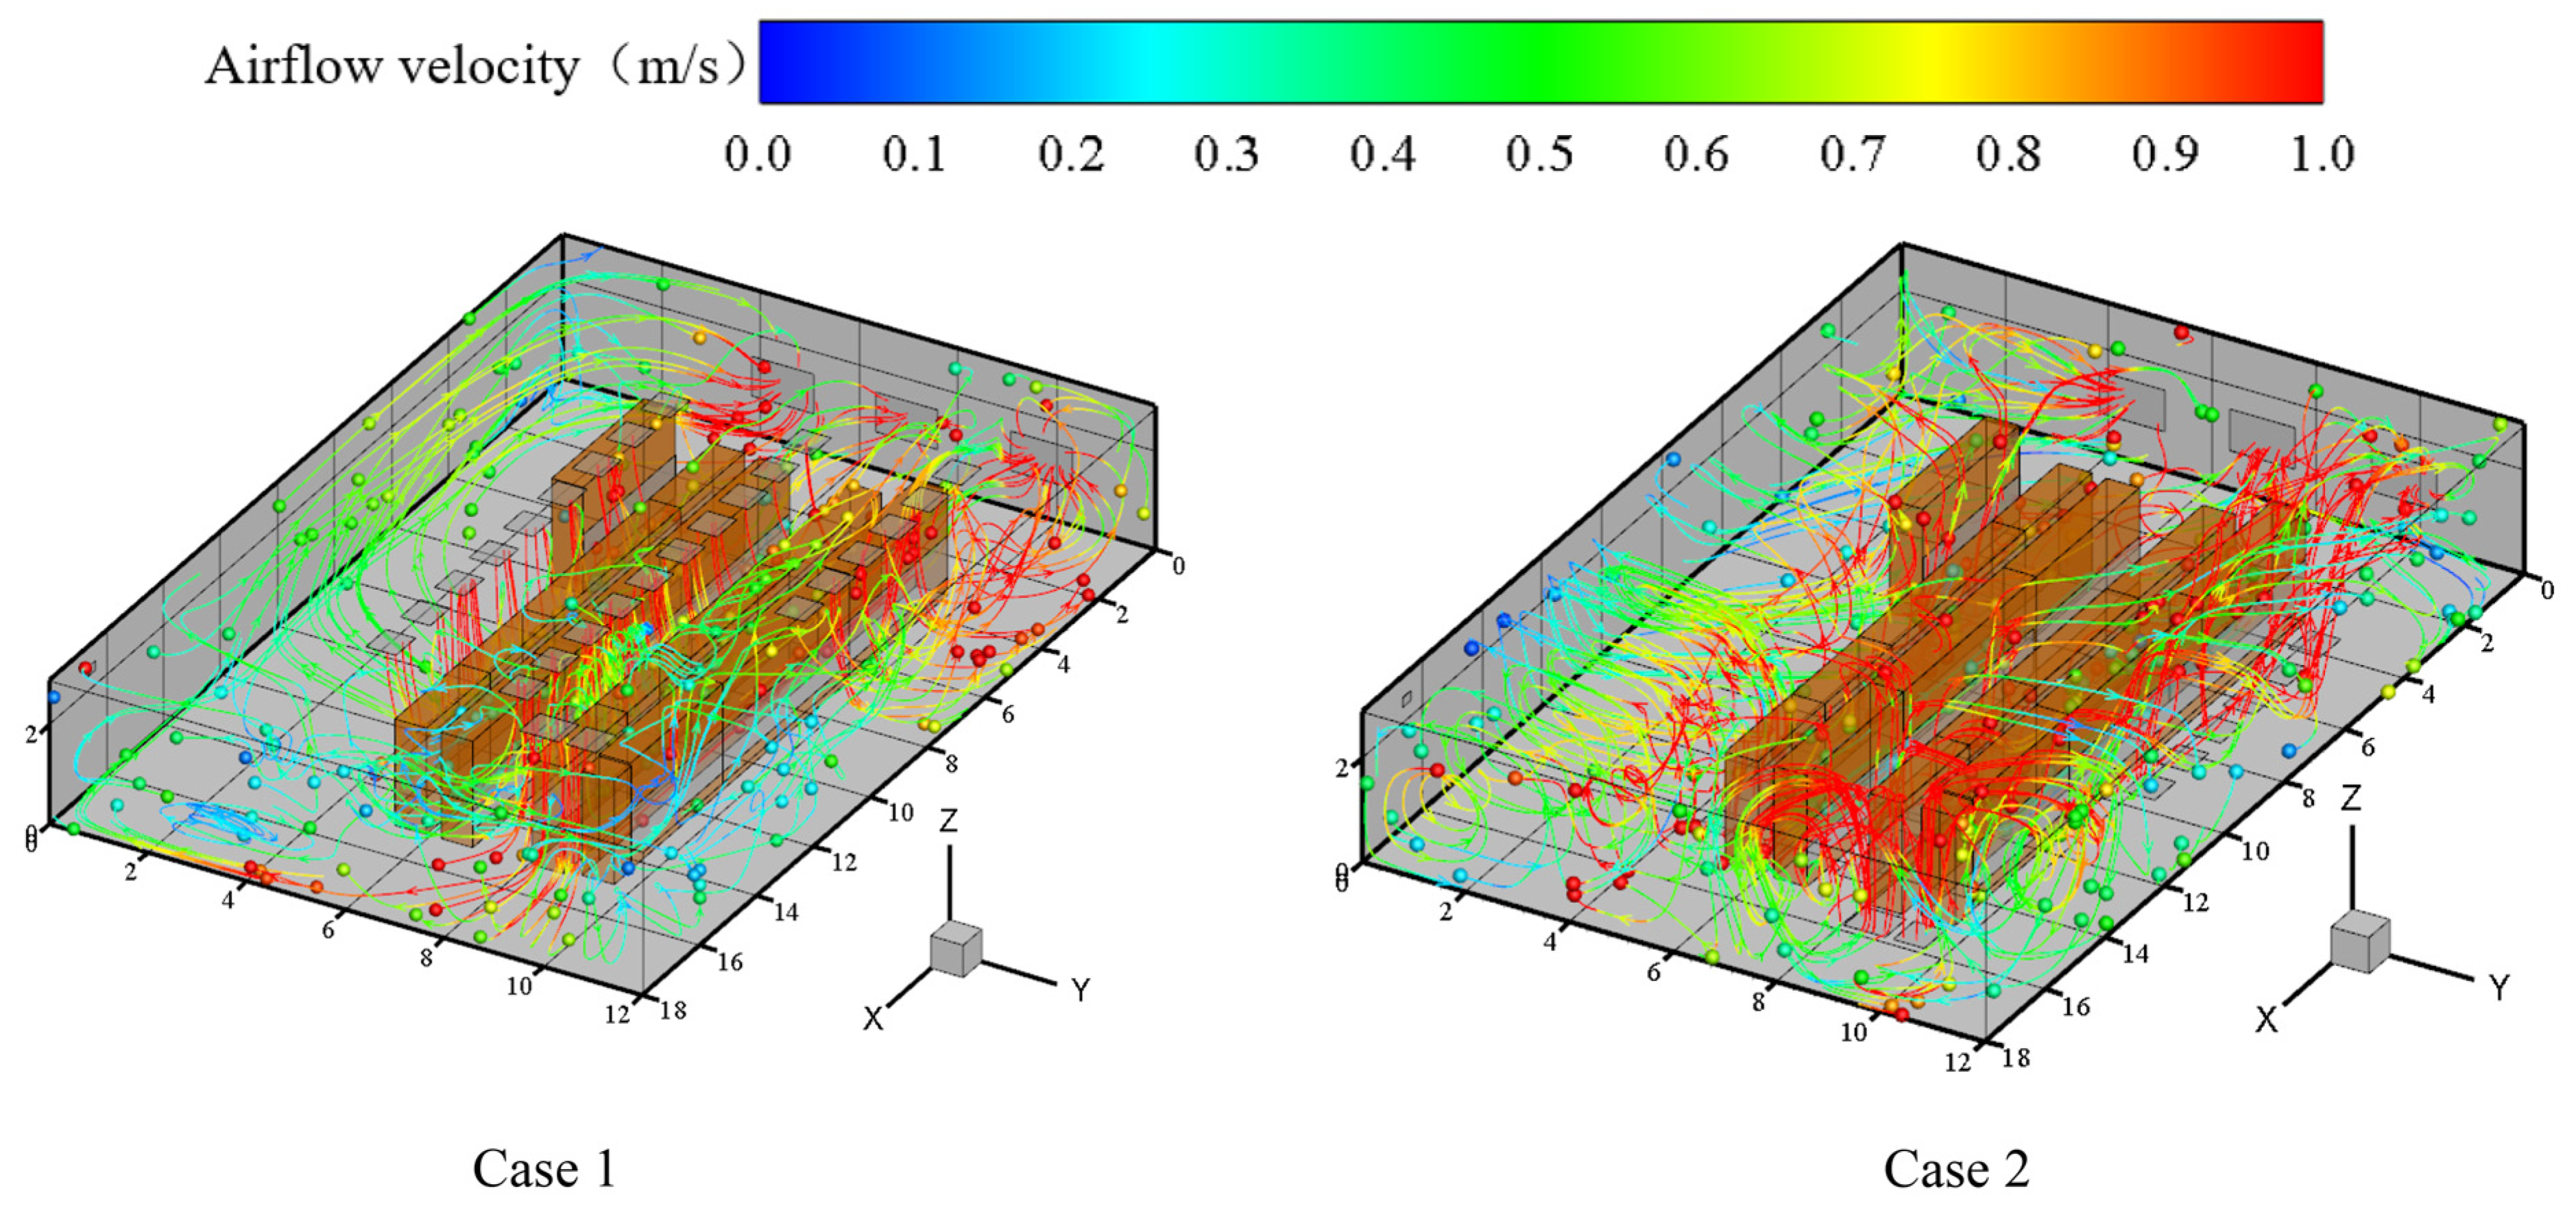
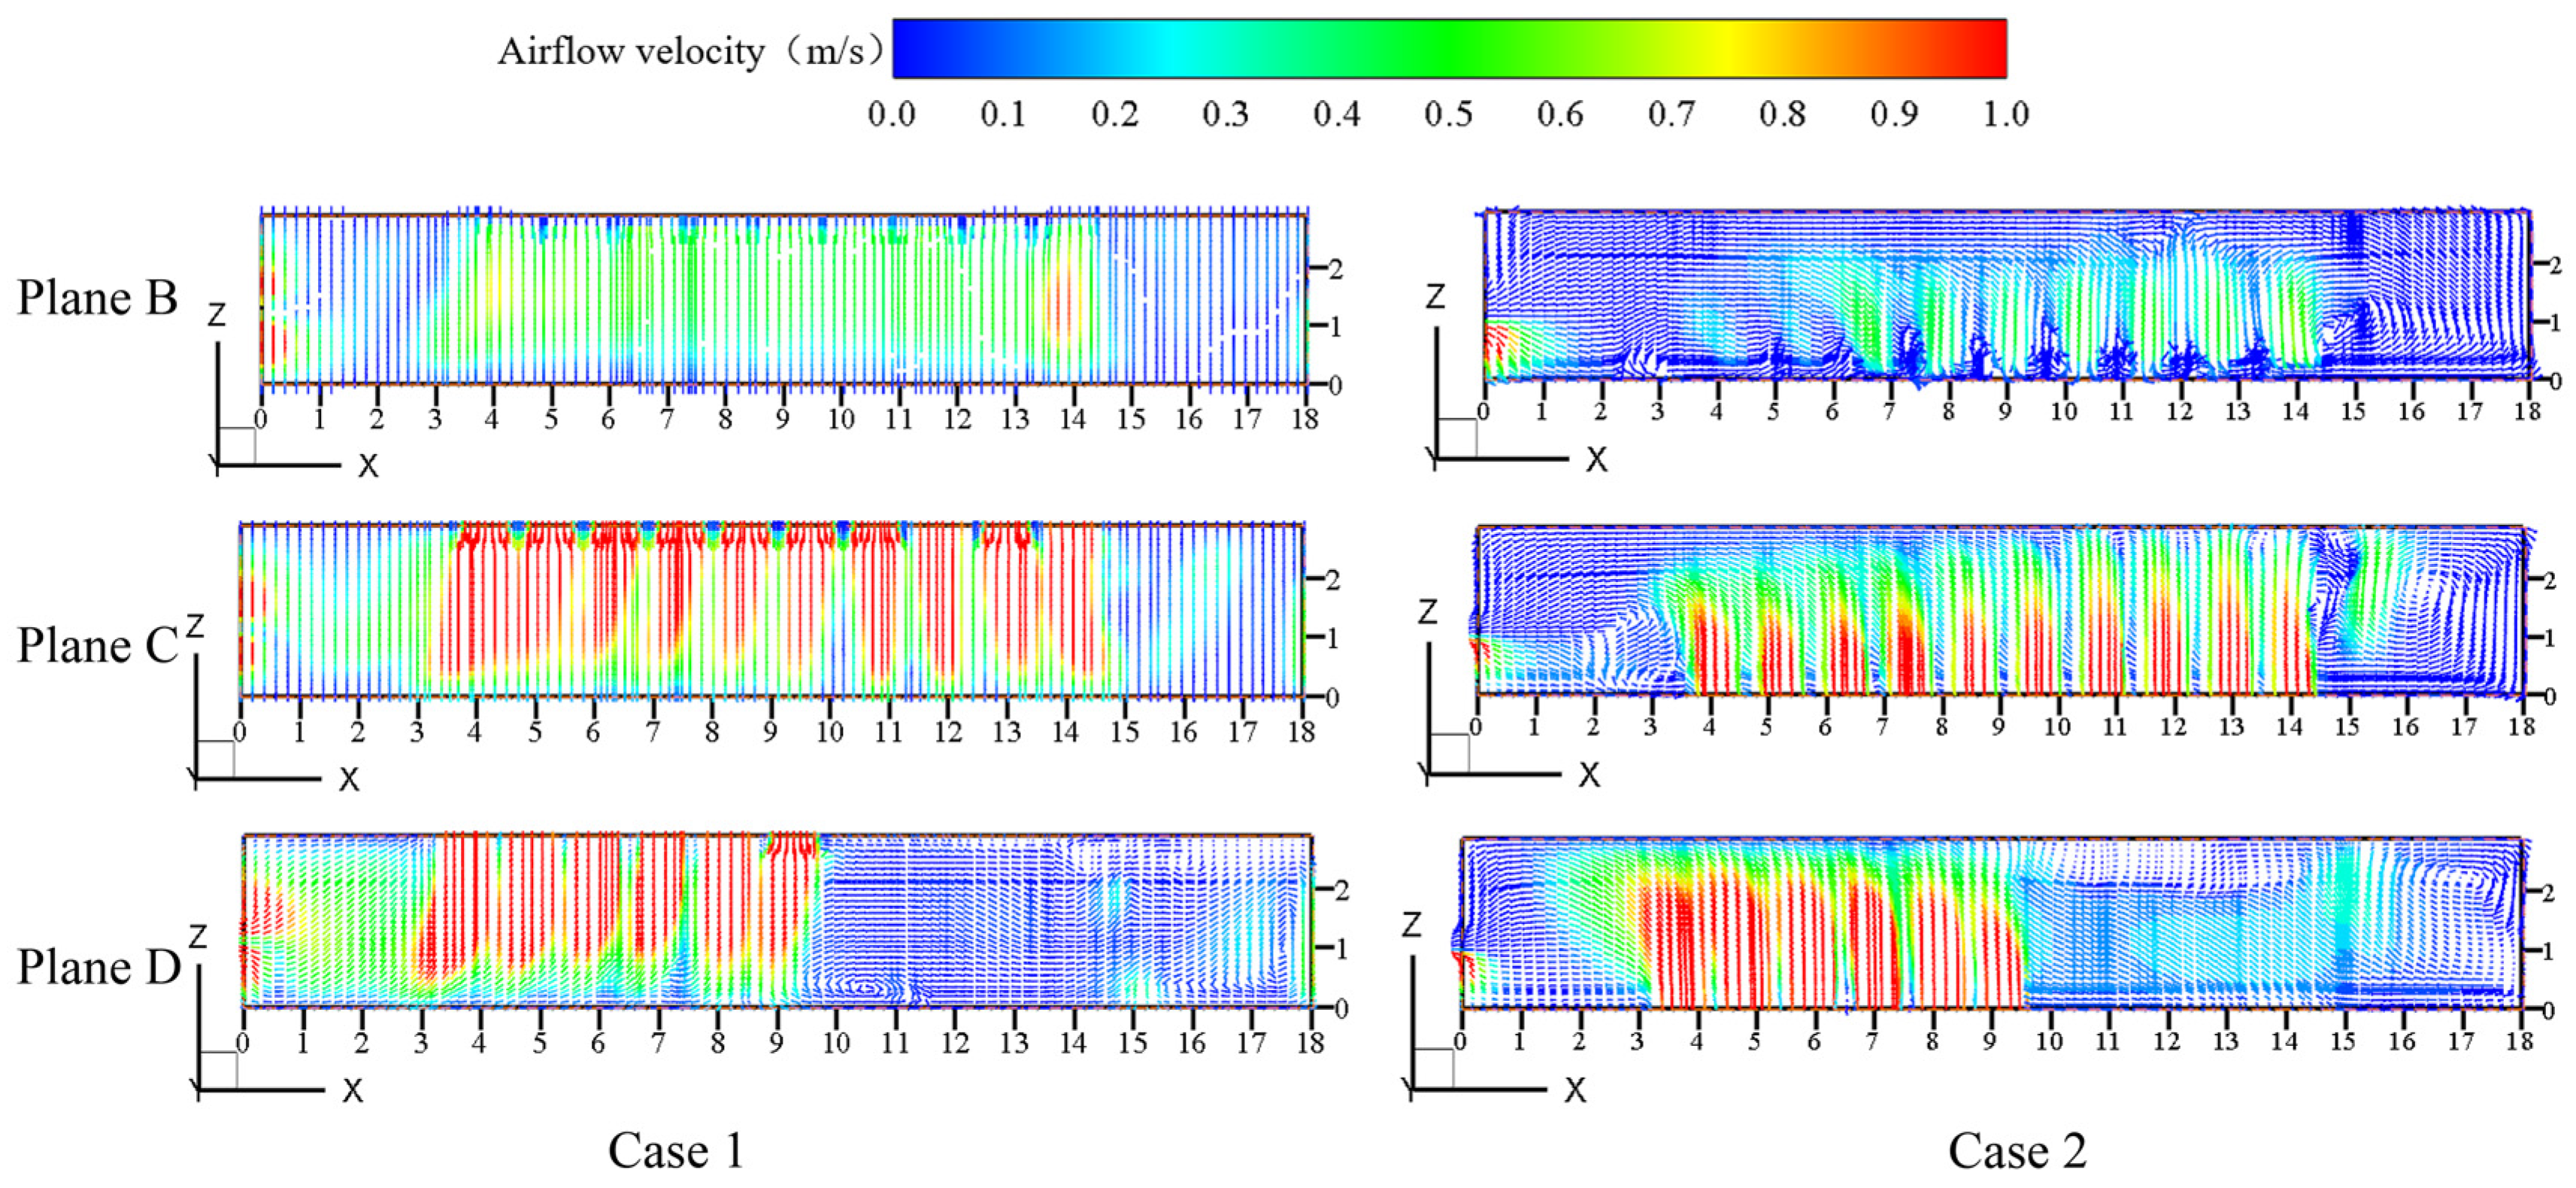
3.1.2. The Comparative Analysis of the Distributions of the Air Velocities

Figure 10 compares the effects of the two cases. Case 1 revealed that the airflow trajectories converged near the ceiling and then descended vertically. In contrast, Case 2 depicted the air flow as being more widely dispersed, primarily near the ground level. This solution is particularly suitable for environments where heat is mainly generated in the middle and lower parts of the plant. To further clarify the distribution of the velocity field, small dots were used to indicate the streamlines, making the distinct velocity characteristics more clearly visible and easier to interpret.
The diagram provides an overview of the overall effects of the two cases. The velocity vector diagrams of three representative aisle cross-sections (Planes B, C, and D) were used for analysis, as shown in Figure 11. In this diagram, the color band at the top represents the magnitude of the velocity (measured in meters per second), with the red gradient indicating higher velocities. By comparing Case 1 and Case 2 and examining the velocity vector distributions of the three cross-sections, different airflow dynamics can be revealed.
In Case 1, the velocity vectors were primarily concentrated around the aisle vent, and a clear vortex zone formed in the X = 0–1 m region across all three cross-sections, indicating significant instability in this area. In contrast, in Case 2, the vortex region was smaller, with the velocity vectors concentrated around the center of the cross-section, suggesting enhanced airflow stability under this scheme. Notably, in the three cross-sectional views of Case 2, the airflow enters the room from the bottom and quickly and effectively removes heat from the middle and lower parts of the equipment. This is consistent with Li’s research [16], indicating that Case 2’s ventilation solution better meets the cooling needs of the control room.

3.1.3. The Comparative Analysis of the Thermal Comfort

Figure 12 shows the PMV and the PPD thermal comfort metric contours in Plane E of the two cases. The PMV value was obtained based on a specific scenario and involved conducting a thermal sensation survey for a group of individuals. The survey questionnaire included seven thermal sensation categories, and the PMV value was derived from the voting results of this group. Generally, the higher the PMV value, the stronger the thermal sensation, but it should not be too low, as this could lead to a feeling of coldness. The specific seven-point thermal sensation scale is detailed in Table 3.
Given that the single PMV index is insufficient to comprehensively reflect the thermal sensation differences among individuals in a given environment, the PPD index was introduced as a supplementary measure. The PPD is essentially a probabilistic measure associated with the PMV, and its calculation formula is as follows:
P P D = 100 95   exp 0.03353 ( P M V ) 4 + 0.2179 ( P M V ) 2
In terms of the thermal comfort evaluation, the optimal state is achieved when the PPD is around 5%, as this corresponds to the lowest dissatisfaction rate among individuals. Additionally, when the PMV value is between approximately −0.5 and +0.5 and the PPD is controlled within 10%, thermal comfort for the individuals can be achieved. It should be noted that the PMV-PPD evaluation criteria are primarily applicable to situations where individuals are in a seated or minimally active state. These criteria are highly suitable for analyzing thermal comfort in enclosed environments [44].
For Case 1, the PMV contour shows that about half of the area in the plane was between 1.5 and 2.5, i.e., the yellow-orange part of the map, if the red area near the device (which represents high thermal stress) is not considered. The corresponding PPD contour reveals that the PPD values were also higher in these areas of a higher PMV, mainly between 50 and 90, indicating that human dissatisfaction with the environment is higher in these regions.
It was observed that the distributions of the PMV indicator showed a significant change in Case 2. Specifically, in Case 2, the yellow-orange zone in the PMV heat map, which represents the somatosensory thermal state, had largely dissipated. Instead, there was an increase in blue-green regions, with the PMV values mainly distributed between −1.5 and −0.5, suggesting that the ambient temperature is lower in this scenario, which may cause a mild chill in the body. In addition, from the comparison of the PPD heat maps, it is evident that the reduction in the red area in Case 2 is indicative of a general reduction in the level of dissatisfaction, which is in line with Ma’s research [9].
Overall, the performance of Case 2 for human comfort was significantly better than that of Case 1. However, despite the improvements, the PMV-PPD values in Case 2 still did not meet the ideal comfort range, i.e., the PMV value being within ±0.5 and the PPD being below 20%. Therefore, based on the results of Case 2, follow-up studies focused on further optimizing the air conditioning and ventilation system to achieve a more comfortable indoor environment.

3.2. The Optimization of the Air Supply Conditions of the Control Room

Previous CFD numerical simulations demonstrated that the proposed tunnel ventilation method outperforms conventional methods under the supply air conditions of an inlet velocity of 1.66 m/s and an air temperature of 15 °C. To further investigate the potential performance of this new ventilation approach, a stepwise variable optimization strategy was employed.
In the first step, the air temperature was fixed at 15 °C while the inlet velocity was varied. Two adjustments to the initial velocity were tested: an increase of 0.5 m/s (resulting in 2.16 m/s) and a decrease of 0.5 m/s (resulting in 1.16 m/s). Using CFD numerical simulations, key parameters such as the airflow field and thermal comfort distributions were analyzed to evaluate the impact of different airflow velocities on the ventilation performance. Based on these results, the optimal inlet velocity was identified.
In the second step, the selected optimal inlet velocity was maintained, and the supply air temperature was varied. Two temperature adjustments were tested: an increase of 2 °C (to 17 °C) and a decrease of 2 °C (to 13 °C). CFD simulations were conducted to assess the effects of air temperature changes on various performance indicators of the ventilation system.
This stepwise optimization systematically examined the influence of the airflow velocity and air temperature on the new ventilation method for the control room of the self-elevating offshore platform’s submersible electric pump system. The findings provide a scientific and practical basis for optimizing ventilation system parameters in real-world applications.

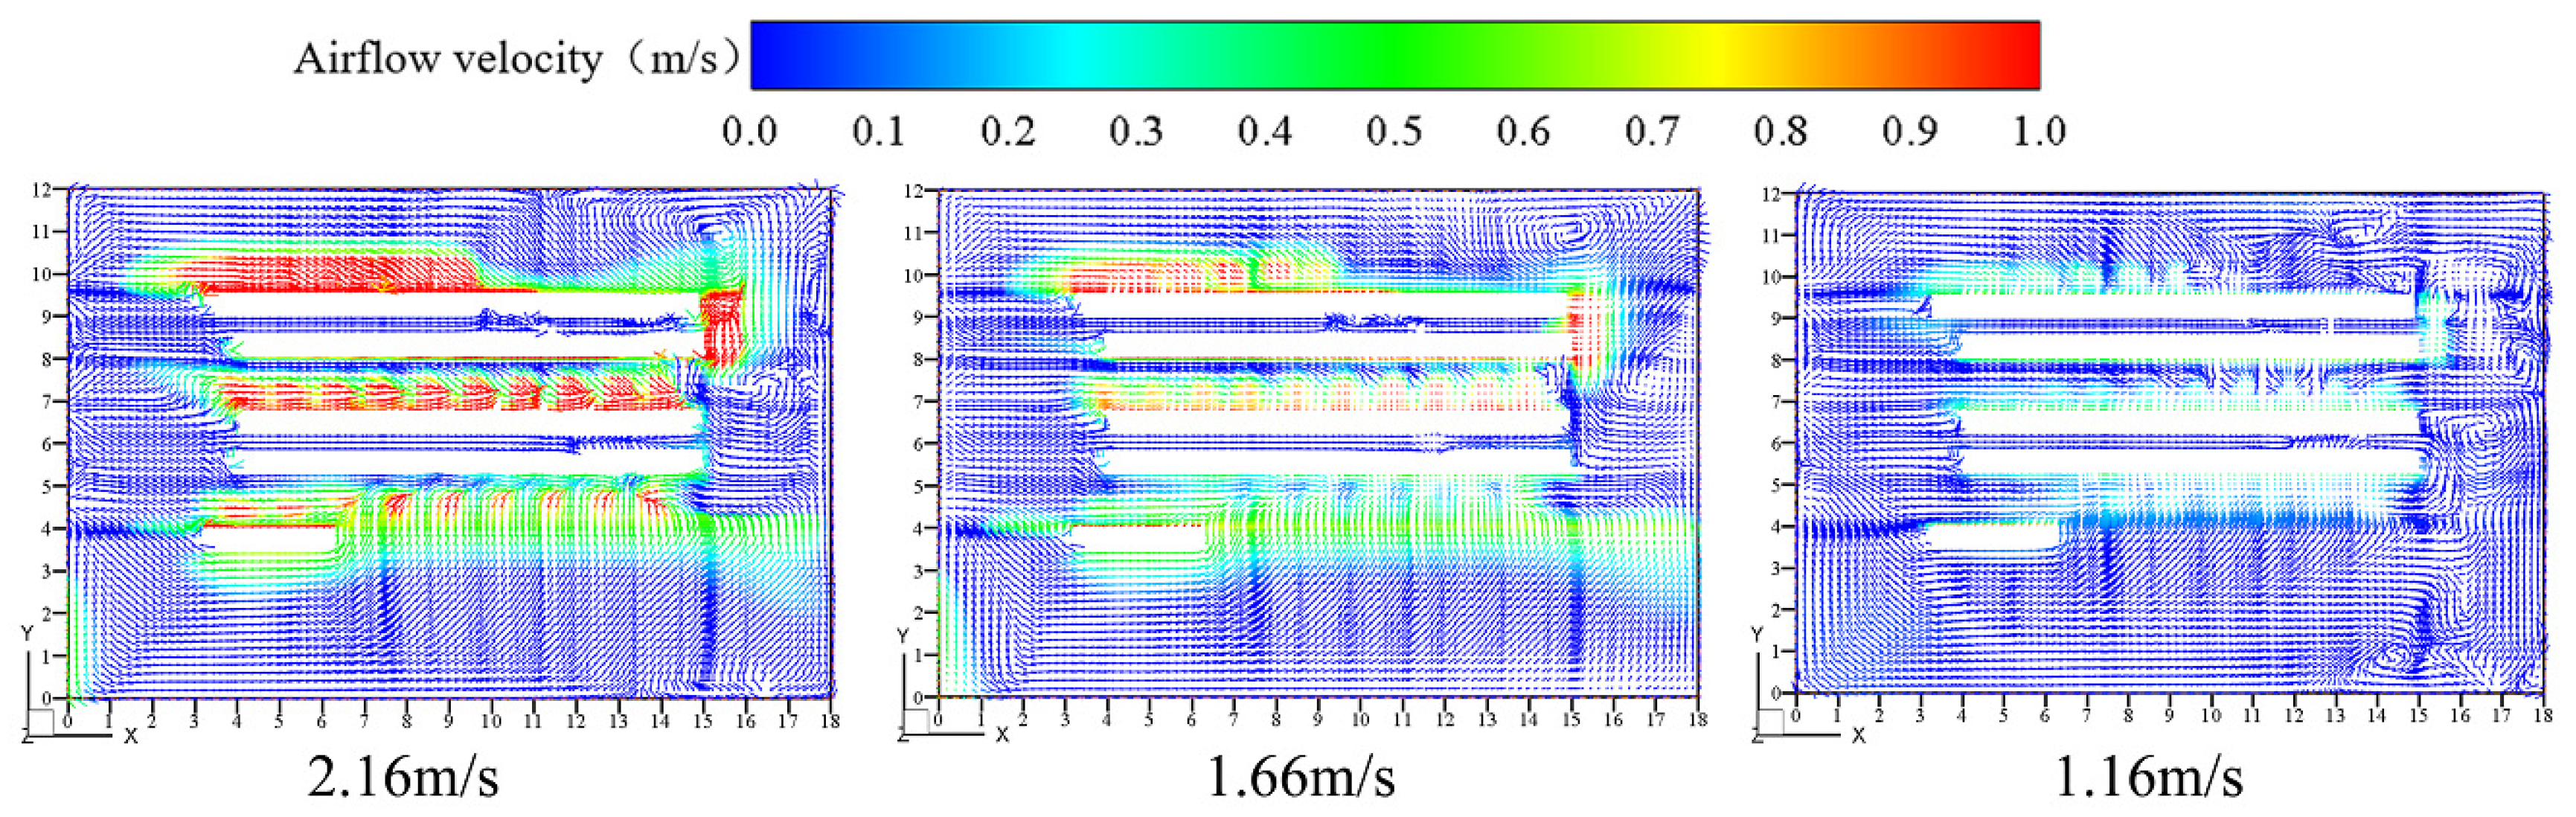
3.2.1. The Optimization of the Air Supply Velocity

Figure 13 illustrates the airflow velocity vector distribution in Plane E under three different air supply velocities. The results indicate that at an inlet velocity of 1.16 m/s, the airflow velocity in Plane E remained steady at 0.3 m/s, meeting the requirements for the indoor airflow velocity specified in the Design Code for Heating, Ventilation, and Air Conditioning of Civil Buildings (GB 50736-2012) [45]. However, at higher inlet velocities (2.16 m/s and 1.66 m/s), localized red zones appeared at the same height, indicating areas where the airflow velocity exceeded the standard limits. This excessive velocity could negatively impact thermal comfort.
Figure 14 illustrates the PMV-PPD distribution in Plane E under three different air supply velocities. As shown in the figure, a decrease in the intake velocity led to the gradual expansion of the green area in the PMV distribution, with PMV values approaching ±0.5. This indicates an improvement in thermal comfort in the head region of the plane. When the PMV value was within the range of ±0.5, the corresponding PPD distribution showed a larger proportion of blue areas, suggesting a reduction in occupants’ dissatisfaction with the environment.
Comparing the thermal comfort under the three different air supply velocities reveals that an intake velocity of 1.16 m/s significantly enhanced the thermal comfort of occupants compared to the original design. Further analysis of the PMV-PPD distribution at this velocity highlights a marked improvement in the overall comfort. However, in the lower area near the air outlet, the PMV values indicated reduced thermal sensation, while the PPD values suggested a dissatisfaction rate between 30% and 50%. To address this issue, adjustments to the inlet air temperature are recommended to further optimize the thermal comfort for control room personnel at the intake velocity of 1.16 m/s.

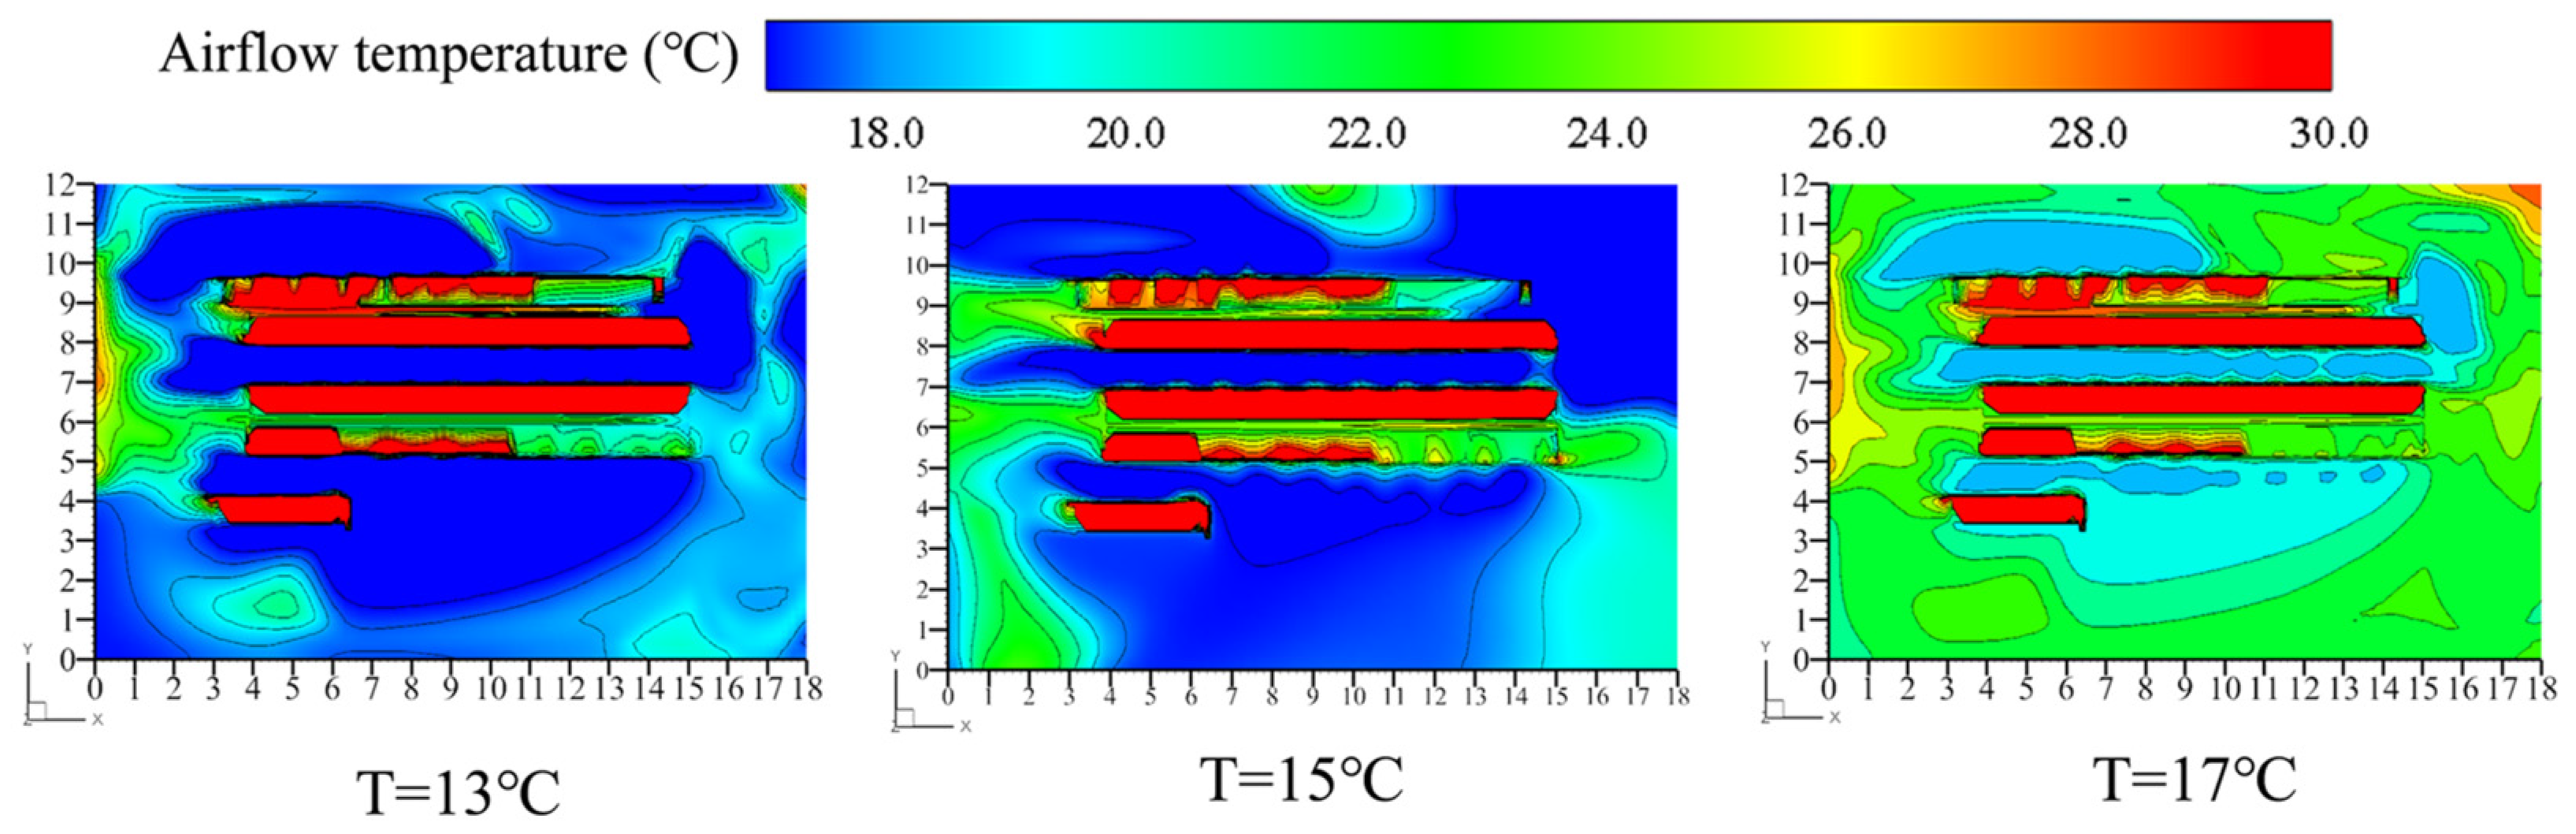
3.2.2. Optimization of the Air Supply Temperature

To examine the impact of intake temperature variations on the PMV-PPD, this study compared operating conditions with air supply temperatures of T = 17 °C and T = 13 °C, using T = 15 °C as the baseline. The analysis focused on the airflow temperature contour lines and the PMV-PPD distribution in Plane E. Figure 15 illustrates the temperature profile distribution in the Plane E cross-section under the three intake temperature conditions. At the baseline setting (T = 15 °C), the air temperature in Plane E was from 18 °C to 22 °C. When the air supply temperature was reduced to 13 °C, the pedestrian area temperature decreased to 18–22 °C. However, in both cases, the indoor air temperature remained below the universally recognized comfort range. Conversely, increasing the air supply temperature to 17 °C resulted in a temperature distribution heat map displaying yellow-green tones, indicating that the pedestrian area temperature rose to 26 ± 2 °C, which aligns with general comfort requirements for building ventilation and indoor temperature control standards.
As shown in Figure 16, an increase in the air supply temperature led to an expansion of the green area in the PMV index distribution, indicating an enlarged thermal comfort neutral zone. Simultaneously, the blue area decreased, reflecting a reduction in slightly cooler regions. In the PPD index distribution, the blue area increased, suggesting a growing proportion of individuals dissatisfied with the thermal environment. When the air supply temperature was set to 17 °C, the thermal comfort indices in the pedestrian zone met the standards defined by ISO 7730 [46], with −0.5 < PMV < 0.5 and PPD < 10%. This demonstrates that at this temperature, the thermal environment in the room achieves optimal conditions for human thermal comfort. These findings provide valuable insights for regulating indoor thermal environments to enhance occupant comfort.

4. Limitations and Research Prospects

This study has certain limitations, primarily related to the idealized assumptions made in the model. Although a 3D physical model was constructed using Rhino 7 and Airpak 3.0 [47,48], it inevitably contains several idealized assumptions. In actual offshore operations, the electrical submersible pump (ESP) control room on a self-elevating offshore platform is subject to various dynamic factors, such as wave-induced motion and platform vibrations. These complex dynamic conditions are difficult to accurately replicate in numerical simulations, leading to discrepancies between the model and real-world conditions, which may affect the accuracy of the ventilation performance predictions. Additionally, while key factors such as the temperature and heat were considered when setting the boundary conditions for the model, some more complex boundary conditions were simplified for the sake of computational efficiency and ease of analysis. For example, the impact of salt corrosion in the marine environment was not fully accounted for, which could potentially affect the long-term performance of the ventilation equipment and the indoor environmental comfort, causing a divergence between the research findings and the actual performance under long-term operational conditions.
To address these issues, future research could focus on the following areas: First, introducing multi-physics coupled simulation techniques, integrating the dynamic characteristics of the offshore platform (e.g., wave forces, structural vibrations) with the fluid dynamics and thermodynamics of the ventilation system, in order to develop dynamic simulation models that more closely represent real operational conditions. This refined simulation approach would allow for a deeper exploration of how the ventilation system performance changes in dynamic environments, providing more accurate guidance for engineering design. Second, expanding the scope of the research to incorporate the impact of complex marine environmental factors, such as variations in the salinity, to comprehensively evaluate the effects of these factors on the durability of ventilation system materials, the heat exchange efficiency, and the overall indoor environmental quality, thereby meeting the diverse needs for efficient and reliable ventilation solutions for various types of offshore platforms.

5. Conclusions

This study, based on high-precision numerical simulation techniques and supplemented by rigorous theoretical analysis, comprehensively investigated the significant advantages of applying a novel tunnel ventilation system compared to traditional ceiling-mounted ventilation in the electrical submersible pump (ESP) control room of a self-elevating offshore platform. It injects a strong impetus into the innovation of marine cabin ventilation technology and opens up a new perspective in related academic fields.
Through an in-depth comparison of simulated temperature contour plots, the meticulous identification and statistical analysis of a vast amount of simulation data undoubtedly confirm the remarkable effectiveness of the tunnel ventilation system in mitigating indoor temperature fluctuations and reducing extreme temperature values. Compared to the traditional ceiling-mounted ventilation mode, the tunnel system demonstrates an exceptional heat dissipation capacity, accurately locating and rapidly dispersing high-heat zones surrounding indoor heat sources. This fundamentally prevents the formation of localized overheating “hot spots”, creating a temperature-appropriate and stable operating environment for sensitive equipment such as ESP control systems. This significantly reduces the risk of equipment failure caused by high temperatures and ensures the continuity and reliability of key operational processes on offshore platforms.
Furthermore, when extending the analysis to encompass multiple factors such as the temperature, velocity, and PMV-PPD indices [49,50,51], systematic data analysis clearly highlights the outstanding achievements of the tunnel ventilation system in reshaping the indoor thermal comfort ecosystem. Starting with the actual thermal comfort feedback of personnel, workers in the indoor environment were relieved from the discomfort of heat, stuffiness, and a turbulent airflow, resulting in a substantial improvement in thermal comfort. This not only directly boosts the immediate work efficiency of field operators and reduces human errors induced by environmental discomfort, thereby mitigating potential safety risks, but also, from a long-term health perspective, establishes a robust physical and mental protective barrier for personnel stationed on offshore platforms who endure high-intensity operational pressures. This strongly supports the efficient and stable execution of various complex and challenging development tasks on offshore platforms.
Furthermore, through a detailed optimization analysis of the ventilation conditions, we found that the best indoor occupant comfort can be achieved at an airflow velocity of 1.16 m/s and an inlet temperature of 17 °C. The optimization process involved adjusting different ventilation parameters, including the inlet airflow velocity and inlet temperature, to determine the optimal combination for optimal comfort. This finding not only provides a more refined design basis for the environmental control system of offshore platforms but also offers valuable insights for future applications. It can inform the design of air conditioning and ventilation systems in similar environments [52,53].
In summary, the new tunnel ventilation method not only effectively improved the working environment of the control room of the electric submersible pump of an offshore platform, but also achieved a better indoor thermal environment through optimization research. In view of this, it is recommended that the application of the tunnel ventilation system should be prioritized in the design and renovation of jack-up offshore platforms in the future, and adjusted according to the optimization parameters proposed in this study, in order to achieve the best ventilation and comfort effects. At the same time, it is hoped that this study will stimulate more innovative thinking and an in-depth investigation of environmental control systems for offshore platforms.

Author Contributions

T.G.: Conceptualization; writing—original draft; data curation. M.L.: Methodology; investigation. S.Z.: Formal analysis; resources. Y.W.: Software. Y.Z.: Visualization. X.W., X.Z. and S.H.: Validation. W.Y.: Project administration; supervision; funding acquisition; writing—review and editing. All authors have read and agreed to the published version of the manuscript.

Funding

This research was funded by the Natural science Foundation of Shandong Province [grant number ZR2023M130].

Data Availability Statement

Data will be made available on request.

Acknowledgments

This work was supported by the Natural science Foundation of Shandong Province [grant number ZR2023M130].

Conflicts of Interest

The authors declare that they have no known competing financial interests or personal relationships that could have appeared to influence the work reported in this paper.

Nomenclature

vvelocity vector of the airflow, m/skTurbulent kinetic energy, m2/s2
ρAirflow density, kg/m3αkTurbulent Prandtl number for k
μDynamic viscosity of the airflow, kg/(m·s)μeffEffective viscosity, kg/(m·s)
pStatic pressure, N/kgμtTurbulent viscosity of the airflow, kg/(m·s)
τStress tensor, N/kgGkGeneration of turbulent kinetic energy due to the mean velocity gradients, Pa/s
gGravitational acceleration, m/s2GbTurbulent kinetic energy generated by buoyancy, Pa/s
FPressure, contact force and surface tension in the domain, N/kgαεInverse effective turbulent Prandtl number for ϵ
uViscosity of the airflow, m/sCModel constant
ETotal energy, W/m3CModel constant
CμModel constantCModel constant
TAirflow temperature, K or °CShHeat source in the solid body, W/m3
PMVPredicted mean votePPDPredicted percentage dissatisfied

References

  1. Yang, L.; Li, M.; Li, X.; Tu, J. The effects of diffuser type on thermal flow and contaminant transport in high-speed train (HST)cabins–a numerical study. Int. J. Vent. 2018, 17, 48–62. [Google Scholar] [CrossRef]
  2. Xu, X.; Xiao, Z.; Wang, M.; Zhu, N.; Qiang, F.; Xiao, N. Prediction Model of Exhaust Smoke Density of Non-road Mobile Machinery Based on Self—Paced Ensemble Learning. J. Shandong Univ. Sci. Technol. (Nat. Sci.) 2023, 42, 100–109. [Google Scholar]
  3. Lubosz, A.; Smoliło, J.; Chmiela, M.; Chmiela, A.; Gajdzik, M.; Smoliński, A. Assessment of the Benefits of Cooling Vests on Working Conditions of Mine Operators in Hard Climatic Conditions: A Case Study. J. Ind. Saf. 2024, 1, 100001. [Google Scholar] [CrossRef]
  4. Liu, C.; Feng, Q.; Tan, X.; Wang, Y.; Chen, Z. Design optimization of ventilation system for the main machinery room of offshore platforms. Pet. Chem. Equip. 2021, 24, 62–65. [Google Scholar]
  5. Yu, X.; Yu, H. Automated design of ventilation system for main transformer room of offshore oil platform. Pet. Chem. Equip. 2017, 20, 12–14. [Google Scholar]
  6. Ma, Z.; Xiong, Z.; Li, T.; Zhang, W. Numerical simulation of ventilation and heat dissipation of offshore platform generator set. Chem. Mach. 2020, 47, 503–507+537. [Google Scholar]
  7. Sun, D.; Zheng, X.; Tian, W.; Mao, L. HVAC optimization design of electrical room of offshore platform based on high heat dissipation. Ocean Eng. Equip. Technol. 2022, 9, 23–26. [Google Scholar]
  8. Yang, S.; Ren, R.; Wang, Y.-Q. Study on Air Cabin Ventilation System by Local Structural Optimization During Tunnel Construction. Buildings 2022, 12, 2235. [Google Scholar] [CrossRef]
  9. Wu, C.; Ahmed, N.A. A Novel Mode of Air Supply for Aircraft Cabin Ventilation. Build. Environ. 2012, 56, 47–56. [Google Scholar] [CrossRef]
  10. Xie, Y.; Zheng, Z.; Wang, H.; Xu, Z.; Liu, G.; Li, Z. Analysis of a Main Cabin Ventilation System in a Jack-Up Offshore Platform Part I: Numerical Modelling. Appl. Sci. 2019, 9, 3185. [Google Scholar] [CrossRef]
  11. Xie, Y.; Qin, J.; Zhu, J.; Liu, G.; Zheng, Z.; Yuan, H. Experimental Research on Ventilation Characteristics of a Main Engine Room in a Jack-up Offshore Platform. Appl. Ocean Res. 2021, 117, 102897. [Google Scholar] [CrossRef]
  12. Li, X. Research on Large-Scale Pig Floor Tunnel Precision Ventilation System. Ph.D. Thesis, Zhejiang University, Hangzhou, China, 2022. [Google Scholar]
  13. Wang, C.; Ni, X.; Wei, M.; Li, Q.; Wang, S.; Cao, X. Research on the cooling effect of plastic greenhouses with different ventilation methods based on CFD. Trans. CSAM 2023, 54, 351–356+439. [Google Scholar]
  14. Liu, T.; He, S.; Zang, J. Effect of bottom tuyere on ventilation characteristics of equipment compartment of high-speed train. Refrigeration 2018, 37, 48–54. [Google Scholar]
  15. Yin, H.; Xie, B.; Huang, B. Assessment of thermocline, temperature front and mesoscale eddy of the South China Sea climate based on numerical products of thermohaline currents in the South China Sea. Ocean Forecast. 2023, 40, 34–46. [Google Scholar]
  16. Ren, Z.; Luo, Y. GB 50019-2015 Code for Design of Heating, Ventilation and Air Conditioning in Industrial Buildings has been submitted for approval in English. HVAC 2019, 49, 59. [Google Scholar]
  17. GB 50019-2015; Design Code for Heating Ventilation and Air Conditioning of Industrial Buildings. China Nonferrous Metals Industry Association; Ministry of Housing and Urban Rural Development of the People’s Republic of China; China Planning Press: Beijing, China, 2015. Available online: https://openstd.samr.gov.cn/bzgk/gb/ (accessed on 20 January 2025).
  18. He, G. Improvement of Typical Compartment Ventilation System of Jack-Up Drilling Platform. Master’s Thesis, Harbin Engineering University, Harbin, China, 2019. [Google Scholar]
  19. Liu, Y.; Liu, C.; Wang, L.; Ai, W.; Zhao, Y.; Han, C. Research on deck plate recognition technology for offshore platform construction. Ship Sci. Technol. 2024, 46, 159–163. [Google Scholar]
  20. Pang, D.; Wen, J.; Wu, Y.; Du, B.; Ma, Y. Application of Django framework in the construction management of offshore platform decks. Tianjin Sci. Technol. 2023, 50, 56–58+62. [Google Scholar] [CrossRef]
  21. Xue, Y.; He, S.; Xue, P.; Xiang, L.; Hu, K.; Wu, W. Selection of turbulence model in numerical simulation of coalescence separation of alcohols. Sci. Technol. Eng. 2023, 23, 5995–6002. [Google Scholar]
  22. Chen, J.; Zhang, C.; Wu, X.; Zhao, W. Uncertainty quantification introduced by turbulence model selection considering numerical discrete error. Acta Aeronaut. Sin. 2021, 42, 234–245. [Google Scholar]
  23. Xiang, C. Applicability Analysis of Turbulence Models for Several Typical Flows. Master’s Thesis, Wuhan University of Technology, Wuhan, China, 2021. [Google Scholar]
  24. Hussain, S.; Oosthuizen, P.; Kalendar, A. Evaluation of various turbulence models for the prediction of the airflow and temperature distributions in atria. Energy Build. 2012, 48, 18–28. [Google Scholar] [CrossRef]
  25. Zhang, Y.; Zhang, C.; Jiang, J. Numerical Simulation of Heat Transfer of Supercritical Fluids in Circular Tubes Using Different Turbulence Models. J. Nucl. Sci. Technol. 2011, 48, 366–373. [Google Scholar] [CrossRef]
  26. Park, I.H.; Cho, Y.J.; Lee, J.S. Analysis of Empirical Constant of Eddy Viscosity by K-ε and RNG k-ε Turbulence Model in Wake Simulation. J. Korean Soc. Mar. Environ. Saf. 2019, 25, 344–353. [Google Scholar] [CrossRef]
  27. Lateb, M.; Masson, C.; Stathopoulos, T.; Bédard, C. Comparison of Various Types of k–ε Models for Pollutant Emissions Around a Two-Building Configuration. J. Wind. Eng. Ind. Aerodyn. 2013, 115, 9–21. [Google Scholar] [CrossRef]
  28. Küçüktopcu, E.; Cemek, B. Evaluating the Influence of Turbulence Models Used in Computational Fluid Dynamics for the Prediction of Airflows inside Poultry Houses. Biosyst. Eng. 2019, 183, 1–12. [Google Scholar] [CrossRef]
  29. Zhu, Z.; Qin, B.; Li, S.; Liu, Y.; Li, X.; Cui, P.; Wang, Y.; Gao, J. Multi-Dimensional Analysis of Turbulence Models for Immiscible Liquid-Liquid Mixing in Stirred Tank Based on Numerical Simulation. Sep. Sci. Technol. 2021, 56, 411–424. [Google Scholar] [CrossRef]
  30. Chen, Y.; Wang, L.; Zhao, J.; Zhang, Y.; Zhao, S.; Li, W.; Zou, X.; Jiang, Y.; Shi, S.; Hong, J.; et al. Main characteristics and main weather and climate events in China in 2021. Meteorology 2022, 48, 470–478. [Google Scholar]
  31. Liang, Z.; Huang, L.; Huang, J.; Liu, X.; Su, J. Analysis of climate change characteristics of summer monsoon water vapor transport in northern South China Sea. Brand Res. 2018, 212–215. [Google Scholar] [CrossRef]
  32. Wang, L.; Wang, D.; Qiu, C.; Zhang, G.; Zou, Z.; Hu, Z.; Dai, X.; Yang, T.; Xi, Z.; He, Y.; et al. Review of marine meteorological research hotspots in 2023. Sci. Technol. Rev. 2024, 42, 124–135. [Google Scholar]
  33. Xu, J.; Li, J.; Pan, S.; Yao, Y.; Chen, L.; Wu, Z. Assessment of Wind and Wave Energy in China Seas Under Climate Change Based on CMIP6 Climate Model. Energy 2024, 310, 133207. [Google Scholar] [CrossRef]
  34. Xie, X.; Zheng, H.-B.; Qiao, P.-J. Millennial Climate Changes since MIS 3 Revealed by Element Records in Deep-Sea Sediments from Northern South China Sea. Chin. Sci. Bull. 2014, 59, 776–784. [Google Scholar] [CrossRef]
  35. Hendrix, C.S.; Glaser, S.M.; Lambert, J.E.; Roberts, P.M. Global Climate, El Niño, and Militarized Fisheries Disputes in the East and South China Seas. Mar. Policy 2022, 143, 105137. [Google Scholar] [CrossRef]
  36. Huang, R.X.; Du, Y. Scientific Questions About South China Sea Ocean Dynamics. Acta Oceanol. Sin. 2015, 34, 1–5. [Google Scholar] [CrossRef]
  37. Luo, Y.; Shi, H.; Wang, W. Response of Extreme Significant Wave Height to Climate Change in the South China Sea and Northern Indian Ocean. Aquat. Ecosyst. Health Manag. 2021, 24, 103–110. [Google Scholar] [CrossRef]
  38. Zhang, H.; Wang, L.; Yang, P.; Liu, Y.; Zhu, C.; Wang, L.; Zhong, H. Optimizing Air Inlet Designs for Enhanced Natural Ventilation in Indoor Substations: A Numerical Modelling and CFD Simulation Study. Case Stud. Therm. Eng. 2024, 59, 104408. [Google Scholar] [CrossRef]
  39. Hu, J.; Kang, Y.; Lu, Y.; Yu, J.; Zhong, K. Simplified Models for Predicting Thermal Stratification in Impinging Jet Ventilation Rooms Using Multiple Regression Analysis. Build. Environ. 2021, 206, 108311. [Google Scholar] [CrossRef]
  40. Zhang, T.; Zhou, X.; Zhang, Z.; Qu, F. Research on the Influence Mechanism of Outdoor Wind Environment on Indoor Smoke Exhaust Efficiency in the Super-High-Rise Tower Crown Based on Airpak Simulation. Atmosphere 2023, 14, 1048. [Google Scholar] [CrossRef]
  41. Xu, X.; Li, H.; Lin, Y. Mesh–Order Independence in CFD Simulation. IEEE Access 2019, 7, 119069–119081. [Google Scholar] [CrossRef]
  42. Lee, M.; Park, G.; Park, C.; Kim, C. Improvement of Grid Independence Test for Computational Fluid Dynamics Model of Building Based on Grid Resolution. Adv. Civ. Eng. 2020, 2020, 8827936. [Google Scholar] [CrossRef]
  43. Cheung, T.; Schiavon, S.; Parkinson, T.; Li, P.; Brager, G. Analysis of the Accuracy on PMV–PPD Model Using the ASHRAE Global Thermal Comfort Database II. Build. Environ. 2019, 153, 205–217. [Google Scholar] [CrossRef]
  44. Vera, S.; Fazio, P.; Rao, J. Interzonal Air and Moisture Transport Through Large Horizontal Openings in a Full-Scale Two-Story Test-Hut: Part 2—CFD Study. Build. Environ. 2010, 45, 622–631. [Google Scholar] [CrossRef]
  45. GB 50736-2012; Design Code for Heating Ventilation and Air Conditioning of Civil Buildings. Ministry of Housing and Urban Rural Development of the People’s Republic of China; China Architecture & Building Press: Beijing, China, 2012. Available online: https://openstd.samr.gov.cn/bzgk/gb/ (accessed on 20 January 2025).
  46. ISO 7730-2005; Ergonomics of the Thermal Environment—Analytical Determination and Interpretation of Thermal Comfort Using Calculation of the PMV and PPD Indices and Local Thermal Comport Criteria. International Organization for Standardization: Geneva, Switzerland, 2005. Available online: https://www.iso.org (accessed on 20 January 2025).
  47. Yu, W.; Zhang, J.; Li, H. Numerical Simulation and Analysis of Thermal Environment in Air-Conditioning Office Building. IOP Conf. Ser. Earth Environ. Sci. 2018, 199, 032068. [Google Scholar] [CrossRef]
  48. Kashi, E.; Mirzaei, F.; Mirzaei, F. Analysis of Gas Dispersion and Ventilation Within a Comprehensive CAD Model of an Offshore Platform via Computational Fluid Dynamics. J. Loss Prev. Process Ind. 2015, 36, 125–133. [Google Scholar] [CrossRef]
  49. Zhang, D.; Qu, B.; Liu, P.; An, Z. Comprehensive Evaluation and Optimization of Rural Space Heating Modes in Cold Areas Based on PMV-PPD. Energy Build. 2021, 246, 111120. [Google Scholar]
  50. Chirico, F.; Magnavita, N. New and Old Indices for Evaluating Heat Stress in an Indoor Environment: Some Considerations. Comment on Kownacki, L.; Gao, C.; Kuklane, K.; Wierzbicka, A. Heat Stress in Indoor Environments of Scandinavian Urban Areas: A Literature Review. Int. J. Environ. Res. Public Health 2019, 16, 560. [Google Scholar] [CrossRef]
  51. Wang, Y.J.; Chen, S.; Zhang, H.; Zhang, W. Research on the selection of electrical equipment for offshore platforms. China Pet. Chem. Ind. Stand. Qual. 2023, 43, 32–34. [Google Scholar]
  52. Gu, J.; Xie, Y.; Zhao, Y.; Li, W.; Tao, Y.; Huang, X. Study on Vortex-Induced Motions of A New Type of Deep Draft Multi-Columns FDPSO. China Ocean Eng. 2018, 32, 1–13. [Google Scholar] [CrossRef]
  53. Ma, P.F. Numerical simulation of air intake filter for cabin ventilation system of offshore platform. Sci. Technol. Innov. 2024, 23, 77–80. [Google Scholar]
Figure 1. A physical diagram of the control room of the electric submersible pump system (Case 1).
Buildings 15 00325 g001
Figure 2. Three-dimensional physical models of the control room for (a) Case 1 and (b) Case 2 (the green color represents the equipment with the heat dissipation and the grey color represents the ventilation space).
Buildings 15 00325 g002
Figure 3. The layout of the measuring points in the control room of the electric submersible pump (A, B, C, D, a, b, c, d represent the measuring points).
Buildings 15 00325 g003
Figure 4. Variations between the measured and simulation temperatures in the control room for the varying inner wall temperatures over time.
Buildings 15 00325 g004
Figure 5. Geometric modeling of default grids (the green color represents the equipment with the heat dissipation and the purple color represents the ventilation space).
Buildings 15 00325 g005
Figure 6. Two denser meshes: (a) 803,739 elements and (b) 1,512,459 elements in Case 1 (the green color represents the equipment with the heat dissipation and the purple color represents the ventilation space).
Buildings 15 00325 g006
Figure 7. Airflow temperature (a) and velocity distributions (b) along a line parallel to the positive X-axis, starting at X = 0, Y = 11 m, and Z = 1.3 m, for three different mesh resolutions.
Buildings 15 00325 g007
Figure 8. Planes (Plane A, Plane B, Plane C, Plane D, and Plane E) displaying simulation results.
Buildings 15 00325 g008
Figure 9. Airflow temperature distributions in the five planes of Case 1 and Case 2.
Buildings 15 00325 g009
Figure 10. Airflow trajectories in the control rooms of Case 1 and Case 2.
Buildings 15 00325 g010
Figure 11. The airflow velocity distributions in Plane B, Plane C, and Plane D of Case 1 and Case 2.
Buildings 15 00325 g011
Figure 12. Thermal comfort distributions of PMV and PPD in Plane E of Case 1 and Case 2.
Buildings 15 00325 g012
Figure 13. Comparisons of the airflow velocity distributions in Plane E under the three air supply velocities.
Buildings 15 00325 g013
Figure 14. Comparisons of the PMV-PPD in Plane E under the three air supply velocities.
Buildings 15 00325 g014
Figure 15. Comparisons of the airflow temperature distributions in Plane E under the three air supply temperatures.
Buildings 15 00325 g015
Figure 16. Comparisons of the PMV-PPD distributions in Plane E under the three air supply temperatures.
Buildings 15 00325 g016
Table 1. A comparative analysis between this study and similar research.
Research InterestsThe LiteratureThe Current State of Research in the Relevant FieldThe Novelty of This StudyThe Research Objectives of This Paper
Application of CFD numerical simulation[4,5,6,7,8,9,10,11]Most conventional CFD software has two significant limitations: first, it uses default settings without optimizing the parameters based on the complex internal structure; second, in terms of the study of thermal comfort for personnel, it can only provide qualitative descriptions and cannot quantitatively assess comfort using metrics such as the PMV-PPD, as performed in this study. This makes it difficult to provide effective feedback on personnel comfort for ventilation optimization.By utilizing Airpak 3.0, this study investigated key indicators such as the PMV and PPD to quantify personnel comfort under different ventilation systems.This research fills the gap in the practical application of tunnel ventilation in marine compartments. Using Airpak 3.0, a comparison was made between the new tunnel ventilation system and traditional ventilation in the electric submersible pump control room on an offshore platform. The unique PMV-PPD indicators were employed to quantify human thermal comfort, and multi-scenario, multi-parameter simulations were conducted to optimize the new tunnel ventilation system.
Optimization research on cabin ventilation solutionsTraditional studies often focus on isolated improvements to a single ventilation method, such as simply increasing the size of ceiling ventilation vents, without considering the overall heat load distribution within the compartment and its impact on the airflow organization. This results in an uneven temperature distribution, with frequent cold or hot spots and ventilation dead zones.Based on the specific distribution of thermal loads within the electric submersible pump control room, the ventilation method was precisely adjusted to achieve optimal alignment with the thermal load characteristics, ensuring the efficient operation of the ventilation system.
Application of tunnel ventilation[12,13,14]Regarding tunnel ventilation, it has been applied in various contexts, such as large-scale pig farms, greenhouse cooling, and high-speed train cabins, but has not yet been explored in marine platform compartments.This study was the first to apply innovative tunnel ventilation in the electric submersible pump control rooms on offshore platforms, utilizing simulation techniques to conduct multi-parameter optimization.
Table 2. The heat dissipation data of equipment in the control room of the electric submersible pump.
EquipmentSize (W × D × H mm)Heat Dissipation Power (kw)
DPP-VSD-A13430 × 636 × 214525.8
DPP-VSD-A23430 × 636 × 214523.65
DPP-VSD-A3H2230 × 636 × 214513.07
DPP-VSD-A4H2230 × 636 × 214515.27
DPP-VSD-A5H2230 × 636 × 214518.74
DPP-VSD-A6H2230 × 636 × 214517
DPP-VSD-A7H2230 × 636 × 214517.51
DPP-VSD-A8H3220 × 636 × 214522.5
DPP-VSD-A9H3220 × 636 × 214521.66
DPP-VSD-A10H3220 × 636 × 214517
DPP-VSD-A11H3220 × 636 × 214520.05
DPP-VSD-PY191A1H3430 × 636 × 214524.15
DPP-VSD-PY191A2H4430 × 636 × 214527.71
DPP-VSD-PY191A3H4430 × 636 × 214525.97
DPP-VSD-PY191A4H4430 × 636 × 214527.5
DPP-CCP-001600 × 650 × 210020.05
Table 3. PMV value and thermal sensation.
ColdCoolSlightly CoolNeutralSlightly WarmWarmHot
−3−2−10+1+2+3
Disclaimer/Publisher’s Note: The statements, opinions and data contained in all publications are solely those of the individual author(s) and contributor(s) and not of MDPI and/or the editor(s). MDPI and/or the editor(s) disclaim responsibility for any injury to people or property resulting from any ideas, methods, instructions or products referred to in the content.

