1. Introduction
The urgency of climate action has intensified as global emissions continue to rise and the remaining carbon budget for limiting warming to 1.5 °C above pre-industrial levels rapidly diminishes [
1,
2]. In this context, the building sector has come under increasing scrutiny due to its substantial contribution to energy-related greenhouse gas (GHG) emissions [
3]. As part of broader decarbonisation efforts, regulatory frameworks, such as the European Union’s Energy Performance of Buildings Directive, are evolving to incorporate life cycle assessment (LCA) as a basis for evaluating the environmental performance of buildings. From 2027, all new buildings in Europe will be required to report whole-life carbon emissions [
4], including those associated with the construction phase.
While operational energy use has traditionally dominated the discourse on building-related emissions [
5,
6], recent research and policy developments have drawn attention to embodied upfront emissions and GHG emissions during construction [
7,
8]. These activities, captured in whole-life carbon assessment based on LCA methodology modules A4 (transport to site) and A5 (on-site construction activities), are directly influenced by contractors and construction site managers, who control logistics, site energy use, and waste management. Addressing emissions at this stage offers a practical and immediate opportunity to reduce the upfront emissions of new buildings.
As carbon reporting becomes a legal requirement and a competitive differentiator, contractors must be able to plan, implement, and document mitigation strategies effectively. This calls for a shift toward data-driven strategic planning and controlling, aligned with principles from the ISO standards on environmental management systems and quality management systems [
9,
10]. These frameworks emphasise continuous improvement, performance tracking, and integration of environmental goals into core business processes.
Despite the growing relevance of construction-phase emissions, only a few studies have systematically evaluated mitigation strategies within the contractor’s scope, and even fewer have assessed their cost-effectiveness. The construction industry is traditionally resistant to implementing new processes, given the economic risks and low returns on investment, averaging just 5.3% in Denmark in 2023 [
11], due to intense competition and the inherent complexity of construction projects [
12,
13]. This pressure is compounded by frequent cost overruns and scheduling delays, often linked to inadequate project management and insufficient planning [
14,
15,
16]. Careful budget planning is key in determining project viability, yet optimism bias and risk underestimation frequently undermine cost accuracy [
17,
18].
Budgeting typically involves two key phases: preparation and execution. In the preparation phase, contractors develop detailed forecasts based on prior experience, market trends, and anticipated activity levels, helping to identify risks and allocate resources strategically [
19,
20]. Once approved, the budget serves as a reference for monitoring progress and guiding decisions. When employees are involved in its development, it can foster ownership and improve performance outcomes [
21]. Regular budget follow-up enables early detection of deviations and supports timely corrective actions [
22]. Despite its importance, many contractors lack integrated systems that link budgeting with cost control and performance feedback, reducing their ability to learn from past projects and improve future estimates [
23].
Strategic planning in construction is increasingly recognised as a necessary framework for aligning environmental goals with economic realities. While the concept itself is broad and context-dependent [
24], its relevance has grown alongside the rise of sustainability as a guiding principle in spatial and infrastructure development [
25]. However, critics have noted that sustainability is often used rhetorically, lacking the operational clarity needed to drive measurable change [
26,
27]. In this study, strategic planning is understood as the process of identifying and evaluating mitigation strategies that can guide more efficient resource use during construction. To move beyond aspirational goals, it is essential to quantify both the environmental impacts and the economic costs of proposed interventions. This enables decision-makers to assess trade-offs and prioritise actions that are not only climate-effective but also financially viable within the constraints of typical contractor budgets.
Recent literature has increasingly addressed the need to reduce construction-phase emissions, yet most studies remain fragmented in scope. Systematic reviews highlight a wide range of mitigation measures—such as optimised material transport, improved waste management, and on-site energy efficiency—but these are often presented as isolated interventions without a unified framework for prioritisation [
28,
29,
30]. Existing literature often relies on project-specific case studies, limiting generalisability and strategic foresight. Moreover, diverging views persist on the most effective levers for reducing construction-phase emissions—ranging from material substitution and design optimisation [
31] to logistical and behavioural interventions [
32]. While embodied carbon reduction strategies have gained traction, particularly through material substitution and design optimisation [
33,
34], research tends to emphasise technical feasibility or environmental benefit alone, neglecting economic considerations critical for contractor adoption [
35,
36]. Moreover, LCA studies focusing on modules A4 and A5 confirm that transport and on-site activities represent significant hotspots for emissions [
7,
8], yet few analyses integrate cost-effectiveness into decision-making. Behavioural aspects, such as training and motivation, have also been identified as key drivers of the successful implementation of low-carbon practices but remain underexplored in mitigation planning [
37,
38]. Contractor behaviour and decision-making under low-carbon requirements have been explored, revealing that regulatory pressure and incentive structures strongly influence uptake, but practical guidance on balancing climate impact with financial viability remains scarce [
39,
40]. These gaps are particularly problematic given the competitive nature of the construction industry and its sensitivity to cost overruns [
13,
14,
41]. Addressing these limitations, the present study combines LCA with economic analysis to systematically evaluate and rank mitigation strategies for modules A4 and A5, offering a structured approach to inform strategic planning at the contractor level.
This study aims to identify and evaluate mitigation strategies to reduce GHG emissions during the construction phase of buildings, specifically focusing on modules A4 and A5 in LCA. These activities occur on construction sites and are directly managed by contractors, making site-level decisions and associated costs central to the analysis. By establishing a generalised business-as-usual (BAU) scenario from 15 representative case studies, based on a broader dataset of 279 built projects, and integrating national construction statistics, the study provides a robust baseline for assessing the climate impact and cost-effectiveness of 20 targeted mitigation strategies. Costs are evaluated from the contractor’s perspective, reflecting the economic implications of implementing mitigation measures at the site level. The contribution of this modelling framework is demonstrated through a generalised case study representing average construction practice. The method applied seeks to illustrate the potential of (a) identifying impactful mitigation strategies within the contractor’s influence and (b) ranking these strategies according to their cost-effectiveness and climate benefit. The results highlight the most effective and economically viable strategies and discuss their applicability across different building sizes and typologies. Ultimately, the study contributes to strategic planning for low-carbon construction by offering a structured approach to mitigation prioritisation.
2. Materials and Methods
This section outlines the methodological framework for assessing the climate impact and cost-effectiveness of mitigation strategies during the construction phase of buildings.
Section 2.1,
Section 2.2,
Section 2.3,
Section 2.4 and
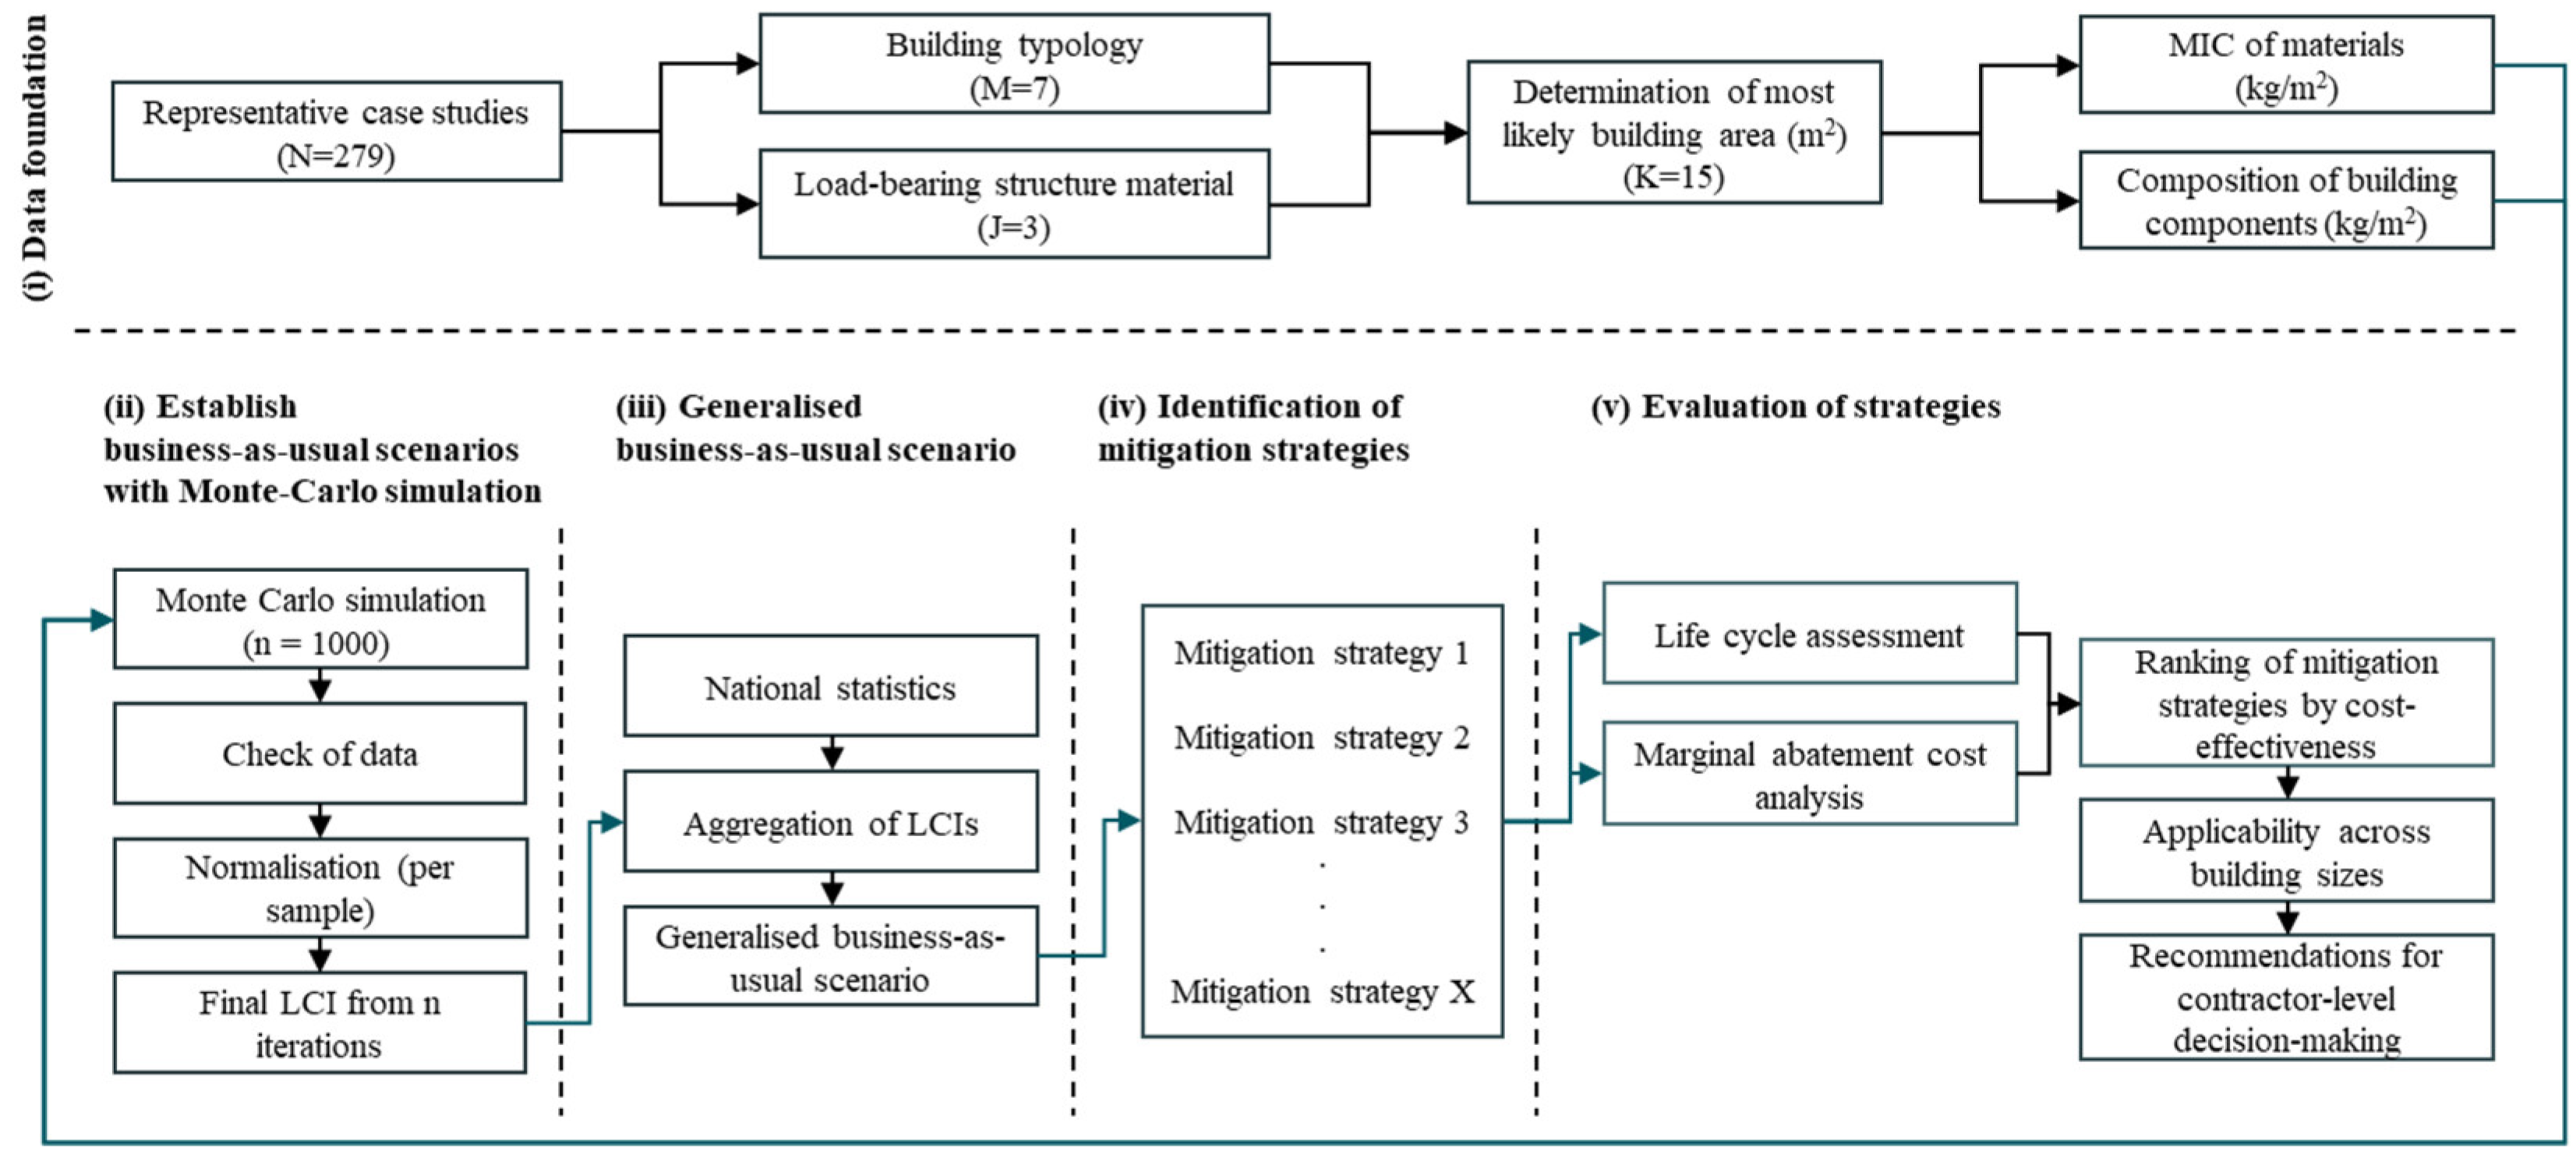
Section 2.5 elaborate on the specific implementation for the case study. The framework follows a structured approach to establish a representative baseline, identify relevant mitigation strategies, and evaluate their performance within the contractor’s scope of influence. The methodological framework consists of a step-by-step structure, as illustrated in
Figure 1, starting from the data foundation, establishing a baseline, analysing the data, and drawing conclusions based on the effectiveness of different mitigation strategies.
The first step is the data foundation, which comprises representative case studies of 279 built projects categorised by building typology and structural systems. The most likely building area of the 15 variations, each representing distinct building typologies and structural systems. The material intensity coefficients (MICs) and component compositions from the data foundation are used in the second step, in which Monte Carlo simulations are applied to construct detailed life cycle inventories (LCIs).
The MICs indicate the amount of total material input required in kilograms per unit of gross floor area [
42] and serve as a key metric for assessing construction GHG emissions. The LCIs include material and energy flows associated with modules A4 and A5, forming the basis for the BAU scenario. The third step involves aggregating the individual LCIs using national construction statistics to create a generalised BAU scenario that reflects current building practices in Denmark. In the fourth step, 20 mitigation strategies are identified based on their potential to influence emissions from transport, waste, and energy use during construction. Finally, the mitigation strategies are evaluated through life cycle assessment and marginal abatement cost analysis. The results are used to rank the strategies by cost-effectiveness and assess their applicability across different building sizes, providing actionable insights for contractors and decision-makers.
2.1. Case Study, Scope, and System Boundaries
The case study investigated in this work is based on a dataset of 279 completed buildings in Denmark, originally sourced from 291 projects by Tozan et al. [
43], with an additional 30 cases from Hasselsteen et al. [
44], who derived MICs from the total of 309 building projects. The material inventories of these projects were aligned with the LCA requirements from the Danish Building Regulations (BR18) [
45] to ensure consistency in LCI development. Projects lacking a complete material inventory were excluded.
The selected buildings span seven typologies: day care institutions (n = 17), education buildings (n = 15), health facilities (n = 9), multi-family houses (n = 87), offices (n = 57), row houses (n = 34), and single-family houses (n = 60). Typologies not included in these seven categories were excluded from the sample. To further reflect the diversity of the Danish building stock, the cases are also categorised by their load-bearing structural material: concrete (n = 177), wood (n = 98), and steel (n = 4). This dual classification results in 15 distinct combinations of building typology and structural system.
The 15 archetypes were derived by combining the seven building typologies with the three structural systems, resulting in distinct combinations that represent common construction configurations. For each archetype, the most likely building area is determined as the mean gross floor area of the respective sample. For each archetype, MICs were calculated as the mean values from the corresponding subset of projects, ensuring that each archetype reflects typical material use patterns for its category.
The MICs represent the quantity of material used per gross floor area (kg/m
2). They are categorised according to the OEKOBAU.DAT system [
46], which applies a three-tier classification of building materials and products. For this study, the materials have been aggregated into 36 material categories and further grouped into 14 overarching material groups. Furthermore, the MICs are distributed across 16 distinct building components, forming the basis for constructing detailed LCIs for each archetype.
The national territory of Denmark defines the geographical system boundary. The temporal scope covers the entire construction period of each building, beginning in 2025. Construction time is estimated using a power regression model based on historical data from previously built projects, expressed by the following function:
where x is the building area in square meters, and f(x) is the estimated construction time in days per building area.
The scope of the assessment is limited to material and energy flows associated with on-site construction activities. This includes the transport of all construction materials (excluding soil and excavation materials), handling construction waste (either off-site or repurposed on-site), and energy consumption from electricity, district heating, and fuel. Modules A4 and A5 were prioritised because they fall within the contractor’s direct influence, making them actionable for site-level decision-making and cost control. These stages offer immediate opportunities for mitigation during project execution, whereas upstream production (A1–A3) and downstream stages (B, C, D) are outside the contractor’s operational scope and were therefore excluded. Moreover, downstream demolition or renovation activities are excluded.
All economic data used in this study originates from real-world quotes provided by a Danish contractor and their suppliers. Prices for energy consumption (electricity, heating, and fuel) reflect actual contractor expenses, while costs for waste container rental, take-back schemes, and equipment—including concrete moulds, temporary offices, sensors, solar panels, timers, heat pumps, oil boilers, and machinery fleets/site vehicles—are based on supplier quotations. This ensures that the cost estimates represent realistic market conditions in Denmark and reflect the contractor’s perspective on implementation feasibility.
This study focuses exclusively on the contractor’s scope of influence, thereby excluding infrastructure and operational energy use beyond the construction phase. This boundary implies that the results address only construction-phase emissions and cost impacts, not whole-life carbon performance. The resulting LCIs serve as the foundation for establishing BAU scenarios and evaluating the climate impact of mitigation strategies.
2.2. Establishing Building as Usual Scenarios with Monte Carlo Simulation
To represent current construction practices, 15 BAU scenarios were developed, each corresponding to a unique combination of building typology and load-bearing structural material. These scenarios were generated using a Monte Carlo simulation (MCS) approach to explicitly account for uncertainty and variability in material distribution across building components.
The simulation is based on MICs derived from the 279 case studies described in
Section 2.1. For each of the 15 building variants, each material category is assigned a probability distribution based on its relative weight contribution within the component.
Monte Carlo sampling is performed using the Dirichlet distribution, a multivariate generalisation of the beta distribution commonly used to model proportions that sum to one. In this study, the Dirichlet distribution is applied to sample the relative material weights of subgroups within each component. The concentration parameters (α) of the distribution are scaled from the observed subgroup probabilities, controlling the variance of the samples. This approach ensures that:
All sampled weights are non-negative.
The proportions within each component sum to the expected total.
The mean of the sampled distributions matches the deterministic input values.
For each building variant, 1000 iterations were performed, which provided stable confidence intervals. Each sample represents a hypothetical building with a unique, yet statistically consistent, material composition. To ensure comparability, each sample is rescaled to match the mean total material intensity per square meter for its building variant. This final adjustment guarantees that the total material use remains consistent across all samples while preserving realistic internal variation.
The resulting dataset is summarised using descriptive statistics, including the mean and the 95% confidence intervals (CIs) for each subgroup within each component. These statistics form the basis for the life cycle inventories used in subsequent climate impact and cost-effectiveness analyses.
Uncertainty in material composition was operationalised by varying the relative weights of material subgroups within each component according to the Dirichlet distribution, while keeping total material intensity constant. Model validation was performed by comparing aggregated material intensities against observed averages from the 279 case studies. The simulated distributions closely matched empirical data, confirming that the probabilistic approach preserves real-world characteristics.
The use of Dirichlet-based Monte Carlo simulation allows for a robust representation of construction practices by capturing the inherent variability in material use while maintaining alignment with observed averages. This probabilistic modelling approach supports the development of credible BAU scenarios and enhances the reliability of mitigation strategy evaluations.
The present study adopts the model for forecasting future material waste flows from Hasselsteen et al. [
44]. For each building project, the expected waste amounts were calculated using the building’s material composition and reported material waste rates, which express the ratio of waste generated to material used. The on-site sorting rate is fixed at 70%, reflecting the EU taxonomy circular economy criterion, case study results from Hasselsteen et al. [
44], and contractor experience with current practice. This value represents a typical level of sorting achievable under current Danish construction conditions, acknowledging that actual rates vary by project type and contractor. The composition of mixed waste assumes all discarded roofing felt, as this fraction is rarely sorted separately. The remaining composition follows the distribution shown in
Appendix A,
Table A1, based on the material composition of mixed waste observed in a Danish case study reported by Hasselsteen et al. [
47]. When the required share of a specific material in mixed waste exceeds the expected amount of waste for that material, the entire material fraction is allocated to mixed waste. In such cases, any shortfall to reach the 30% threshold is compensated by adding more wood waste. Of the mixed waste, 10% is sent for off-site sorting, while 90% is incinerated. Materials for incineration are only those suitable for burning, meaning they do not include bricks, ceramics, concrete, building services, glass, inert materials, or metal.
Energy consumption during construction was assumed to be linearly distributed over the considered time scope, as detailed time-resolved data were unavailable. Electricity and heat grid mixes were modelled according to the 2025 projection by the Danish Energy Agency. The total energy use was based on measured data for the construction process of 63 building projects constructed from 2014 to 2025, reported in Hasselsteen et al. [
48]. The average electricity use was 49.6 kWh/m
2 (range: 20.6–72.4 kWh/m
2), heating use was 37.5 kWh/m
2 (range: 16.1–63.1 kWh/m
2), and fuel use was 2.9 L/m
2 (range: 0.6–4.7 L/m
2). These values provide a representative benchmark for typical projects and were used to define minimum and maximum boundaries for sensitivity analysis via the interquartile range. No distinction was made between electricity used for temporary offices, construction lighting, and electricity used for the remaining construction work. However, Seo et al. [
49] estimated that 52.5% of the total electricity consumption in the construction phase was consumed by the temporary offices, followed by direct construction, lifting equipment, and common temporary work, and a Danish case study revealed that 15.7% of the total electricity consumption was used for construction lighting. Due to the lack of more representative data, these shares were applied to allocate electricity consumption internally.
All heating was assumed to be supplied by the Danish district heating grid, and fuel was considered to be diesel. Based on contractor experience, 8.9% of total fuel consumption occurs during equipment idling, which was included in the estimates.
To assess construction-phase GHG emissions, material and energy flows are coupled with emission background data from the Danish Building Regulation (BR18, §297) [
45]. The effects of data and process uncertainties are assessed through the range of materials flows associated with 95% CIs from the Monte Carlo simulation, as well as the range of energy flows from consumption data.
2.3. Generalised Building-As-Usual Scenario
To generalise the archetypes into a single BAU scenario, national records from the Danish Building and Dwelling Register (BBR) were used to determine the share of floor area constructed between 2015 and 2025 for each building typology [
50]. These shares were then used to weight the 15 archetypes, ensuring that the aggregated scenario reflects the actual typological composition of the Danish building stock.
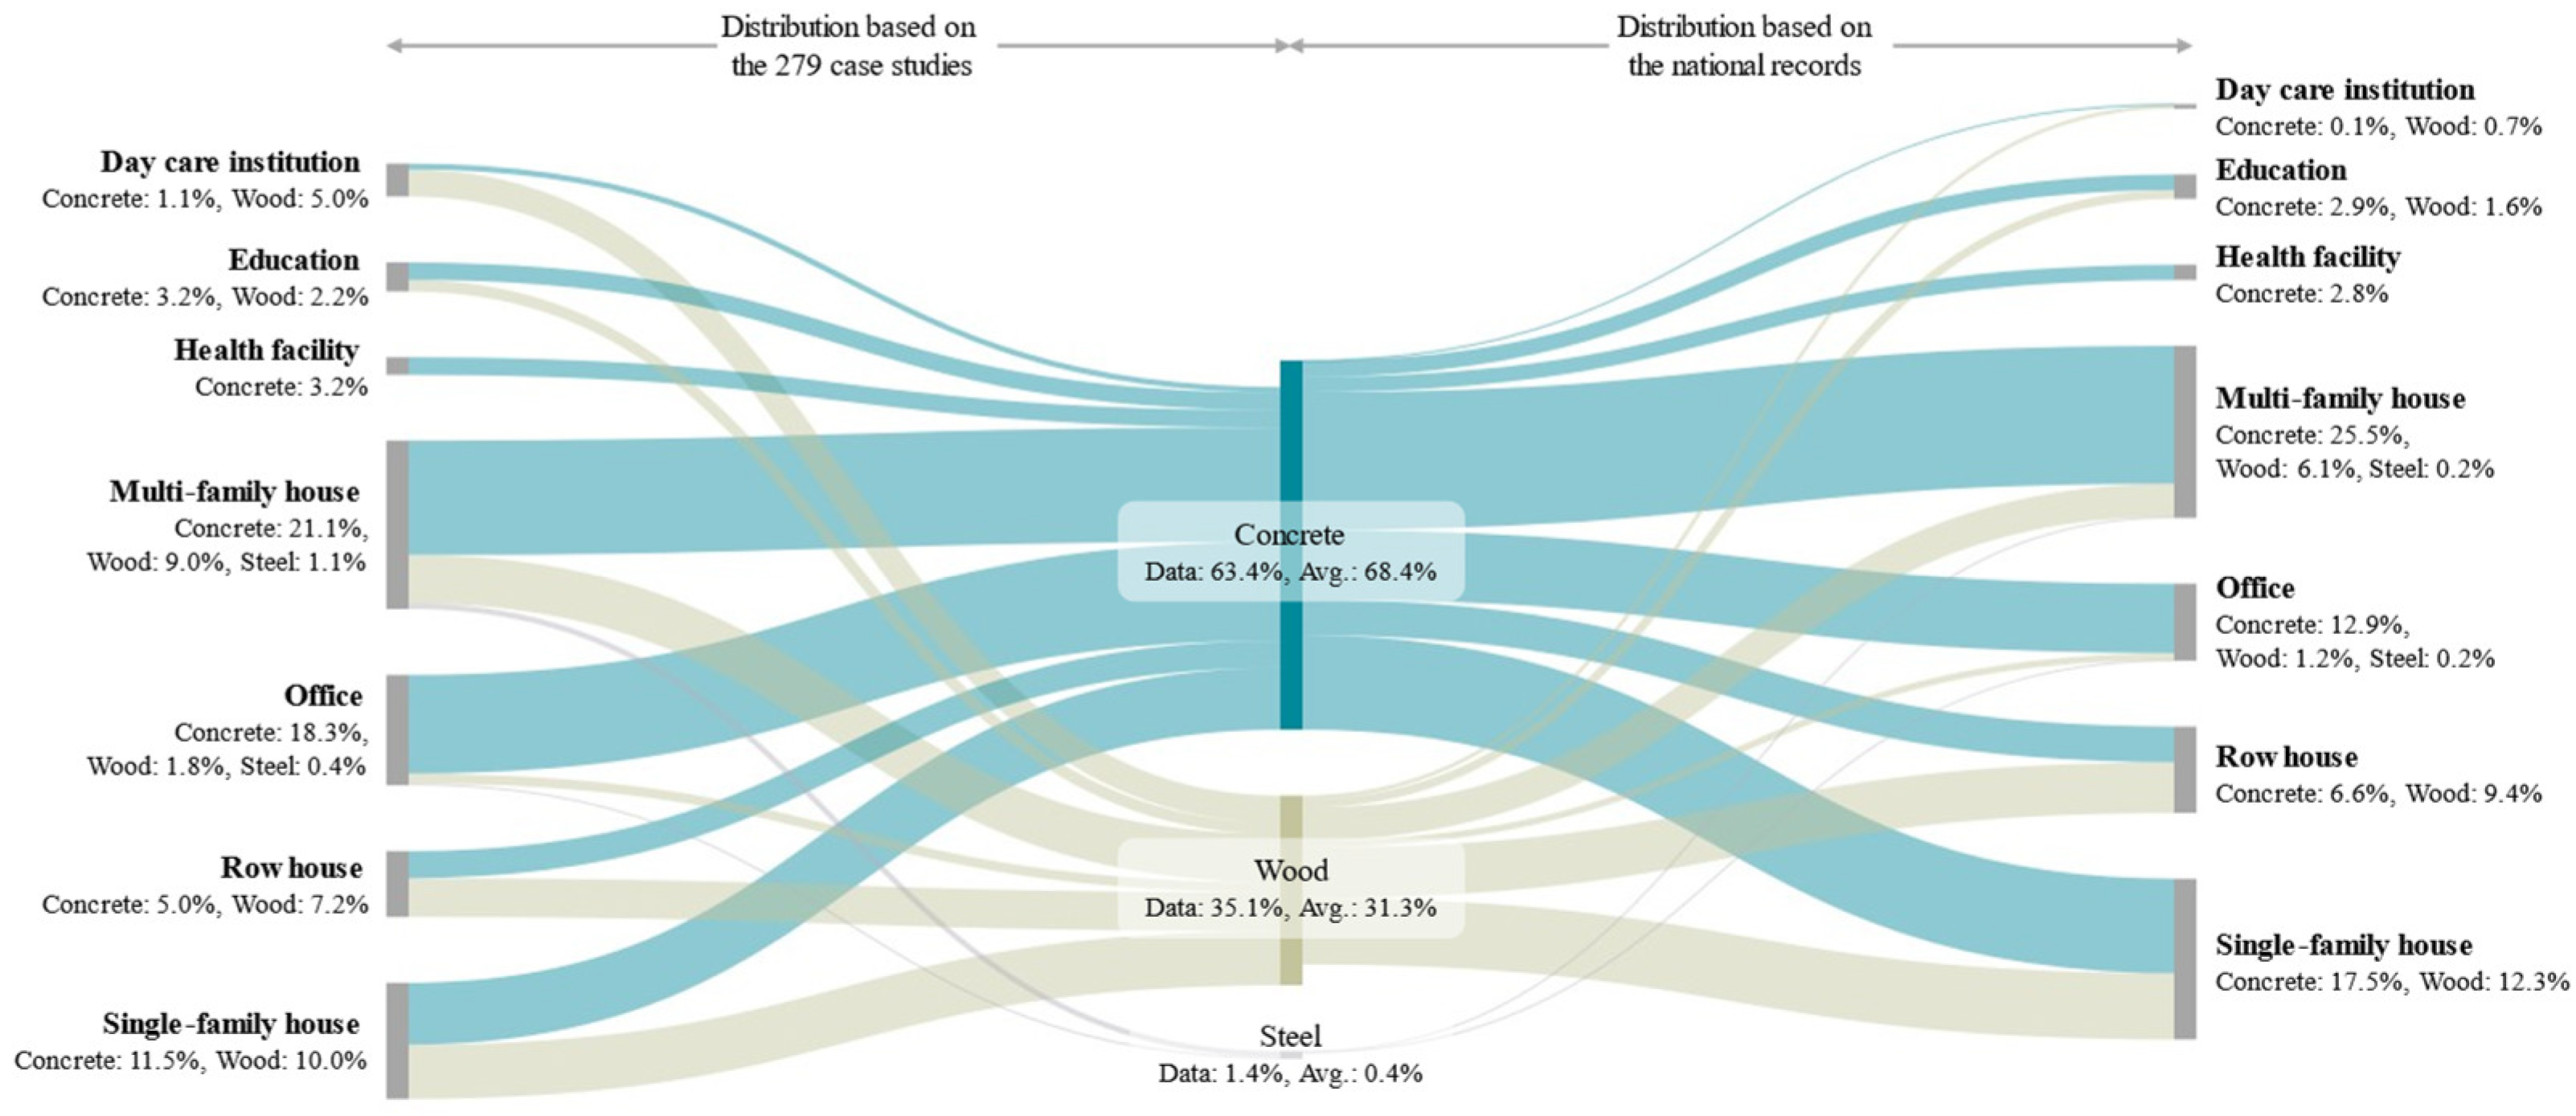
Figure 2 illustrates the comparison between the distribution of the 279 case studies (per case) and the national records (per built m
2). The diagram shows the flow from case study typologies (left) through structural systems (middle) to national shares (right). For example, multi-family houses account for 31.2% of the case studies, while national records indicate a slightly higher share of 31.8%. Similarly, row houses show a somewhat higher share in the national records (16.0%) compared to the case studies (12.2%). In contrast, typologies such as day care institutions, education, health facilities, and offices appear slightly underrepresented in the national records relative to the case sample.
Overall, the variance in typology composition compared to the national registry is minor, indicating that the case studies provide a representative sample of Danish construction practice. The distribution of materials used for the structural system is not recorded in the building registry, but the distribution in case studies is assumed to reflect current construction practices. The share of structural systems within each typology is therefore based on the observed distribution of building area in the case study dataset. In terms of structural systems, concrete is slightly more prevalent in the aggregated BAU scenario, accounting for 68.4% of the total built area, compared to 63.4% in the case studies. Wood accounts for 31.3%, while steel is used minimally in both datasets.
This weighting approach ensures that the generalised BAU scenario is both statistically grounded and representative of national construction trends. It represents a typical mix of materials, energy use, and waste management practices under current regulatory and market conditions and provides a robust baseline for evaluating the climate impact and cost-effectiveness of mitigation strategies under realistic conditions. Uncertainty arises from variability in project-specific factors such as design complexity, site logistics, and contractor behaviour. These uncertainties were addressed through CI ranges from Monte Carlo simulations for material flows and minimum and maximum boundaries for energy consumption.
2.4. Mitigation Strategies
To evaluate which mitigation strategies are most effective at reducing GHG emissions during the construction phase, 20 strategies were identified. The strategies were identified from previous literature [
28,
30] and the contractor-level influence, and selected based on a hotspot analysis of the BAU scenario, targeting emissions from transport, waste, and energy use—three key domains within the contractor’s scope of influence.
Although the list of mitigation strategies presented in this study is not exhaustive, it is designed to demonstrate how targeted interventions can be defined and incorporated into the modelling framework. Each strategy is implemented as a dynamic parameter, allowing for quantification of its impact on emissions and cost-effectiveness. The strategies are grouped into three categories: transport (MS1), waste (MS2), and energy (MS3), and evaluated individually to assess their marginal abatement potential.
The BAU scenario assumes no mitigation measures are in place (i.e., baseline values), while each mitigation strategy is assigned a specific parameter value representing its implementation level. For example, MS1.1 assumes 80% of material deliveries use biodiesel, while MS2.1 assumes a 100% on-site waste segregation rate. These values are based on best available estimates and practical implementation potentials, informed by industry reports and previous studies.
An overview of the mitigation strategies, their categories, and the values applied in the BAU and mitigation scenarios is provided in
Table 1. These strategies are modelled independently to assess their individual impact on GHGe and cost. The results are used to rank the strategies by cost-effectiveness and to identify those with the highest mitigation potential.
For transport-related strategies (MS1.1–MS1.3), GHG emissions are directly linked to the energy consumption of the vehicles used for material delivery. The cost calculation is based on a total cost of ownership (TCO) approach, which includes both capital and operational expenses. The model does not amortise investment costs over the equipment lifetime; instead, the full investment cost of converting the truck fleet to biodiesel or electric vehicles is included in the TCO and assumed to be passed on to the contractor through adjusted delivery prices. The TCO accounts for the initial vehicle purchase, annual fuel and maintenance costs, and applicable CO
2 taxes, all discounted using a 4% rate to reflect the time value of money. Fuel consumption and price are calculated per kilometre, and logistics factors are applied to reflect real-world conditions such as urban zone penalties or charging requirements. The total cost is then normalised per square meter of building area to enable comparison across scenarios. This method follows established TCO modelling practices used in transport and fleet analysis [
51,
52] and provides a consistent basis for evaluating the financial implications of switching from diesel to biodiesel or electric transport solutions from the contractor’s perspective.
GHG emissions from construction waste are determined by the sum of emissions from the product (A1–3) and waste treatment stages (C2–4). For the complete on-site segregation scenario (MS2.1), combustibles and mixed waste fractions are avoided by sorting into individual material waste fractions. In the robotic sorting scenario (MS2.2), all mixed waste from the BAU scenario is sent to a robotic sorting system. Here, the material categories bricks, ceramics, concrete, inert, metal, plastic, and wood are sorted with a sorting rate of 71.6% based on the results from Svedin et al. [
53].
The direct reuse of construction materials strategies (MS2.3 and MS2.7–9) avoids any GHG emissions, except for the transport of removed materials from the site (C2). In comparison, the take-back strategies (MS2.4–6) omit only the C3–4 stages, because waste processing is replaced by integrating secondary materials into the manufacturing of new products (A1–3). One of the strengths of re-looping excess materials by their previous manufacturers is the well-documented composition of the secondary materials and the resulting high quality and high recycling utilisation, compared with an intermediate, anonymous, and less controlled waste process.
For energy-related strategies (MS3.1–8), GHG emissions are directly related to consumption. Percentage reductions and costs are derived from consumption data from previous building projects, product data sheets, and suppliers. For MS3.2, it is assumed that temporary office sheds are used on all construction sites regardless of size. However, in practice, large projects will most likely use pavilions rather than sheds to improve the work conditions on the construction site.
2.5. Marginal Abatement Cost Analysis
To assess the cost-effectiveness of each mitigation strategy, this study applies the Marginal Abatement Cost (MAC) method. MAC is a widely used decision-support tool that quantifies the cost (or savings) associated with reducing one unit of GHG emissions through a specific intervention [
54]. It enables comparison across strategies by expressing the economic efficiency of emission reductions in monetary terms per kg of CO
2-equivalent (€/tCO
2e).
The MAC is calculated by comparing the net present cost of implementing a mitigation strategy with the total emissions abated over the construction period. Specifically, the MAC is defined as:
The net cost includes capital investments (e.g., equipment purchases), operational costs (e.g., energy and maintenance), and any cost savings (e.g., reduced energy consumption or material reuse), all discounted over the expected lifetime of the intervention.
Regional cost variability is addressed by sourcing all economic data from real-world quotes from Danish contractors and suppliers, ensuring prices reflect current market conditions in Denmark. Sensitivity analysis was performed by varying material and energy consumption within the ranges observed in the dataset. This approach indirectly captures variability in key cost parameters, as changes in consumption affect associated costs.
The emissions abated are calculated as the difference in climate impact between the BAU scenario and the mitigation scenario, based on the LCI results for modules A4 and A5. Each mitigation strategy is evaluated independently, and the resulting MAC values are plotted on a Marginal Abatement Cost Curve (MACC). The MACC visually ranks the strategies from lowest to highest cost per kg of CO2e abated, allowing decision-makers to identify the most cost-effective interventions. Strategies with negative MAC values represent net savings (i.e., cost reductions alongside emission reductions), while positive values indicate additional costs required to achieve mitigation.
This approach supports strategic planning by highlighting which mitigation actions deliver the greatest climate benefit per euro invested. It also enables prioritisation of interventions under budget constraints or regulatory targets.
3. Results
This section presents the results derived from the methodological framework outlined in
Section 2, demonstrating how each analytical step informed the findings. The results follow the same structured approach illustrated in
Figure 1, ensuring coherence between the applied methods and the outcomes. First,
Section 3.1 reports the baseline results for the 15 building archetypes generated through Monte Carlo simulations, as described in
Section 2.2, based on the scope and system boundaries defined in
Section 2.1. These archetypes form the foundation for estimating emissions and costs under the BAU scenario.
Next,
Section 3.2 evaluates the mitigation strategies identified in
Section 2.4 against the generalised BAU scenario developed in
Section 2.3. This evaluation uses the MACC approach introduced in
Section 2.5 to rank strategies by cost-effectiveness and climate impact.
Section 3.2.1 further compares individual strategies in terms of abatement potential and implementation cost, providing insights into their practical applicability across different project scales. Together, these results illustrate how the methodological framework translates into actionable findings for contractors and decision-makers.
3.1. Generation of Representative Archetypes
Figure 3 presents the average MICs (kg/m
2) across the 15 archetypes, grouped by building typology and structural system. The results show substantial variation in MICs across both typologies and structural systems. Concrete structures consistently exhibit higher material intensities, with education buildings reaching the highest value at 1628 kg/m
2, followed by multi-family houses (1373 kg/m
2) and offices (1354 kg/m
2). In contrast, wood structures generally have lower MICs, such as 756 kg/m
2 for day care institutions and 669 kg/m
2 as the overall average across all typologies. Steel structures, though less represented in the dataset, show intermediate values, averaging 891 kg/m
2.
The overall average MIC across all typologies and structural systems is 1049 kg/m2, with concrete contributing the highest average (1263 kg/m2), followed by steel and wood.
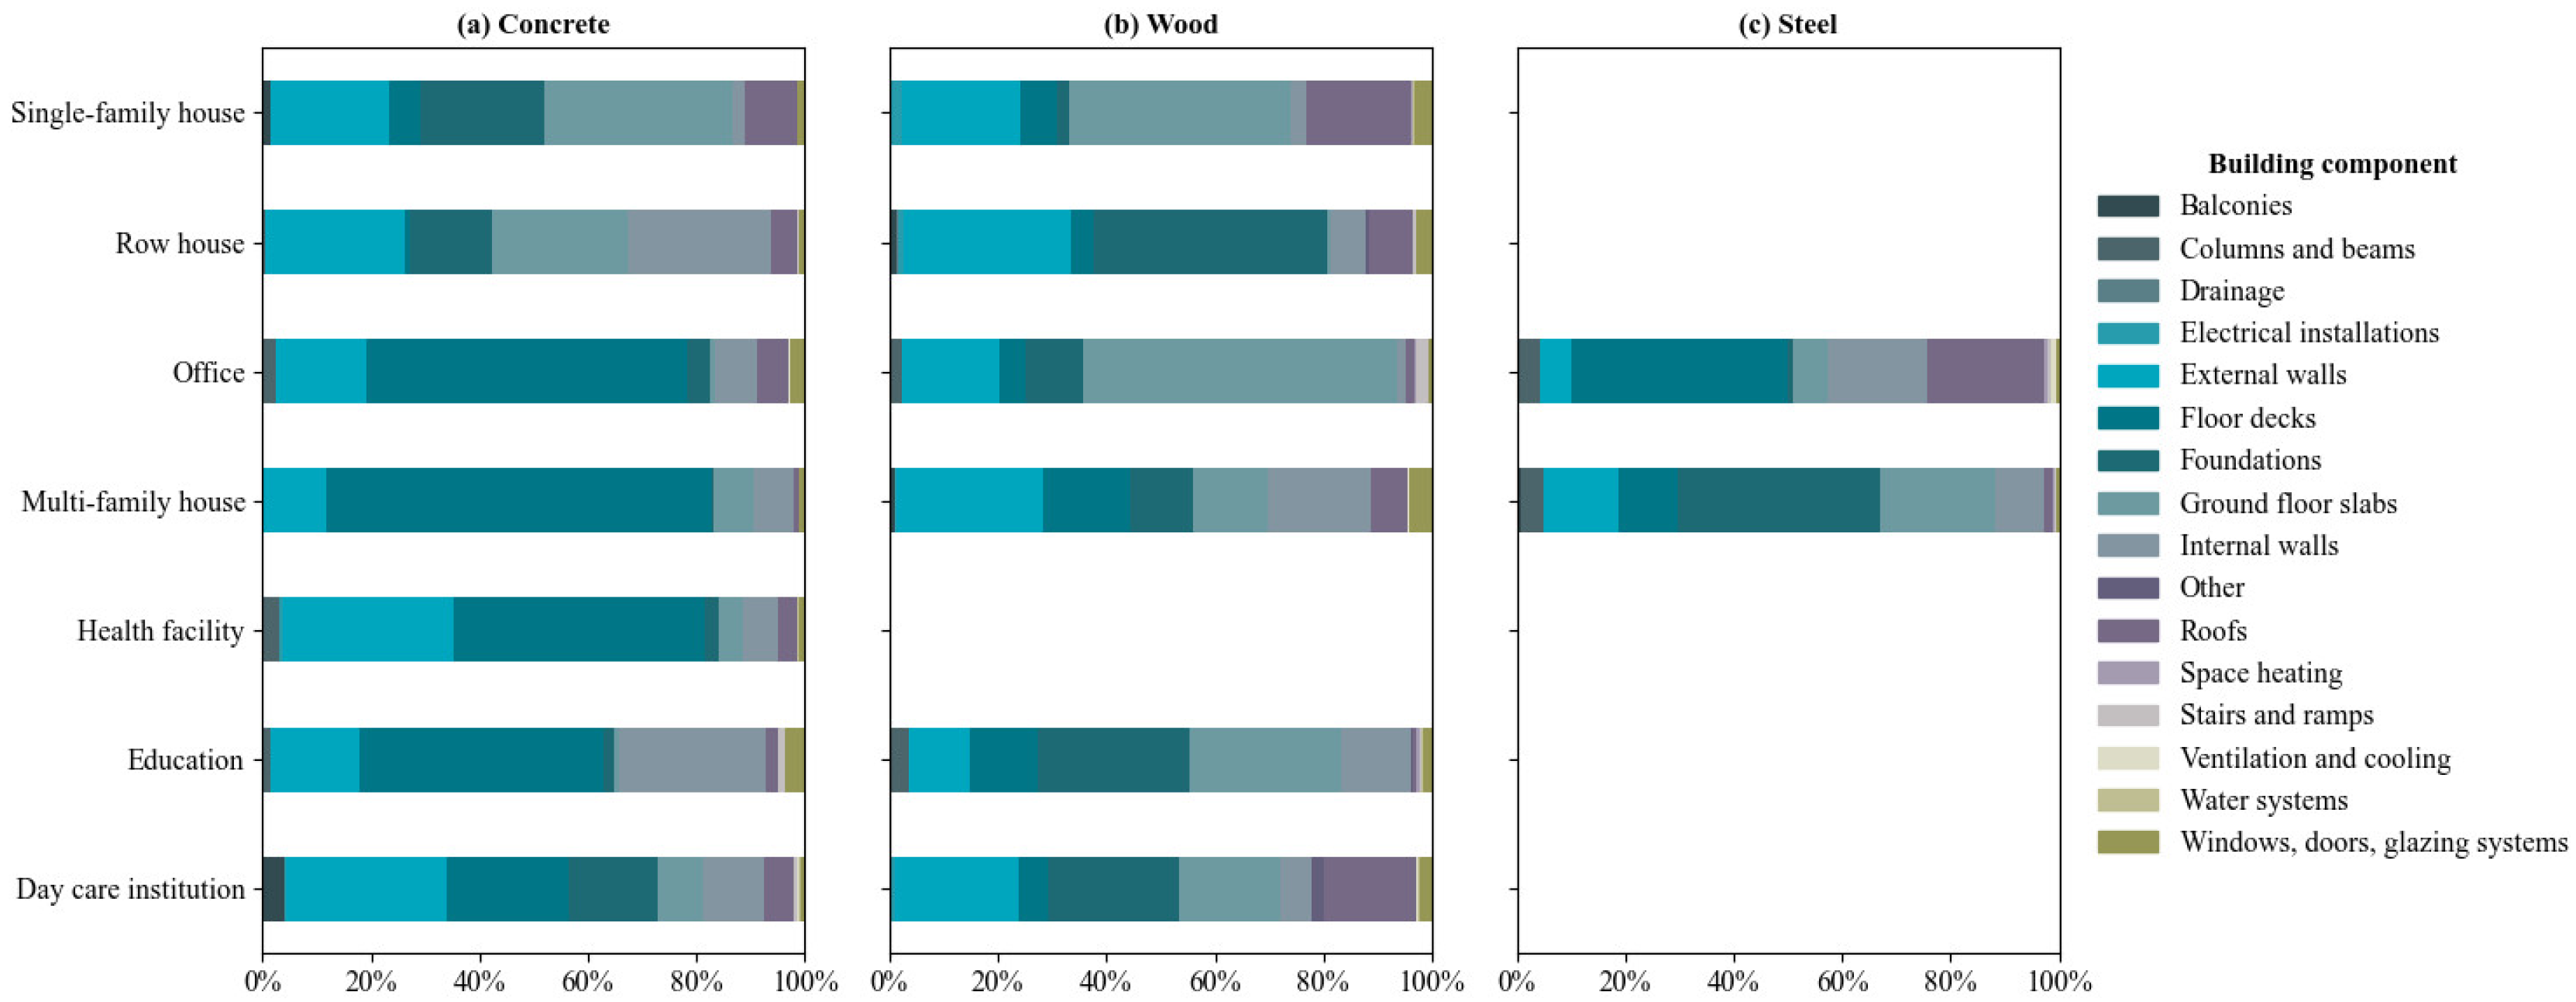
To further characterise the 15 representative archetypes,
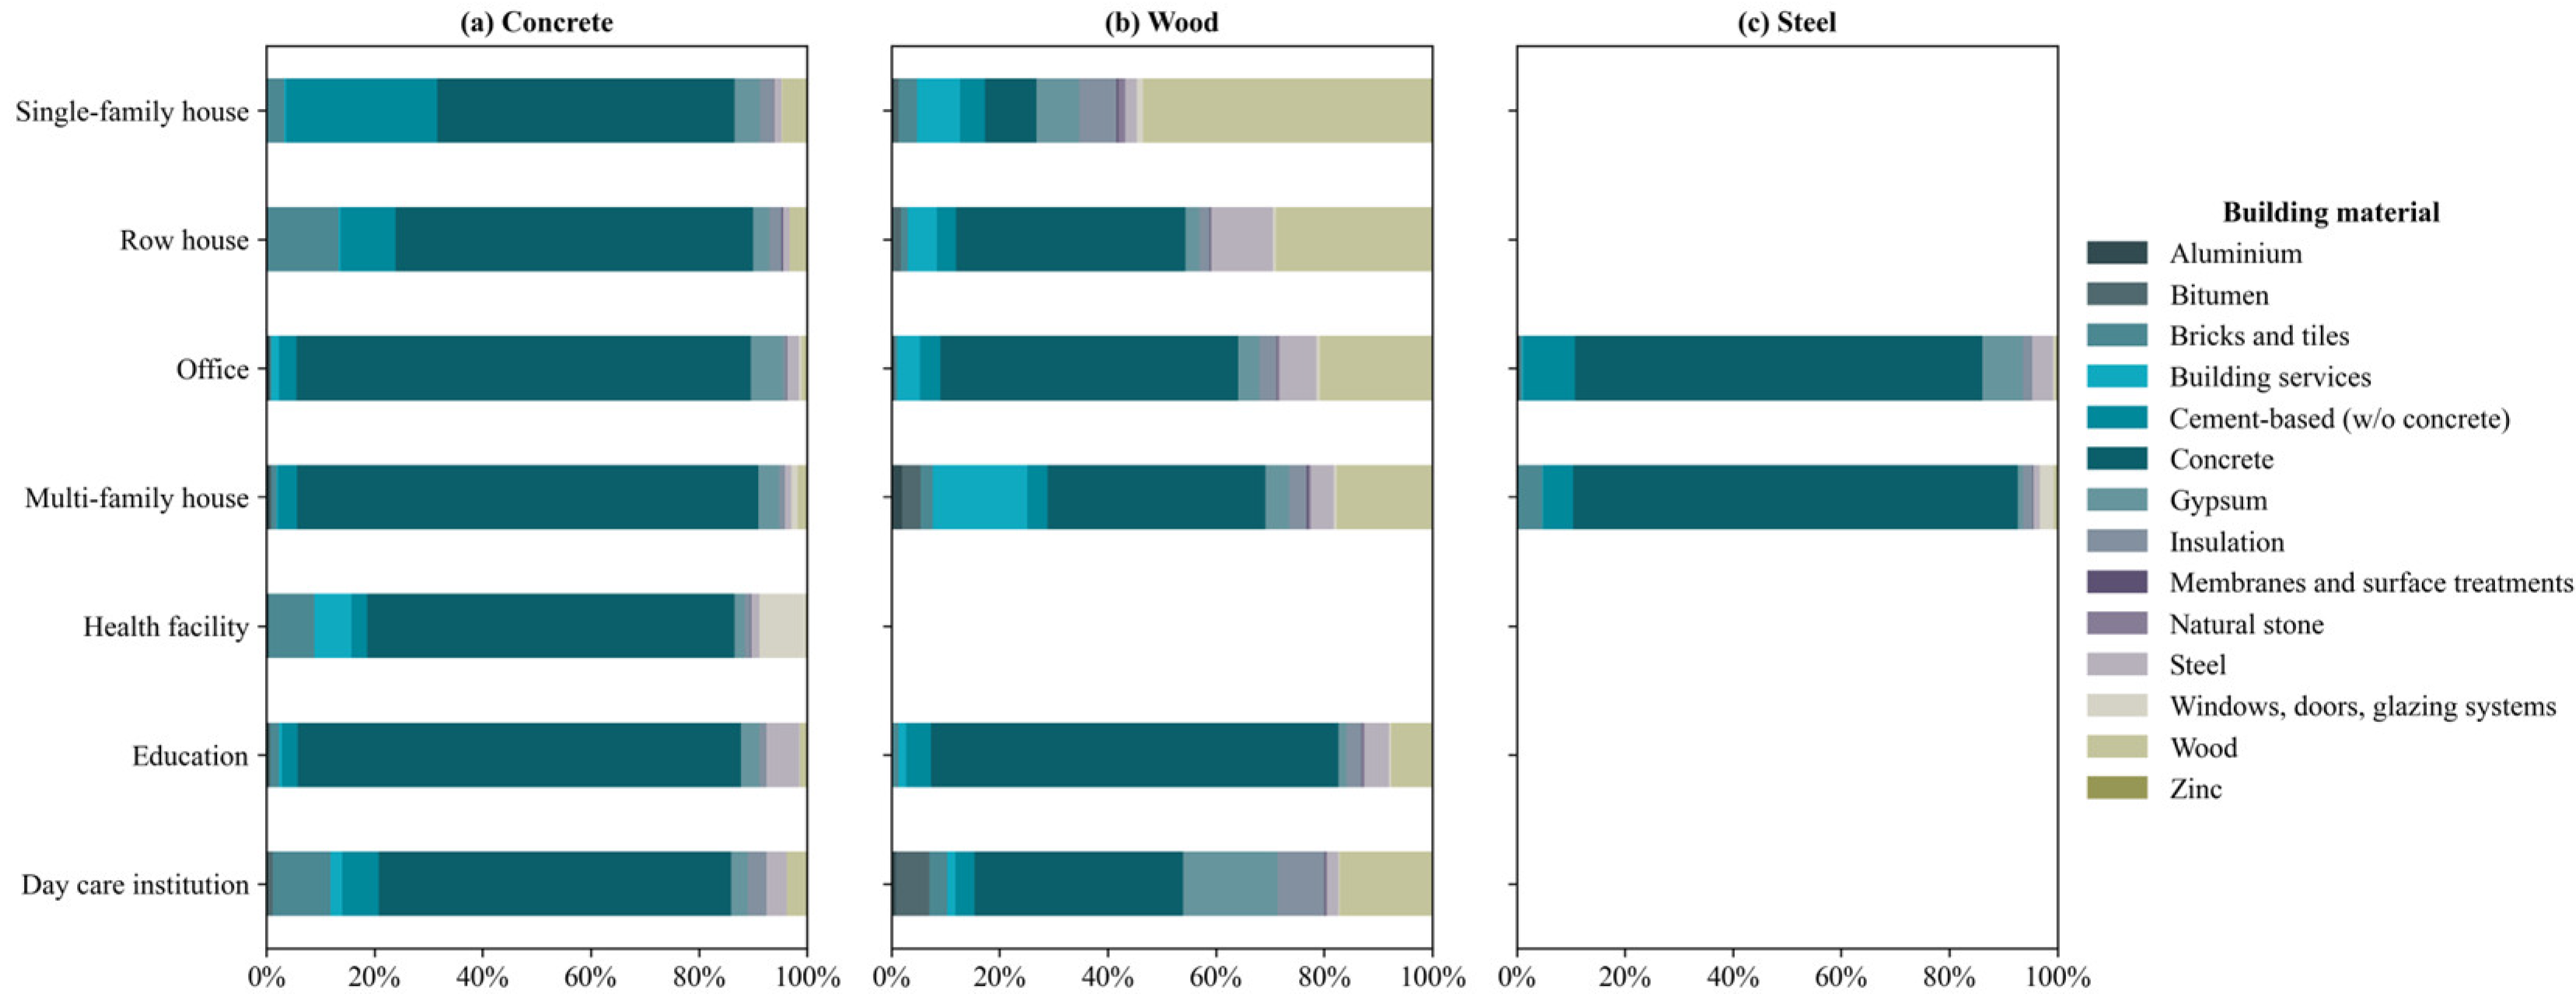
Figure 4 presents the material composition across building typologies and structural systems, while
Figure 5 illustrates the distribution of building components. Together, these figures provide a detailed breakdown of how materials and components are allocated across different construction contexts, reflecting the structural and architectural range of the generalised life cycle inventories.
Figure 4 shows the relative share of material groups used in each building type, segmented by structural system. The results reveal clear patterns in material use depending on both typology and structure. Concrete buildings are dominated by concrete and cement-based materials, with significant shares of steel, insulation, and facade openings. Wood-based buildings, on the other hand, show a higher proportion of timber, gypsum, and surface treatments, reflecting the lighter and more modular nature of wood construction. Steel structures, though less common, exhibit a similar percentage material distribution as the concrete structures, but with a lower MIC.
Across all typologies, certain materials—such as insulation, gypsum, and facade openings—appear consistently, indicating their widespread use regardless of structural system. However, the relative proportions vary significantly. For example, multi-family houses and offices tend to have higher shares of building services and concrete. In contrast, single-family houses and row houses show greater use of wood and surface treatments.
Figure 5 complements this analysis by showing how building components are distributed across the same 15 case studies. The component breakdown includes structural elements (e.g., foundations, beams, columns), envelope elements (e.g., external walls, windows, roofs), and technical systems (e.g., ventilation, heating, electrical installations). The results highlight the complexity and variation in component composition across typologies.
For instance, in single-family and row houses, the share of envelopes—external walls, ground-floor slabs, and roofs—increases, whereas in multi-family houses, the share of internal floor decks is higher. In lighter structural systems (wood and steel), foundations and ground-floor slabs account for a larger share of the building composition due to the lighter structural frame components.
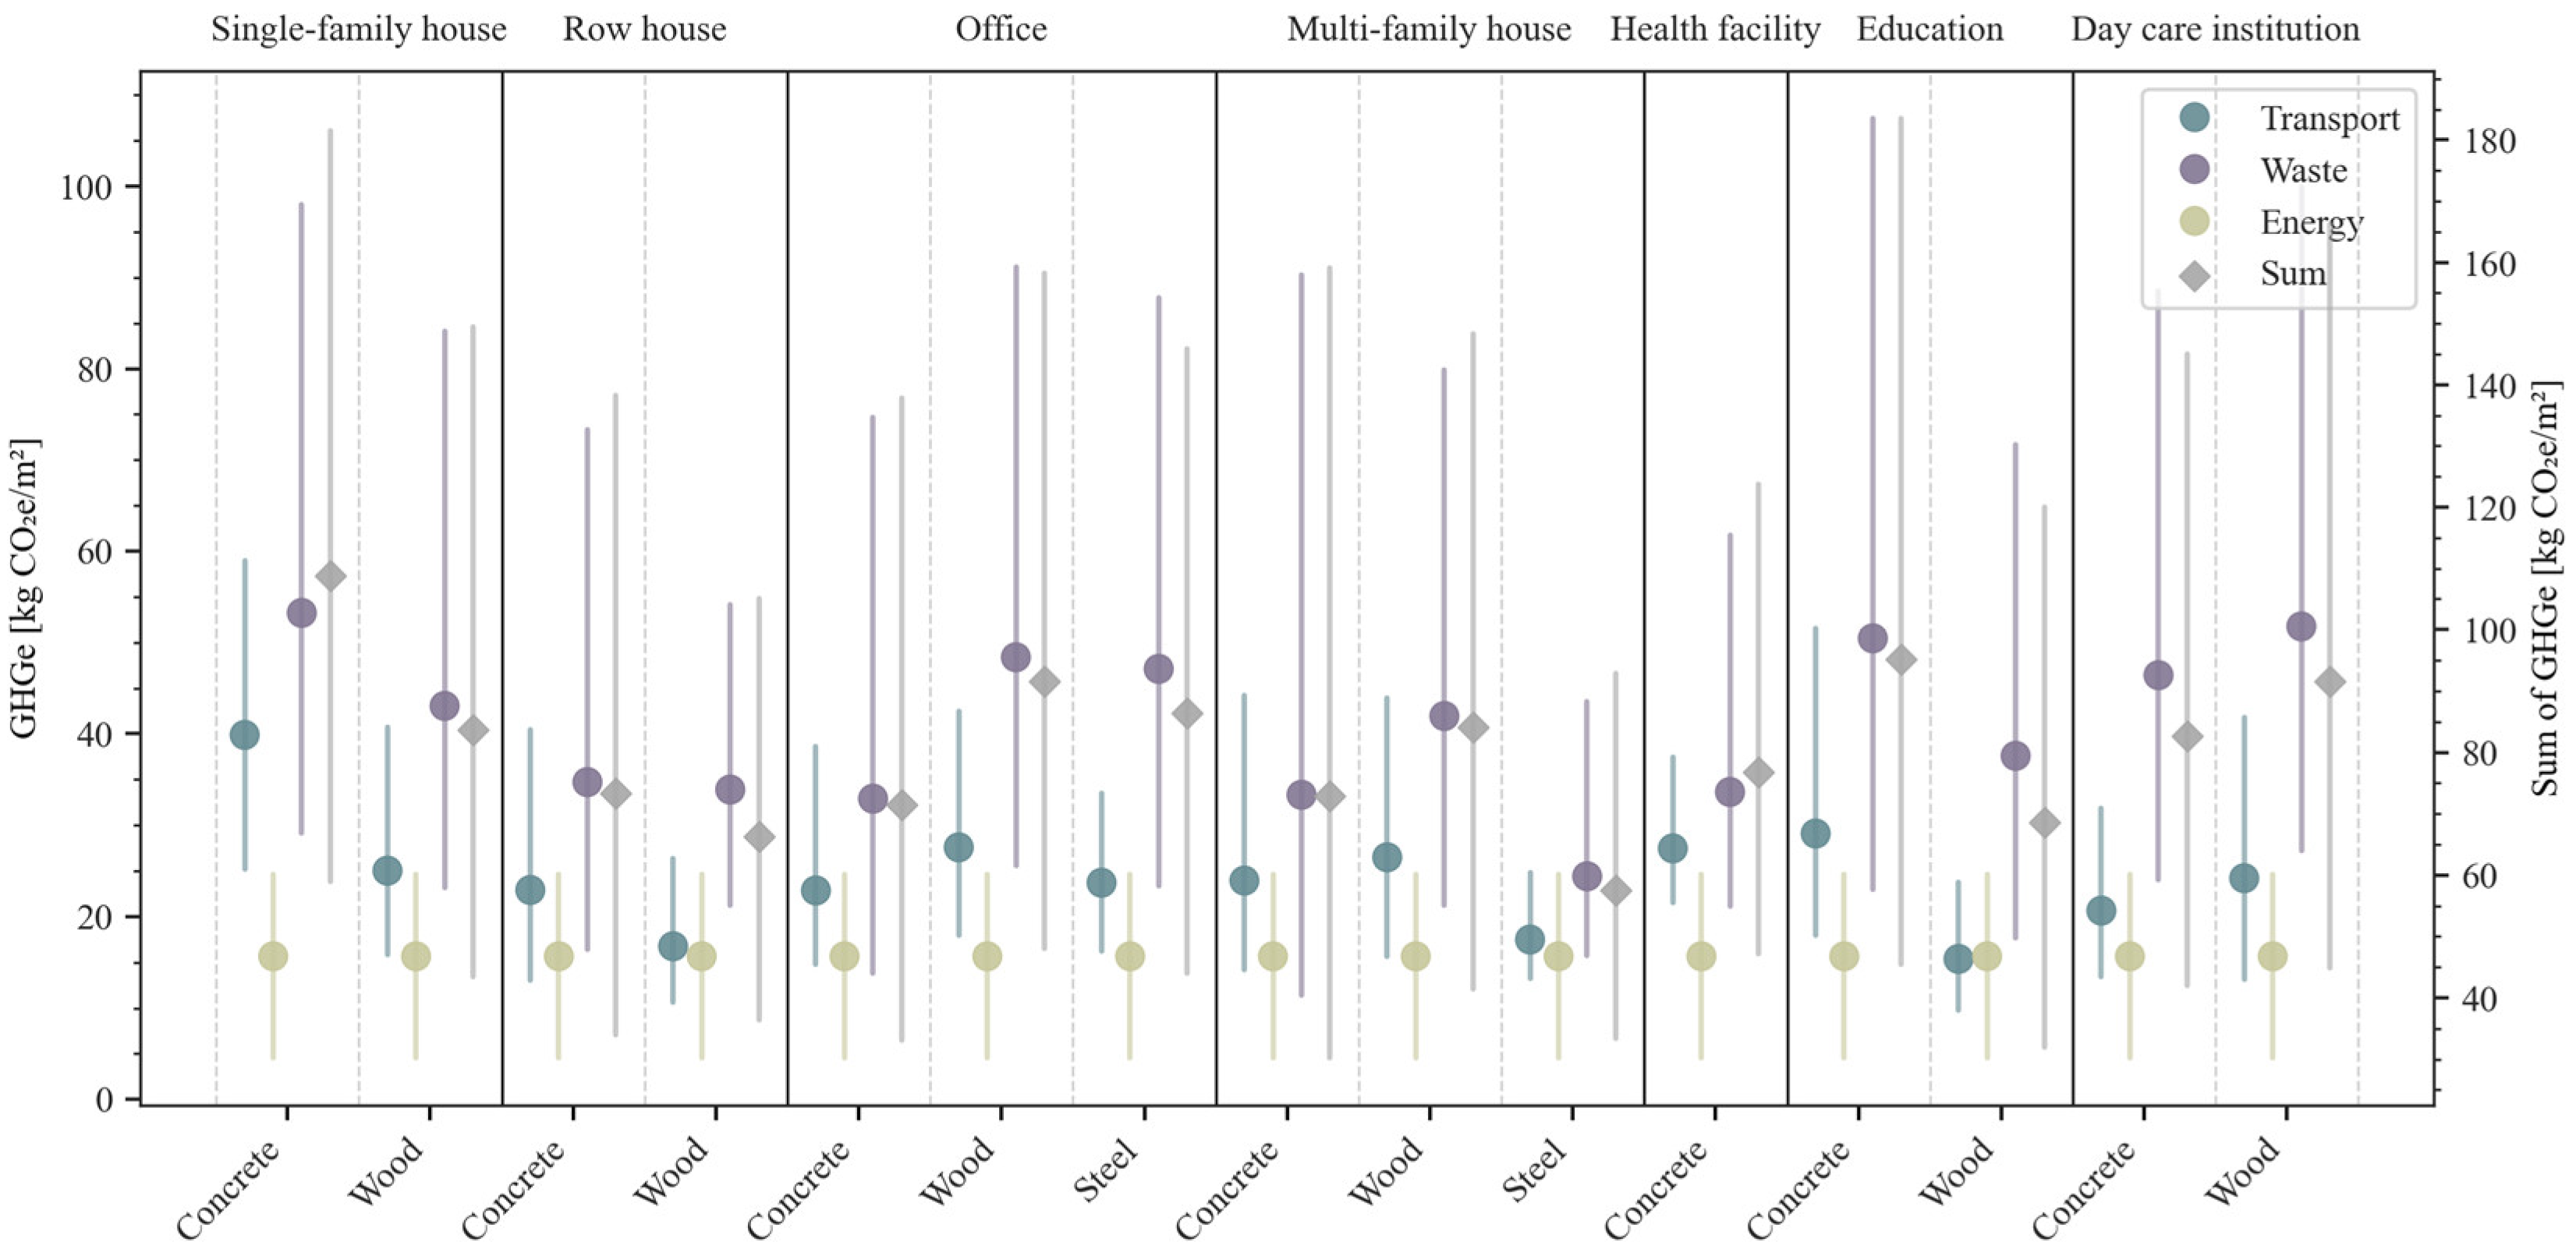
To complete the characterisation of the 15 representative archetypes,
Figure 6 presents the expected GHG emissions per unit area for the construction process (A4–5) under the BAU scenario. Emissions are broken down into three categories—transport, waste, and energy—represented by coloured dots, with error bars indicating the minimum and maximum expected values. The GHG emissions case results are shown in
Appendix B,
Table A2.
As a result of the initial assumptions, energy emissions remain constant across all 15 archetypes because the expected consumption is standardised per square meter. Moreover, energy is the lowest emission source in nearly all cases, except for the wood-based education building, where energy becomes more prominent due to lower transport emissions.
Transport and waste emissions are highly dependent on the MICs. However, the relationship is not strictly linear. In some typologies, buildings with lower MICs—such as those constructed with wood or steel—can still exhibit higher emissions due to the nature of the materials used. For example, wood elements and steel profiles tend to have higher transport emissions per kilogram than concrete elements, due to differences in logistics distances and density. Similarly, materials like gypsum and metals typically generate more waste per kilogram and have higher emissions associated with waste treatment compared to concrete elements.
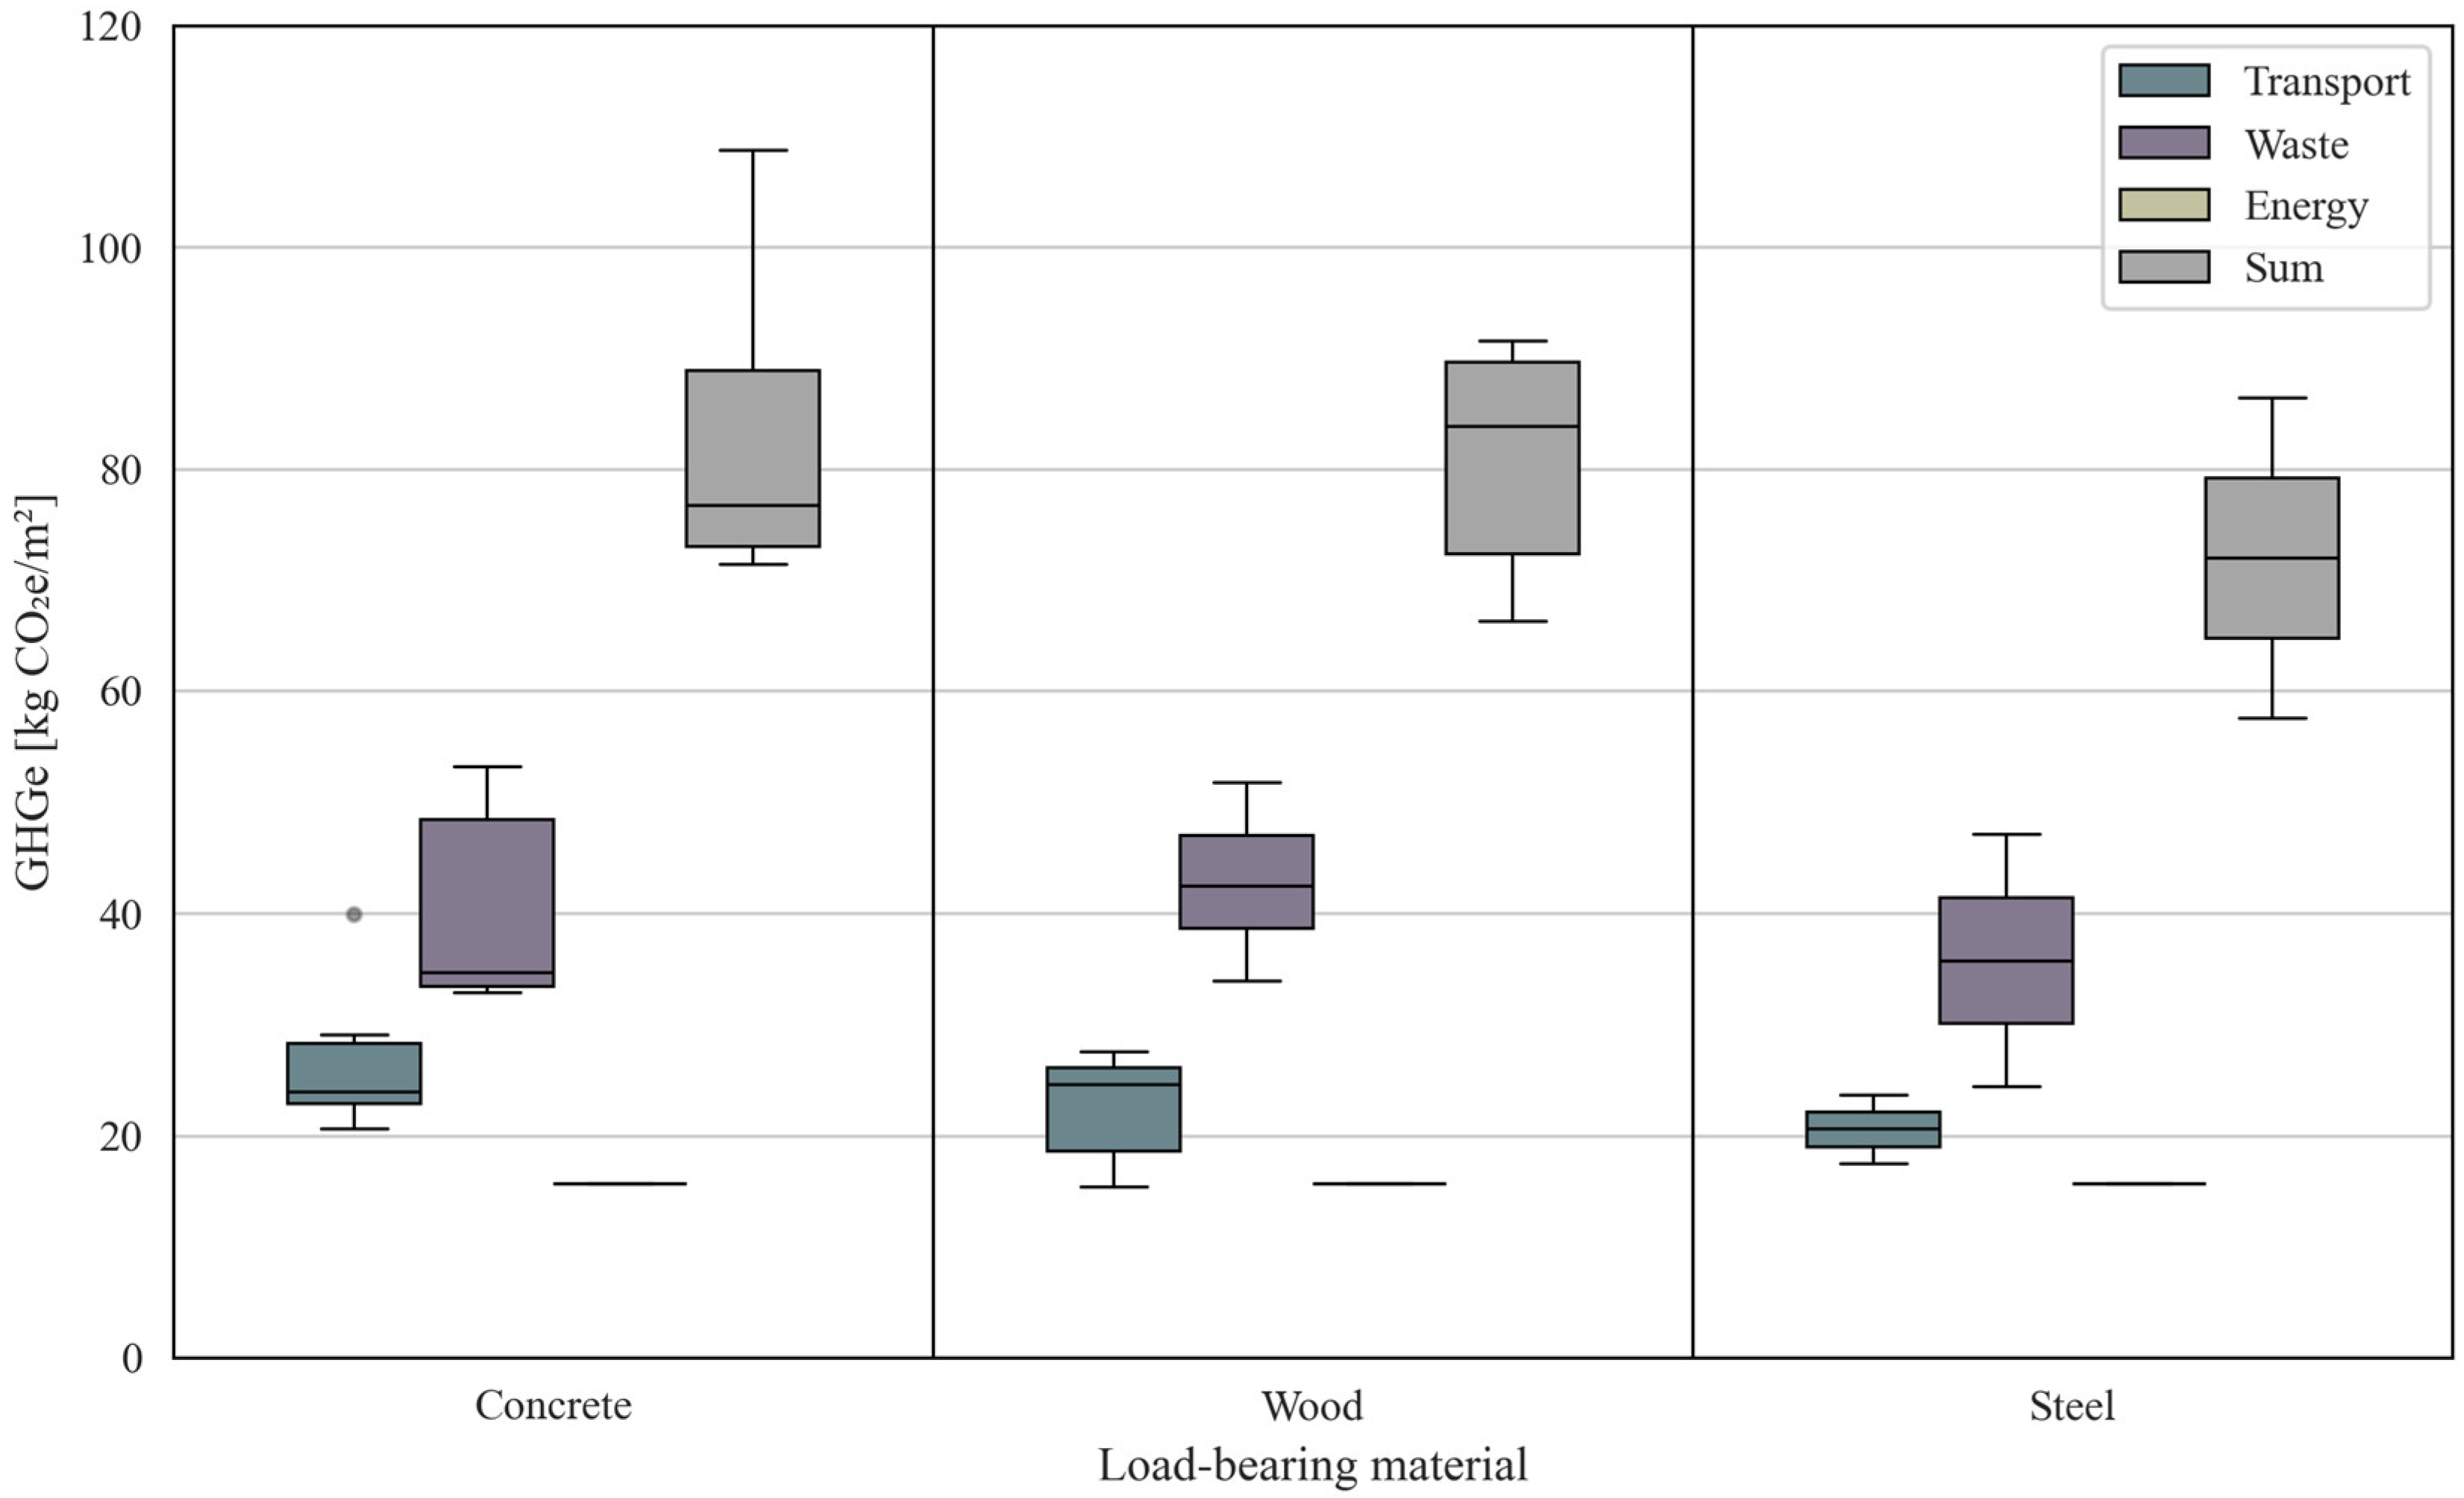
As a result, concrete buildings do not always result in the highest emissions during construction, despite their higher overall material intensity. These dependencies on the load-bearing structure are visualised in
Appendix B,
Figure A1, where the medians for wood-based buildings are higher than those for concrete buildings, but the variance across typologies is larger for concrete structures. These findings highlight the importance of considering material-specific emission factors and waste generation profiles, rather than relying solely on total material mass, when evaluating GHG emissions.
The findings in the BAU scenario express a wide range of construction process emissions and their correlation with project characteristics such as material composition, typology, and structural system. They underscore the potential for tailoring mitigation approaches to building-specific characteristics. In the following analysis, these results serve as a baseline for assessing the carbon-mitigation potential and cost-efficiency of a range of interventions during the construction phase.
3.2. Marginal Abatement Cost
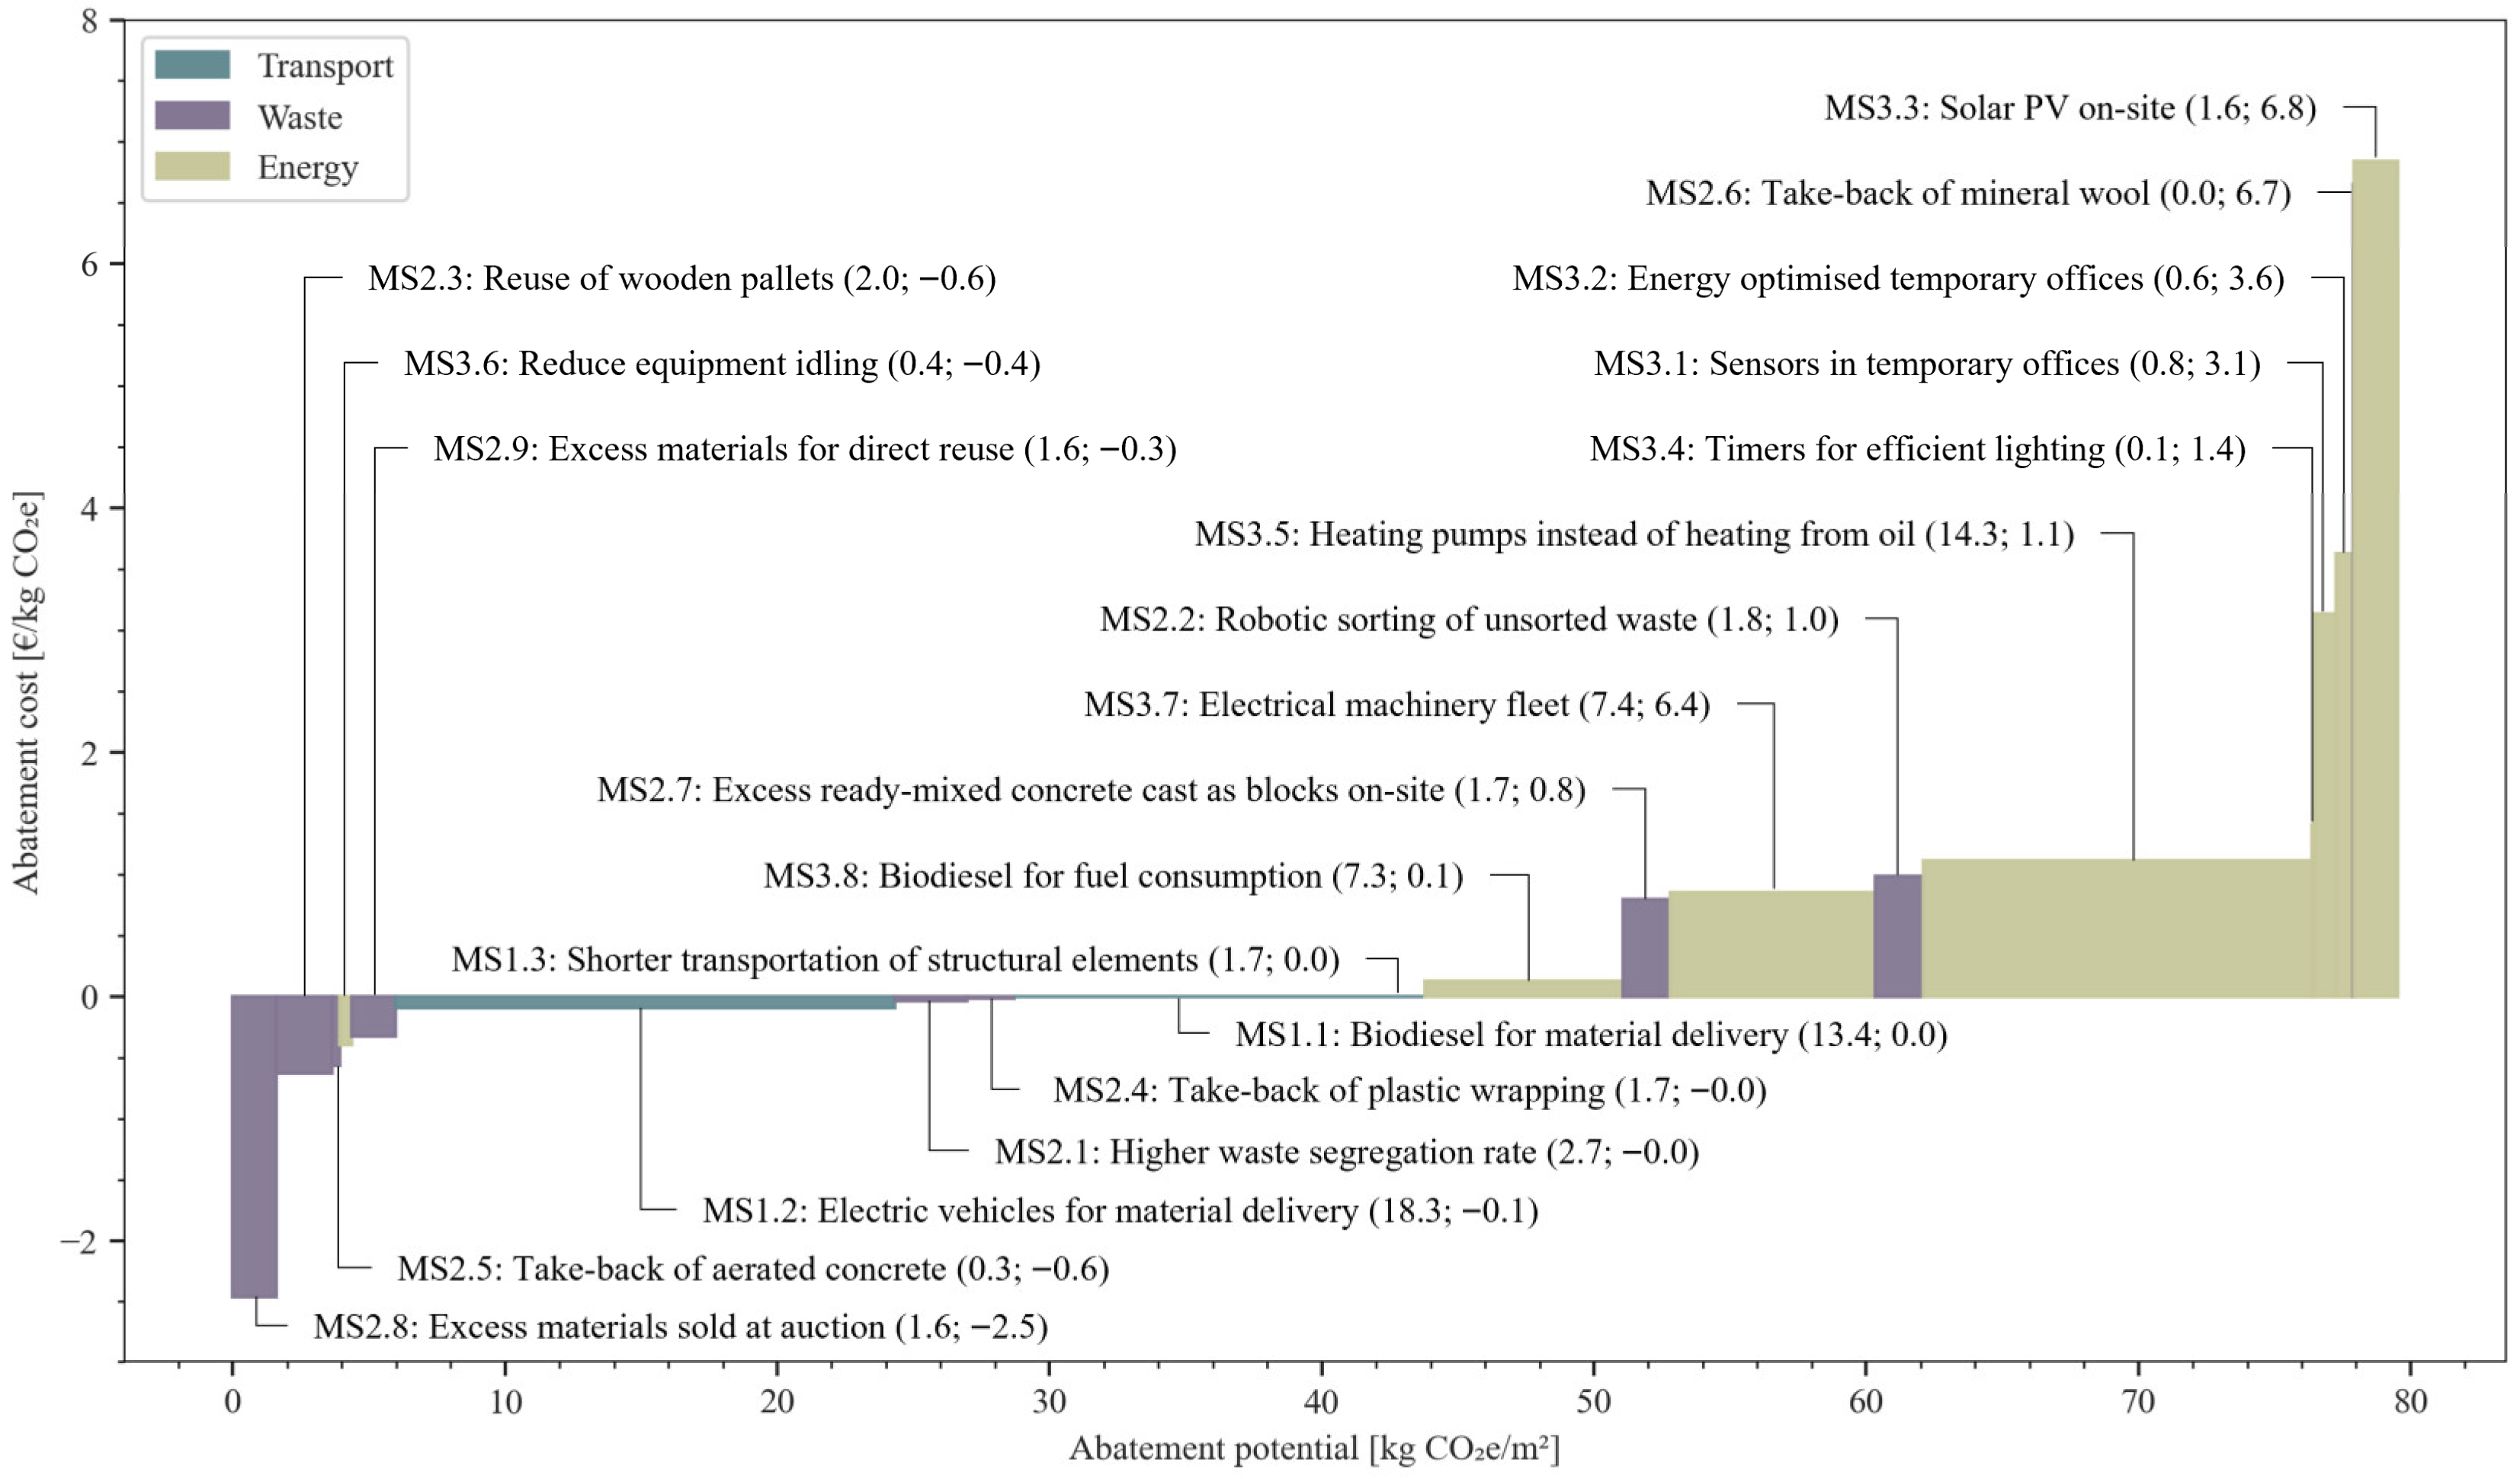
The MACC in
Figure 7 illustrates the cost-effectiveness and carbon mitigation potential of the 20 identified strategies, categorised into transport, waste, and energy interventions. Each bar represents a mitigation strategy, with its height indicating the cost per kilogram of CO
2-equivalent abated (€/kg CO
2e), and its width representing the abatement potential per gross floor area (kg CO
2e/m
2). The MACC results are shown in
Appendix B,
Table A3.
The results reveal substantial variation in both cost and GHG emissions across strategies. Energy-related strategies that involve reducing diesel or oil consumption, such as MS3.5, MS3.7, and MS3.8, all have high abatement potential of 14.3, 7.5, and 7.3 kg CO2e/m2 respectively. Moreover, these mitigation strategies, besides offering some of the highest abatement potentials, also have moderate expenses ranging from 0.1 to 1.1 €/kg CO2e, indicating high cost-efficiency. Reducing equipment idling (MS3.6) also decreases diesel consumption, but it has a lower abatement potential; however, it offers a moderate cost benefit. The remaining energy-related mitigation strategies are found to have both low abatement potential and moderate implementation costs.
Among the most cost-effective strategies are those related to transport, especially those that involve reducing diesel consumption. Using both biodiesel and electric vehicles for material delivery provides a negligible benefit in abatement costs, due to lower or avoided CO2 taxes for the trucks, combined with changes in fuel costs. This makes the mitigation strategies MS1.1 and MS1.2 very cost-effective, with abatement potentials of 13.4 and 18.4 kg CO2e/m2 respectively, under current assumptions. Reducing the delivery distance for all structural elements results in a more moderate abatement potential of 1.7 kg CO2e/m2, assuming cost-free implementation.
Generally, waste-related mitigation strategies are found to result in net savings or near-zero cost, with abatement potentials spanning from being negligible to 2.7 kg CO2e/m2 for segregating all on-site waste into material fractions (MS2.1).
Overall, the MACC highlights that while some strategies offer high mitigation potential, they may come at a substantial cost, whereas others provide modest reductions with strong economic benefits. This analysis supports prioritising strategies such as MS2.8, MS2.3, and MS1.1–3 for their favourable cost–benefit profiles, while strategies like MS3.7 or MS3.3 may be considered in contexts where larger emission reductions justify higher investment.
3.2.1. Cost and Abatement Potential Comparison
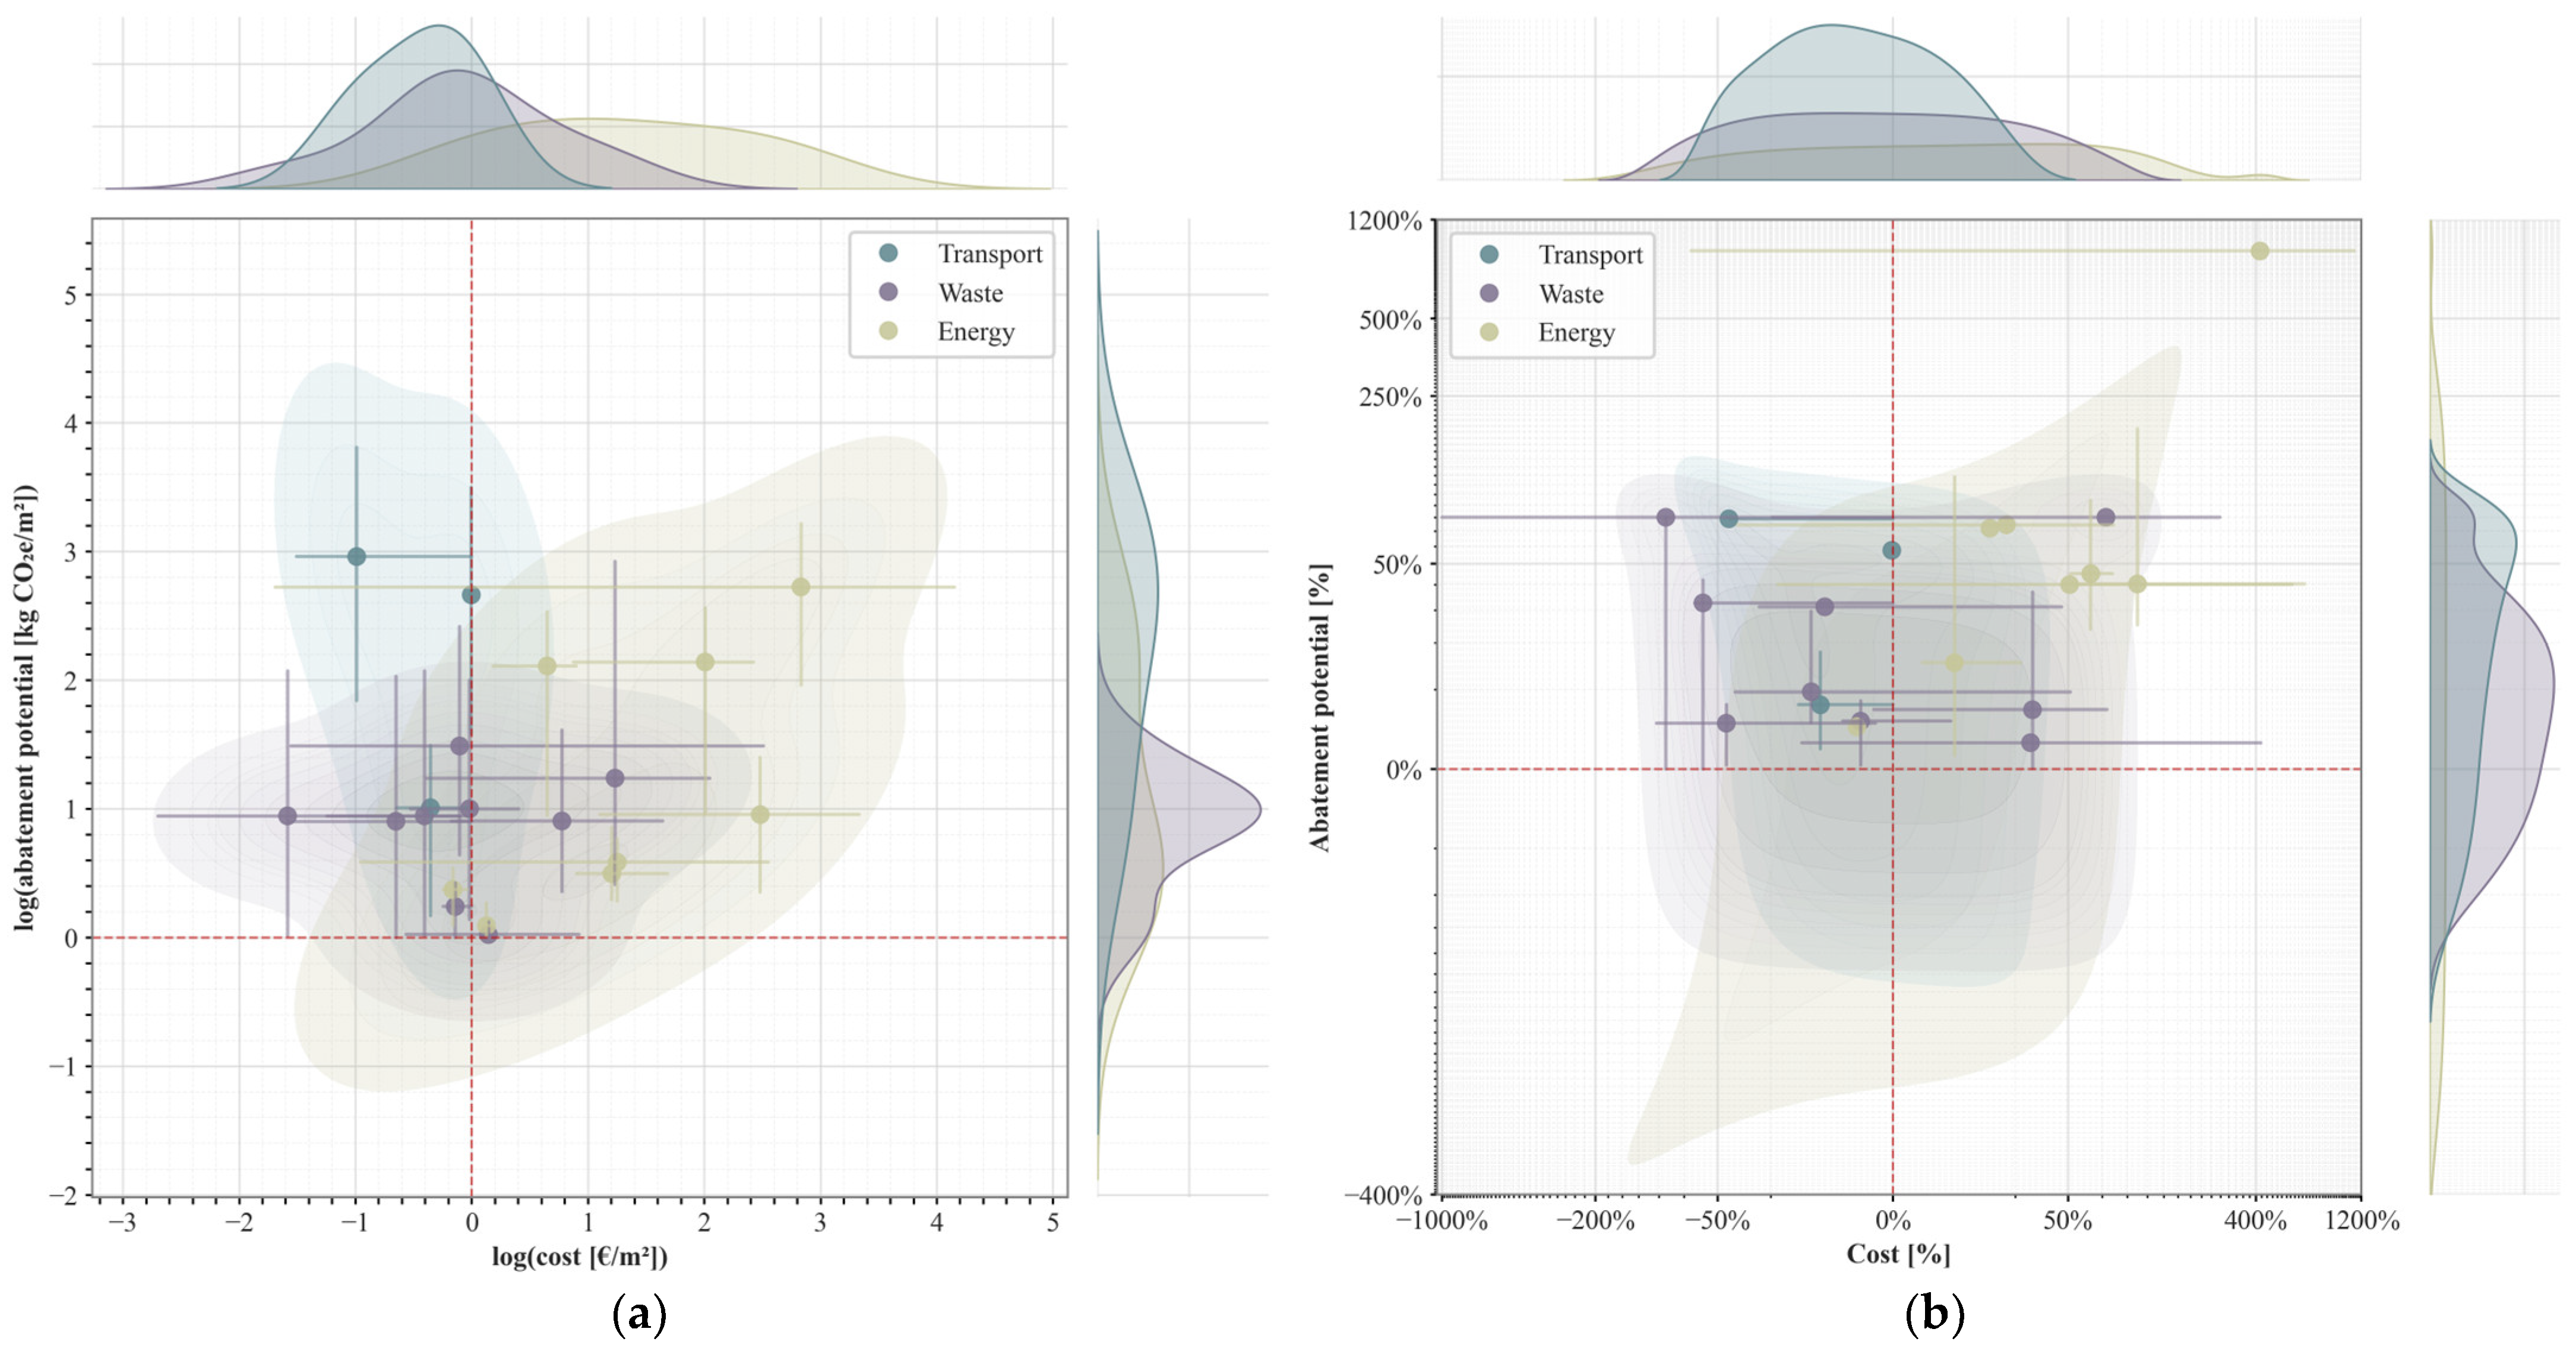
Figure 8a,b present a comparative analysis of the 20 mitigation strategies in terms of their cost and abatement potential.
Figure 8a plots the average cost per square meter (€/m
2) against the average abatement potential (kg CO
2e/m
2), while
Figure 8b expresses both dimensions as percentage changes relative to the BAU scenario. Both figures include error bars to indicate the range in values derived from the Monte Carlo simulations, capturing the uncertainty and variability in outcomes. The results are shown in
Appendix B,
Table A4 and
Table A5.
The results reveal distinct patterns across the three resource categories—transport, waste, and energy. Transport-related strategies (MS1.1–MS1.3) consistently show high abatement potential with no cost or slight net savings. For example, MS1.2 (use of electric vehicles for material delivery) achieves an average abatement of 18.3 kg CO2e/m2 with a net saving of 1.69 €/m2. These strategies also exhibit relatively narrow uncertainty ranges across different archetypes.
Waste-related strategies (MS2.1–MS2.9) generally offer moderate abatement potential and tend to result in net savings. MS2.1 (higher on-site waste segregation) and MS2.3 (reuse of wooden pallets) are particularly cost-effective, with average abatement potentials of 1.5–3.4 kg CO2e/m2 and negative or near-zero costs. However, some strategies, such as MS2.2 (robotic sorting) and MS2.7 (casting excess concrete as blocks), exhibit greater cost variability, suggesting sensitivity to project-specific conditions.
Strategies like MS3.7 (electrical machinery fleet) and MS3.5 (heating pumps) offer substantial reductions but come with high implementation costs, averaging 6.4 €/m2 and 15.9 €/m2, respectively. However, when using heat pumps instead of oil boilers for post-closure heating (MS3.5), the error bars indicate a shift in costs, with the strategy moving from a burden to a cost–benefit. In contrast, low-cost interventions such as reduced equipment idling (MS3.6) provide modest but cost-efficient reductions.
Figure 8 shows that transport strategies offer the most favourable balance between cost and abatement potential, while energy strategies require careful consideration given their higher costs and variable effectiveness. Waste strategies occupy a middle ground, often delivering net savings with moderate climate benefits. These insights support a tiered approach to mitigation planning, prioritising low-cost, high-impact strategies while evaluating the feasibility of more capital-intensive interventions.
4. Discussion
This study set out to identify and evaluate mitigation strategies that can reduce GHG emissions during the construction phase of buildings, focusing on modules A4 and A5 of the LCA. The working hypothesis was that targeted interventions within the contractor’s scope, particularly in transport, waste management, and energy use, could offer meaningful climate benefits at varying levels of cost-effectiveness. The results confirm this hypothesis and provide a nuanced understanding of how different strategies perform under realistic construction conditions, offering insights that support more informed and strategic planning in the construction sector. These findings are particularly relevant for construction sites, as the modelled strategies directly target on-site activities such as transport, energy use, and waste management. By linking GHG reductions to contractor costs, the results provide actionable insights for site-level decision-making and budgeting, supporting contractors in balancing environmental goals with economic constraints.
The MACC and the comparative analysis (
Figure 7 and
Figure 8) reveal that transport-related strategies consistently offer the most favourable balance between cost and GHG emissions. Strategies such as biodiesel deliveries (MS1.1) and electric vehicle deliveries (MS1.2) demonstrate high abatement potential with either no cost or net savings. However, in practice, the contractor may incur an additional cost if more electric cars are required than the supplier has available. These findings align with previous studies [
7,
55], which emphasise the role of low-carbon logistics in reducing construction emissions. The relatively low implementation complexity of these strategies further supports their prioritisation in contractor-level decision-making. It confirms earlier research suggesting that logistical interventions are among the most scalable measures for near-term decarbonisation [
27,
28].
Waste-related strategies have moderate abatement potential and tend to yield net savings, particularly those involving reuse and take-back schemes. These results are consistent with circular economy literature, which highlights the environmental and economic benefits of material recovery and reuse [
8]. However, the variability in cost outcomes, especially for strategies such as robotic sorting (MS2.2), suggests that feasibility is highly dependent on project-specific factors, such as scale and site logistics. Notably, the study did not model waste-prevention strategies, despite evidence from previous research [
44,
47] showing that reducing waste generation can significantly lower construction-phase emissions. Waste prevention, such as improved design planning, material optimisation, and procurement practices, could complement the modelled strategies by addressing emissions at the source. Integrating these upstream measures into future assessments would likely enhance both environmental performance and cost-effectiveness. This gap highlights the need for future studies to incorporate upstream planning decisions into mitigation assessments.
Energy-related strategies present a more complex picture. While some interventions, such as reduced equipment idling (MS3.6), offer modest but cost-effective reductions, others, like heating pumps (MS3.5) and electrical machinery fleets (MS3.7), show high abatement potential but also high implementation costs on average. These findings echo previous research (e.g., by Ohms et al. [
56]), which found that operational energy demand and electrification strategies can be impactful but require substantial investment. The high percentage reductions (from 4.4% to 911%) observed in
Figure 8b for energy strategies suggest that, despite their lower absolute impact per square meter, they may be critical for achieving long-term decarbonisation goals and regulatory compliance, particularly in larger projects.
Behavioural changes, although often overlooked, represent a promising category of low-cost, high-impact mitigation strategies. Interventions such as reducing equipment idling (MS3.6) and improving on-site waste sorting (MS2.1) are typically underutilised due to their intangible nature and reliance on human compliance. The construction industry tends to prioritise technical solutions over behavioural ones, partly because standardised methods for quantifying behavioural impacts in LCA and cost–benefit analyses are lacking [
37,
38]. Additionally, limited institutional support and awareness further hinder the adoption of behavioural programmes, despite their potential to be implemented quickly and at minimal cost [
40]. Addressing these barriers—through training, incentives, and monitoring systems—could unlock significant mitigation potential within the contractor’s scope of work [
30].
Beyond behavioural aspects, implementation feasibility is also shaped by organisational and contextual factors. Contractor decision-making, procurement processes, and supply chain agreements can significantly influence whether mitigation strategies are adopted in practice [
40]. For example, take-back schemes require contractual arrangements with suppliers, and reuse strategies depend on site-level coordination and storage capacity. Broader contextual factors, such as national carbon pricing, regulatory incentives, and local infrastructure for waste treatment or electric charging, also affect cost-effectiveness and scalability. These factors were not included in the present model, as the focus was on technical and economic performance under current conditions.
4.1. Applicability of Mitigation Strategies Across Building Sizes
While the mitigation strategies identified in this study demonstrate varying degrees of GHG emissions and cost-effectiveness, their practical applicability is strongly influenced by the scale of the construction project. A linear relationship is assumed between building size and material intensity, meaning that emissions and savings generally scale proportionally with area. However, this assumption does not hold uniformly across all strategy types. For instance, transport-related strategies yield consistent savings per square meter regardless of project size, making them broadly applicable. This finding aligns with previous research emphasising the scalability of low-carbon logistics interventions [
28,
29,
30]. In contrast, waste and energy strategies exhibit more complex relationships with scale, shaped by factors such as waste volume, equipment needs, and construction duration, confirming earlier observations that mitigation planning must account for project-specific operational realities [
25].
4.1.1. Waste Mitigation Strategies: Feasibility and Cost-Effectiveness
The analysis reveals that economies of scale are critical in determining whether a waste mitigation strategy results in net savings or additional costs. Larger projects benefit from lower per-square-meter costs for container delivery and collection, as these are typically fixed fees. However, larger projects also lead to larger waste volumes, thereby requiring more frequent emptying of waste containers and longer rental periods. Consequently, many waste strategies shift from being cost-intensive to cost-saving once a certain project size threshold is reached. This finding aligns with earlier literature that emphasises the importance of accurate budgeting and forecasting for managing cost performance [
19,
23] and supports circular economy principles that advocate for resource recovery at scale [
8,
31].
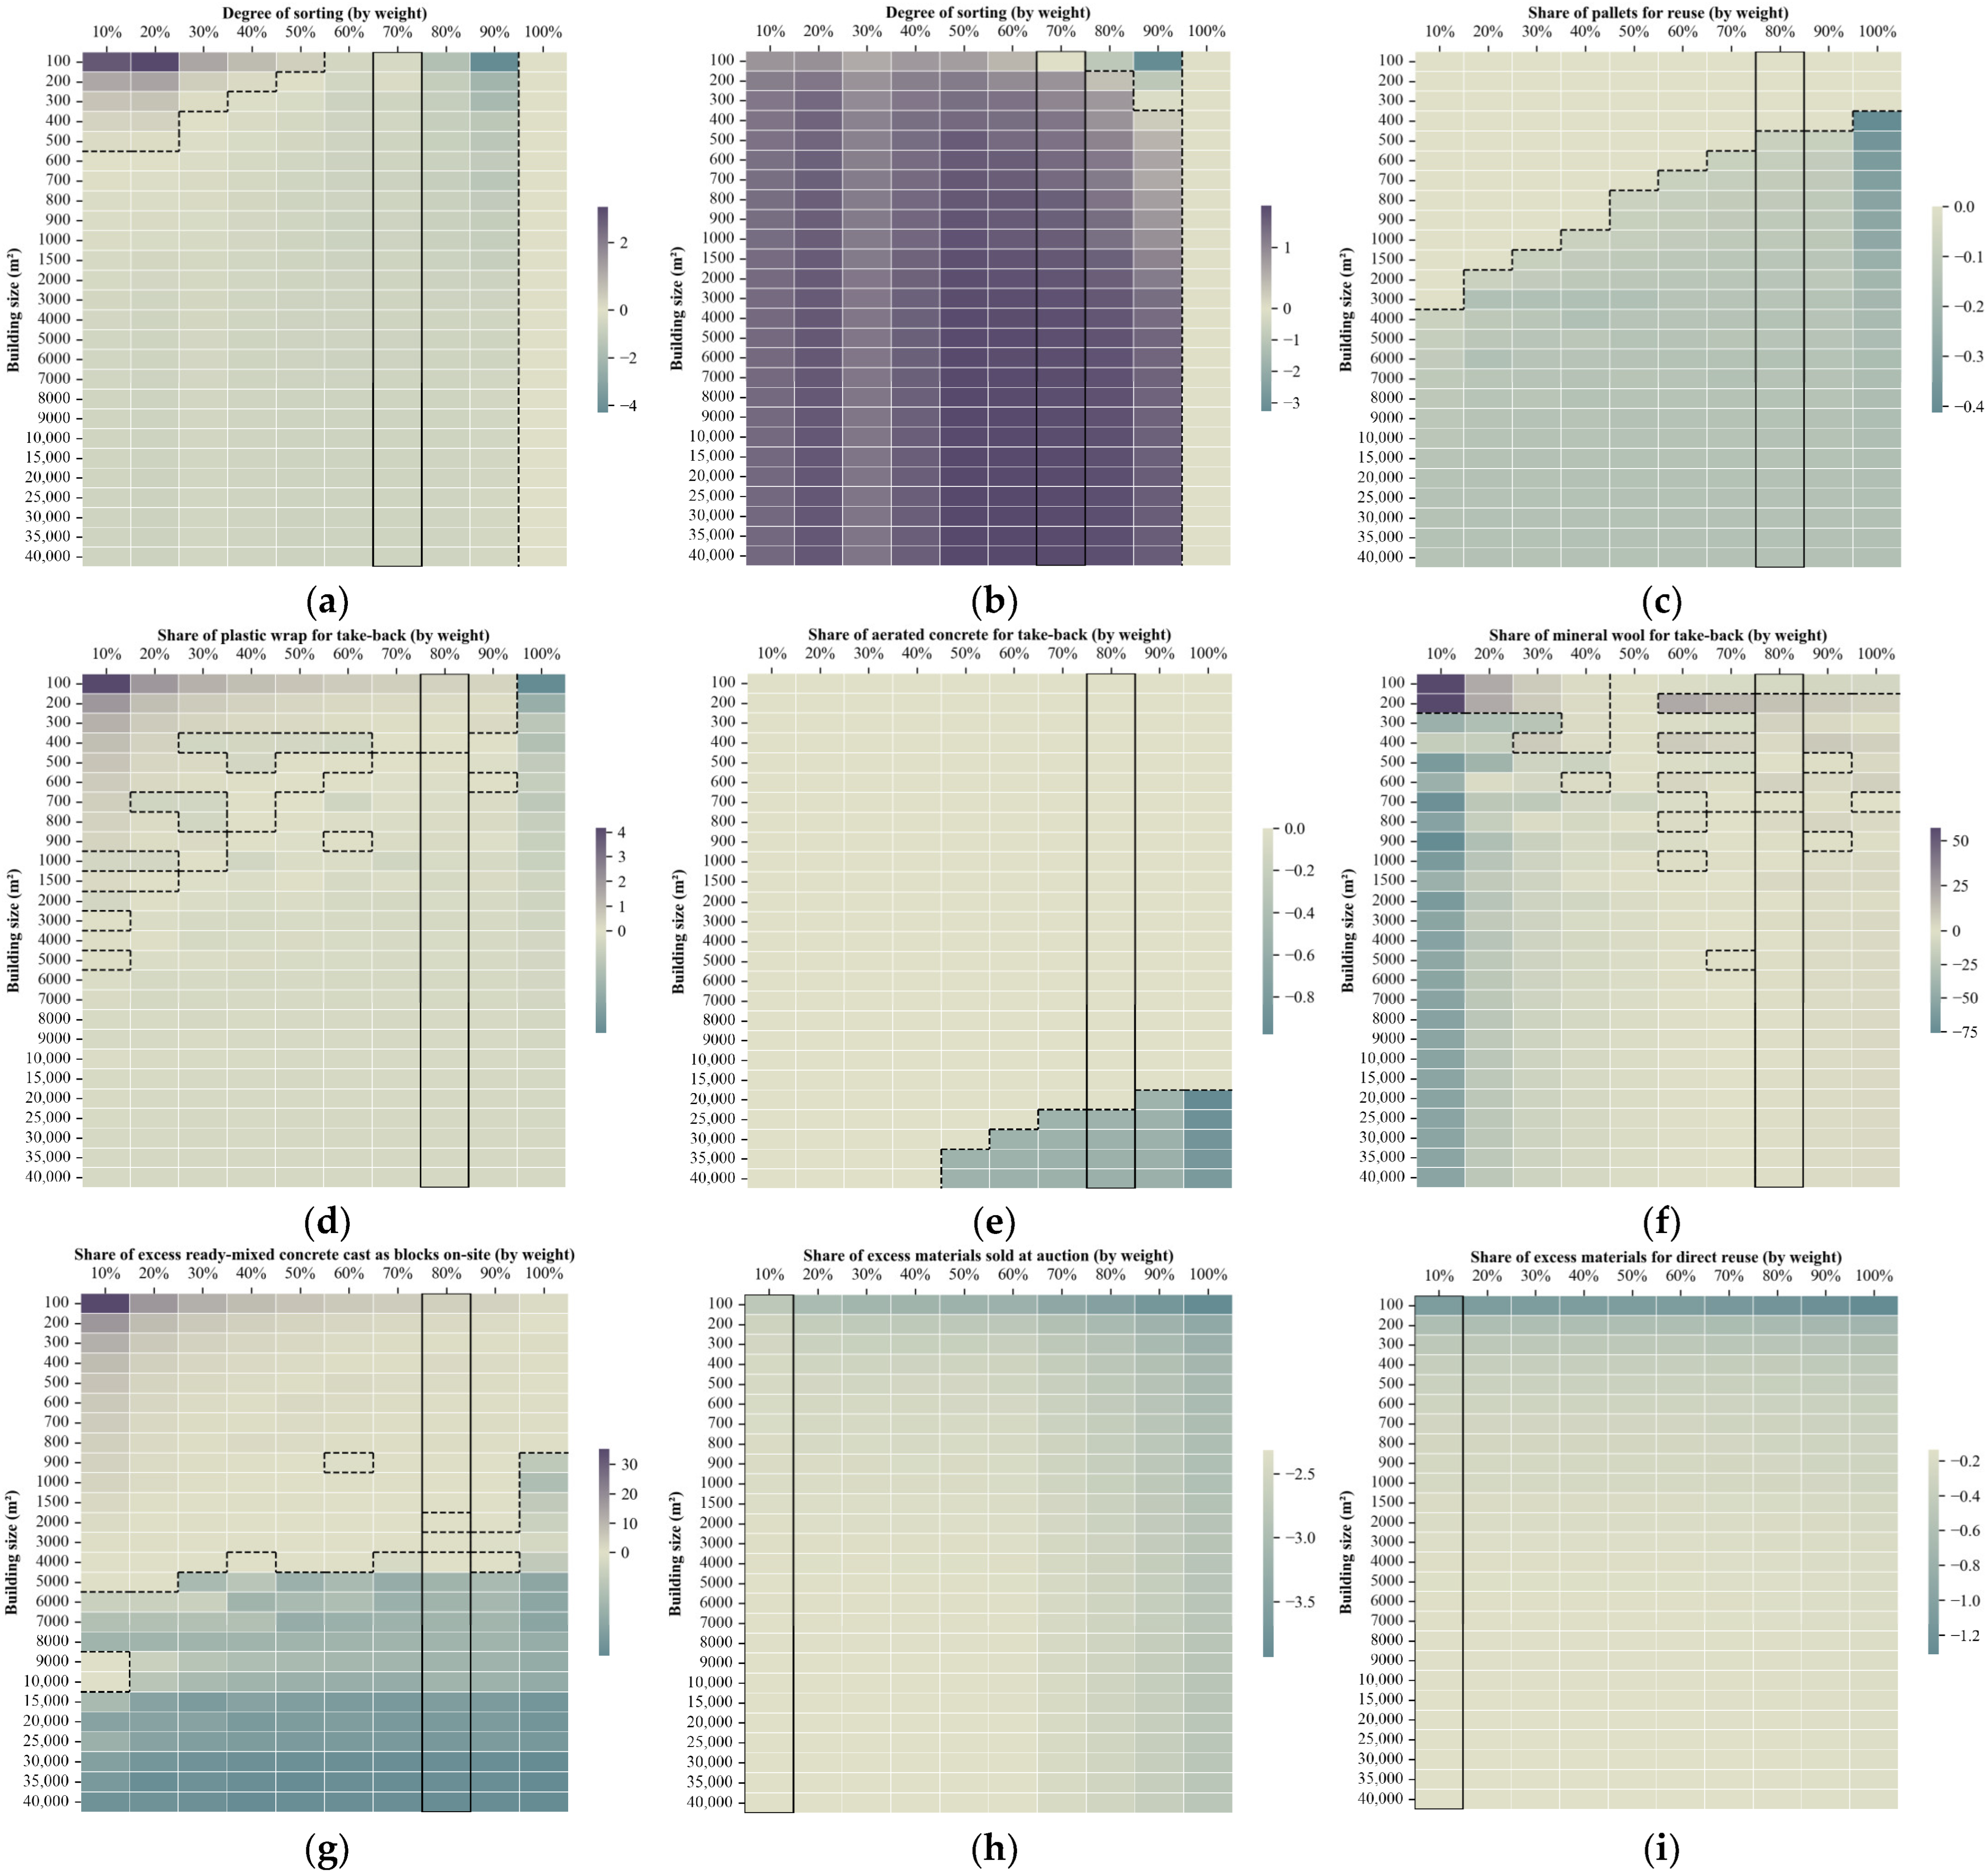
For example, on-site waste segregation (
Figure 9a) is not economically viable for small projects with low segregation rates, due to high per-container costs and limited turnover. However, small projects with high segregation rates can achieve significant savings by reducing the volume of expensive mixed waste, which incurs post-collection sorting fees. This highlights the need for project-specific assessments and suggests that waste strategies should be tailored to each site’s operational realities.
Robotic sorting of mixed waste (
Figure 9b) is only economically feasible for small projects that already maintain a high degree of on-site segregation. This suggests that robotic sorting should be considered a complementary strategy rather than a standalone solution, particularly in projects with limited space or logistical constraints. This aligns with broader findings in the strategic planning literature, where the effectiveness of interventions depends on their integration into existing workflows and site conditions [
24].
Material take-back strategies, such as those for wooden pallets (
Figure 9c) and aerated concrete (
Figure 9e), are highly size-dependent. Minimum thresholds for collection, 150 pallets or 25 big bags, equivalent to around 10 tonnes of aerated concrete, limit their feasibility to medium- and large-scale projects. Logistical and spatial limitations faced by construction sites may lack the volume or storage capacity to implement such strategies effectively. These findings reinforce earlier research on supply chain coordination and material traceability as critical enablers of circular economy strategies [
8,
31].
The take-back of plastic wrapping and mineral wool (
Figure 9d,f) presents a more complex picture. These two waste fractions are unique in that their containers have a higher cost per kg of waste during emptying than mixed waste. However, the take-back solutions for both are less expensive than collecting the sorted fractions through conventional means. This cost dynamic creates an uneven distribution of positive and negative outcomes across different project sizes and sorting rates. For plastic wrapping, the take-back strategy becomes economically beneficial for projects larger than approximately 5000 m
2, where the volume of material justifies the logistics and collection costs. Moreover, the higher the share of plastic wrap taken back, the greater the net savings, making this strategy particularly attractive for medium to large-scale projects with high sorting rates.
In contrast, the take-back of mineral wool is only cost-effective when the material sorting rate exceeds roughly 75%. Projects with lower sorting rates do not benefit economically from the 80% take-back parameter, as it becomes more expensive than the generalised BAU scenario, which assumes a sorting rate of about 55% for mineral wool to achieve an overall segregation rate of 70%. However, a notable exception exists; replacing the general mineral wool container with a take-back container always results in a net benefit, as the emptying cost for the take-back container is lower. This substitution is feasible only if all the mineral wool used on the project originates from the same producer, due to logistical and contractual constraints. This finding reinforces the importance of supply chain coordination and material traceability, which are increasingly emphasised in circular economy frameworks [
8].
Casting excess ready-mixed concrete on-site (
Figure 9g) is another strategy where project size and duration are critical. The initial investment in moulds is justified only when sufficient excess concrete is generated, and the timeline allows for curing and reuse. Projects over 5000 m
2 typically meet these criteria, and mould reuse across projects further enhances cost-effectiveness. This supports the broader argument that strategic planning must account for lifecycle use of resources, not just one-off interventions [
25].
Finally, strategies involving reuse or redistribution of surplus materials (
Figure 9h,i), such as selling at auction or donating to local communities, offer modest climate benefits but require storage space and proximity to reuse facilities. While selling materials yields greater economic returns, both approaches depend on the availability of undamaged surplus and logistical feasibility. These findings echo previous studies on behavioural and organisational factors influencing reuse practices, which highlight the role of incentives and collaborative networks in enabling circular flows [
37,
38].
In summary, the applicability of waste-related mitigation strategies is highly sensitive to project scale, waste volume, and site logistics. Larger projects tend to unlock greater savings and mitigation potential, while smaller projects may face barriers related to cost, space, and operational complexity. These findings highlight the importance of conducting project-specific evaluations to incorporate strategic planning and budgeting into environmental decision-making. They also suggest that scalable solutions, like modular take-back systems or shared logistics, could enhance feasibility across a broader range of construction contexts.
4.1.2. Energy Mitigation Strategies: Feasibility and Cost-Effectiveness
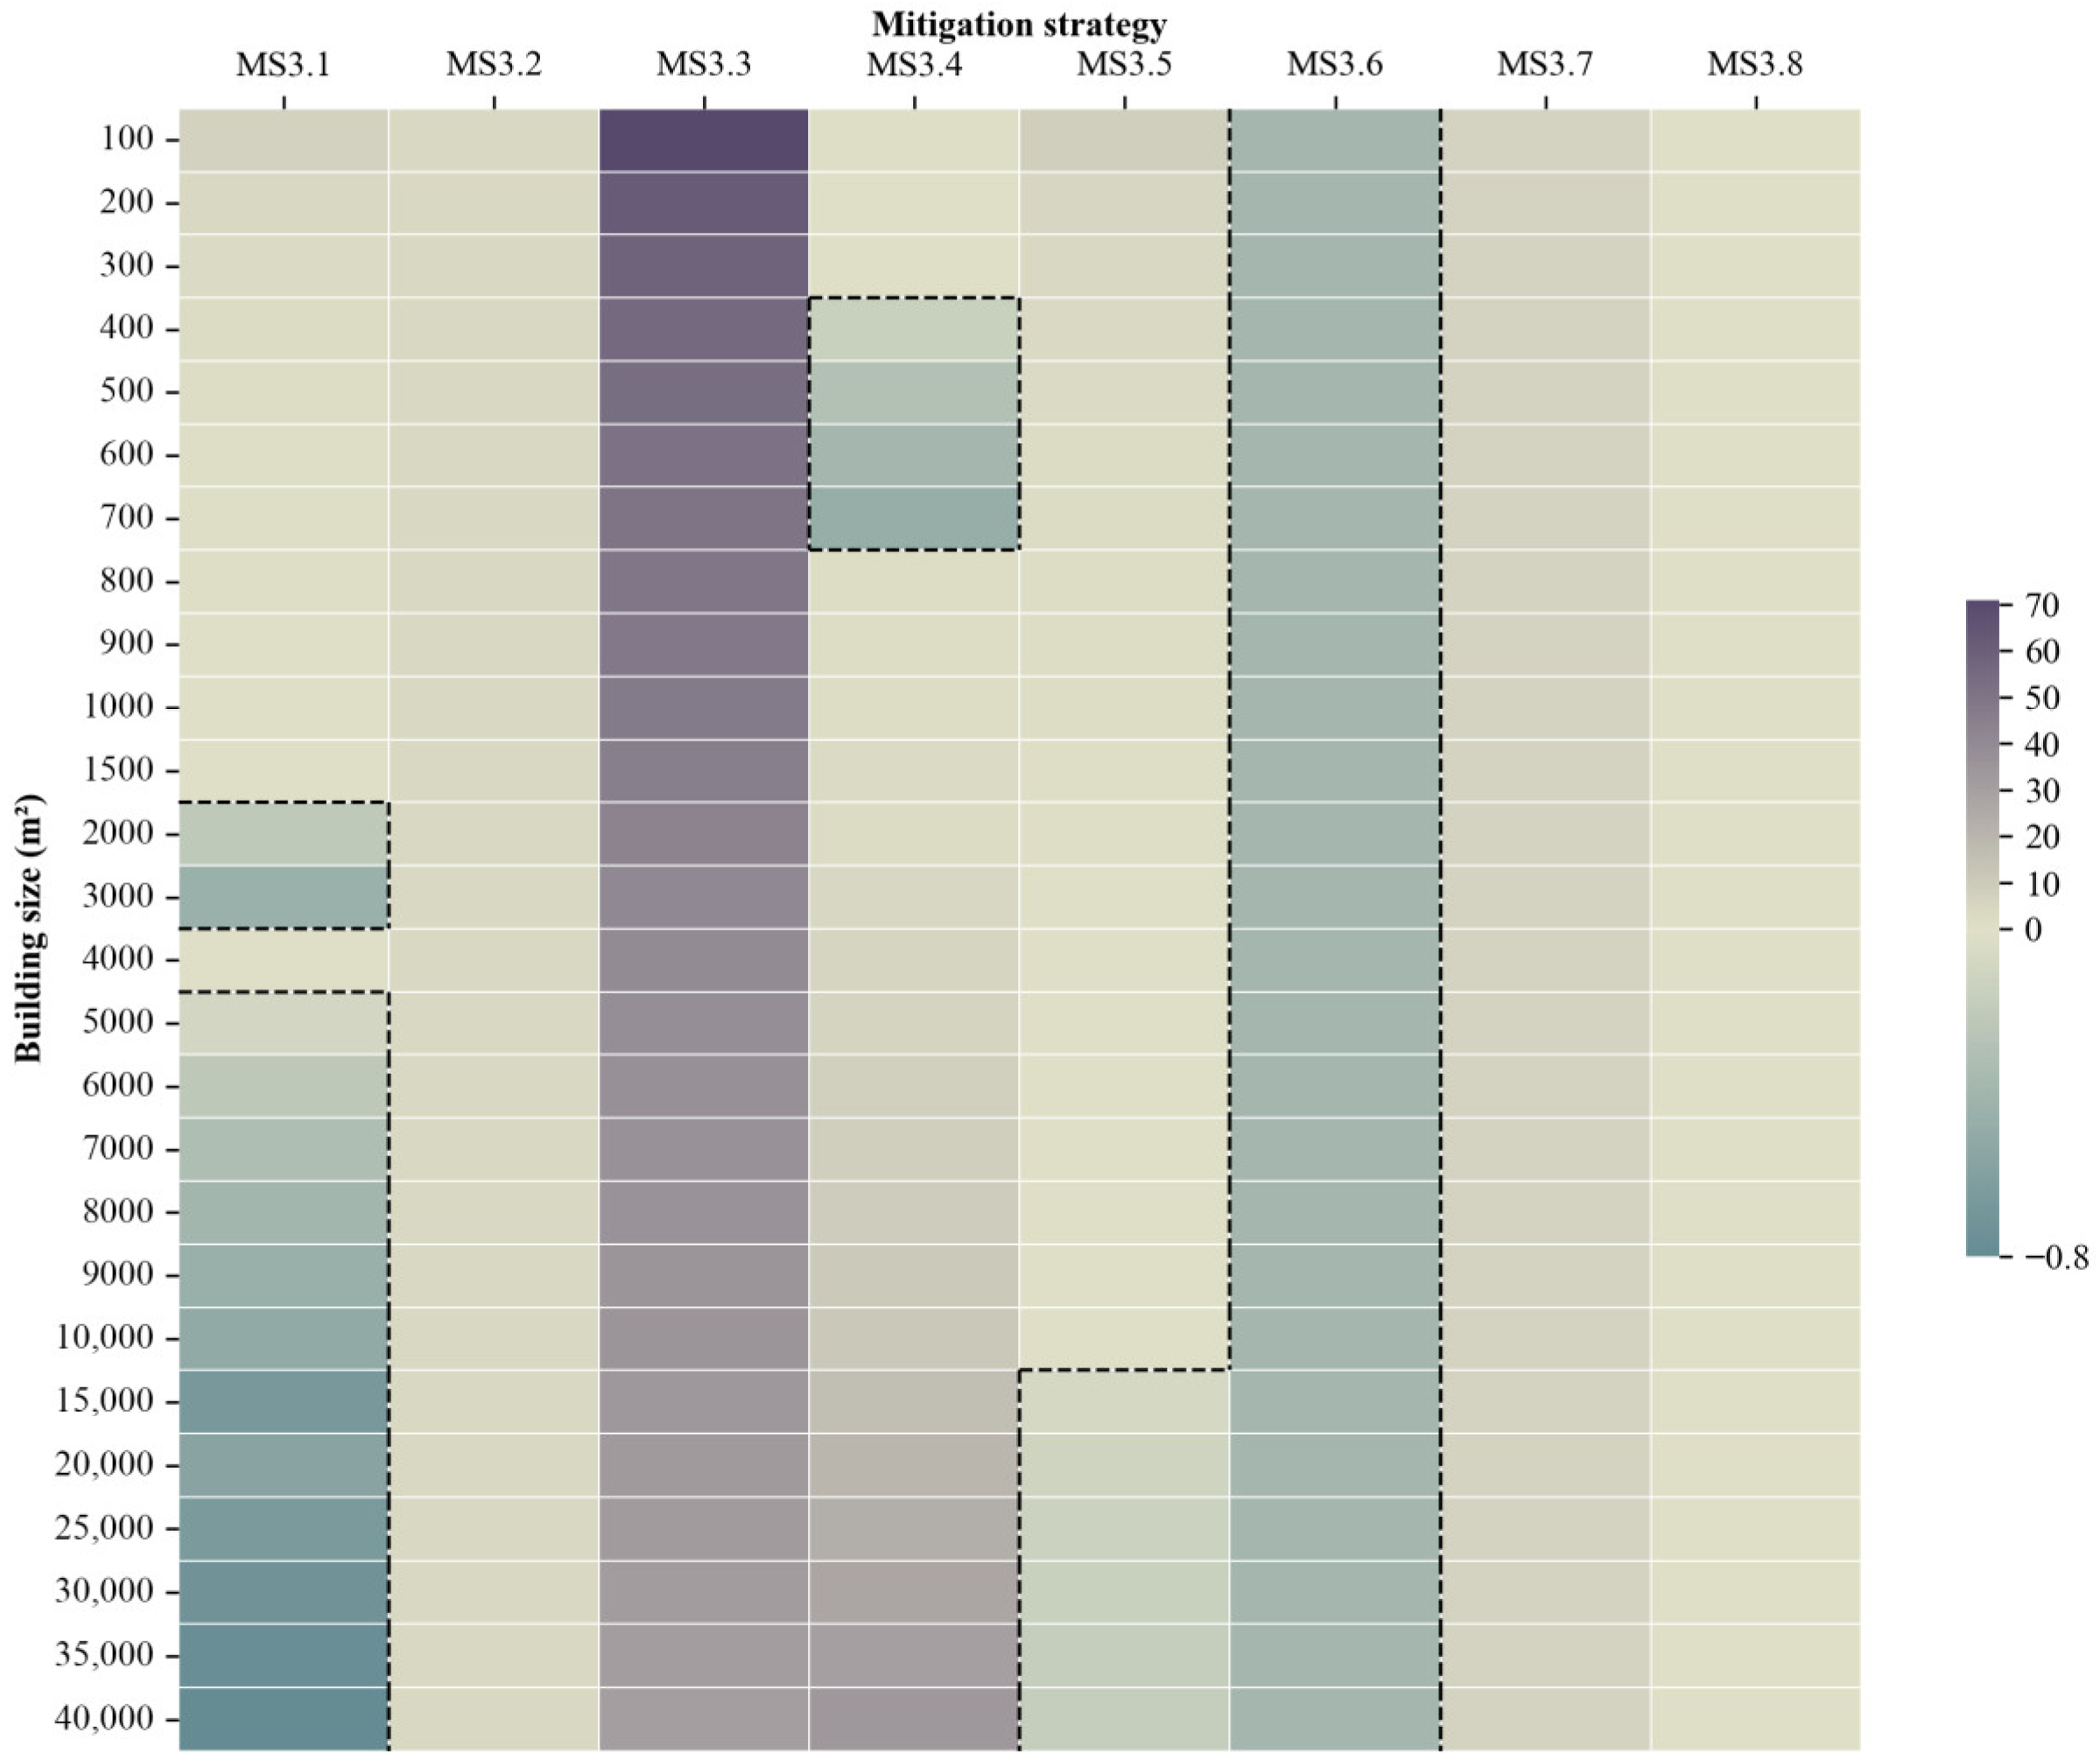
Unlike waste-related strategies, where cost-effectiveness is closely tied to waste volume, energy-related mitigation strategies exhibit more complex dependencies on building size, construction duration, and energy consumption patterns. While the emission-reduction potential for most mitigation strategies in the BAU scenario is fixed per square meter, the cost dynamics of several energy strategies vary significantly across project scales and operational characteristics, as illustrated in
Figure 10. These findings reinforce the importance of integrating lifecycle-based investment planning and flexible implementation models into strategic decision-making, as emphasised in the literature on construction budgeting and planning [
19,
20].
For instance, installing sensors in temporary offices (MS3.1) becomes economically viable for projects exceeding 2000 m
2, where electricity savings outweigh rental costs. Larger buildings with higher-than-average energy consumption further amplify these savings, making the strategy increasingly attractive as project size grows. This supports the argument that energy efficiency measures should be evaluated in relation to both scale and consumption intensity, consistent with findings from systematic reviews advocating context-sensitive energy interventions [
29].
In contrast, upgrading to energy-optimised sheds (MS3.2) shows relatively stable marginal abatement costs across different project sizes. Although larger projects require more sheds, leading to higher total costs, the emission reductions scale proportionally. However, smaller projects may experience slightly higher marginal costs due to a higher shed-to-area ratio, suggesting that layout efficiency and modular design should be considered in planning.
The strategy of installing on-site solar panels (MS3.3) is modelled under the assumption of a minimum coverage of 25% of total electricity consumption. While this results in a considerable abatement potential, it also leads to high implementation costs for smaller projects, where a single panel may exceed the required coverage, and rental fees are disproportionately high. For larger projects, the marginal abatement cost decreases, but still does not yield a net benefit unless the panels are purchased and reused across multiple projects over their lifetime. If the full investment cost is attributed to a single project, break-even occurs only at an impractically large scale of 70 million m
2. This highlights the importance of shared infrastructure models and long-term asset planning to realise the benefits of renewable energy installations, an approach increasingly advocated in the strategic planning literature [
24,
25].
Timers for efficient lighting (MS3.4) are most beneficial for small-scale projects, where a single timer can generate sufficient savings to offset its cost. However, as project size increases, the number of timers required scales linearly, while energy savings stagnate due to diminishing returns from extended construction durations. This results in higher marginal abatement costs for larger projects, suggesting that this strategy is best suited for compact or short-duration builds.
Mobile heat pumps (MS3.5) offer substantial emission reductions when replacing oil-based heating systems in projects where connection to the district heating grid is not possible, once post-closure heating is needed. The initial investment is offset by lower electricity costs in projects around 10,000 m2, making this strategy viable for medium to large-scale developments. However, the high upfront cost may deter adoption unless supported by financial incentives or shared equipment schemes, reinforcing the need for budget-aligned planning in contractor decision-making.
Some strategies, such as reducing equipment idling (MS3.6), switching to electric site vehicles (MS3.7), and using biodiesel on-site (MS3.8), are modelled as percentage reductions in fuel use. These strategies are independent of project size, making them universally applicable across construction contexts. Moreover, MS3.6 incurs minimal implementation costs, relying on behavioural interventions such as signage and awareness campaigns that can be easily scaled and integrated into site management routines. This aligns with findings from behavioural studies [
37,
38], which emphasise the effectiveness of low-cost, compliance-driven measures when supported by training and incentives.
In summary, the applicability of energy mitigation strategies varies widely. While some scale well with project size or are universally applicable, others, particularly those involving fixed installations or specialised equipment, require careful consideration of project-specific parameters, budget constraints, and long-term planning horizons. These findings underscore the need for flexible implementation models, such as modular systems and shared infrastructure, to maximise the feasibility and impact of energy-related interventions across diverse construction projects. They also highlight the importance of aligning environmental strategies with contractor budgeting and forecasting processes to support more effective and economically viable climate action, reinforcing theoretical arguments for integrating cost-effectiveness into LCA-based planning [
28,
29,
30,
31,
32,
33,
34].
4.2. Limitations and Further Work
While this study provides a comprehensive assessment of mitigation strategies during the construction phase, several limitations must be acknowledged. The analysis is based on a generic model that assumes a linear relationship between building size and material composition, and does not account for variations in floors, internal separations, or facade cladding. These architectural and design features can significantly influence both material use and energy consumption, and their exclusion means that the results should be interpreted as indicative rather than definitive.
Furthermore, the LCIs used in this study are generalised across 15 building archetypes, weighted by national construction statistics. While this approach ensures representativeness within the Danish context, it may not capture the specific conditions, constraints, or opportunities present in individual construction projects or in other national settings. For example, Danish construction sites are characterised by relatively high labour costs, widespread use of prefabricated elements, and moderate logistical complexity due to the country’s compact geography. These factors influence both the feasibility and cost structure of mitigation strategies. Additionally, emissions factors used in the analysis reflect Danish waste management and energy and fuel mixes, which may differ significantly from those in other regions.
Cultural and operational differences also affect the applicability of specific strategies. For instance, robotic sorting of construction waste is considered a viable solution in Denmark due to high labour costs and limited manual sorting capacity. In contrast, in regions with lower labour costs and stronger on-site sorting discipline, manual segregation may be more practical and cost-effective. These examples highlight the importance of contextualising mitigation strategies and caution against directly extrapolating results to other countries without accounting for local conditions.
The cost–benefit analyses presented in this study are best understood as generalised insights that help identify promising mitigation options and assess their relative performance within the context of Danish construction practices. While the strategies themselves may be relevant internationally, their modelled cost-effectiveness and mitigation potential are shaped by national conditions. Therefore, project-specific assessments are essential to support informed decision-making in practice. Detailed evaluations should consider local energy prices, material availability, construction timelines, regulatory frameworks, and site-specific logistics to ensure that mitigation strategies are both feasible and effective in diverse construction contexts.
While the current model is tailored to Danish construction practices, its structure allows adaptation to other national contexts by replacing key input parameters with locally relevant data. This includes updating emission factors, energy and fuel mixes, waste management practices, and cost structures to reflect regional conditions. Additionally, adjusting logistics assumptions, labour cost profiles, and regulatory requirements would enable the framework to capture country-specific feasibility and cost-effectiveness of mitigation strategies. Such adaptations would require collaboration with local stakeholders and access to representative life cycle inventory data to ensure accuracy and practical relevance.
Future work should aim to refine the model by incorporating more granular building characteristics, such as floor count, internal layout, and facade design. Additionally, expanding the scope to include project-specific operational energy, soil and excavation materials, and renovation activities would provide a more holistic view of emissions across the building life cycle. In addition, future research should broaden the model to include renovation and transformation activities, crucial for climate and circular economy goals by extending building lifespans and reducing new material needs. Incorporating renovation requires adapting the material flow model for selective demolition, reuse, and secondary materials. Modelling emissions in modules A4–A5 can standardise construction-phase emissions management for new builds and retrofits, aiding policy and industry practices. Finally, integrating stakeholder perspectives and wider contextual factors, such as contractor preferences, supply chain constraints, national carbon pricing, and regulatory incentives, could enhance the practical applicability and feasibility of the proposed strategies. This approach may also boost external validity and facilitate alignment with policy and industry goals.
5. Conclusions
This study aimed to identify and evaluate mitigation strategies to reduce GHG emissions during the construction phase of buildings, specifically focusing on modules A4 and A5 in life cycle assessments. By establishing a generalised BAU scenario from 15 representative building archetypes, based on 279 completed projects and weighted by national construction statistics, the study provides a robust foundation for assessing the GHG emissions and cost-effectiveness of 20 targeted mitigation strategies within the contractor’s scope.
The results show that considerable emission reductions—averaging 0.02 to 18.83 kg CO2e/m2—can be achieved through practical interventions in transport, waste management, and energy use. Particularly, strategies related to transport and waste offer both abatement potential and economic savings, while energy-related strategies with high mitigation potential often require greater investment. From a strategic perspective, the findings support a tiered mitigation approach: low-cost, high-impact strategies should be prioritised for immediate implementation, while higher-cost energy strategies may be considered in larger projects or where long-term sustainability goals justify the investment.
The study demonstrates substantial climate action beyond the often dominating upstream production or operational measures. Through strategic planning and informed budgeting, contractors can play a pivotal role in reducing construction-phase emissions. The results underscore the importance of integrating cost–benefit analysis into environmental decision-making, enabling stakeholders and policymakers to balance climate ambition with financial feasibility.
The analysis also highlights that some mitigation strategies are project-dependent, influenced by factors such as building size, construction duration, material composition, and site logistics, while others are beneficial in most projects. Waste and energy strategies do not scale evenly—some only pay off in large projects, others in small ones. That is why flexible solutions like modular systems, shared infrastructure, and long-term planning are key to making them work.
While the findings are indicative and based on generalised assumptions, they highlight the importance of integrating mitigation planning into the early phases of construction projects. To make informed decisions, cost–benefit analyses must be embedded in project-specific budgeting and forecasting processes, accounting for design features, site logistics, and contractor capabilities. This alignment ensures that mitigation strategies are not only environmentally effective but also financially viable within the constraints of real-world construction practice. Although the modelling framework was developed using Danish construction data, the approach can be translated to other contexts. Doing so will require defining new context-specific reference flows for materials, energy, and logistics to reflect local practices and market conditions. By linking environmental performance with strategic planning and financial management, this study provides a practical framework for evaluating and ranking mitigation actions—offering actionable insights for contractors, planners, and policymakers working toward low-carbon building practices.
