Article

Piezoresistive Behavior and Applications of Graphene Oxide-Modified Concrete: Experimental and Simulation Study

1
School of Architecture, Changchun Institute of Technology, Changchun 130021, China
2
School of Civil Engineering, Changchun Institute of Technology, Changchun 130021, China
3
PowerChina Jilin Provincial Electric Power Survey and Design Institute Co., Ltd., Changchun 130021, China
*
Author to whom correspondence should be addressed.
Buildings 2025, 15(23), 4268; https://doi.org/10.3390/buildings15234268
Submission received: 24 October 2025 / Revised: 17 November 2025 / Accepted: 20 November 2025 / Published: 26 November 2025

Abstract

To enable self-sensing capabilities in concrete structures for real-time health monitoring, this study investigates the incorporation of graphene oxide (GO) to develop smart concrete. The mechanical, electrical, and flexural-sensing properties of GO-concrete were systematically examined at both material and structural levels. The core finding of this research is the identification of an optimal GO content (0.09%) and the successful demonstration that a layered configuration of GO-concrete within beams functions as an excellent flexural sensor, providing precise electrical signal feedback for deformation and damage. Experimental results indicate that at this optimal content, the compressive strength and electrical conductivity were significantly enhanced, with a 17.67% increase in strength and a 32.28% decrease in initial electrical resistivity. Microstructural analysis revealed that this improvement stemmed from more complete cement hydration and reduced porosity. At the structural level, while GO had a negligible impact on the flexural load-bearing capacity of beams, it substantially improved the electrical resistivity’s responsiveness to applied load and deflection. The beam with a layered GO configuration exhibited the highest signal correlation. Furthermore, finite element simulations agreed well with experimental findings, revealing that the resistance change is intrinsically linked to crack propagation, which alters the length and cross-sectional area of the current path. This confirms the reliability of this material for structural monitoring applications.

1. Introduction

Graphene Oxide-Modified Concrete for Structural Health Monitoring: Sensing Performance, Mechanisms, and Application Potential Structural Health Monitoring (SHM) is crucial for ensuring the safety of concrete structures. Compared with traditional embedded sensors, smart concrete with self-sensing capabilities provides a novel approach for distributed monitoring [1]. Among various functional fillers, graphene oxide (GO) exhibits enormous potential in regulating the electrical conductivity of cement-based composites, owing to its unique two-dimensional structure, high specific surface area, and abundant surface functional groups [2,3].
The fundamental difference between GO and materials such as graphene and carbon nanotubes lies in their surface chemical properties and conductive mechanisms. The oxygen-containing functional groups on the GO surface endow it with excellent hydrophilicity, resulting in far superior dispersibility in the cement matrix compared to hydrophobic carbon materials. This lays the foundation for constructing stable conductive networks [4,5]. Although GO itself is insulating, it can be partially reduced in the alkaline environment of cement hydration to restore electrical conductivity. Meanwhile, its lamellar structure can guide the ordered growth of hydration products, refine pore sizes, and optimize electron transport pathways [6,7]. Studies have confirmed that GO/recycled aggregate concrete can significantly improve the interfacial transition zone, synchronously enhancing mechanical properties and piezoresistive signal stability [8].
In terms of mechanical properties, the reinforcing effect of GO has been widely verified, yet its optimal dosage remains controversial. Studies have shown that a 0.05% dosage yields the most significant improvement in mechanical properties [9,10,11], while a 0.06% dosage performs better in recycled concrete systems [12,13]. This discrepancy may be related to the inherent characteristics of GO and the complexity of the system [14]. Microscopic studies have confirmed that GO can promote the dense distribution of hydration products and form a barrier against crack propagation, thereby reinforcing the matrix [15,16].
Compared with traditional carbon materials, GO’s advantage lies in its efficient synergistic effects at low dosages. The percolation threshold of graphene nanoplatelet systems is as high as 7.5% [17], and excessive addition tends to cause irreversible changes in resistivity [18]. In contrast, the composite of GO and carbon nanotubes can significantly reduce the percolation threshold and improve strain sensitivity and signal stability [19,20]. Recent studies have shown that the composite of GO and nano-silica can synergistically enhance the early mechanical strength and electrical conductivity of materials through dual nano-effects [21].
Based on the aforementioned characteristics, GO-modified concrete exhibits superior smart performance in structural monitoring. Its resistivity shows a good correlation with stress under cyclic loading [22], and it demonstrates a stable and repeatable piezoresistive effect [23]. Notably, the GO/ECC (Engineered Cementitious Composites) composite maintains stable electrical conductivity even under high tensile strain, enabling accurate sensing of the tensile damage process [24]. At the application level, graphene-based conductive film and coating technologies have shown promising prospects in damage localization and crack visualization monitoring [25,26], fully reflecting the wide application value of GO in smart structures.
Against the backdrop of (SHM) for concrete structures, this study aims to prepare highly smart conductive concrete by incorporating GO into cement-based materials. The internal resistance of the concrete is measured via the electrode method to infer its stress state and health condition, enabling real-time and accurate monitoring of concrete deformation and damage. This work provides theoretical support for practical engineering applications and holds significant implications for SHM of large-scale building structures or locally critical components. A multi-scale SHM method based on GO-modified concrete is proposed: (1) Fabricate GO-doped conductive concrete, test the compressive and electrical properties of specimens with different GO dosages, observe the microstructure, and determine the optimal GO dosage; (2) Produce three types of concrete beams using the optimal dosage (GO-concrete specimen embedded beams, GO-modified layered beams, and ordinary concrete control beams), conduct segmental resistance testing of the flexural/shear zones, analyze the correlation between resistance and deflection, and explore its SHM application; (3) Perform finite element simulation using COMSOL software (COMSOL Multiphysics® Version 6.3 Trial Version), validate simulation reliability by inputting experimental data, simulate electric field distribution to investigate the mechanism of resistance variation, and improve the practical application of monitoring theory.

2. Experimental

To investigate the influence of GO content on the electrical conductivity of concrete, a series of concrete specimens with varying GO dosages—expressed as a percentage of cement weight—were prepared. The following subsections detail the materials employed in the study, followed by a description of the corresponding testing procedures.

2.1. Raw Materials

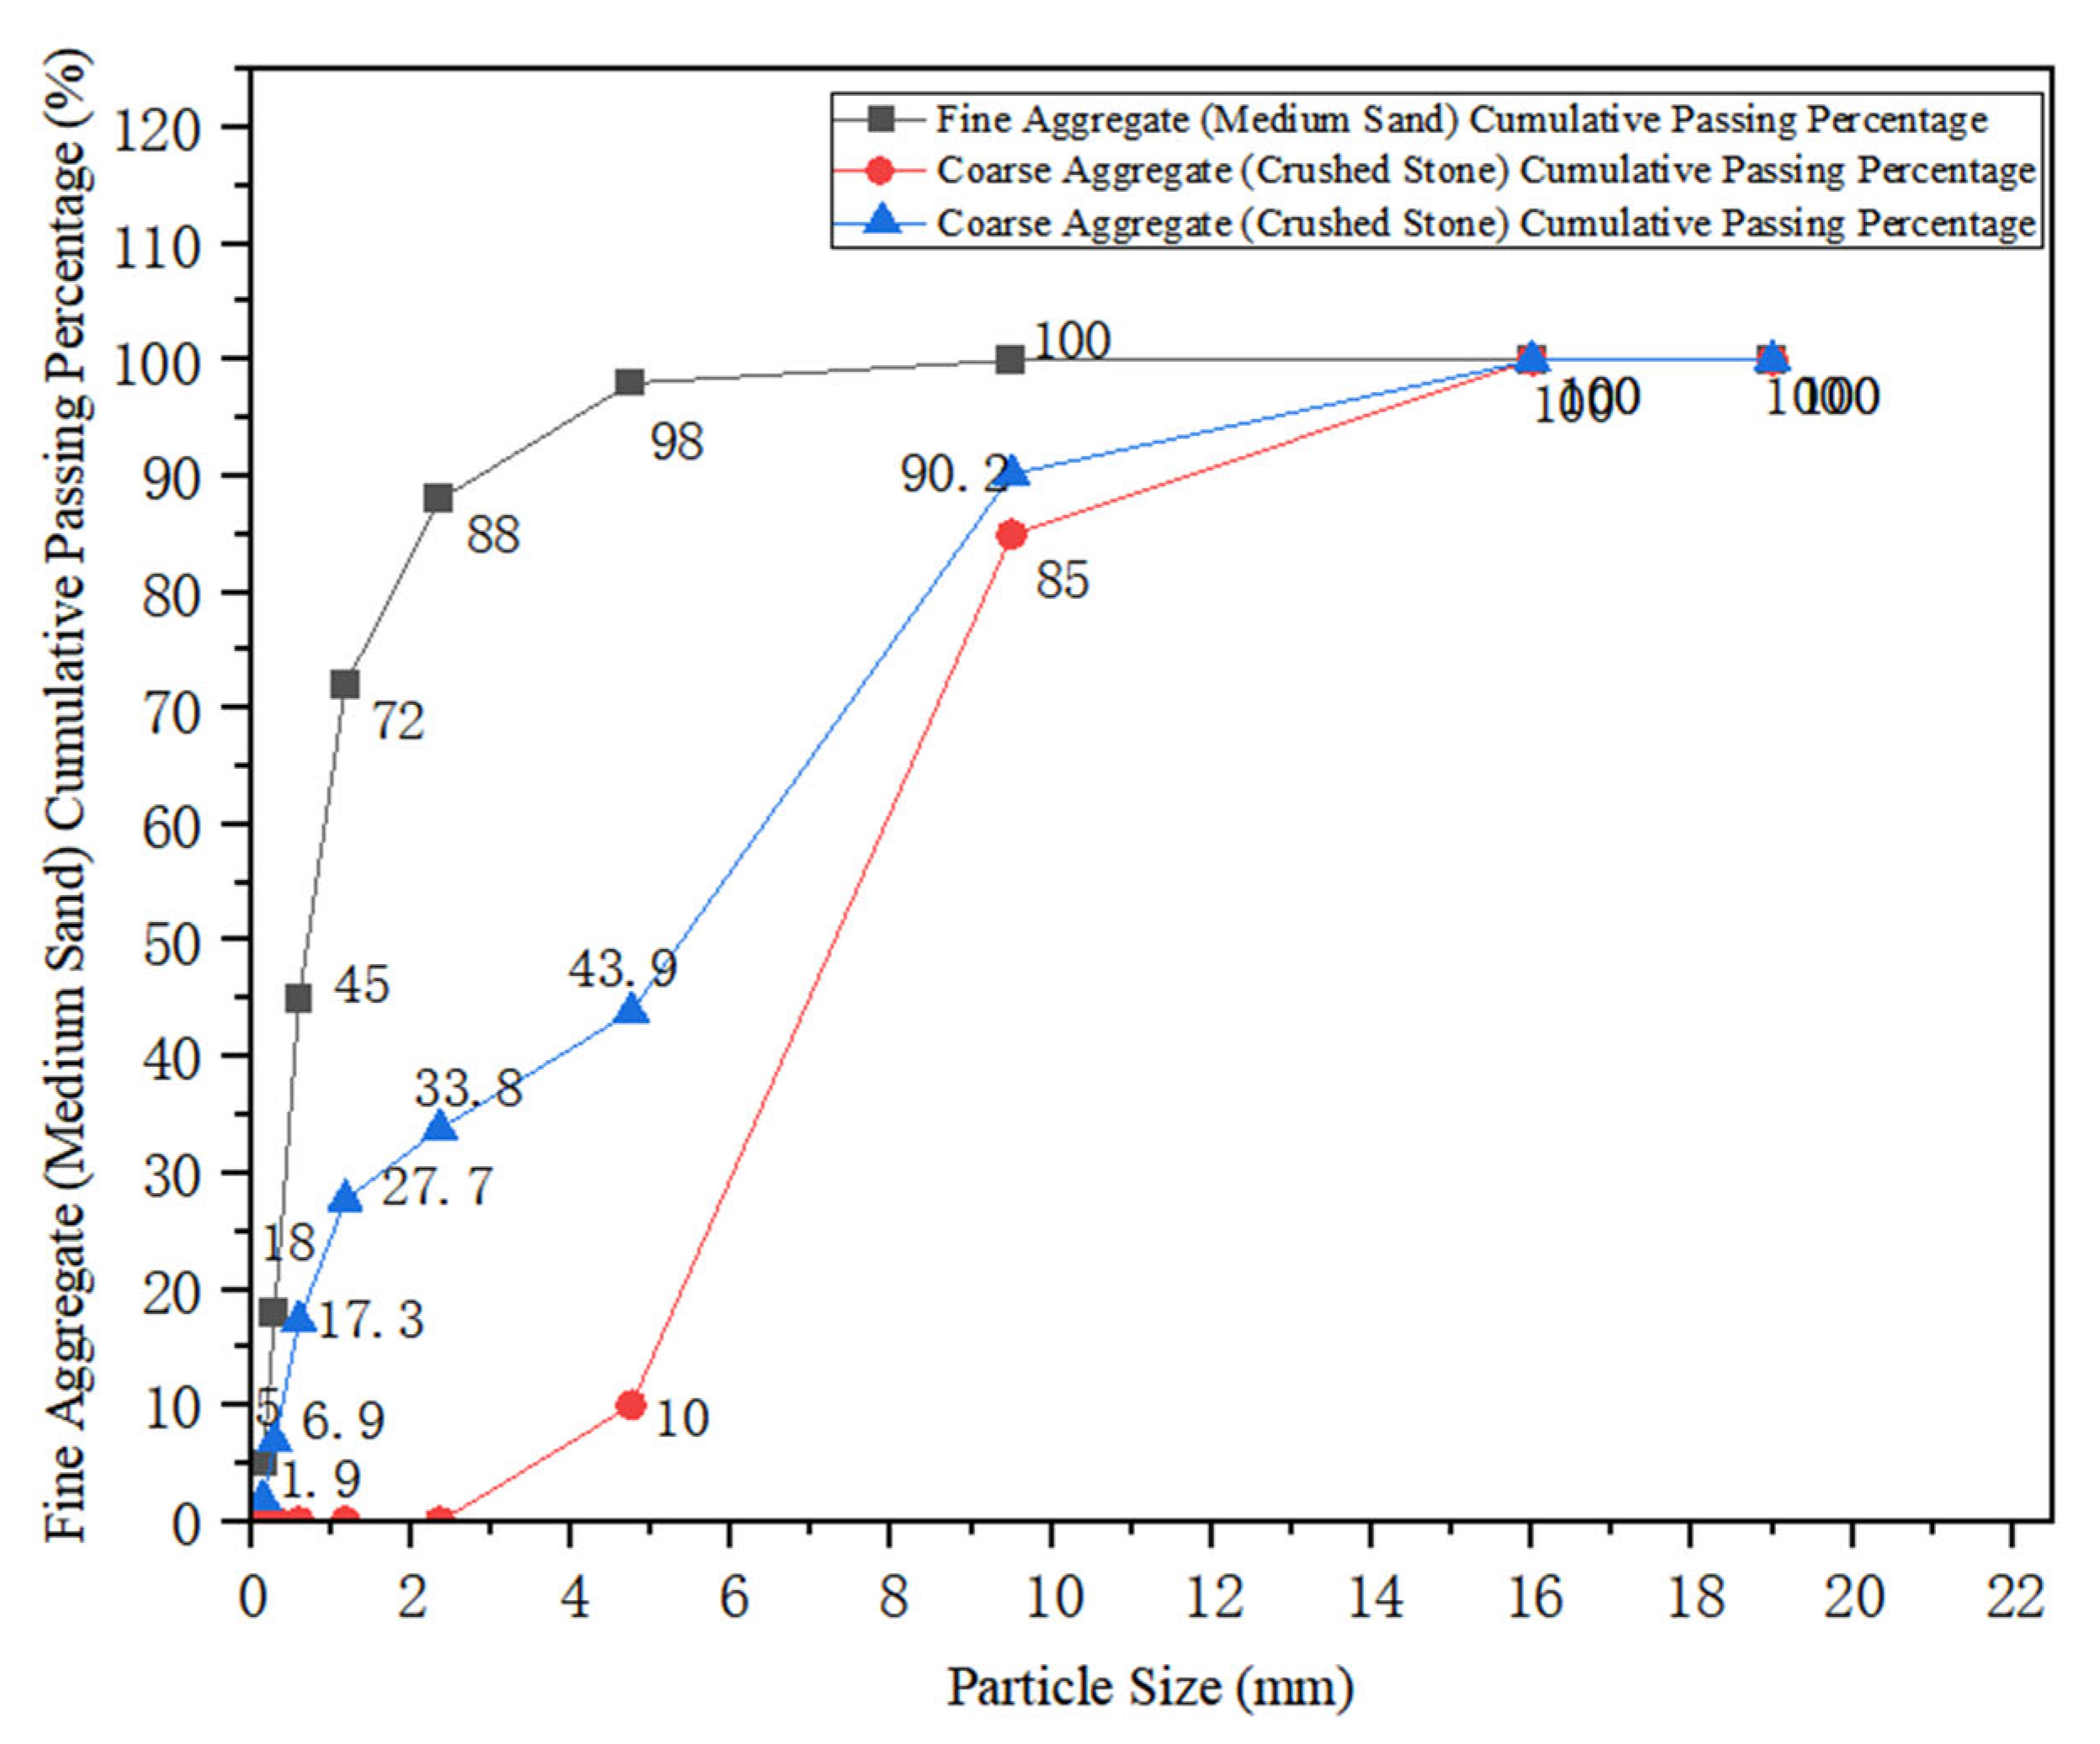
Ordinary Portland cement (P.O. 42.5 grade), produced by the Changchun Yatai Cement Plant (China), was used in this study. The chemical composition of the cement comprises 5.1% tricalcium aluminate, 16.8% tetracalcium aluminoferrite, 22.1% dicalcium silicate, 55.7% tricalcium silicate, 0.3% free calcium oxide, and 10% loss on ignition (LOI). The fineness indexes of the cement are as follows: the 45 μm sieve residue shall be within the range of 5–10%, and the specific surface area is approximately 310–340 m2/kg. Its physical and mechanical properties are presented in Table 1. The fine aggregate used was Zone II medium sand, characterized by a mean particle size of 0.35–0.5 mm, a fineness modulus of 2.4–3.0, an apparent density of 2650 kg/m3, a bulk density of 1468 kg/m3, and a clay content of 1.2%. The coarse aggregate consisted of crushed stone with particle sizes between 5 and 15 mm. The aggregate gradation curve is as shown in Figure 1.
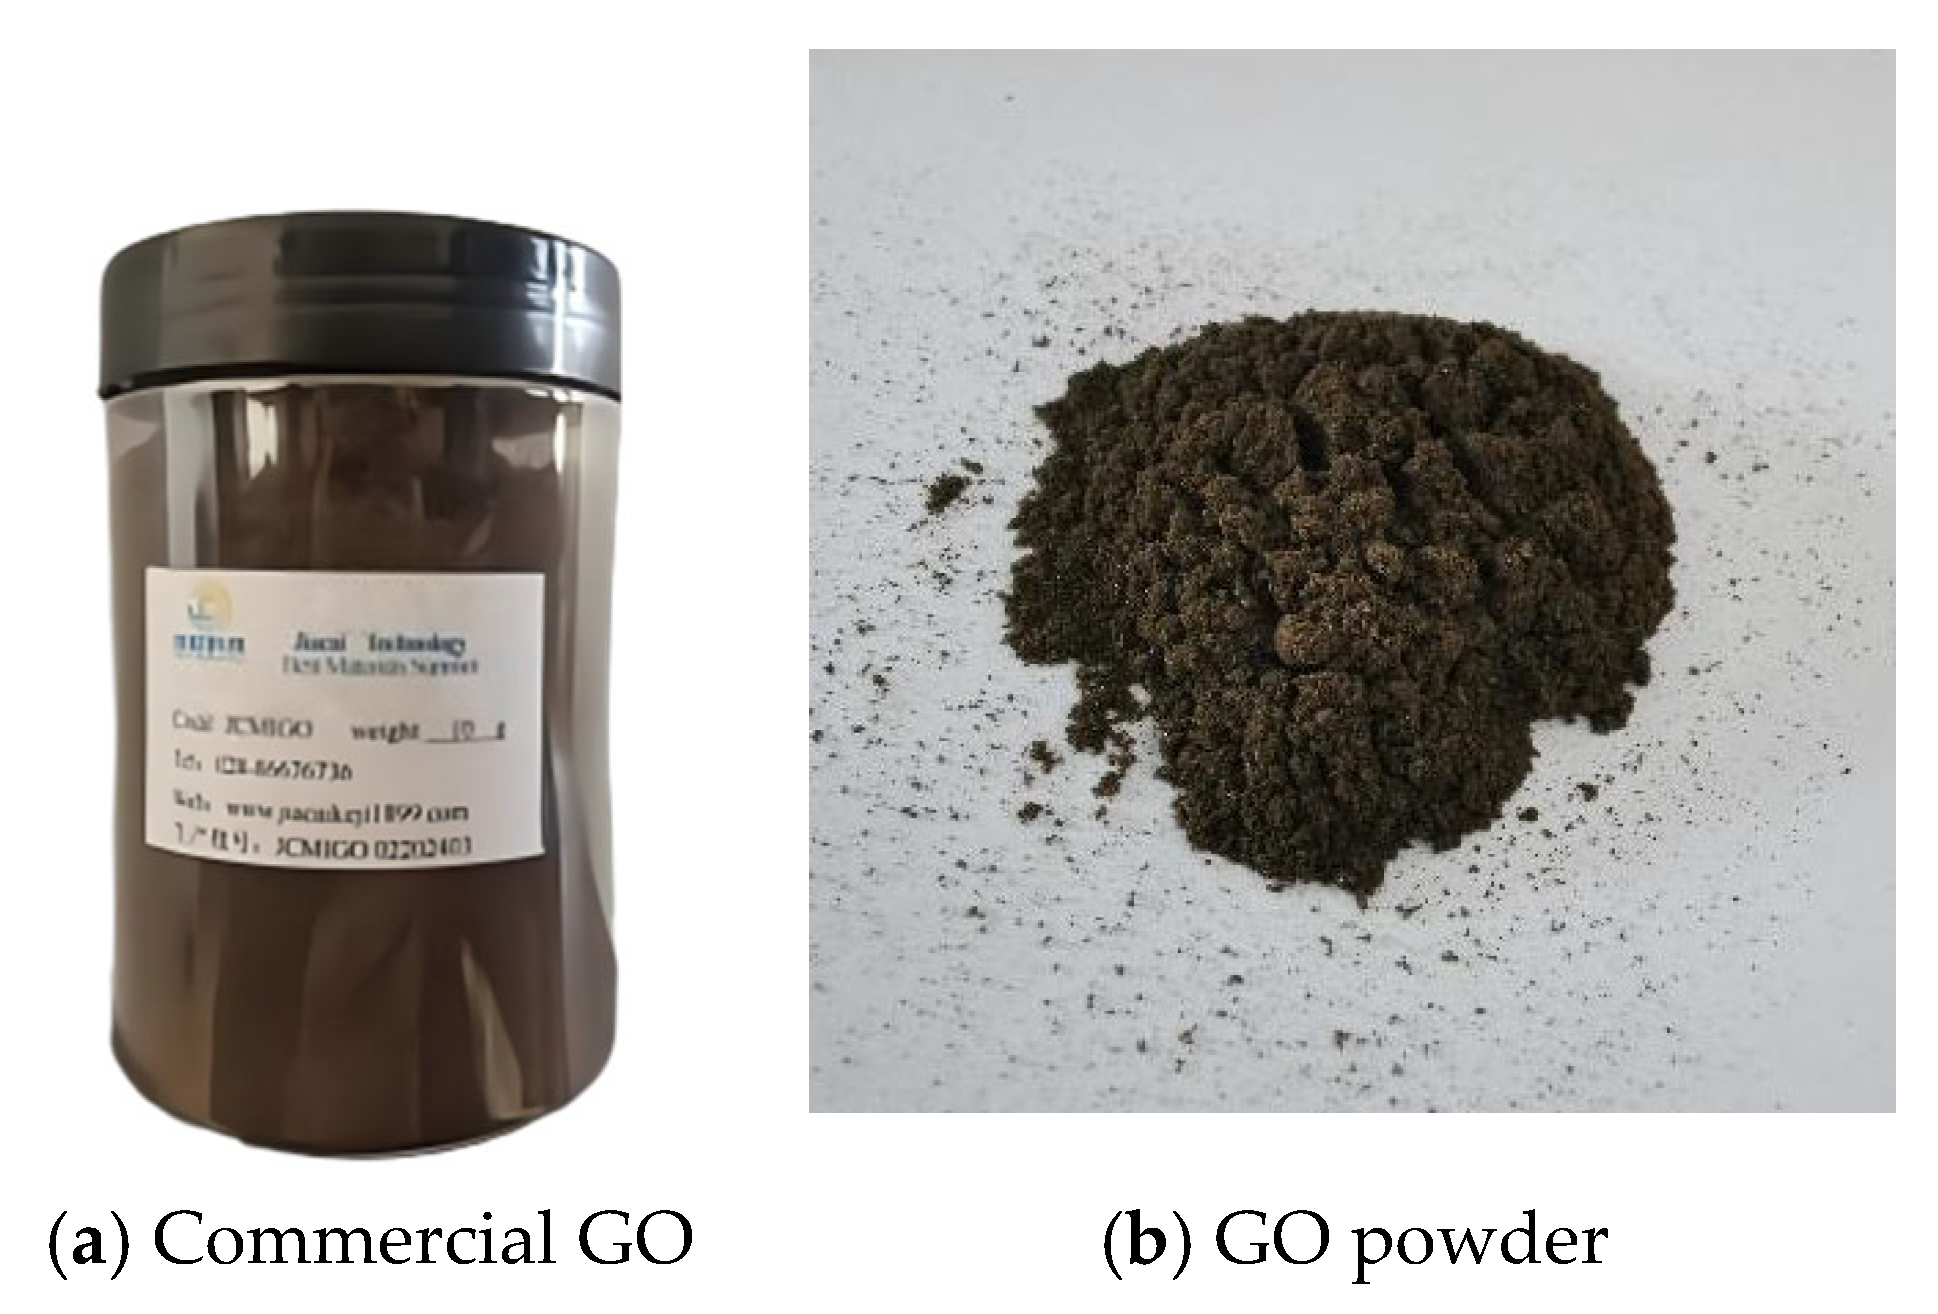
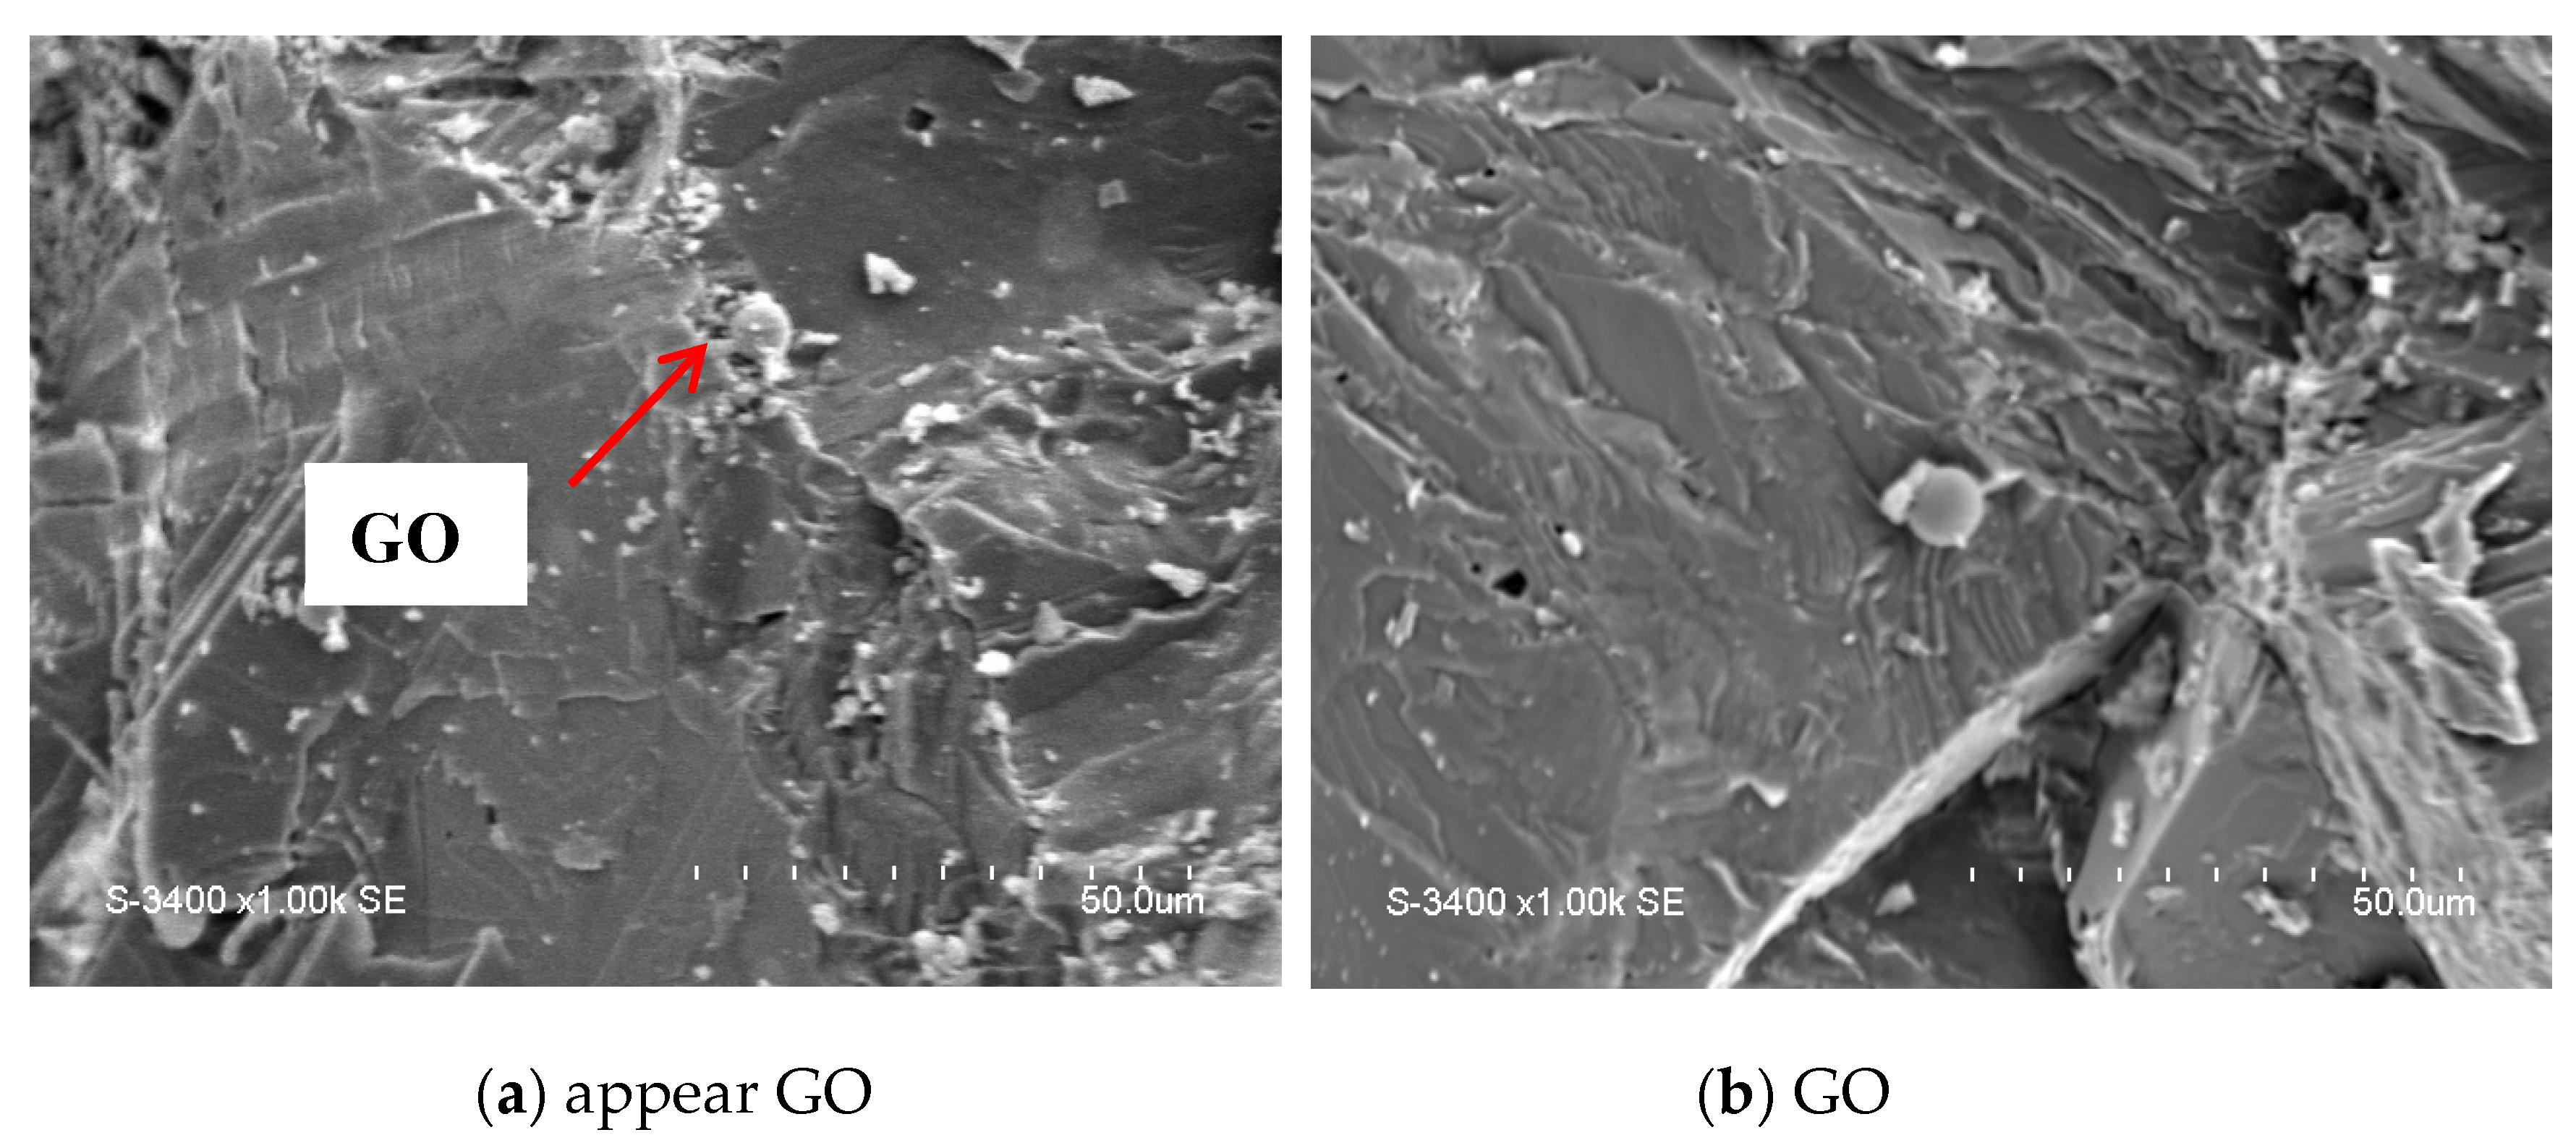
Multilayer GO powder, supplied by Jiacai Technology Co., Ltd. in Chengdu, China, was used in the mix. As shown in Figure 2, the GO powder contains carbon (C), oxygen (O), and hydrogen (H) elements with a purity level exceeding 95%. It consists of fewer than 10 layers and has a particle size smaller than 5 μm.
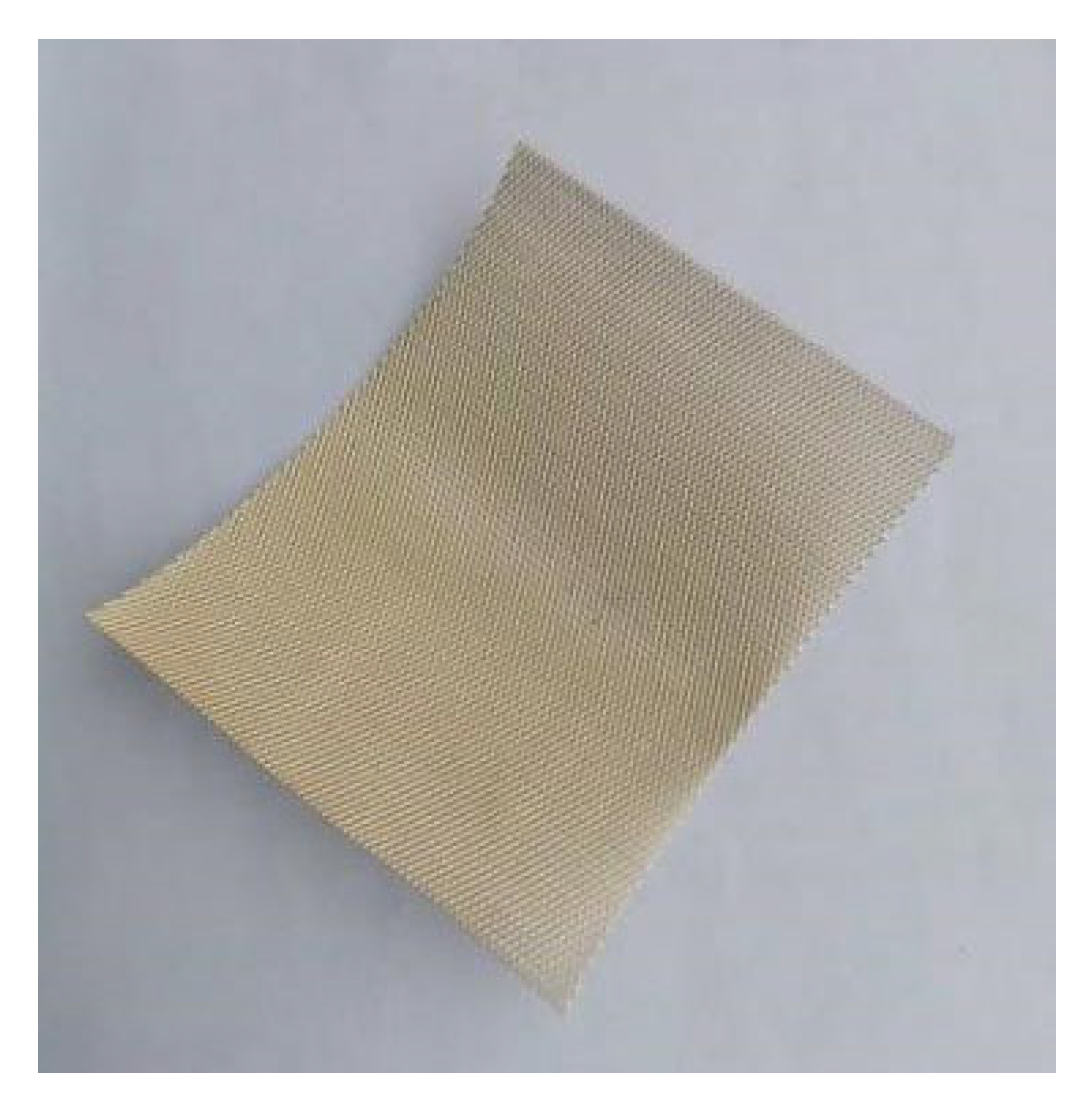
Copper mesh electrodes were obtained from Zhongcheng Copper Material Sales Co., Ltd. in Wuhu, China. These were fabricated from brass sheets and stamped into a fine diamond pattern. To optimize current capture during conductivity testing—and thus improve measurement accuracy—a small-mesh brass diamond lattice was selected. The mesh had openings of 1 mm × 2 mm and a thickness of 0.15 mm. Its mesh physical structure is shown in Figure 3, and its chemical composition is provided in Table 2.
Tap water from the laboratory of Changchun Institute of Technology was used for the mixing process. A powdered, polycarboxylate-based, high-performance water-reducing agent was incorporated to improve the workability of the concrete. The percentage of water-reducing agent relative to the cement content is approximately 0.51%.

2.2. Principal Testing Instruments

The primary instruments and equipment used in this study included the JZC-250 concrete mixer (manufactured by Zhengzhou Chenguang Construction Machinery Manufacturing Co., Ltd. The company is located in Zhengzhou, China), a 1000 mm × 1000 mm concrete vibration platform (produced by Xinxiang Gongcheng Vibration Equipment Co., Ltd. The manufacturer is located in Xinxiang, China), and the Chunlin CR-009S ultrasonic cleaner (produced by Shenzhen Chunlin Cleaning Equipment Co., Ltd. The company is located in Shenzhen, China). Other devices comprised the JD5000-2 multifunction electronic balance (manufactured by Shenyang Longteng Precision Instrument Co., Ltd. The manufacturer is located in Shenyang, China), a JH-S waterproof stainless steel electronic scale, and the JH-800S waterproof stainless steel bench scale. For mechanical testing, a D005B-200T microcomputer-controlled electro-hydraulic servo universal testing machine and the Donghua DH3821 static stress–strain testing system (Donghua Testing Co., Ltd. The manufacturer is located in Guangdong, China) were employed. Specimens were cast using 150 × 150 × 300 plastic molds. The power supply equipment comprised UTP1605S and SG1732SL3A regulated DC power supplies.

2.3. Mix Design and Compressive Strength Testing

To investigate the influence of GO content on the electrical conductivity of concrete, and building upon previous studies [13,20,27] addressing the conductive properties of GO-enhanced concrete, 0.02% is the effective minimum concentration to ensure the reinforcing effect, which can verify the performance baseline at low dosage. The gradient design of 0.02% → 0.06% → 0.09% enables systematic exploration of the dosage-effect relationship between GO content and concrete strength, facilitating efficient localization of the optimal concentration range. Meanwhile, 0.09% serves as a reasonable upper limit balancing reinforcing effect, GO dispersion stability, and engineering application cost, avoiding particle agglomeration-induced defects and excessive cost escalation caused by high concentrations. This study prepared four groups of concrete specimens with GO dosages of 0%, 0.02%, 0.06%, and 0.09% by weight of cement. Each group consisted of three specimens, resulting in a total of 12 specimens. All specimens measured 150 mm × 150 mm × 300 mm. Table 3 presents the grouping and mix ratios, where “C” represents concrete, “GO” indicates graphene oxide, and the following number corresponds to the GO dosage as a percentage of cement weight, instead of replacing cement; for example, C-GO2 represents concrete containing 0.02% GO. Throughout the experiments, the concrete mix proportions were strictly controlled in accordance with the designated mix design. According to the Chinese national standard for Standard for Testing Methods of Concrete Physical and Mechanical Properties (GB/T 50081-2019) [28], cube compressive strength tests were performed on the specimens. The resulting compressive strengths satisfied the criteria for subsequent testing phases.

3. Mechanical and Electrical Properties of Concrete Specimens During Failure

The mechanical properties of concrete serve as a base for analyzing its structural and electrical characteristics. In this study, three groups of GO-modified concrete specimens with GO dosages of 0.02%, 0.06%, and 0.09% were compared against ordinary concrete specimens. The objective was to examine the influence of GO incorporation on compressive strength, electrical conductivity, secant modulus, and ultimate stress. In addition, microstructural characteristics were studied using the scanning electron microscopy (SEM, the manufacturer of the equipment is Hitachi High-Technologies Corp, the equipment is sourced from Tokyo, Japan) technique.

3.1. Specimen Preparation

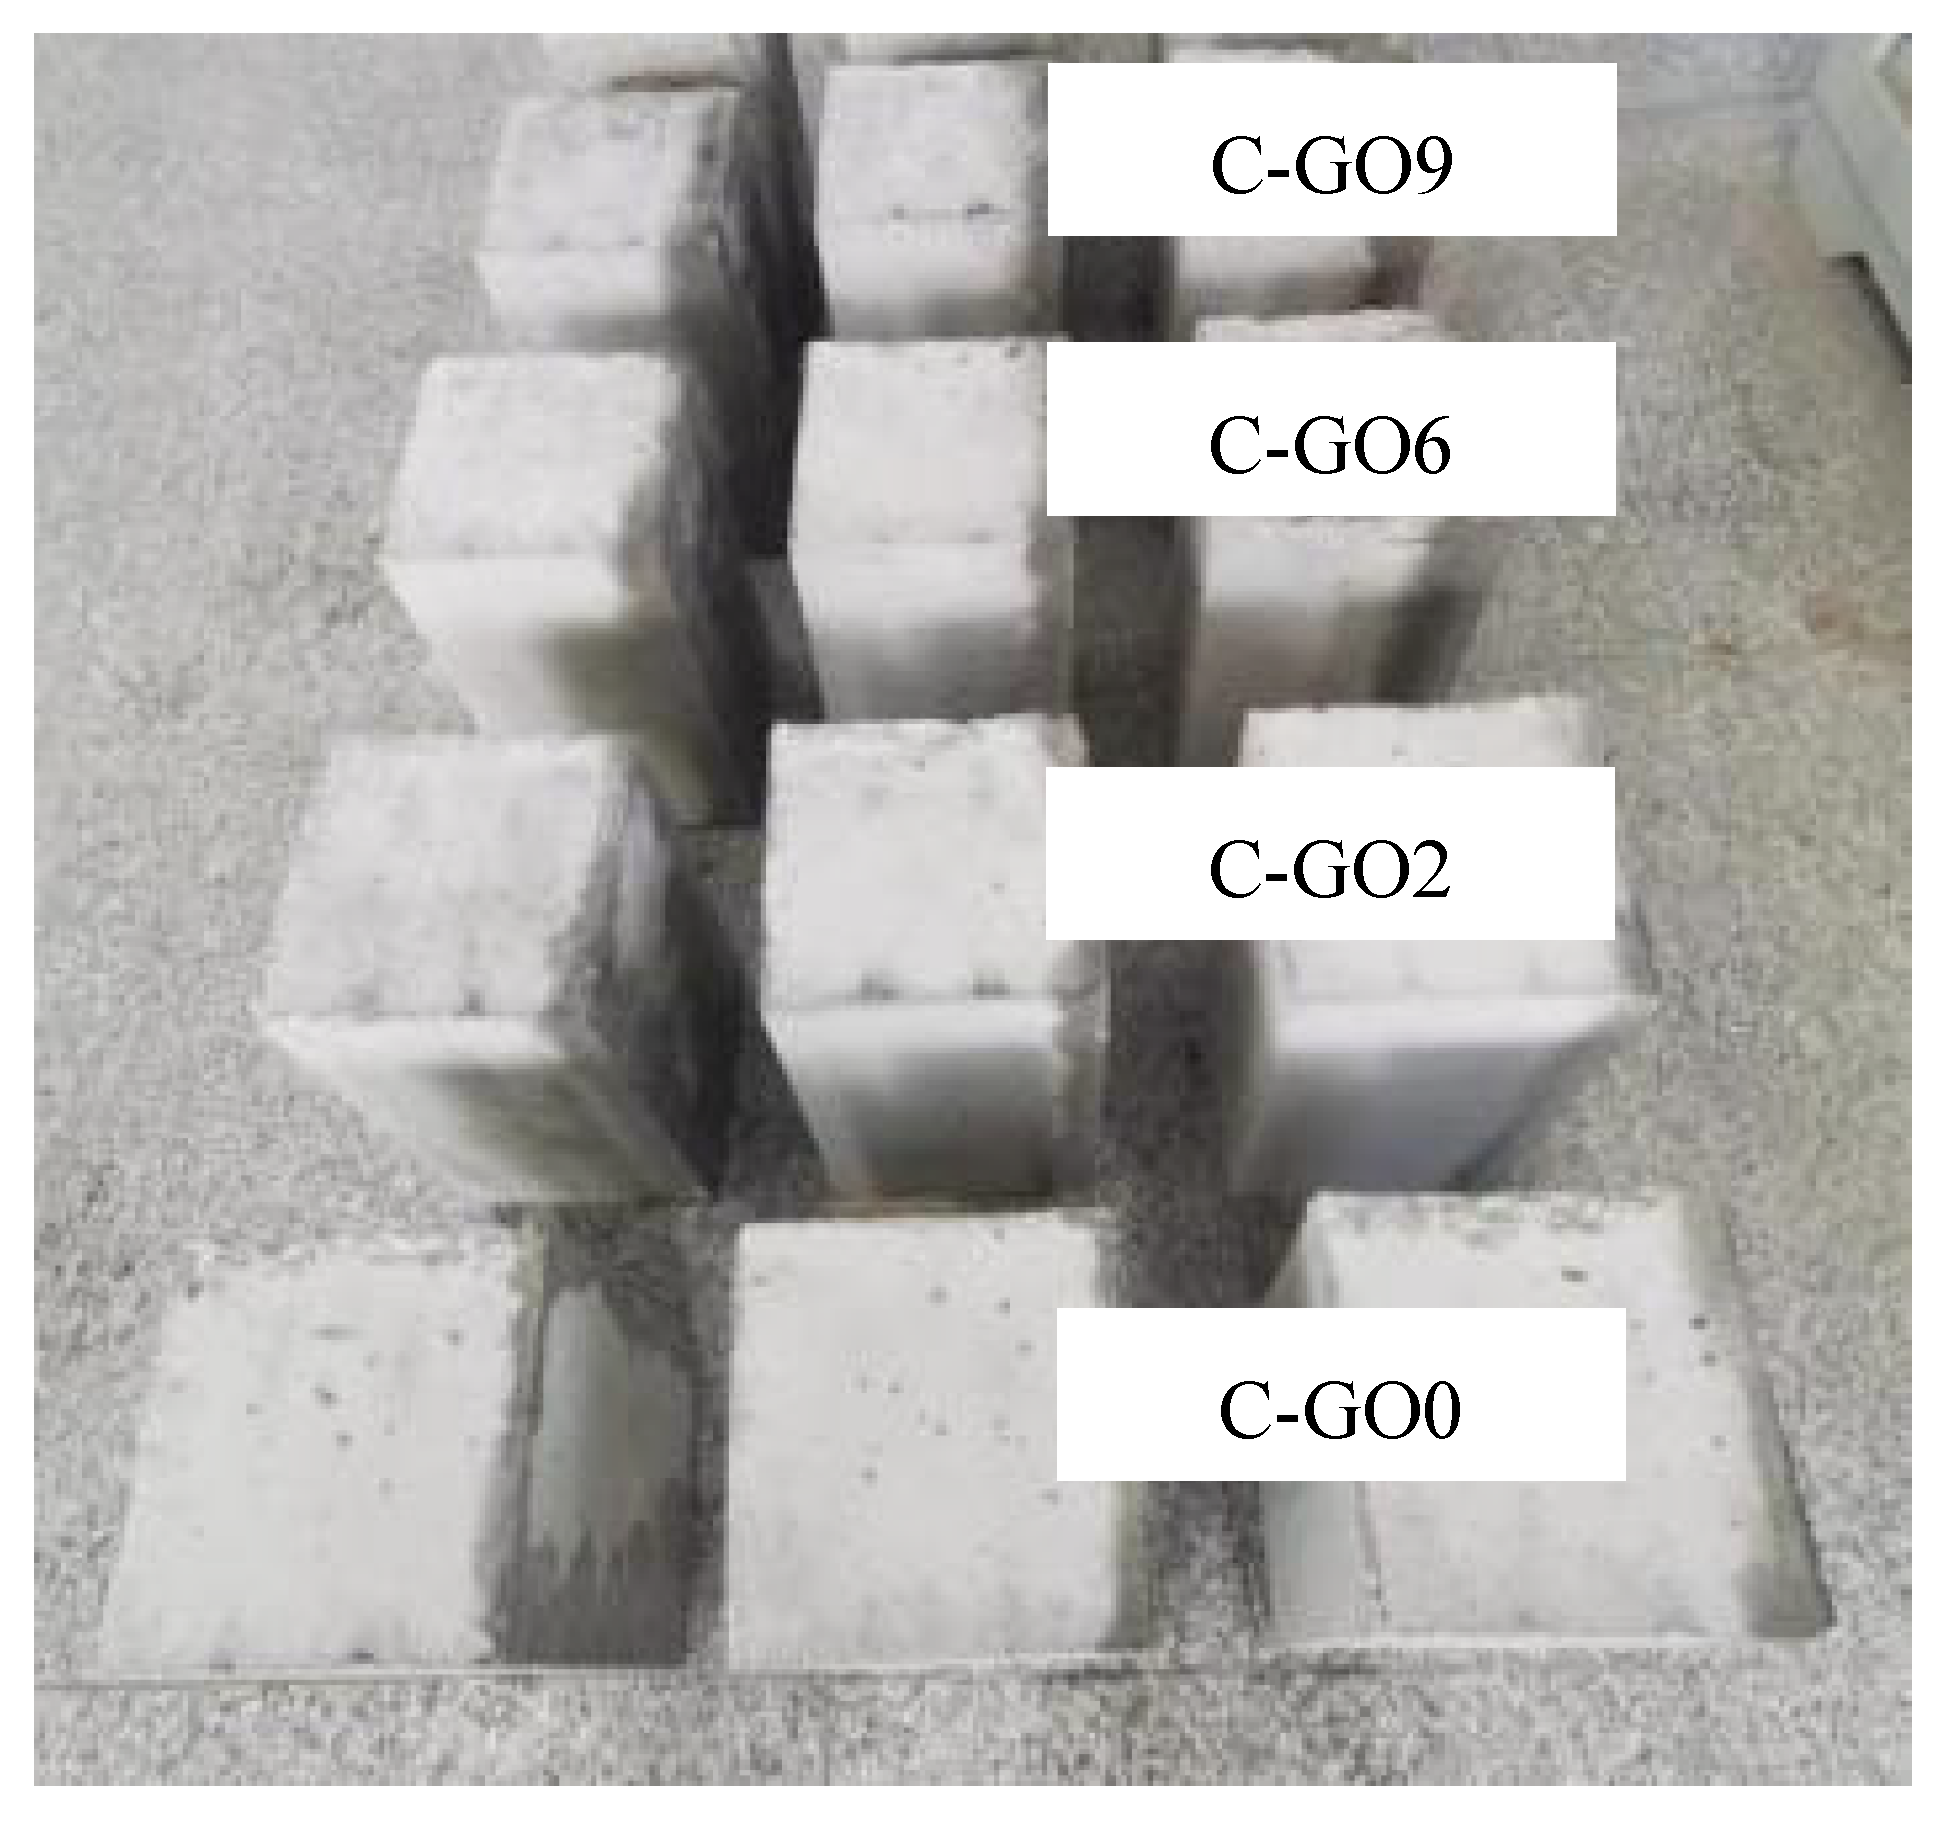
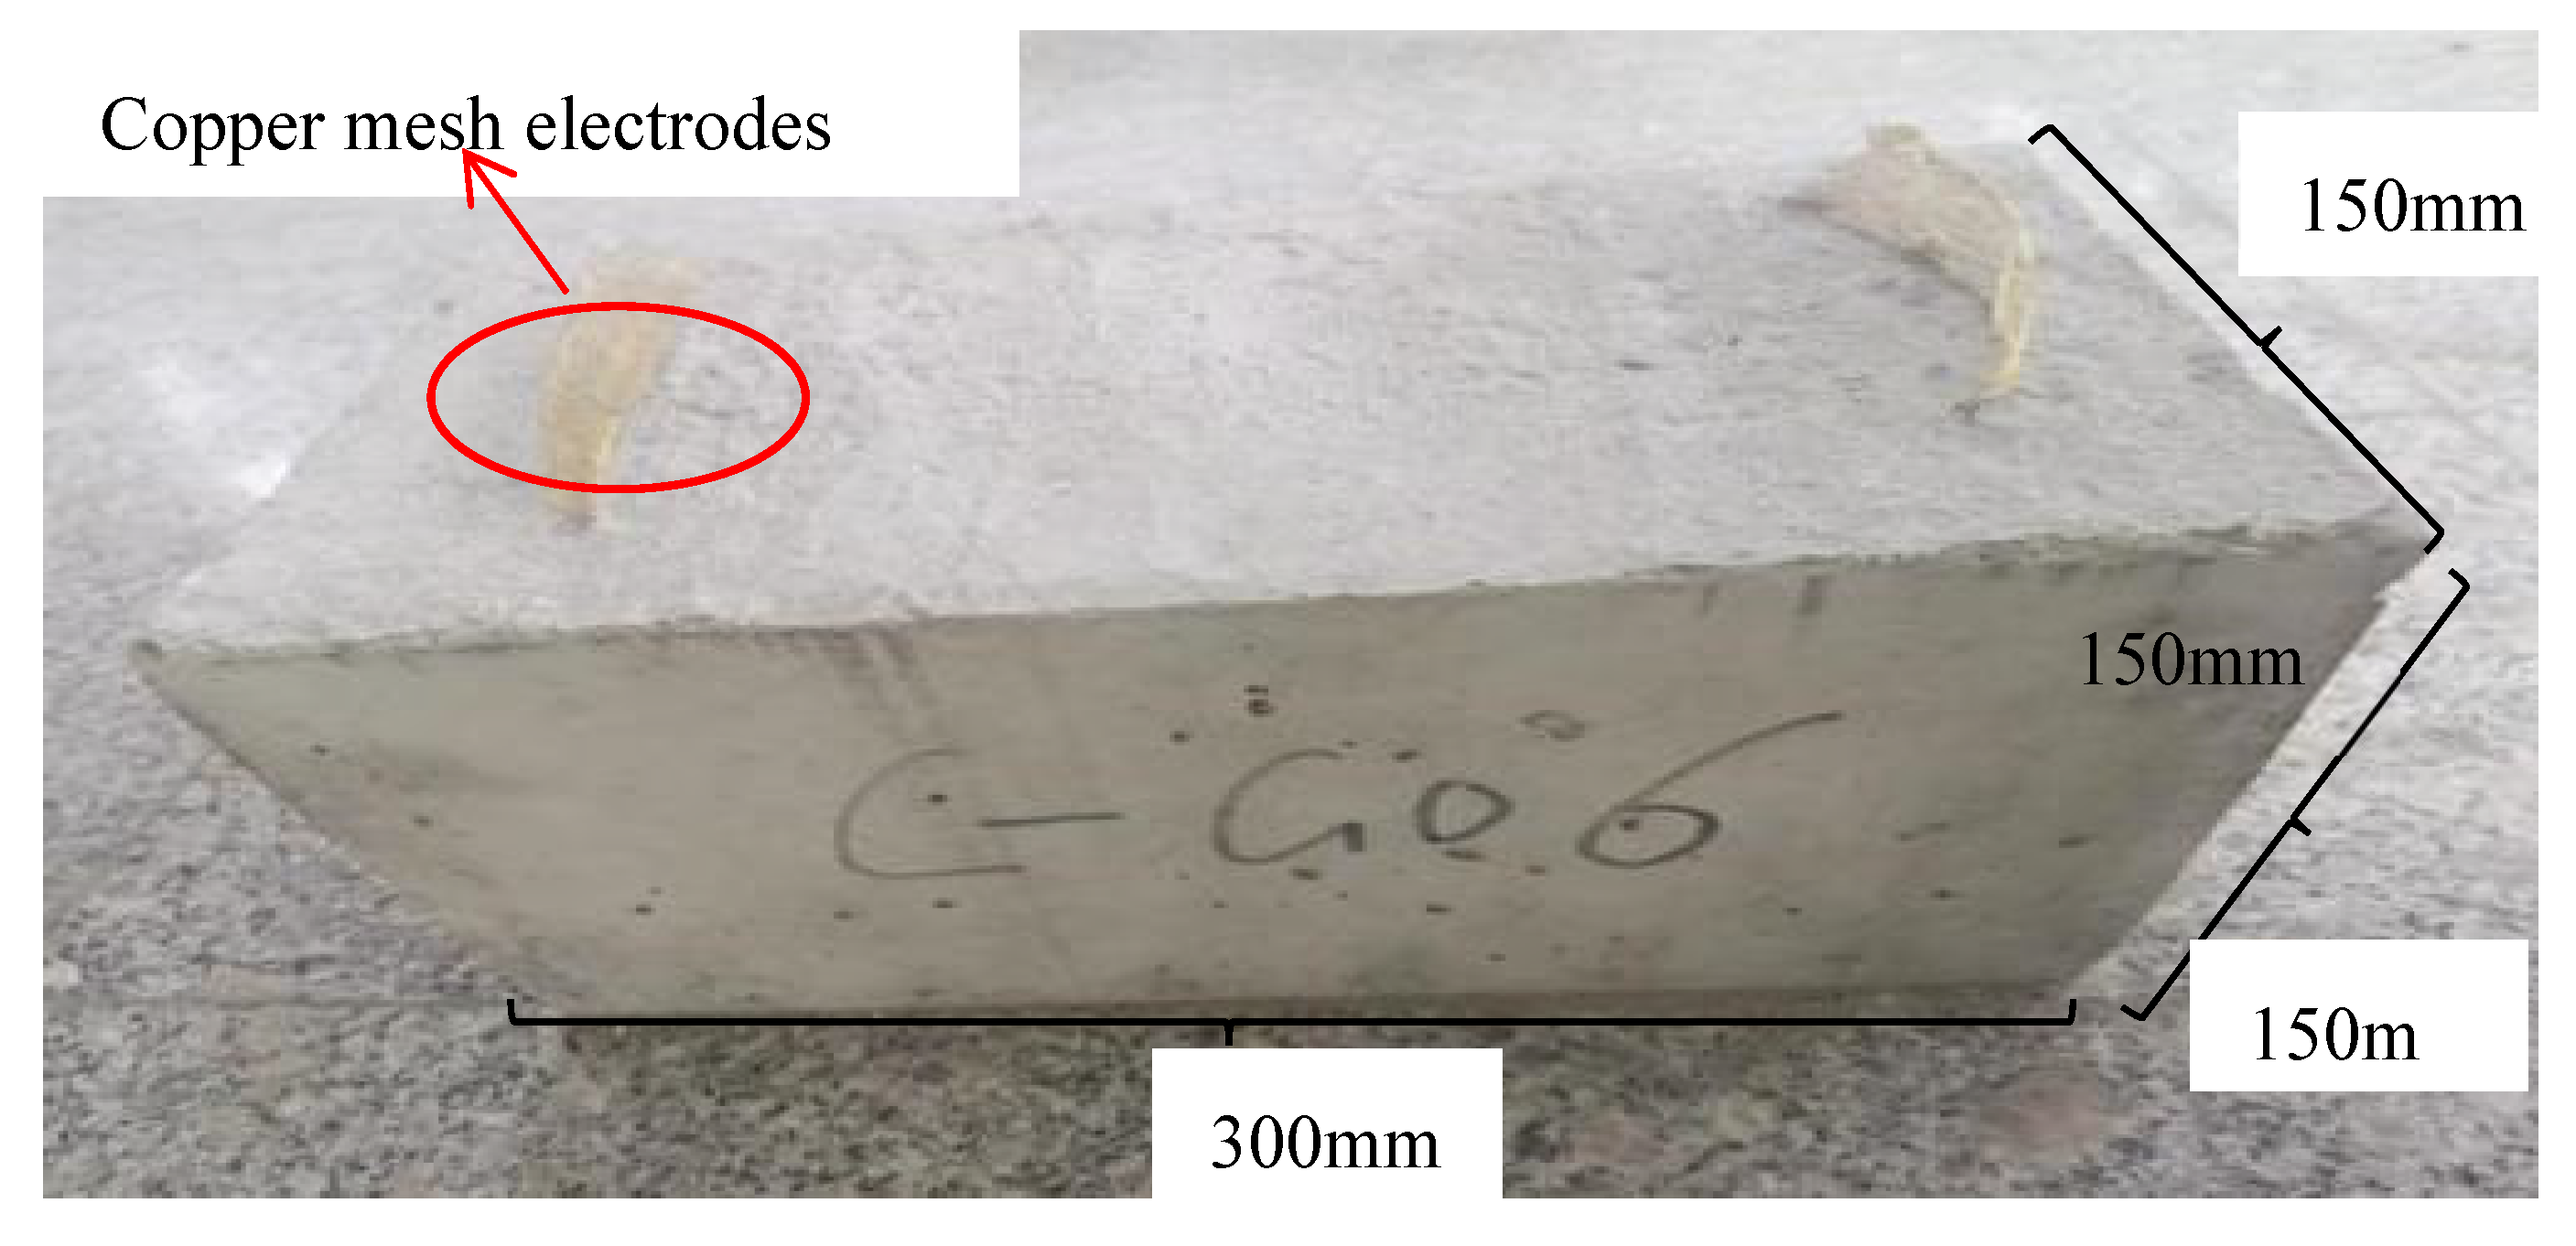
GO dispersion was performed using a Chunlin CR-009S ultrasonic cleaner: deionized water, GO powder, and a high-efficiency water reducer were accurately weighed in a preset ratio and placed in the cleaning tank. The ultrasonic parameters were set to a power of 200 W and a frequency of 40 kHz, and continuous ultrasonic dispersion was conducted for 20 min under a constant temperature of 20 °C. The cavitation effect generated by high-frequency vibration effectively broke down particle agglomeration, achieving uniform dispersion of GO. The dispersed suspension was characterized by a Zeta potential analyzer and a laser particle size analyzer. The results showed that the absolute value of the Zeta potential was ≥35 mV, and the average particle size was ≤100 nm. After 72 h of static observation, no obvious stratification or sedimentation was observed in the suspension, confirming that GO had formed a stable dispersion system. The target specimen size was 150 mm × 150 mm × 300 mm, with three specimens fabricated per group. The arrangement of the demolded specimens and copper mesh electrodes is shown in Figure 4 and Figure 5, respectively.

3.2. Mechanical and Electrical Testing of Concrete Specimens

3.2.1. Calculation Methods for Axial Compressive Strength, Resistance, Resistivity, and Piezoresistivity

Axial compressive strength was measured using a 200-ton microcomputer-controlled electro-hydraulic servo universal testing machine. Compressive strength was calculated as follows:
f cp = F A
where fcp is the axial compressive strength of the concrete specimen (MPa), F is the ultimate compressive load applied to the specimen (N), and A is the cross-sectional area of the specimen (mm2).
Specimen resistance was determined by the volt-ampere method:
R = U I
where R is the specimen resistance (Ω), U is the voltage across the specimen (V), and I is the current through the specimen (A).
Resistivity was measured using the two-electrode method. Based on the resistance obtained from Equation (2), resistivity was calculated as:
ρ = R S L
where ρ is the resistivity of the specimen (Ω·cm), R is the resistance (Ω), S is the cross-sectional area of the specimen (cm2), and L is the distance between the two electrodes (cm).
Piezoresistivity was evaluated by calculating the relative change in resistance magnitude, defined as:
Δ p = P i P 0 P 0 × 100 %
where Δp is the relative change in resistance magnitude, Pi is the resistivity during loading (Ω·cm), and P0 is the initial resistivity (Ω·cm).

3.2.2. Axial Compression Testing

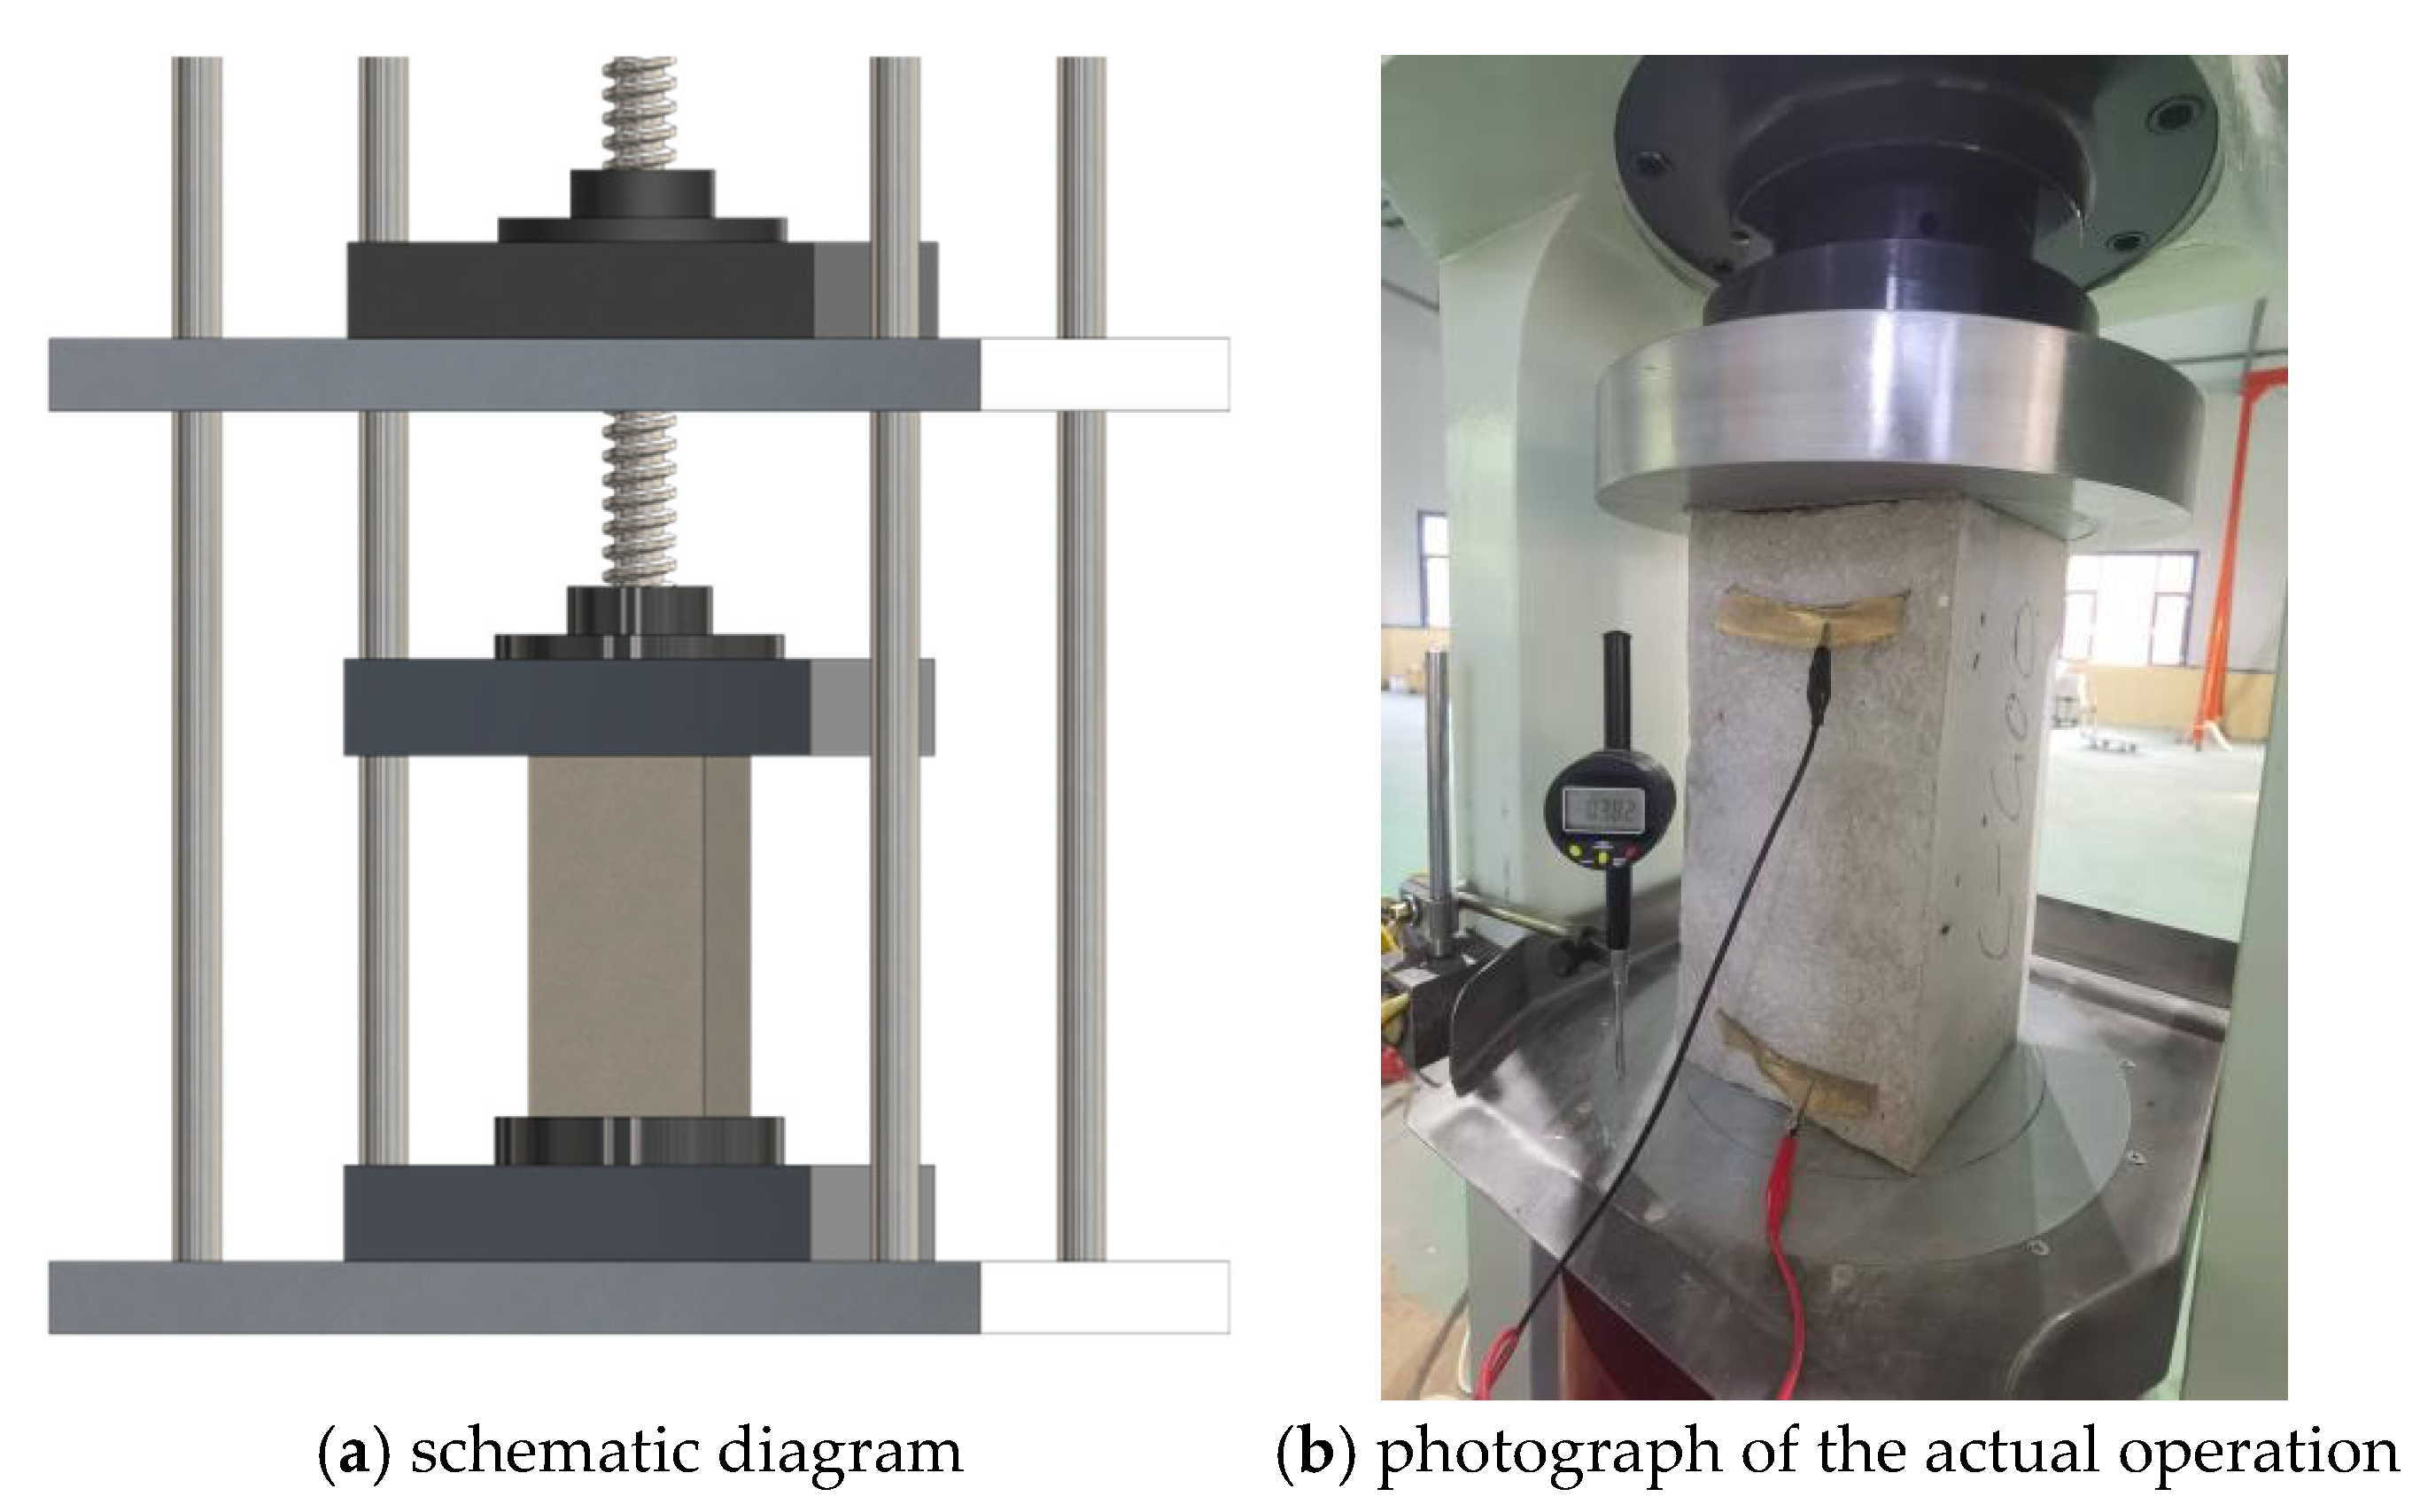
Testing commenced after the specimens underwent curing and internal moisture drying. Before testing, specimen surfaces were cleaned and precisely positioned at the center of the testing machine to ensure firm contact with the upper and lower press surfaces. A displacement meter was mounted and calibrated to zero. The alligator clips of the lead wires were connected to the specimen’s embedded copper mesh electrodes, while the other ends were connected to a regulated DC power supply. The voltage was set to 64 V and maintained for 10 min to stabilize the conductive network within the specimen. The initial resistance value was recorded before loading. The loading rate was set at 5 kN/s, with load increments of 20 kN. Current values were recorded following each load increment until specimen failure. The loading effect diagram and the testing setup are shown in Figure 6a and Figure 6b, respectively.

3.2.3. Testing Observations and Results

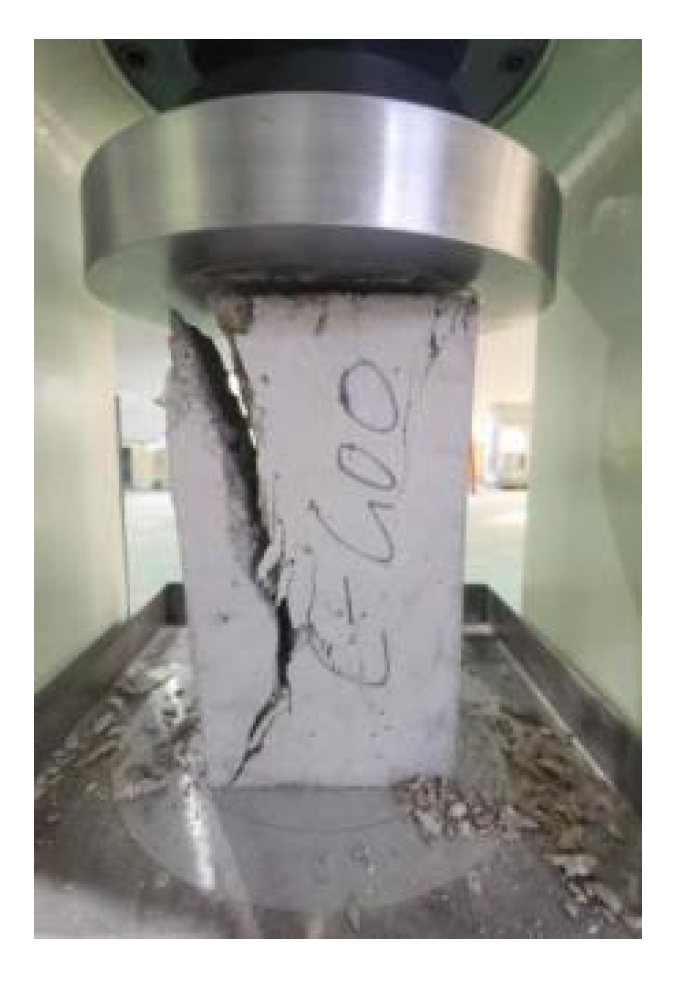
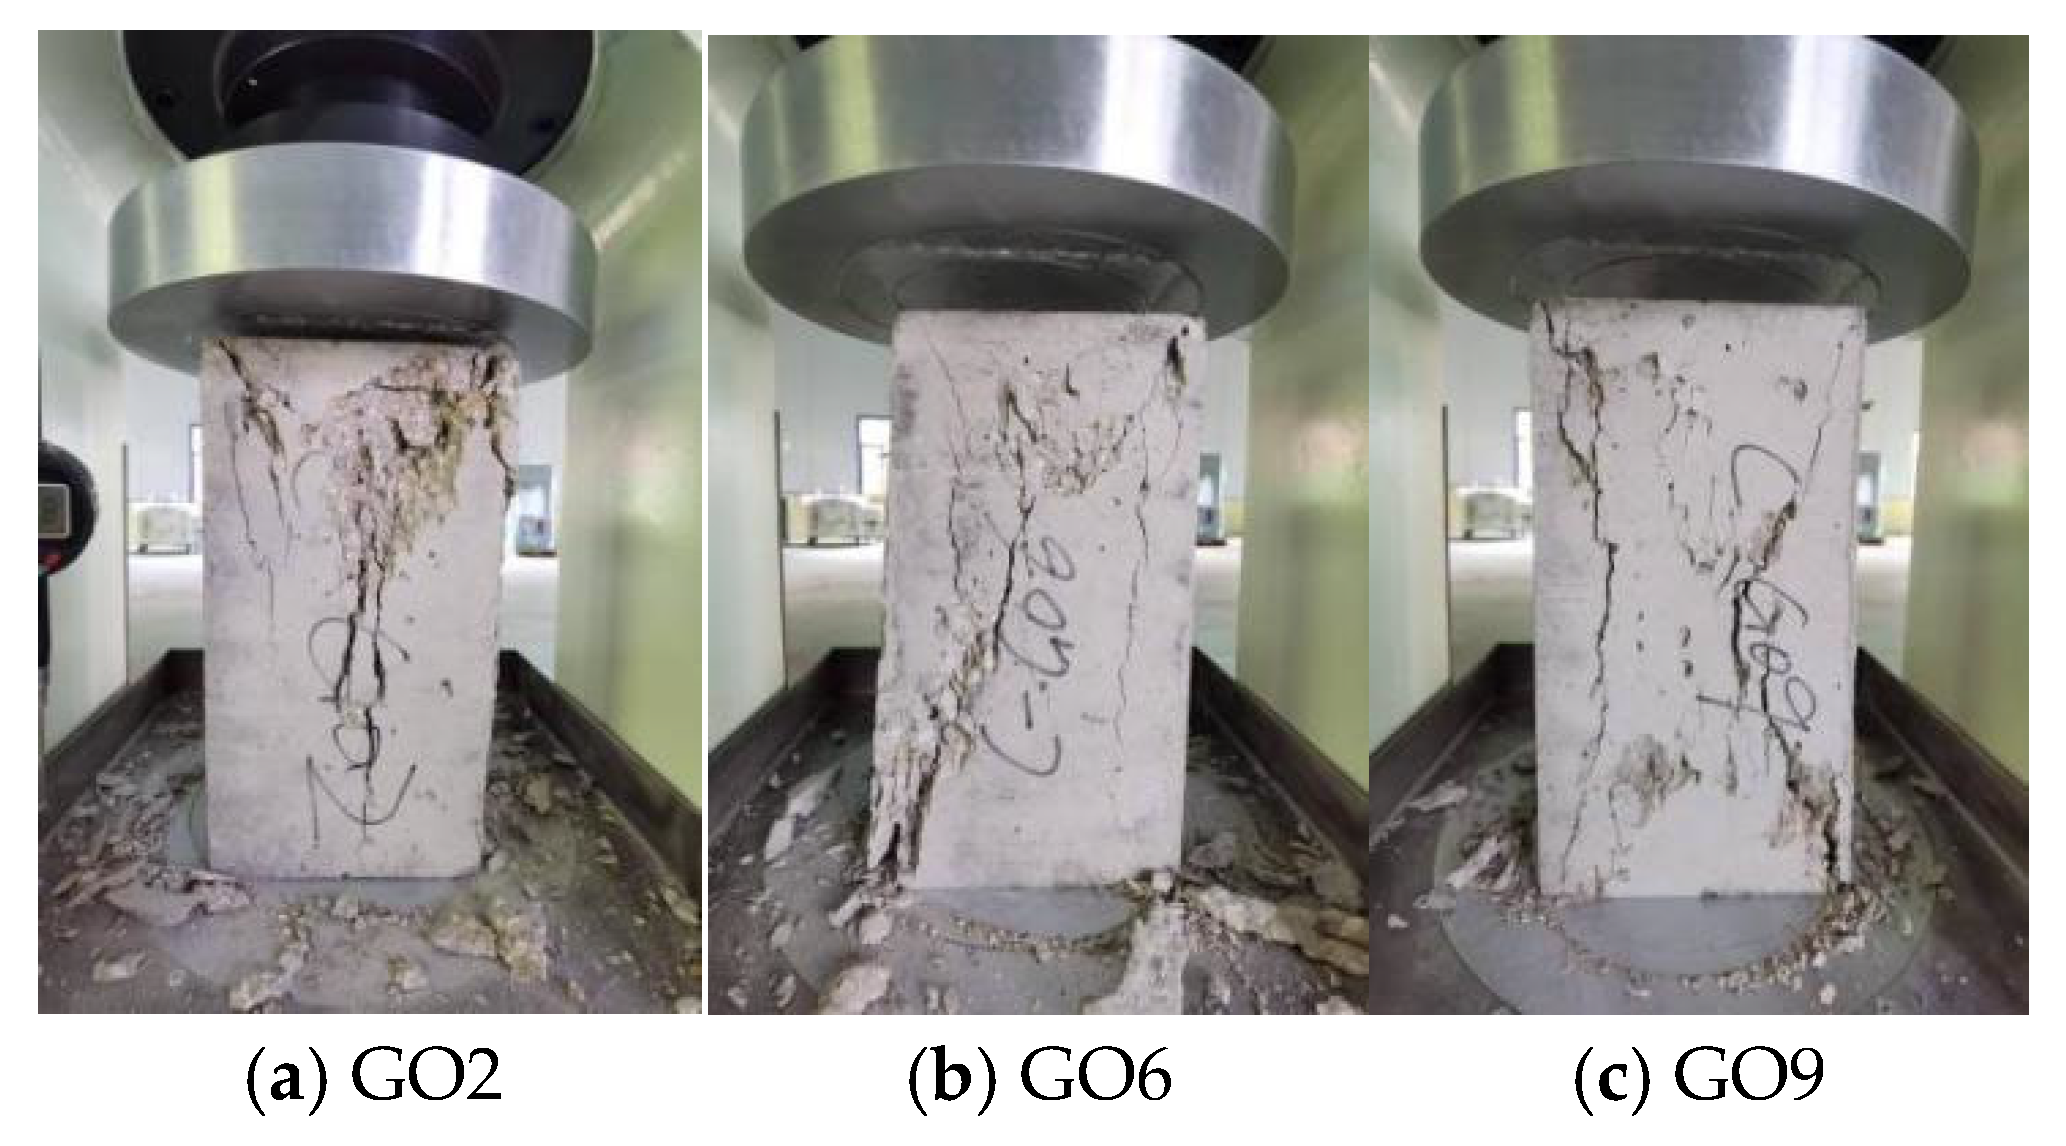
Ordinary concrete specimens developed fine cracks when subjected to 90% of their ultimate load, followed by crack propagation and spalling. Displacement meter readings increased rapidly as failure approached, leading to cone-shaped brittle failure and crushing, as shown in Figure 7. In contrast, GO-modified concrete specimens at GO dosages of 0.02%, 0.06%, and 0.09% (see Figure 8) exhibited smaller displacement meter readings, narrower cracks, reduced spalling, and improved structural integrity with greater deformation at ultimate load failure. The addition of GO enhanced compressive strength, with growth ratios and rates summarized in Table 4. As the GO dosage increased, compressive strength also increased, reaching a maximum of 35.56 MPa at 0.09% GO—a 17.67% improvement compared to ordinary concrete.
These results indicate that the incorporation of GO significantly improves the mechanical properties and failure morphology of concrete. This finding is consistent with reports in the literature on nanomaterials enhancing cement-based composites. For example, CNTs exhibit similar effects in improving the compressive strength and controlling crack propagation in concrete; however, their enhancement magnitude is generally lower than that of GO at comparable dosages, which may be attributed to GO’s larger specific surface area and surface functional groups promoting the formation of hydration products. In comparison with carbon fiber-modified concrete, GO demonstrates superior performance in controlling crack width and maintaining structural integrity at the same dosage, particularly in terms of reducing spalling and improving deformation capacity.

3.3. Experimental Results

3.3.1. Resistance and Resistivity

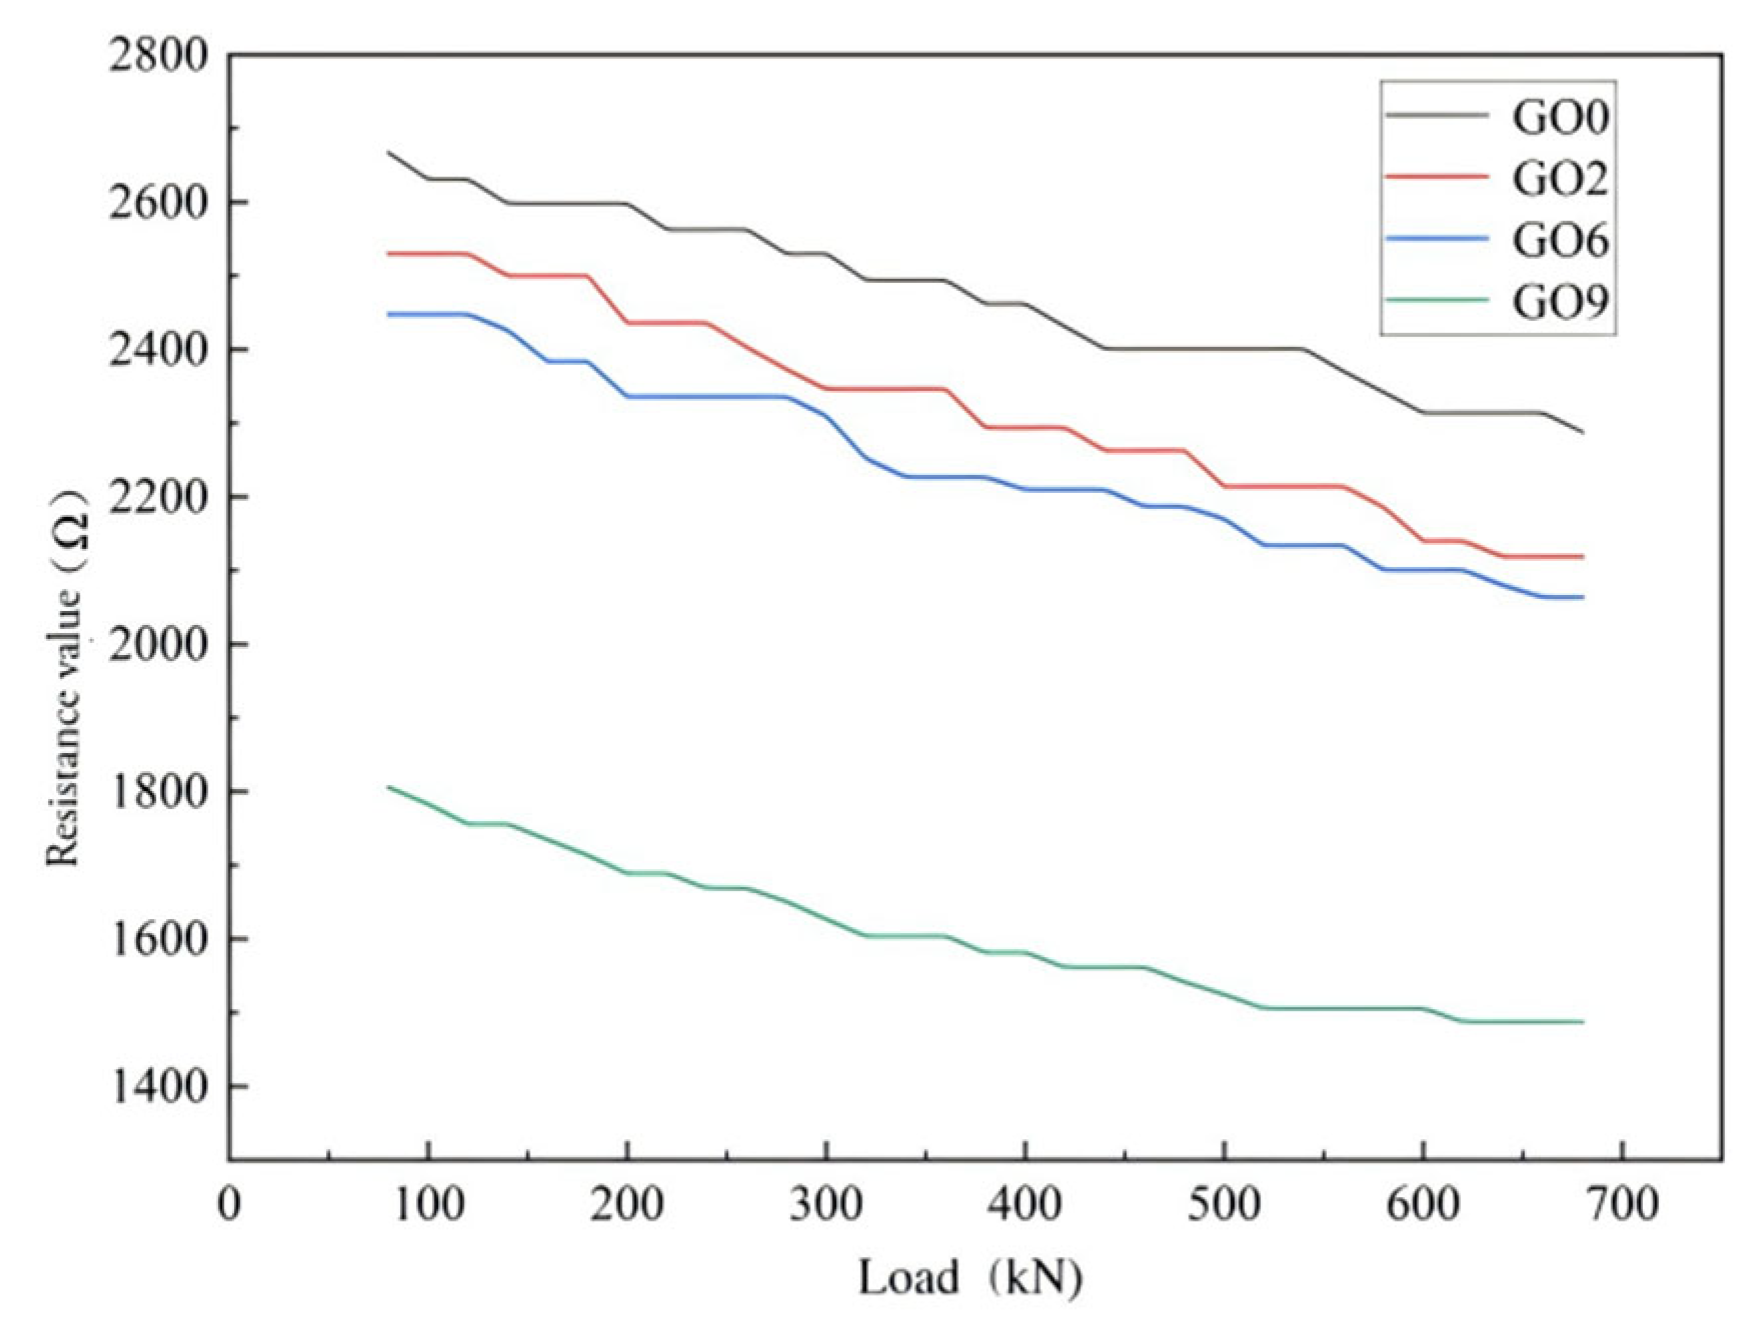
The initial resistance values of concrete specimens GO0, GO2, GO6, and GO9 were 2667 Ω, 2530 Ω, 2448 Ω, and 1806 Ω, with corresponding electrical resistivities of 30,962 Ω·cm, 25,888 Ω·cm, 25,277 Ω·cm, and 19,116 Ω·cm, respectively. Among them, the GO9 group exhibited the lowest initial resistance and electrical resistivity, which were 32.28% and 38.26% lower than those of the GO0 group. Within the loading range of 0 to 660 kN, the resistance and electrical resistivity of all specimens decreased with the increase in load, and the decreasing rates were basically consistent. When the load reached 660 kN, the GO9 group showed the maximum decreases in resistance and electrical resistivity, which were 17.61% and 17.55%, respectively. Compared with the GO0 group, the GO9 group had larger decreases in resistance and electrical resistivity, reaching 34.97% and 39.35%, respectively. The experimental results indicate that GO dosages of 0.02% and 0.06% only exhibited weak conductive effects with similar trends. In contrast, when the GO dosage was 0.09%, the conductive performance of the concrete specimens was optimal, as shown in Figure 9 and Figure 10. These results are consistent with the conductive behavior reported for carbon nanotube- or carbon fiber-modified cementitious materials. However, GO exhibits a higher resistance reduction rate at a lower dosage, likely due to its two-dimensional layered structure facilitating the formation of a continuous conductive network. Compared to carbon nanotubes (typically requiring ~0.1% dosage) and carbon fibers (often >0.5% dosage), GO demonstrates superior dosage efficiency, highlighting its potential for developing self-sensing concrete.

3.3.2. Stress–Strain Curve Analysis

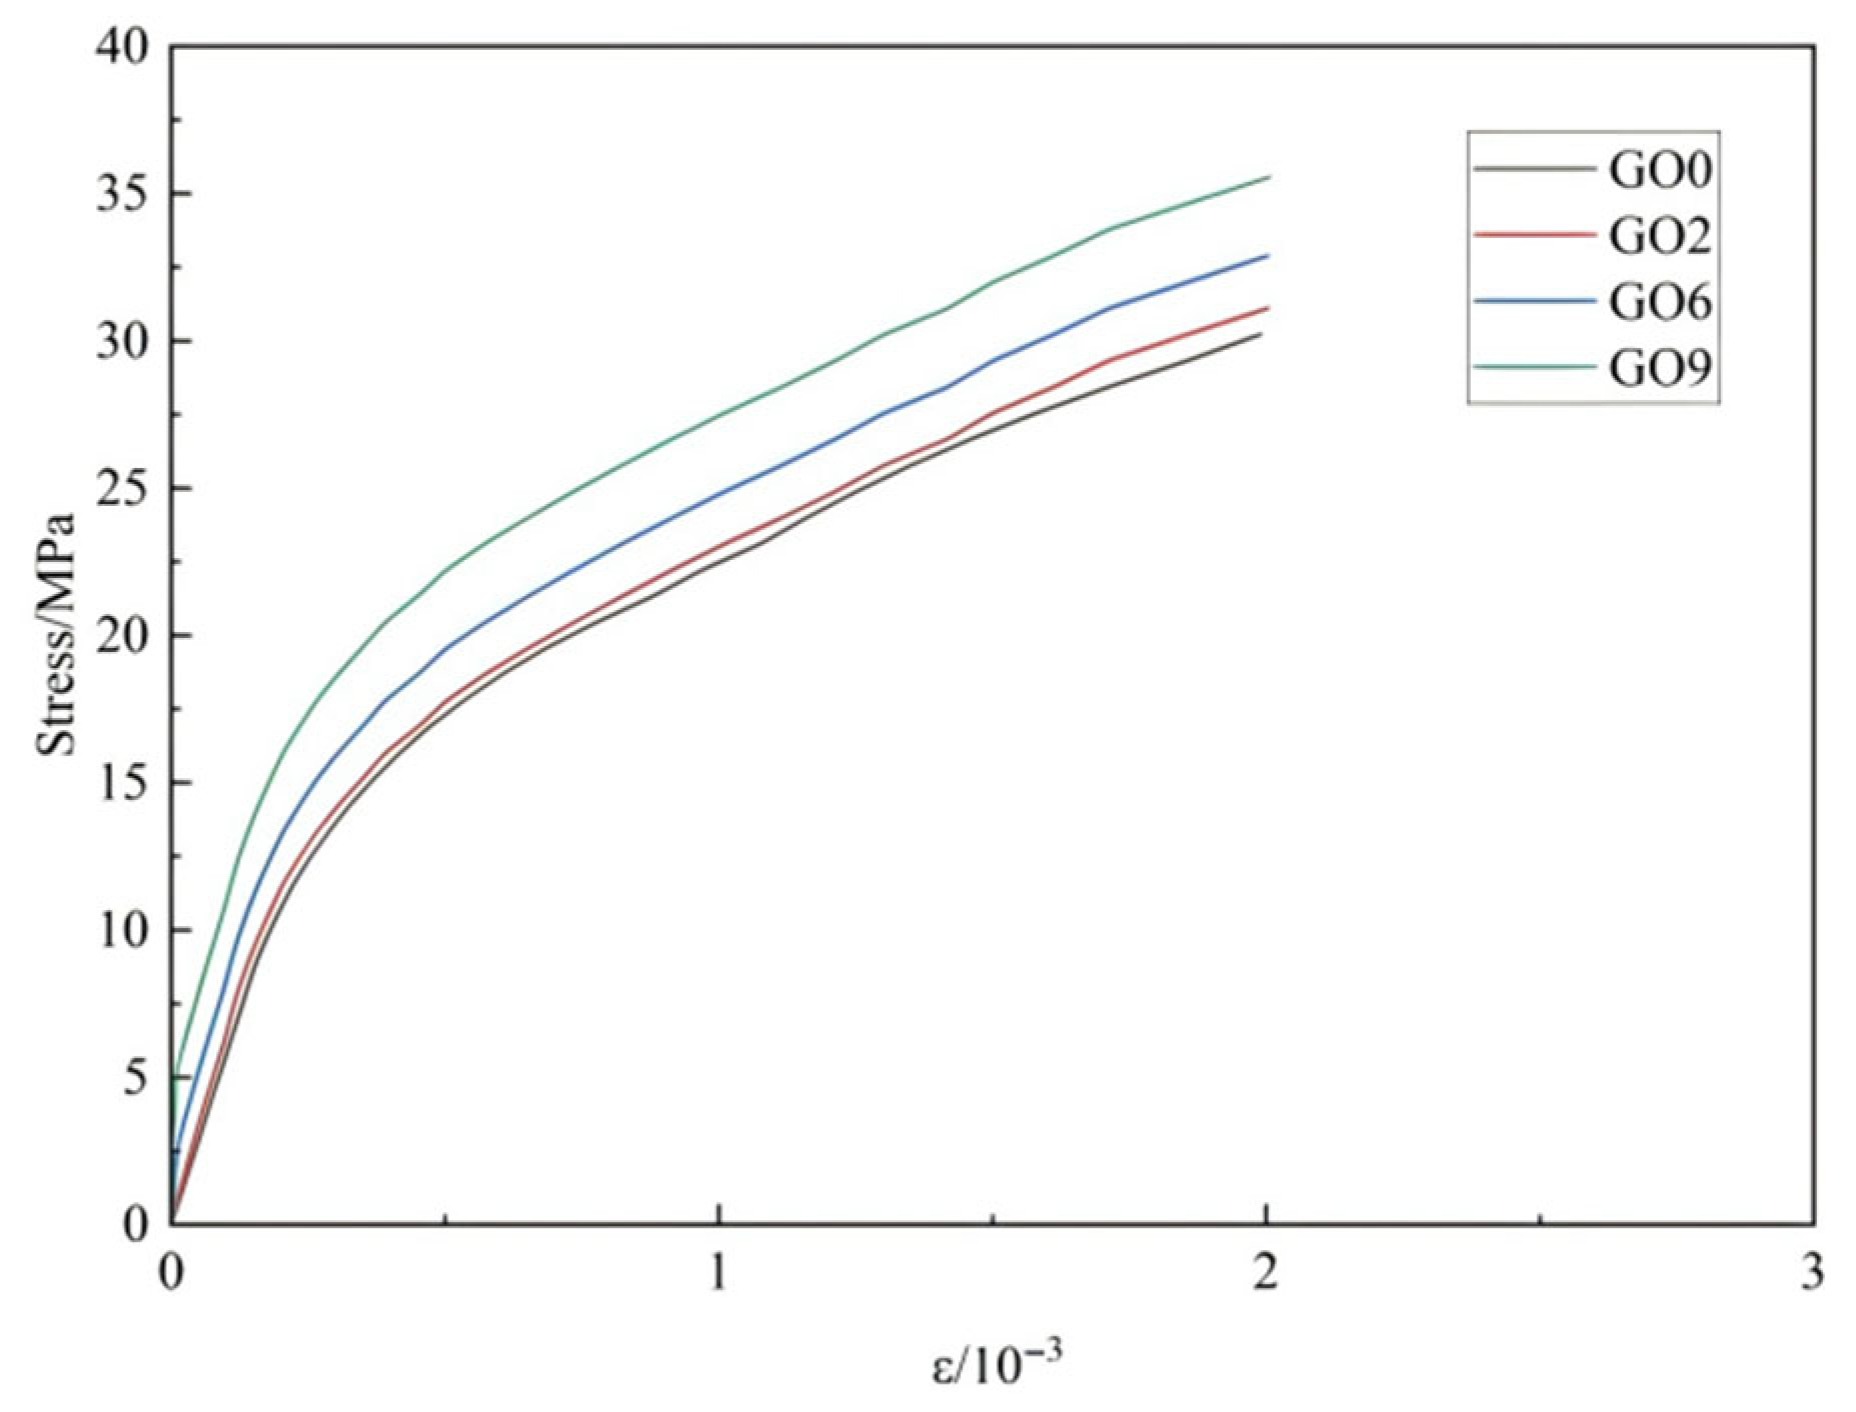
The secant modulus represents the average stiffness and deformation behavior of concrete under a given stress state. As shown in Figure 11, during the elastic stage, strain increased linearly with stress. The stiffness of the specimens increased with the GO dosage, resulting in decreased deformation. In the plastic stage, the stress–strain curve deviated from linearity; however, the secant modulus remained highest in the group containing 0.09% GO. When the strain reached 0.002, the specimens attained their ultimate stress, which also increased with GO dosage. Among all specimens, the group containing 0.09% GO exhibited the highest compressive strength. The absence of a descending branch in the curve after reaching the peak stress, characterized by abrupt fracture, is typical of brittle materials. This indicates that before necking can occur, internal defects or crack tips within the material have already reached a critical stress and undergone unstable propagation, resulting in an instantaneous loss of load-bearing capacity.

3.3.3. (SEM) Microstructural Analysis

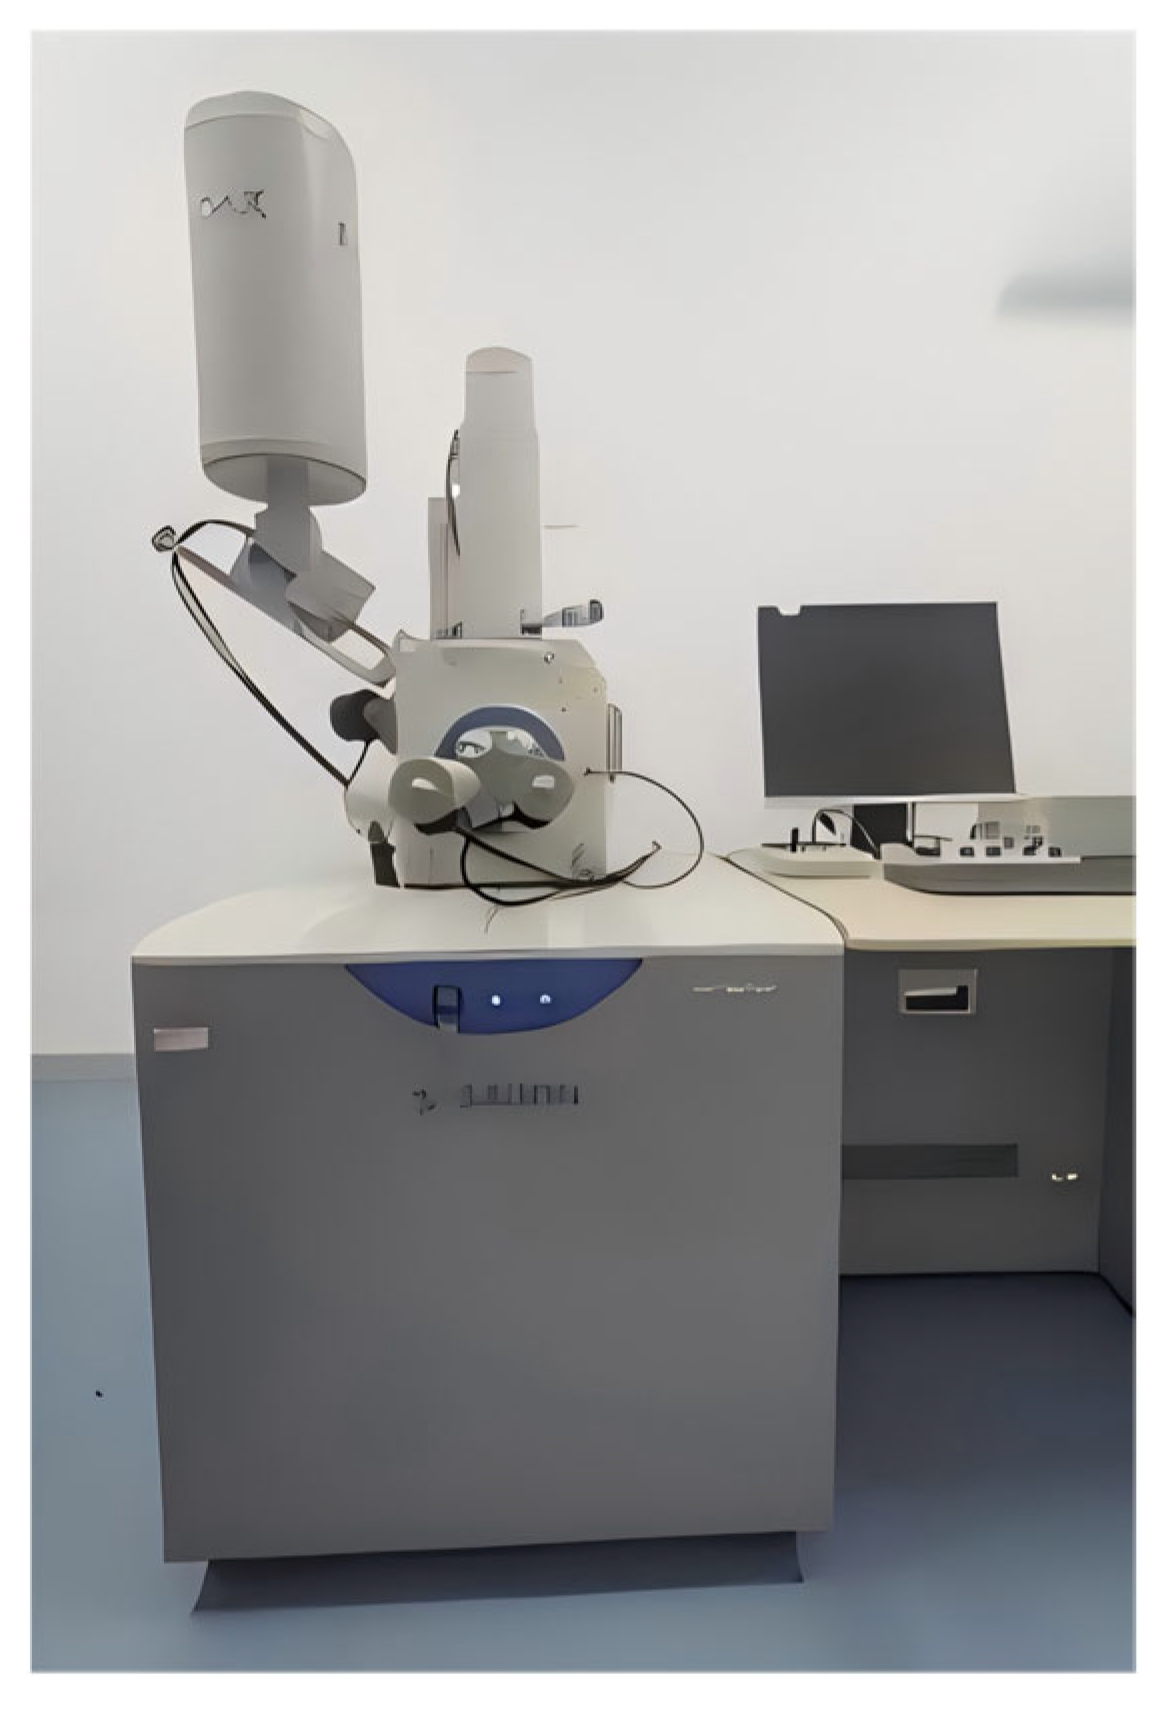
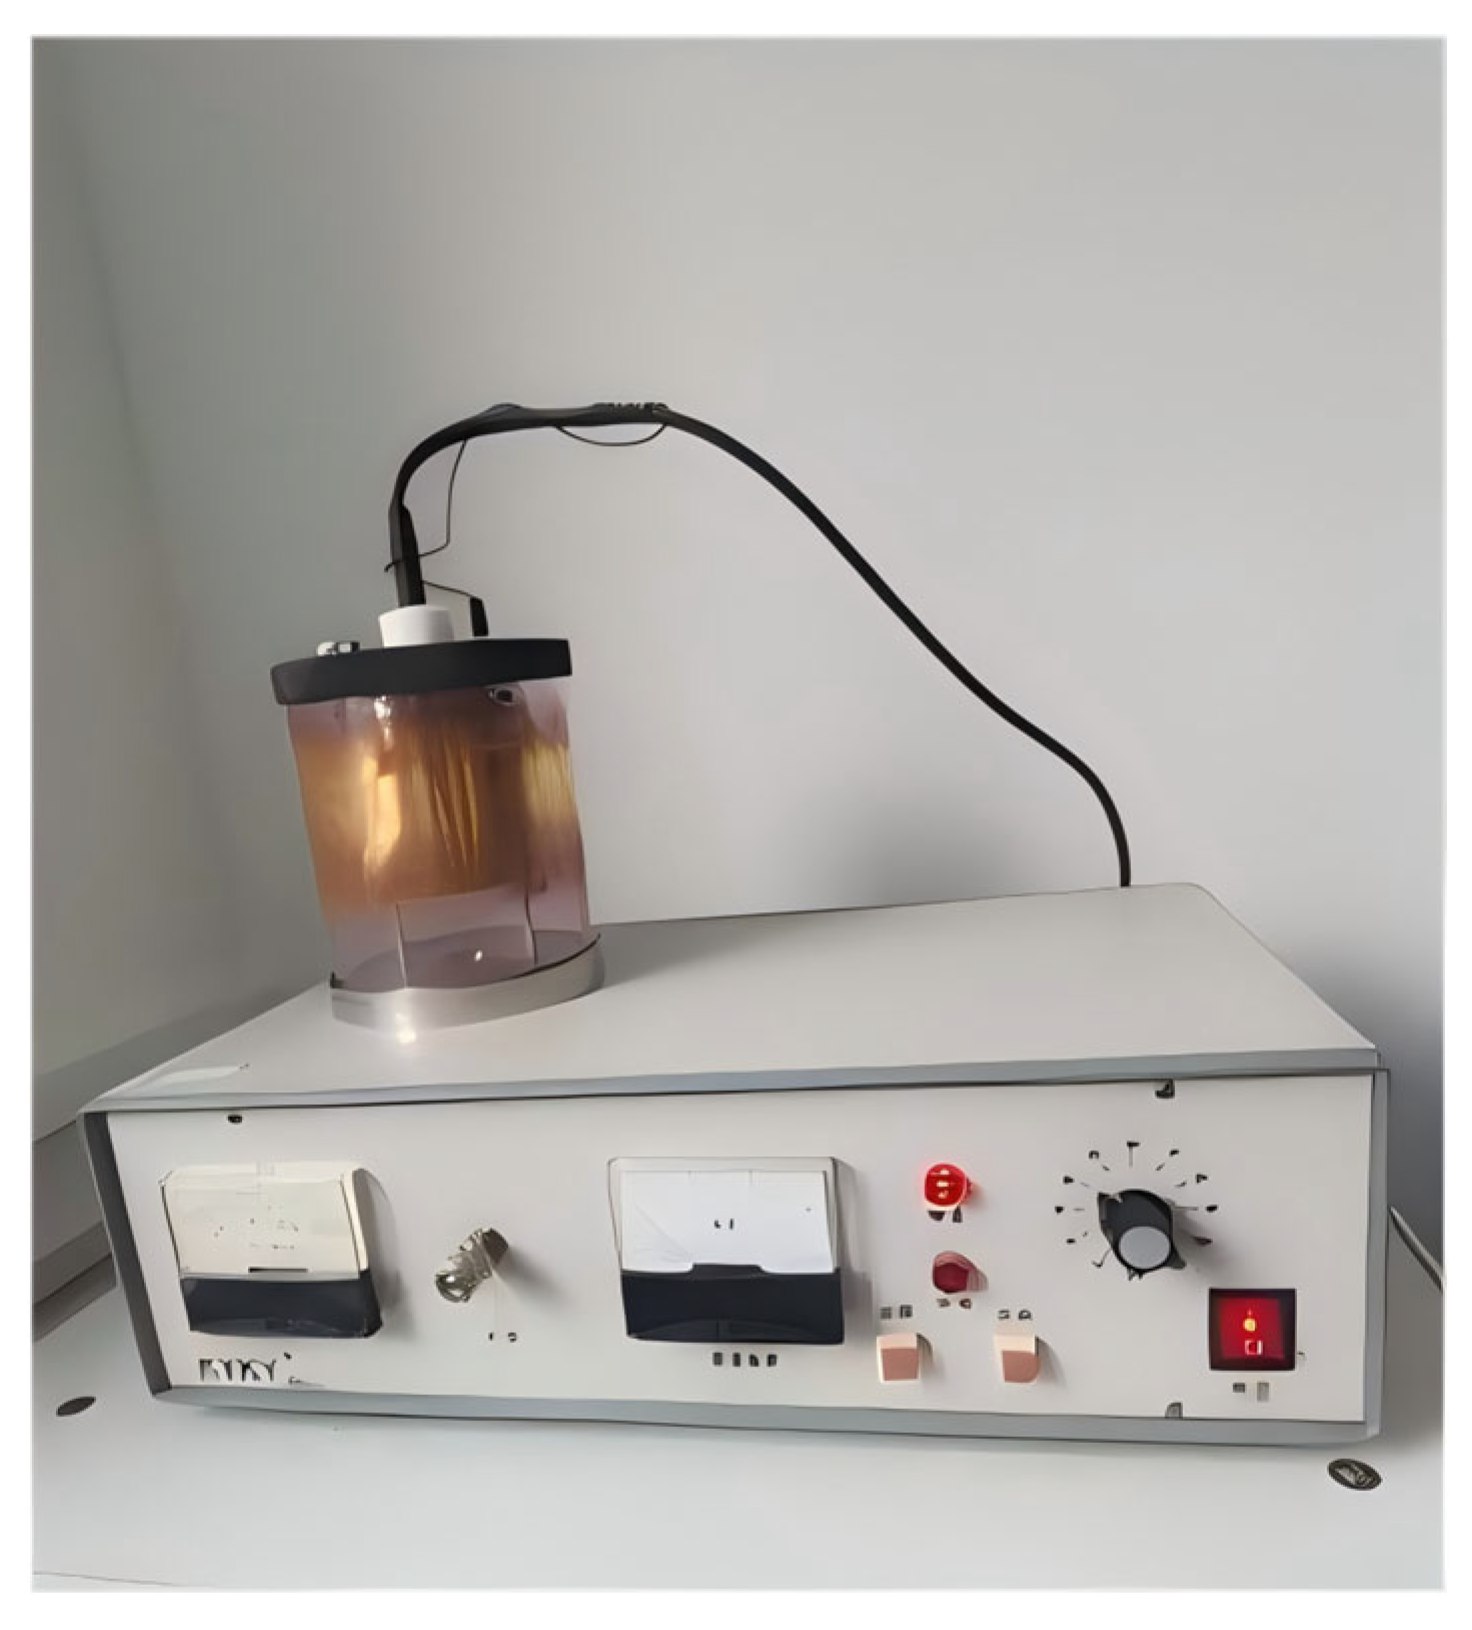
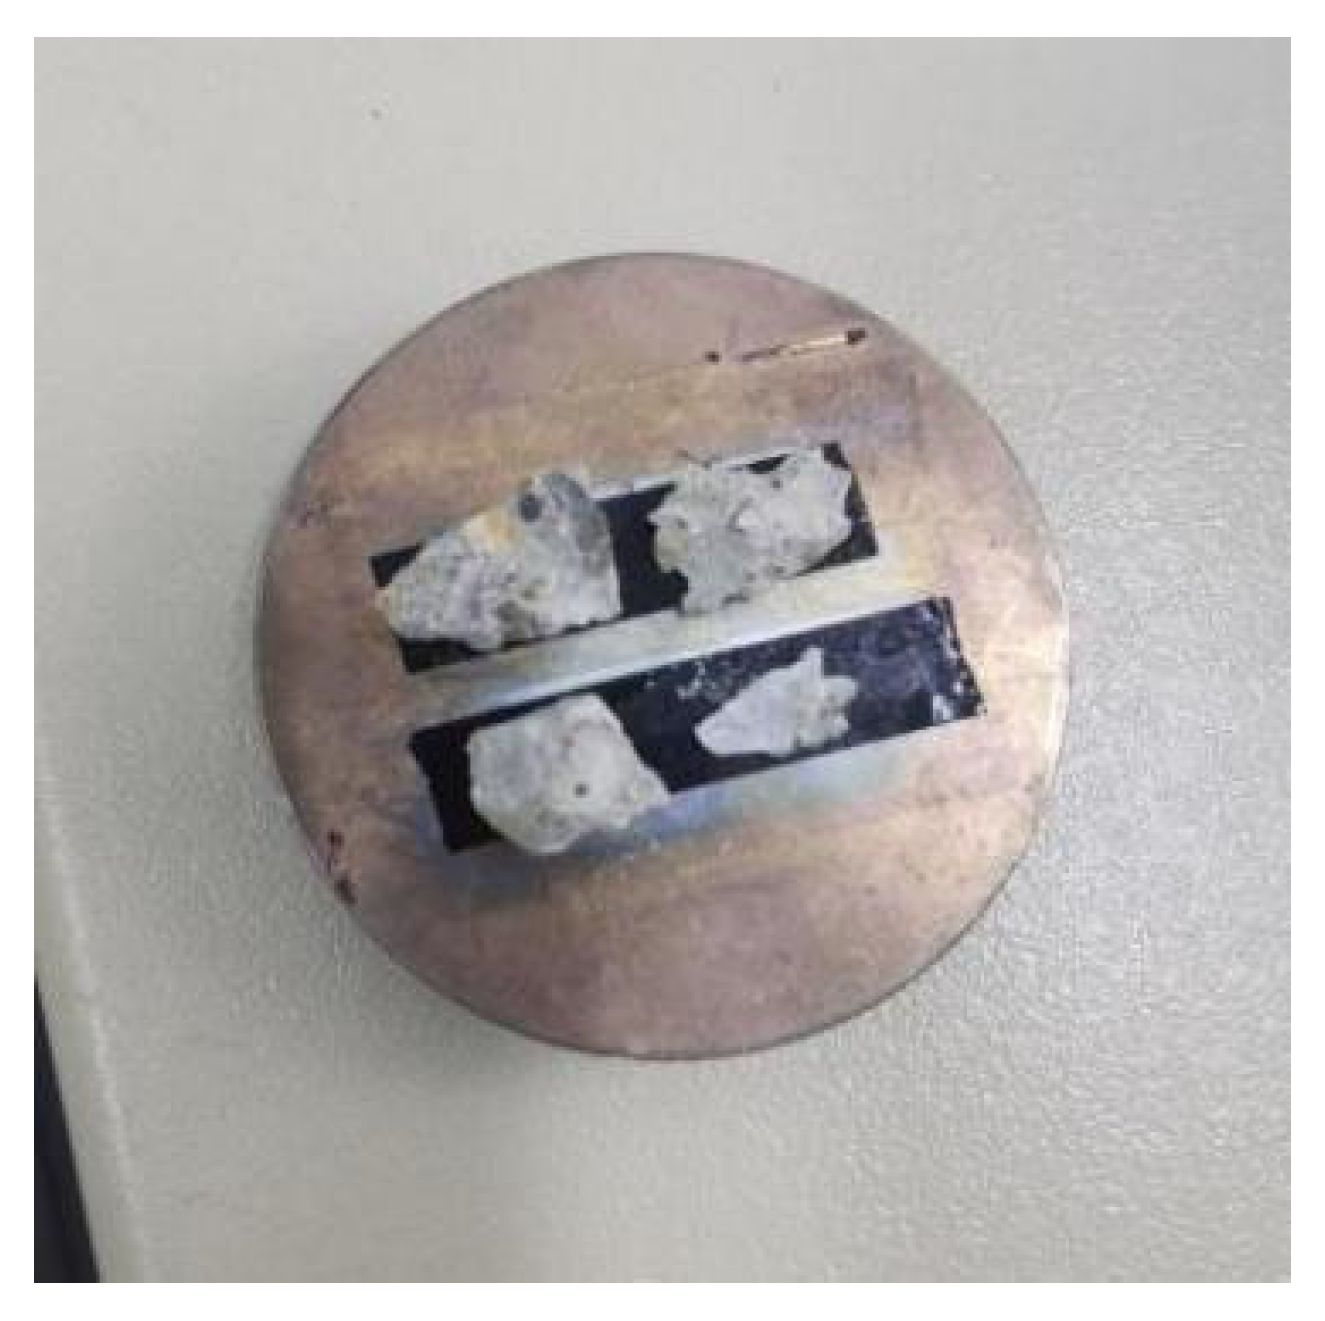
In this study, an S-3400N scanning electron microscope (SEM) was employed to examine fractured specimens and evaluate the influence of GO content on the microstructure of conductive concrete, scanned in late October 2024, thereby elucidating the mechanism of conductivity. Prior to SEM analysis, the specimens were sputter-coated with gold using an ion sputter coater to enhance conductivity. SEM functions by emitting an electron beam that interacts with the specimen’s electrons, generating signals that can be processed to obtain microstructural information. Relevant equipment is shown in Figure 12 and Figure 13. The fractured specimens were cut into small blocks measuring 1.5 cm in length and width and 0.5 cm in thickness. These blocks were adhered to metal stubs using double-sided tape, sputter-coated with gold, and then placed into the SEM. The prepared specimens are shown in Figure 14.
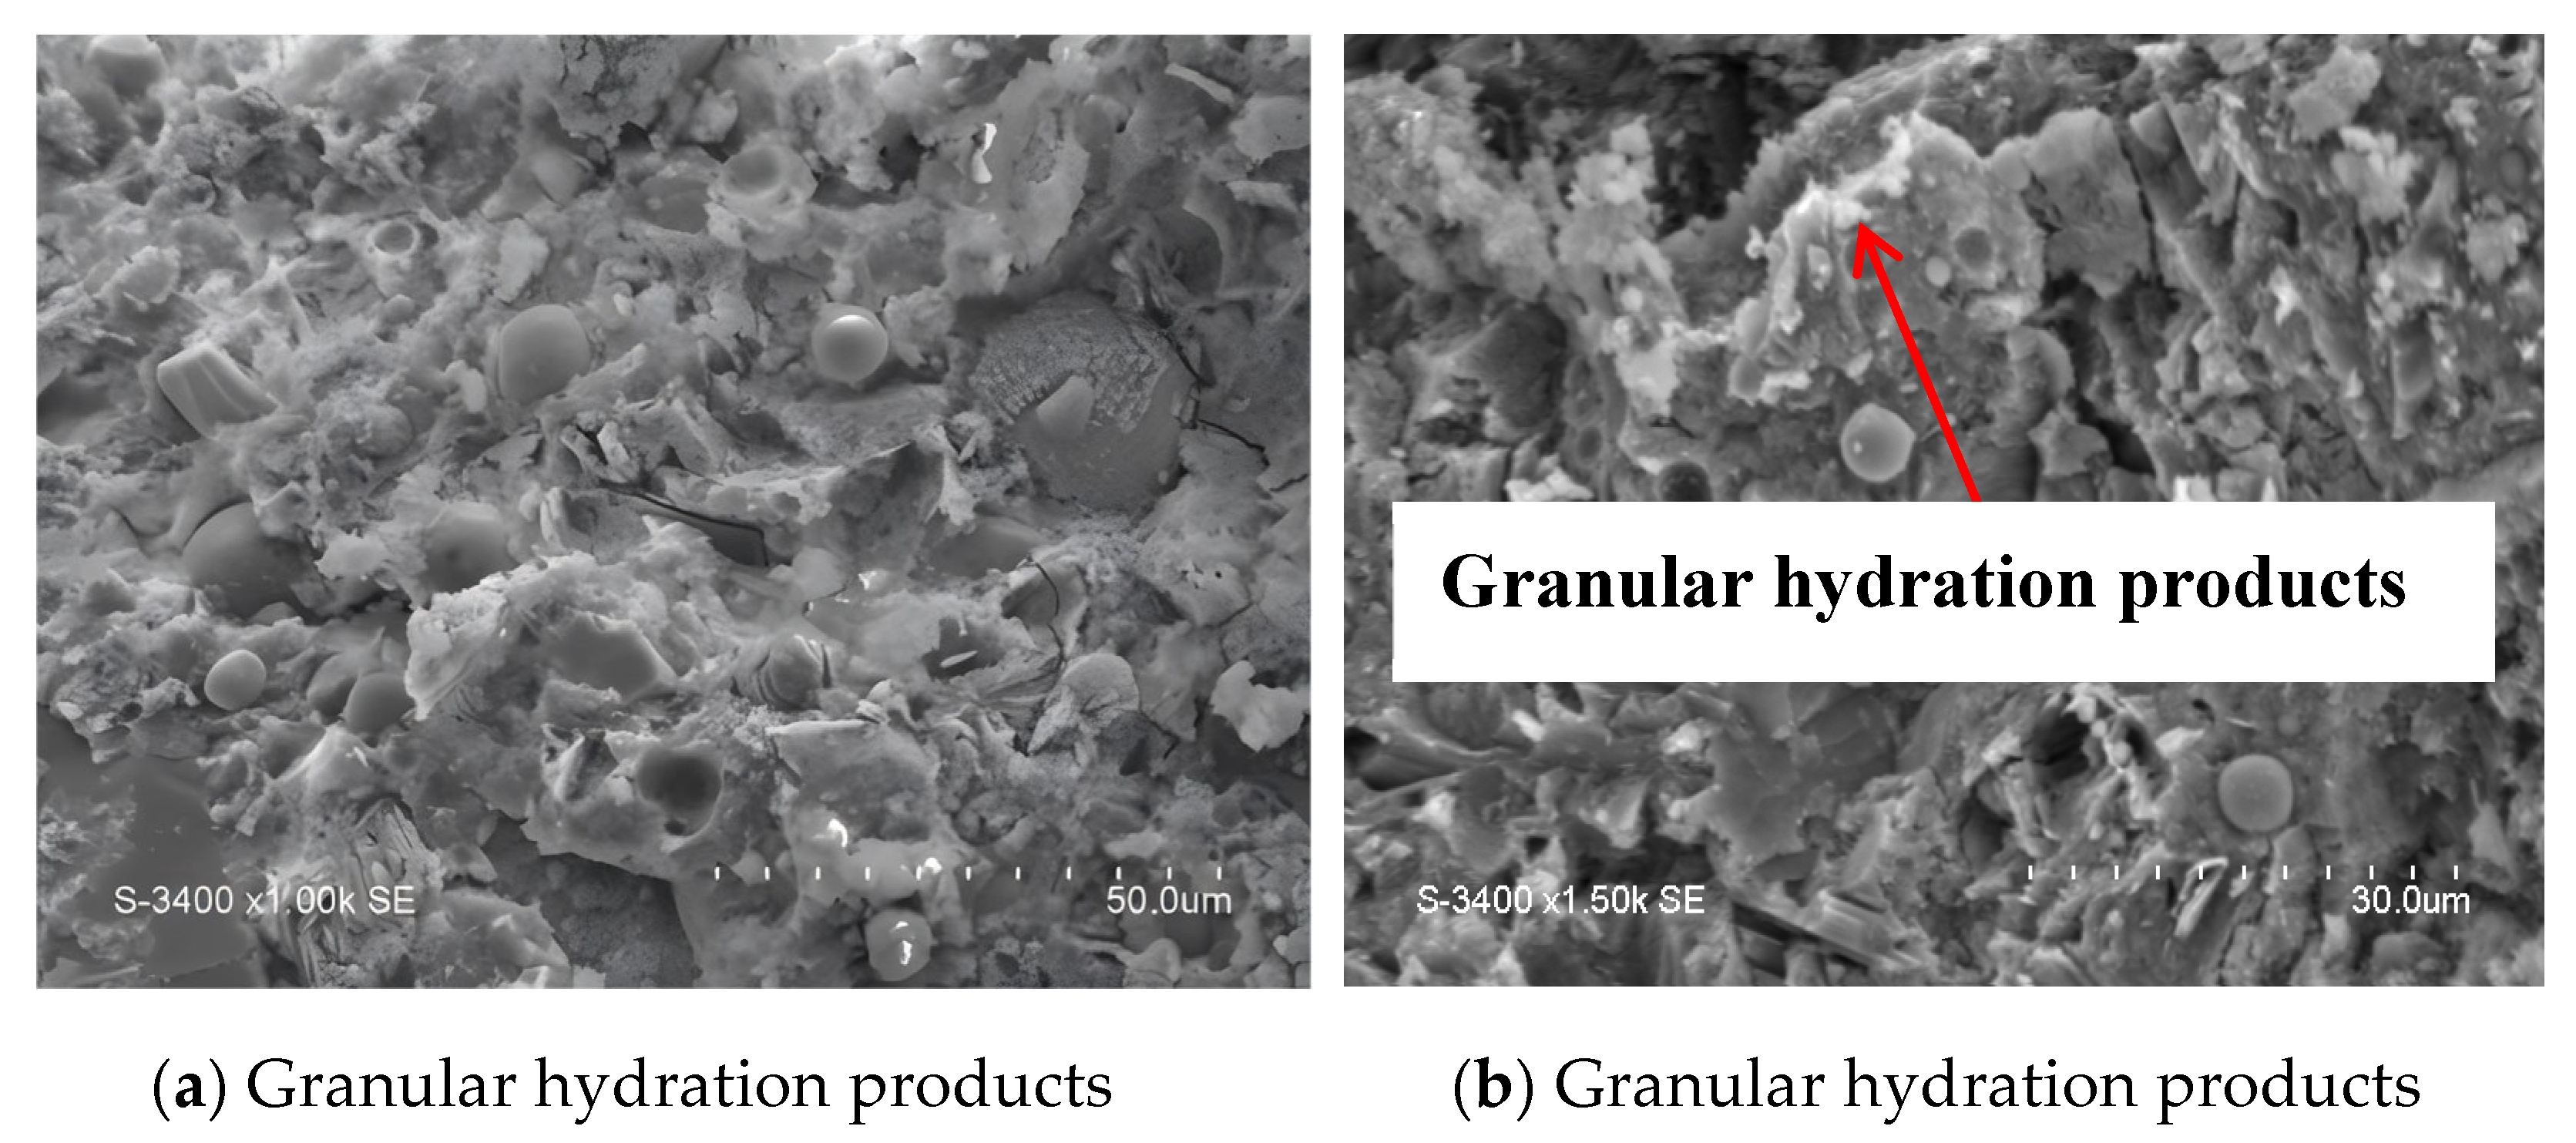
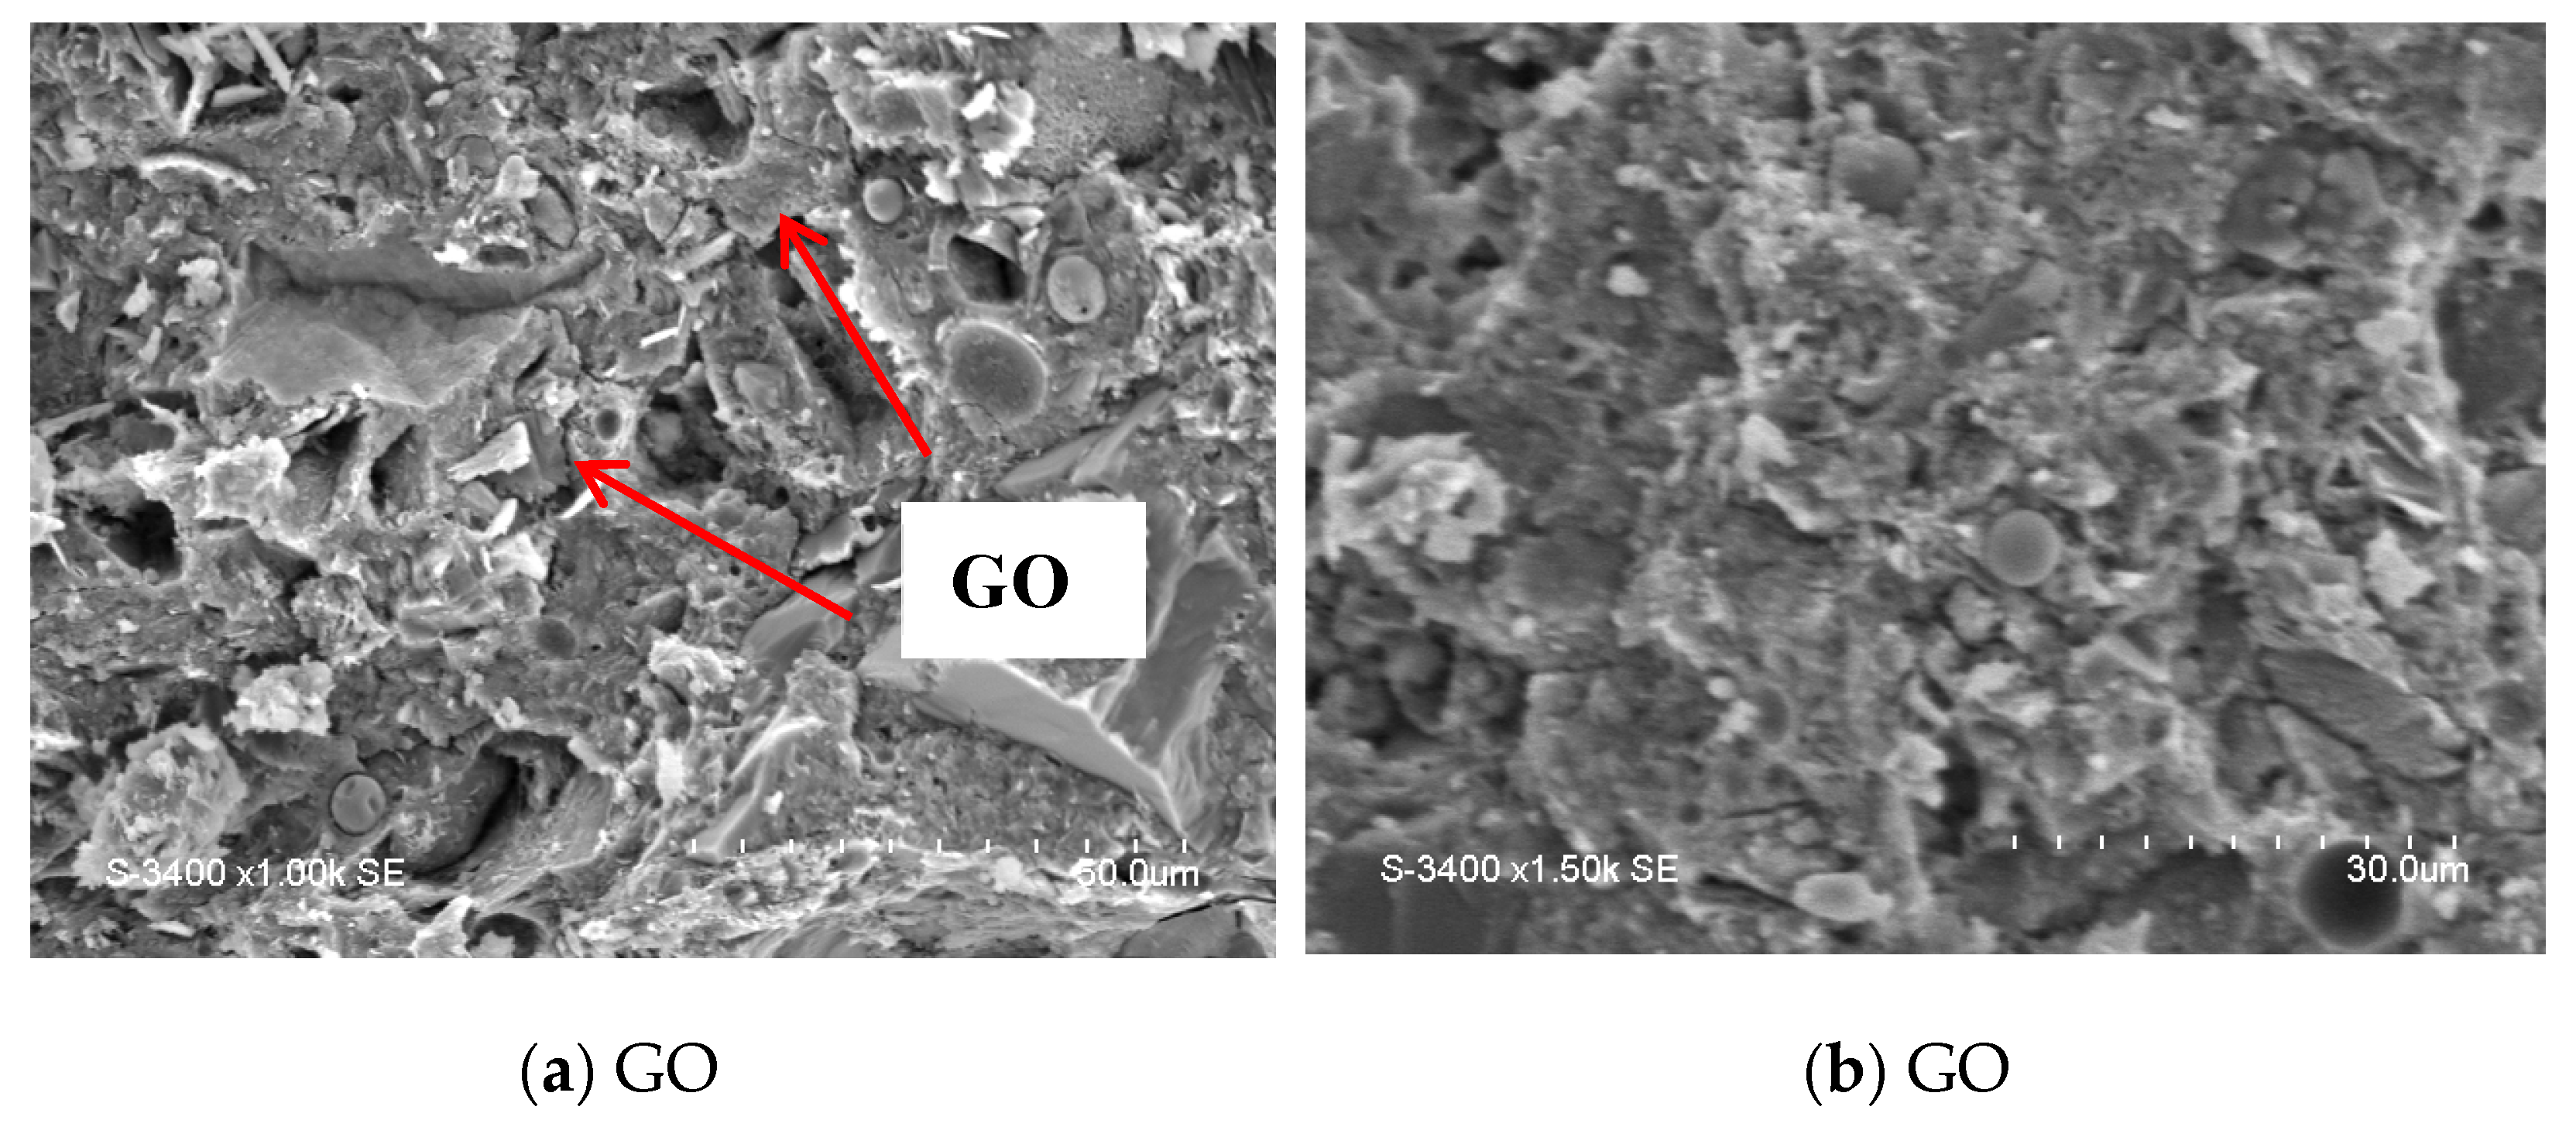
Figure 15, Figure 16, Figure 17 and Figure 18 illustrate the microstructural evolution of cement matrices with different graphene oxide (GO) dosages. Figure 15 shows that the sample without GO addition exhibits a high porosity of approximately 15–20% along with numerous microcracks, indicating incomplete hydration reaction, which is the main reason for its low strength and brittle failure. As the GO dosage increases to 0.02%, Figure 16 reveals improved matrix uniformity with a significant reduction in pores and cracks. Figure 17 demonstrates that when the dosage reaches 0.06%, the hydration reaction becomes more sufficient and the structural compactness is further enhanced; for the sample with 0.09% GO (Figure 18), a large amount of hydration products are generated, forming a dense microstructural structure dominated by calcium silicate hydrate (C-S-H) gel, with the corresponding porosity decreasing to below 8%. C-S-H gel is formed by the hydration of C3S and C2S phases in cement, and its non-stoichiometric composition (CaO·SiO2·H2O) is the core for concrete to obtain strength and durability. The addition of GO not only increases the yield of C-S-H gel by regulating the hydration process, but its lamellar structure also further optimizes the pore distribution, reducing the proportion of harmful pores (>100 nm) and shifting the most probable pore diameter to the nanoscale. This microstructural refinement process not only enhances the mechanical properties of the matrix, but also reduces the electronic potential barrier between GO lamellae, promoting the formation of tunnel effect and conductive pathways, thereby significantly improving the electrical conductivity of the material. Combined with the results of microstructural observations and performance tests, when the GO dosage is 0.09%, the structural densification can be achieved while synergistically optimizing the mechanical and electrical properties to the optimal state.

4. Mechanical and Conductive Properties of Reinforced Concrete Beams (RCBs)

Based on the preliminary experimental data, when the GO dosage is 0.09%, the concrete simultaneously achieves the highest compressive strength, optimal conductive performance, and maximum secant modulus, realizing the synergistic optimization of mechanical properties, sensing performance, and stiffness. Therefore, a GO dosage of 0.09% was selected for the preparation of reinforced concrete beams (RCBs). All specimens adopted the same concrete grade, GO dosage, and reinforcement ratio, but were designed differently through various structural configurations such as embedded block structures and layered reinforcement. This study systematically analyzed the flexural mechanical behavior and conductive property responses of each component, and finally derived a predictive calculation formula by fitting the deflection-resistance curve.

4.1. Specimen Design

4.1.1. Mechanical Properties and Reinforcement Configurations

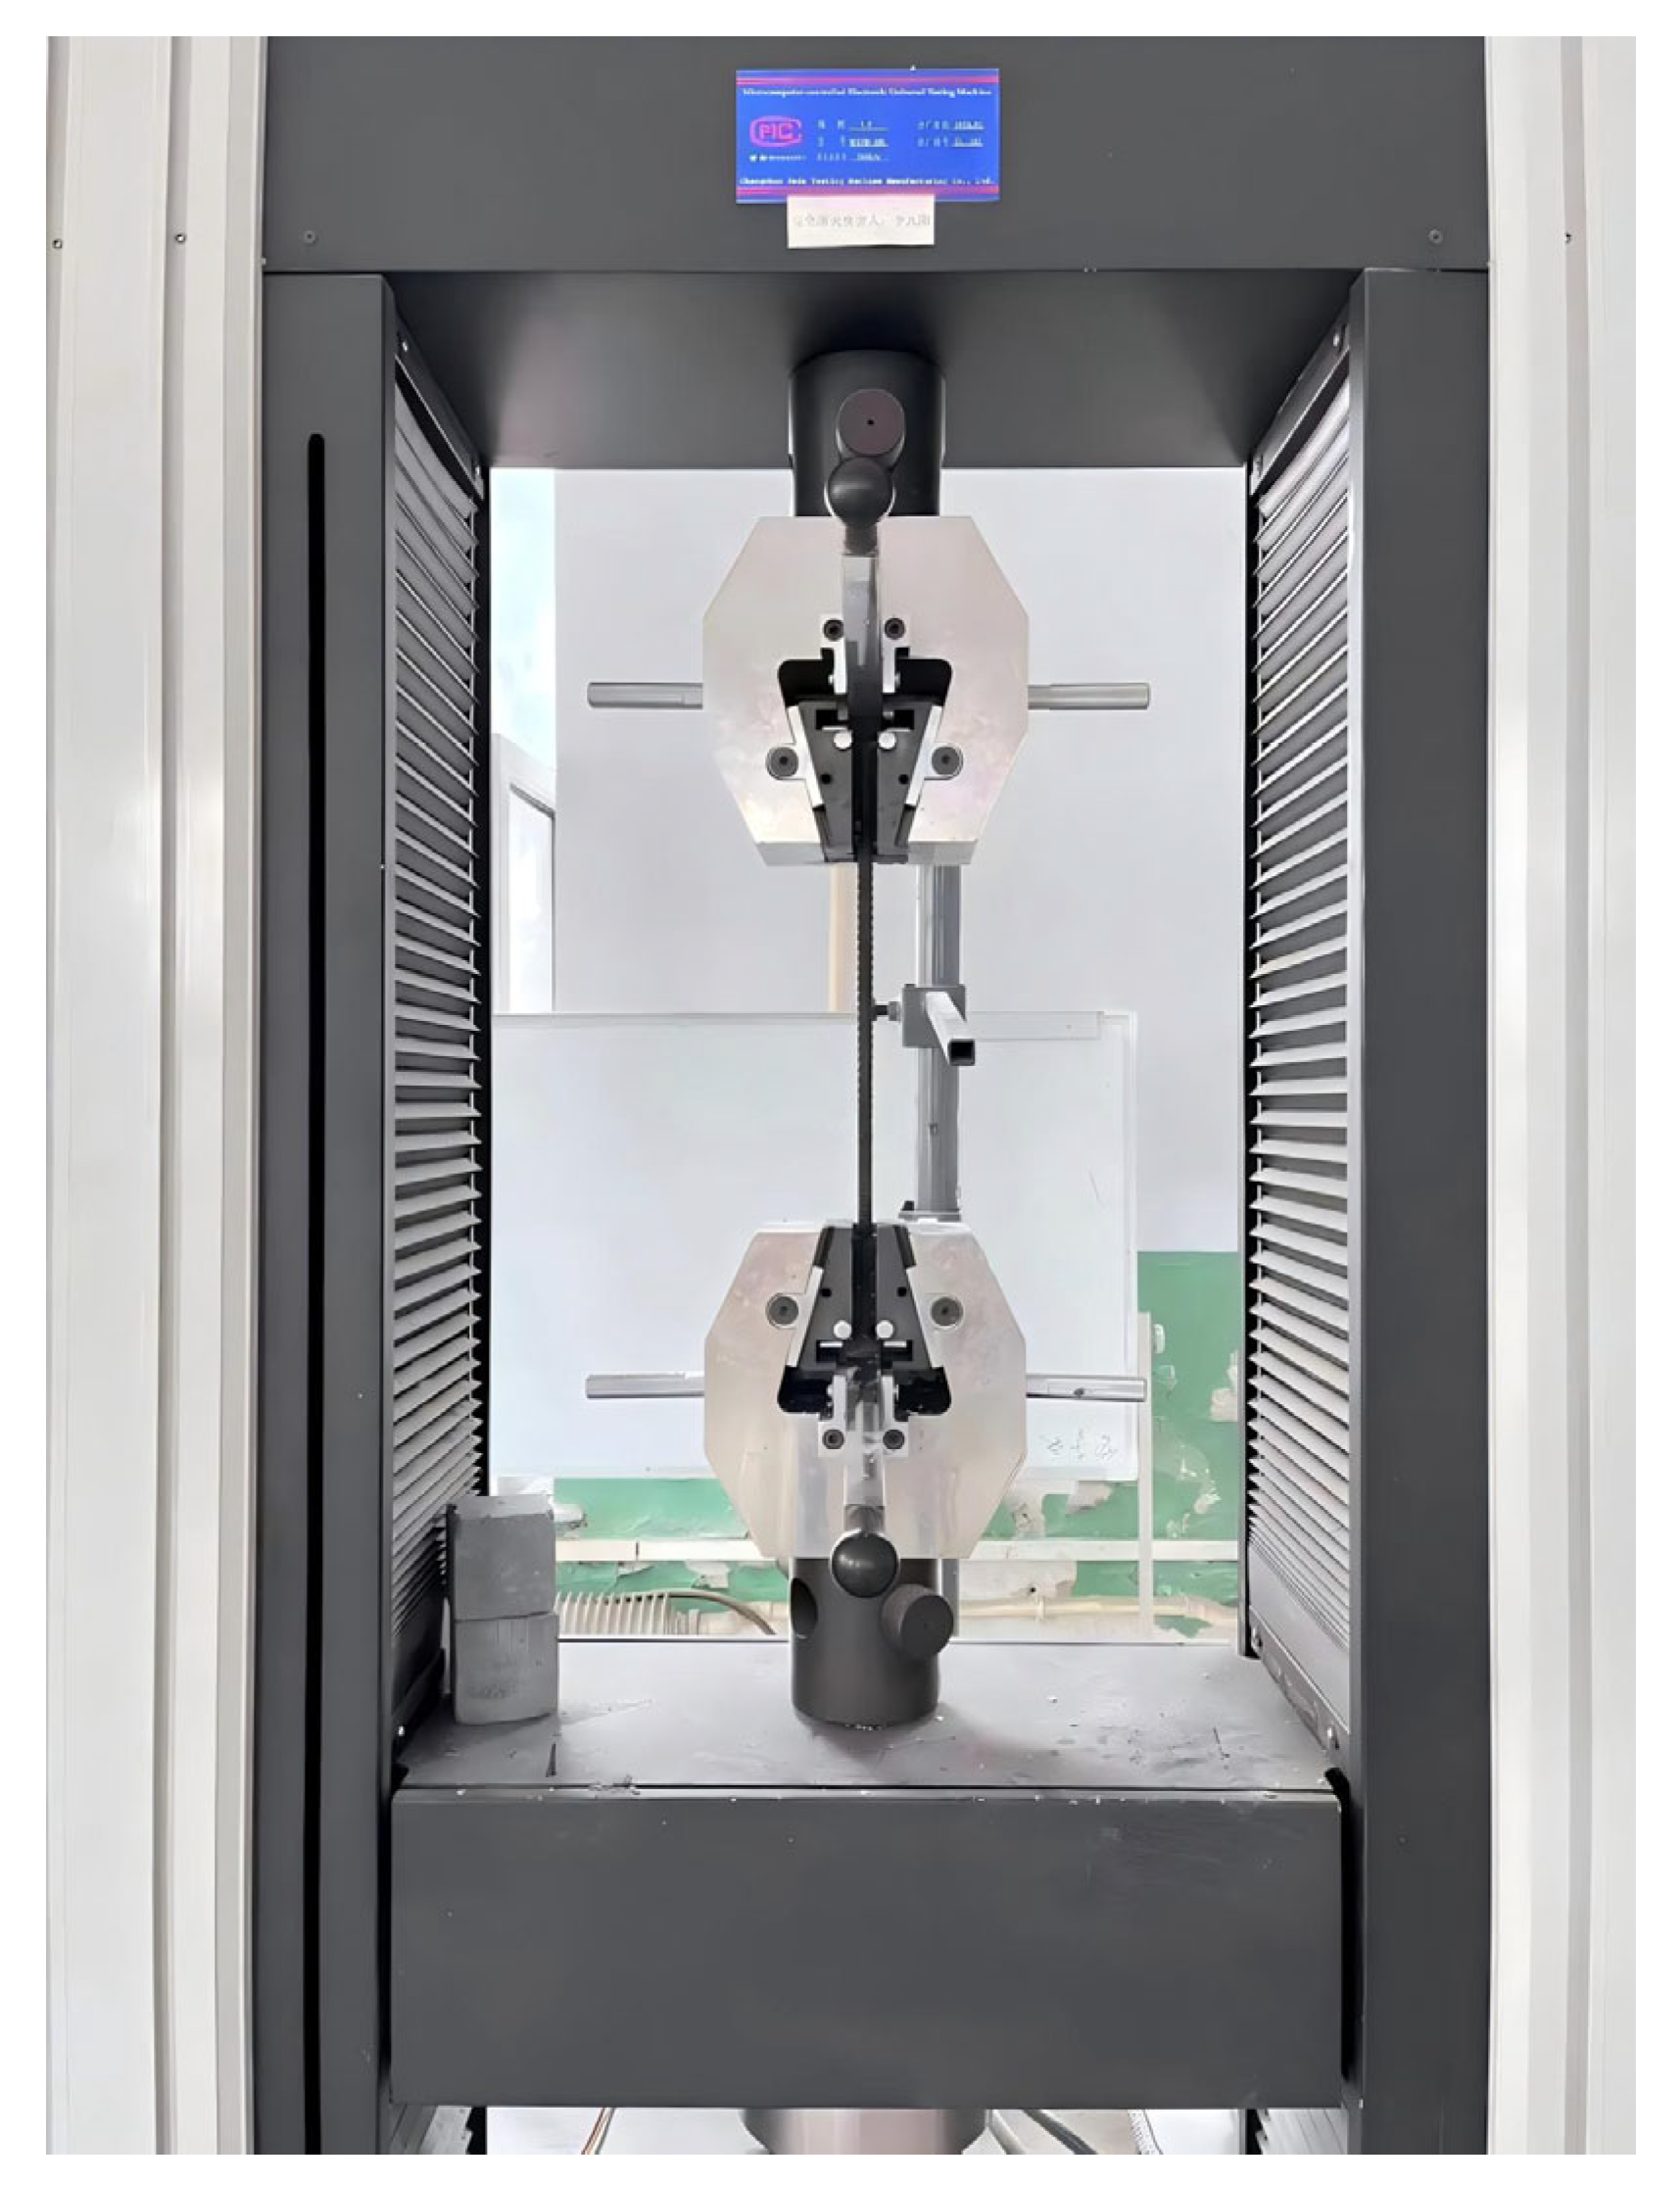
The reinforcing steel bars used in the GO-modified concrete beams were grade HRB400. Tensile testing of the steel bars was conducted in accordance with the standard “Metallic Materials—Tensile Testing—Part 1: Method of Test at Ambient Temperature” [29]. The specific mechanical properties of these bars are listed in Table 5, and the on-site tensile testing setup is illustrated in Figure 19.
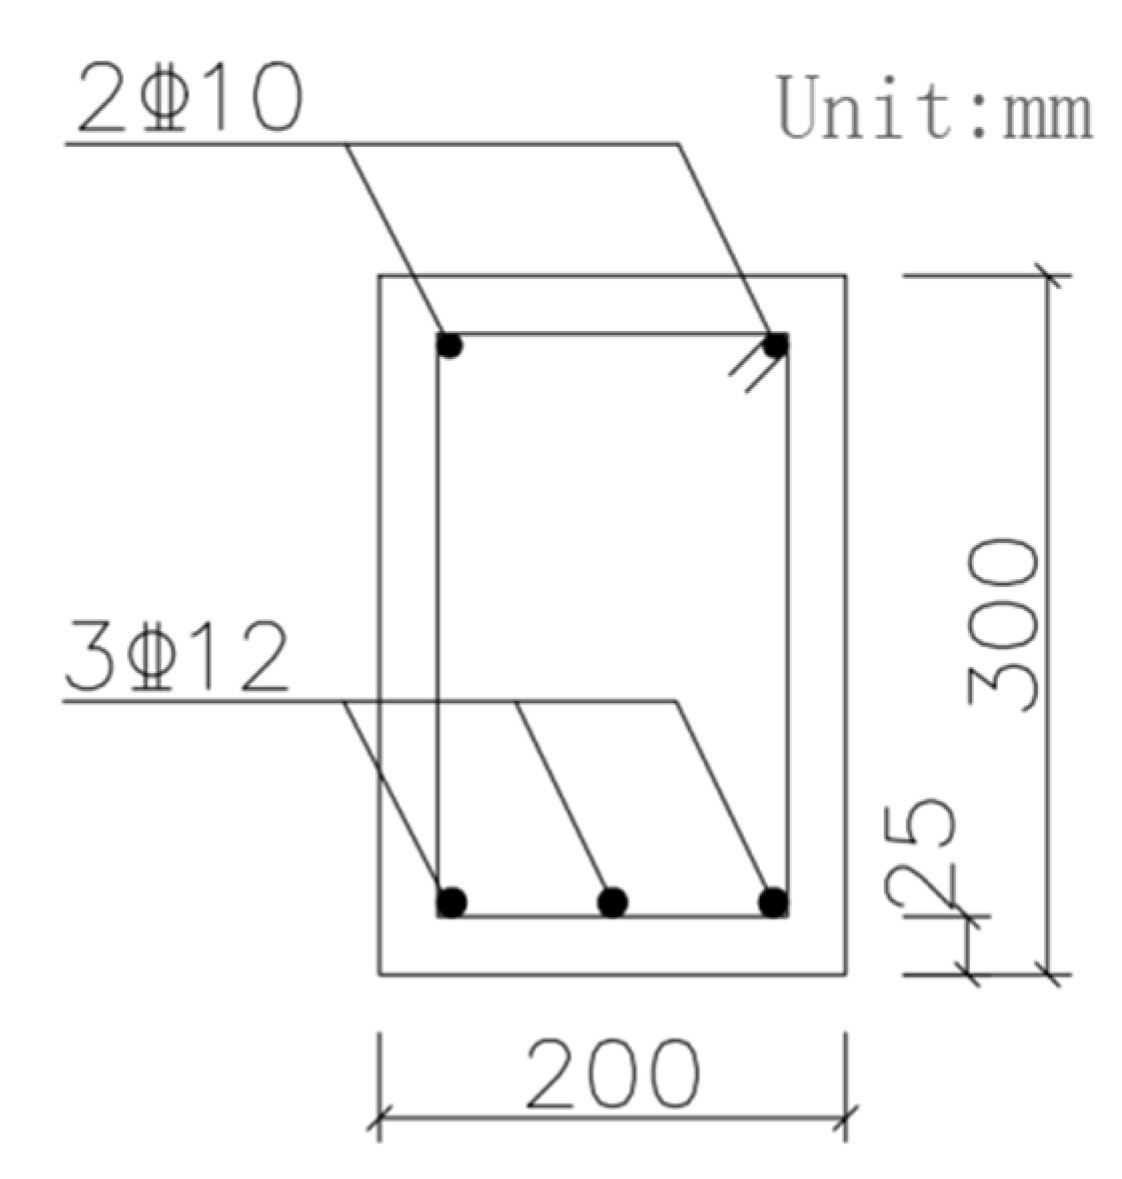
According to the “Standard for Design of Concrete Structures” (GB/T50010-2010) [30], the test beams measured 200 mm × 300 mm × 1800 mm, with a concrete cover thickness of 25 mm. The longitudinal and hanger bars were each 1750 mm long. To facilitate deflection observation during testing, no stirrups were installed within the 500-mm midspan. The longitudinal reinforcement consisted of 12-mm HRB400 bars, while 10-mm HRB400 bars were used as hanger bars. According to the “strong shear–weak bending” design principle, shear zones were reinforced using 8-mm-diameter HRB400 stirrups spaced at 75-mm intervals. Beam dimensions and reinforcement details are shown in Figure 20 and Figure 21.

4.1.2. Specimen Fabrication

Following the mix proportions detailed in Table 3, a total of nine test beams were cast, divided into three groups: three ordinary RCBs, three layered GO-modified RCBs, and three GO-smart-block beams. The ordinary RCBs served as the control group. Beam designations are explained as follows: “RCB” stands for reinforced concrete beam; “PT” indicates plain (ordinary) concrete; “GO” denotes graphene oxide; “F” refers to layered casting; “Z” signifies smart blocks; and the accompanying number indicates the beam sequence. For example, RCB-GO-F-1 represents the first-layered GO-modified RCB. Parameter details are presented in Table 6.
The specimen fabrication process consists of the following procedures: tying of the steel reinforcement cage, installation of strain gauges, application of epoxy adhesive, mounting of GO intelligent blocks, fabrication of wooden formwork, concrete pouring, and curing. In addition, intelligent concrete blocks with dimensions of 100 mm × 100 mm × 100 mm were cast, and 100 mm × 50 mm copper mesh electrodes were embedded on their surfaces. The mixing ratio was strictly in accordance with the specifications in Table 3, and the preparation process was exactly consistent with the method described in Section 3.1. After 3 days of curing, the concrete blocks were demolded and grooved to enhance the bonding strength with cast-in-place concrete, ultimately forming an integrated load-bearing structure.

4.2. Loading Protocol and Measurement Methodology

4.2.1. Testing Setup and Loading Apparatus

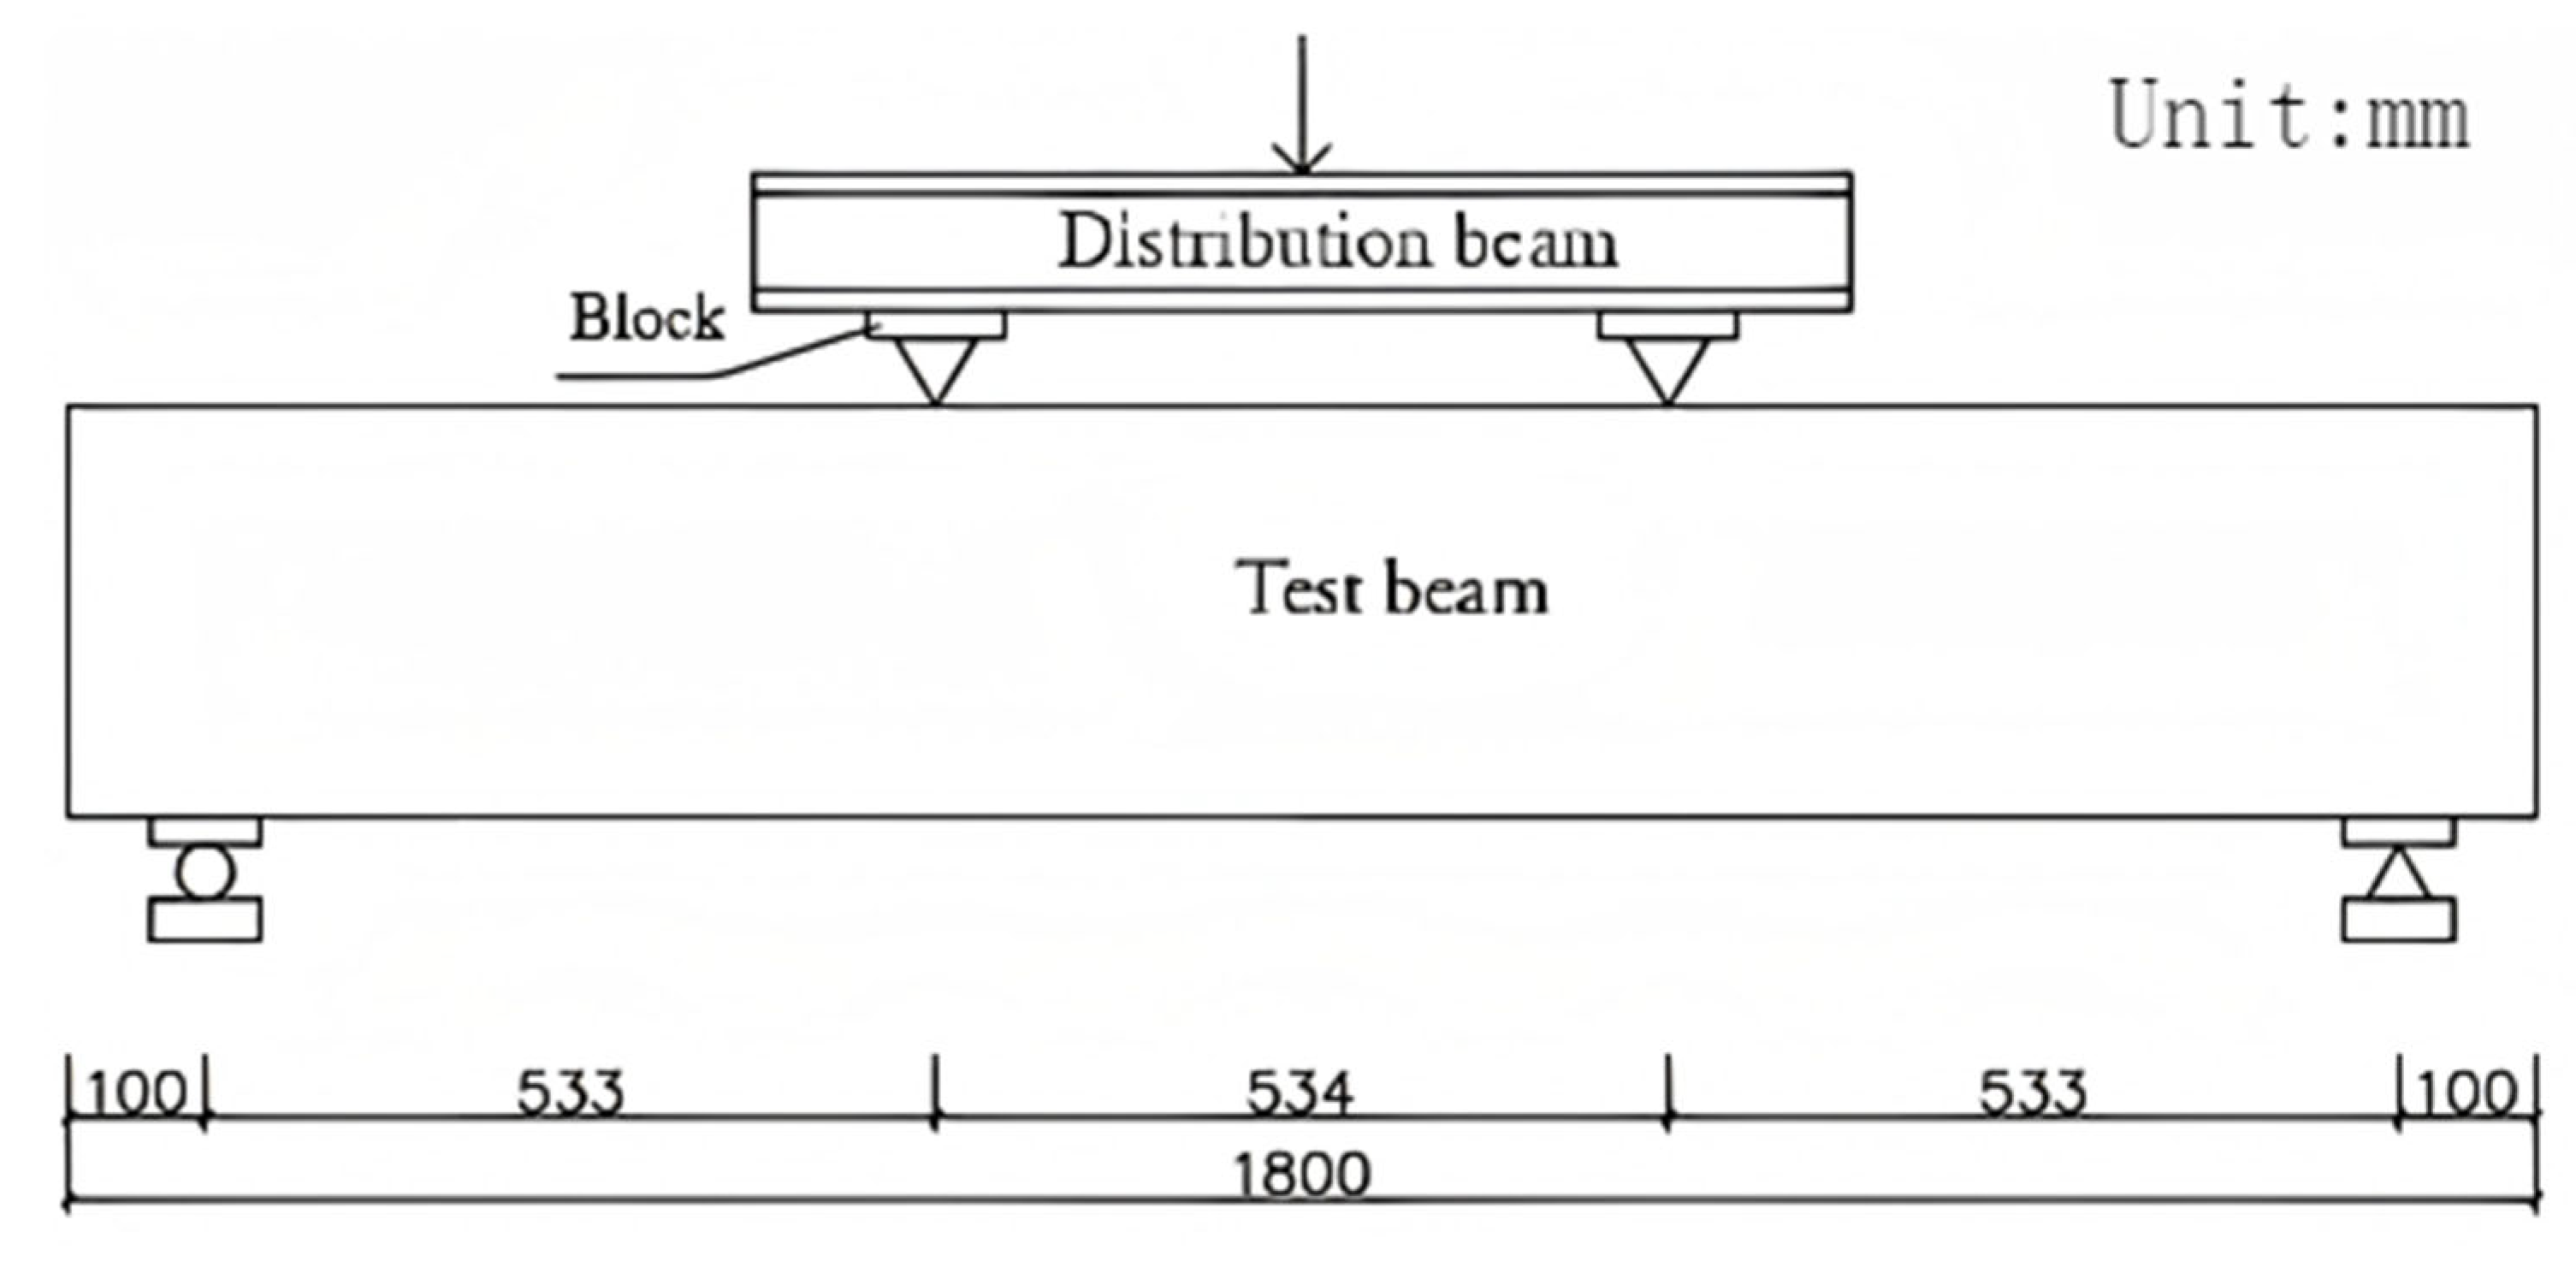
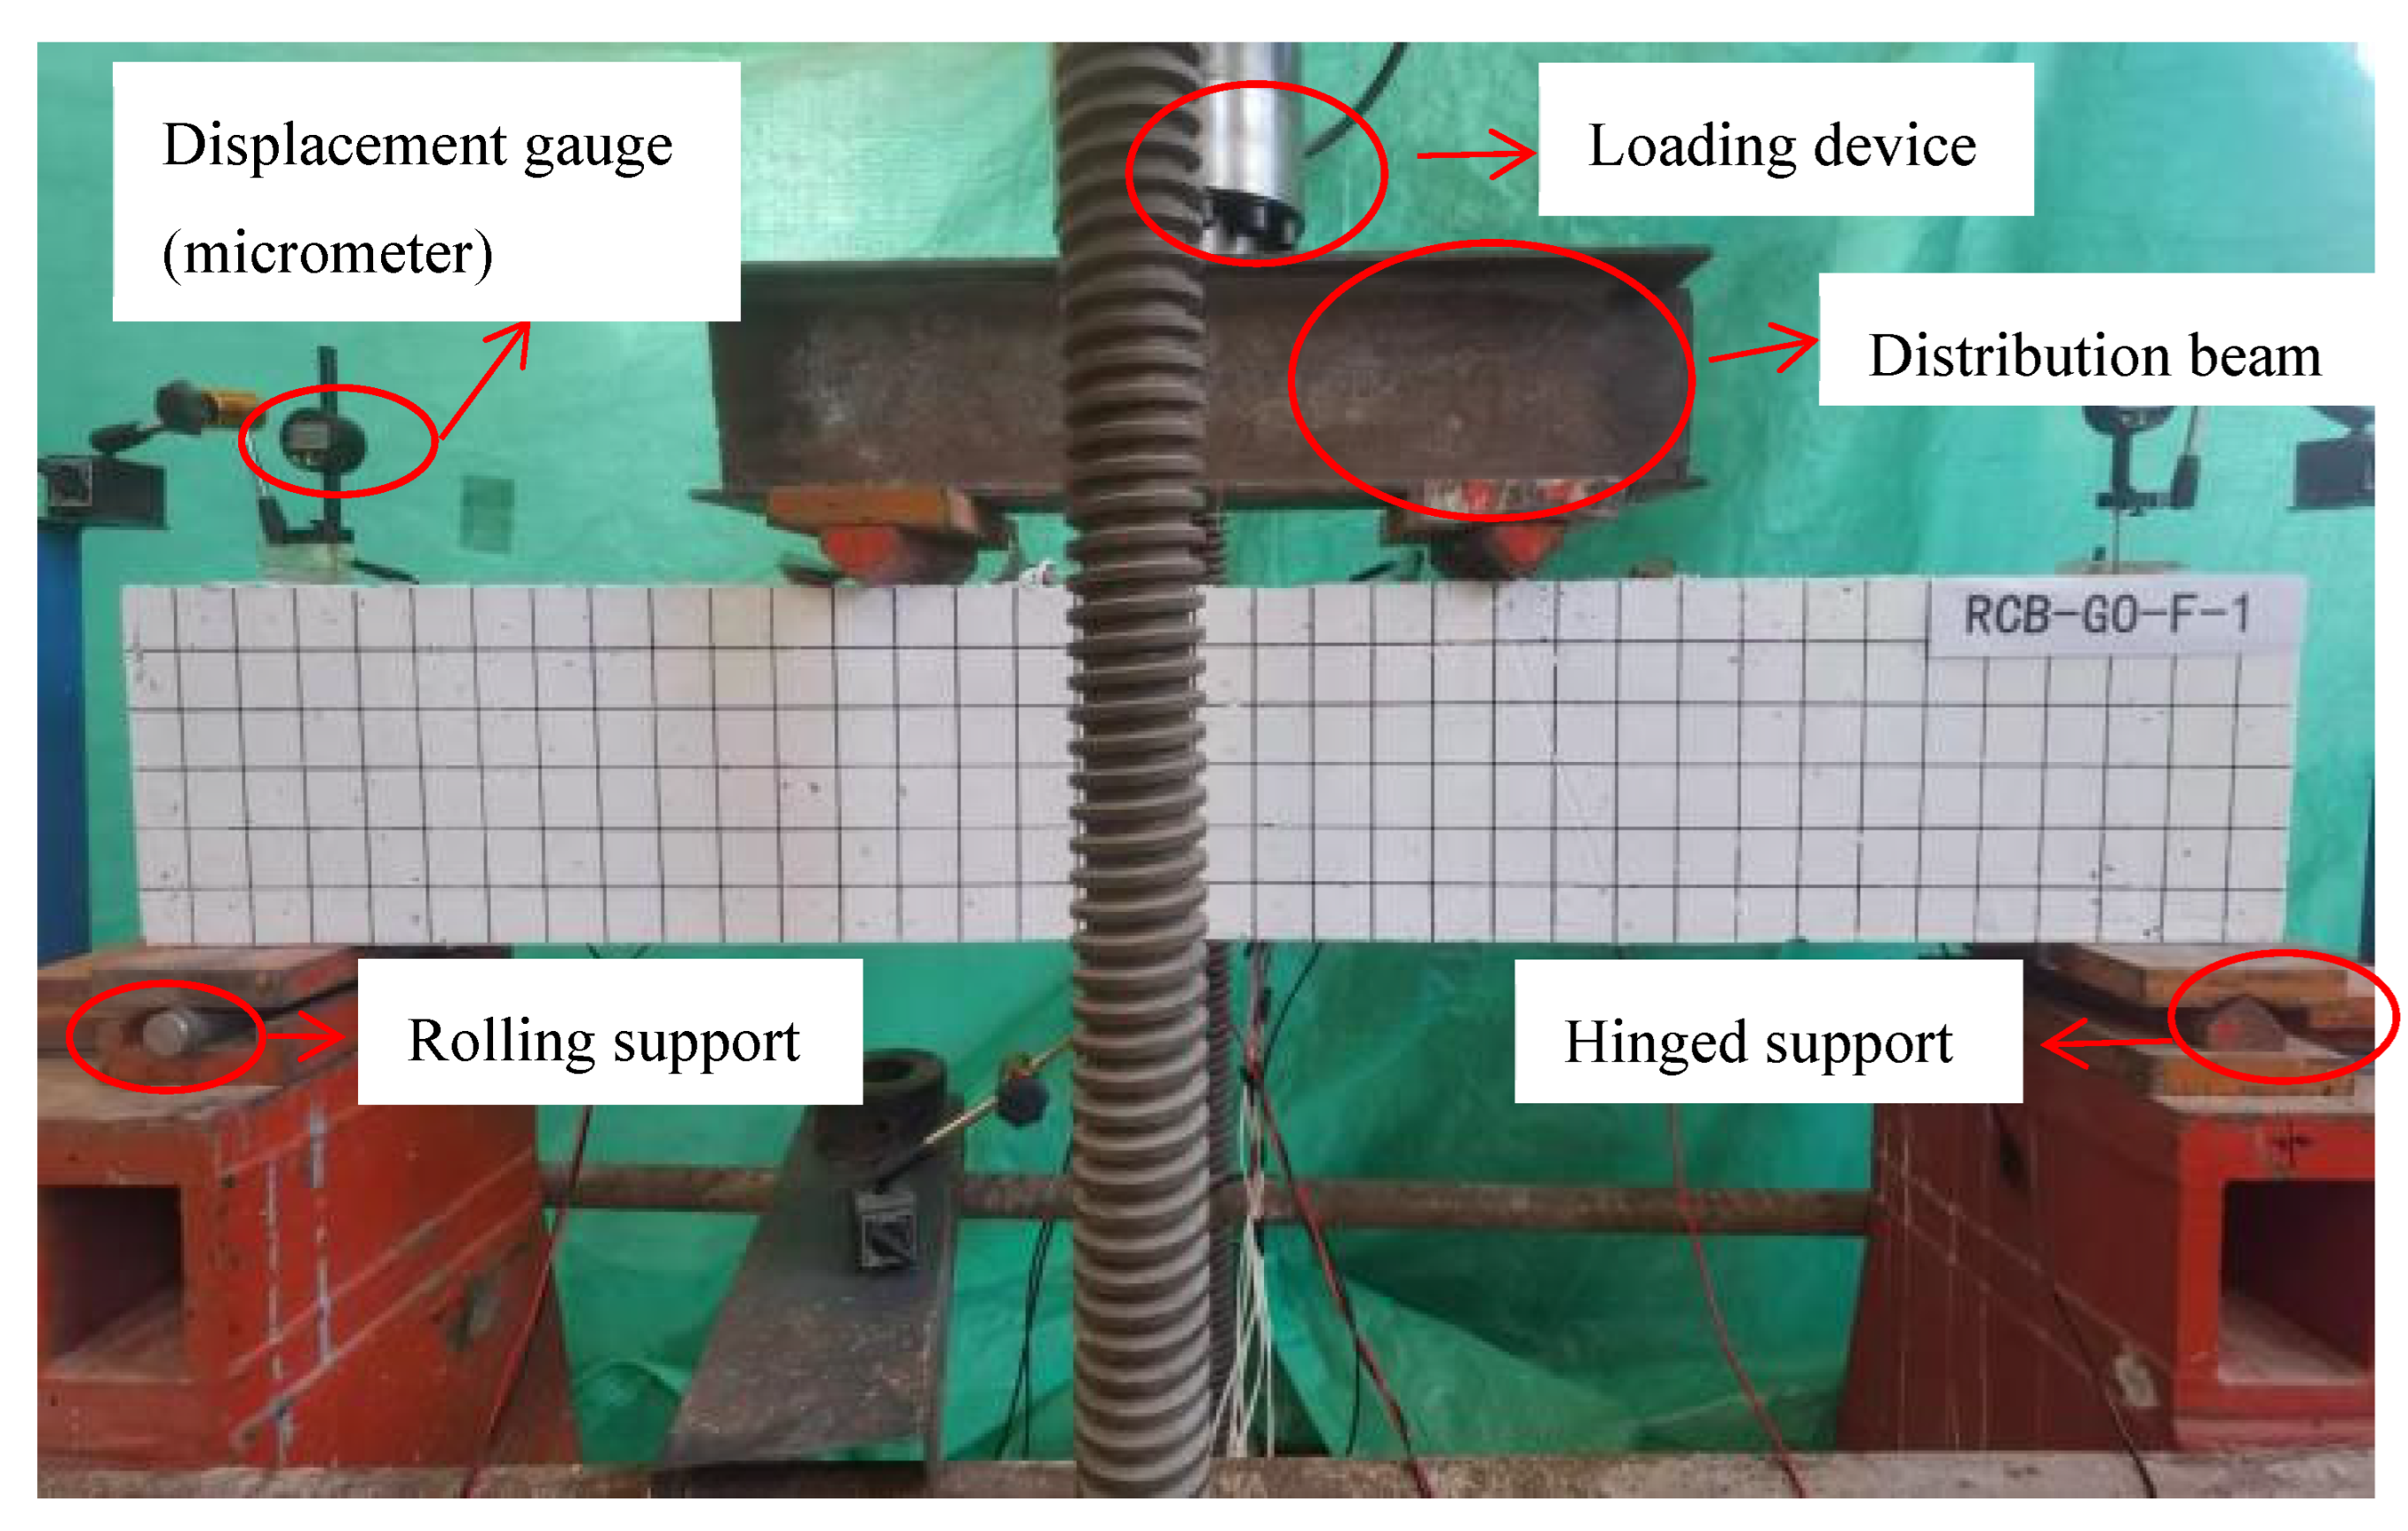
According to the “Standard for Test Methods of Concrete Structures” (GB/T50152-2012) [31], three-point bending tests were performed on the beams. A schematic of the loading setup is shown in Figure 22. The testing employed a laboratory reaction frame and a hydraulic jack loading device, as shown in Figure 23. The loading procedure consisted of two distinct stages:
(1)
Preloading: This stage involved applying load to the test beams up to 50% of the estimated cracking load, performed in two increments. During this stage, the measurement system and the contact interface between the beam and the testing machine were inspected. Once confirmed to be functioning, the load was then reduced to zero.
(2)
Formal loading: This stage utilized a stepwise loading method at a rate of 0.2 kN/s, with data recorded every 5 kN until beam failure occurred.

4.2.2. Measurement Protocol

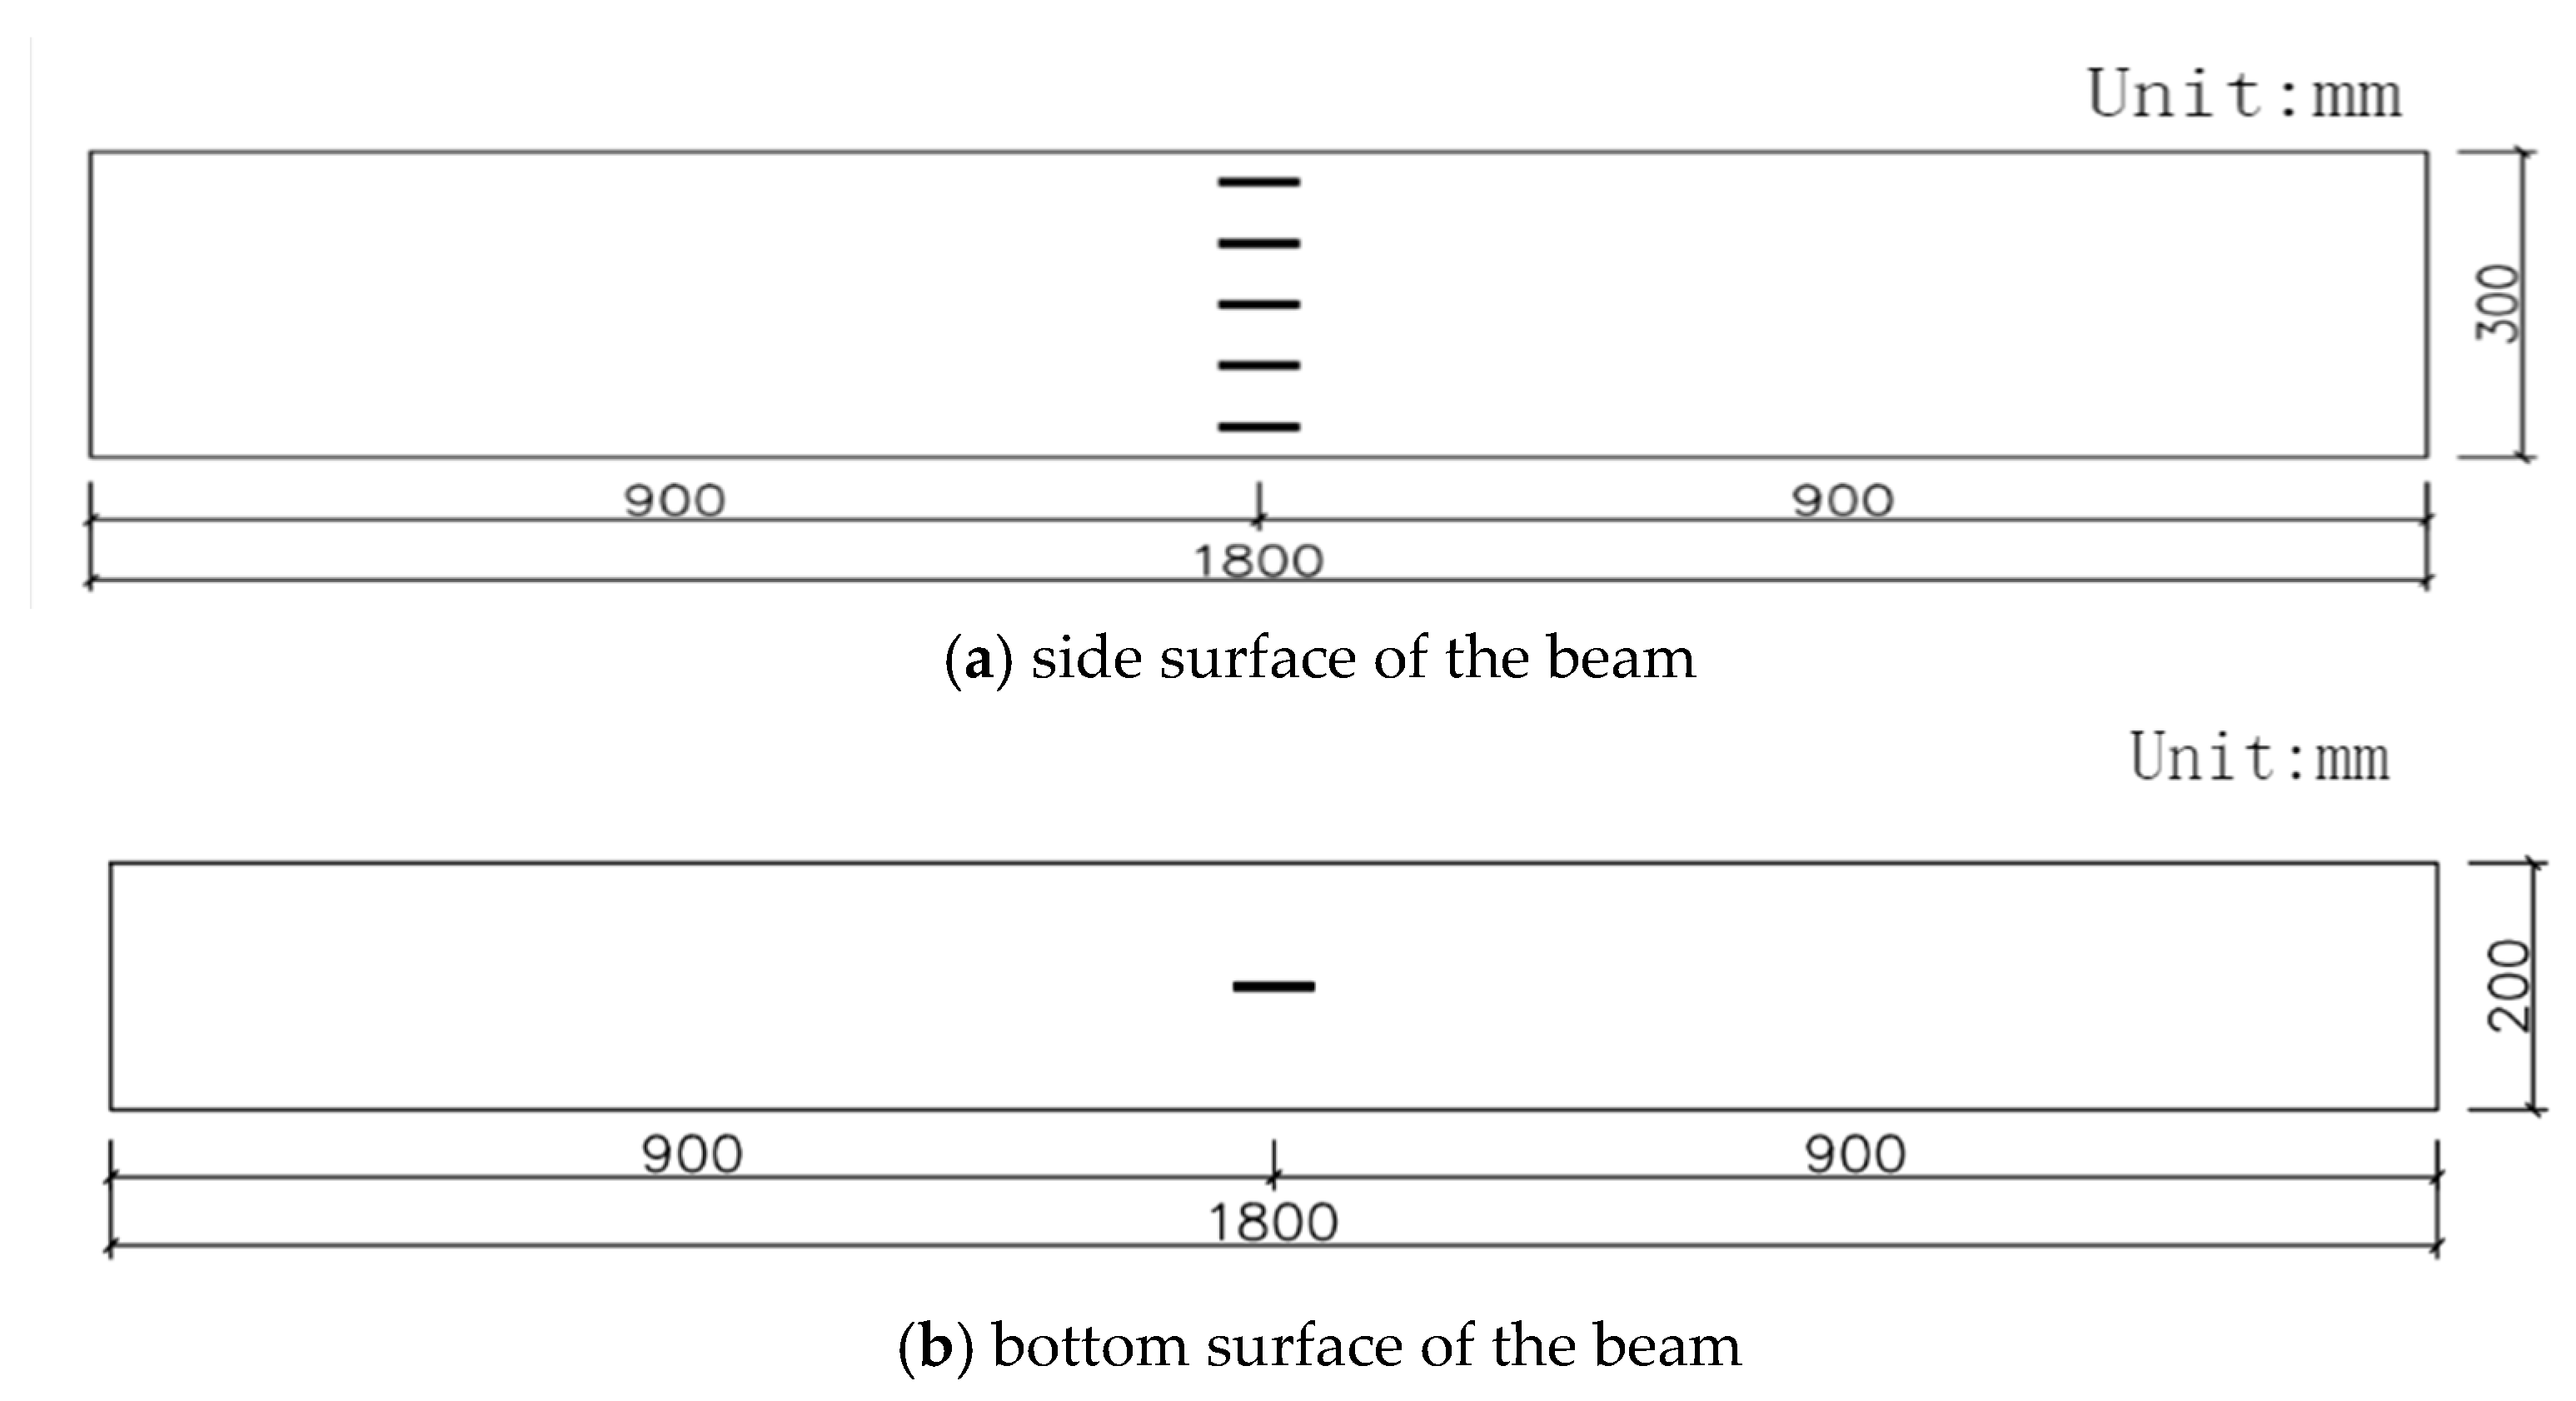
During testing, a Donghua DH3821 dynamic strain signal acquisition system recorded the applied load, steel strain, and concrete strain. Dial indicators were placed at both ends and the midspan of each beam to manually record crack distribution and width. The BF120-3CA(11)-P150-D strain gauges were attached to the midspan of each longitudinal steel bar, aligned along the bar direction, and firmly bonded. For concrete strain measurement, six BF120-100AA(11)-P150-D strain gauges were used: one located at the bottom midspan and five positioned along the mid-height of the side surface at 60-mm intervals. Before installation, the bonding areas were ground flat and cleaned with alcohol. The gauges were affixed using 502 glue and then encapsulated with Kafuter K-704AB adhesive (Kafuter, Huizhou, China). Concrete strain measurements were obtained through the Donghua testing system. Figure 24 and Figure 25 illustrate the setup.

4.3. Flexural Sensing Performance of RCBs

4.3.1. Resistivity Behavior in Bending and Shear Zones

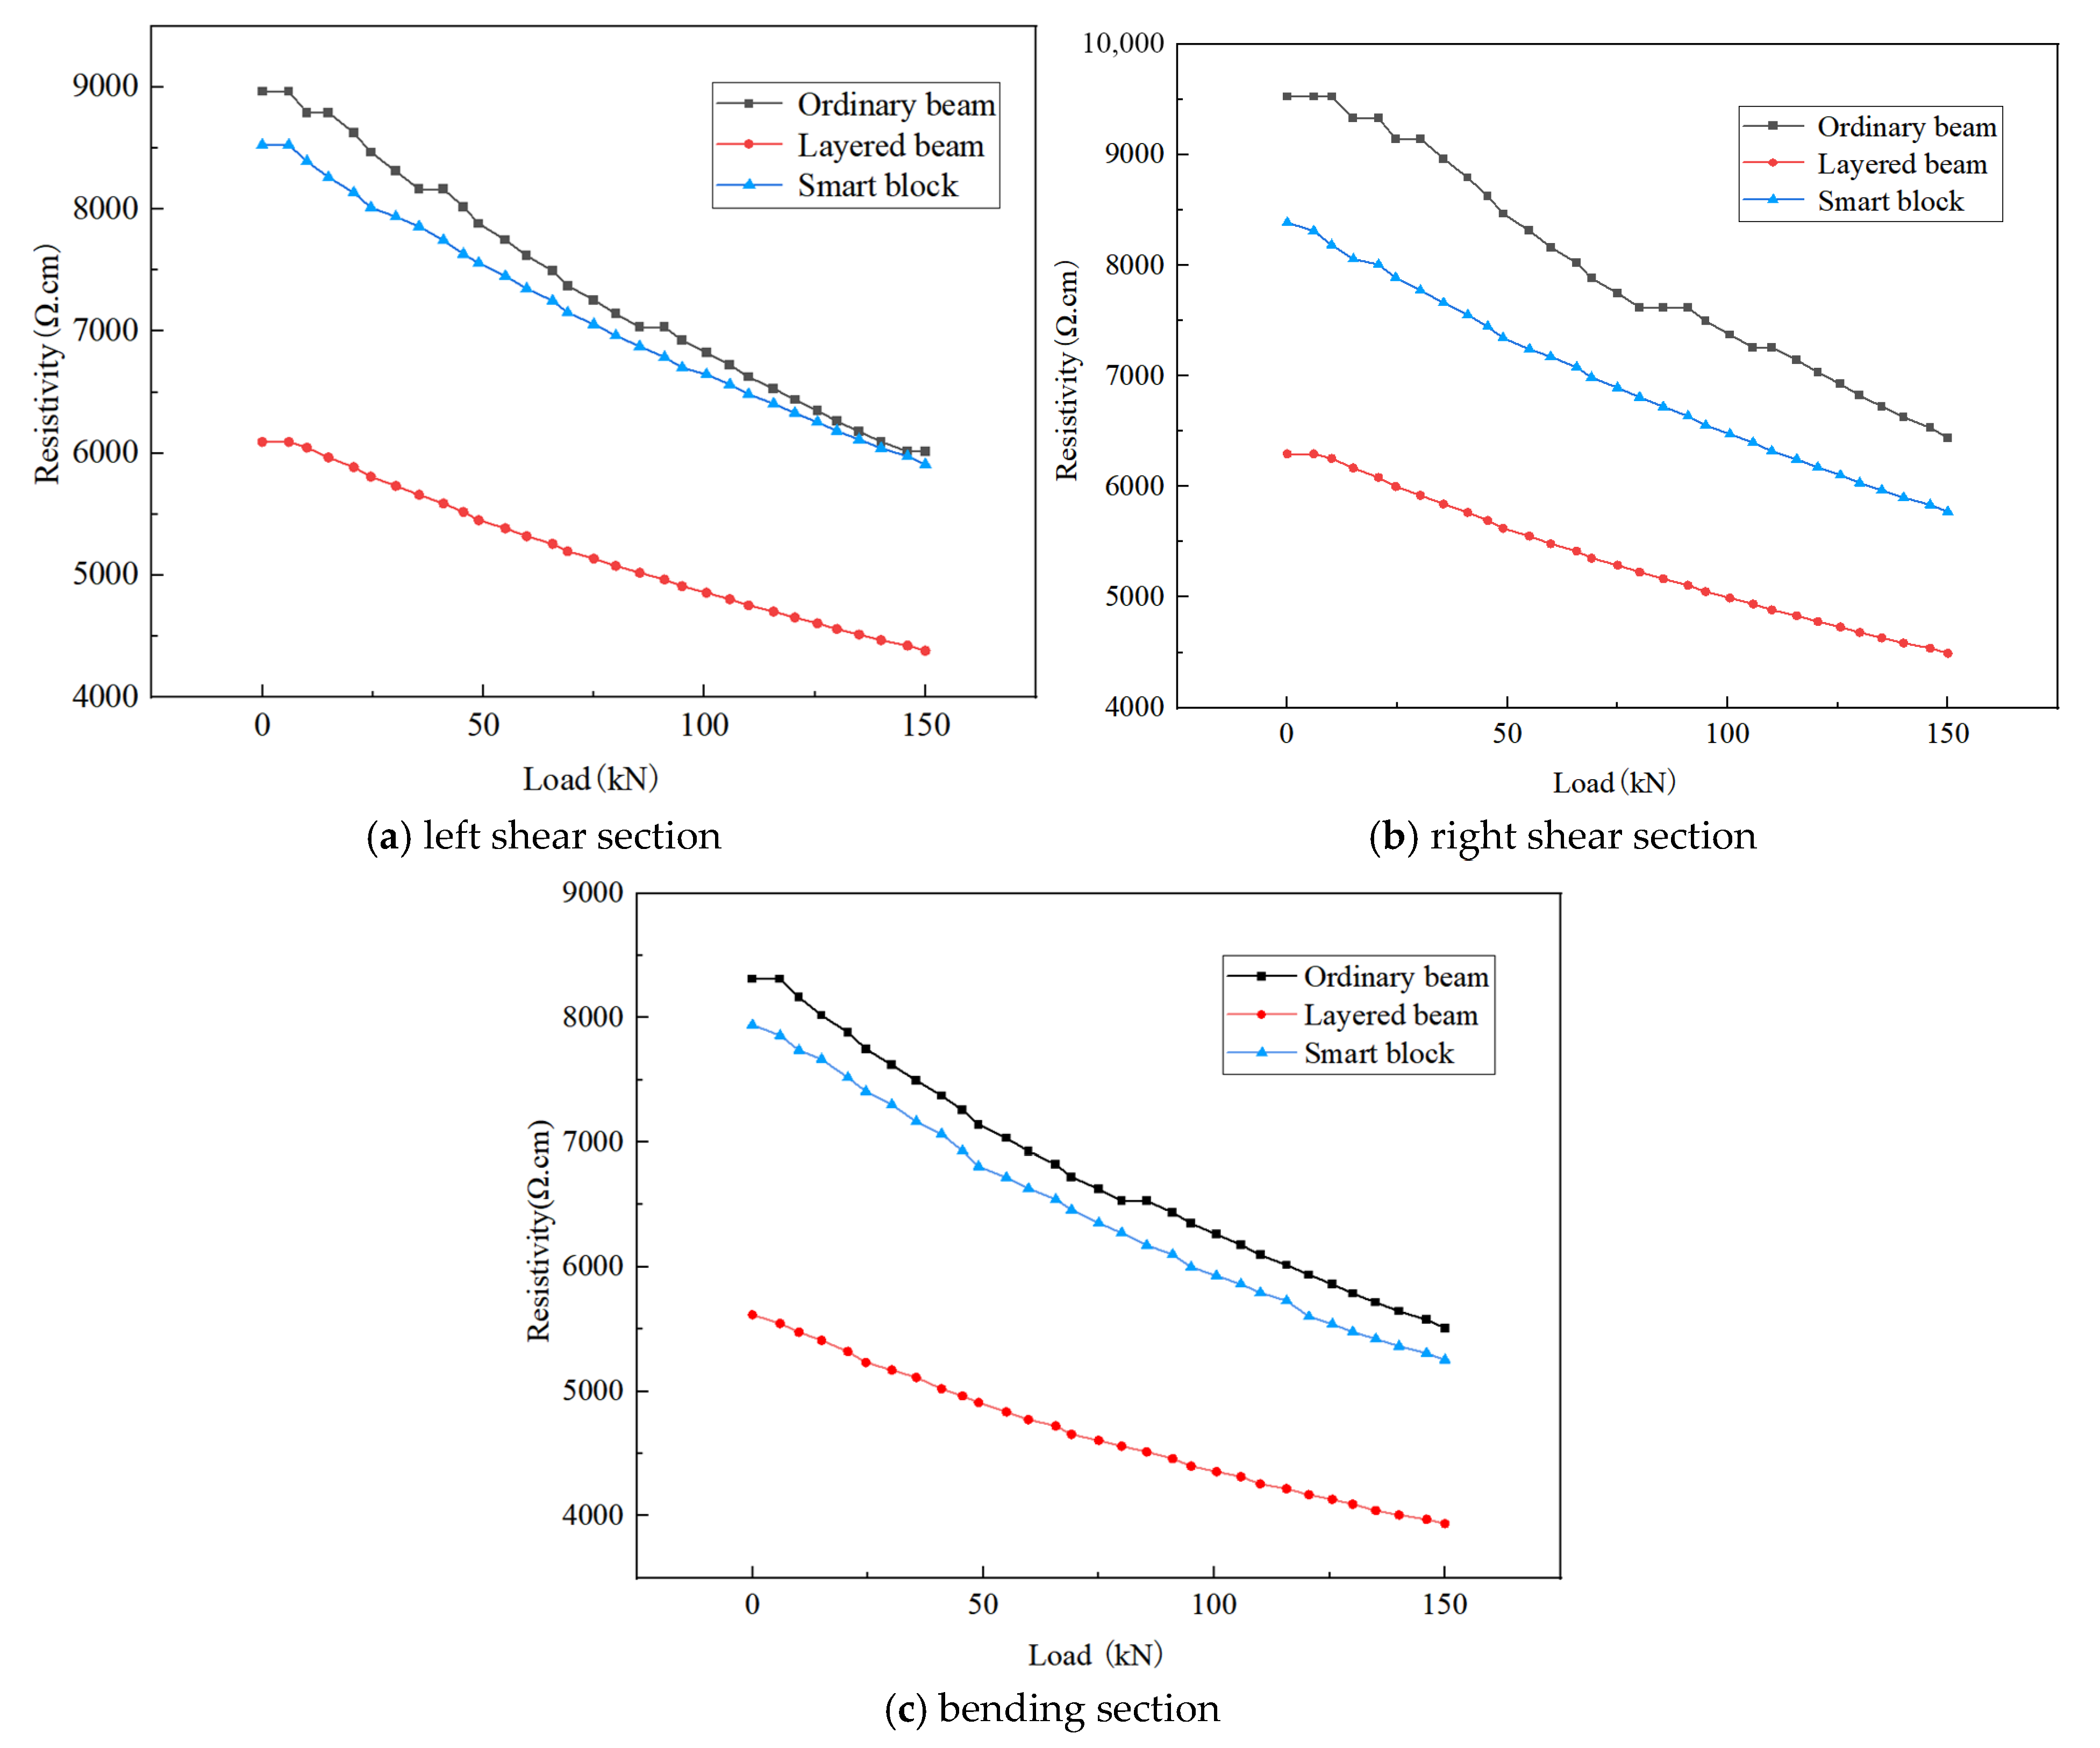
Each test group consisted of three beams, and the average values were adopted for calculating resistance and electrical resistivity. As shown in Figure 26, the load-resistivity curves of the flexural zone and the shear zones at both ends were plotted respectively.
(1)
Left shear zone: The electrical resistivity of the ordinary concrete beam decreased from 8963.59 Ω·cm to 6015.04 Ω·cm, with a decrease of 32.89%. The electrical resistivity of the layered GO-modified beam decreased from 6093.94 Ω·cm to 4381.60 Ω·cm, a decrease of 28.10%. The electrical resistivity of the GO intelligent block beam decreased from 8526 Ω·cm to 5908.61 Ω·cm, a decrease of 30.70%. It shows that the layered GO-modified beam not only has a relatively low initial electrical resistivity but also a smaller overall fluctuation range.
(2)
Right shear zone: The electrical resistivity of the ordinary concrete beam decreased from 9523.81 Ω·cm to 6438.63 Ω·cm, with a decrease of 32.39%. The electrical resistivity of the layered GO-modified beam decreased from 6293.77 Ω·cm to 4492.94 Ω·cm, a decrease of 28.61%. The electrical resistivity of the GO intelligent block beam decreased from 8386.69 Ω·cm to 5771.29 Ω·cm, a decrease of 31.19%. It indicates that the electrical resistivity variation range of the layered GO-modified beam is relatively small.
(3)
Flexural zone: The electrical resistivity of the ordinary concrete beam decreased from 8311.69 Ω·cm to 5507.75 Ω·cm, with a decrease of 33.73%. The electrical resistivity of the layered GO-modified beam decreased from 5614.75 Ω·cm to 3935.29 Ω·cm, a decrease of 29.91%. The electrical resistivity of the GO intelligent block beam decreased from 7942.18 Ω·cm to 5251.45 Ω·cm, a decrease of 33.88%. The layered GO-modified beam exhibited the smallest variation range of electrical resistivity.
Therefore, it is concluded that under load, the resistance and electrical resistivity of concrete beams show a basically linear downward trend. Among them, the layered GO-modified beam has the most significant resistance change and optimal conductive performance, and can effectively reflect internal damage, making it suitable for internal damage monitoring of concrete structures, but its application in practical engineering remains to be investigated. The conductive performance of the GO intelligent block beam is basically equivalent to that of the ordinary concrete beam, but its complex construction process limits its practical engineering application.

4.3.2. Analysis of Load and Relative Resistance Change Magnitude

The resistance and electrical resistivity of each test beam gradually decreased, while the resistance change rate increased with the increase in load, showing a basically linear growth trend. For comparison according to a unified standard, the maximum load value was set to 140 kN when plotting the curves. After the specimen reached the flexural ultimate load, part of the concrete in the compression zone was crushed, and the conductive network was completely destroyed. At this point, the current reading became zero, and the resistance and electrical resistivity tended to be infinite.

4.3.3. Analysis of Midspan Deflection and Relative Resistance Change Magnitude

With the increase in flexural angle, the resistance values of the nine reinforced concrete beams (RCBs) showed a decreasing trend, while the relative resistance change range increased significantly. Before reaching the ultimate flexural load, the relative resistance change range of each specimen fluctuated between −31.25% and −32.95%. Due to its lower initial resistance, the layered graphene oxide (GO)-modified beam exhibited the smallest relative resistance change range. Overall, the layered GO-modified beam exhibited superior conductive performance compared to the other specimens.

4.3.4. Correlation Between Midspan Deflection and Relative Resistance Change Magnitude

When the under-reinforced concrete beam is subjected to load, the resistance change rate shows a good regularity. Fitting the deflection-resistance change rate curve yields a univariate quadratic equation, which is expressed as Equation (5):
y = a x 2 + b x + c
In the equation, y denotes the resistance change rate, a represents the opening direction of the curve, b is the axis of symmetry of the curve, and c stands for the intercept of the curve on the vertical axis. The relevant parameters of each fitted curve are presented in Table 7 below. The correlation coefficients of all regression equations are higher than 0.93, and the research results are consistent with those reported in the literature [3]. This fitted curve can best reflect the variation of the resistance change rate as well as the deformation and damage of concrete.
It can be seen from the data in Table 7 that the concrete beams prepared with GO in a layered manner achieved the best fitting results, and the correlation coefficient of its regression equation was closest to 1, indicating that the layered GO concrete beam had the optimal flexural sensitivity performance. For the three fitted univariate quadratic equations of the layered GO concrete beam, the average values of the a, b, and c parameters can also be calculated to obtain a new univariate quadratic equation, which is expressed as Equation (6):
y = 0.7398 x 2 9.6025 x + 2.484
The aforementioned expression can fully indicate the relationship between the deflection and resistance change rate of the layered GO concrete beam, and this fitting equation is the most prominent in reflecting the variation of the resistance change rate as well as the deformation and damage of concrete.

4.4. Mechanical Properties of RCB

According to the test results, the cracking load and ultimate load of each test beam, as well as the average value of cracking load and ultimate load of each group of three test beams, are listed. The specific values are shown in Table 8.
The table reveals that the crack load and ultimate load of all test beams show minimal variation. The average crack load values across all groups are nearly identical to the average ultimate load values, with crack loads consistently stabilizing at 50 kN or 55 kN while ultimate loads fluctuate around 160 kN. A key factor contributing to the lack of significant improvement in ultimate load capacity is the GO layer being positioned in the upper half of the test beam rather than the tension zone. Consequently, the GO-reinforced concrete beams demonstrate limited impact on their flexural performance.

5. Finite Element Simulation Analysis of RCBS

Numerical methods, particularly the finite element method, are widely employed in civil engineering structural analysis due to their robust analytical and problem-solving capabilities. COMSOL Multiphysics software serves as a multiphysics simulation platform that integrates mechanical and electrical modules, offering a comprehensive environment for constructing and coupling multiphysics models. Utilizing the finite element method, COMSOL delivers high-precision simulation results that satisfy experimental modeling requirements. By comparing simulated stress distributions with experimental data, the applicability of the model can be verified. In addition, the software enables simulation of the distribution of electrical potential and current pathways. These findings may contribute significantly to advancing conductive theory applications in concrete structural health monitoring.

5.1. Construction of Finite Element Models

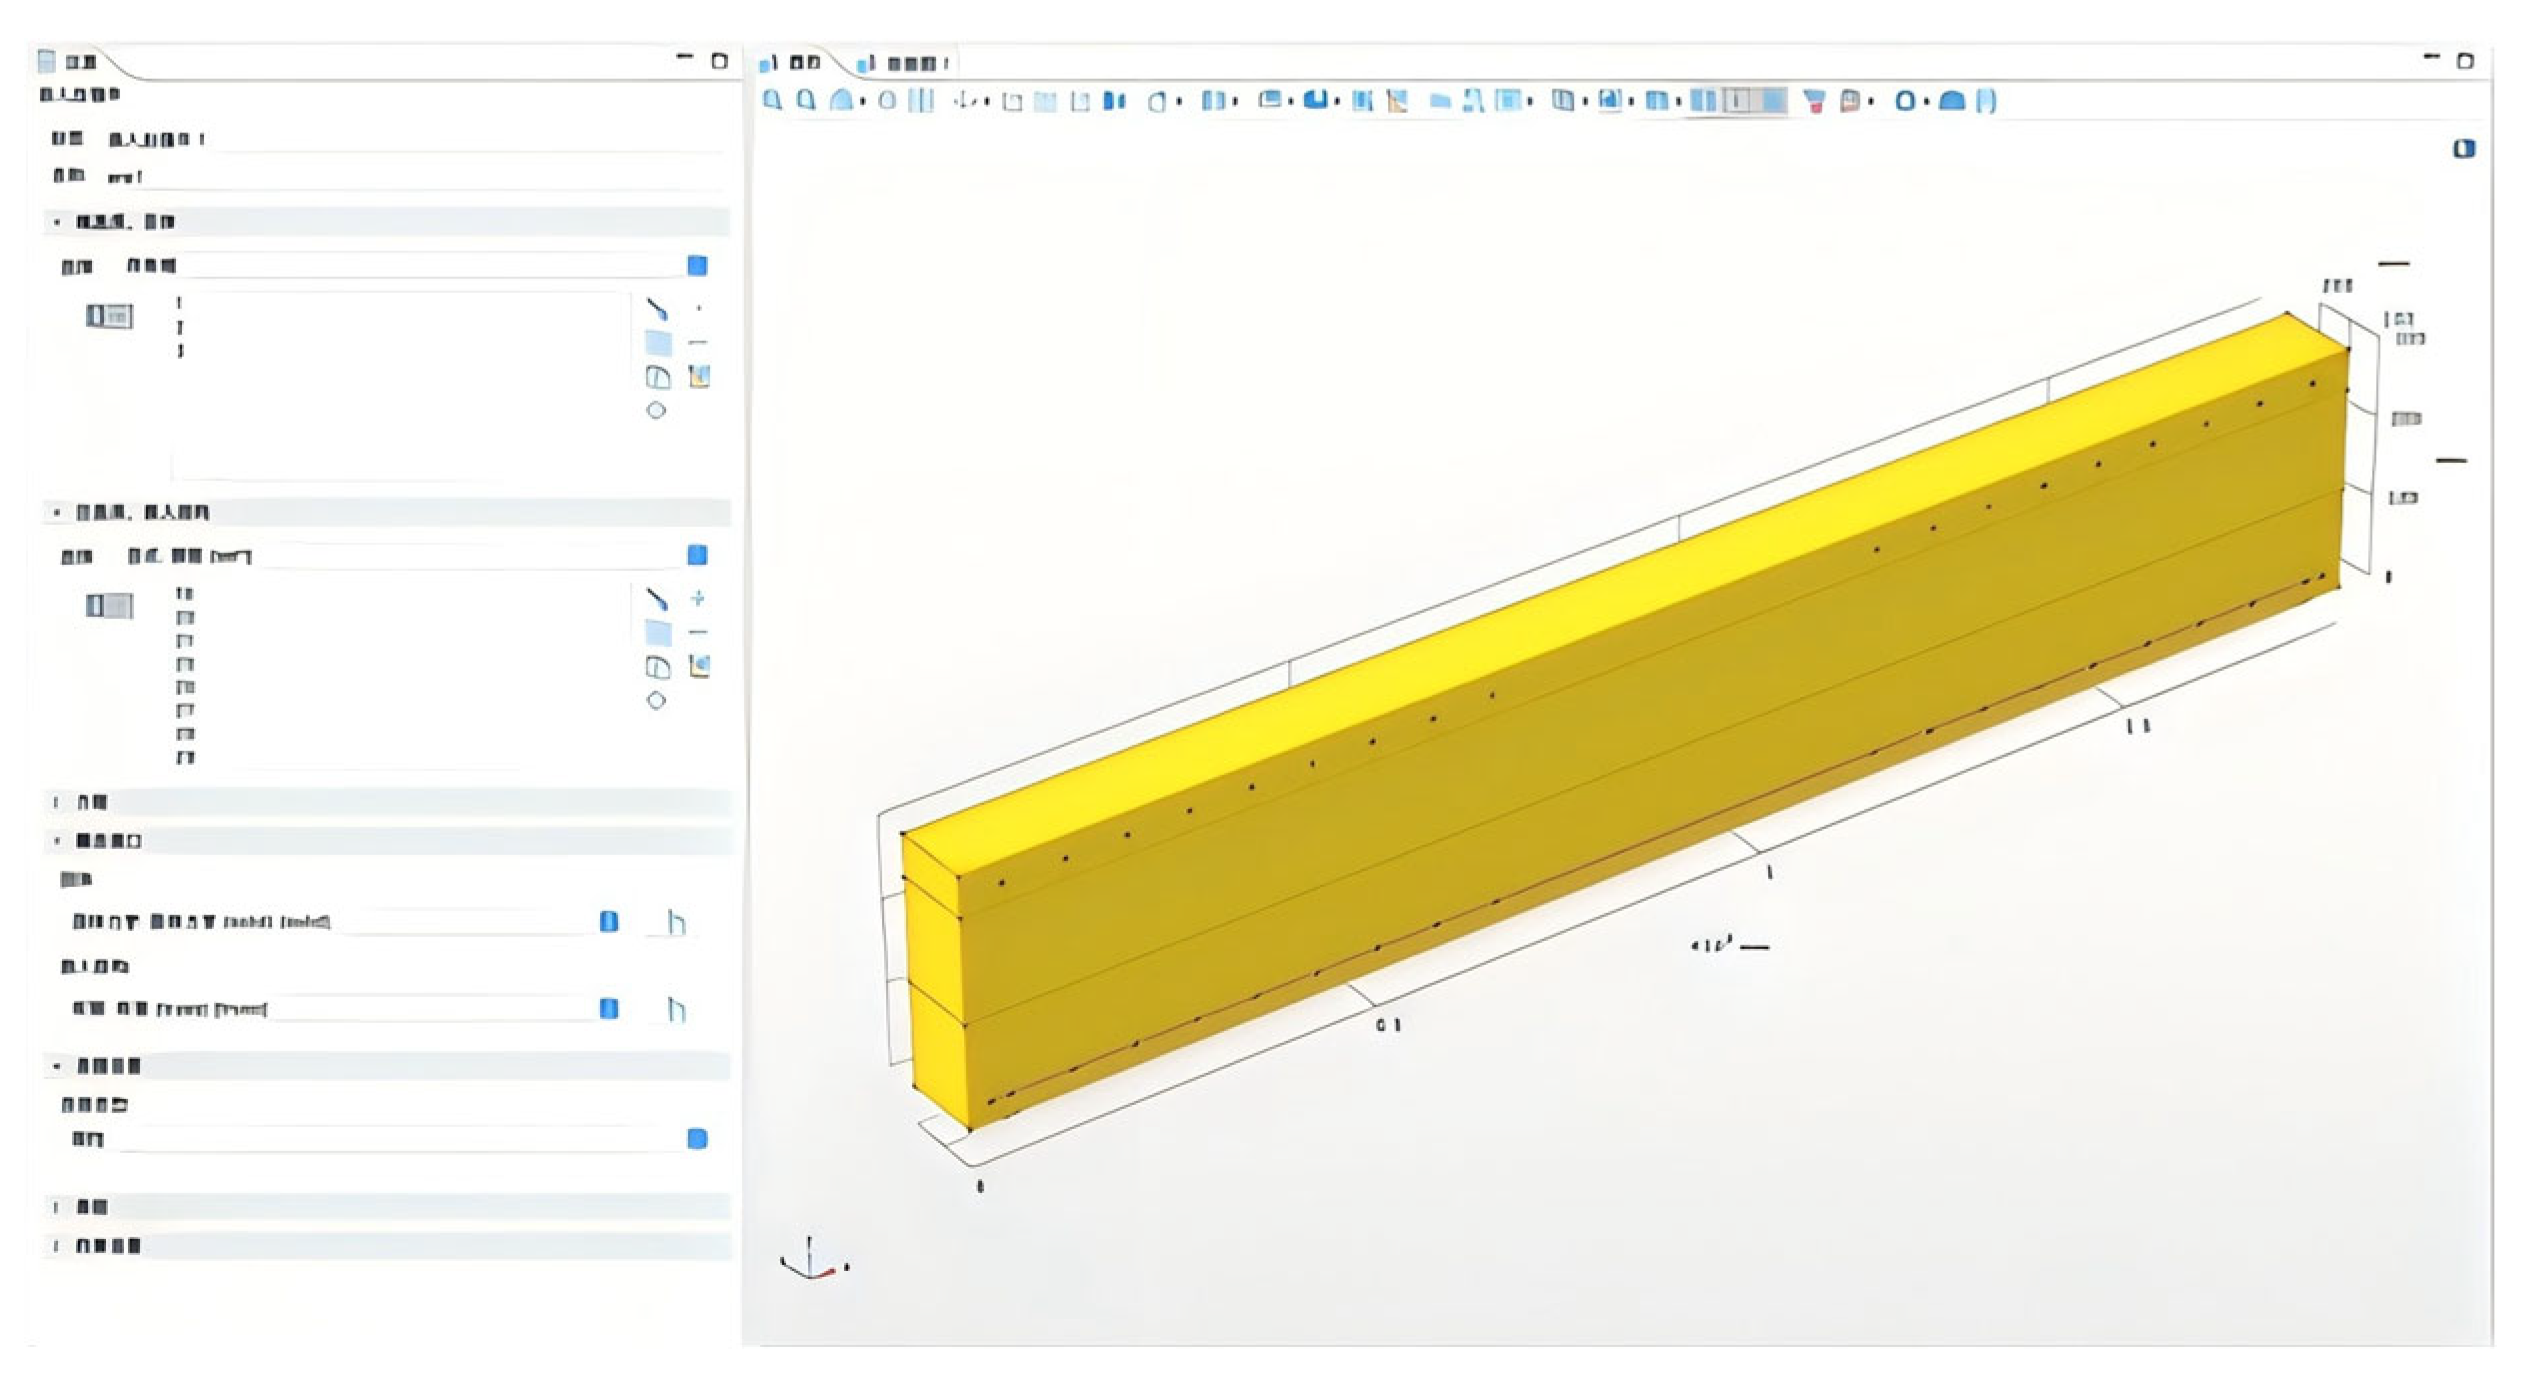
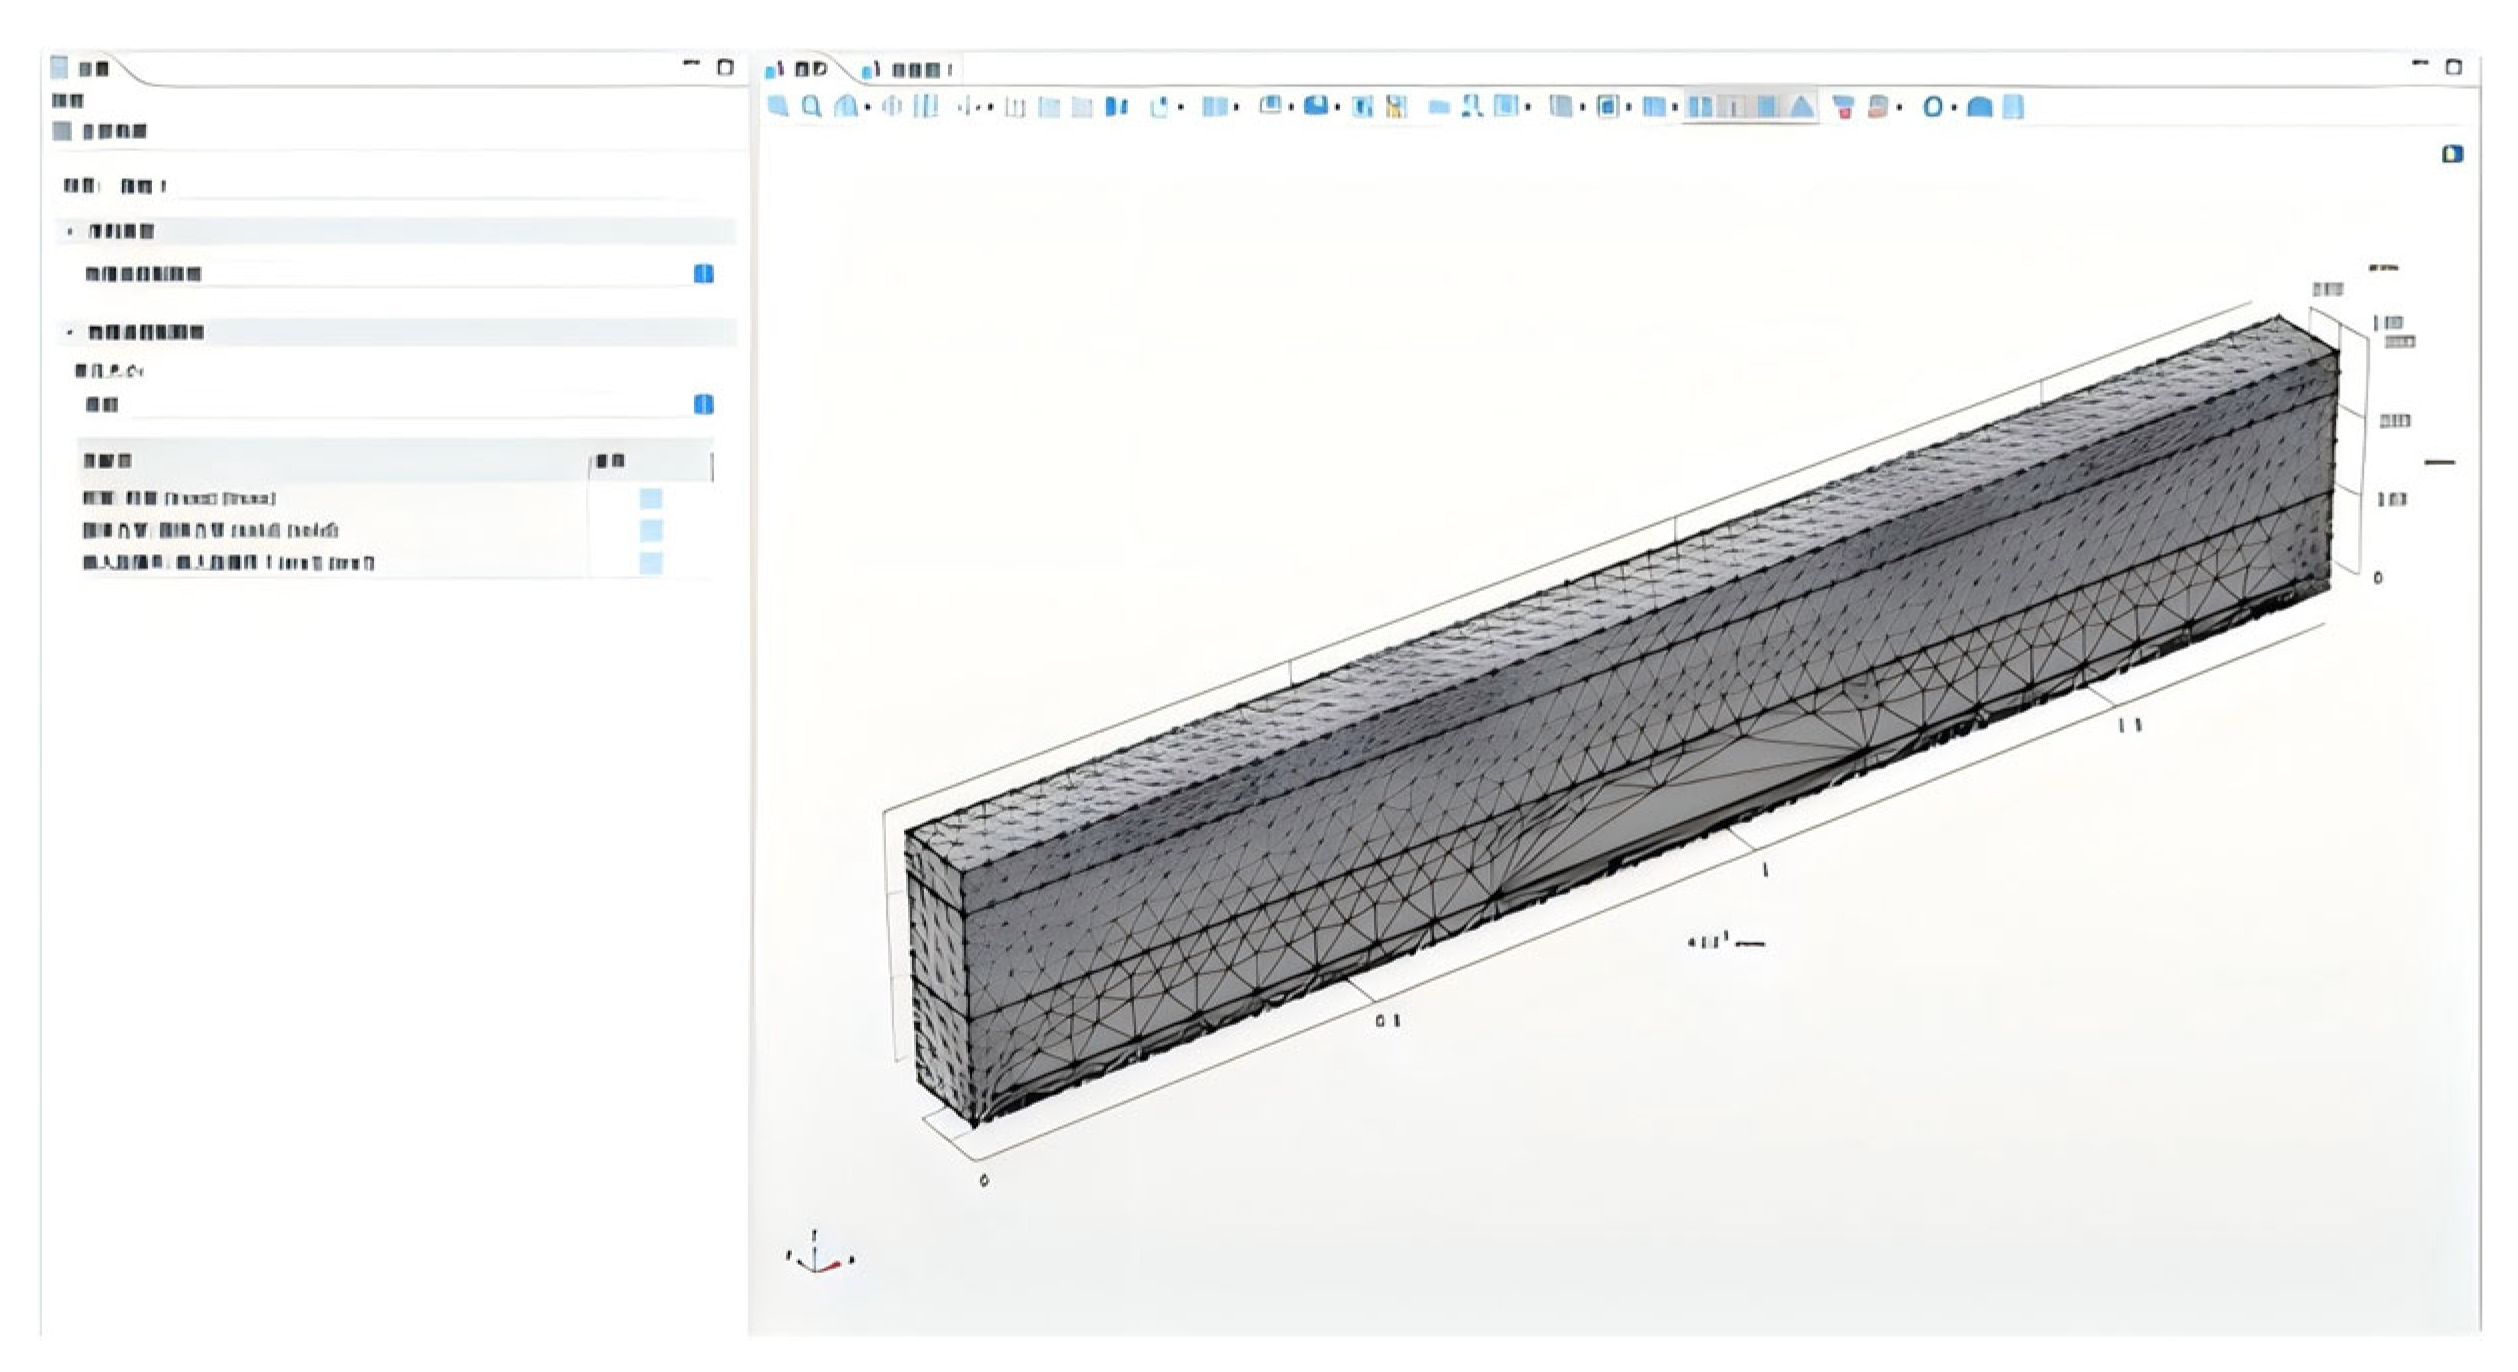
Three-dimensional modeling and analysis were performed for three types of beams (ordinary concrete beams, layered GO-modified beams, and GO intelligent block beams) using the Solid Mechanics and Electric Field modules in COMSOL Multiphysics software. One corresponding beam was modeled for each group. The compressive strengths of concrete were set as follows: 30 MPa for ordinary concrete beams; 35 MPa for the upper layer and 30 MPa for the lower layer of layered GO-modified beams; 35 MPa for the intelligent block section and 30 MPa for the remaining areas of GO intelligent block beams. Simply supported constraints were applied on the boundaries (restricting the vertical displacement at both ends, with additional fixed longitudinal displacement on one side). The measured current was applied at the electrical terminal, the output terminal was grounded, and zero charge was set on the other surfaces. A free tetrahedral mesh was adopted for the entire domain (maximum size: 8 mm), with local refinement to 2 mm for the GO layers and intelligent blocks. Quadratic Lagrangian elements were selected to reduce the risk of shear locking. All interfaces were treated as perfect bonding, and the cohesive zone model can be used to correct the slip effect if necessary. By inputting the experimentally measured current values into the model, the variation law of current line distribution was observed. The corresponding geometric models and simulation models are shown in Figure 27 and Figure 28, respectively.
The finite element model has the following potential errors and limitations: first, simplifying the randomly distributed flaky GO layers into isotropic continuous layers may underestimate the local resistance; second, assuming perfect interface bonding, while the actual existing transition zones and local microcracks will increase the contact resistance by 5–8%; third, the nonlinear influence of temperature and humidity on conductivity is not considered, which is inconsistent with the experimental environment; fourth, although refining the mesh to 1 mm only causes a 0.7% change in deflection, the calculation time increases significantly, so the local refinement scheme of 2 mm was comprehensively selected.

5.2. Validation of Simulation Models

The simulated and experimental values of the ultimate load for each test beam are shown in Table 9, ANOVA analysis is as shown in Table 10. The one-way ANOVA results (p = 0.466 > 0.05) indicate no statistically significant difference in the mean ultimate load among the three specimen groups: RGB-PT, RGB-GO-F, and RGB-GO-Z. This finding confirms the reliability of the experimental data as a consistent baseline for model validation. The simulated values show exceptional agreement with the experimental results, with all errors remaining below 4%, which strongly validates the predictive accuracy of the proposed model.

5.3. Simulation Results Theory Coupling Analysis

It can be inferred from the volume resistivity formula (4) in Chapter 2 that there are three factors affecting the change in resistivity, namely the specimen resistance, the specimen cross-sectional area, and the electrode spacing. When a certain load is reached, microcracks appear in the specimen, the cross-sectional area of the specimen decreases, and the increase in mid-span deflection lengthens the distance between the copper mesh electrodes, thereby leading to an increase in the volume resistivity of the specimen. The following analysis will focus on the change in specimen resistance during the cracking process. By combining and analyzing the experimental results with the theory, the main reason is that the change in the specimen shape causes the resistance change of the under-reinforced concrete beam, while the microstructural changes of the specimen during the loading process have little effect on the resistance. Based on the above analysis, the shape change of the under-reinforced concrete beam is the main factor affecting its resistance change. Therefore, the work in this section will simulate the potential and current line distribution in the specimen to explore the flow direction and trend of the current in the specimen.
COMSOL Multiphysics software was used to perform finite element simulation analysis of potential and current lines, so as to better elaborate the above theory. The finite element analysis results of the potential and current lines of the under-reinforced concrete beam are shown in Figure 29.
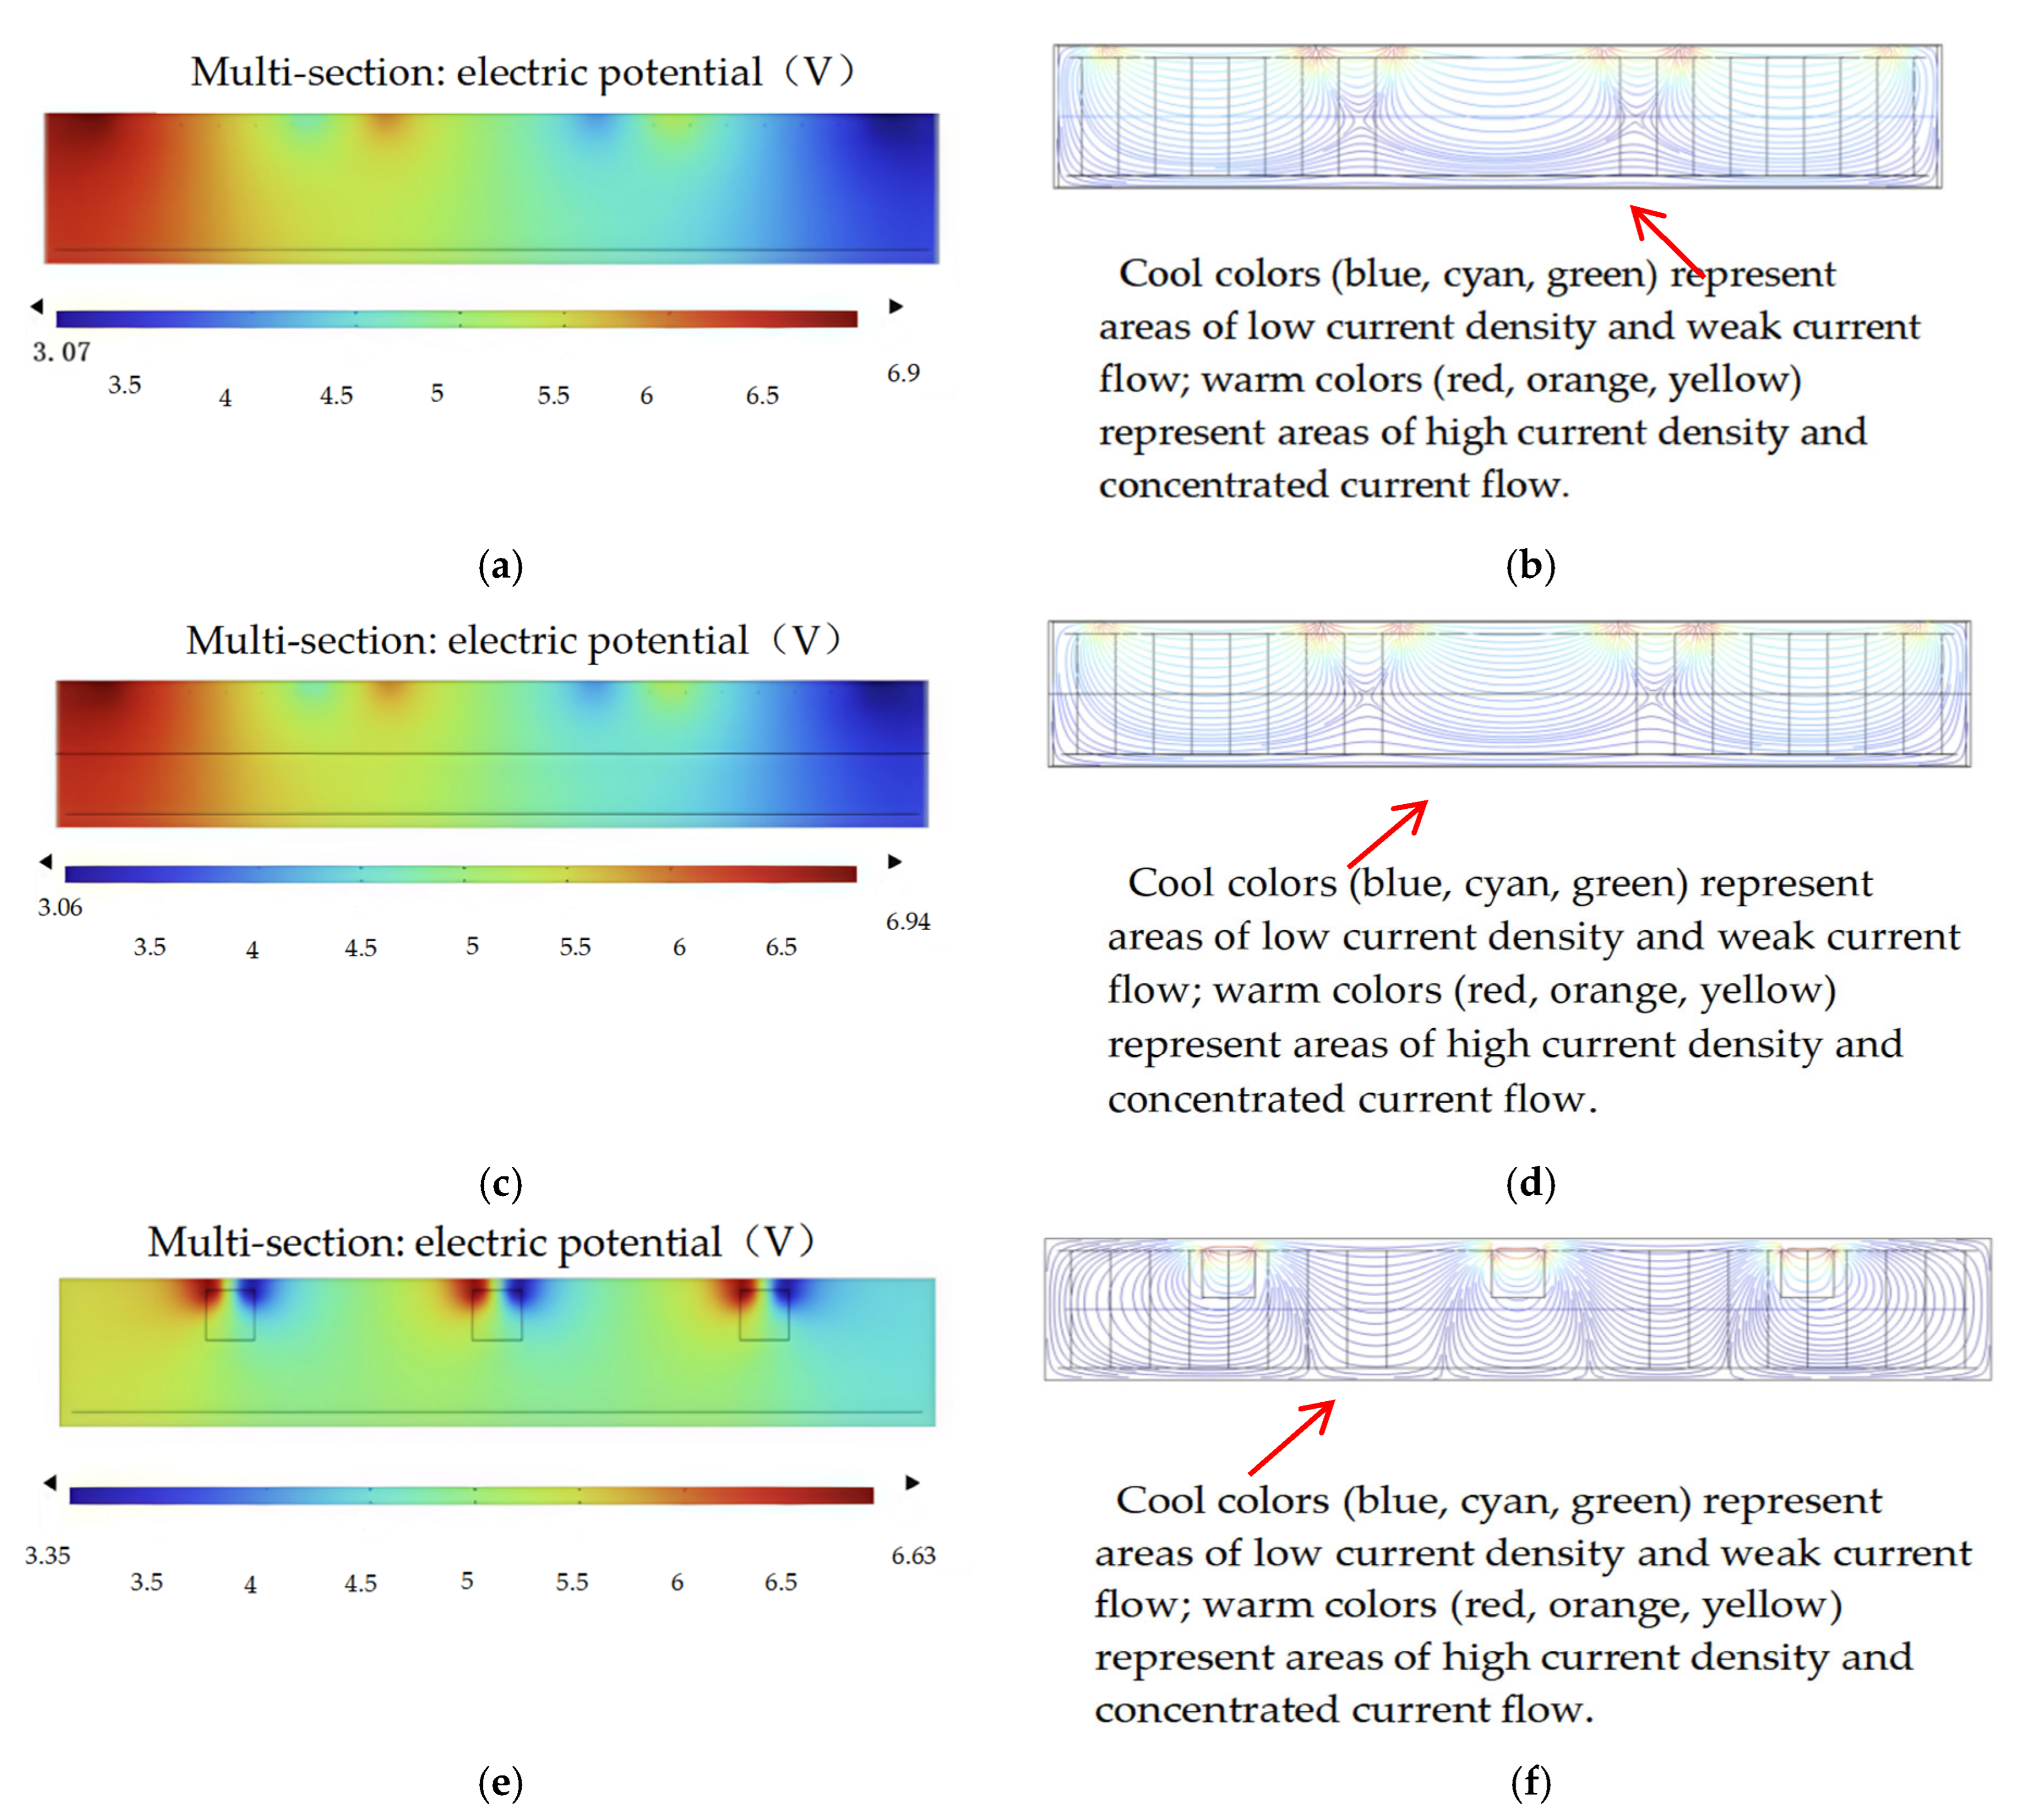
The concentrated warm and cold color regions in the figures correspond to the positions of the electrodes, i.e., the six electrodes for each test beam. Figure 29a,c,e are the potential contour maps of the beam members along the length direction. The potential gradually decreases from the warm color region to the cold color region, with the darkest red and blue regions representing the maximum and minimum potential points, respectively. The curves in Figure 29b,d,f show the development trend of current lines. It can be observed that although the applied potential is located at three positions (left, middle, and right) on the top of the specimen, current is distributed in all parts of the beam member. The current lines are relatively dense between the two electrodes, resulting in a larger current; as the current lines gradually become sparse along the height direction of the beam member, the current intensity decreases progressively. Figure 29b,d,f also show the current lines when there are no cracks in the specimen. It can be seen from the figures that the current lines gradually become sparse from the top surface to the bottom surface of the specimen. This phenomenon indicates that as the current travels along the length, the resistance is positively correlated with the height—with the increase in height, the resistance gradually increases. By comparing Figure 29b,d, the current lines of the GO layered beam are denser than those of the ordinary concrete beam. Therefore, it can be concluded that the resistance of the GO layered beam is lower than that of the ordinary concrete beam.
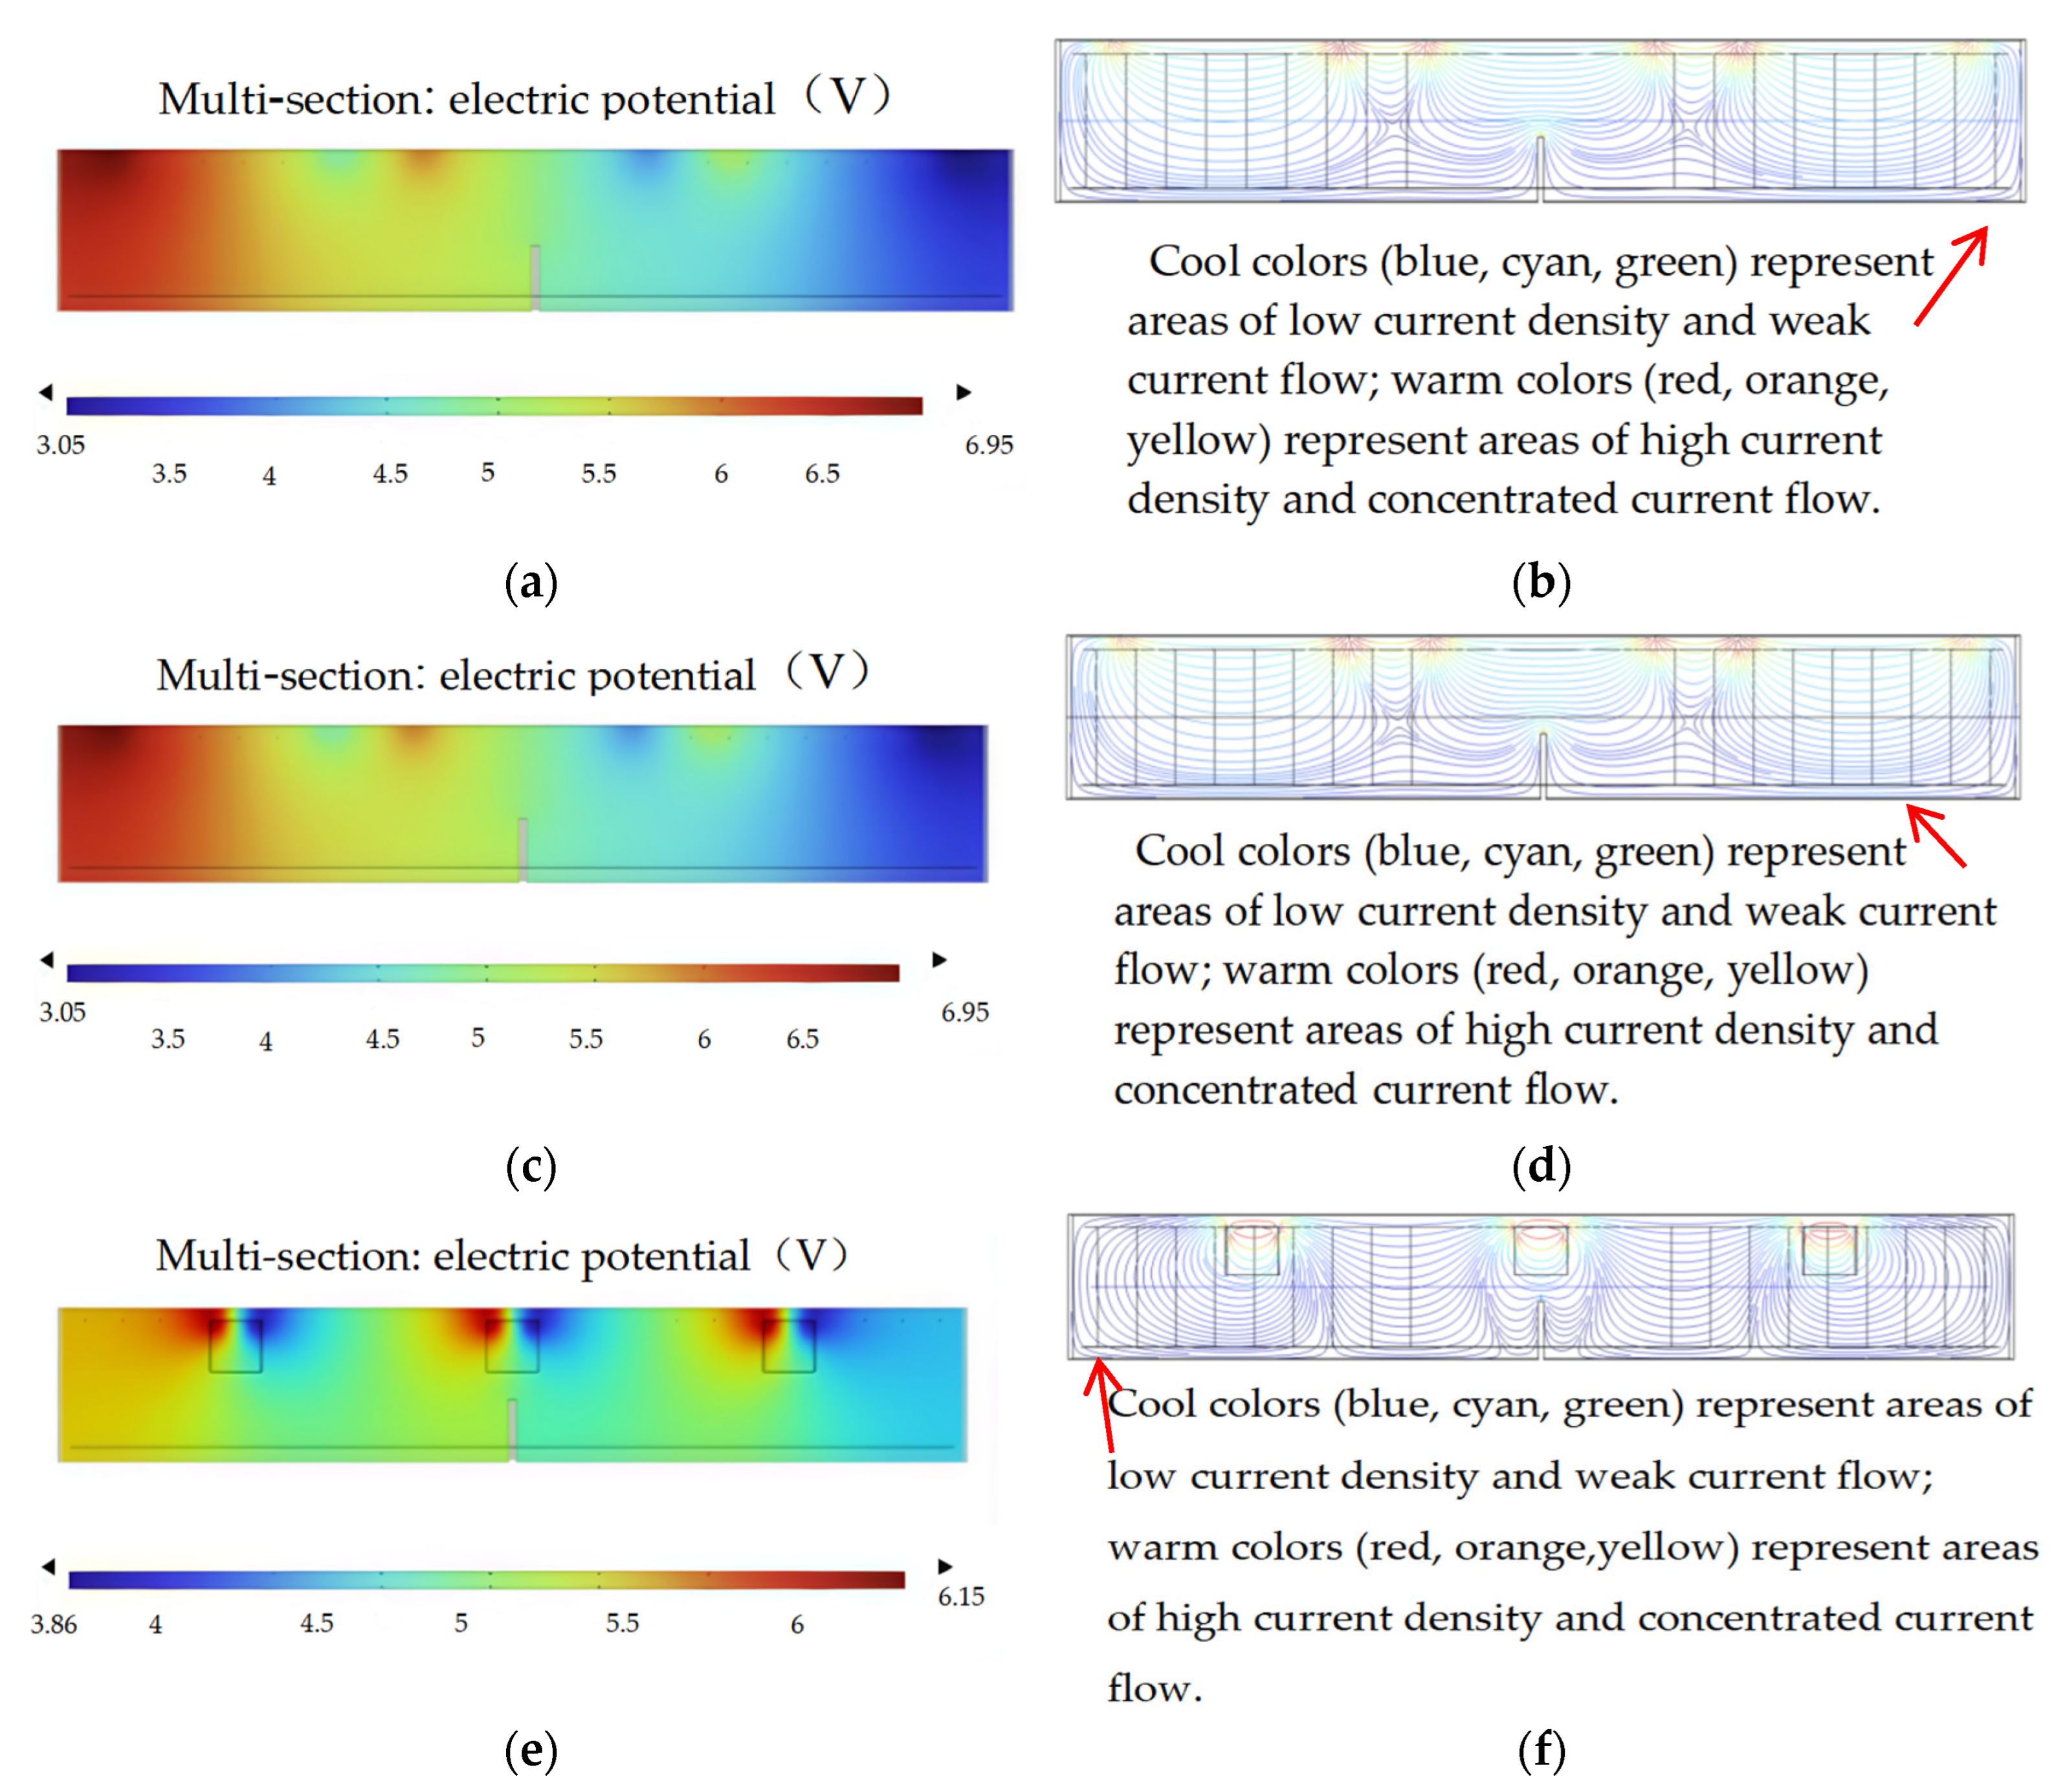
It can be seen from Figure 30 above that the current lines between the cracks are cut off due to the generation of cracks. To form a path, the current in the lower part will bypass the cracks and pass through the upper part of the cracks, resulting in the extension of the current path, the densification of current lines, an increase in resistance at the cracks, and thus an increase in the resistance of the beam member.
After the specimen cracks, the deflection gradually increases with the continuous increase in load, the cracks further extend, and the crack width gradually widens, causing the continuous upward movement of the crack tips and the continuous cutting of current lines. For the current in the lower part to flow from the positive electrode to the negative electrode, the length of the current path must be increased to form a circuit. It can be further concluded that the crack height has a greater impact on the resistance of the GO conductive concrete specimen. When the member undergoes normal section failure, all current lines will be cut off, the resistance at the crack position tends to be infinite, and the conductive network of the beam member is destroyed, resulting in an open circuit.
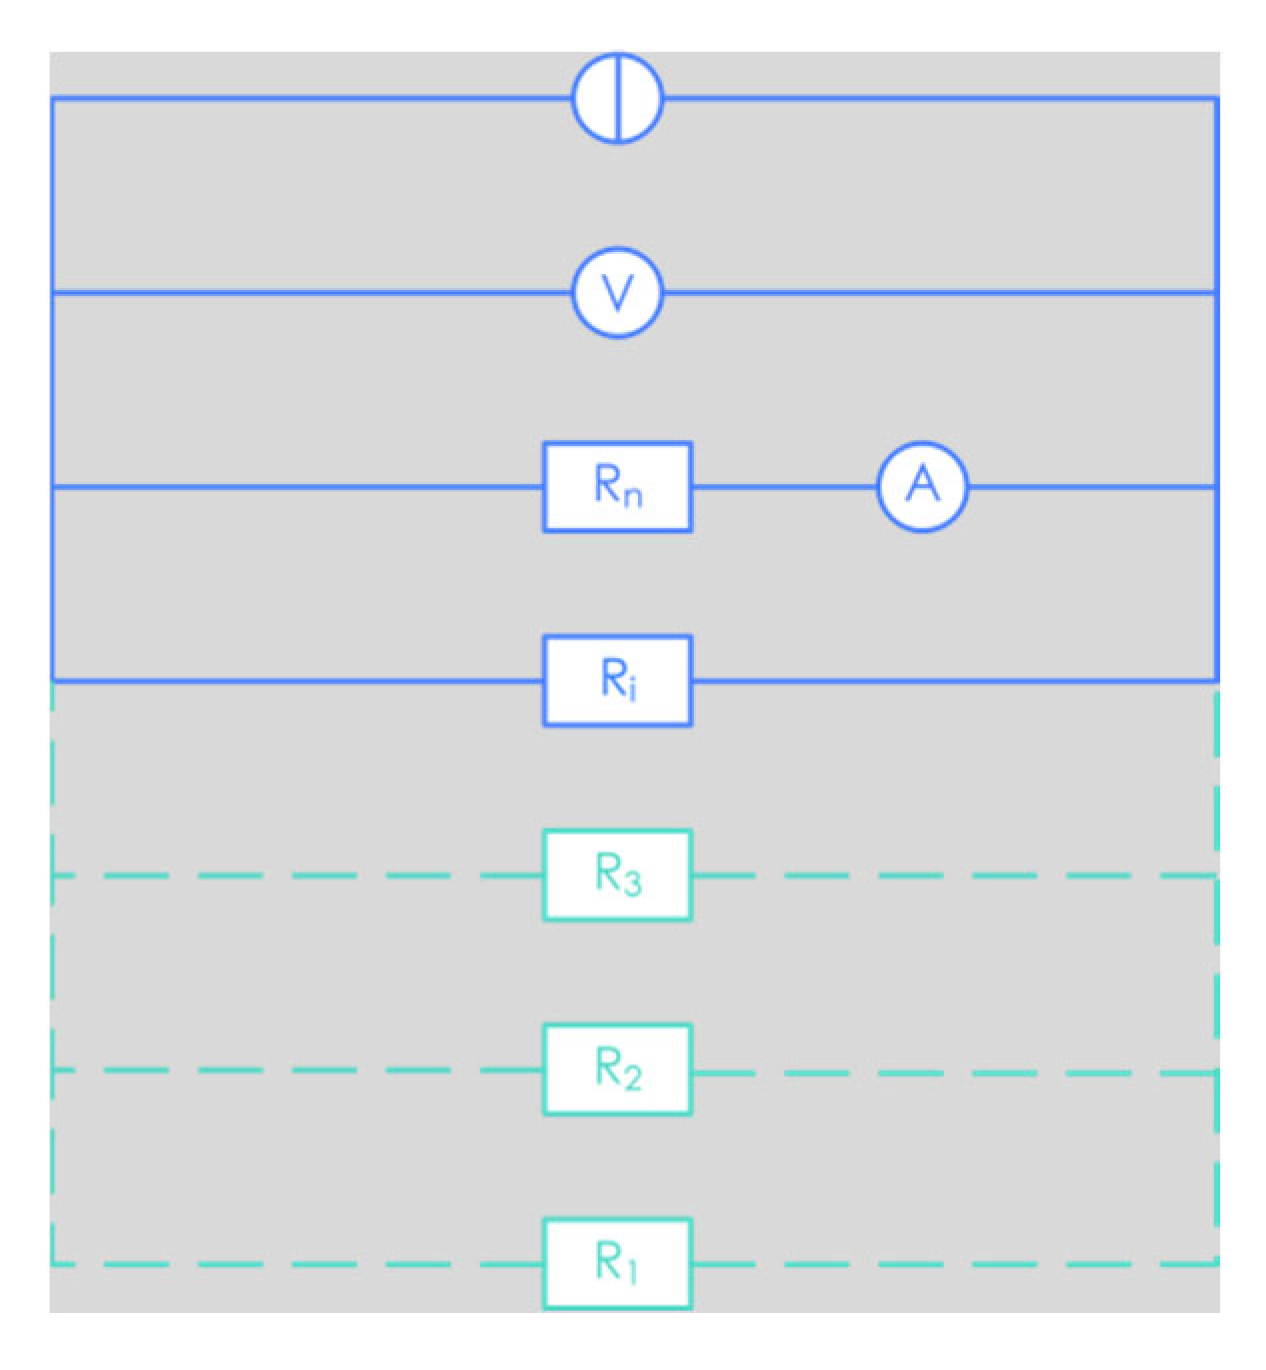
Figure 31 shows the equivalent circuit diagram of the beam member after cracking. The position with infinite resistance is called an open circuit, so R1, R2, R3, etc., in the figure are invalid resistances. When the crack extension height reaches the position of resistance Ri, the equivalent resistance R of the concrete beam member is calculated by Equation (7):
R = 1 1 R i + + 1 R n
It can be found from the formula that Ri to Rn will gradually increase, and the denominator will be gradually reduced, resulting in an infinite increase in the equivalent resistance R.
It can thus be inferred that the increase in resistance is directly related to the crack height, crack width, the length of the current path, and the cross-sectional area through which the current passes. As the crack height and width extend, the length of the current path becomes longer, which is positively correlated with the increase in resistance; the cross-sectional area through which the current passes gradually decreases, which is negatively correlated with the increase in resistance.
The simulation results indicate that before the cracking load of the test beam, although there was no significant change in the cross-sectional area for current passage or the length of the current path, the generation of internal microcracks led to corresponding changes in the conductive channels. It can thus be concluded that the resistance increased to a certain extent before the specimen cracked, but the degree of increase was relatively small. After the occurrence of macroscopic cracks in the member, the extension of crack height and width blocked the current, resulting in a reduction in the cross-sectional area for current passage and an increase in the length of the current path. Consequently, the resistance at the cracks tended to be infinite.

6. Conclusions and Outlook

6.1. Conclusions

The following conclusions were drawn from a systematic investigation into the effects of incorporating GO on the mechanical properties, electrical conductivity, and structural sensitivity of concrete specimens and reinforced beams:
  • The addition of GO significantly enhanced both the mechanical and electrical properties of concrete. At a dosage of 0.09%, the compressive strength increased by 17.67% compared to ordinary concrete, while the resistivity decreased most markedly, indicating optimal electrical conductivity. Microstructural analysis revealed that GO promotes hydration, fills pores and microcracks, and refines the matrix density, thereby improving both mechanical and electrical performance.
  • While GO had negligible impact on the flexural capacity of concrete beams, it considerably improved their electrical and flexural sensitivity. Under loading, the rate of change in electrical resistance exhibited a strong linear correlation with deflection. Beams with layered GO configuration performed best, with a fitting goodness above 0.93 for the deflection–resistance change rate curve, demonstrating excellent capability in monitoring deformation and damage.
  • COMSOL multi-physical field simulations confirmed that crack propagation leads to an increase in electrical resistance, which is influenced by both the length of the current path and the conductive cross-sectional area. The simulations validated the numerical model’s effectiveness in analyzing the conductive network and damage mechanism, providing a theoretical basis for structural health monitoring in concrete.

6.2. Limitations and Outlook

This study still has several limitations: Firstly, it only focuses on the single-phase conductive additive of GO and does not involve the synergistic effect of mixed conductive systems; Secondly, the adopted copper mesh electrodes are difficult to fully meet the diverse needs of electrode configurations in practical engineering; Thirdly, the setting of a uniform reinforcement ratio fails to consider the regulatory effect of reinforcement differences on the electrical properties of conductive concrete; Fourthly, the electrode arrangement at a single site on the beam top surface may affect the accuracy of self-sensing performance evaluation. In addition, from the perspective of engineering application, the uniform dispersion technology of GO in large-scale production has not yet been matured, and its high preparation cost limits large-scale engineering promotion; meanwhile, environmental friendliness issues such as energy consumption and pollutant emissions during GO preparation, as well as stability under long-term service environments, have not been systematically evaluated. These all constitute the core challenges for this technology to move towards practical application.
Future research can be carried out in the following directions: Firstly, explore multi-component mixed conductive systems and optimize GO dosage to further tap the potential for performance improvement; Secondly, attempt diverse electrode materials and configuration schemes to establish electrode selection criteria suitable for engineering scenarios; Thirdly, conduct in-depth analysis of the influence mechanism of different reinforcement ratios on the electrical properties of conductive concrete; Fourthly, adopt through-beam or bottom-surface electrode arrangements to improve the accuracy of self-sensing performance evaluation; Fifthly, focus on overcoming large-scale GO dispersion technology and develop low-cost preparation processes; Sixthly, systematically evaluate the environmental performance of GO-modified concrete, clarify its environmental impacts throughout the entire life cycle, and provide theoretical support and technical reference for the engineering application of this material.

Author Contributions

Writing—Original Draft, Y.C.; Supervision, X.Y.; Project Administration, X.Y.; Validation, X.Y. and H.S.; Formal Analysis, H.L. and X.S.; Funding Acquisition, H.L. and H.S.; Resources, H.L.; Methodology, L.W.; Software, L.W.; Writing—Review & Editing, X.S. All authors have read and agreed to the published version of the manuscript.

Funding

This research was funded by the Key Research and Development Project in the Field of Social Development of the Science and Technology Department of Jilin Province (20230203034SF) & Study on salt and frost resistance of composite green concrete in complex soil environment of permafrost region in Northeast Asia (No. DJ-ZDXM-2023-35).

Data Availability Statement

The raw data and supporting materials for this study are included in the main article. Further inquiries regarding the data can be sent to the corresponding author.

Conflicts of Interest

Haoyue Sun was employed by the PowerChina Jilin Provincial Electric Power Survey and Design Institute Co., Ltd. The remaining authors declare that the research was conducted in the absence of any commercial or financial relationships that could be construed as a potential conflict of interest.

References

  1. Zhou, J. Mechanical Behavior and Self-Sensing Property of Multi-Walled Carbon Nanotubes Reinforced Engineered Cementitious Composites. Master’s Thesis, Shandong University, Jinan, China, 2018. [Google Scholar] [CrossRef]
  2. Kong, X.D. Material Design and Mechanical Property Analysis of Conductive Concrete. Master’s Thesis, Ningbo University, Ningbo, China, 2021. [Google Scholar] [CrossRef]
  3. Yang, Y.Z. Study on the Smart Properties of Multiphase Conductive Concrete. Master’s Thesis, Shenyang Jianzhu University, Shenyang, China, 2022. [Google Scholar] [CrossRef]
  4. Han, Z.B. Flexural Smart Properties and Crack Self-Sensing Ability of Conductive Concrete. Master’s Thesis, Dalian University of Technology, Dalian, China, 2013. [Google Scholar]
  5. Yan, C. Research of Macro Fiber on the Self-Monitoring Ability of Crack of Smart Concrete. Master’s Thesis, Dalian University of Technology, Dalian, China, 2022. [Google Scholar] [CrossRef]
  6. Liu, P. Preparation and Application of Conductive Asphalt Concrete Graphene Electrode. Master’s Thesis, Harbin Institute of Technology, Harbin, China, 2018. [Google Scholar] [CrossRef]
  7. Zhang, X.M.; Liu, R.G.; Dai, L.; Zhou, K. Reparation and study on mechanical properties and frost resistance of graphene modified concrete. J. Funct. Mater. 2023, 54, 4087–4092. [Google Scholar] [CrossRef]
  8. Maizuar, M.; Fithra, H.; Yusuf, K.; Usrina, N.; Bahri, S.; Senin, S.F. Mechanical properties of high-volume fly ash mortar modified by hybrid carbon nano tube and graphene oxide. Electron. J. Struct. Eng. 2024, 24, 23–27. [Google Scholar] [CrossRef]
  9. Peng, H.; Ge, Y.; Cai, C.S.; Zhang, Y.; Liu, Z. Mechanical properties and microstructure of graphene oxide cement-based composites. Constr. Build. Mater. 2019, 194, 102–109. [Google Scholar] [CrossRef]
  10. Chu, H.; Zhang, Y.; Wang, F.; Feng, T.; Wang, L.; Wang, D. Effect of graphene oxide on mechanical properties and durability of ultra-high-performance concrete prepared from recycled sand. Nanomaterials 2020, 10, 1724–1732. [Google Scholar] [CrossRef] [PubMed]
  11. Guo, K. Research on Properties and Modification Mechanism of Graphene Oxide Recycled Concrete. Bachelor’s Thesis, Dalian University of Technology, Dalian, China, 2021. [Google Scholar] [CrossRef]
  12. Wang, Q.; Li, S.Y.; Wang, J.; Pan, S.; Lv, C.X.; Cui, X.Y.; Guo, Z.W. Effect of graphene oxide on hydration process and main hydration products of cement. J. Chin. Ceram. Soc. 2018, 46, 163–172. [Google Scholar] [CrossRef]
  13. Lei, B.; Zou, J.; Rao, C.H. Experimental study on modification of recycled concrete with graphene oxide. J. Build. Struct. 2016, 37, 106–108. [Google Scholar] [CrossRef]
  14. Xu, Y.; Zeng, J.; Chen, W.; Mao, J.; Shen, J.; Hu, D. A state-of-the-art review on graphene oxide reinforced cement based composites. Mater. Rep. 2017, 31, 150–155. [Google Scholar] [CrossRef]
  15. Pan, Z.; He, L.; Qiu, L.; Korayem, A.H.; Li, G.; Zhu, J.W.; Collins, F.; Li, D.; Duan, W.H.; Wang, M.C. Mechanical properties and microstructure of a graphene oxide–cement composite. Cem. Concr. Compos. 2015, 58, 140–147. [Google Scholar] [CrossRef]
  16. Lv, S.H.; Zhang, J.; Luo, X.Q.; Zhu, L.; Ni, C. Microstructure and properties for composites of graphene oxide/cement. Chin. J. Mater. Res. 2018, 32, 233–240. [Google Scholar] [CrossRef]
  17. Li, L.; Zheng, Q.; Han, B.; Ou, J. Fatigue behaviors of graphene reinforcing concrete composites under compression. Int. J. Fatigue 2021, 151, 106354. [Google Scholar] [CrossRef]
  18. Dong, W.; Li, W.; Wang, K.; Shah, S.P. Physicochemical and piezoresistive properties of smart cementitious composites with graphene nanoplates and graphite plates. Constr. Build. Mater. 2021, 286, 122943. [Google Scholar] [CrossRef]
  19. Hu, K. Mechanical Properties of GO Soil-Cement Under Freeze-Thaw Cycles. Master’s Thesis, Shenyang Jianzhu University, Shenyang, China, 2022. [Google Scholar] [CrossRef]
  20. Najafishad, S.; Manesh, H.D.; Zebarjad, S.M.; Hataf, N.; Mazaheri, Y. Production and investigation of mechanical properties and electrical resistivity of cement-matrix nanocomposites with graphene oxide and carbon nanotube reinforcements. Arch. Civ. Mech. Eng. 2020, 20, 57. [Google Scholar] [CrossRef]
  21. Jiang, X.; Lu, D.; Yin, B.; Leng, Z. Advancing carbon nanomaterials-engineered self-sensing cement composites for structural health monitoring: A state-of-the-art review. J. Build. Eng. 2024, 87, 109129. [Google Scholar] [CrossRef]
  22. Chen, M. Electrothermal and Sensitive Properties of Multiphase Conductive Cement-Based Materials with Graphene. Master’s Thesis, Nanjing University of Aeronautics and Astronautics, Nanjing, China, 2018. [Google Scholar]
  23. Sun, S.; Han, B.; Jiang, S.; Yu, X.; Wang, Y.; Li, H.; Ou, J. Nano graphite platelets-enabled piezoresistive cementitious composites for structural health monitoring. Constr. Build. Mater. 2017, 136, 314–328. [Google Scholar] [CrossRef]
  24. Belli, A.; Mobili, A.; Bellezze, T.; Cachim, P.B.; Tittarelli, F. Commercial and recycled carbon-based fillers and fibers for self-sensing cement-based composites: Comparison of mechanical strength, durability, and piezoresistive behavior. J. Build. Eng. 2023, 73, 106836. [Google Scholar] [CrossRef]
  25. Meng, Q.S.; Araby, S.; Oh, J.A.; Chand, A.; Zhang, X.; Kenelak, V.; Ma, J.; Liu, T.; Ma, J. Accurate self-damage detection by electrically conductive epoxy/graphene nanocomposite film. J. Appl. Polym. Sci. 2021, 138, 50452. [Google Scholar] [CrossRef]
  26. Cai, C.N.; Chen, S.L.; Liu, L.N. Detection of crack damage for concrete by conductive ink layer and electrical resistance tomography. Chin. J. Sens. Actuators 2024, 37, 1084–1089. [Google Scholar] [CrossRef]
  27. Qu, Y.J. Study on the Mechanical and Electrical Properties of Graphene-Reinforced Cement-Based Composites. Master’s Thesis, Shenyang University of Technology, Shenyang, China, 2021. [Google Scholar] [CrossRef]
  28. GB/T 50081-2019; Standard for Test Methods of Concrete Physical and Mechanical Properties. Standards Press of China: Beijing, China, 2019.
  29. GB/T 228.1-2021; Metallic Materials—Tensile Testing—Part 1: Method of Test at Ambient Temperature. Standards Press of China: Beijing, China, 2021.
  30. GB/T 50010-2010; Standard for Design of Concrete Structures. China Architecture & Building Press: Beijing, China, 2024.
  31. GB/T 50152-2012; Standard for Test Methods of Concrete Structures. China Architecture & Building Press: Beijing, China, 2012.
Figure 1. Aggregate gradation curve.
Buildings 15 04268 g001
Figure 2. Images of graphene oxide (GO) used in this study.
Buildings 15 04268 g002
Figure 3. Photograph of a copper mesh electrode used for conductivity measurements.
Buildings 15 04268 g003
Figure 4. Demolded concrete specimens after curing.
Buildings 15 04268 g004
Figure 5. Concrete specimen with copper mesh electrodes installed for electrical testing.
Buildings 15 04268 g005
Figure 6. Specimen loading setup.
Buildings 15 04268 g006
Figure 7. Typical failure mode of an ordinary concrete specimen.
Buildings 15 04268 g007
Figure 8. Typical failure mode of GO-modified concrete specimens.
Buildings 15 04268 g008
Figure 9. Load–resistance relationships of concrete specimens with varying GO dosages.
Buildings 15 04268 g009
Figure 10. Load–resistivity relationships of concrete specimens with varying GO dosages.
Buildings 15 04268 g010
Figure 11. Stress–strain curves of concrete specimens with different GO dosages.
Buildings 15 04268 g011
Figure 12. S-3400N scanning electron microscope (SEM) used for microstructural analysis.
Buildings 15 04268 g012
Figure 13. Ion sputter coater employed for SEM sample preparation.
Buildings 15 04268 g013
Figure 14. SEM test specimens prepared from concrete samples.
Buildings 15 04268 g014
Figure 15. Micromorphology of a concrete specimen containing 0% GO (ordinary concrete).
Buildings 15 04268 g015
Figure 16. Micromorphology of a concrete specimen containing 0.02% GO.
Buildings 15 04268 g016
Figure 17. Micromorphology of a concrete specimen containing 0.06% GO.
Buildings 15 04268 g017
Figure 18. Micromorphology of a concrete specimen containing 0.09% GO.
Buildings 15 04268 g018
Figure 19. Operation diagram used for rebar tensile testing.
Buildings 15 04268 g019
Figure 20. Dimensions and reinforcement details of test beams.
Buildings 15 04268 g020
Figure 21. Cross-sectional reinforcement configuration of test beams.
Buildings 15 04268 g021
Figure 22. Schematic diagram of the loading arrangement for test beams.
Buildings 15 04268 g022
Figure 23. Diagram of the loading device used for beam testing.
Buildings 15 04268 g023
Figure 24. Strain gauge bonding on rebars.
Buildings 15 04268 g024
Figure 25. Strain gauge bonding on concrete.
Buildings 15 04268 g025
Figure 26. Load–resistivity curves for bending and shear sections of test beams.
Buildings 15 04268 g026
Figure 27. Model diagram of a beam with an embedded rebar cage.
Buildings 15 04268 g027
Figure 28. Finite element mesh generation for the beam model.
Buildings 15 04268 g028
Figure 29. Simulated potential distribution and current lines for each beam. (a) potential diagram of ordinary concrete; (b) current line diagram of ordinary concrete; (c) potential diagram of a layered GO-modified beam; (d) current line diagram of a layered GO-modified beam; (e) potential diagram of a GO-smart-block beam; (f) current line diagram of a GO-smart-block beam.
Buildings 15 04268 g029
Figure 30. Simulated potential distribution and current lines during beam cracking. (a) potential diagram during cracking of ordinary concrete; (b) current line diagram during cracking of ordinary concrete; (c) potential diagram during cracking of a layered GO-modified beam; (d) current line diagram during cracking of a layered GO-modified beam; (e) potential diagram during cracking of a GO-smart-block beam; (f) current line diagram during cracking of a GO-smart-block beam.
Buildings 15 04268 g030
Figure 31. Equivalent circuit diagram.
Buildings 15 04268 g031
Table 1. Physical and mechanical properties of the cement used in this study, including loss on ignition (LOI), initial and final setting times, and compressive strength.
TypeLoss on Ignition (%)Initial Setting Time (h)Final Setting Time (h)Compressive Strength (MPa)
P.O 42.51.0245.2528.4
Table 2. Standard and measured chemical composition of copper mesh electrodes used as the conductive interface in the experimental setup. Values are presented in weight percentage, with “N.D.” indicating non-detected components.
ElementCu (%)P (%)Pb (%)Fe (%)Hg (%)Cd (%)Cr6+ (%)
Standard content60.5–63.5≤0.010≤0.010≤0.15≤0.0020≤0.0020≤0.0020
Measured content61.370.0030.00650.013N.D.0.00030.0003
Table 3. Mix proportions for conductive concrete specimens with varying graphene oxide (GO) dosages.
GroupSpecimen CodeMaterial Dose (kg/m3)
GOWaterCementFine AggregateCoarse AggregateWater-Reducing AgentWater-Cement Ratio
1C-GO00204409.390114392.10.5
2C-GO20.082
3C-GO60.246
4C-GO90.368
Table 4. Compressive strength results of concrete specimens incorporating different GO dosages.
Specimen IDNumber of ReplicationCompressive Strength (MPa)Strength Growth RatioStrength Growth Rate (%)Standard DeviationError
C-GO0330.221.00000.51.243
C-GO2331.111.0292.950.61.481
C-GO6332.891.0888.840.71.740
C-GO9335.561.17717.670.81.988
Table 5. Mechanical properties of HRB400 rebars of different diameters, including yield strength and ultimate tensile strength.
Material TypeRebar Diameter (mm)Rebar Yield Strength (MPa)Rebar Ultimate Strength (MPa)
HRB4008486648
HRB40010424565
HRB40012421593
Table 6. Detailed parameters of reinforced concrete beams (RCBs) tested in this study, including GO dosage, rebar specifications, reinforcement ratio, beam dimensions, and specimen grouping.
GroupIDGO Dose (%)Longitudinal Rebar (mm)Reinforcement Ratio (%)Rebar TypeQuantity (Bars)Dimensions (mm)
1RCB-PT-10120.63HRB4001200 × 300 × 1800
RCB-PT-21
RCB-PT-31
2RCB-GO-F-10.091
RCB-GO-F-21
RCB-GO-F-31
3RCB-GO-Z-10.091
RCB-GO-Z-21
RCB-GO-Z-31
Table 7. Parameters of fitted curves.
Sample NumberabcCR2
RCB-PT-10.9551−11.40360.96120.9575
RCB-PT-21.0534−12.61874.22940.9653
RCB-PT-31.0606−12.8524.98110.9779
RCB-GO-F-10.7607−9.84360.45380.9874
RCB-GO-F-20.6366−7.92331.96010.9859
RCB-GO-F-30.8221−11.04075.0380.9734
RCB-GO-Z-11.271−13.2621.26250.9859
RCB-GO-Z-20.9075−11.68353.85440.9762
RCB-GO-Z-30.7498−11.30568.96880.9328
Table 8. Cracking load and ultimate load of the test beam.
Serial NumberCracking Load (kN)Average Cracking Load (kN)Ultimate Load (kN)Average Ultimate Load (kN)Failure Mode
RCB-PT-15553.33161163.67Normal Section Failure
RCB-PT-250160Normal Section Failure
RCB-PT-355170Normal Section Failure
RCB-GO-F-15551.67165160Normal Section Failure
RCB-GO-F-250163Normal Section Failure
RCB-GO-F-350152Normal Section Failure
RCB-GO-Z-15051.67162163.33Normal Section Failure
RCB-GO-Z-250164Normal Section Failure
RCB-GO-Z-355164Normal Section Failure
Table 9. Simulation values and test values of ultimate load of test beam.
CodeExperimental Ultimate Load (kN)Average Experimental Value (kN)Simulated Value (kN)Error (%)
RCB-PT-1161163.671583.46
RCB-PT-2160
RCB-PT-3170
RCB-GO-F-11651601653.13
RCB-GO-F-2163
RCB-GO-F-3152
RCB-GO-Z-1162163.331602.04
RCB-GO-Z-2164
RCB-GO-Z-3164
Table 10. One-Way Analysis of Variance (ANOVA) for Experimental Ultimate Load.
Source of VariationDegrees of Freedom (df)Sum of Squares (ss)Mean SquareF-Valuep-Value
Between Groups240.2220.110.870.466
Within Groups (Error)6138.6723.11
Total8178.89
Disclaimer/Publisher’s Note: The statements, opinions and data contained in all publications are solely those of the individual author(s) and contributor(s) and not of MDPI and/or the editor(s). MDPI and/or the editor(s) disclaim responsibility for any injury to people or property resulting from any ideas, methods, instructions or products referred to in the content.