Article

Seismic Fragility Analysis of Shield Tunnels Considering the Flexural Capacity of Longitudinal Joints

1
State Key Laboratory of Precision Blasting, Jianghan University, Wuhan 430056, China
2
Hubei Key Laboratory of Blasting Engineering, Jianghan University, Wuhan 430056, China
3
School of Digital Construction and Blasting Engineering, Jianghan University, Wuhan 430056, China
4
School of Civil Engineering, Harbin Institute of Technology, Harbin 150090, China
*
Author to whom correspondence should be addressed.
Buildings 2025, 15(23), 4265; https://doi.org/10.3390/buildings15234265
Submission received: 21 October 2025 / Revised: 17 November 2025 / Accepted: 19 November 2025 / Published: 26 November 2025
(This article belongs to the Special Issue Advanced Research in Cement and Concrete)

Abstract

The longitudinal joints in shield tunnels connect the segments in a ring and can predominantly influence the mechanical behavior of the lining. The axial force environment influences the flexural capacity of longitudinal joints in shield tunnels and is a key indicator of the damage state of shield tunnels under seismic loading. In addition to increased seismic demand, the flexural capacity of the longitudinal joints is also enhanced at higher seismic intensities. However, existing seismic fragility analyses of shield tunnels have overlooked the influence of axial force, so the conclusions do not accurately reflect actual conditions. To address this gap, this paper proposes an analytical model to estimate the flexural capacity of longitudinal joints and develops a probabilistic model based on a Bayesian approach. The fragility curves for shield tunnels in three different damage states, considering the influence of the axial force environment, are presented. The results show that, for the example used in this paper, when PGA = 0 and the tunnel is in a homogeneous condition, the mean flexural capacity of the lining is 196 kN·m. When the tunnel joint is considered, the mean joint capacity is 142 kN·m for the positive bending moment loading condition and 91 kN·m for the negative bending moment loading condition. When PGA reaches 1.6 g, the mean estimation of the flexural capacity of the tunnel joint is about 310 kN·m. Therefore, the flexural capacity of the longitudinal joints gradually increases with the increase in the seismic demand. The fragility analysis results show that shield tunnels are more susceptible to failure at longitudinal joints at low seismic intensities and more vulnerable in segments at higher seismic intensities.

1. Introduction

In recent years, seismic damage data have indicated that underground engineering structures, such as tunnels, can also suffer significant seismic damage [1,2]. Due to their high levels of mechanization and operational safety, shield tunnels have been widely employed [3]. Shield tunnels may display various complex types of damage under seismic loads, including cracking, spalling, local collapse, segment misalignment, localized compression, and joint dislocation [4,5,6]. Further investigating their seismic performance has become a key focus in civil engineering. The lining of shield tunnels is composed of segments connected by bolts, which serve as potential weak points in the lining structure and are vital for the overall stability of the tunnel [7,8,9].
Shield tunnels mainly have two types of joints: transversal joints used to connect the adjacent rings and longitudinal joints used to connect the segments in a ring, and the longitudinal joints predominantly influence the mechanical behavior of the lining. Because it can establish a direct relationship between the probability of structural failure and seismic parameters, fragility analysis has served as a crucial tool for scientifically assessing the seismic risk levels of shield tunnels [10,11]. Seismic demand, structural capacity, and damage indicators are critical factors that influence the risk level in structural fragility analysis [12]. It is essential to conduct a systematic study of the flexural capacity of the longitudinal joints for shield tunnels, as bending deformation is the primary failure mode for shield tunnels under the action of seismic load.
Theoretically, fragility curves can be derived from a statistical analysis of historical earthquake damage data [13]. Due to the limited number of actual seismic damage data, researchers often rely on numerical simulation results to develop fragility curves. For instance, Argyroudis & Pitilakis [14] utilized numerical methods to simulate the lateral seismic response of tunnels in alluvial soil sites, and established fragility curves for different damage states. Zhang et al. [15] derived fragility curves for shield tunnels using Vertical Seismic Intensity (VSI) as the intensity measure rather than Peak Ground Acceleration (PGA). Their study considered the nonlinear deformation of joints, soil liquefaction effects, and the characteristics of seismic actions. Through incremental dynamic analysis, Liu et al. [16] provided fragility curves for underwater shield tunnels located in interlayer soil. Xu et al. [17] conducted seismic fragility analysis of shield tunnels in liquefiable layered deposits. Shen et al. [18] explored the seismic fragility of shield tunnels in three types of soil: two liquefiable and one non-liquefiable. Avanaki et al. [19] developed fragility curves based on numerical simulations of steel fiber-reinforced concrete linings, while Yang et al. [20] created fragility curves for shield tunnels that utilized asphalt-cement (A-C) materials for backfill grouting. These research efforts significantly contribute to the seismic risk analysis and the seismic design of shield tunnels. However, the consideration of joints in shield tunnels remains insufficient. For example, in the studies by Argyroudis & Pitilakis [14] and Yang et al. [20], the lining was modeled using homogeneous materials, neglecting the behavior of the joints. In the research by Shen et al. [18] and Avanaki et al. [19], the soil-tunnel interactions were represented in a plane-strain manner, which limits a comprehensive assessment of joint details. Furthermore, while these studies primarily focus on developing seismic demand probability models, the randomness of factors affecting lining capacity was not comprehensively considered. Zhao et al. [21] proposed a probabilistic model for the flexural capacity of circular tunnel linings. However, their model simplifies the tunnel to a homogeneous circular ring, making it unsuitable for calculating the flexural capacity of shield tunnels that consider the effects of joints.
The longitudinal joints are a critical weak point in shield tunnel linings, making their load-bearing capacity a significant engineering research focus. Researchers have conducted extensive theoretical calculations, model tests, and numerical simulations to investigate the load-bearing capacity of the longitudinal joints. Andreotti et al. [22] developed a calculation model that addresses the accumulation of concrete damage under cyclic loads, validating their model by using experimental data. Wang et al. [23] provided an analytical solution for circular segmental tunnel linings subjected to overburden and surrounding earth pressures, modeling the joint as a linear spring. Zhang et al. [24] proposed an analysis to determine the compressive-flexural capacity of shield tunnel lining joints, confirming its accuracy and applicability through full-scale experiments. Huang et al. [25] established an analysis using the state space method to examine the nonlinear mechanical behavior of shield tunnel joints by modeling them as nonlinear springs. Li and Liu [26] proposed an analytical model for calculating the compressive bending bearing capacity of steel plate reinforced joints based on the deformation and stress characteristics of the surface of shield tunnel joints. Zhang et al. [27] developed a calculation method for the mechanical behavior of longitudinal joints in shield tunnels, considering rotational stiffness and shear stiffness. These studies provide valuable methodological references and theoretical foundations for scientifically evaluating the flexural capacity of shield tunnel longitudinal joints, which is crucial for guiding lining design. However, many of these analytical methods depend on finite element software for assistance in calculations [22], rely on iterative solving [24,25], or the details of the joints are neglected [23]. As a result, they are inconvenient for engineering applications and often do not account for the potential uncertainties of factors affecting the flexural capacity of the joints.
As stated above, the current fragility analysis of shield tunnels has not fully addressed the randomness associated with the resistance parameters of the longitudinal joints. In addition, the axial force of the lining can highly influence the flexural capacity of the joints, and the axial force of the lining varies to the intensity of ground motions. However, previously proposed fragility curves do not consider the impact of the seismic intensity on the capacity of the joints. To tackle this issue, this paper proposes a probabilistic model to estimate the flexural capacity of the longitudinal joints for shield tunnels. This model is grounded in an analytical approach proposed in this paper based on mechanical principles, allowing for a systematic evaluation of the potential uncertainties of various factors. Additionally, the limit state equation is developed based on the proposed capacity model and the seismic demand model proposed by Zhao et al. [28], and then the fragility curves for shield tunnels at three different damage levels are provided.

2. Mechanical Properties of Shield Tunnel Longitudinal Joints

2.1. Characteristics of Longitudinal Joints to Seismic Loads

Figure 1a shows a three-dimensional schematic diagram of shield tunnels. It can be seen that shield tunnels are composed of prefabricated segments, which are connected by bolts. Figure 1b presents a simple diagram of the cross-section of shield tunnels. Figure 1c gives a simple diagram of a longitudinal joint of shield tunnels. Under external loads, the longitudinal joints are prone to rotation, resulting in gaps at the joints and posing a risk of water seepage in the tunnel structure. In addition, the stress state at the joints is affected by the gap width and the properties of the bolts. In recent earthquakes, many underground structures have suffered severe seismic damage, and the seismic safety of underground structures has become a research hotspot. Figure 2 shows a schematic diagram of the dynamic time-history response analysis for a tunnel under a seismic excitation. As shown in Figure 2a, under seismic loads, the surrounding rock will undergo certain deformations, which will cause deformations in the tunnel structure. As shown in Figure 2b, under seismic loads, the tunnel lining can be approximated as a curved beam, and circular tunnels mainly undergo oval deformations, and bending moment and axial force are the primary internal forces (see Figure 2c).
Since circular lining structures are primarily susceptible to bending failure under seismic action, existing studies typically only consider the bending moment response of the lining. Under seismic loads, the axial force response of the lining is also significant, and the flexural capacity at the joint is affected by the axial force environment. The larger the axial force, the greater the flexural capacity at the joint. Therefore, when the seismic load is large, the flexural capacity at the joint of shield tunnels also increases simultaneously. However, this factor is often overlooked in existing studies, resulting in failure to reflect the actual situations.

2.2. Numerical Simulation of Shield Tunnel Joints

To further analyze the mechanical properties of shield tunnel joints, this paper utilizes a commercial finite element software, ABAQUS with the version of 2024, to construct detailed finite element models of the longitudinal joints for shield tunnels. To validate the accuracy of the numerical model, the results are compared with the full-scale tests conducted by Jin et al. [29] and Zhang et al. [30]. Jin et al. [29] carried out a series of full-scale laboratory tests, and two types of segmental joints were considered. The Specimen JR of Jin et al. [29] is chosen for comparison in this paper. The lining thickness is 0.48 m. The diameter of the bolt is 36 mm. The joint was loaded with an axial force of 1193 kN in the negative bending case and was loaded with a smaller load of 495 kN in the positive bending case. Zhang et al. [30] analyzed the mechanical properties of longitudinal joints under six different conditions of corrosion and loading. Among these tests, one was performed under a non-corroded condition, and the results of this particular test are chosen for comparison in this paper. For this test, the outer diameter of the lining is 3.3 m, the lining thickness is 0.35 m, and the concrete conforms to grade C55 as per the Chinese design code [31]. The tensile strength of the concrete is 600 MPa, while the yield strength of the bolt is 480 MPa. The diameter of the bolt is 30 mm, with a length of 480 mm. Since the flexural capacity of the joints is influenced by axial force conditions, Zhang et al. [30] first applied a constant axial force of 500 kN to the lining and then maintained this axial load while applying vertical loads until the segment failed.
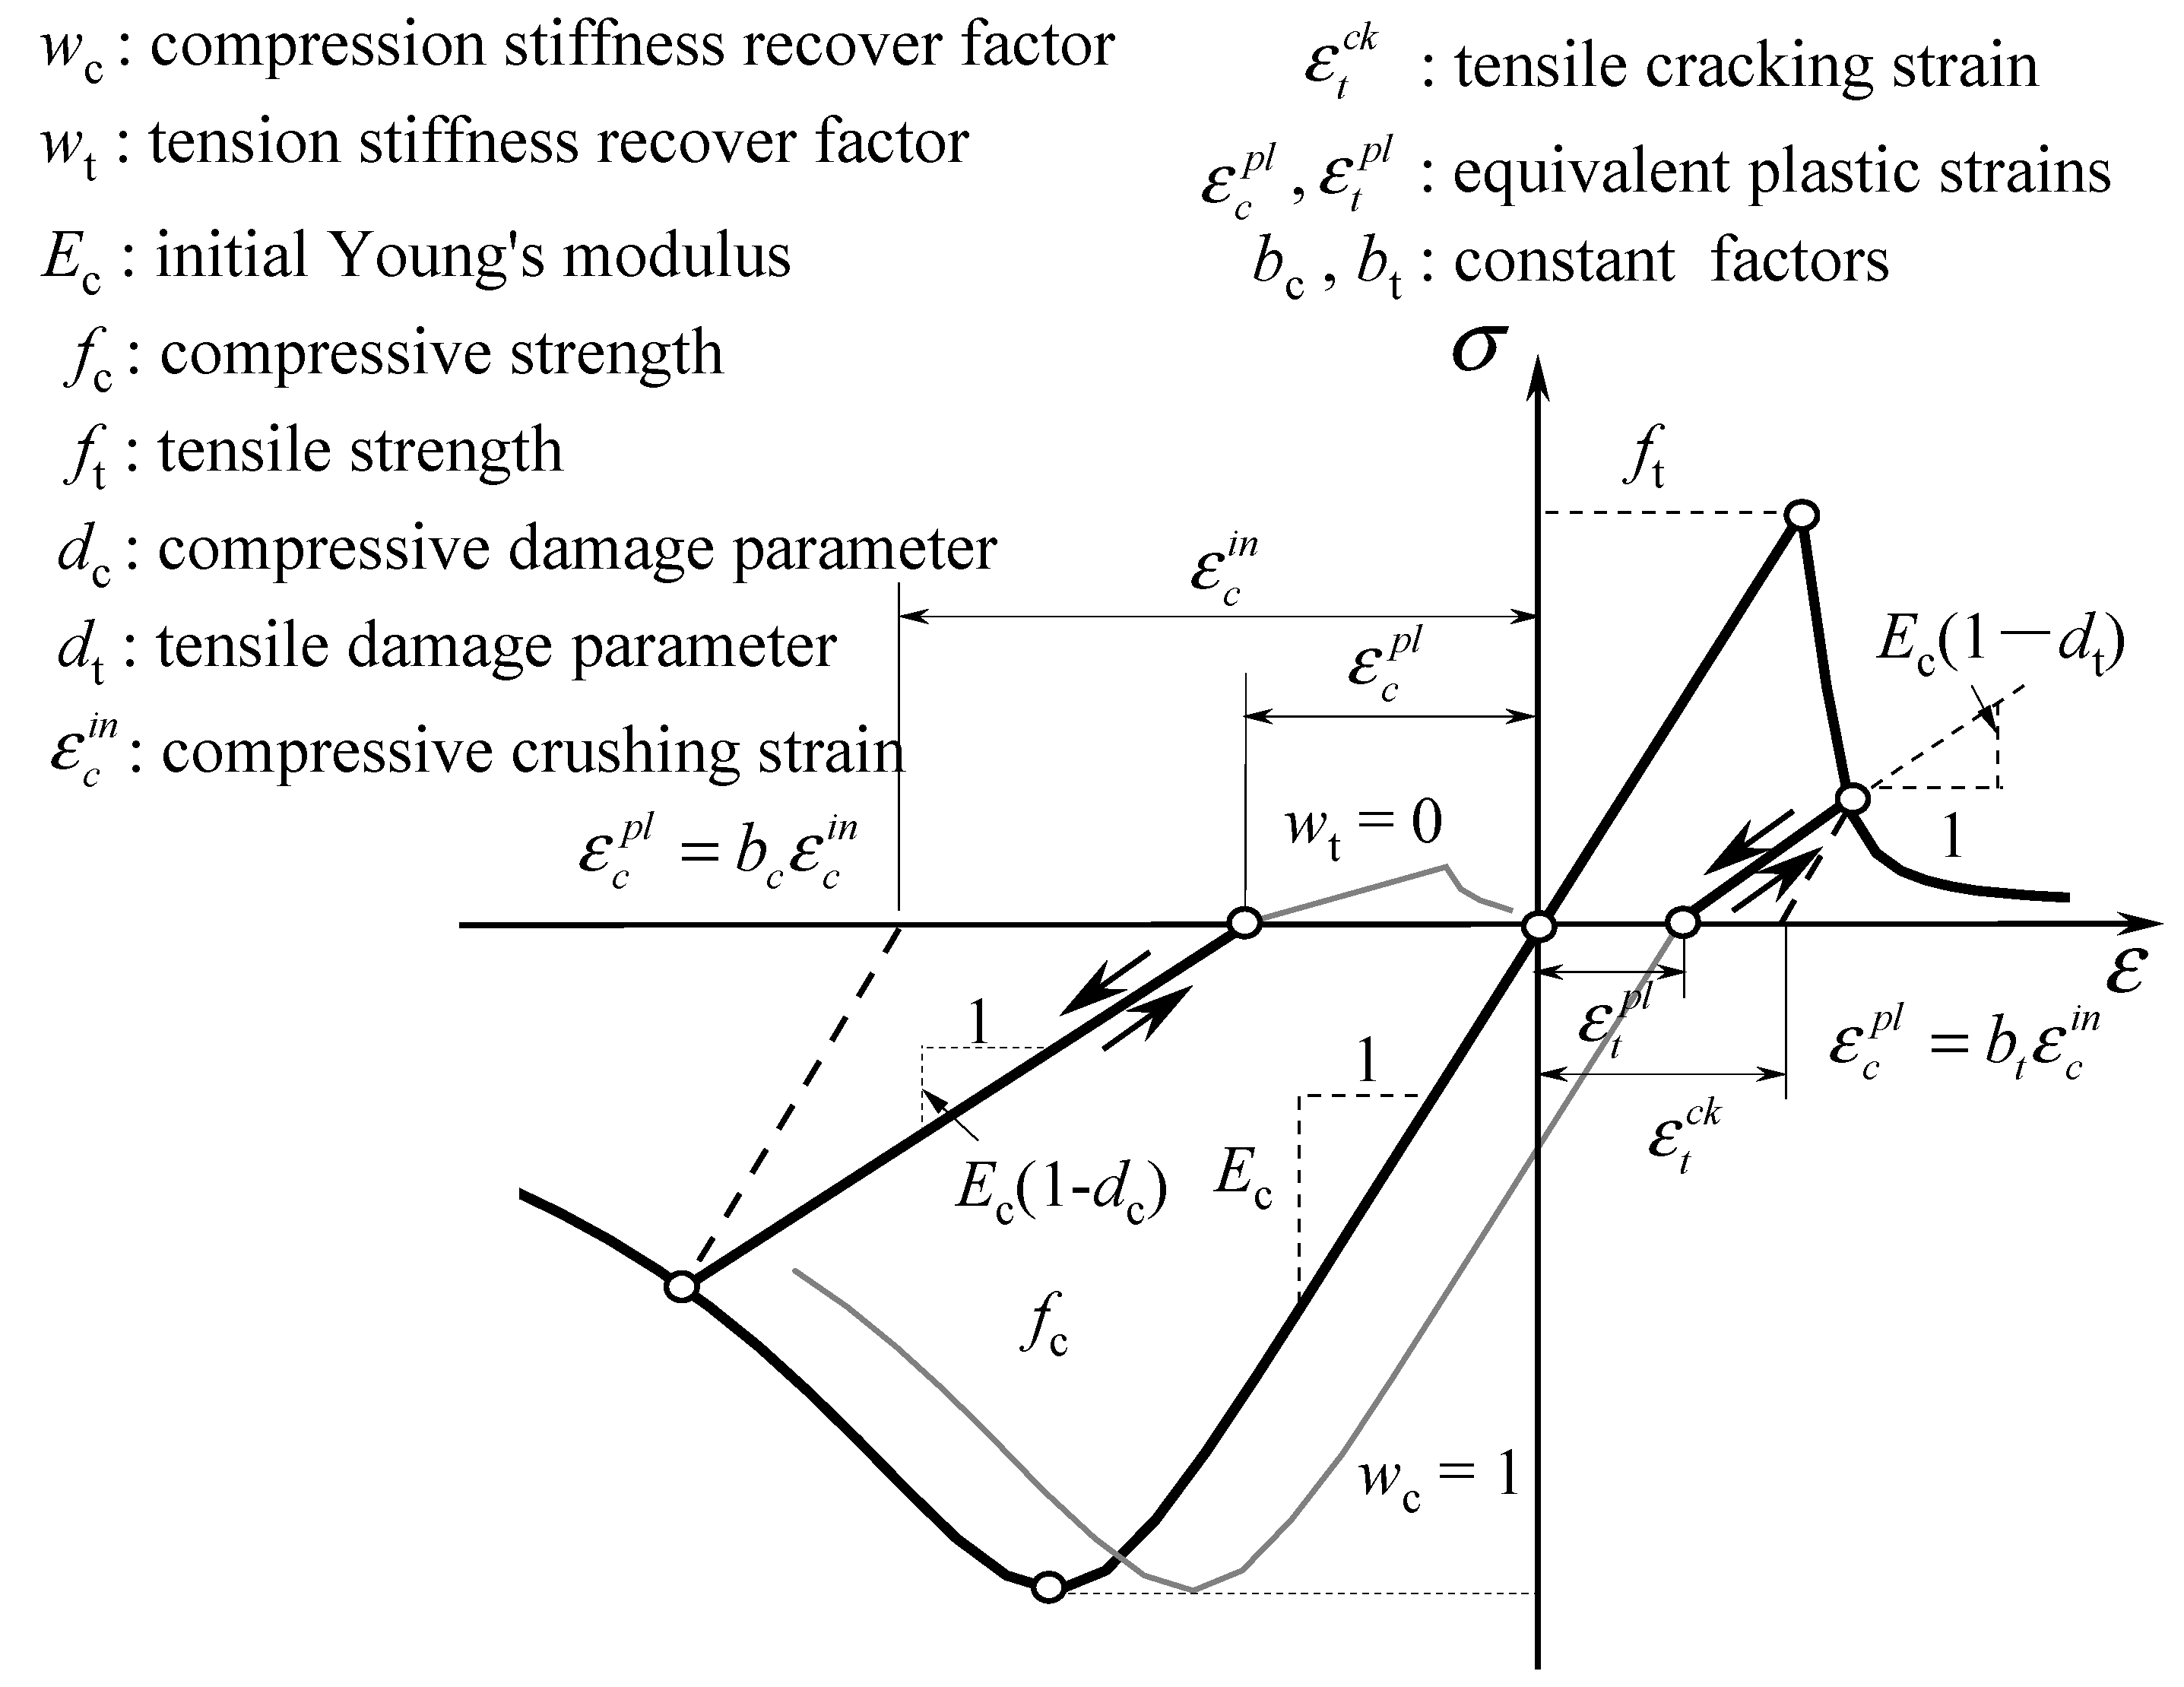
Figure 3 presents the finite element model of the shield tunnel segments developed in this paper. The finite element model comprises three components: the concrete lining, reinforcing steel bars, and bolts. The concrete lining and bolts are modeled as solid elements, while the reinforcing steel bars are modeled as beam elements utilizing an embedded approach that connects the reinforcement with the concrete. To simulate the tensile and compressive damage behavior of the concrete, a Concrete Damaged Plasticity (CDP) model is employed, as shown in Figure 4. Many studies have shown that the results from the CDP model align well with experimental data [32,33]. The CDP model is primarily defined by two key parameters: the compressive damage parameter, dc, and the tensile damage parameter, dt. Both dc and dt range from zero, indicating undamaged material, to one, representing a total loss of strength. The compressive and tensile damage behaviors are calculated using constant factors bc and bt, as illustrated in Figure 4. Birtel and Mark [34] suggested that setting bc = 0.7 and bt = 0.1 aligns well with test results. The bolts are modeled using a bilinear constitutive model, whereas the reinforcement follows an ideal elastic-plastic constitutive model. Hinged supports are positioned at both ends of the model. An axial force is applied at the supports and is constrained to align with the center line of the joint.
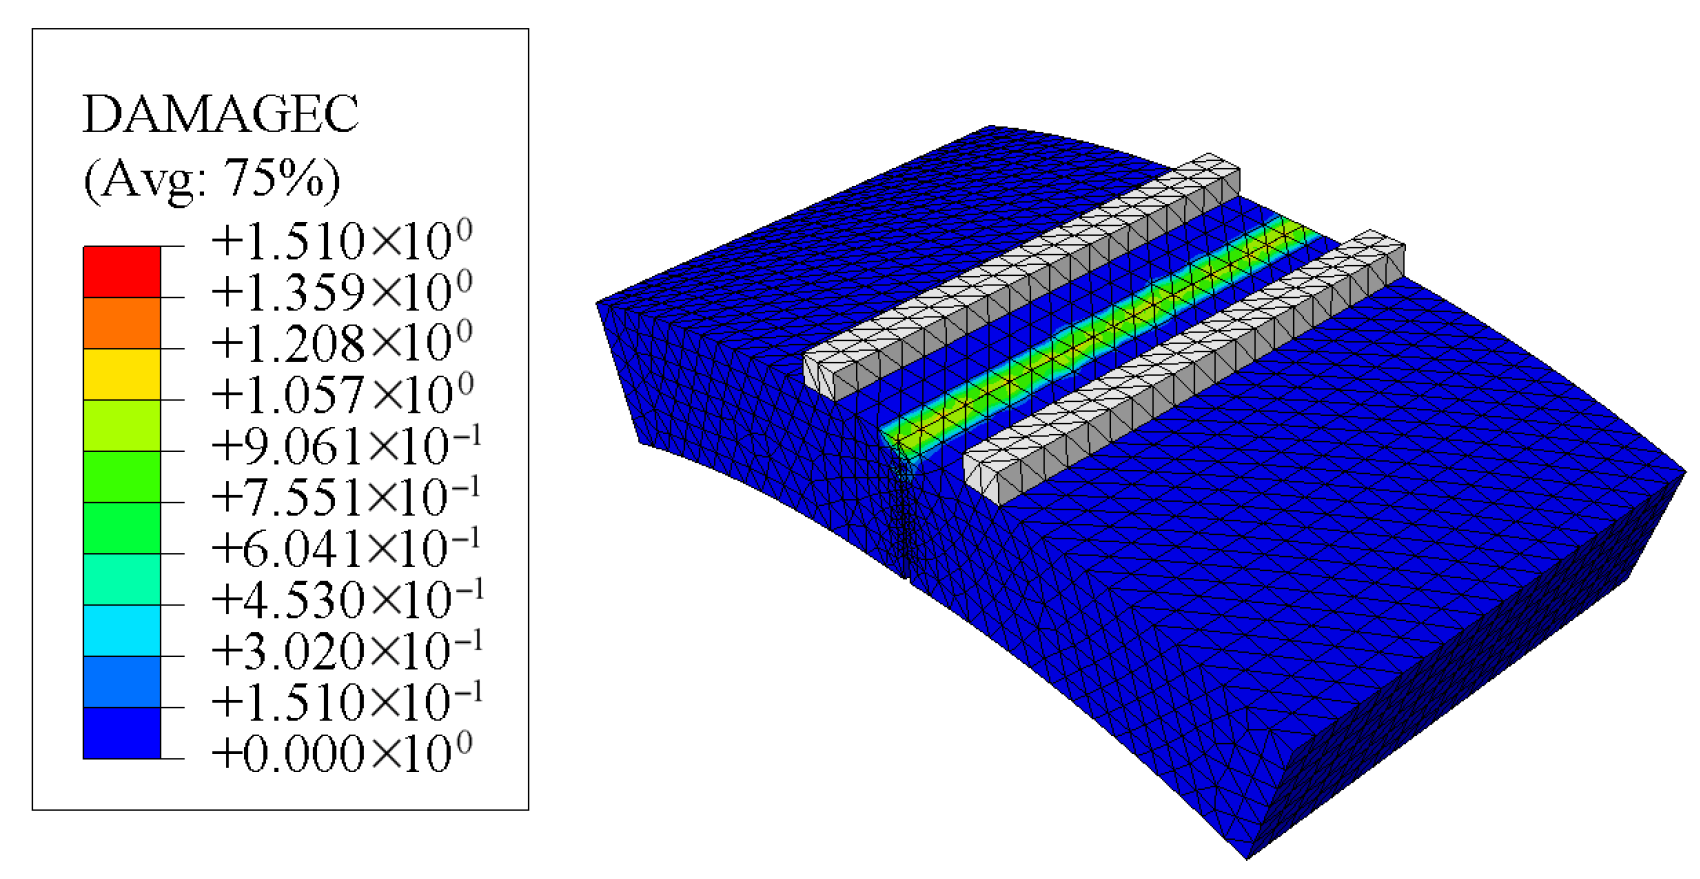
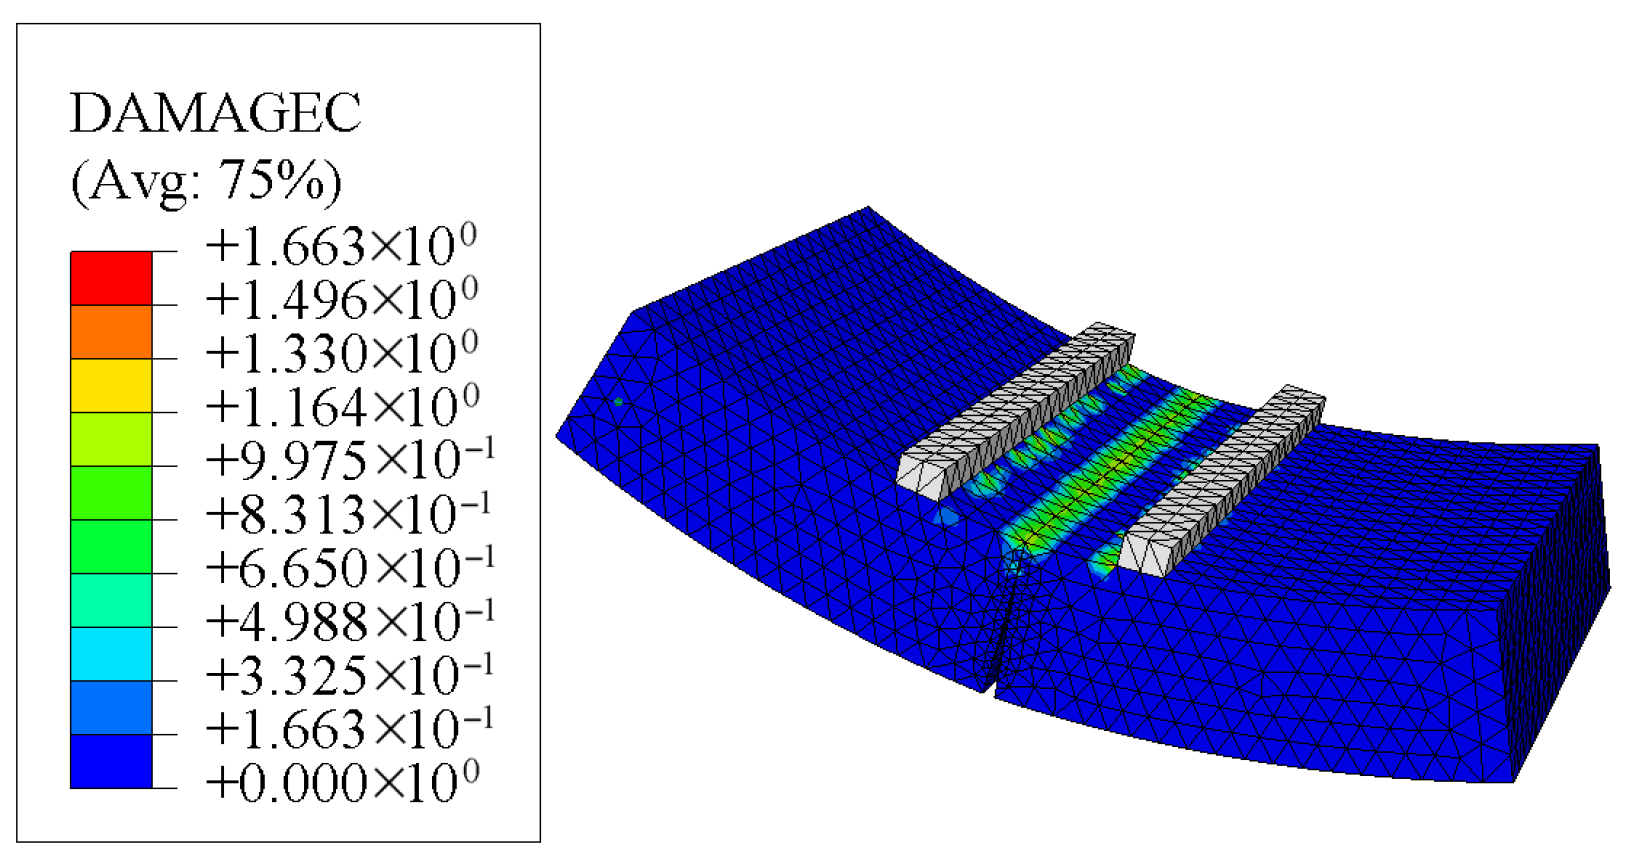
Shield tunnel joints can be categorized into two states based on working conditions: positive and negative bending moment states. These two conditions were also examined in the study by Jin et al. [29] and Zhang et al. [30]. Figure 5 and Figure 6 illustrate the numerical simulation results of compressive damage nephograms for positive and negative bending moment loading conditions, respectively. These two numerical simulations correspond to Figure 8a,b in the study by Zhang et al. [30]. Compared with the testing results of Zhang et al. [30], the finite element numerical simulation established in this paper can effectively simulate the two loading states of the joints in shield tunnels. The compressive damage factor contours presented in Figure 5 and Figure 6 indicate that the loading states reach the ultimate condition of the lining, characterized by crushing at the outer edge of the lining.
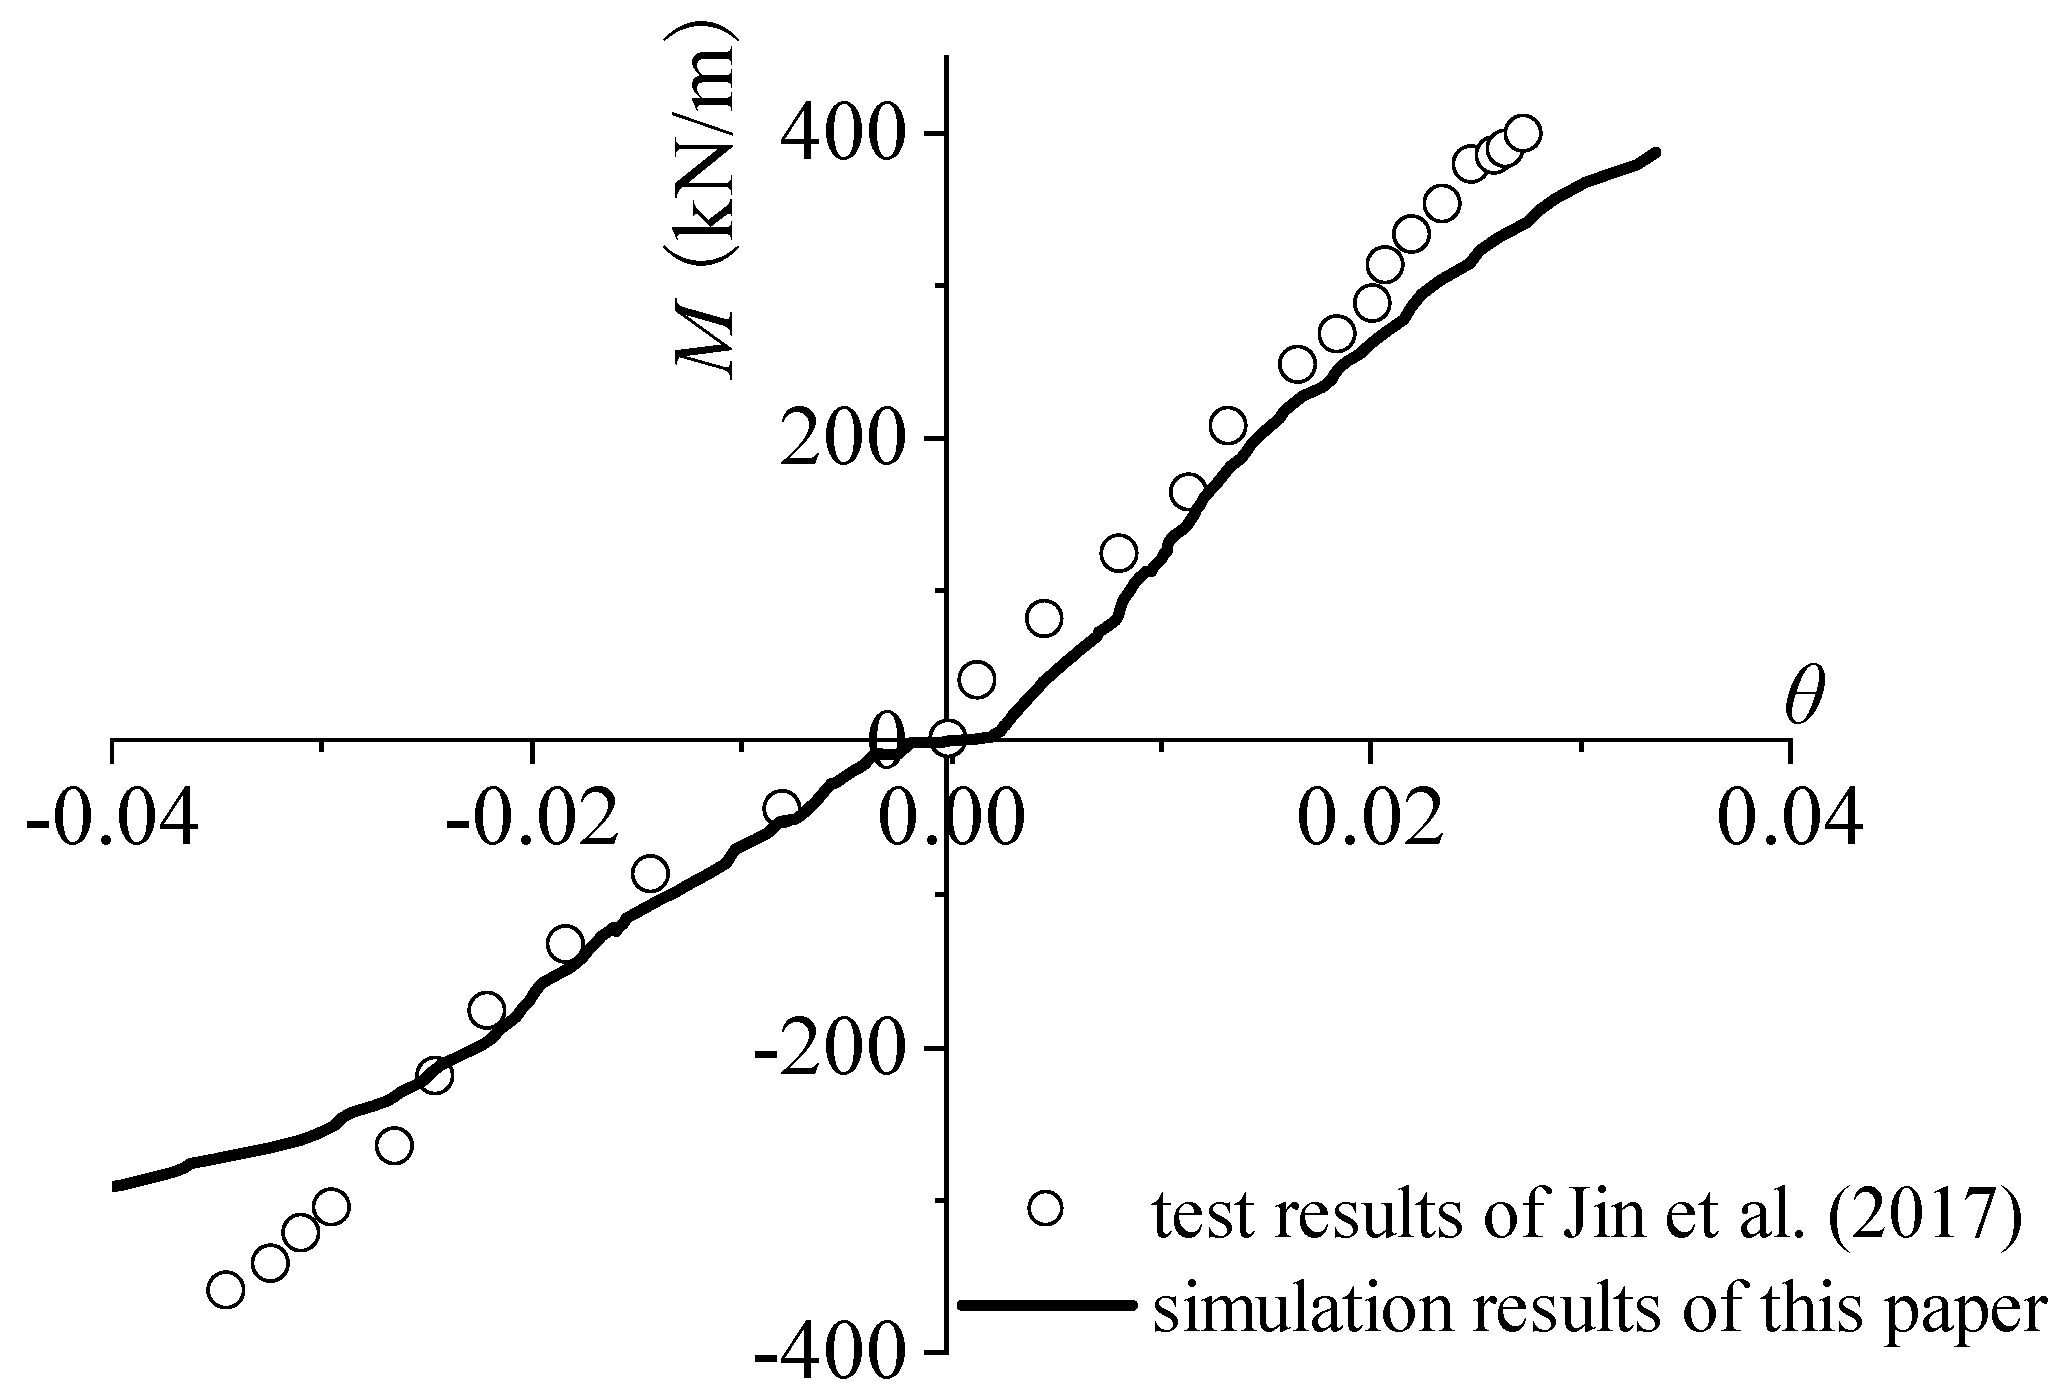
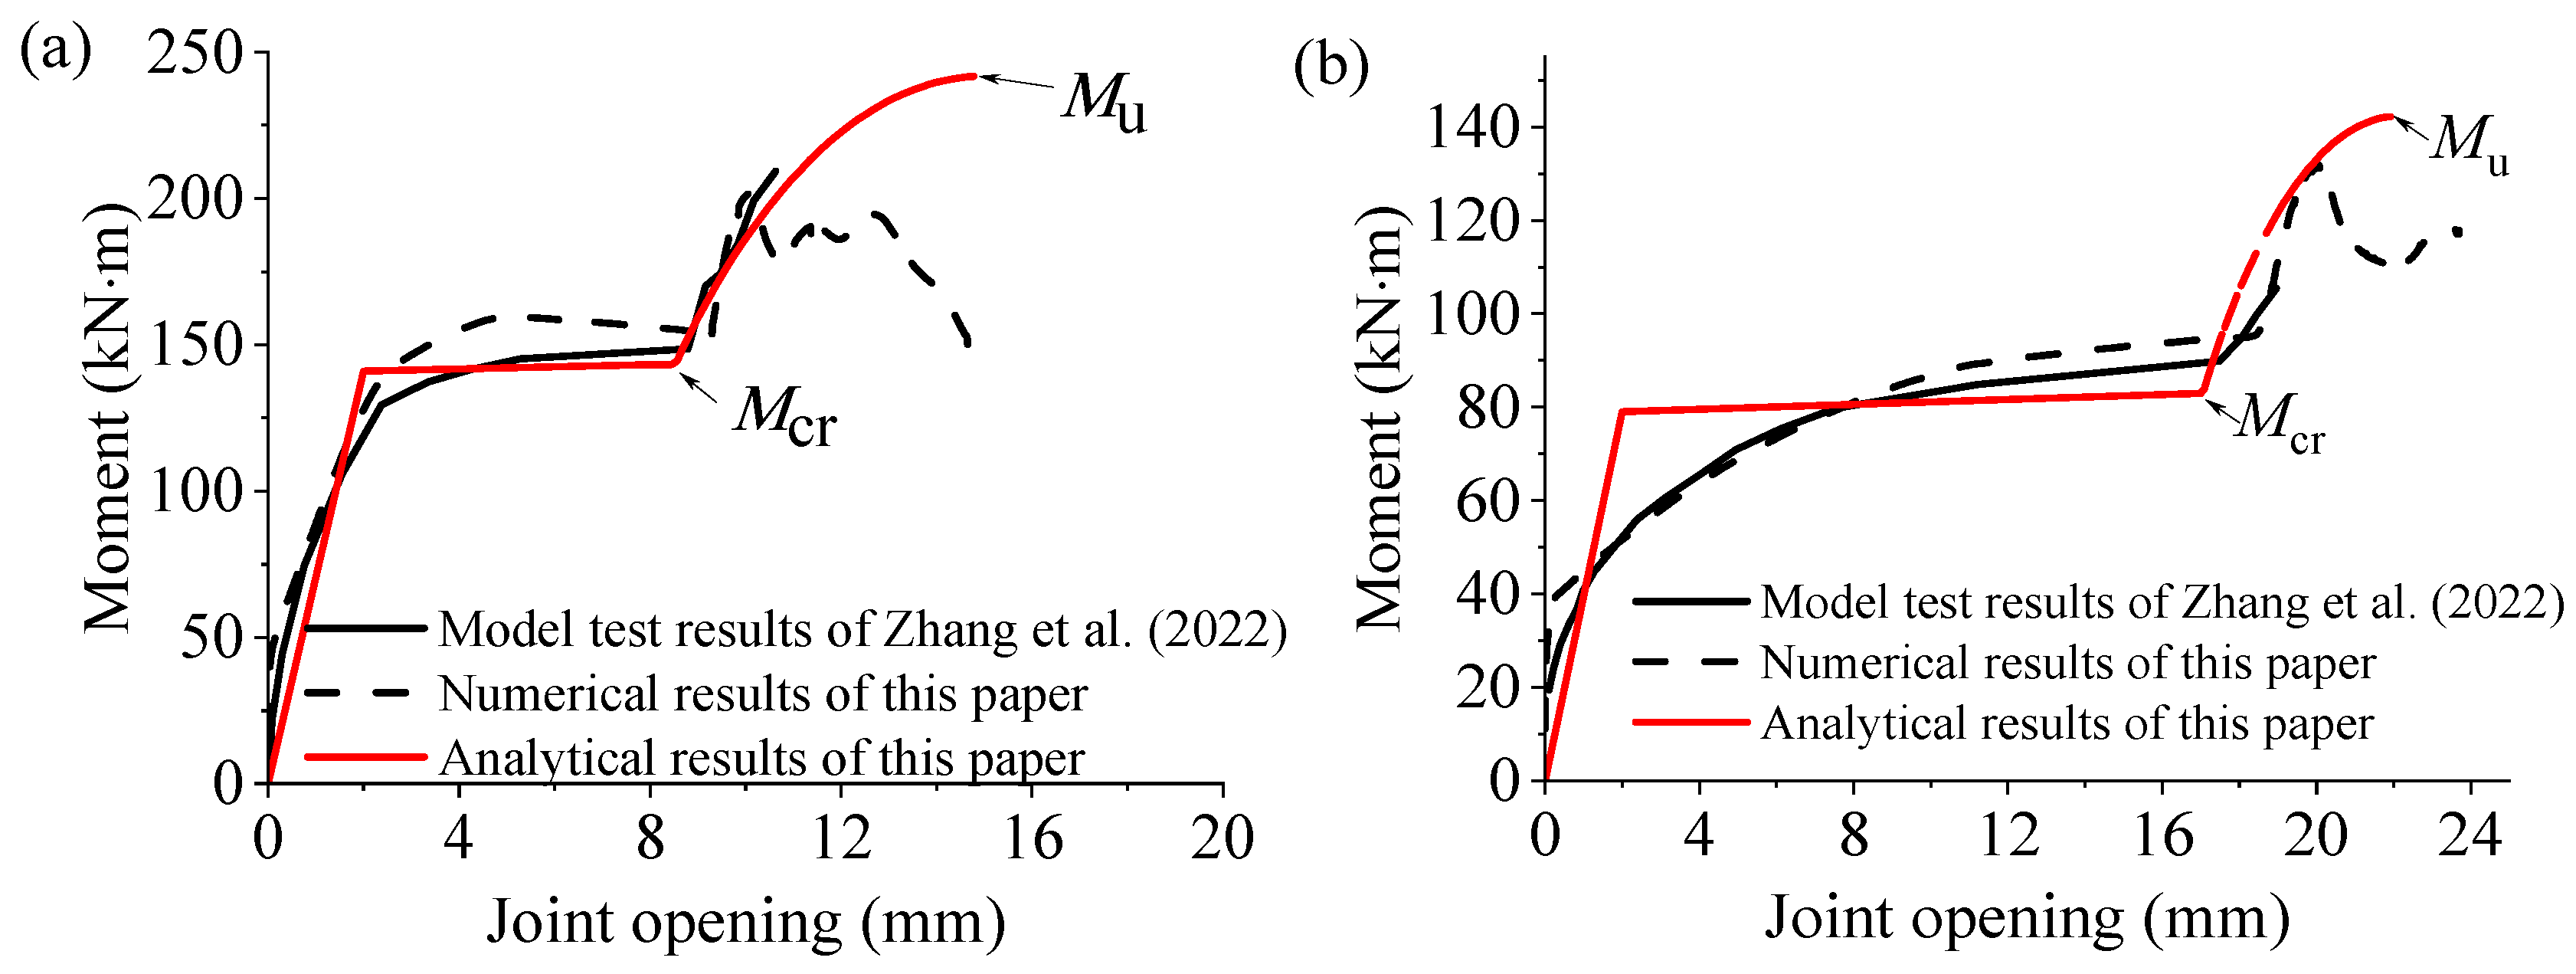
Under external loads, a certain angle is generated at the longitudinal joints of shield tunnels. As the load is applied, the gap at the tension side gradually widens, while the gap on the compression side gradually closes. Figure 7 presents a comparison of the bending moment response curves related to joint rotation angle θ simulated by this paper to the test results of Jin et al. [29]. It can be seen that the numerical results correspond well with the test results. The parameters of the CDP constitutive model were not established using experimental data. When the strain becomes large, there is a significant decrease in strength. This is the primary reason why the difference between the simulation results and the experimental results becomes large when the rotation angle is large. Furthermore, Figure 8 presents a comparison of the bending moment response curves related to joint opening, derived from numerical simulations to the test results of Zhang et al. [30]. Figure 8 also shows the results obtained by the analytical model proposed in this paper, and the analytical model will be described in detail later. The Pearson correlation coefficient ρ = 0.99 and 0.98 between the numerical results and the model test results for the two loading conditions. This further indicates that the finite element numerical model established in this paper can accurately reflect the mechanical characteristics of shield tunnel joints.

2.3. Mechanical Analysis of Tunnel Joints Based on Numerical Simulations

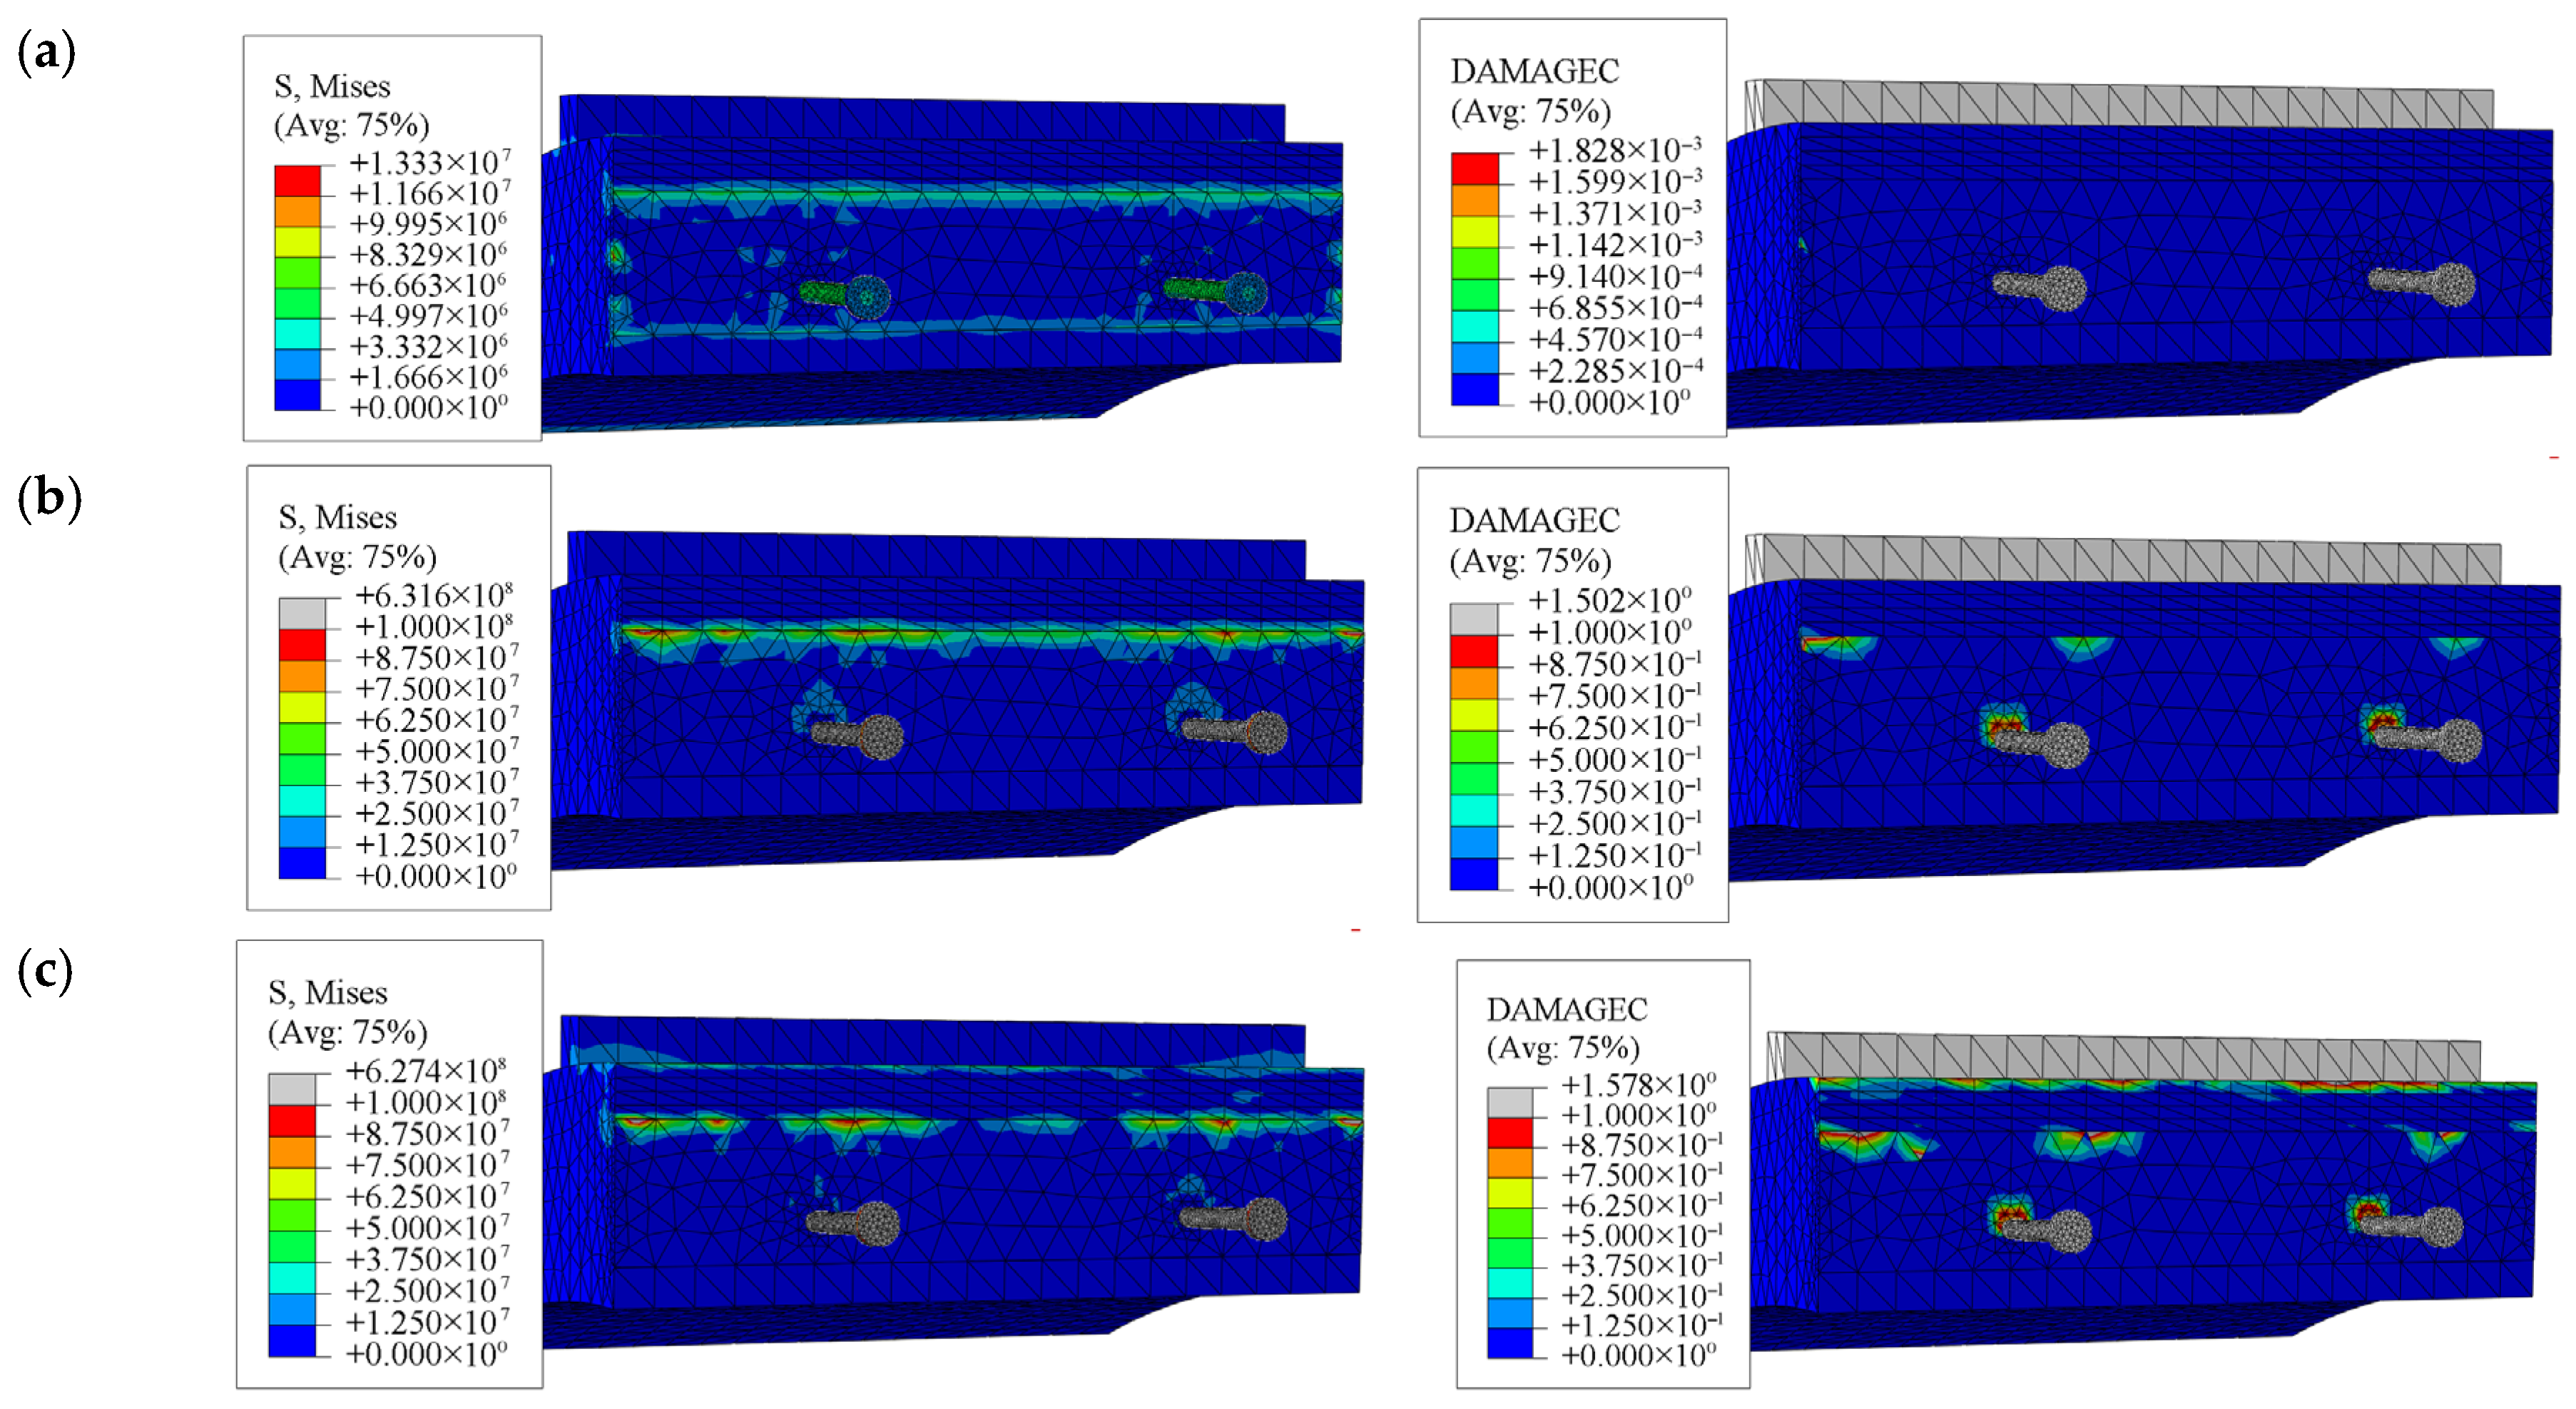
By analyzing the mechanical characteristics of the segments and bolts of shield tunnel joints as the rotation angle increases, the loading states of the joints can be categorized into three distinct loading states, as illustrated in Figure 9. To further illustrate the mechanics characteristic, Figure 10 presents the stress nephogram and compression damage nephogram of the joint for the three loading states. Loading state I occurs when the joint remains closed, causing the concrete around the bolts to be under compression (see Figure 9a). Loading state II arises when there is some degree of opening at the joint, which leads to tension in the concrete at the bolts while the joint gap on the compression side remains unclosed (see Figure 9b). Loading state III involves the closing of the joint gap on the compression side (see Figure 9c). In loading state I, the lining primarily experiences axial pressure with a slight bending moment (see Figure 10a). In loading state II, the lining rotates around the outer edge of the core area of the lining, resulting in compression at the outer edge of the core area (see Figure 10b). This situation also leads to elongation and tension in the bolts, with the bending moment becoming the dominant response. In loading state III, the angle continues to increase, and the outer concrete begins to be pressed (see Figure 10c). When transitioning from loading state II to loading state III, the joint gap on the compression side closes, which increases the effective height of the cross-section. Consequently, a sudden rise in the bending moment is observed, as illustrated in Figure 8.

3. Flexural Capacity Probability Model for the Lining Joints

3.1. Probability Models Used in This Paper

To fully consider the uncertainties of the capacity parameters in the fragility analysis, this paper aims to establish a probability model that can effectively estimate the flexural capacity of the longitudinal joints for shield tunnels. To fully use the effective information contained within analytical methods and overcome the limitations of traditional polynomial-based probability models, Gardoni et al. [35] proposed a method to develop probabilistic models by adding correction terms to analytical methods, utilizing Bayesian methods for model optimization and parameter estimation. This paper adopts this method to establish the flexural capacity probability model for the longitudinal joints of shield tunnels. The mathematical expression of the model form is given in Equation (1).
ln [ C ( x , θ ) ] = ln [ c ^ ( x ) ] + γ ( x , θ ) + σ ε
where C is the flexural capacity of joints; c ^ is the selected deterministic model to estimate the flexural capacity; γ is the correction term that consists of a series of explanatory functions hi(x), and γ ( x , θ ) = i = 1 p θ h i ( x ) ; x is a set of measurable variables; θ is a set of parameters introduced to fit the model; σ is the standard deviation of the model error; ε is a standard normal random variable (with zero mean and unit standard deviation). The logarithmic transformation helps to meet three key assumptions: homoskedasticity ( σ k does not depend on xD), normality ( σ k follows the standard normal distribution), and additivity ( σ k ε k is added to the model).

3.2. Deterministic Model Used in the Probability Model

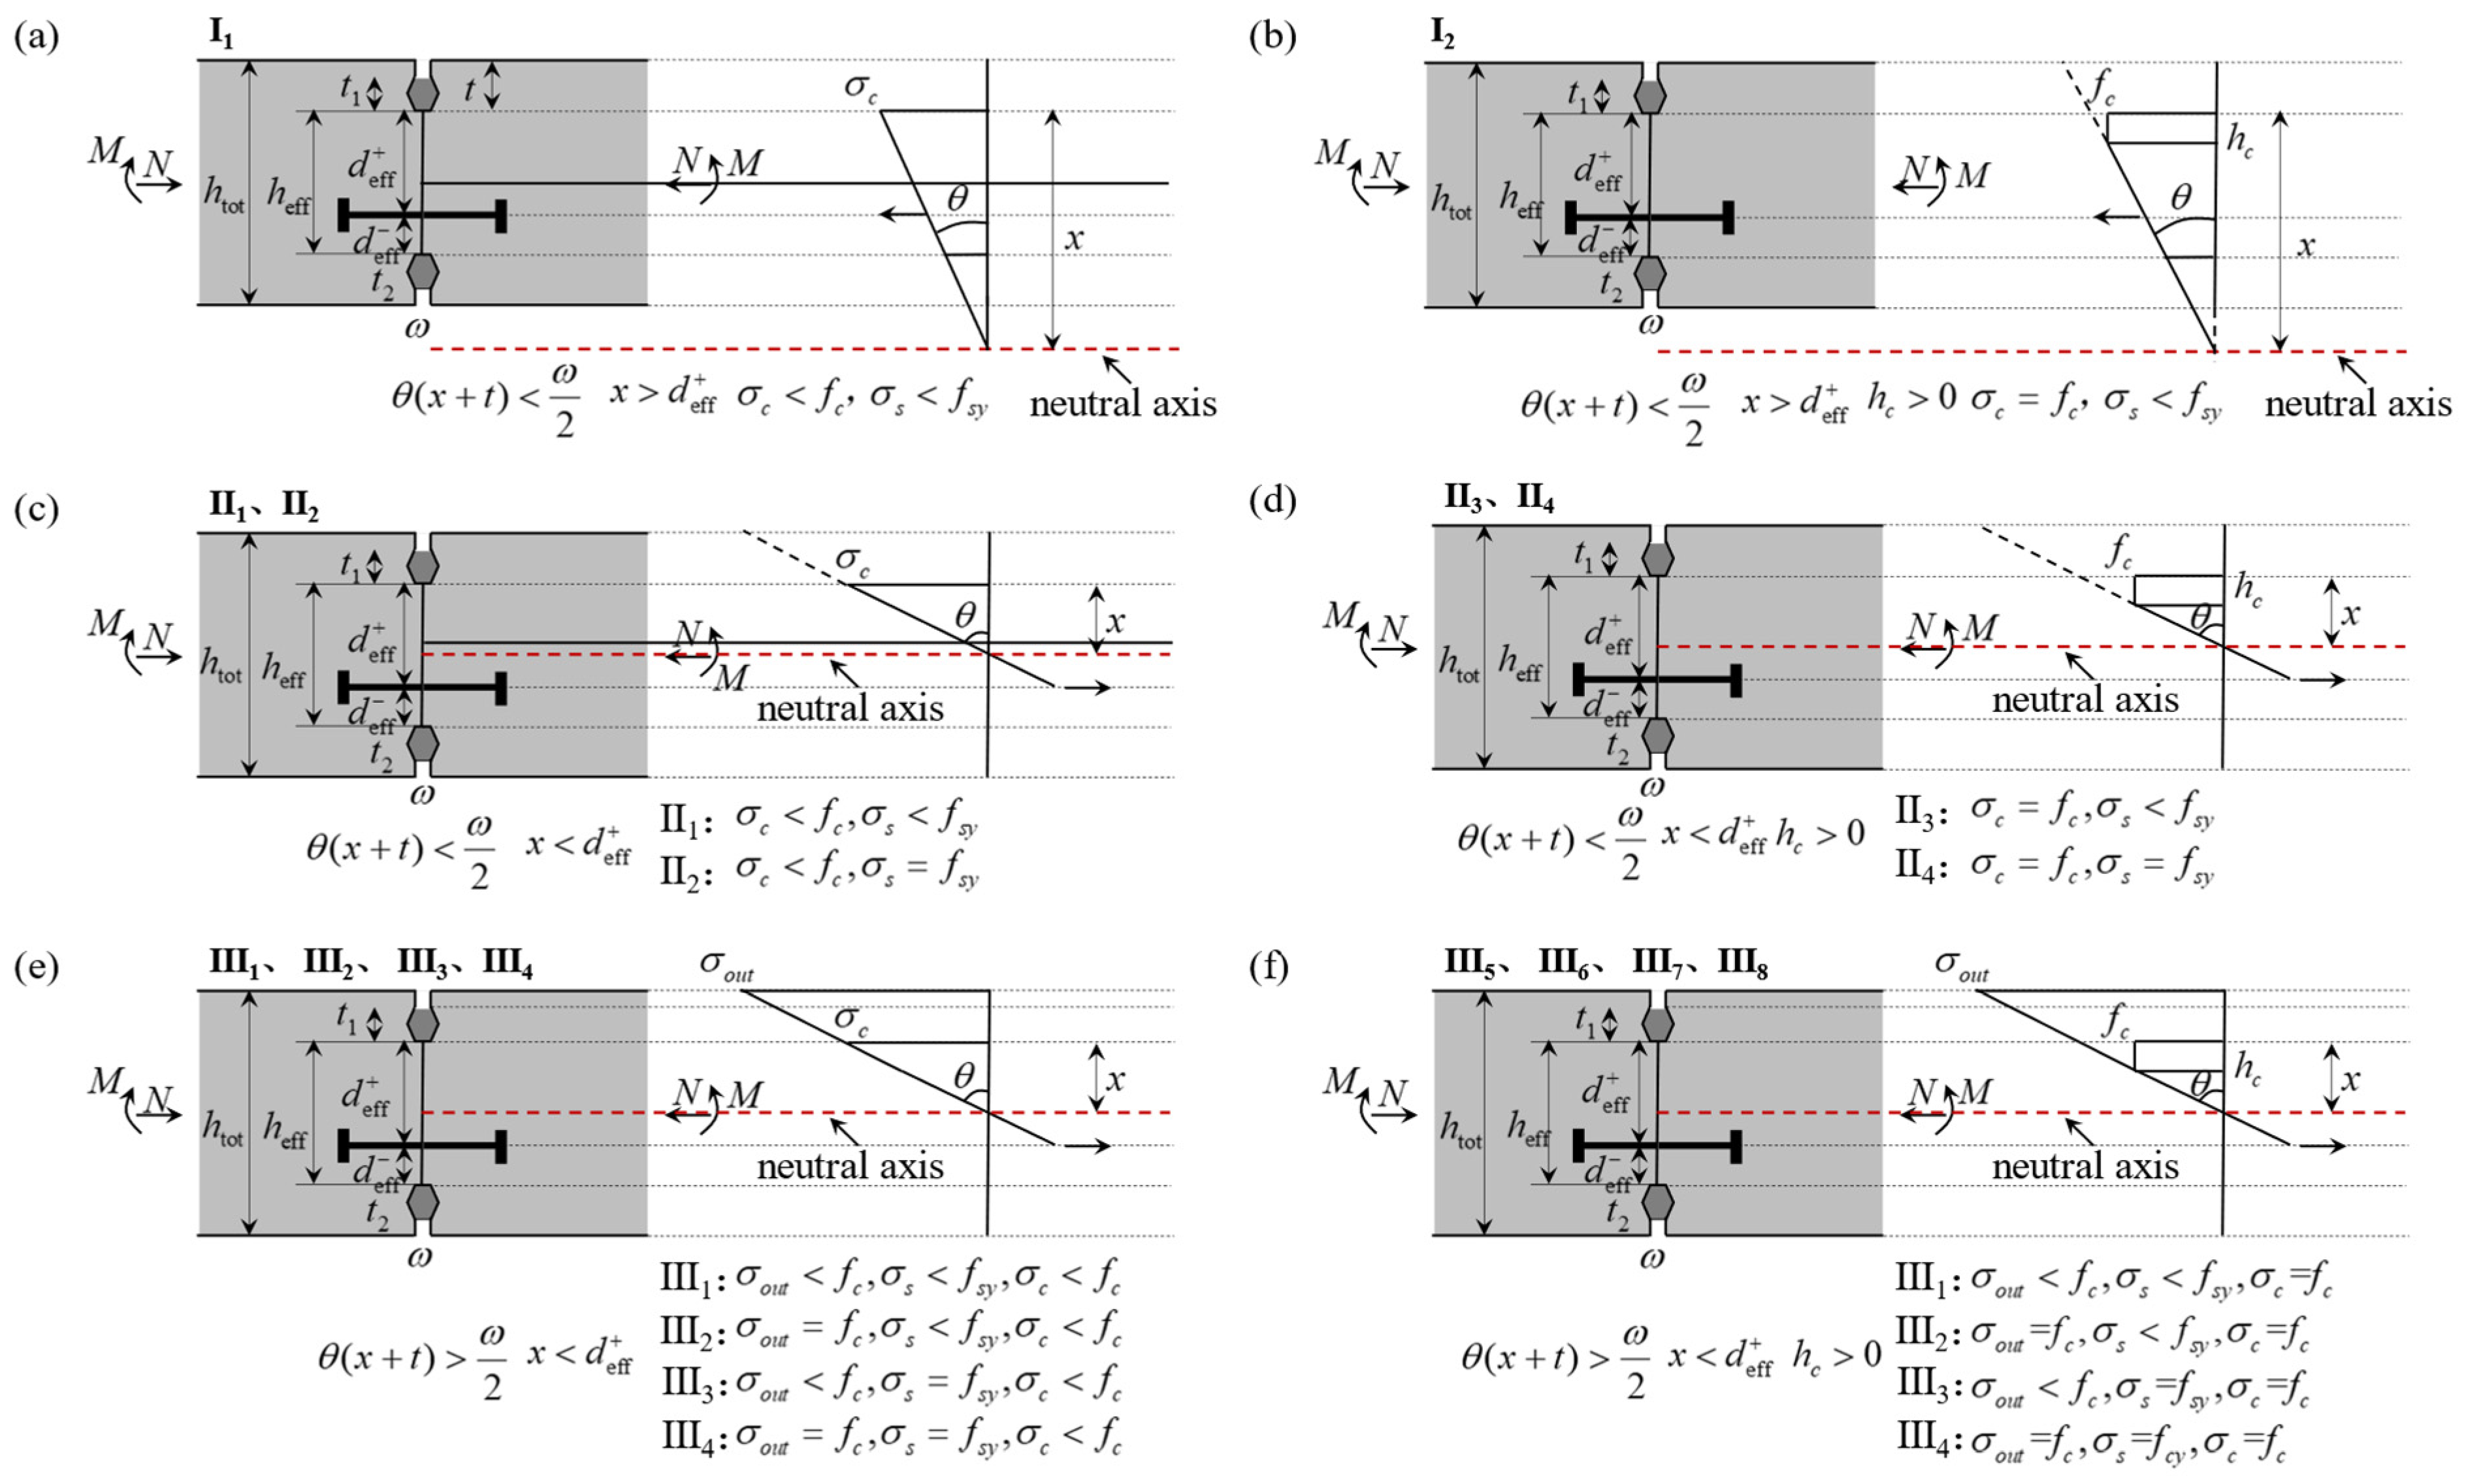
As given in Equation (1), the probability model requires a straightforward analytical approach for calculating flexural capacity. Due to the complexity of previously established analytical methods, this study proposes a more straightforward analytical method to estimate the flexural capacity of the joints based on the underlying mechanical principles. As shown in Figure 9 and Figure 10, the loading states of the shield tunnel joints can be categorized into three situations. This paper calculates the moment response of all three conditions and then gives the curve of the moment response to the joint opening, finally determining the flexural capacity. Figure 11 shows the mechanical diagram for each situation. The loading state I is divided into two sub-categories, I1 and I2; The loading state II is divided into four sub-categories: II1 to II4. The loading state III is divided into eight sub-categories: III1 to III8.
The rotation angle between the lining on both sides of the joint is assumed as θ. To calculate the bending moment response of the lining to θ, θ is given a small initial value, and then the value of θ is gradually increased, and the loading state of the lining is determined at each step. The height of the compression zone x is calculated by the static equilibrium equation, which is the balance between the axial force generated by the deformation of the concrete in the core zone, the deformation of the concrete at the outer edge and the deformation of the bolt and the axial force level N. Table 1 gives the static equilibrium equations of the 14 sub-categories.
In Table 1 and Figure 11, lc is the length of lining on one side of the joint; htot is the lining thickness; t1 is the depth of the lining gap; ω is the width of the lining gap; t2 is the thickness of the sealing pad; t is the thickness of the concrete at the lining edge (t = t1 + t2); heff is the effective thickness of the core area of the joint (heff = htot − 2t); d eff + is the distance from the center of the bolt to the upper edge of the core area; d eff is the distance from the centerline of the bolt to the lower edge of the core area; As is the cross-sectional area of the bolt; σsp is the bolt preload stress; fsy is the yield strength of the bolt; Es is the elastic modulus of the bolt; fc is the compressive yield strength of the concrete; Ec is the elastic modulus of the concrete; σc is the stress of the concrete in the core area; σout is the stress of the concrete in the outer edge of the lining; σs is the stress of the bolt; hc is the yield height of the concrete in the core area.
Using the height of the compression zone x as the main parameter, the stress of the concrete in the core area σc, the stress of the concrete in the outer edge of the lining σout, the stress of the bolt σs, and the yield height of the concrete in the core area hc can be calculated based on deformation coordination and static equilibrium, and are given as follows:
σ c = E c θ x l c
σ o u t = [ θ ( x + t ) l c ω 2 l c ] E c
σ s = d e f f + x x E c σ c E s + σ s p
h c = x f c l c E c θ
In the study of Andreotti et al. [22], a damage index (DI) was defined to consider the damage of the concrete. This paper adopts the same method to consider the damage behavior of the concrete. The lining damage index DI is defined as:
D I = θ θ c r θ u θ c r , θ > θ c r
where θu is the limit Angle, and θcr is the critical Angle, and are defined as:
θ cr = f c l c E c x
θ u = ε cu l c x
where εcu is the ultimate compressive strain in concrete.
The elastic modulus of the damaged concrete is calculated by Equation (9). As suggested by Andreotti et al. [22], α = 0.05 in this paper.
E c , damage = ( 1 D ) α E c
The bending moment M of the joint can be calculated according to the corresponding loading state based on mechanical principle.
Figure 8 provides a comparison between the analytical method, numerical results, and test results under positive and negative bending moment states, respectively. For the positive bending moment loading condition, the Root Mean Square Error RMSE between the analytical results and the model test results is 8.75 kN·m, and the 95% confidence interval CI is from 8.74 kN·m to 8.78 kN·m, and the Pearson correlation coefficient ρ = 0.98. RMSE = 15.41 kN·m, CI = [15.39 15.44] kN·m, and ρ = 0.96 between the analytical results and the numerical results. For the negative bending moment loading condition, RMSE = 9.21 kN·m, CI = [9.18 9.23] kN·m, and ρ = 0.83 between the analytical results and the model test results, and RMSE = 11.87 kN·m, CI = [11.85 11.89] kN·m, and ρ = 0.79 between the analytical results and the numerical results. Therefore, the proposed analytical method demonstrates a certain degree of accuracy.
The numerical results account for the damage and degradation behavior of concrete using the CDP constitutive model. In contrast, the analytical method considers damage to the concrete using a simple parameter, DI, which cannot fully assess the damage behavior. Moreover, when the joint opening is large, the tunnel joint geometry also undergoes significant changes, resulting in additional bending moments. It is the main reason why the analytical solution yielded larger values than the numerical results. In Figure 8, the value occurred before the second upward trend is termed the critical flexural capacity Mcr, while the maximum value along the curve is referred to as the ultimate flexural capacity Mu. Given that some parts of the lining cross-section are under positive bending moment states and others under negative bending moment states to seismic loading, this study adopts the minimum of the ultimate flexural capacities under positive and negative bending moment states as the flexural capacity of the joint.

3.3. Sample Points Generation Used for Model Calibration

The levels of axial force within the lining, the concrete strength grade, and the steel grade of the bolts significantly influence the flexural capacity at the joints. Extensive research has been conducted on the effects of these factors on the flexural capacity of lining joints (e.g., [7,24]) and thus will not be discussed in detail here. A single model test can only be applicable to specific conditions and cannot serve as an accurate representation for other scenarios. While numerical simulations can economically provide the flexural capacity of a specific shield tunnel joint, the modeling process is complex and requires designers to possess a high level of finite element modeling expertise. The assumptions and simplifications inherent in analytical calculation methods do not completely align with real-world conditions, resulting in a certain degree of inherent bias in the values produced. To achieve a more accurate estimation of the flexural capacity of lining joints while considering the potential randomness of various factors, this study establishes a probability model based on finite element numerical simulation results as samples.
This paper employs ABAQUS to establish a series of refined finite element models of the longitudinal joints of shield tunnels. To enhance the general applicability of the probability model, the generation of finite element samples takes into account the influence of tunnel radius, lining thickness, concrete grade, bolt grade, and axial force environment on the flexural capacity of the joints. Considering practical engineering conditions, five different tunnel radii are evaluated: r = 3 m, 4 m, 5 m, 6 m, and 7 m, along with five different lining thicknesses: t = 0.3 m, 0.35 m, 0.4 m, 0.45 m, and 0.5 m, resulting in a total of 25 combinations. To rationally reduce the number of sample points, this paper adopts the uniform design proposed by Fang [36] and Wang and Fang [37] to generate simulation samples. The primary concept of the uniform design is to distribute experimental points evenly across the experimental domain. In some ways, uniform design is similar in principle to Latin hypercube design.
Uniform design is employed for the factors of concrete grade, bolt diameter, bolt grade, and axial force environment, with each group of factors having 9 levels (as shown in Table 2). For each combination of tunnel radius and lining thickness, there are 9 sample points, yielding a total of 25 × 9 = 225 sample points.

3.4. Model Optimization and Parameter Calibration

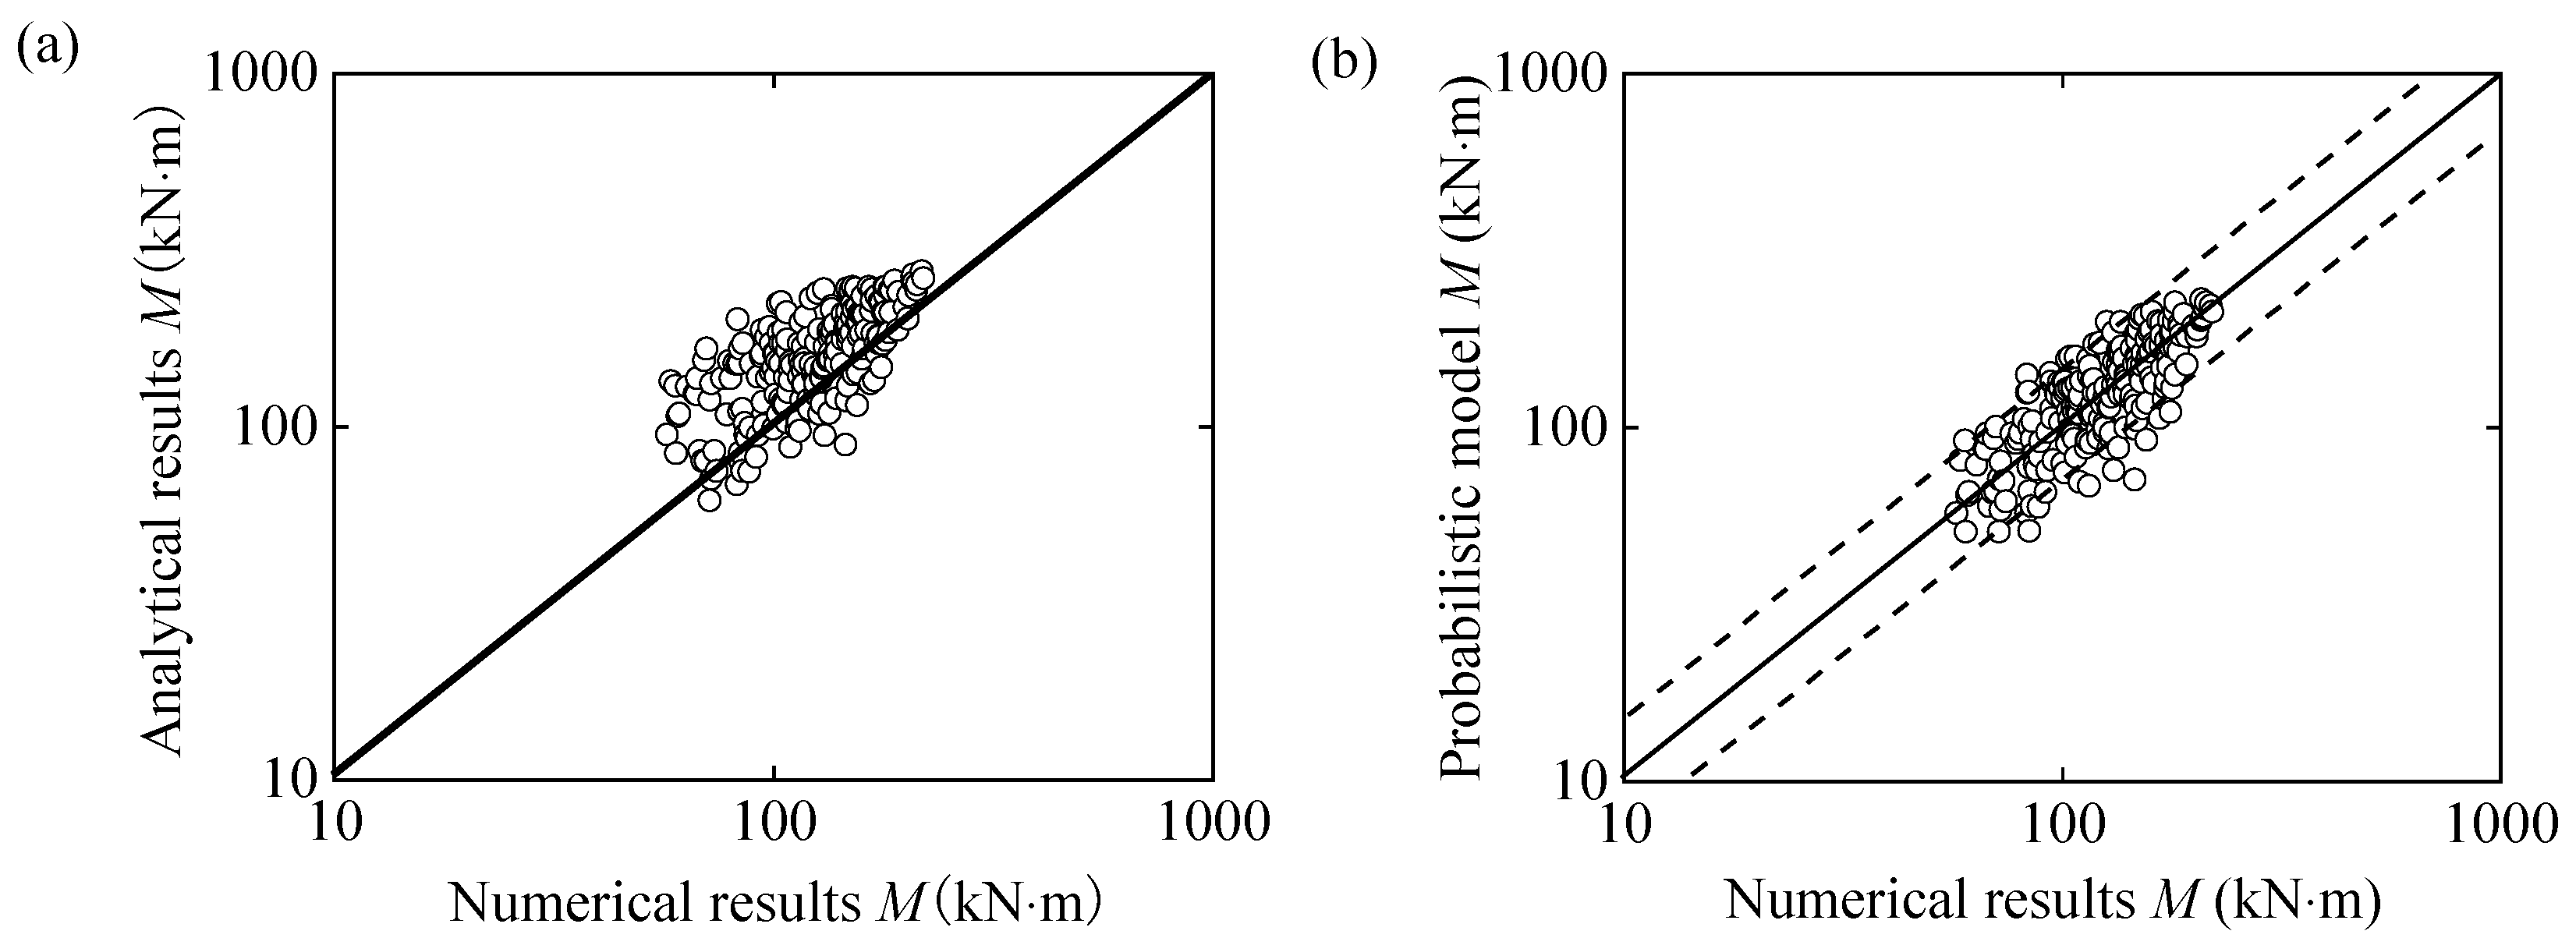
Figure 12a presents a scatter plot comparing the proposed analytical metho with numerical results. As shown, the analytical solutions are generally greater than the numerical results, indicating that the analytical method exhibits a certain degree of inherent bias, albeit minor. It is mainly caused by the inherent discrepancies in the assumptions of the damage behaviors of the lining and bolts. The probability model established by Gardoni et al. [35] is built upon the analytical method with the addition of a series of potential linear correction terms. Bayesian methods are then employed to estimate the posterior distribution of the coefficients of these correction terms, progressively eliminating those with high coefficients of variation in their posterior distributions to obtain a simplified probability model.
In this study, 9 parameters are selected as potential explanatory functions (see Table 3). In Table 3, a constant term of 1 is included as an explanatory function to account for the inherent bias in the model. Following Bayesian estimation and model optimization, three explanatory functions are retained in the final probability model: bolt yield strength fsy, bolt tensile strength fsu, and axial force environment N. The mathematical formulation of the final probability model is given in Equation (10), with the posterior statistics of the model parameters presented in Table 4. Figure 12b illustrates a scatter plot comparing the proposed probability model with numerical results. Compared to Figure 12a, the data points in Figure 12b are more closely distributed around the 1:1 line. As given in Table 4, the logarithmic standard deviation of the data shown in Figure 12b is 0.204. The results show that the logarithmic standard deviation of the data shown in Figure 12b is 0.0.343. Therefore, the probabilistic model not only eliminates the inherent bias in the analytical method but also significantly reduces the randomness of the data.
ln ( C M ) = ln ( c ^ M ) + θ c + θ fsy f sy + θ fsu f su + θ N N + σ M ε M
where C is the flexural capacity of joints; c ^ is the flexural capacity estimated by the proposed deterministic model; fsy, fsu, and N are the bolt yield strength, bolt tensile strength, and the axial force environment, respectively; θc, θfsy, θfsu, and θN are the model coefficients; σ is the standard deviation of the model error; ε is a standard normal random variable (with zero mean and unit standard deviation).

4. Seismic Fragility Analysis

4.1. Fragility Calculation Method and Damage Index

In the literature, the ratio between capacity and demand is commonly employed to assess the failure states in the fragility analysis of tunnels. In view of this, this paper adopts Equation (11) as the limit state equation.
g ( x , θ ) = C ( x C , θ C ) D ( x D , θ D )     D I
where C represents the flexural capacity probability model; D is the seismic demand probability model; xC and xD are measurable physical parameter quantities in the capacity and seismic demand probability models, respectively; θC and θD are coefficients in the capacity and seismic demand probability models, respectively; x is the union of xC and xD; θ is the union of θC and θD and DI denotes the failure index.
The fragility of the lining structure can be defined as:
F ( x , θ ) = P g ( x , θ ) 0 | x D , θ
where P[A|xD, θ] denotes the conditional probability of event A given the coefficients θ and xD.
To compute the fragility curves by using Equations (11) and (12), a seismic demand model is required. Although previous studies have proposed various types of seismic demand models for tunnels, these models are usually simple expressions obtained by regression analyses, with the uncertainties cannot be fully considered. In addition, these models only provided the bending moment response of the lining to seismic loads. As stated above, the flexural capacity of joints is influenced by the axial force environment. Therefore, a probability model that accounts solely for the bending moment response cannot accurately present the fragility curve of the joints of shield tunnels. Zhao et al. [28] proposed a trivariate moment-thrust-distortion model that can estimate the bending moment, axial force, and deformation of circular tunnel lining to seismic loads, and the correlations between different demand measures were considered based on Bayesian approaches. This paper adopts the bending moment and axial force demand probability models proposed by Zhao et al. [28] and integrates them with the proposed flexural capacity probability model. Following the damage index defined by Argyroudis & Pitilakis [14], this study categorizes the tunnel lining into three damage states: slight damage (1.0 < DI ≤ 1.5), moderate damage (1.5 < DI ≤ 2.5), and severe damage (DI > 2.5). Based on Equations (11) and (12), the fragility curves of the joints of shield tunnels can be calculated by using Monte Carlo method. Compared with the previous studies that used a fixed logarithmic standard deviation to consider the randomness of the capacity, the probability model presented in this paper can more comprehensively consider the potential randomness of various influencing factors.

4.2. Fragility Curves and Comparisons with Previous Studies

As an example, a tunnel case from the research by Hashash et al. [38] is used as the target structure for calculating the fragility curve. This tunnel has an external lining diameter of 6 m, a lining thickness of 0.3 m, an elastic modulus of concrete of 24.8 GPa, a Poisson’s ratio of 0.2, a site shear wave velocity of 250 m/s, a surrounding rock density of 1920 kg/m3, an embedded depth of 15 m, a moment magnitude of 7.5, and a fault distance of 10 km. For the purposes of calculating the flexural capacity of the joints, it is assumed that the bolt grade is 6.8, with a bolt diameter of 30 mm, yielding a corresponding yield strength of 480 MPa and a tensile strength of 600 MPa.
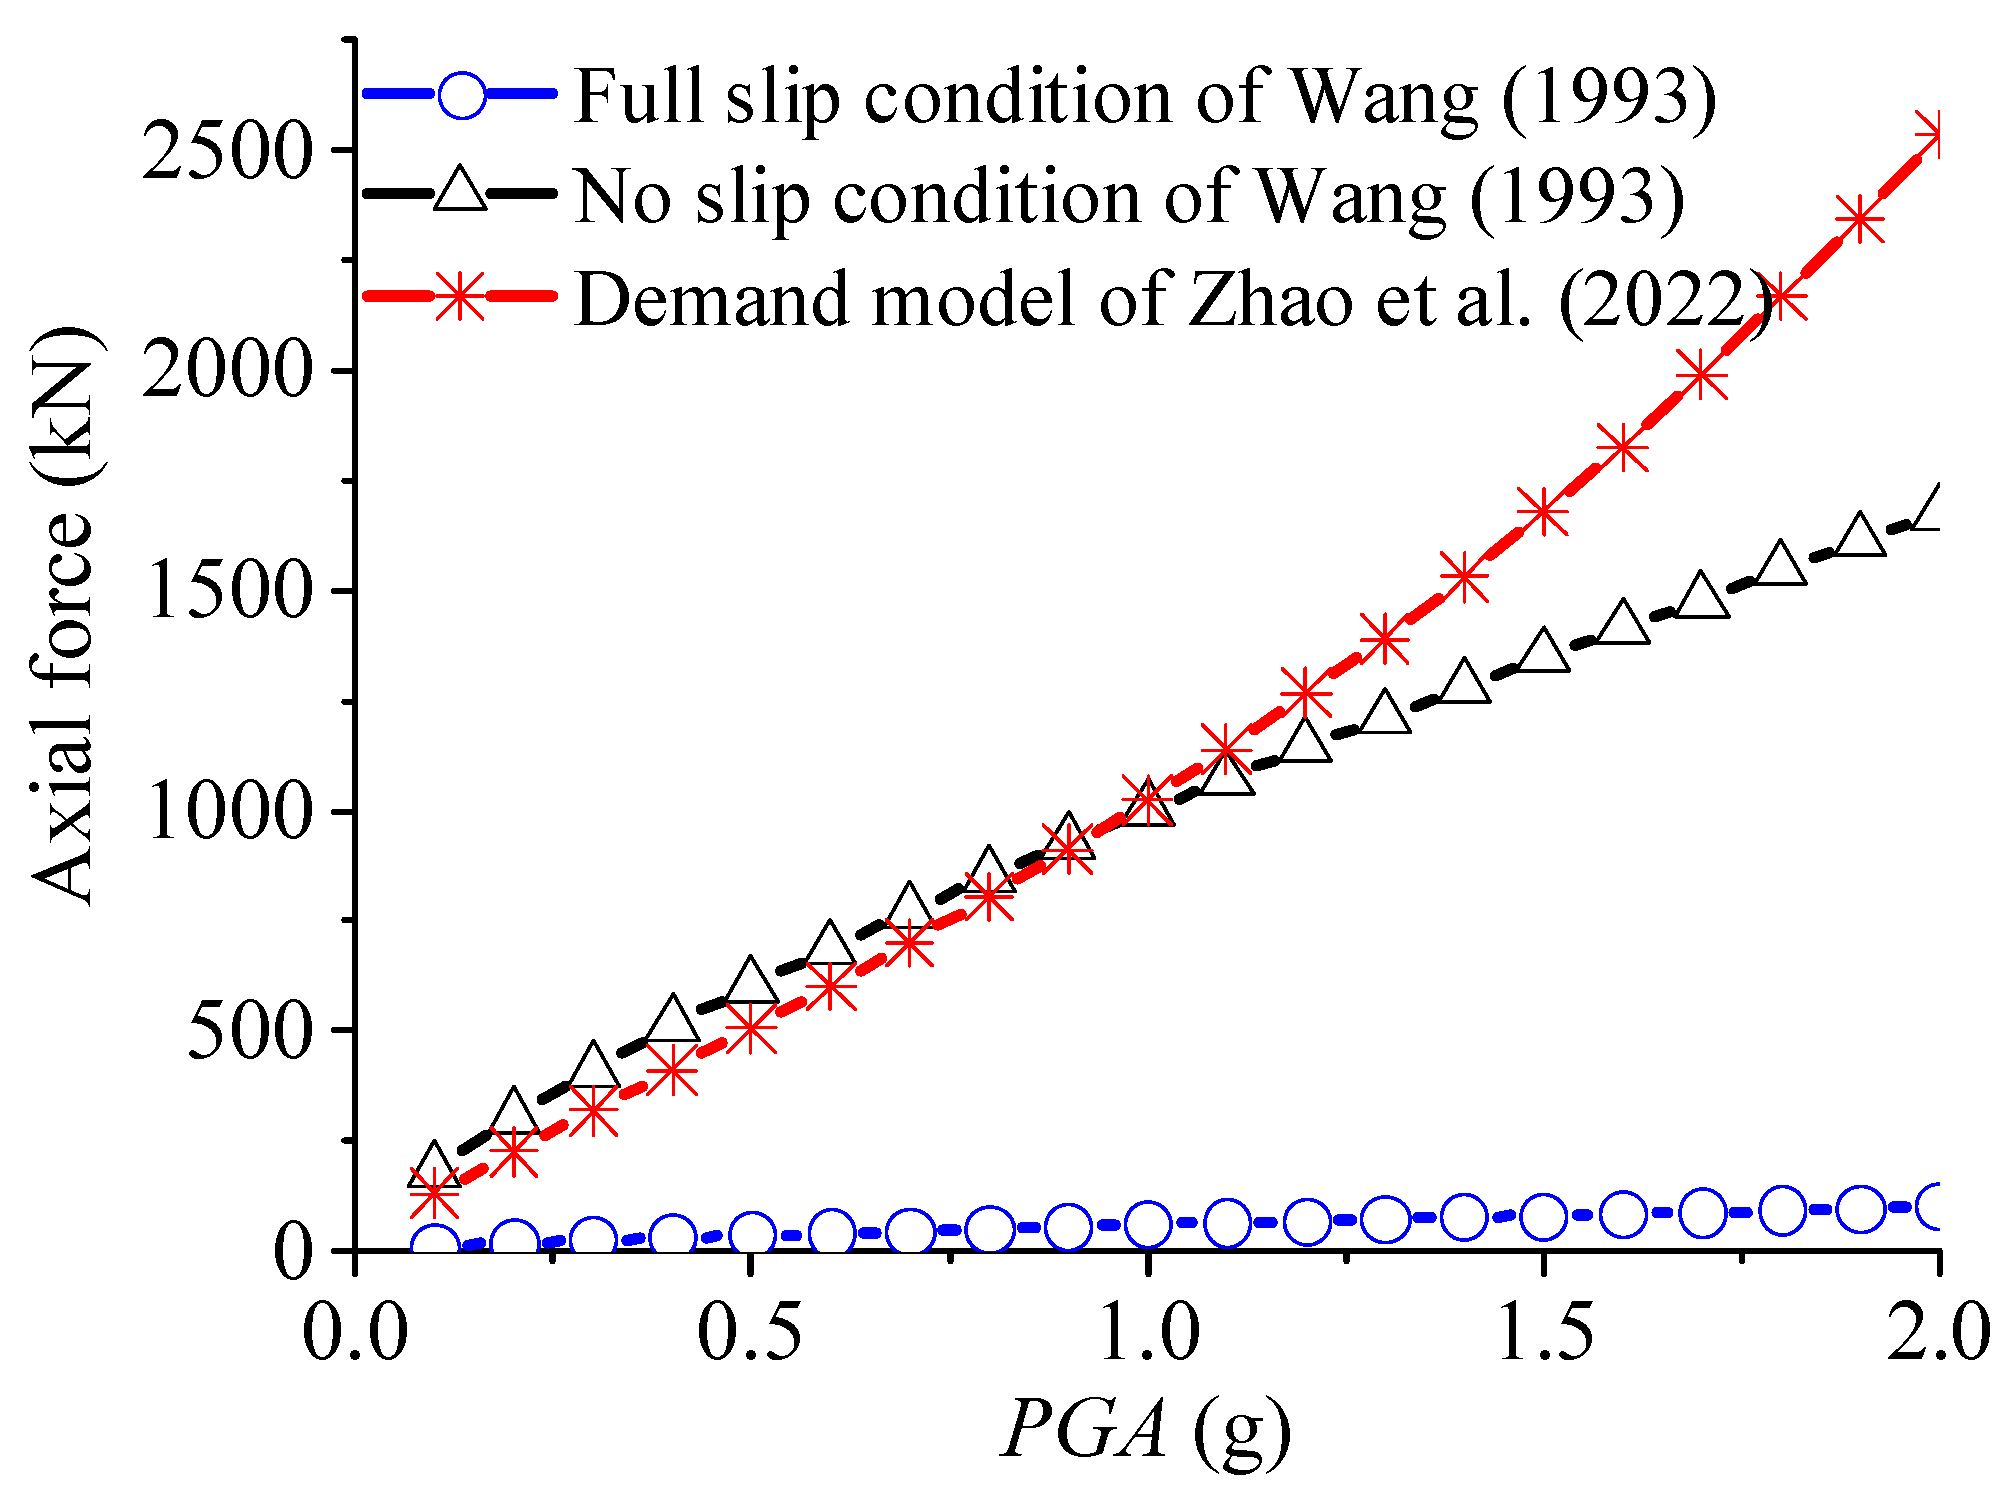
The interface condition between the surrounding soil and the lining can significantly affect the axial force of the lining when subjected to seismic loads. As mentioned earlier, the axial force of the lining is crucial as it can greatly influence the flexural capacity of the joints. To demonstrate how the interface condition affects the fragility results of the lining joints, the analytical models for no-slip and full-slip conditions provided by Wang [39], and the seismic demand model presented by Zhao et al. [28] are utilized to estimate the axial force response of the example tunnel lining, see Figure 13. As shown in Figure 13, the axial force response within the lining calculated by the analytical method under full-slip condition is very small. The results of the probability model proposed by Zhao et al. [28] and the results of the analytical method under no-slip condition are significant. It should be noted that the difference between the method proposed by Zhao et al. [28] and the analytical method for no-slip condition is affected by the relative stiffness between the tunnel and the surrounding rock. The difference shown in Figure 13 is just an example. When parameters such as the lining radius are changed, the difference between the results for the two methods will change. As shown in Figure 13, when PGA is equal to 1.0 g, the axial force response within the lining is approximately 1000 kN. The axial force environment has a significant impact on the flexural capacity of the lining joints, but it is overlooked in existing fragility analyses. It should be noted that, due to the high compressive strength of concrete, the analysis indicates that in actual earthquakes, the lining structure will not be damaged by excessive axial force.
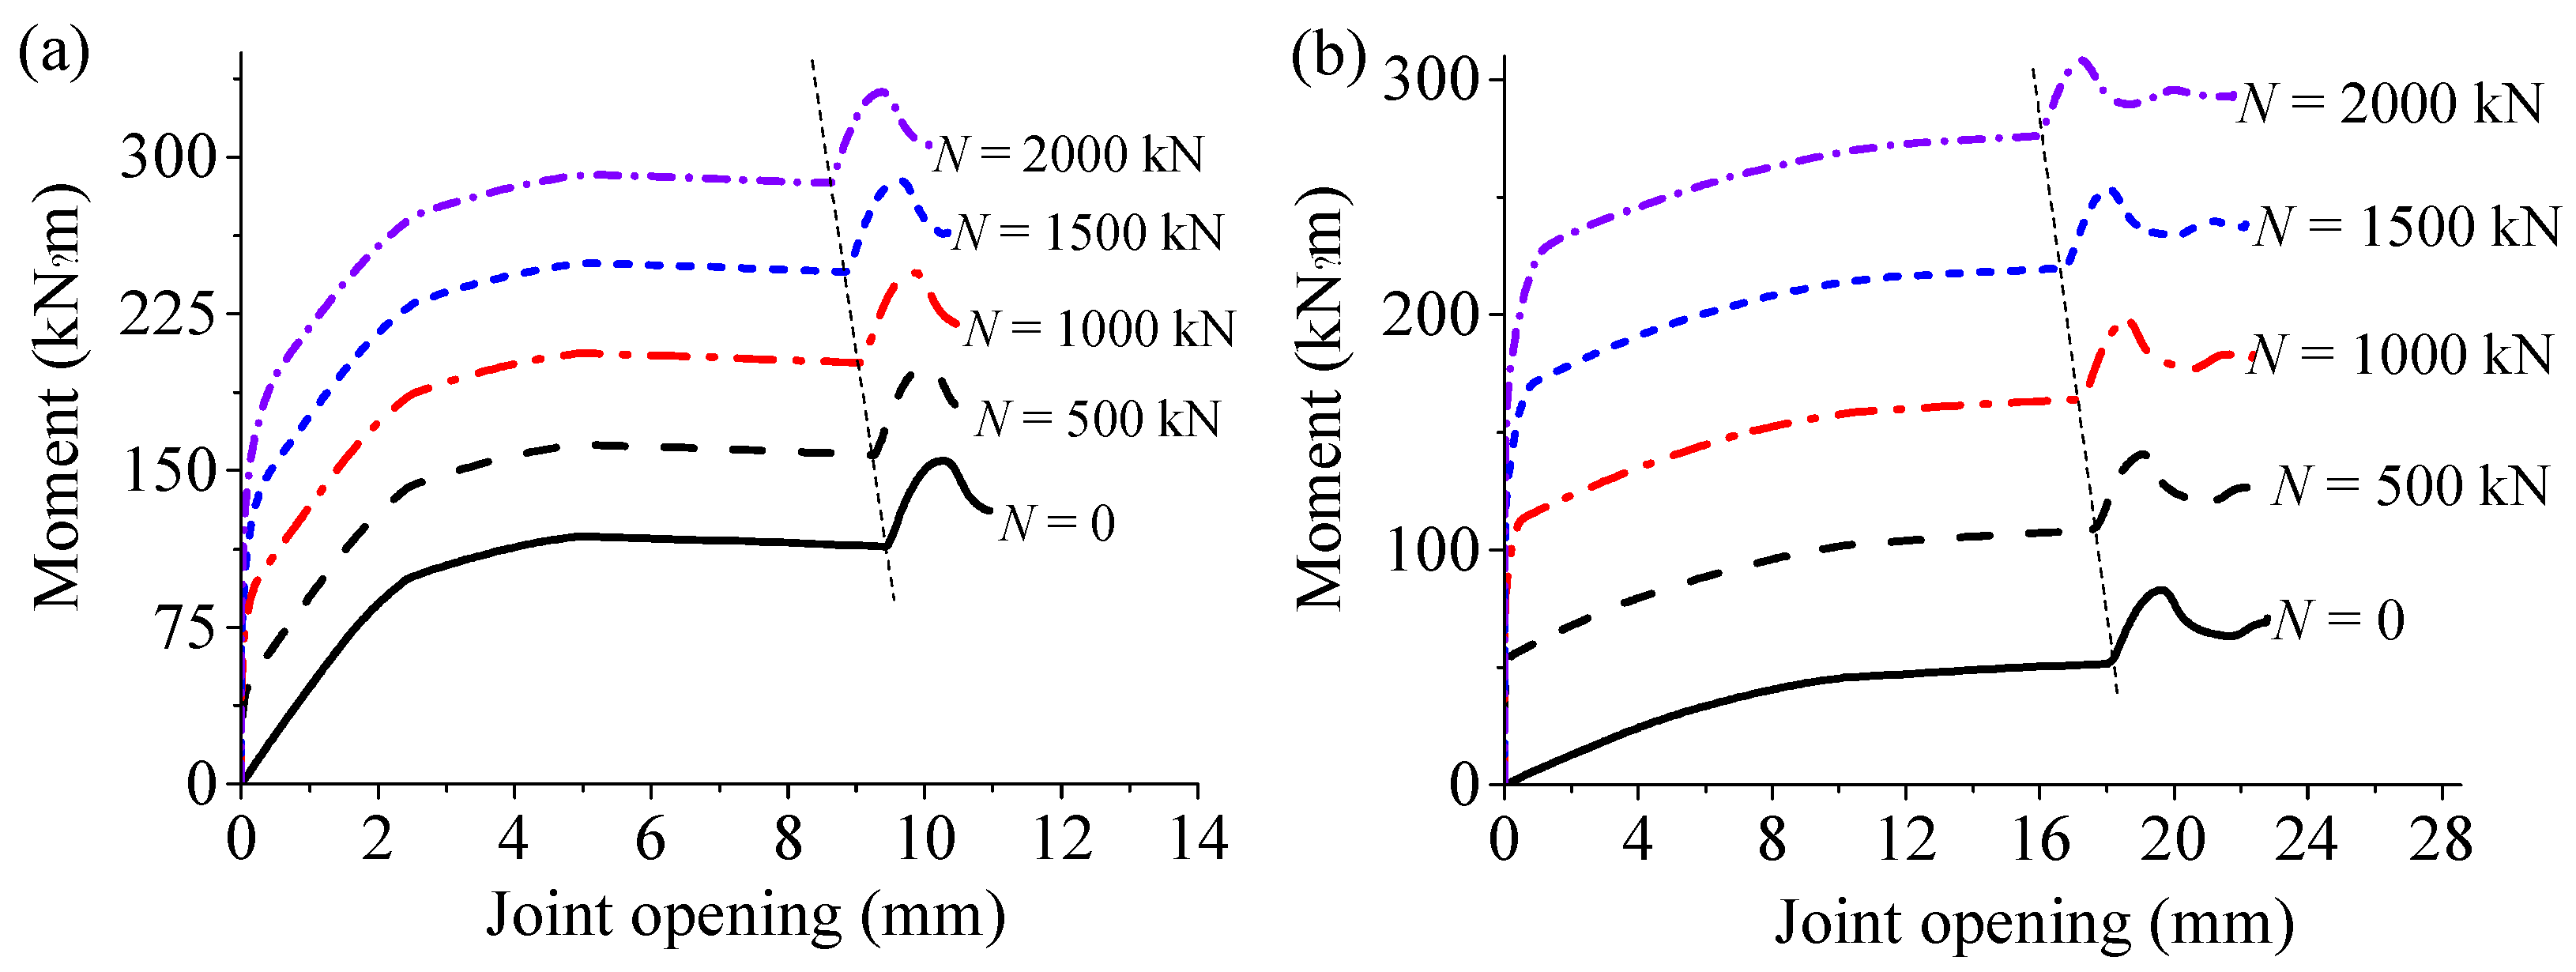
Figure 14 presents the curves of the bending moment response of the joint to the joint opening under different axial force conditions. As shown in Figure 14, the flexural capacity of the lining joint is highly influenced by the axial force conditions. Compared with the positive bending moment loading condition, in the negative bending moment loading condition, the increase in the flexural capacity of the joint becomes more significant with the increase in the axial force. When the axial force is 1000 kN, the flexural bearing capacity is approximately doubled compared to the case without axial force. Furthermore, as shown in Figure 14, as the axial force within the lining increases, the opening amount at the joint gradually decreases for the two loading conditions. Therefore, with the increase in the axial force environment, the anti-seepage capacity at the joint of the shield tunnel also significantly improves.
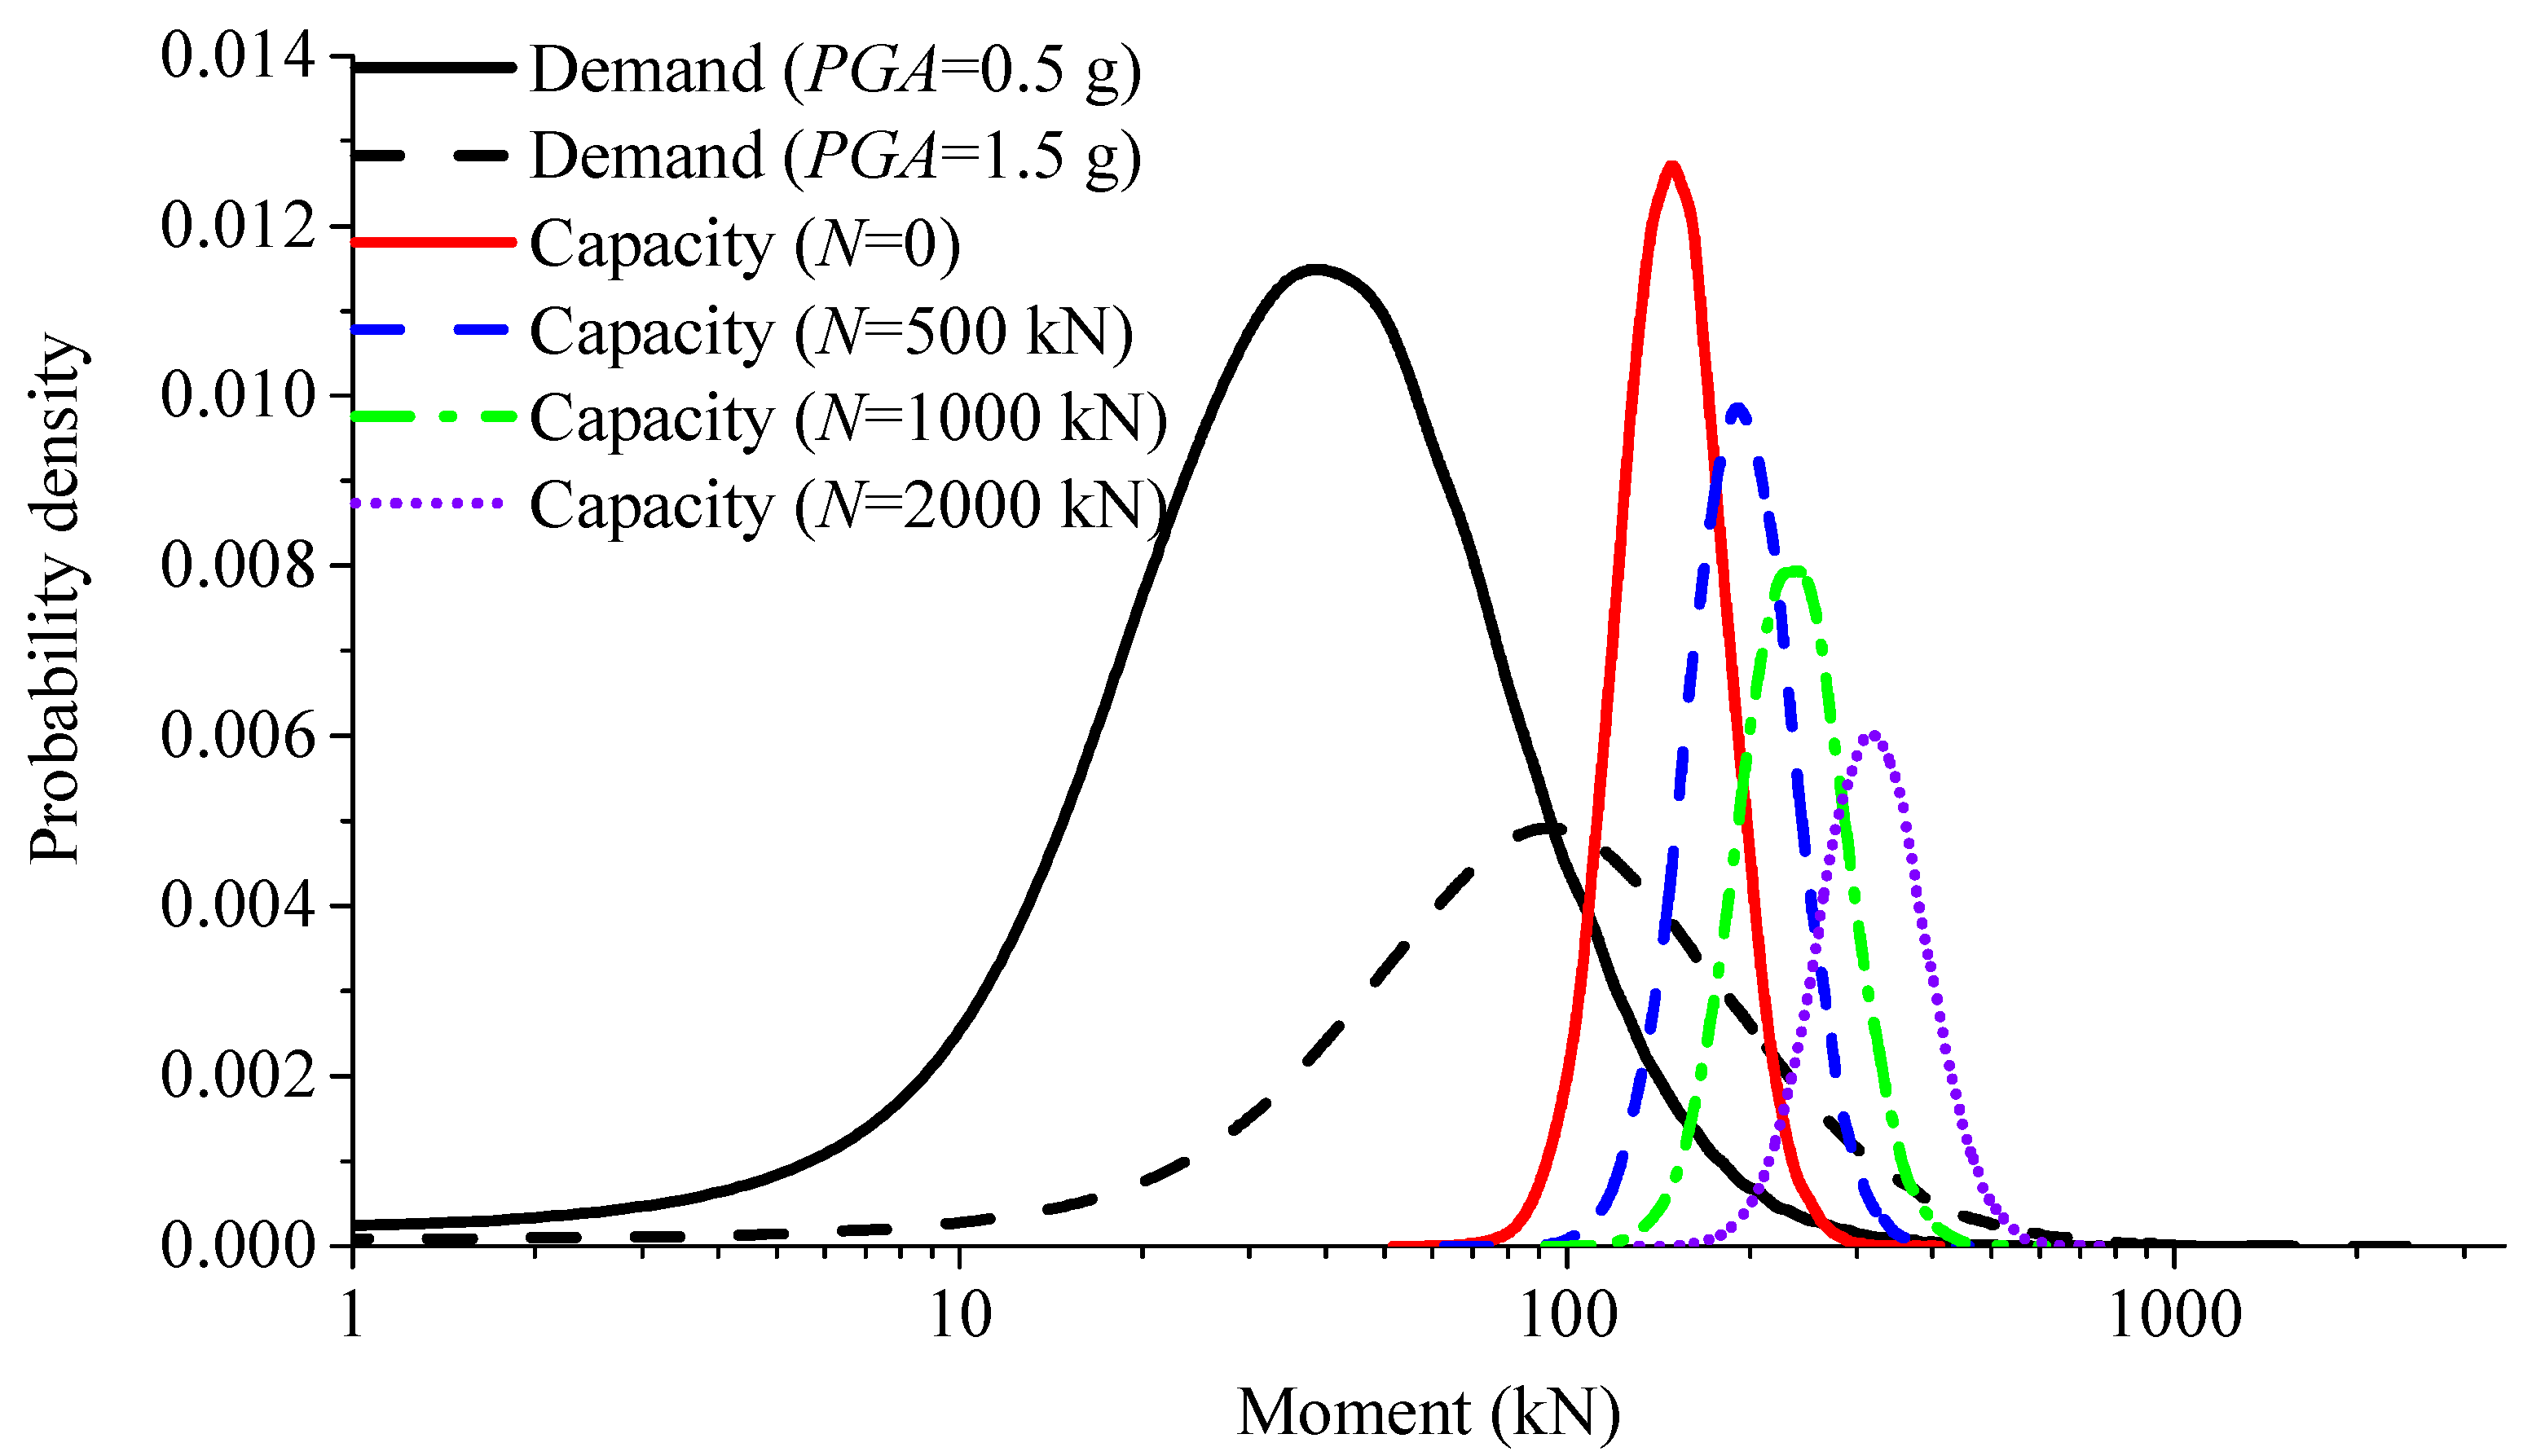
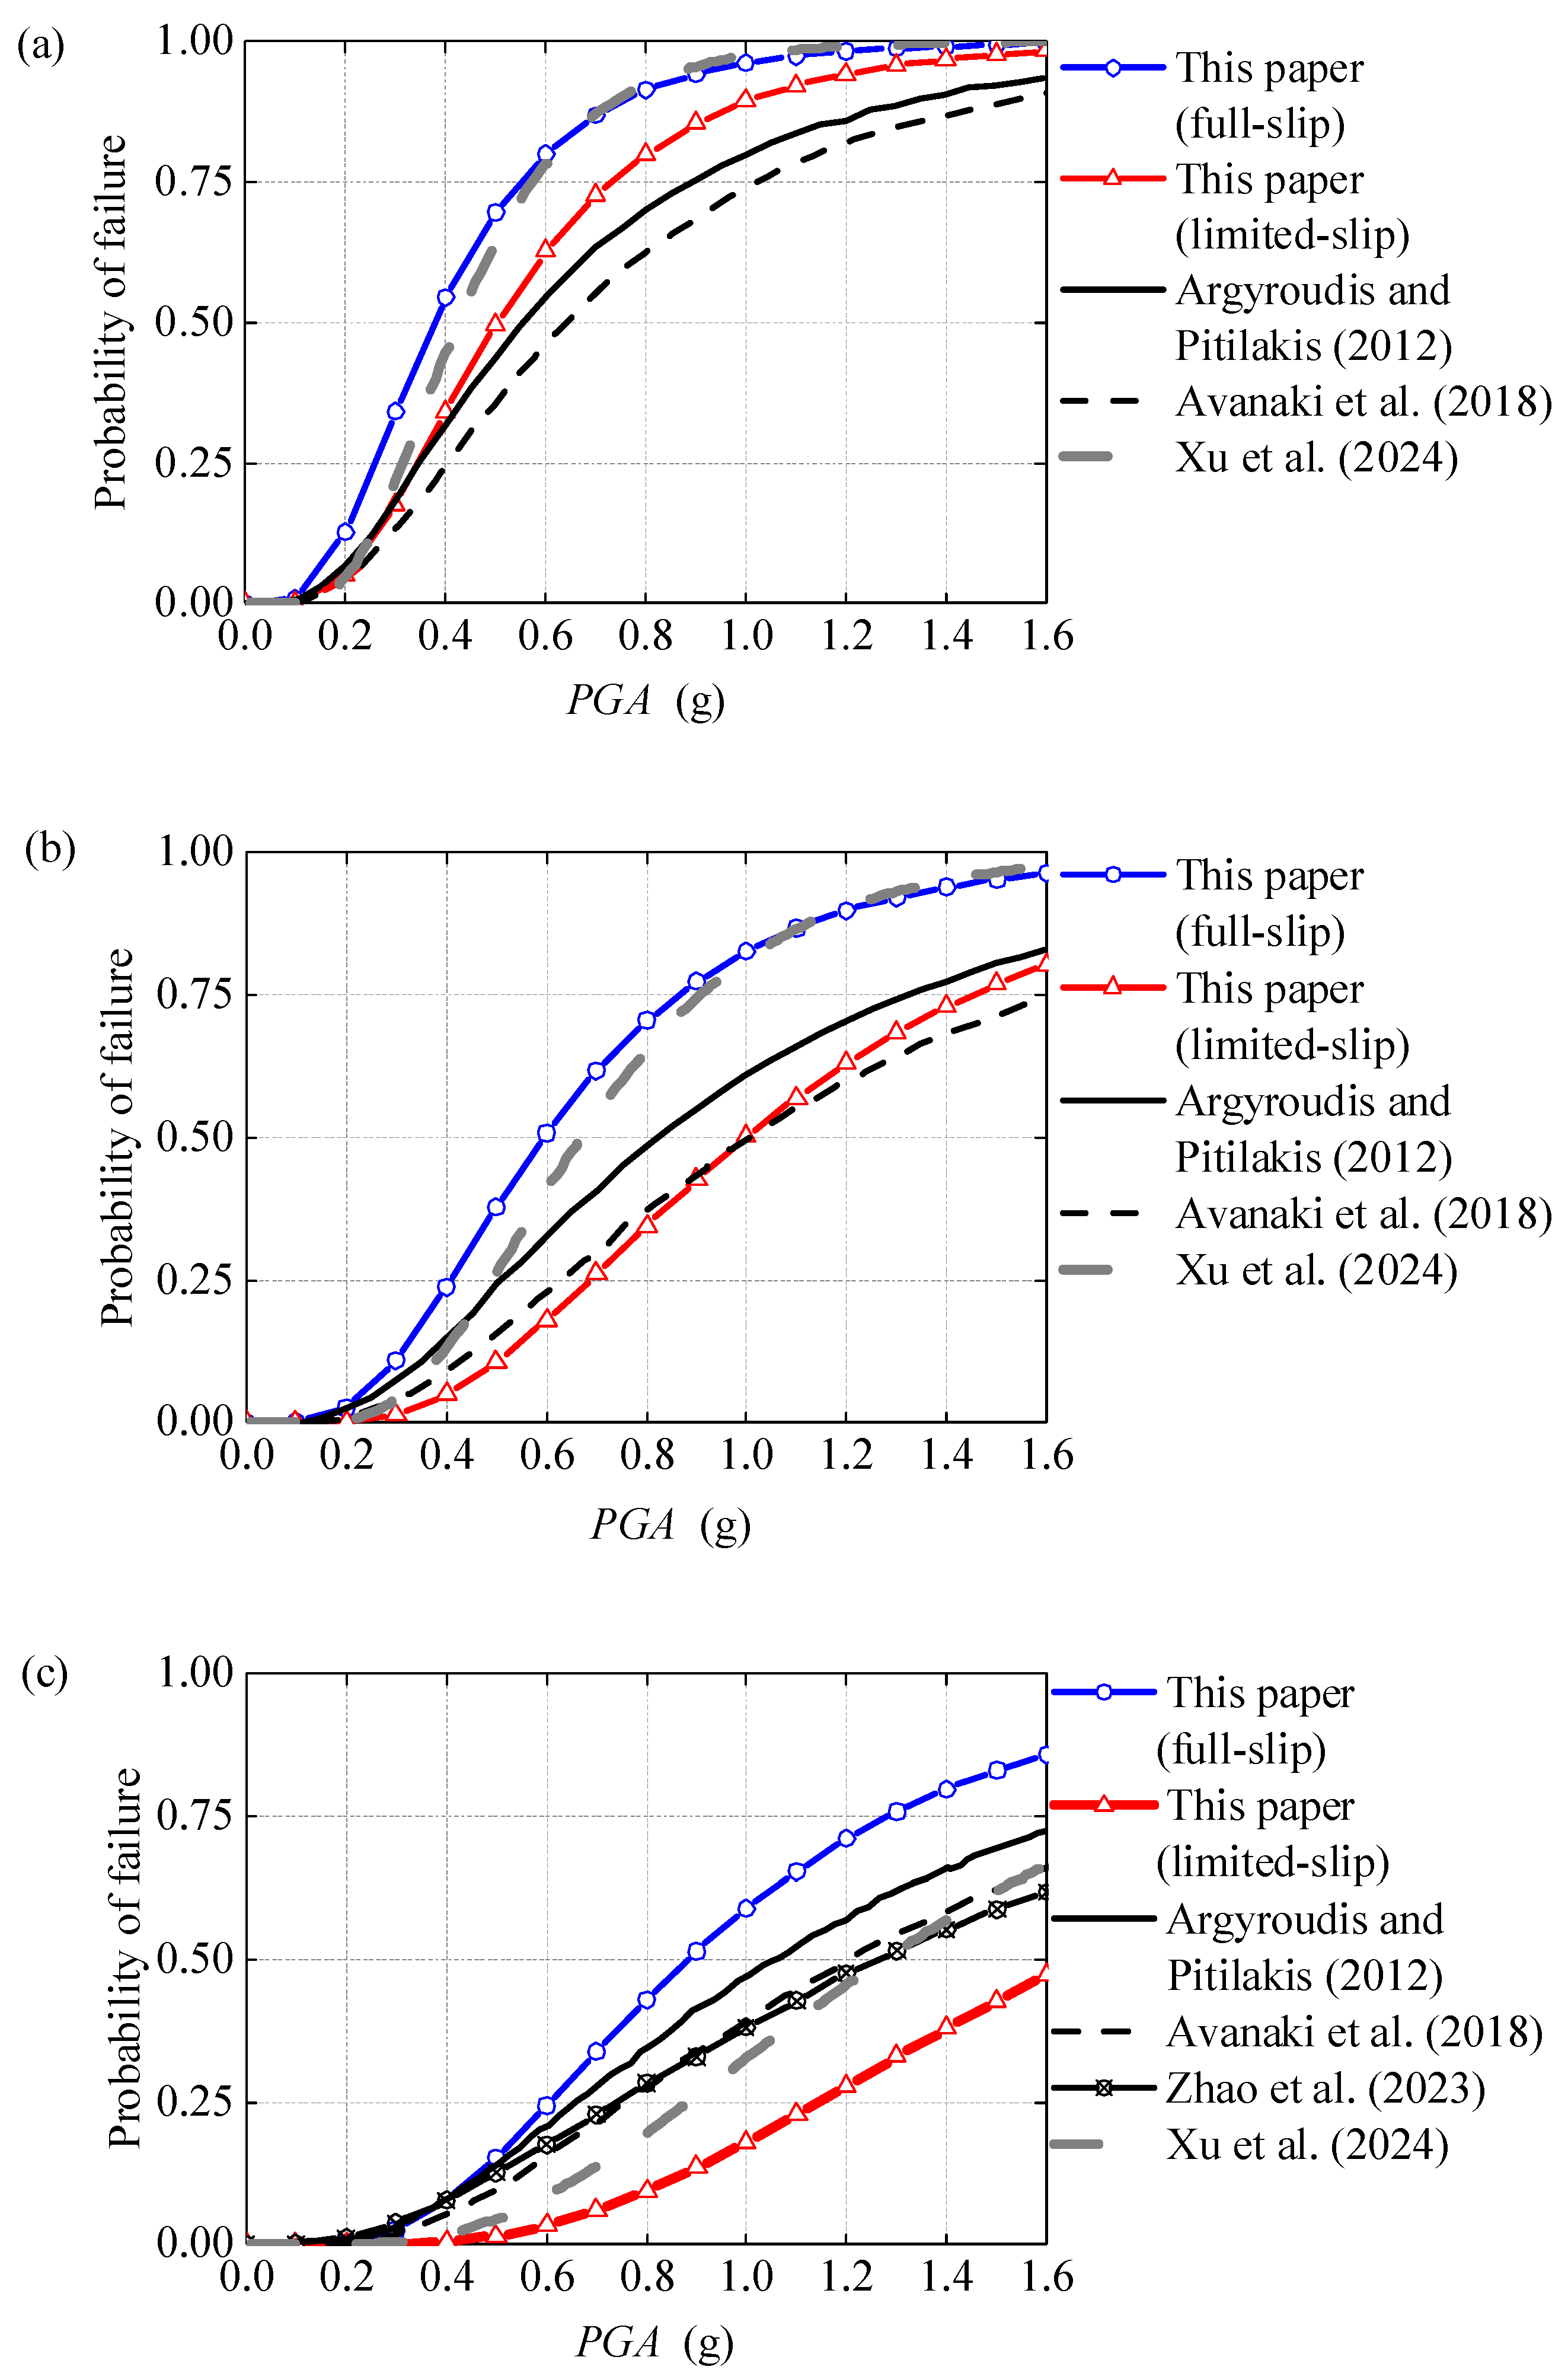
Figure 15 presents the probability density curves of the moment responses of the lining for the example tunnel, calculated using the seismic demand probability model proposed by Zhao et al. [28] when the PGA is equal to 0.5 g and 1 g, and the probability density curves of the flexural capacity of the lining joint under different axial force conditions, calculated using the capacity probability model proposed in this paper. As shown in Figure 15, the bending moment response of the example tunnel gradually increases with the increase in PGA. Meanwhile, the flexural capacity of the lining the joint increases with the increase in the axial force. When the seismic intensity is high, the bending moment response of the tunnel is large, and the flexural capacity of the tunnel also increases. However, the previous fragility analysis did not consider this influence. Figure 16 presents the fragility results considering the impact of the axial force on the flexural capacity of the joint, and the comparison to the results of previous studies. In Figure 16, the full-slip line corresponds to the seismic demand estimated using the model of Wang [39] for full-slip conditions, while the limited-slip line represents the seismic demand estimated by the model of Zhao et al. [28]. In view of that, Zhao et al. [21] only gave the fragility curve for severe damage level, so their results are only compared in Figure 16c.
In the research conducted by Argyroudis & Pitilakis [14], the lining is modeled as a homogeneous continuous circular structure without considering the effects of the joints. Conversely, in the study by Avanaki et al. [19], the impact of the joints was considered using a two-dimensional finite element model. However, the limitations of the two-dimensional finite element model make it challenging to simulate the complex mechanical behavior at the actual joints accurately. The damage indices for slight, moderate, and severe damage in the study by Avanaki et al. [19] were defined as 1.2 < DI ≤ 1.9, 1.9 < DI ≤ 2.7, and DI > 2.7, which are slightly higher than the damage indices used in this work and by Argyroudis & Pitilakis [14]. This discrepancy is a primary reason for the lower failure probability values in Avanaki et al. [19] for the three damage states, as shown in Figure 16. Xu et al. [40] obtained the probability model of the bearing capacity of circular tunnel linings under different damage states through nonlinear incremental dynamic analysis and combined it with the demand probability model proposed by Zhao et al. [28] to develop the fragility curves of a tunnel. Due to the use of the same demand probability model, the results of Xu et al. [40] are close to the no-slip fragility curve of this paper in cases of slight and moderate damage. However, in the case of severe damage, the failure index adopted by Xu et al. [40] differs from that of this paper, and their fragility results are smaller than the full-slip results of this paper.
For the full-slip interface condition, the axial force is non-significant. As a result, the flexural capacity for the lining is in a small value. As indicated by Zhao et al. [21], when the example tunnel is in a homogeneous condition, the mean value of the flexural capacity for the lining is 196 kN·m. In contrast, the mean estimate from the probability model presented in this paper for full-slip condition is in a mean value of 142 kN·m for the positive bending moment loading condition and is in a mean value of 91 kN·m for the negative bending moment loading condition. This study adopts the minimum value for the two states as the flexural capacity of the joint. As a result, the flexural capacity is significantly lower than that of a homogeneous circular ring tunnel for full-slip interface condition. It is also the main reason for the higher failure probability calculated in this study for the full-slip condition.
In practice, the interaction between the rock mass and the tunnel lining lies between full-slip and no-slip and is termed as limited-slip in this paper. In the limited-slip condition, the axial force and bending moment responses of the lining gradually increase as seismic intensity rises. When the bending moment response is significant, the axial force response also tends to be large. Consequently, when the seismic demand is at a high level, the flexural capacity at the joints is also to be significant. During slight damage, the seismic demand is small, and at this stage, the seismic capacity is not markedly different from that of full-slip state. As a result, for slight damage level, the failure probability of the limited-slip condition is slightly lower than that of the full-slip condition but also significantly higher than the results of previous studies for homogeneous tunnel linings. At the moderate damage level, the flexural capacity at the joints increases with the rising seismic demand and approaches the capacity of the homogeneous tunnel linings. As a result, the failure probability is similar to previous results for the moderate damage level. In severe damage level, the flexural capacity of the lining joint increases to a significant, leading to a lower failure probability than previous results. The results show that, in severe damage level, when PGA reaches to 1.6 g, the mean estimation of the flexural capacity is about 310 kN·m. Therefore, during slight damage, the failure probability of joints is higher than that of the homogeneous tunnel linings; with moderate damage, the failure probability of the joints is similar to that of the homogeneous tunnel linings; in cases of severe damage, the failure probability of the joints is lower than that of the homogeneous tunnel linings.

5. Conclusions

This paper examines the mechanical properties of the longitudinal joints of shield tunnels. An analytical model is introduced to determine the flexural capacity of the joints, and a probabilistic model is developed based on this analytical framework. Additionally, the fragility curves of the joints are presented for three different damage states. The main findings of this paper are as follows:
(1) When there is no rotation of the joints, the axial force is the predominant internal force response to external loads. When slight rotation occurs, it leads to compression at the upper edge of the concrete in the core area and tension in the bolts. As the rotation angle at the joints becomes significant, the gap in the compressed area closes, causing the outer edge of the concrete of the lining to be compressed. This change results in a significant rise in the bending moment response of the joints. The proposed analytical model effectively captures the mechanical characteristics of the longitudinal joints. Furthermore, this paper establishes a probabilistic model for estimating the flexural capacity of the joints by incorporating correction terms into the analytical model. The proposed probability model more accurately reflects the actual characteristics and uncertainties of the flexural capacity of the joints and can be used to enhance the fragility analysis of shield tunnels.
(2) The interaction between the rock mass and the tunnel lining can significantly influence the axial force response of the lining caused by seismic loads. The flexural capacity of the lining joints is connected to the axial force environment: a greater axial force leads to an increased flexural capacity. Additionally with the increase in the axial force environment, the anti-seepage capacity at the joint of the shield tunnel also significantly improves. When the full-slip assumption is applied to this interaction, the axial force in the lining is relatively small under seismic loads, resulting in a flexural capacity for the joints that is lower than that of homogeneous tunnel linings. In states of slight, moderate, and severe damage, the fragility curves at the joints are higher than those previously reported for homogeneous tunnel linings, indicating a greater probability of failure. This implies that the joints are the weak link in shield tunnels when the influence of the axial force is not considered.
(3) Under limited-slip conditions, seismic loads generate a significant axial force response in the tunnel lining, leading to a noticeable increase in the flexural capacity of the joints. The flexural capacity gradually increases with the increase in the seismic demand. In the case of slight damage, the seismic demand is relatively low, and the flexural capacity of the joints is lower than that of a homogeneous tunnel lining. This results in a higher probability of failure compared to the homogeneous lining. In a moderate damage state, the flexural capacity of the joints approaches that of the homogeneous tunnel lining, making the failure probability similar to that of the homogeneous lining. However, in a severe damage state, the flexural capacity of the joints is significantly greater than that of the homogeneous lining, which leads to a markedly lower probability of failure. Therefore, in the actual situation, shield tunnels are more susceptible to failure at the joints during low seismic intensities. In contrast, at higher seismic intensities, the damage is primarily influenced by the segments away from the joints. Therefore, to enhance the overall seismic resistance of shield tunnels, it is recommended to increase the preload of the bolt, etc., to improve the bearing capacity of the tunnel joints, ensuring that the joints do not fail during low seismic intensities.
The interaction between the lining and the rock mass significantly affects the axial force response under seismic action, thereby influencing its flexural capacity. This paper uses the seismic demand probability model proposed by previous researchers to calculate the axial force level. This probability model is mainly applicable when the friction coefficient between the lining and the surrounding rock is 0.7. In further studies, the fragility results under different friction coefficients need to be discussed.

Author Contributions

Conceptualization, S.L. and G.Z.; methodology, G.Z.; software, Z.Y.; validation, Z.Y., J.Z. and Y.W.; formal analysis, S.L.; investigation, G.Z.; resources, S.L.; data curation, J.Z.; writing—original draft preparation, G.Z.; writing—review and editing, Y.W.; visualization, Y.W.; supervision, S.L.; project administration, G.Z.; funding acquisition, G.Z. All authors have read and agreed to the published version of the manuscript.

Funding

The research is supported by the National Natural Science Foundation of China (52378517, 52478523), Nature Science Foundation of Hubei Province (2023AFB934), and the Natural Science Foundation for Distinguished Young Scholars of Hubei Province of China (2023AFA099).

Data Availability Statement

Data will be made available on request.

Acknowledgments

The authors wish to thank the anonymous reviewers for their careful work and thoughtful suggestions that substantially improved this paper.

Conflicts of Interest

The authors declare no conflicts of interest.

References

  1. Li, Y.; Lai, J.; Yang, Y.; Zhou, J.; Shan, Y.; Cui, J. Seismic performance study of immersed tunnel with longitudinal limit device of flexible joint. Undergr. Space 2025, 20, 17–32. [Google Scholar] [CrossRef]
  2. Wang, T.T.; Kwok, O.L.A.; Jeng, F.S. Seismic response of tunnels revealed in two decades following the 1999 Chi-Chi earthquake (Mw 7.6) in Taiwan: A review. Eng. Geol. 2021, 287, 106090. [Google Scholar] [CrossRef]
  3. Jiang, X.; Zhu, H.; Yan, Z.; Zhang, F.; Ye, F.; Li, P.; Zhang, X.; Dai, Z.; Bai, Y.; Huang, B. A state-of-art review on development and progress of backfill grouting materials for shield tunneling. Dev. Built. Environ. 2023, 16, 100250. [Google Scholar] [CrossRef]
  4. Zhao, Z.; Cui, J.; Liu, C.; Liu, H.; ur Rehman, M.; Chen, W.; Peng, Z. Seismic damage characteristics of large-diameter shield tunnel lining under extreme-intensity earthquake. Soil Dyn. Earthq. Eng. 2023, 171, 107958. [Google Scholar] [CrossRef]
  5. Han, L.; Liu, H.; Zhang, W.; Ding, X.; Chen, Z.; Feng, L.; Wang, Z. Seismic behaviors of utility tunnel-soil system: With and without joint connections. Undergr. Space 2022, 7, 798–811. [Google Scholar] [CrossRef]
  6. Ye, Z.; Li, Y.; Li, L.; Xu, W.; Wu, H.; Miao, Y.; Liu, H. Seismic response of a long shield tunnel crossing through multiple soil deposits. Comput. Geotech. 2025, 177, 106892. [Google Scholar] [CrossRef]
  7. Feng, K.; He, C.; Qiu, Y.; Zhang, L.; Wang, W.; Xie, H.; Zhang, Y.; Cao, S. Full-scale tests on bending behavior of segmental joints for large underwater shield tunnels. Tunn. Undergr. Space Technol. 2018, 75, 100–116. [Google Scholar] [CrossRef]
  8. Shen, Y.; Zhong, Z.; Li, L.; Du, X.; El Naggar, M.H. Seismic response of shield tunnel structure embedded in soil deposit with liquefiable interlayer. Comput. Geotech. 2022, 152, 105015. [Google Scholar] [CrossRef]
  9. Yang, W.; Xiao, L.; Tang, Z.; Mei, G. An improved theoretical method for assessing tunnel response to pre-excavation dewatering: Time-dependent deflection, internal force, joint opening, and dislocation. Comput. Geotech. 2025, 183, 107216. [Google Scholar] [CrossRef]
  10. Moayedi Far, A.; Nejati, H.R.; Goshtasbi, K.; Khosrotash, M.; Moosavi, S.A. Seismic Fragility Analysis for Probabilistic Risk Assessment of Underground Structures. J. Earthq. Eng. 2025, 29, 265–287. [Google Scholar] [CrossRef]
  11. Rajkumari, S.; Thakkar, K.; Goyal, H. Fragility analysis of structures subjected to seismic excitation: A state-of-the-art review. Structures 2022, 40, 303–316. [Google Scholar] [CrossRef]
  12. Zhu, J.; Zhao, G.; Xu, L.; Li, S. Probabilistic Seismic Demand Models of Circular Tunnels Subjected to Horizontal Ground Motions Based on 2D Dynamic Analyses. J. Earthq. Eng. 2023, 27, 4739–4760. [Google Scholar] [CrossRef]
  13. Shinozuka, M.; Feng, M.Q.; Lee, J.; Naganuma, T. Statistical analysis of fragility curves. J. Eng. Mech. 2000, 126, 1224–1231. [Google Scholar] [CrossRef]
  14. Argyroudis, S.A.; Pitilakis, K.D. Seismic fragility curves of shallow tunnels in alluvial deposits. Soil Dyn. Earthq. Eng. 2012, 35, 1–12. [Google Scholar] [CrossRef]
  15. Zhang, X.; Pan, Y.; Su, L.; Ou, E.; Liu, H.; Liu, C.; Cui, J. Seismic fragility assessment of shield tunnels in liquefiable soil-rock strata using fuzzy method for IM optimization. Tunn. Undergr. Space Technol. 2024, 152, 105957. [Google Scholar] [CrossRef]
  16. Liu, G.; Geng, P.; Wang, T.; Meng, Q.; Huo, F.; Wang, X.; Wang, J. Seismic vulnerability of shield tunnels in interbedded soil deposits: Case study of submarine tunnel in Shantou Bay. Ocean Eng. 2023, 286, 115500. [Google Scholar] [CrossRef]
  17. Xu, L.Y.; Xi, J.P.; Jiang, J.W.; Cai, F.; Sun, Y.J.; Chen, G.X. Seismic fragility analysis of shield tunnels in liquefiable layered deposits. Soil Dyn. Earthq. Eng. 2025, 191, 109246. [Google Scholar] [CrossRef]
  18. Shen, Y.; El Naggar, M.H.; Zhang, D.M.; Huang, Z.K.; Du, X. Scalar-and vector-valued seismic fragility assessment of segmental shield tunnel lining in liquefiable soil deposits. Tunn. Undergr. Space Technol. 2025, 155, 106171. [Google Scholar] [CrossRef]
  19. Avanaki, M.J.; Hoseini, A.; Vahdani, S.; de Santos, C.; de la Fuente, A. Seismic fragility curves for vulnerability assessment of steel fiber reinforced concrete segmental tunnel linings. Tunn. Undergr. Space Technol. 2018, 78, 259–274. [Google Scholar] [CrossRef]
  20. Yang, Q.; Geng, P.; Wang, L.; Liu, G.; Tang, R. Study on asphalt-cement isolation layer for shield tunnels using seismic fragility curves. J. Earthq. Eng. 2023, 27, 2338–2357. [Google Scholar] [CrossRef]
  21. Zhao, G.; Gardoni, P.; Xu, L.; Xie, L. Seismic probabilistic capacity models and fragility estimates for the transversal lining section of circular tunnels. J. Earthq. Eng. 2023, 27, 1281–1301. [Google Scholar] [CrossRef]
  22. Andreotti, G.; Calvi, G.M.; Soga, K.; Gong, C.; Ding, W. Cyclic model with damage assessment of longitudinal joints in segmental tunnel linings. Tunn. Undergr. Space Technol. 2020, 103, 103472. [Google Scholar] [CrossRef]
  23. Wang, J.; Huang, W.; Xu, R.; Yang, Z.; Xu, R. Analytical approach for circular-jointed shield tunnel lining based on the state space method. Int. J. Numer. Anal. Methods Geomech. 2020, 44, 575–595. [Google Scholar] [CrossRef]
  24. Zhang, L.; Feng, K.; Li, M.; Sun, Y.; He, C.; Xiao, M. Analytical method regarding compression-bending capacity of segmental joints: Theoretical model and verification. Tunn. Undergr. Space Technol. 2019, 93, 103083. [Google Scholar] [CrossRef]
  25. Huang, W.M.; Wang, J.C.; Yang, Z.X.; Xu, R.Q. Analytical model for segmental tunnel lining with nonlinear joints. Tunn. Undergr. Space Technol. 2021, 114, 103994. [Google Scholar] [CrossRef]
  26. Li, Z.; Liu, X. Analytical model regarding compression-bending capacity of segmental joint reinforced by steel plate. Undergr. Space 2025, 20, 157–173. [Google Scholar] [CrossRef]
  27. Zhang, Z.; Liang, R.; Li, Z.; Kang, C.; El Naggar, M.H.; Xiao, M.; Wu, W. Analytical solution for longitudinal deformation of shield tunnel induced by overcrossing tunnelling considering circumferential joints. J. Rock Mech. Geotech. Eng. 2023, 15, 2355–2374. [Google Scholar] [CrossRef]
  28. Zhao, G.; Gardoni, P.; Xu, L.; Shu, F.; Xie, L. Probabilistic seismic demand models for circular tunnels subjected to transversal seismic load. Tunn. Undergr. Space Technol. 2022, 25, 104527. [Google Scholar] [CrossRef]
  29. Jin, Y.; Ding, W.; Yan, Z.; Soga, K.; Li, Z. Experimental investigation of the nonlinear behavior of segmental joints in a water-conveyance tunnel. Tunn. Undergr. Space Technol. 2017, 68, 153–166. [Google Scholar] [CrossRef]
  30. Zhang, D.M.; Zhang, B.L.; Luo, T.L.; Zhang, D.M.; Li, B.J. Full-scale testing and numerical modelling of segmental-joint performance with corroded bolt. Tunn. Undergr. Space Technol. 2022, 119, 104260. [Google Scholar] [CrossRef]
  31. GB-50010; Code for Design of Concrete Structures. China Architecture and Building Press: Beijing, China, 2010.
  32. Chen, L.; Graybeal, B.A. Modeling Structural Performance of Ultrahigh Performance Concrete I-Girders. J. Bridge Eng. 2012, 17, 754–764. [Google Scholar] [CrossRef]
  33. Bahij, S.; Adekunle, S.K.; Al-Osta, M.; Al-Dulaijan, S.U.; Rahman, M.K. Numerical investigation of the shear behavior of reinforced ultra-high-performance concrete beams. Struct. Concr. 2018, 19, 305–317. [Google Scholar] [CrossRef]
  34. Birtel, V.; Mark, P. Parameterised finite element modelling of RC beam shear failure. In Proceedings of the ABAQUS Users’ Conference, Cambridge, MA, USA, 23 May 2006; pp. 95–108. [Google Scholar]
  35. Gardoni, P.; Der Kiureghian, A.; Mosalam, K.M. Probabilistic capacity models and fragility estimates for reinforced concrete columns based on experimental observations. J. Eng. Mech. 2002, 128, 1024–1038. [Google Scholar] [CrossRef]
  36. Fang, K.T. Uniform design: Application of number-theoretic methods in experimental design. Acta Math. Appl. Sin. 1980, 3, 363–372. [Google Scholar]
  37. Wang, Y.; Fang, K.T. A note on uniform distribution and experimental design. Chin. Sci. Bull. 1981, 26, 485–489. [Google Scholar]
  38. Hashash, Y.M.; Hook, J.J.; Schmidt, B.; John, I.; Yao, C. Seismic design and analysis of underground structures. Tunn. Undergr. Space Technol. 2001, 16, 247–293. [Google Scholar] [CrossRef]
  39. Wang, J.N. Seismic Design of Tunnels: A State-of-the-Art Approach; Parsons Brinckerhoff Inc.: New York, NY, USA, 1993. [Google Scholar]
  40. Xu, L.; Zhu, J.; Zhao, G.; Li, S. Probabilistic seismic capacity models for circular tunnels at different performance levels. Comput. Geotech. 2024, 165, 105906. [Google Scholar] [CrossRef]
Figure 1. (a) Three-dimensional diagram, (b) two-dimensional cross-sectional diagram, and (c) longitudinal joint diagram for shield tunnels.
Buildings 15 04265 g001
Figure 2. (a) Displacement profile of the rock mass to ground motions at a time point, (b) lining deformation response and (c) lining internal force for tunnels to seismic loading.
Buildings 15 04265 g002
Figure 3. Finite element model of (a) the concrete lining, (b) the reinforcing steel bars, and (c) the bolt used to simulate the mechanical features of the shield tunnel lining joints.
Buildings 15 04265 g003
Figure 4. Mechanical schematic of the concrete damaged plasticity model used in this paper.
Buildings 15 04265 g004
Figure 5. Numerical simulation results for the positive bending moment loading condition.
Buildings 15 04265 g005
Figure 6. Numerical simulation results for the negative bending moment loading condition.
Buildings 15 04265 g006
Figure 7. Comparison of the relation of bending moment M to joint rotation angle θ simulated by this paper to the testing results of previous studies [29].
Buildings 15 04265 g007
Figure 8. Comparison of the bending moment response curves related to joint opening obtained by different methods for (a) positive bending moment loading condition and (b) negative bending moment loading condition [30].
Buildings 15 04265 g008
Figure 9. (a) Loading state I, (b) loading state II, and (c) loading state III at the joints of shield tunnels.
Buildings 15 04265 g009
Figure 10. Stress nephogram and compression damage nephogram of the joint sections under the (a) loading state I, (b) loading state II, and (c) loading state III at the lining joints.
Buildings 15 04265 g010
Figure 11. Mechanical schematic diagram of shield tunnel joints at (a) I1 loading state, (b) I2 loading state, (c) II1 and II2 loading states, (d) II3 and II4 loading states, (e) III1~III4 loading states, and (f) III5~III8 loading states.
Buildings 15 04265 g011
Figure 12. Scatter plot of the flexural capacity computed by (a) the analytical method and (b) the proposed probabilistic model to that simulated numerical approaches.
Buildings 15 04265 g012
Figure 13. Axial force responses of the example tunnel lining to seismic loading with different intensities calculated by various methods [28,39].
Buildings 15 04265 g013
Figure 14. Bending moment responses of the example tunnel lining to the joint opening under different axial force environments simulated by numerical methods for (a) positive bending moment loading condition and for (b) negative bending moment loading condition.
Buildings 15 04265 g014
Figure 15. Seismic demand and flexural capacity probability density curves for the example tunnel lining of this paper.
Buildings 15 04265 g015
Figure 16. Comparison of the fragility curves developed by this paper to those of previous results for (a) slight damage, (b) moderate damage, and (c) severe damage conditions [14,19,21,40].
Buildings 15 04265 g016
Table 1. Criteria for different loading states and the corresponding static equilibrium equation.
StatesCriteriaStatic Equilibrium Equation
II1σc < fc, σs < fsy 1 2 E c θ l c x 2 + θ E s A s l c x θ E s l c d e f f + A s σ s p A s N = 0
I2σc = fc, σs < fsy 1 2 E c θ l c x 2 + f c x + E c θ h e f f l c x + θ E s A s l c x 1 2 f c 2 l c E c θ 1 2 E c θ h e f f 2 l c θ E s A s d e f f + l c σ s p A s N = 0
IIII1σc < fc, σs < fsy 1 2 E c θ l c x 2 + θ E s A s l c x θ E s l c d e f f + A s σ s p A s N = 0
II2σc < fc, σs = fsy 1 2 E c θ l c x 2 f s y A s N = 0
II3σc = fc, σs < fsy f c x + θ E s A s l c x 1 2 f c 2 l c E c θ θ E s A s d e f f + l c σ s p A s N = 0
II4σc = fc, σs = fsy f c x 1 2 f c 2 l c E c θ f s y A s N = 0
IIIIII1σout < fc, σc < fc, σs < fsy 1 2 E c θ l c x 2 + θ l c E c t 2 x + θ A s E s l c x + θ t l c E c t 2 ω 2 l c E c t 2 θ A s E s d e f f + l c σ s p A s N = 0
III2σout = fc, σc < fc, σs < fsy 1 2 E c θ l c x 2 + θ E s A s l c x + f c t 2 θ E s A s d e f f + l c σ s p A s N = 0
III3σout < fc, σc < fc, σs = fsy 1 2 E c θ l c x 2 + E c t 2 θ l c x + E c t 2 θ t l c E c t 2 ω 2 l c f s y A s N = 0
III4σout = fc, σc < fc, σs = fsy 1 2 E c θ l c x 2 + f c t 2 f s y A s N = 0
III5σout < fc, σc = fc, σs < fsy θ E c t 2 l c x + f c x + E s θ A s l c x + θ E c t 2 t l c ω E c t 2 2 l c 1 2 f c 2 l c E c θ σ s p A s d e f f + E s θ A s l c N = 0
III6σout = fc, σc = fc, σs < fsy f c x + E s θ A s l c x + f c t 2 1 2 f c 2 l c E c θ σ s p A s d e f f + E s θ A s l c N = 0
III7σout < fc, σc = fc, σs = fsy θ E c t 2 l c x + f c x + θ t E c t 2 l c ω E c t 2 2 l c 1 2 f c 2 l c E c θ f s y A s N = 0
III8σout = fc, σc = fc, σs = fsy f c x + f c t 2 1 2 f c 2 l c E c θ f s y A s N = 0
Table 2. Sample points information table based on the uniform design method.
NO.Concrete GradeDiameter of Bolt (mm)Bolt GradeAxial Force (kN)
1C40209.81200
2C45265.81100
3C50324.61100
4C551810.9900
5C60246.8800
6C65304.8700
7C701612.9600
8C75228.8500
9C80285.6400
Table 3. Information on the potential explanatory functions.
Physical QuantitiesPhysical or Mechanical Meaning
rLining radius
tLining thickness
EcConcrete elastic modulus
fcConcrete strength
rsBolt diameter
fsyBolt yield strength
fsuBolt tensile strength
NAxial force level
1Constant term
Table 4. Posterior statistics of the parameters in the flexural capacity model.
ParametersMean ValueStandard DeviationCorrelation Coefficient
θ1θfsyθfsuθNσ
θ1−0.210.0101
θfsy2.1 × 10−92.35 × 10⁻¹⁰−0.0211
θfsu−1.97 × 10−92.04 × 10−10−0.032−0.8841
θN2.32 × 10−74.26 × 10−80.1240.432−0.5421
σ0.2040.0110.006−0.0100.0090.0111
Disclaimer/Publisher’s Note: The statements, opinions and data contained in all publications are solely those of the individual author(s) and contributor(s) and not of MDPI and/or the editor(s). MDPI and/or the editor(s) disclaim responsibility for any injury to people or property resulting from any ideas, methods, instructions or products referred to in the content.