Review

Classifying Concrete Permeability Using Rapid Chloride Permeability and Surface Resistivity Tests: Benefits, Limitations, and Predictive Models—A State-of-the-Art Review

by
Seyedsaleh Mousavinezhad
1,*,
Shahin Nozari
2 and
Craig M. Newtson
1
1
Department of Civil Engineering, New Mexico State University, Las Cruces, NM 88003, USA
2
Department of Plant & Environmental Sciences, New Mexico State University, Las Cruces, NM 88003, USA
*
Author to whom correspondence should be addressed.
Buildings 2025, 15(23), 4216; https://doi.org/10.3390/buildings15234216
Submission received: 24 September 2025 / Revised: 6 November 2025 / Accepted: 18 November 2025 / Published: 21 November 2025
(This article belongs to the Section Building Materials, and Repair & Renovation)

Abstract

Penetration of harmful substances, such as chloride ions, is a major contributor to durability issues in concrete structures. Low permeability is critical for long-term performance, prompting the assessment and classification of concrete based on its resistance to ionic transport. However, the transport mechanisms are complicated and influenced by a range of interdependent factors including binder type, mixture proportions, specimen age, and curing conditions. There are two widely adopted test methods used for assessing chloride ion permeability: the Rapid Chloride Permeability Test (RCPT) and the Surface Resistivity Test (SRT), a non-destructive alternative. While RCPT is well-established, its long testing time as well as its high costs and sensitivity to specimen preparation limit its practicality. The SRT offers faster, more repeatable, and easier implementation. This state-of-the-art review systematically compares RCPT and SRT results across studies, revealing a strong inverse correlation with coefficients of determination (R2) from 0.85 to 0.95, as influenced by compressive strength, testing age, water-to-cement ratio, and supplementary cementitious material (SCM) type. Results showed that RCPT often has standard deviation (SD) values exceeding 300 coulombs and coefficient of variation (COV) values up to 10%, while SRT has lower variability (SD < 3 kΩ·cm and COV ≈ 5%). The review concludes that, with appropriate calibration, the SRT can reliably classify concrete permeability, closely aligning with RCPT results. However, research gaps remain regarding the applicability of existing models to less conventional SCMs and concrete types. Future research should prioritize the development of binder-specific correlations, validation using diffusion-based methods, and exploration of alternative SCMs and curing regimens to expand SRT applicability.

1. Introduction

A comprehensive understanding of fluid transport mechanisms is crucial for evaluating serviceability and long-term durability of concrete. Infiltration of liquids into concrete may cause various forms of deterioration that become more sever when these fluids contain chlorides or other substances that promote corrosion [1,2,3,4,5,6]. Various experimental methods are available to assess the extent and rate at which fluids penetrate concrete, each with distinct advantages and limitations. However, not all of these methods are commonly used in practice. This paper primarily focuses on two of the most widely used permeability assessment techniques: the Rapid Chloride Permeability Test (RCPT) and the Surface Resistivity Test (SRT).
The RCPT is a widely adopted testing method for assessing the resistance of concrete to chloride ion penetration and is referenced in multiple standards such as CSA/S413-94 [7,8,9,10,11,12]. Its widespread use is primarily due to its simplicity and broad acceptance by many state and provincial transportation agencies, and usefulness for quality control and specification compliance. Despite its widespread use, the RCPT has several limitations. One key limitation is the long duration required for data acquisition and results accuracy significantly depends on the electrical conductivity of the concrete, which is influenced by concrete pore structure and the conductivity of the ingredients used in concrete. For instance, materials such as steel fibers or admixtures such as calcium nitrite, commonly used as a corrosion inhibitor, can increase conductivity, thereby affecting the RCPT outcome [8]. Additionally, the RCPT’s high voltage (60 V) causes heat generation known as the Joule effect that alters pore structure and ion mobility, potentially overestimating permeability [13,14,15,16,17]. For this reason, RCPT is generally more reliable for qualifying than for disqualifying mixtures [8,18]. These limitations are amplified in mixtures with supplementary cementitious materials (SCMs), which influence microstructure and conductivity, affecting associated heat generation during the RCPT [8,19,20]. Moreover, RCPT measures ionic transport under an applied electrical field, dominated by hydroxyl ions (OH), rather than chloride ions alone [15,21,22,23,24]. SCMs may lower OH concentrations, artificially reducing the measured charge passed and falsely suggesting improved chloride resistance [25,26,27]. Therefore, RCPT may inaccurately reflect concrete’s true resistance to chloride ion penetration, necessitating the exploration of alternative methods.
The SRT is an alternative to RCPT, which measures the electrical resistivity of concrete to infer its permeability. The SRT offers several advantages over the RCPT, including its non-destructive nature, faster execution time, and ease of application. Additionally, since SRT operates at low voltages for short durations, it eliminates errors associated with heat generation that often distort RCPT results [28]. More importantly, research indicates that SRT results have lower variability compared to RCPT. However, the SRT does have some limitations, such as sensitivity to environmental conditions, surface condition, and moisture content. It is also less suitable for materials with low conductivity. Therefore, the application of the SRT remains limited, primarily due to the lack of extensive research and practical experience.
Given the long-established use of the RCPT and the advantages associated with the SRT, it is worth exploring whether the SRT can reliably interpret concrete permeability and correlate its results with the RCPT. While existing research suggests a correlation between the two methods, the relationship is not yet fully understood, particularly regarding the influence of factors such as strength, water-to-cementitious materials (w/cm) ratios, testing age, and the incorporation of SCMs. Therefore, this paper aims to critically examine how strength, w/cm ratio, testing age, and SCM type influence the relationship between these two methods. By addressing this gap, the study seeks to assess the reliability of SRT as a viable substitute for RCPT in evaluating chloride permeability.

2. Concrete Permeability

Permeability, the ease with which fluids or ions penetrate and move through concrete, is a key factor in concrete durability. Harmful ions (e.g., chloride) from sources such as soil, seawater, or de-icing salts can enter concrete via liquid penetration, leading to concrete degradation and corrosion of steel reinforcement [29]. The resistance of concrete to such penetration is controlled by its transport properties, which are influenced by microstructural factors such as defects, the air void system, the pore structure of the cement paste (including pore size, quantity, and connectivity), and the porosity of the interfacial transition zone (ITZ) between paste and aggregates [30]. Although concrete typically has lower total porosity than plain hardened cement paste, the presence of ITZs and air voids introduces additional pathways for fluid movement [31]. However, aggregates can reduce transport rates by decreasing cement paste volume (dilution effect), increasing tortuosity around particles, or introducing additional entrapped air voids that may sometimes limit the fluid flow [32].
Due to the complexity and interdependence of these factors, predicting fluid transport accurately is challenging, making experimental evaluation the most reliable assessment method [30,33]. Fluid penetrates concrete mainly through three mechanisms: direct crack flow, surface absorption, and diffusion through capillary pores [29]. These are influenced by microstructure and external/environmental conditions such as surface treatments and temperature. The presence of cracks can amplify fluid transport by several orders of magnitude [32,34,35,36,37], severely compromising long-term durability of concrete structures [38].

2.1. Direct Penetration Through Cracks

Micro-cracks in concrete, ranging from 10 to 60 μm in width, often create pathways that allow chloride ions and fluids to penetrate the concrete [30]. Studies have shown that flow rate increases with both crack width and pressure gradient, although the influence of pressure becomes more significant at extreme values [8,39,40,41,42]. Additionally, factors such as crack morphology, material properties, characteristics of the ITZ, and the density and distribution of micro-cracks play substantial roles in controlling permeability. While the impact of micro-cracks on concrete permeability appears to be obvious, their exact influence is difficult to isolate due to the heterogeneous nature of concrete.
Studies have shown conflicting results regarding the impact of cracks on permeability. However, it is generally accepted that cracks smaller than 0.05 mm have minimal impact, whereas wider cracks (>0.05 mm) significantly increase permeability, with direct penetration becoming the dominant fluid transport mechanism [39,40,41,42]. Despite the rapid flow through macro-cracks, absorption and diffusion mechanisms remain important, particularly in scenarios where flow is periodically impeded due to self-healing phenomena [8,39,40,41,42].

2.2. Absorption

Absorption is the primary fluid transport mechanism in unsaturated concrete, where water enters the concrete’s pore structure through a surface exposed to moisture due to a moisture gradient, not pressure differences. This mechanism is particularly important in structures such as pavement slabs, which typically lack hydraulic heads [8]. Concrete absorption occurs in two stages: an initial (capillary) absorption, where water fills capillary pores, followed by a slower secondary absorption, during which water fills entrained and entrapped voids. The rate of initial absorption (initial sorptivity) is determined by the permeability at partially dry state and is mainly controlled by the cement type and w/cm ratio. However, secondary absorption is primarily determined by the permeability during the water-saturated state, and its rate (secondary sorptivity) depends on the quality of the air void system, so it can be effectively controlled through the use of air-entraining admixtures [43,44].
Among the various factors affecting initial absorption, pore size plays a critical role. The stage that reflects how easily water can move through the dry and coarse particles is driven by capillary suction, negative pressure that develops within small-radius pores. It is widely recognized that smaller pores generate higher capillary suction, while larger pores exhibit lower suction potential [45]. Therefore, pores ranging from 50 nm to 2 µm play a major role in this stage of absorption, while larger pores (>50 µm) have minimal effect [43,46]. In addition to pore size, other factors such as pore connectivity, and the properties of the infiltrating liquid such as its surface tension, viscosity, density, and contact angle, as well as the surrounding relative humidity, significantly affect the rate of initial absorption [47,48].
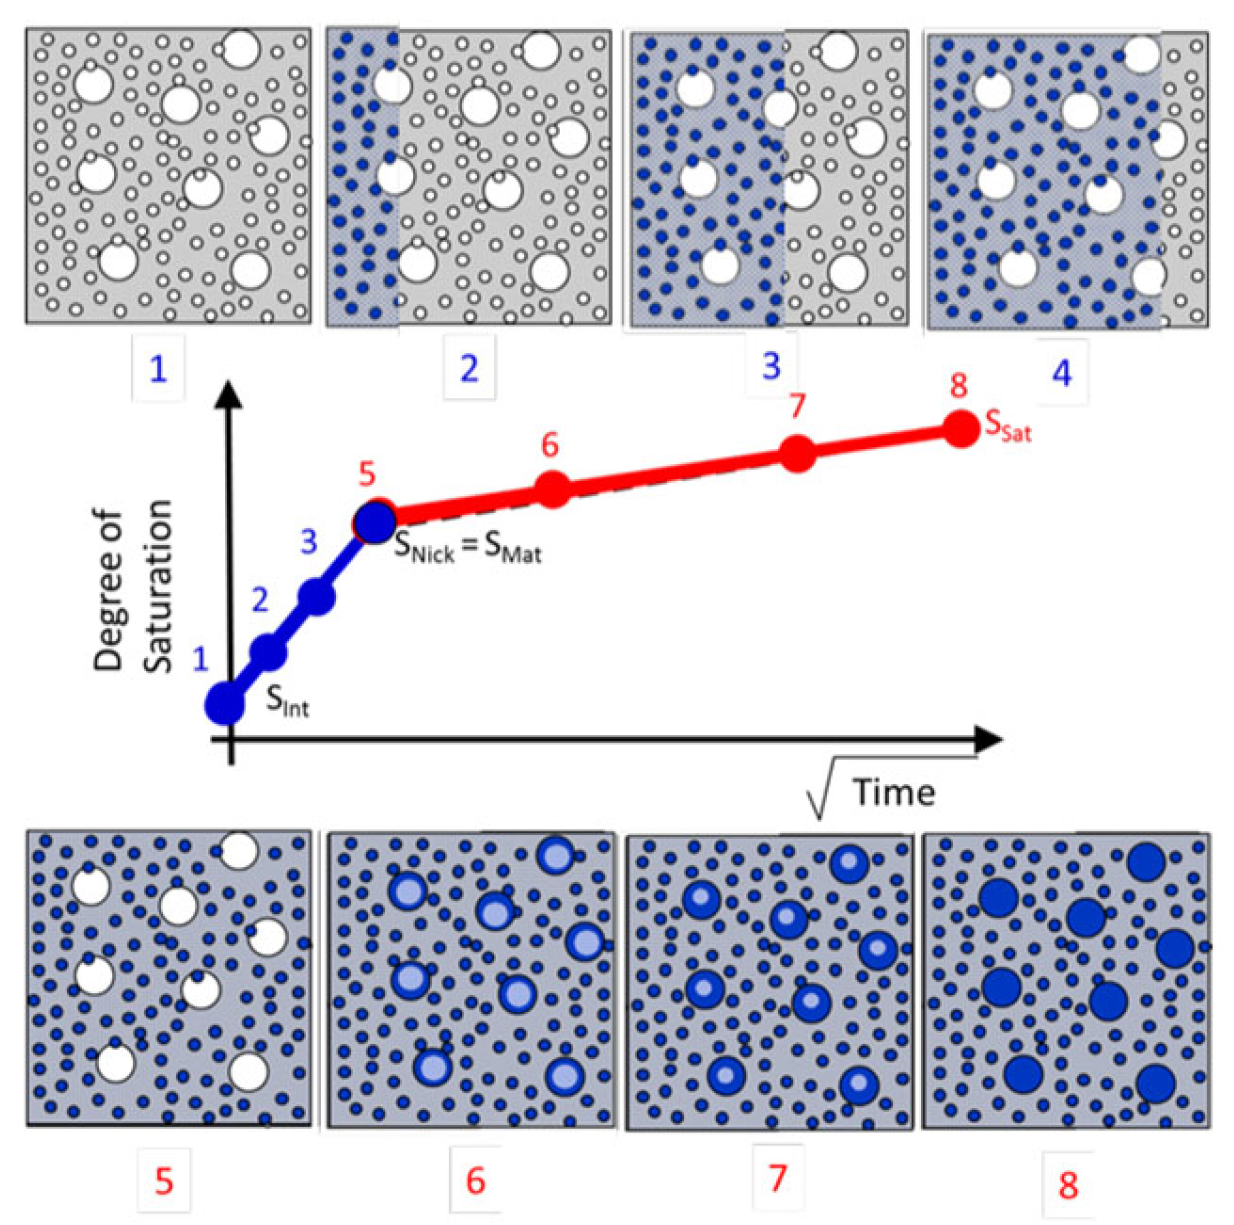
Following the initial absorption period dominated by capillary action in small, connected pores, the rate of water absorption decreases as coarser pores typically associated with entrapped or entrained air) begin to control the transport mechanism. This transition marks the onset of secondary absorption, where capillary pores are completely filled and water gradually penetrates the remaining air-filled voids. Figure 1 [29] schematically illustrates this transition to provide a clearer understanding of the two absorption stages.
The complex interaction among these factors, coupled with the heterogeneous microstructure of concrete, makes it difficult to accurately predict the total volume of absorbed water. However, experimental studies have shown that the depth of water penetration due to capillary absorption is generally limited. In normal-strength concrete, absorption depths typically range from 10 to 20 mm within 10 to 28 days. Under dry curing conditions, this can increase to 40–50 mm, with maximum penetration depths reaching up to 70 mm in extreme cases. These findings are also valid for low-strength concrete mixtures, according to predictive models [48].
The temporal characteristics of absorption are also important in understanding moisture transport in concrete. Traditionally, absorption was assumed to be proportional to the square root of time (t0.5) as shown in Figure 1, a simplification widely adopted in design codes and durability models [33]. However, more recent studies have shown this assumption may not universally apply to cement-based materials. Due to the water sensitivity and microstructural evolution of such materials, capillary absorption may follow the t0.5 relationship only during the initial hours of exposure. Over time, typically within several days, the process transitions to a slower, nearly linear regime. In certain concrete types, long-term absorption is more accurately described by a t0.25 relationship [5,33,49,50].

2.3. Diffusion

While absorption is the dominant mechanism for initial chloride ion ingress at exposed concrete surfaces, diffusion becomes the primary transport mechanism at greater depths and in fully saturated concrete [51]. Diffusion plays a critical role in the long-term deterioration of concrete, as it facilitates the inward movement of chloride ions toward embedded reinforcement, eventually leading to corrosion. This process is driven by the concentration gradient, which refers to the difference in chloride ion concentration between the surface and the interior of the concrete element [52,53].
Diffusion can occur under either non-steady-state conditions, where the diffusion rate varies with time, or steady-state conditions, where the rate remains constant. In concrete, diffusion is inherently nonlinear and time-dependent, requiring non-steady-state models due to the heterogeneous and porous structure of concrete. Concrete consists of both liquid and solid phases. The liquid phase, which forms an interconnected, liquid-filled pore network, has high diffusivity and allows chloride ions to migrate much more easily and rapidly. Diffusion through the solid phase is extremely slow and is typically considered negligible. Chemical interactions within the concrete, such as chloride binding to hydration products, the presence of other ions in the pore solution, and the continuously evolving pore structure, further influence the rate of chloride transport over time [54,55,56].
Fick’s second law is commonly used to model non-steady-state chloride diffusion. It states that the rate of change in concentration within a given volume is directly proportional to the curvature of the concentration gradient at that location, assuming that the surface chloride concentration and diffusion coefficient remain constant [57]. Equation (1) presents Fick’s second law:
δ C δ t = D a δ 2 C δ x 2
where
  • D a = apparent diffusion coefficient (m2/s);
  • C = ion concentration at a distance x from the surface after time t (g/m3);
  • x = distance (m);
  • t = time (s).
Solving Equation (1) yields the ion concentration C at depth x and time t . However, in concrete, both surface chloride concentration and diffusion coefficient vary over time due to ongoing chloride binding reactions and microstructural changes. Also, the diffusion coefficient decreases with lower relative pore humidity, greater concrete strength, and reduced temperatures [58,59,60]. Water diffusion coefficient in concrete typically varies widely, ranging from approximately 10−7 to 10−11 m2/s [59,60,61]. Therefore, the method based on Fick’s second law for measuring concrete diffusion rate is not the most precise or accurate approach [62,63,64]. Consequently, the diffusion coefficient derived from this approach is referred to as the “apparent chloride ion diffusion,” reflecting the simplified assumptions [65]. To obtain a more accurate estimate of chloride ingress in concrete, researchers have suggested adjustments to the application of Fick’s second law to consider the effects of chloride binding, time, porosity, tortuosity, and other factors [64,65,66,67]. For instance, Fick’s first law is sometimes applied initially to determine the “effective diffusion coefficient,” which represents the diffusion of free (unbound) chloride ions within the concrete pore structure, excluding binding effects [67]. This effective diffusion coefficient can then be incorporated into the more comprehensive models based on Fick’s second law for better prediction of chloride ingress. Equation (2) presents Fick’s first law:
q = D e d C d x
where
  • q = ion flux, representing the amount of substance flowing through a unit area per unit time (mol/m2.s);
  • D e = effective diffusion coefficient (m2/s);
  • C = ion concentration (mol/m3);
  • x = position variable (m);
  • d C d x = ion concentration gradient (g/m3/m).

3. Chloride Ion Permeability Testing Methods

Concrete’s fluid transport properties can be evaluated through various test methods including those that measure water absorption, ionic diffusivity, and electrical resistivity. This section discusses these methods and explains why some are widely used while others are less common.

3.1. Absorption-Based Tests

Absorption-based tests assess how quickly water penetrates the surface of concrete, providing insight into the material’s near-surface durability. These tests should not be confused with methods that measure the overall permeability of the concrete matrix [68]. Typically, Absorption-based tests involve exposing one surface of a concrete specimen to water and tracking the amount of water absorbed over time by measuring the specimen’s mass before and after exposure. The rate of mass gain indicates how fast water is absorbed into the surface.
Among the most common testing methods is the initial surface absorption test (ISAT) which is standardized under BS 1881-208 and typically used for on-site assessments, measuring the rate of water absorption over short periods [69]. In this test, a small cap is sealed to the concrete surface, and water is supplied under a controlled, low-pressure head. The volume of water absorbed is recorded at defined intervals, often spanning 10, 30, and 60 min. The measured rate of absorption, normalized by surface area, provides an indication of how permeable the concrete surface is. Greater absorption rates typically suggest greater vulnerability to chemical attacks, freeze–thaw cycling, and potential corrosion of embedded steel reinforcement. It should be noted that the initial moisture content of the concrete can significantly affect the results; therefore, some procedures such as vacuum preconditioning are sometimes used to improve consistency.
An alternative approach, commonly known as water sorptivity testing, such as that described in ASTM C1585, measures water absorption driven by capillary forces over longer durations [70]. In these tests, a prepared specimen is conditioned to a stable moisture state, and all surfaces except the test face are sealed. The exposed face is placed in shallow water, and the specimen’s mass is monitored at regular intervals. Plotting the increase in mass against the square root of time allows calculation of the sorptivity coefficient, which reflects the material’s tendency to absorb water via capillary action. This approach is particularly useful for comparing different concrete mixtures or assessing the effectiveness of surface treatments, with lower sorptivity values indicating improved resistance to moisture penetration.
Although both ISAT and sorptivity tests provide valuable information about water ingress at the concrete surface, chloride ions primarily penetrate concrete and reach embedded steel reinforcement through diffusion rather than absorption. Therefore, diffusion-based tests are more suitable for evaluating chloride ion permeability, which is critical for assessing corrosion risk to embedded reinforcement.

3.2. Diffusion-Based Tests

Diffusion-based tests are essentially designed to simulate diffusion of chloride ions into concrete over time. However, methods relying on the natural diffusion process (true diffusion-based tests) have seen limited practical application due to the lengthy durations required (often several months) to allow ions to penetrate just 10 mm in mortar specimens and for the natural diffusion process to reach the steady-state condition [71,72,73]. Therefore, researchers have proposed several techniques to accelerate the test and diffusion process such as reducing the thickness of the specimen, increasing the upstream chloride concentration, or using an external current. While the first two techniques have not gained widespread acceptance, the use of an external current has been widely adopted [54,74]. These tests, known as migration-based tests, accelerate ion movement by applying an external electrical potential difference across the specimen, forcing chloride ions to migrate faster than under natural diffusion conditions.

3.2.1. True Diffusion-Based Tests

Common true diffusion-based tests include the salt ponding test [75], the apparent chloride diffusion test [76], and the accelerated chloride penetration test [77]. These tests are all based on the same fundamental concept of natural chloride diffusion. In these tests, a diffusion cell is typically used, with one chamber containing a chloride solution and the other free of chlorides. Chloride ions naturally migrate through the specimen over time, and once a steady-state condition is reached, the measured chloride flux is used to determine the diffusion coefficient. Because of the long duration required for this steady state to develop, true diffusion-based tests are mainly used for research rather than routine control.

3.2.2. Migration-Based Tests

Since the 1970s, many researchers have tried to develop a practical, rapid, inexpensive, and reliable, test for evaluating the chloride ion permeability of concrete. Using an external current to accelerate the diffusion process is a widely used approach to measure ion diffusion [54]. However, the diffusion coefficient obtained from such migration-based tests is different from that derived from true diffusion tests because the applied voltage violates the steady-state assumptions of Fick’s first or second law used to determine the natural diffusion coefficient [22]. Common migration-based tests include Rapid Chloride Ion Penetration Test (RCPT, ASTM C1202) [78], Chloride Diffusion Coefficient from Migration Cell Experiments (NT Build 355) [79], Effective Diffusion Coefficient by Migration (JSCE-G571) [80], and Chloride Migration Coefficient from Non-Steady State Migration Experiments (NT Build 492) [81].
Among these, the last three have not gained widespread popularity. NT Build 355 [79] offers acceptable accuracy but is highly time-consuming (>8 days). The JSCE-G571 method [80] requires 11 days or more, making it less suitable for rapid assessment needs. The NT Build 492 [81] is faster (6 to 96 h), depending on the concrete quality and applied voltage (10–60 V). However, because different voltage levels may be used for different tests, the results are not directly comparable unless the tests are conducted under the same voltage conditions. The RCPT, according to the ASTM C1202 [78], is the fastest and most commonly used method.
The RCPT, also known as the coulomb test, was the first simplified and electrically accelerated approach for evaluating the chloride ion permeability of concrete. It was originally developed by Whiting [82,83,84] in 1981 to determine the diffusion coefficient of concrete. Before that, the salt ponding test was the most common method for evaluating the diffusion coefficient of concrete, but that test was both time-consuming and expensive [85]. Based on the method developed by whiting, ASTM published the first version of ASTM C1202 [78] in 1991, which measures the total electrical charge (current) that passes through a 51 mm slice of saturated concrete (with a 127 mm diameter) due to an applied electrical gradient within the slice during testing. The measured current and time are integrated to compute the total charge passed (coulombs), which is then used to classify the chloride ion permeability of concrete. A greater total electrical charge passing through the concrete specimen indicates that the concrete is more permeable. ASTM C1202 [78] categorizes chloride ion penetration into five classes based on the total charge passed, as shown in Table 1.
According to ASTM C1202 [78], a 51 mm slice cut from a 102 by 203 mm cylinder specimen is placed in a vacuum desiccator, evacuated to less than 6650 Pa for three hours, then submerged in deionized water for one hour under vacuum, ad finally left in the vacuum desiccator for an additional 18 h while the pump is off. Then, the specimen is tested in a testing cell with one side exposed to a 3.0% sodium chloride (NaCl) solution and the other side is exposed to a 0.3 N sodium hydroxide (NaOH) solution. A 60 V DC power supply is applied, and the current is measured every 30 min for six hours. The total charge passed (coulombs), a measure of the electrical conductance of the concrete (greater electrical conductance indicates that the specimen is more permeable) during the period of the test, is calculated as:
Q x = 900 × ( I 0 + 2 I 30 + 2 I 60 + + 2 I 300 + 2 I 330 + I 360 )
Q s = Q x × ( 95 x ) 2
where
  • Q x = total charge passed through a specimen with diameter of x (coulombs);
  • I 0 = current immediately after voltage is applied (amperes);
  • I t = current at time t after voltage is applied (amperes);
  • t = time (min);
  • Q s = adjusted total charge passed through a 95 mm diameter specimen (coulombs);
  • x = diameter of the actual specimen (mm).
Although the RCPT has been widely accepted and utilized for more than three decades, there are still some important issues related to the RCPT. While its total duration, approximately 30 h including specimen conditioning, is shorter than that of true diffusion-based chloride permeability tests, it is still relatively long compared to other electrical tests that can be completed in less than an hour. Moreover, the RCPT may not attain a steady-state condition as the high potential difference of 60 V is only applied for six hours and the total charge passed is calculated during this limited period of time [8,86]. The high voltage (60 V) used in the test also generates significant heat, particularly in highly conductive (permeable) concrete specimens, which increases the specimen’s electrical conductivity [13,14]. This elevated conductivity further accelerates current flow, leading to a self-perpetuating cycle of rising conductivity, current, and temperature, all of which can distort the test results and misleadingly suggest greater permeability [13,15,16,17].
Another issue is that the RCPT is mistakenly referred to as the “Rapid Chloride Permeability Test,” which is somewhat misleading, as the test does not directly measure chloride permeability in the conventional sense. Permeability refers to fluid flow through a porous material under a pressure gradient, whereas the RCPT measures electrical conductance as an indirect indicator of ionic movement within concrete under an applied electrical potential. Additionally, the total charge passed during testing is influenced by the movement of all ions present in the pore solution, not just chloride ions, with OH ions typically being the dominant charge carriers [8,15,21,22,23,24].
The use of SCMs may further distort accuracy of the RCPT results. Some studies have reported that SCMs can artificially reduce the total charge passed, thereby appearing to reduce permeability, while other studies have shown that the SCMs may artificially increase the permeability [20,25,26,27,87]. This discrepancy is largely attributed to the different effects SCMs have on pore structure and pore solution chemistry. For instance, SCMs can reduce the total charge passed by reducing OH concentrations in the pore solution but can also increase the total charge passed by increasing concrete density, which raises heat generation, conductivity, and consequently, the total charge passed [19,87,88]. In some cases, these combined effects have led to an underestimation of SCM effectiveness in enhancing chloride resistance by as much as a factor of two [8,20]. Therefore, the use of the RCPT as a sole indicator of chloride permeability in concrete, especially for concrete mixtures containing SCMs or chemical admixtures, may not be entirely accurate.

3.3. Electrical Resistivity Tests

The electrical resistivity of a material indicates its ability to impede the flow of electrical current. It is the inverse of electrical conductivity and provides information about how difficult it is for electricity to pass through the material. Research [89] has shown that there is a statistically significant linear correlation between the probability of corrosion initiation and electrical resistivity in concrete, highlighting its value as a non-destructive indicator of durability. The resistivity of a concrete specimen can be calculated using Equation (5):
ρ = R × K g
where
  • ρ = specimen measured resistivity (Ω-cm);
  • R = electrical resistance (Ω); and
  • K g = geometric factor (cm), which is a numerical multiplier that depends on the electrode configuration used to measure the electrical resistivity.
The electrical resistance, R , is measured during testing or can be determined from Ohm’s law using Equation (6):
R = V I
where
  • V = voltage (V);
  • I = current (amperes).
Concrete resistivity, the ability of a concrete specimen to resist the movement of ions in an electric field, is not significantly affected by its geometry. A saturated concrete is a porous solid with low conductivity, but its pore solution (such as water) has relatively high conductivity due to the presence of ions that enable electrical charge to move through the concrete. Therefore, the electrical properties of concrete (such as concrete resistivity) are primarily determined by conductivity of the pore solution (type and quantity) and the properties of pore structure. Since conductivity of the pore solution is relatively constant across similar concrete mixtures, it can be removed from calculations when comparing the resistivity of different concrete specimens. Consequently, concrete resistivity can be exploited as a rapid method to evaluate the pore structure of concrete such as the size and distribution of pores, their interconnectivity, and tortuosity [90]. Therefore, concrete resistivity has the potential to be a reliable indicator of permeability since it is influenced by the pore structure properties of concrete, and pore structure is the main factor that affects the permeability of concrete.
Previous research has reported an acceptable correlation between concrete resistivity and chloride permeability [91,92,93]. Additionally, it has been shown that steel reinforcement corrosion rate and concrete resistivity are also correlated, as the movement of ions between anodes and cathodes on the surface of steel bars is a significant factor for corrosion rate [94]. Since greater permeability leads to less resistivity, increased chloride ion penetration, and accelerated steel reinforcement corrosion rate, it is expected that the chloride diffusion coefficient decreases as concrete resistivity increases. This inverse relationship has been validated in several studies. The proportionality factor linking concrete resistivity and the chloride diffusion coefficient is influenced by both free chloride transport and the extent of chloride binding, which depends on the type and amount of cement used in the mixture [95,96,97].
There are two common techniques used to measure the electrical resistivity of concrete including the bulk resistivity test (BRT) and the surface resistivity test (SRT). The BRT determines the electrical resistivity of concrete using plate electrodes on the two end faces of a cylindrical specimen while the SRT uses a Wenner array on the surface of the specimen to measure electrical resistivity of concrete [98].

3.3.1. Bulk Resistivity Test (BRT)

The BRT measures electrical resistivity through the entire volume of a concrete specimen. In this method, a low-frequency alternating current is applied across two plate electrodes attached to the end faces of a saturated cylindrical specimen. During the test, the voltage difference between the electrodes is recorded. By substituting the applied current (I), measured voltage (V), and the specimen’s geometric factor (Kg) into Equation (5), the bulk resistivity is calculated and is typically expressed in Ω·cm. This value indicates the concrete’s resistance to electrical flow, which is closely associated with its ability to resist ionic transport such as chloride ion penetration. In the BRT, the geometric factor, Kg, in Equation (5) is defined as the ratio A⁄L, where A is the specimen cross-sectional area (cm2) and L is the specimen length (cm) [99].
Although BRT provides more precise and representative measurements of the concrete’s internal resistivity compared to SRTs, it is less practical for field applications. First, the method is not non-destructive, as it requires extracting a cylindrical core, which may not always be feasible in existing structures. Secondly, the testing procedure is time-consuming: the specimen must be preconditioned and submerged in a simulated pore solution (such as water) for at least six days before measurement. While the actual resistivity measurement takes less than five minutes, the overall process exceeds six days, making the BRT even slower than the RCPT in total testing time [100].

3.3.2. Surface Resistivity Test (SRT)

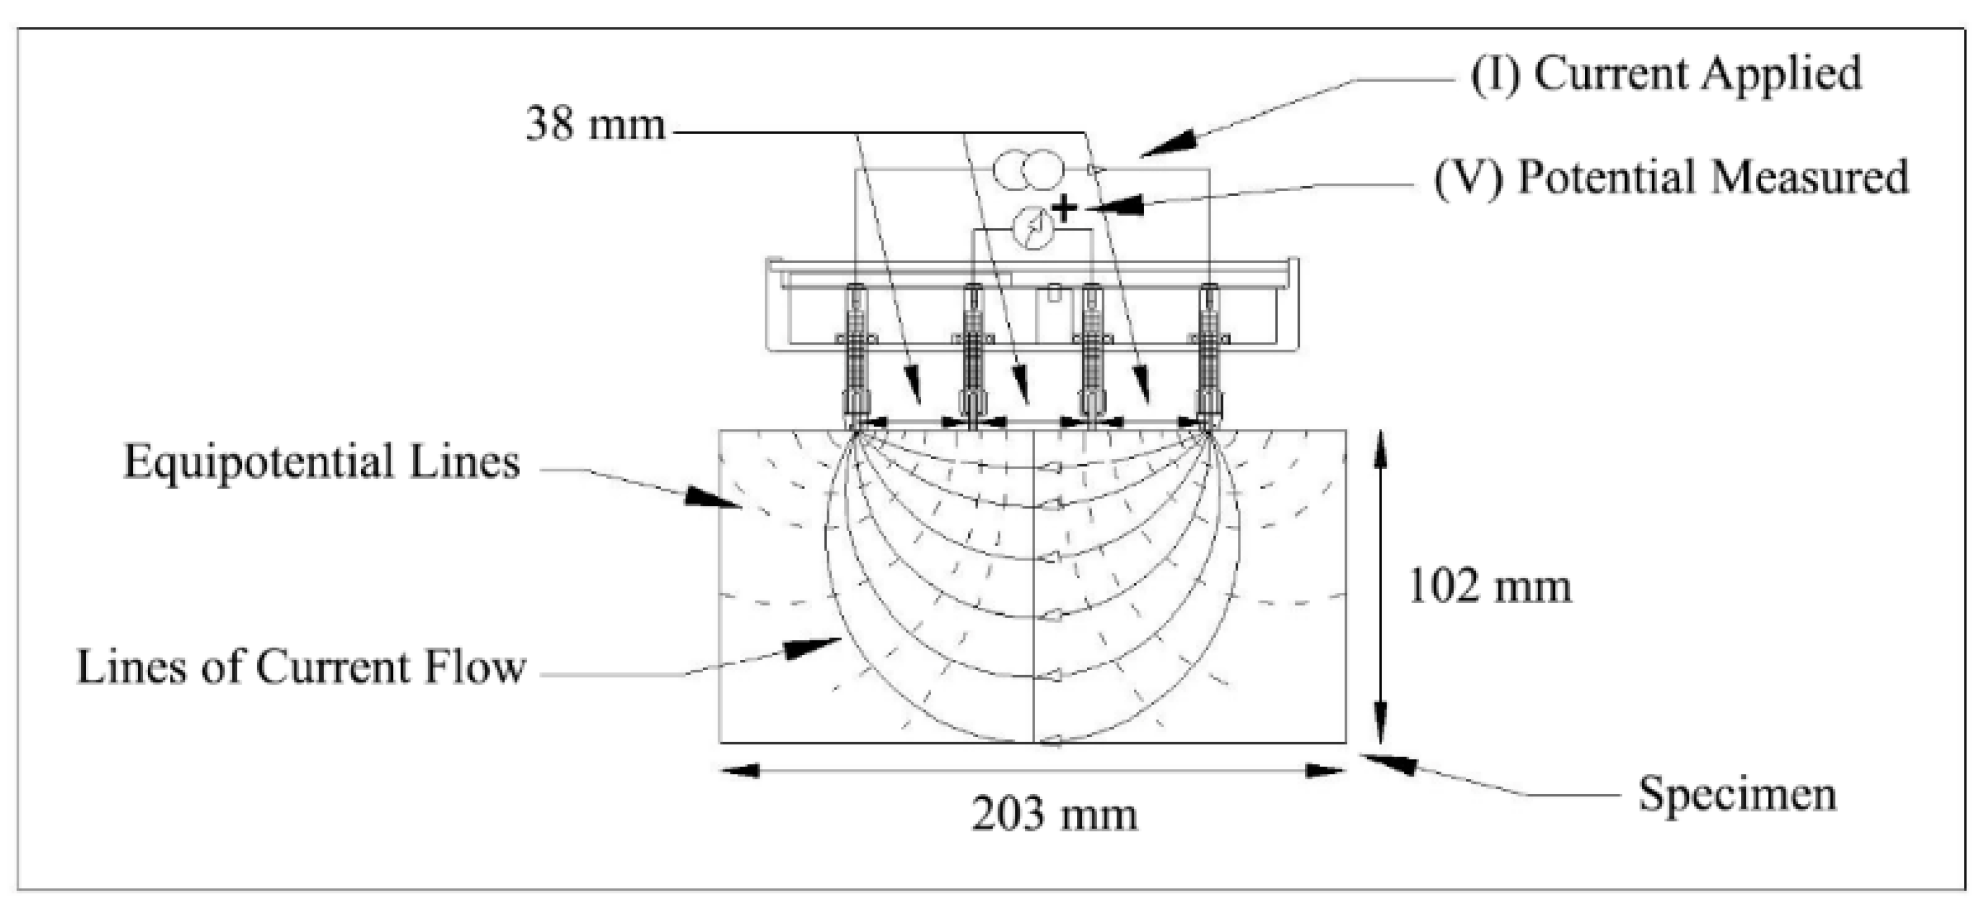
The SRT measures the electrical resistivity near the surface of a concrete specimen rather than through its entire volume. Three primary electrode configurations are commonly used to assess surface resistivity: the Wenner array, dipole–dipole array, and Schlumberger array. Among these, the Wenner array is the most widely used in concrete applications. Therefore, the SRT for concrete typically employs a four-pin Wenner probe array resistivity meter, which has four equally spaced surface contacts. This device applies a 25 V peak-to-peak and 13 Hz alternating trapezoidal voltage through the specimen via the outer pair of contacts and measures the resulting voltage drop between the inner pair [101]. Over the past two decades, SRTs based on AASHTO TP 95 or AASHTO T 358 [98,102] have been widely performed by U.S. departments of transportation for testing permeability of structural concrete and concrete pavements [103,104].
AASHTO T 358 [98] describes the SRT method, which involves applying an alternating current potential difference through the outer pins (current electrodes) of a four-pin Wenner probe array, generating current flow in the concrete. The resulting potential difference between the two inner pins (potential electrodes) is then measured (Figure 2). The current (I) used, resultant potential (V), and affected specimen area are used to determine the concrete’s surface resistivity, which is expressed in Ω-cm. This value serves as an indicator of the concrete’s electrical resistivity during the test and is associated with its resistance to chloride ion penetration. It should be noted that the cylindrical specimen used in this test must be kept wet throughout the testing process [98].
The SRT offers several advantages over other permeability tests such as the BRT and the RCPT. The SRT is considered a rapid test that substantially decreases specimen preparation and test time compared to other permeability tests. Additionally, this test is non-destructive and can be performed on in situ structures. The SRT also requires fewer specimens for reasonable evaluation than other destructive permeability tests since the SRT can be performed on the same specimens at different ages. This test can also be conducted on cylindrical specimens before testing for strength properties [105]. Therefore, the SRT is generally considered suitable for QC and QA testing.
Despite its usefulness, the SRT has several technical and practical limitations. First, SRT provides only an indirect indication of concrete permeability and does not measure permeability directly. The test measures the electrical resistivity of the concrete surface, which is influenced by the pore structure, moisture content, and ionic concentration. While higher resistivity generally corresponds to lower permeability, SRT does not directly measure the actual flow of fluids through the concrete. Additionally, the Wenner probe used in the SRT is highly sensitive, meaning even slight movements during testing can lead to inaccurate results. Accurate measurements require a steady hand and careful handling. Moreover, all the probe pins must make proper contact with the concrete surface for the device to provide correct readings. Minor surface irregularities can interfere with this contact and affect the results. Consistency across multiple measurements also depends on placing the probe in precisely the same location each time.
Other factors that substantially influence electrical resistivity measurements include degree of saturation, testing temperature, and external coating type [106]. The selection of the curing method, such as immersion in lime water, storage in a controlled-moist environment, or curing in plastic molds at ambient temperature, can also significantly affect the outcomes of the SRT. For example, immersion in water or lime solutions may lead to the leaching of alkalis from the concrete’s pore solution, which can alter the pore chemistry and affect resistivity readings. Therefore, the conditioning protocol should be explicitly defined, and the test should be conducted under standardized procedures within a controlled laboratory setting to ensure reliable and accurate measurements [107,108].
AASHTO T 358 [98] presents five categories of chloride ion penetration based on SRT results as shown in Table 2. It can be observed in Table 2 that greater surface resistivity values indicate that the concrete specimen is less permeable. It should be noted that, in practice, concrete resistivity is often expressed in Ω-m or kΩ-cm, with the latter being more commonly used in the United States. For consistency, concrete resistivity will be reported in kΩ-cm from this point forward.

4. Relationship Between the RCPT and the SRT

This section provides an overview of studies that have investigated the relationship between results from the RCPT and the SRT. Since 2003, researchers have been studying this topic, and the majority of their findings indicate a significant correlation between these two permeability tests. Some of these studies have presented an equation to describe this relationship, while others have not.
Several parameters may affect the relationship between the two tests, including w/cm ratio, testing age, and type of SCMs used. The concrete industry currently uses various types of SCMs, including silica fume, fly ash, natural pozzolans (such as pumicite and tuff), ground granulated blast furnace slag (GGBFS), metakaolin, and rice husk ash (RHA), among others. The inclusion of these SCMs generally improves the microstructure of concrete, making it denser and thereby reducing its permeability [109,110,111,112]. According to Song et al. [113], using silica fume in concrete leads to a finer pore structure with reduced connectivity, improving impermeability. This reduction in permeability is mainly due to densification of the cement matrix, refinement of pore size, and improved ITZ between the aggregate and paste. This improvement stems from the pozzolanic reaction where silica fume interacts with calcium hydroxide (CH) during hydration, producing additional calcium silicate hydrate (CSH) and densifying the ITZ. Similarly, another study [114] found that silica fume significantly reduces porosity, bleeding, and permeability of ultra-high-performance concrete (UHPC) through the formation of calcium hydrate resulting from the reaction of CH and silica fume. Additionally, Saha [115] observed that fly ash helps reduce chloride ion penetration in concrete, primarily due to its ability to bind alkalis and its impact on lowering the connectivity of pore spaces.
Overall, the observed increase in density in such concrete mixtures can be attributed to the unique physical characteristics of the SCM particles or their chemical reactivity (pozzolanic reaction). In general, pozzolanic reactions between SCMs and CH lead to additional CSH formation, which fills voids in the matrix and reduces permeability [116,117]. It has been shown that SCMs effectiveness in reducing concrete permeability depends on many factors, such as the curing conditions and the type and amount of SCM used [109].

4.1. Overall Comparison

Over the past few decades, several studies have investigated the relationship between RCPT and SRT results for concrete mixtures containing different SCMs with varying strength classes. Additionally, factors such as testing age (degree of hydration), w/cm ratio, and other variables have been examined for their influence on this relationship. Assuming that the electrical conductivity of a concrete specimen remains constant during tests, theoretical principles suggest that the relationship between the RCPT and the SRT should follow a linear inverse pattern. That is, as SRT value increases (higher resistivity), RCPT value decreases (lower electrical conductivity) and vice versa. This relationship can be expressed as:
R C P T = a   ×   S R T 1
where
  • R C P T = charge pass through the specimen using the RCPT (coulombs);
  • S R T = surface resistivity value using SRT (kΩ-cm);
  • a = a scaling factor based on material properties and test conditions.
However, the assumption of constant conductivity during testing is not always valid in most practical applications of the RCPT. During the RCPT process, the temperature of concrete specimen and its pore solution increases due to the high voltage (60 V) applied over six hours, which causes Joule heating [13]. This rise in temperature increases the electrical conductivity of the specimen over time, meaning that conductivity is not constant throughout the testing period. As a result, the RCPT often yields greater charge passed values, leading to an overestimation of the concrete’s actual permeability. Therefore, the relationship between the RCPT and the SRT typically do not follow a perfect linear inverse correlation and nonlinear behavior is observed when RCPT results are plotted against SRT values [118].
To account for these temperature-induced deviations, many researchers have proposed that the relationship between the RCPT and the SRT follows a power-law model, typically expressed as:
R C P T = a   ×   S R T b
where
  • b = An exponent that defines the curvature of the relationship (negative and not equal to −1).
In this relationship, the value of the exponent “b” varies depending on the concrete’s density and conductivity. Generally, as conductivity increases, the temperature rise during the RCPT becomes more significant, which further amplifies conductivity. Therefore, for concrete with low permeability (low conductivity), the exponent tends to be closer to −1, indicating a more linear inverse relationship. In contrast, for more permeable or conductive mixtures, “b” becomes more negative, reflecting greater deviation from linearity due to stronger temperature effects during the RCPT.
In response to the temperature-induced fluctuations in RCPT results, many researchers have investigated different strategies to reduce this effect and achieve a more consistent, linear relationship between the RCPT and the SRT. Some of the approaches include shortening the RCPT duration and focusing on initial conductivity readings as a better indicator of permeability [13,16,24,119,120,121]. The ultimate goal of these modifications is to ensure that RCPT measurements more accurately reflect the intrinsic chloride transport properties of concrete, independent of test-induced thermal effects.
Julio-Betancourt and Hooton [13] found that if the temperature remains stable during the RCPT, a linear correlation is expected between the conductivity and total charge passed in the RCPT, with a very high correlation coefficient (R2 = 0.988). Therefore, they proposed a simple alternative: a 1 min conductivity test using the same RCPT apparatus, which could serve as a practical supplement and improvement to the current ASTM C1202 standard [13,78]. Additionally, McGrath and Hooton [119] proposed estimating the six-hour charge passed by analyzing data from just the first 30 min of the RCPT. Similarly, another study [120] observed a strong correlation between the total charge passed measured within the initial 1 to 10 min and the total charge after six hours. These findings highlight that the electrical conductivity of a given concrete specimen generally remains stable unless affected by temperature rise due to Joule heating. Other researchers have also confirmed that early-stage current readings can reliably predict the total charge passed, highlighting the potential for shorter testing alternatives [16,24,121].
Table 3 presents a summary of RCPT-SRT correlation data collected from a wide range of studies since 2003, covering concrete mixtures with different strength levels, curing ages, and types of SCMs [85,103,104,107,110,111,118,122,123,124,125,126,127,128,129,130,131,132,133,134]. Some regression equations were developed by the authors using data reported in the original studies.
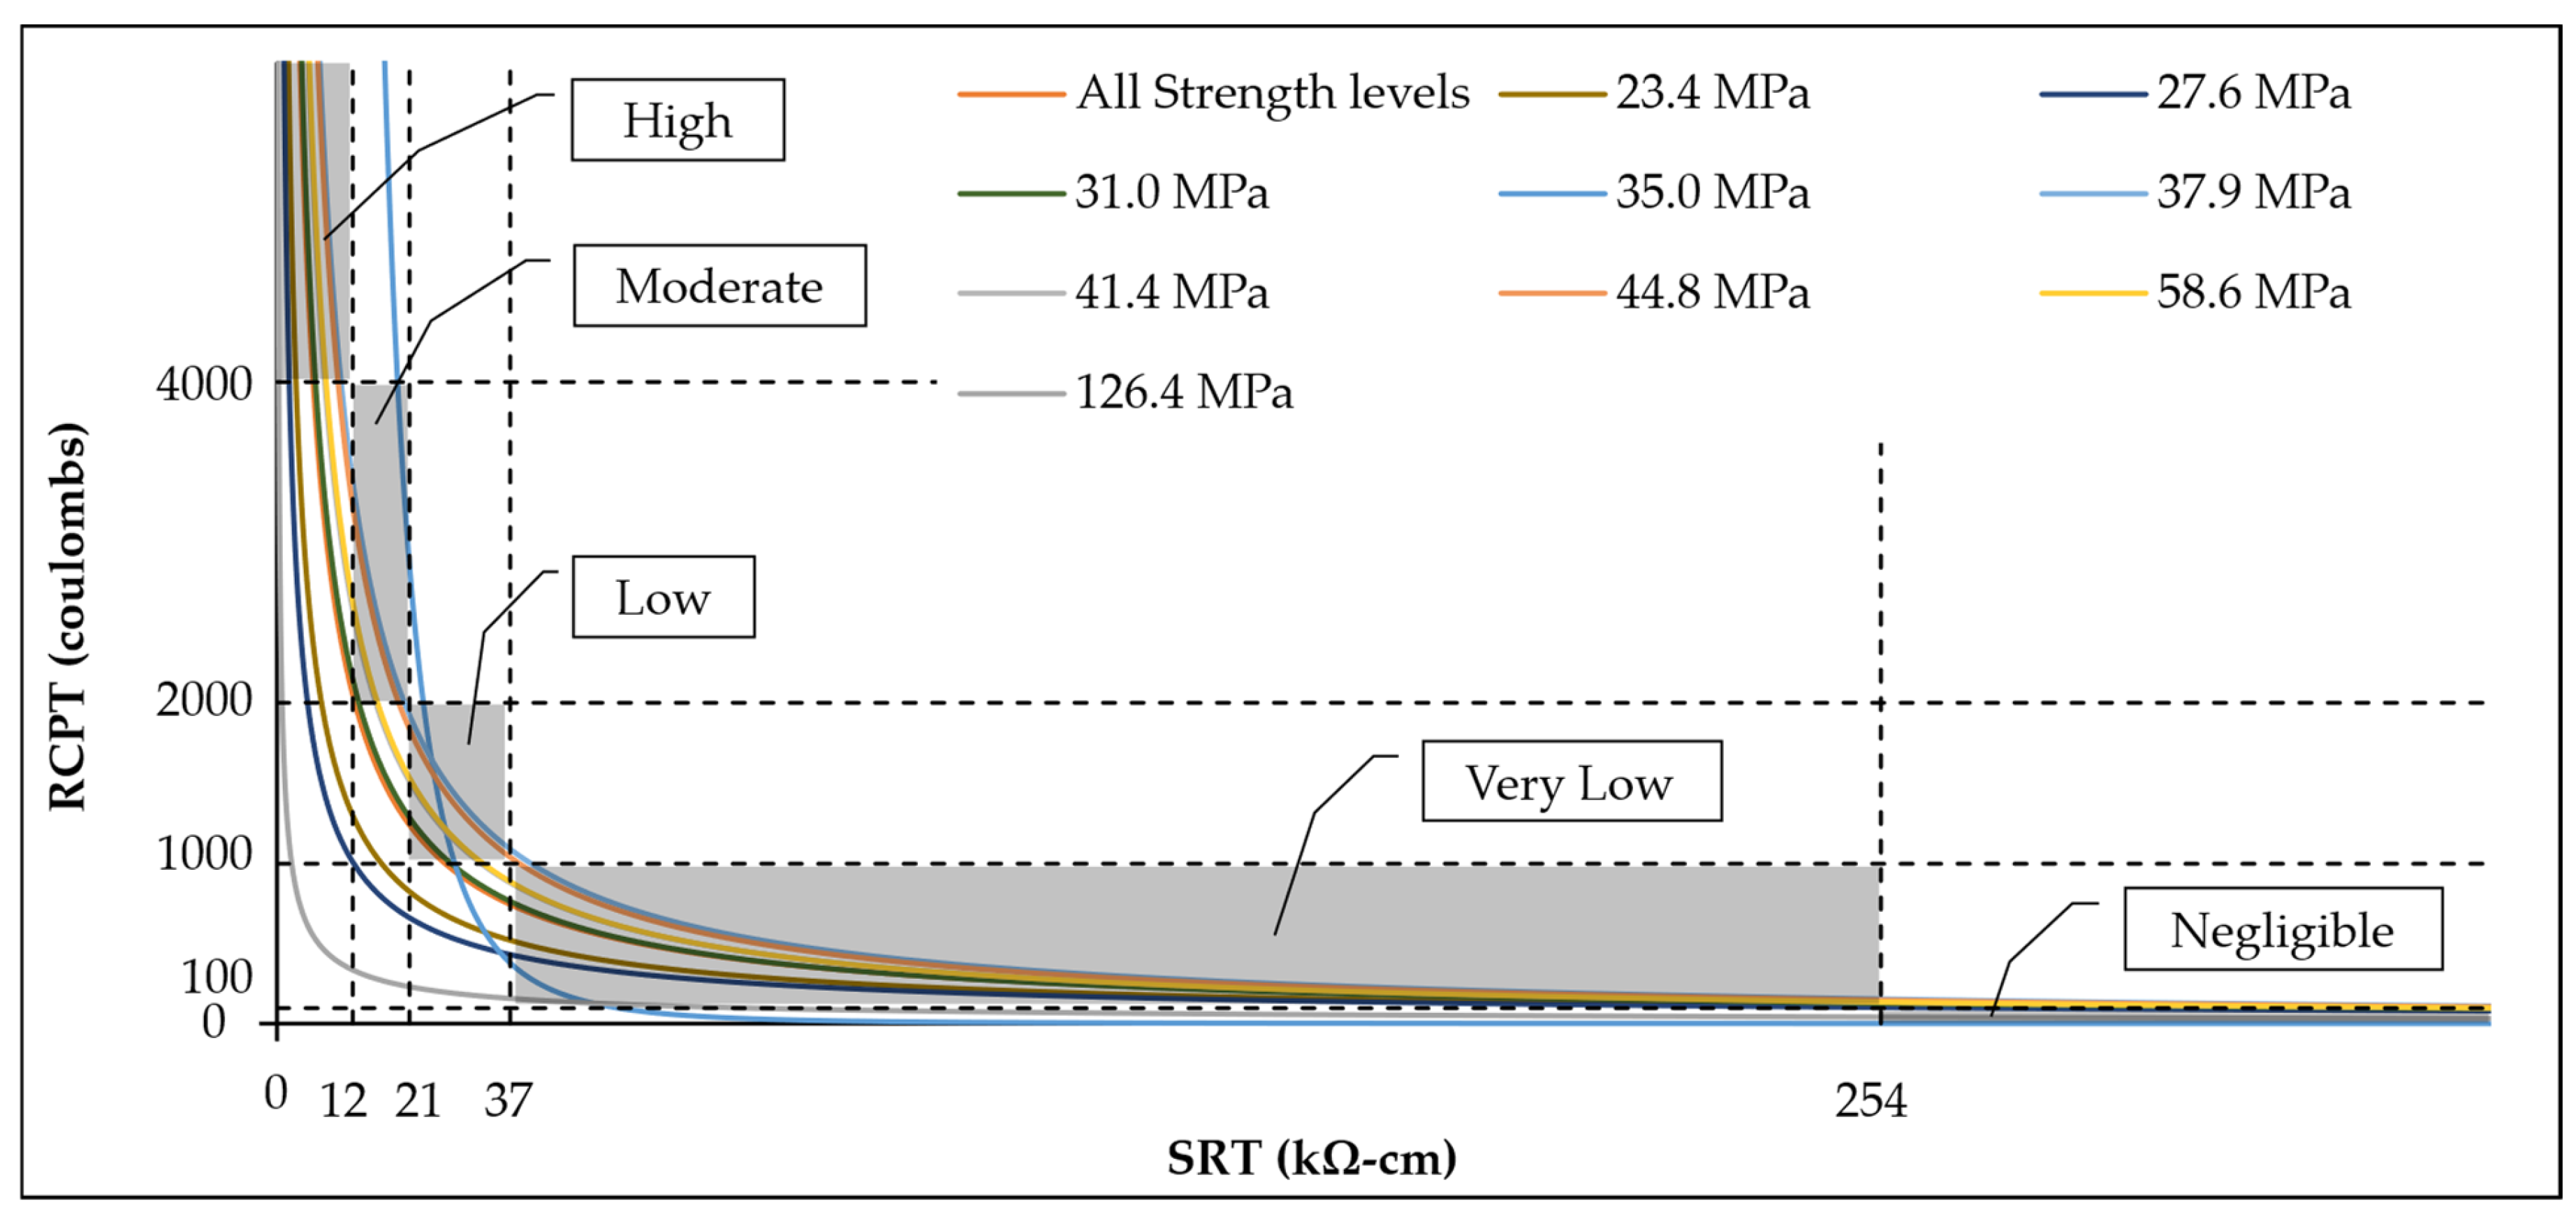
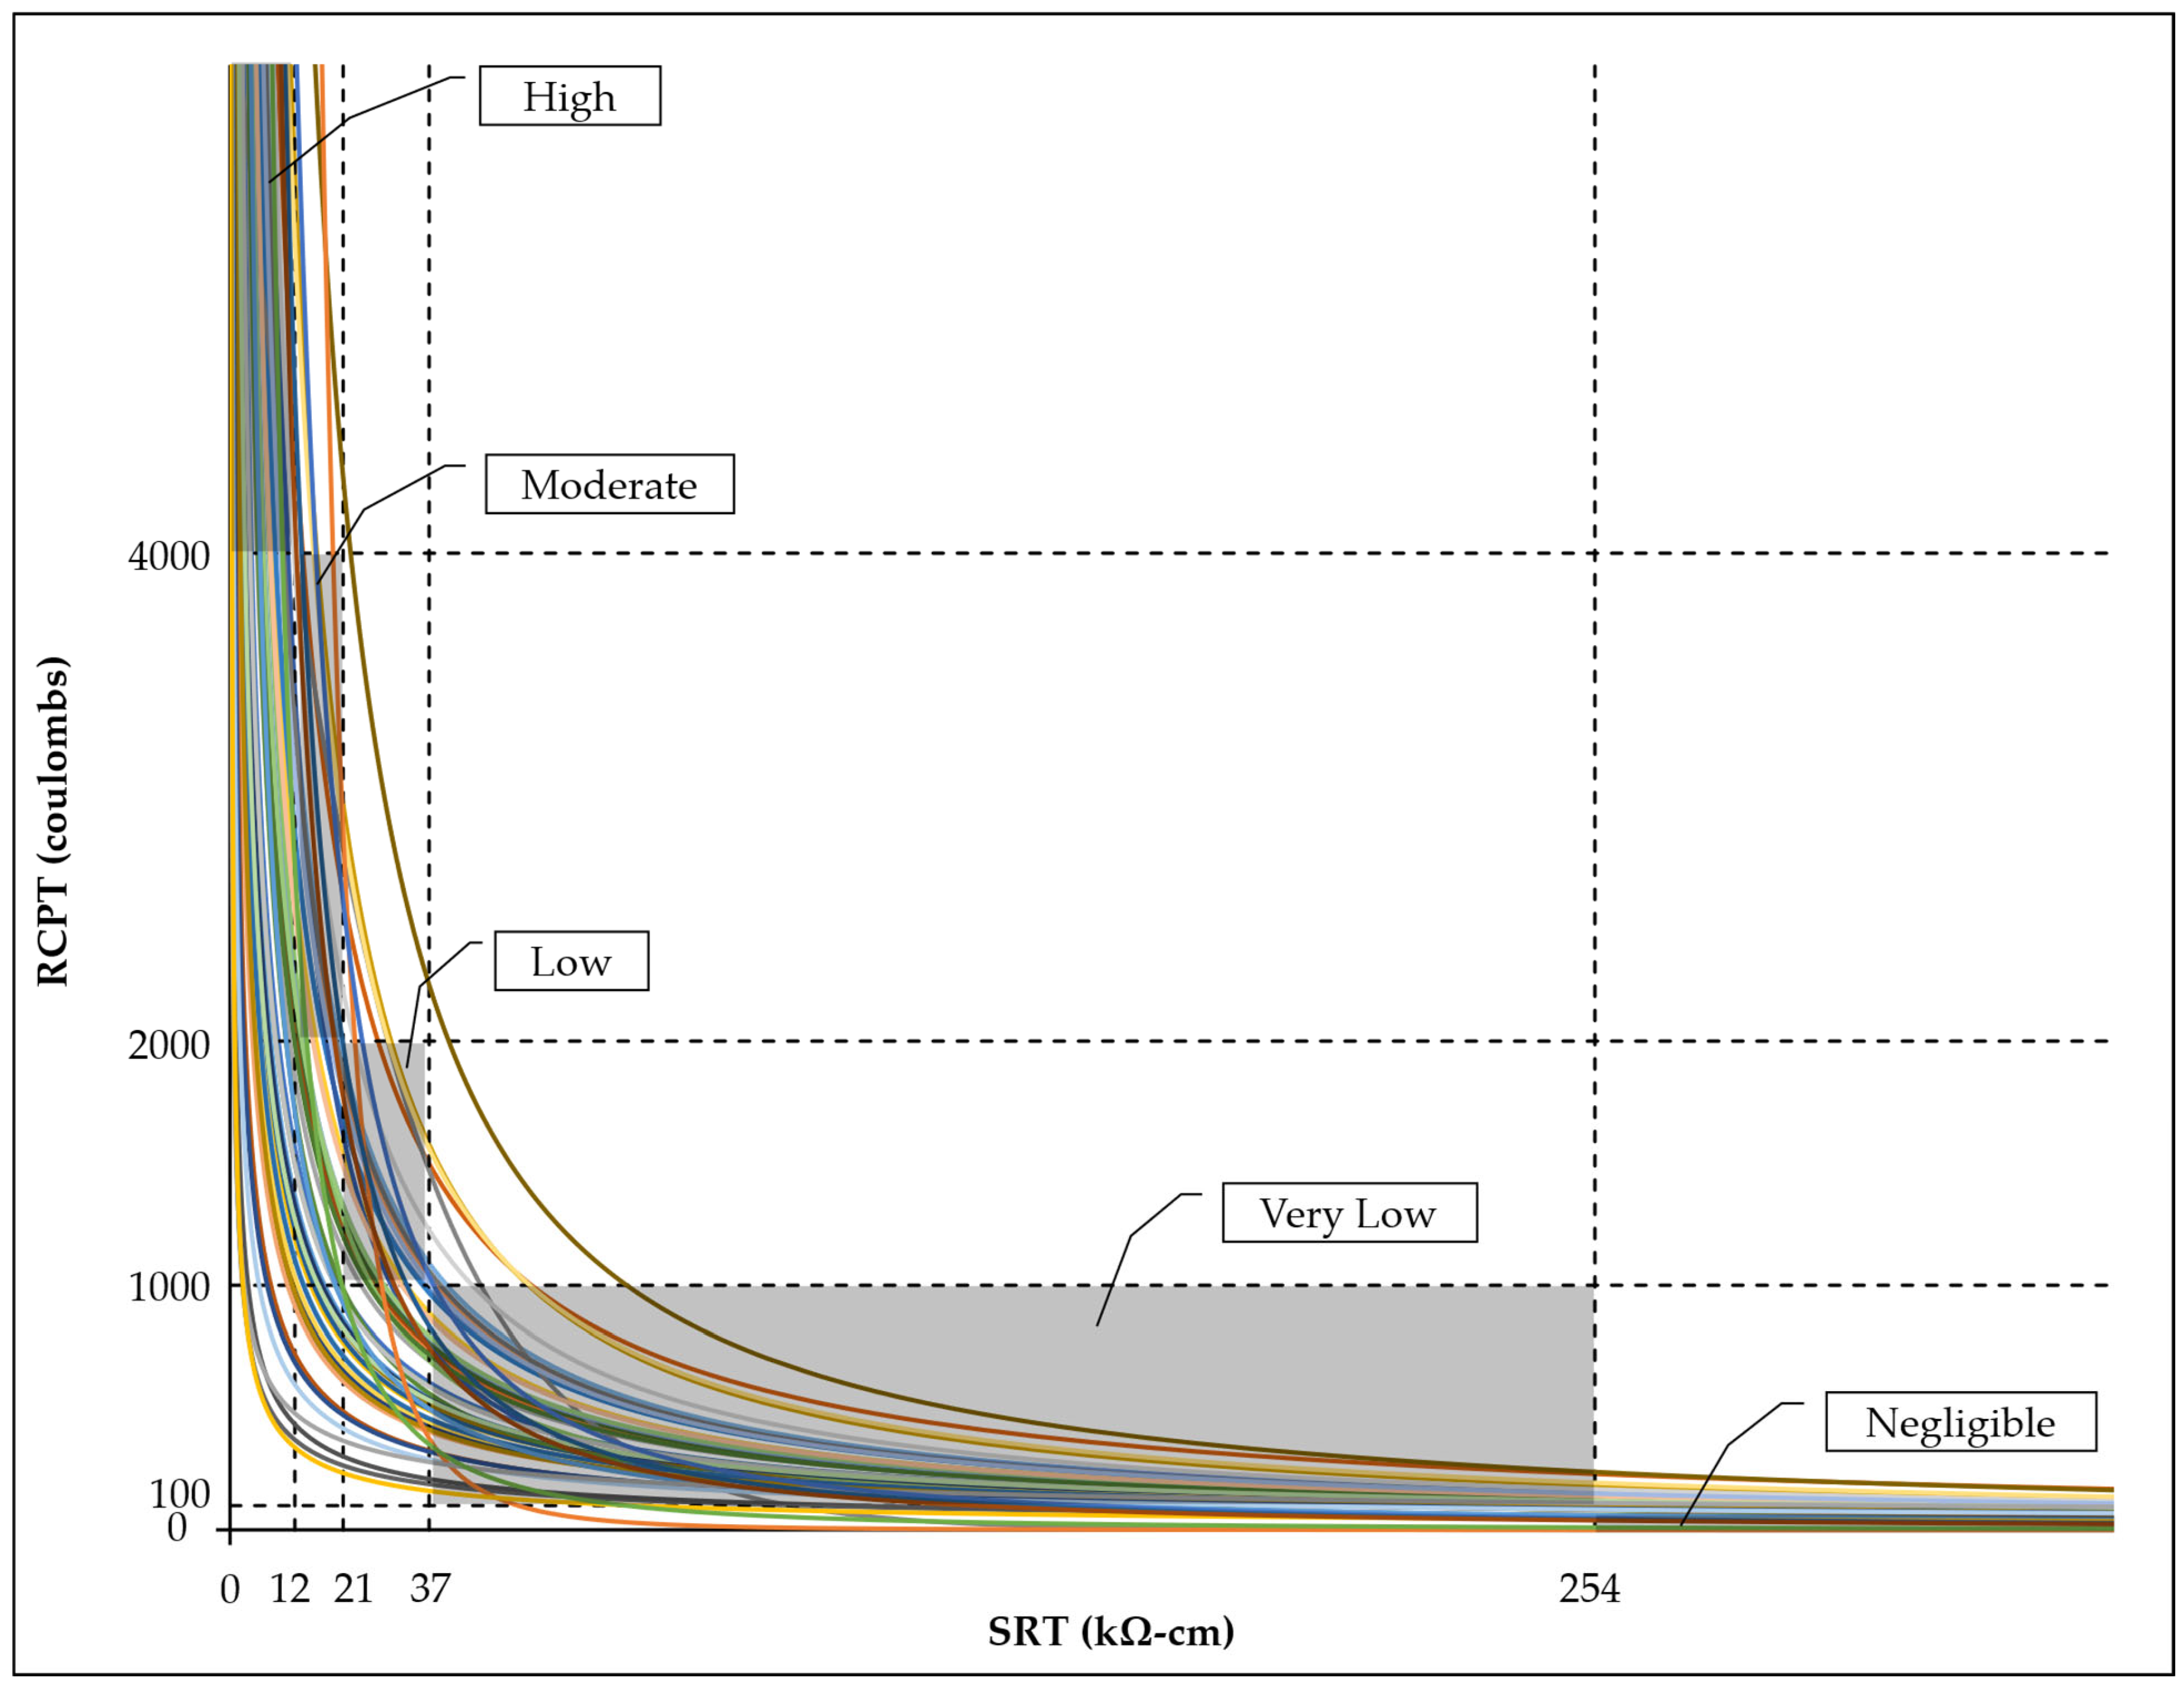
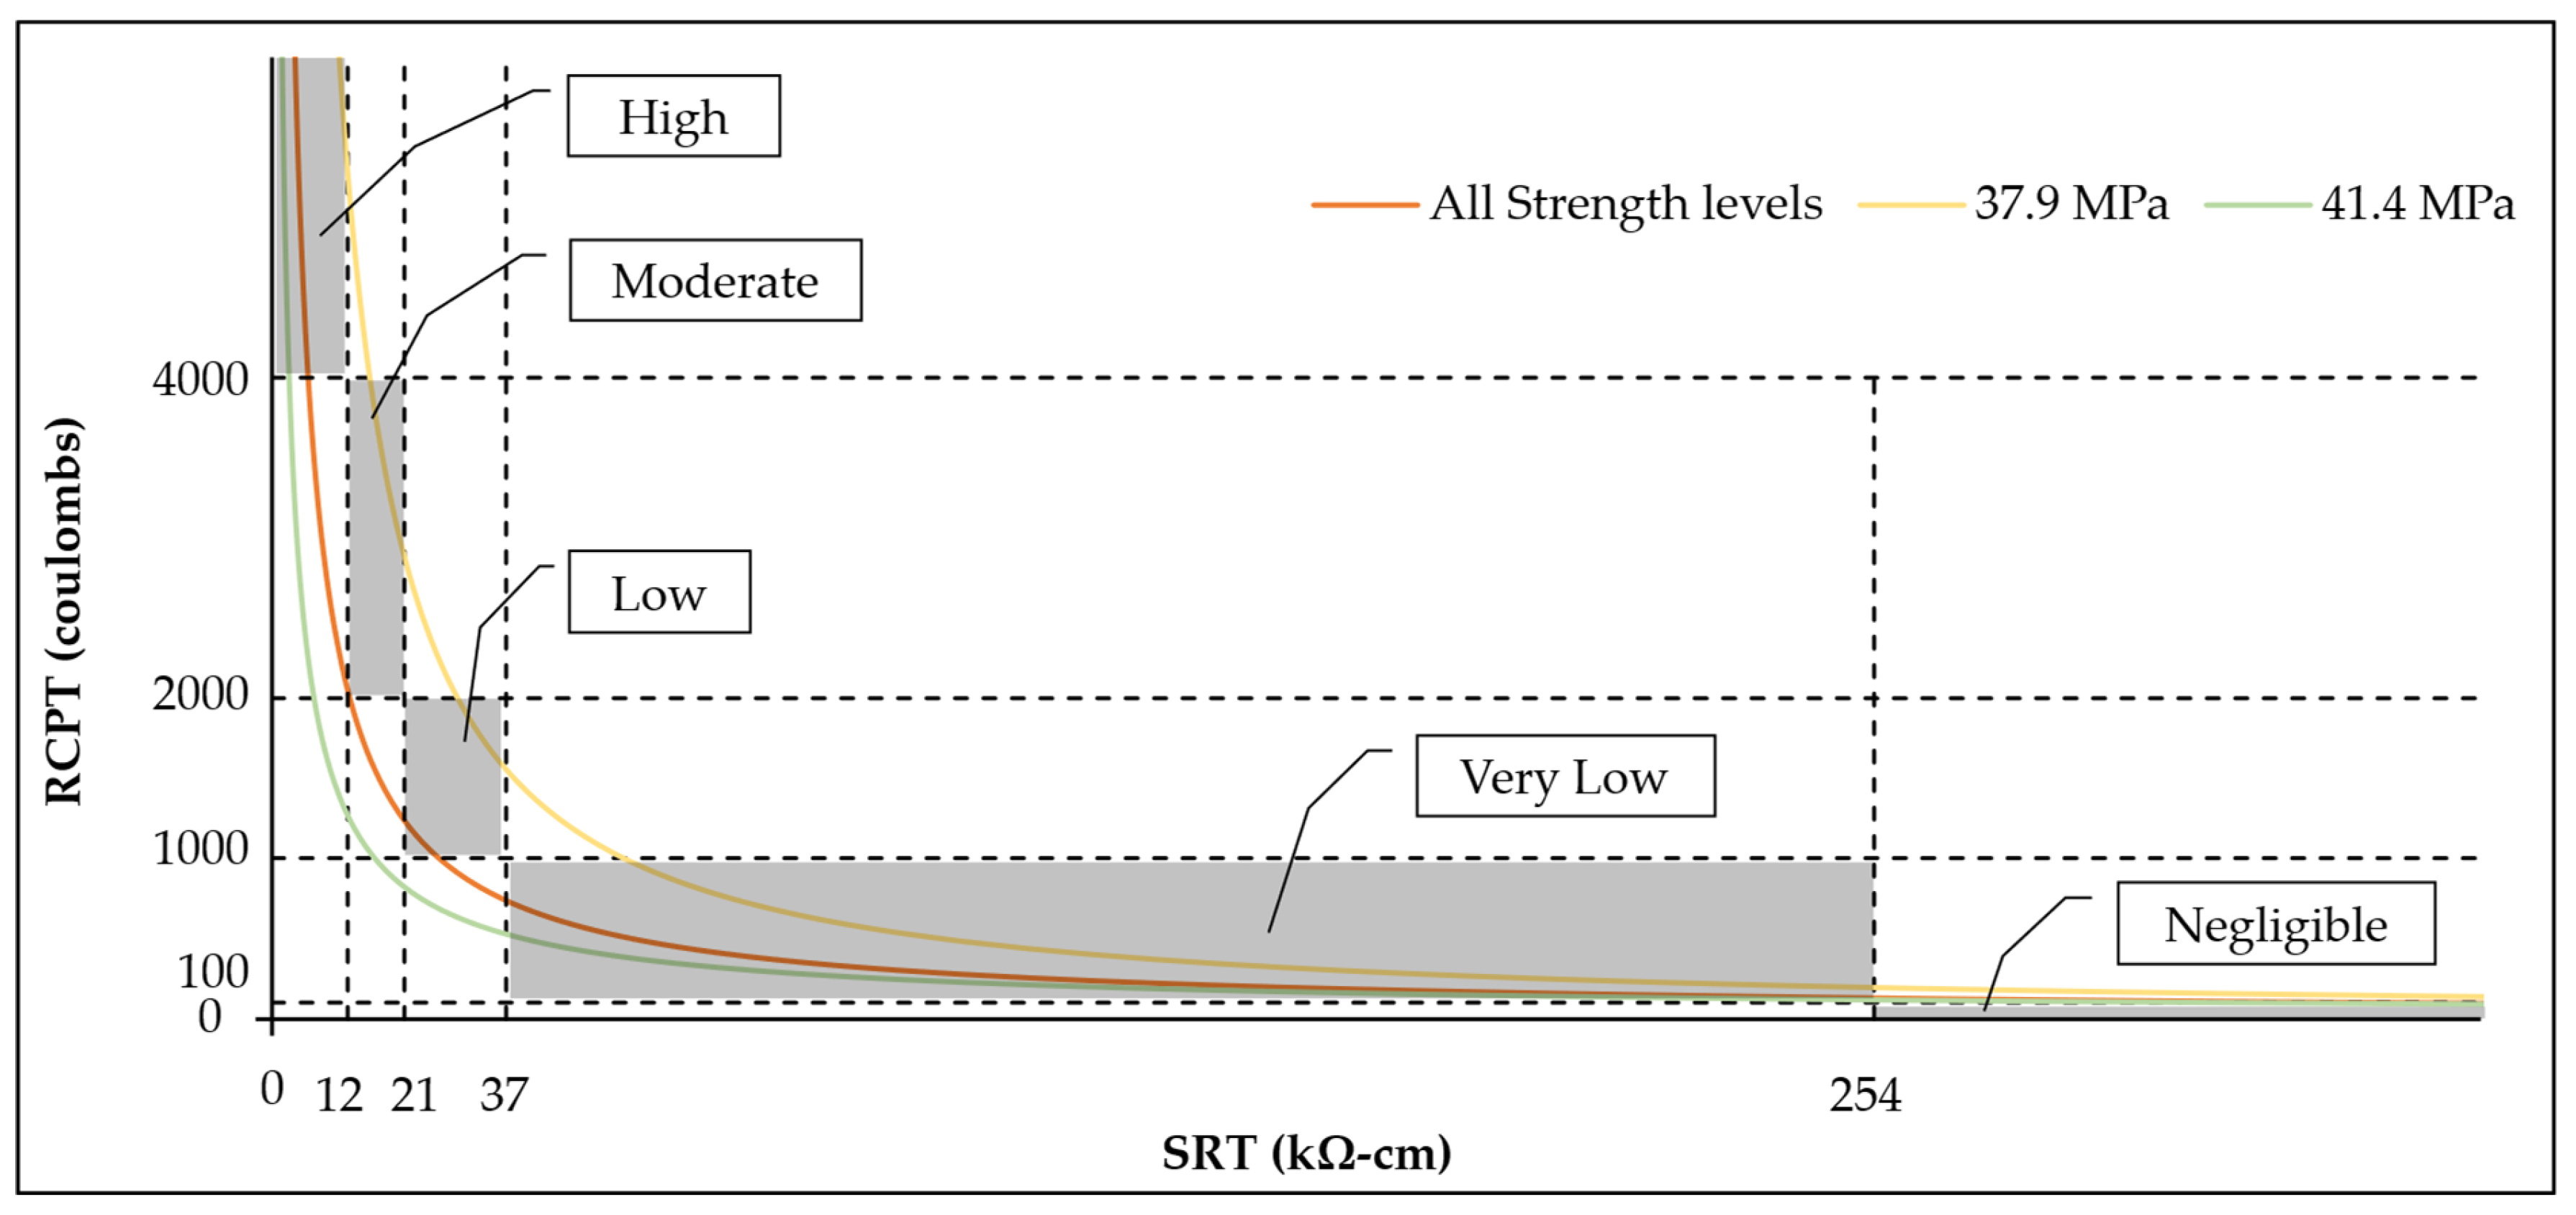
The regression equations listed in Table 3 are plotted in Figure 3, providing a comprehensive comparison of the RCPT and the SRT results.
A clear inverse correlation exists between RCPT and SRT values: as surface resistivity increases, the total charge passed in the RCPT decreases, indicating lower ionic transport and thus reduced permeability. This trend is consistent with the physics of ionic transport in concrete, where greater resistivity corresponds to reduced ion mobility and lower permeability. However, this relationship is inherently nonlinear, which is why power-law models have been used by researchers, primarily due to temperature-induced variability in the RCPT measurements [13,118].
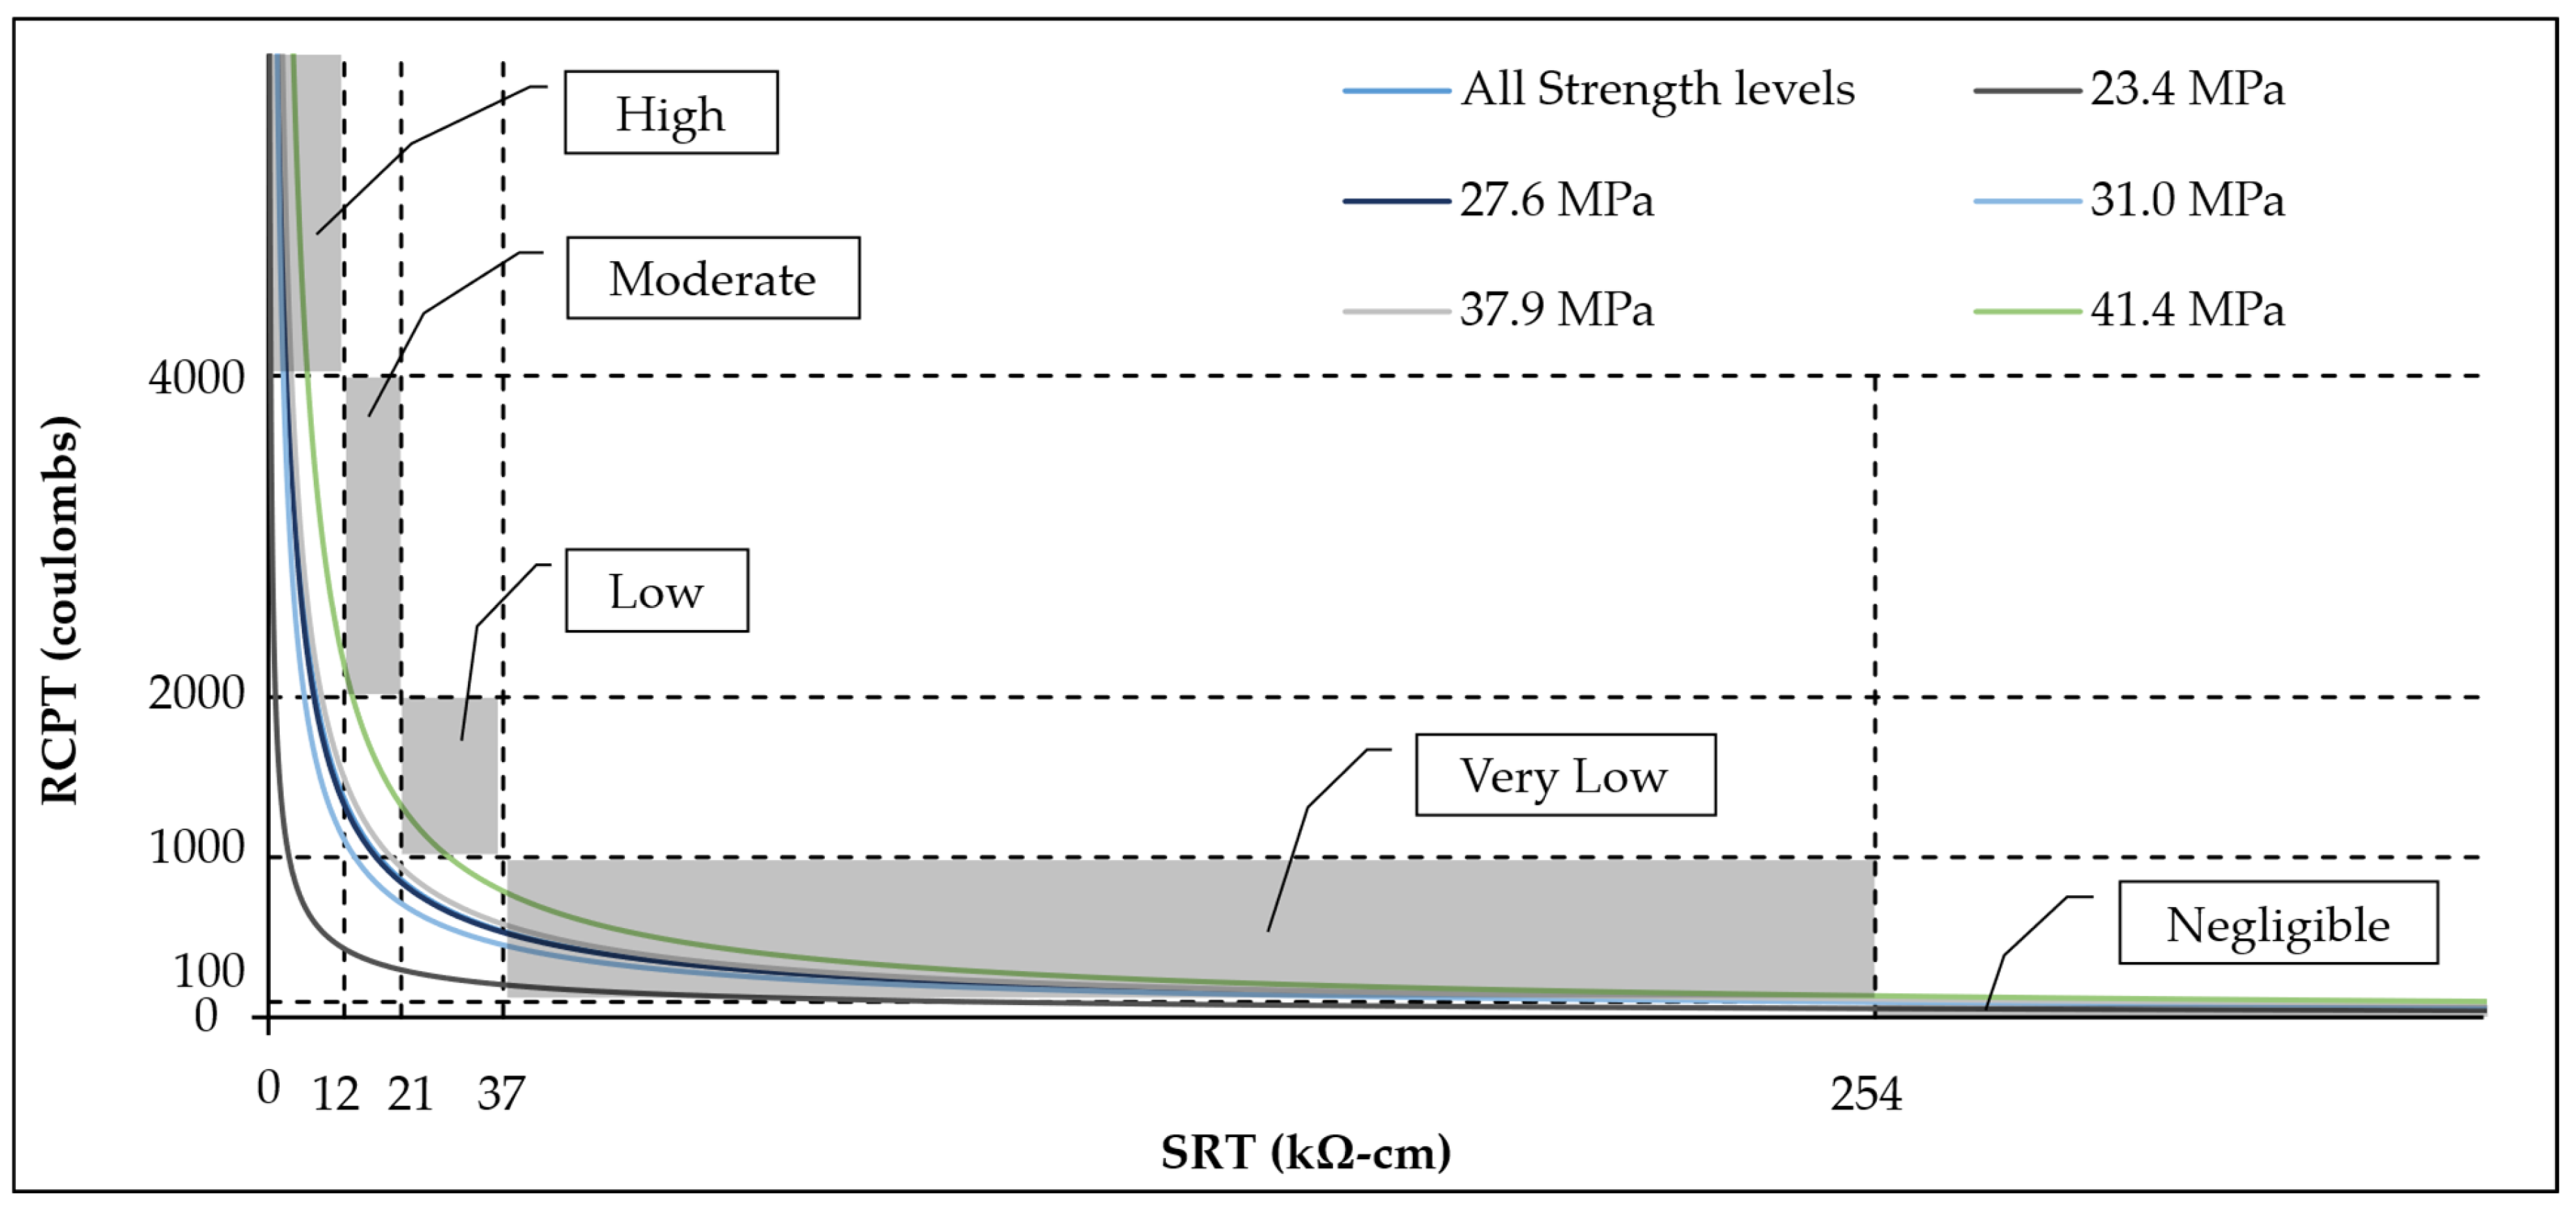
The shaded bands in Figure 3 represent the zones of “permeability classification agreement” where both test methods, the RCPT and the SRT, led to the same permeability classifications (e.g., negligible, very low, low, moderate, and high) as defined by ASTM C1202 [78] for the RCPT and AASHTO T 358 [98] for SRT. Ideally, a reliable predictive model should have the majority of RCPT-SRT curve fall within these zones. While many points on the curves do fall within the agreement zones, some points clearly lie outside the shaded area, revealing discrepancies in classification.
For instance, SRT values between 37 and 254 kΩ-cm are categorized as “very low” permeability by AASHTO T 358 [98], while the corresponding predicted RCPT values based on the proposed equations sometimes exceed 1000 coulombs, which ASTM C1202 [78] categorizes as ‘low’ permeability. Similarly, SRT values between 12 and 21 kΩ-cm (classified as “moderate” permeability per AASHTO T 358 [98]) sometimes corresponded to the predicted RCPT values between 1000 and 2000 coulombs, again pointing to “low” permeability according to ASTM C1202 [78].
These inconsistencies highlight the limitations of current empirical equations in reliably predicting RCPT values from SRT values. In some cases, these equations yield RCPT values that assign concrete to a different permeability category than that indicated by the corresponding SRT, resulting in misclassification through either overestimation or underestimation of concrete permeability. This issue shows that while the RCPT and the SRT may show strong numerical correlation (e.g., high R2 values), their alignment in terms of permeability classification is not always accurate. This lack of consistency can be attributed to several factors, including experimental differences (e.g., temperature rise during the RCPT), variations in concrete composition, SCM combinations, curing conditions, and the age at testing. For instance, some mixtures with resistivity values around 40 kΩ-cm, which typically can be considered very low resistivity, have shown unexpectedly high conductivity in the RCPT (charge passage exceeding 1000 coulombs). This outcome is contradictory, as high resistivity and high conductivity should not coexist, and is likely due to temperature-induced increases in conductivity during the RCPT.
Equation (9), proposed by Ramezanianpour et al. [118], stands out among the available predictive models for its ability to capture a significant portion of the RCPT-SRT curve within the shaded agreement zones, particularly across a broad range of SRT values. Additionally, this model tends to be slightly conservative, overestimating RCPT values for some SRT values, which minimizes the risk of underestimating permeability. This model was developed from a study covering a wide range of influential variables, including w/cm ratios (0.40 to 0.60), cement contents (250 to 515 kg/m3), SCMs (pumicite, tuff, three types of metakaolin, silica fume, nano-silica, and RHA), and testing ages to ensure broader applicability of the model. Based on this diverse dataset, the authors proposed the following inverse power-law equation with R2 = 0.90:
S R T = 67,998   ×   R C P T 1.028
However, to maintain consistency with the rest of this manuscript, Equation (9) will be rewritten to solve for the RCPT value based on the given SRT value. By rearranging Equation (9) to isolate the RCPT value, the modified version of the equation presented by Ramezanianpour et al. [118] can be expressed as:
R C P T = 50,219   ×   S R T 0.9728
Another important consideration is the variability in the two test methods. The RCPT tends to have greater standard deviations (SD) and coefficients of variation (COV), often exceeding 300 coulombs in SD and reaching up to 10% COV. However, the SRT shows much more consistent results, with SD typically less than 3 kΩ-cm and COV around 5.3% [100,101]. This lower variability of SRT makes SRT a more repeatable and efficient option, reducing the likelihood of outlier results.

4.2. Effects of Compressive Strength

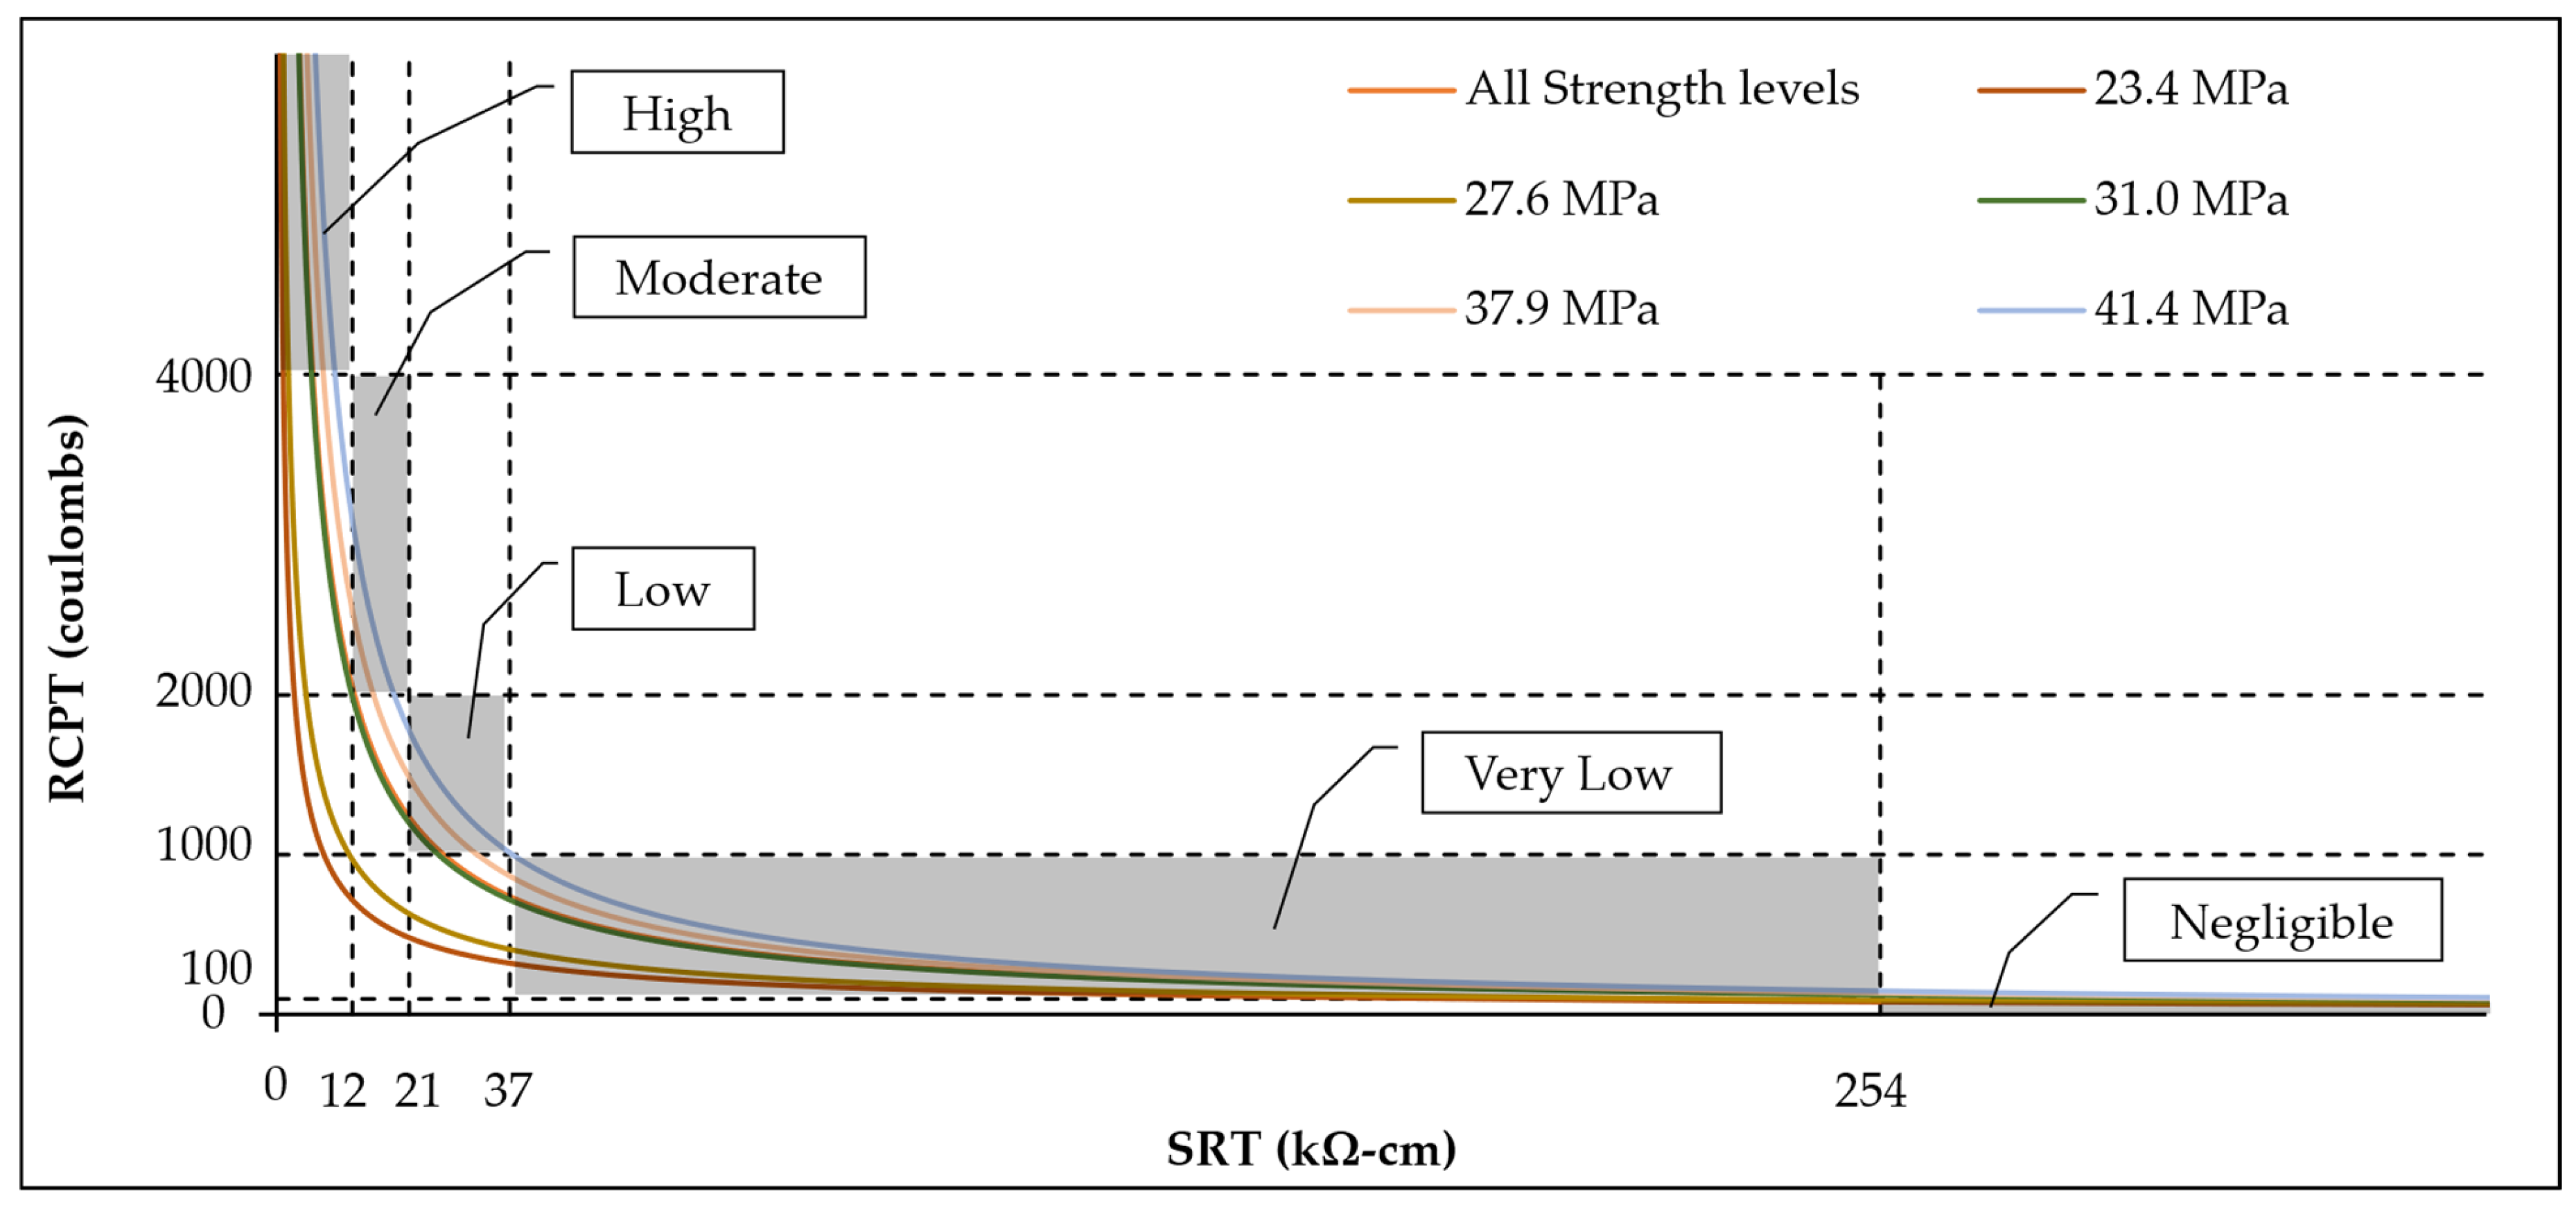
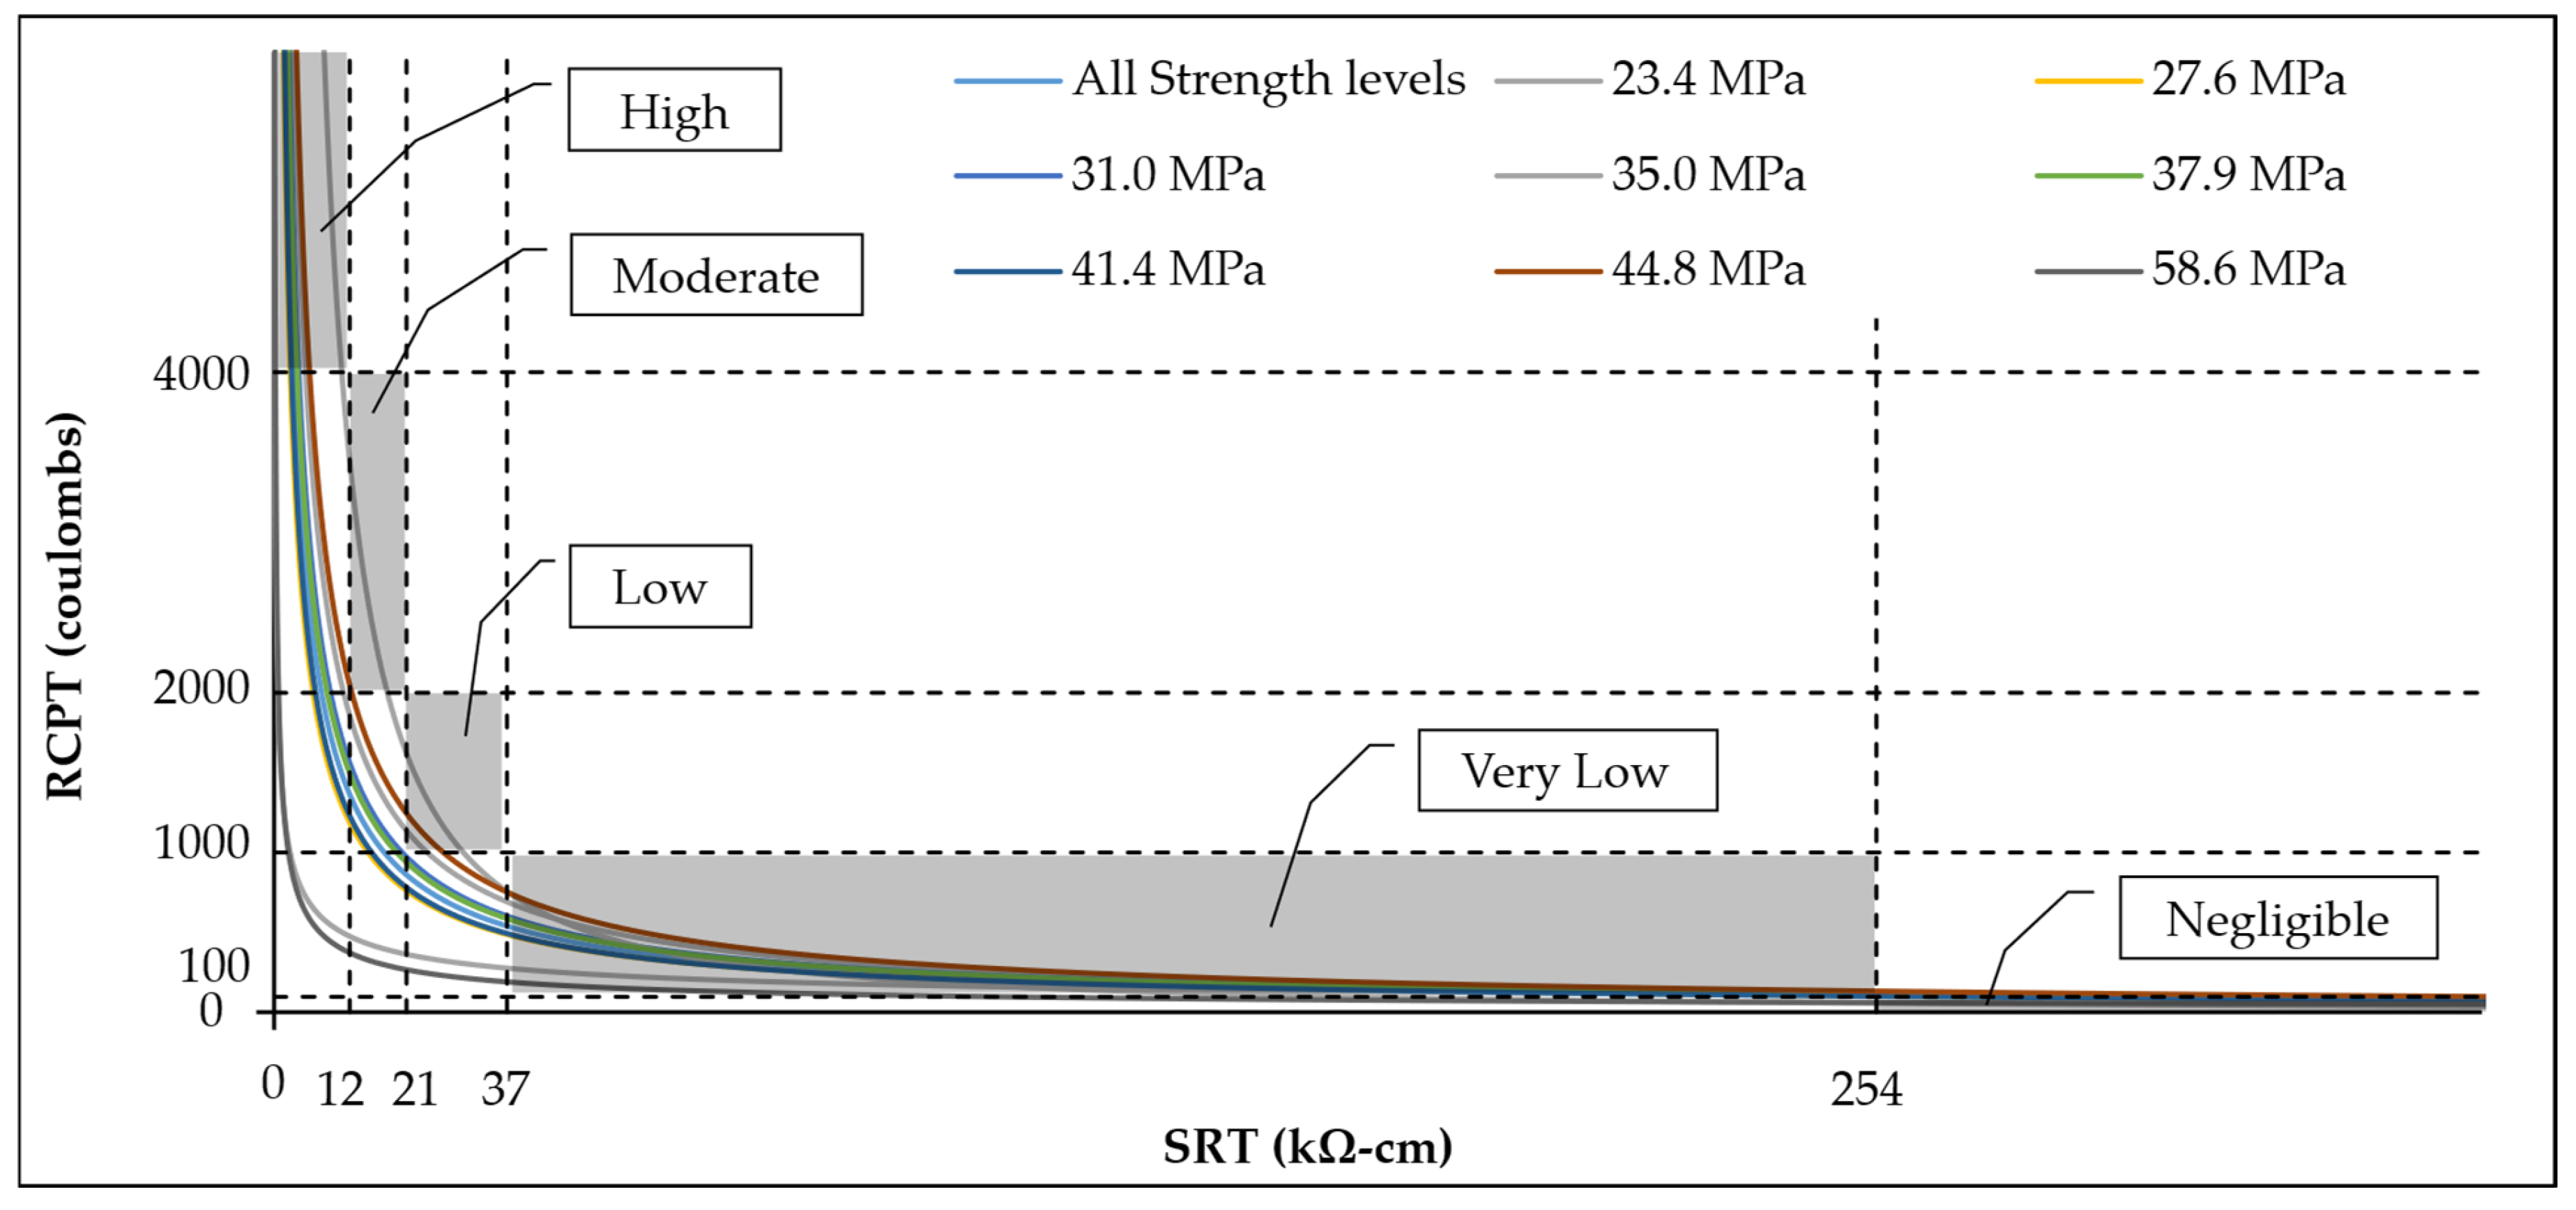
Researchers have also investigated the relationship between RCPT and SRT results for concrete mixtures with different compressive strengths [104,123,131]. Figure 4 and Figure 5 present a series of fitted equations that illustrate how compressive strength influences the relationship between surface resistivity and charge passed at different ages. The results indicate that while a general inverse power-law relationship exists between the RCPT and the SRT, the strength of the concrete mixture can affect this relationship. However, this effect is not consistent across ages, as is evident from a comparison of the RCPT-SRT curves, showing the significant influence of age on the relationship between the two tests.
A comparison of Figure 4 and Figure 5 reveals that, almost at all test ages and across all strength levels, a great portion of the RCPT-SRT curves falls within the shaded agreement zones for the “High” and “Very Low” permeability classes. However, a noticeable portion of the curves falls outside the shaded zones for the “Negligible,” “Low,” and “Moderate” permeability classes. This discrepancy is more pronounced in the 28-day tests, indicating that at early ages the two test methods do not consistently lead to the same permeability classifications for the “Negligible,” “Low,” and “Moderate” categories.
In the 28-day tests (Figure 4), the RCPT-SRT curve representing the 58.6-MPa concrete (green curve) shows a notable deviation from the RCPT–SRT curves observed from other strength levels. Specifically, this curve falls outside the “agreement zones,” in the low and moderate permeability ranges. This distinct behavior of high-strength concrete may be attributed to several microstructural factors in high-strength concrete mixtures: lower w/cm ratios, higher matrix density, and reduced internal moisture content. These factors may hinder ionic mobility and distort resistivity measurements, thereby affecting the charge-passed results and reducing the predictive reliability of surface resistivity as a stand-alone indicator of the charge passed for high-strength mixtures at early ages, especially in the low and moderate permeability zones. In contrast, the 37.9- and 44.8-MPa mixtures (blue and brown curves, respectively) show strong alignment with the RCPT–SRT curves observed from other strength levels, with a great proportion of the curve falling within the shaded “agreement zones.” This indicates that mid-strength concrete mixtures at 28 days tend to provide more consistent relationships between RCPT and SRT interpretations compared to their high strength counterparts.
At later ages (Figure 5), the correlation patterns shift, revealing that the relationship between the RCPT and the SRT can be influenced by age. In the 91-day tests, the lowest-strength mixtures, 23.4 and 27.6 MPa (purple taupe and teal curves, respectively), now show the greatest deviation from the RCPT–SRT curves observed from other strength levels. This contrasts with the earlier findings at 28 days, where the highest-strength mixtures (58.6 MPa) showed the greatest deviation. This shift highlights the influence of prolonged hydration and microstructural development, which affects ion transport differently across strength levels.
Despite this shift, the 37.9- and 44.8-MPa mixtures (blue and dark red curves, respectively) continue to show RCPT-SRT curves that fall well within the shaded agreement zones in both Figure 4 and Figure 5. This underscores the robustness of SRT for predicting the RCPT-based classifications for concrete mixtures in the mid-strength range and maturity level.
Overall, although no single RCPT-SRT curve dominates across all strength levels and test ages, a few key patterns emerge. Mid-strength concrete mixtures (e.g., 37.9 and 44.8 MPa) tend to yield RCPT results that correspond well with permeability levels based on SRT results. However, high-strength concrete mixtures (e.g., 58.6 MPa) show a significant deviation at early ages, but later age testing tends to bring a greater portion of the RCPT-SRT curve within the shaded agreement zones across most mixtures. These findings underscore the importance of accounting for both compressive strength and specimen age when using SRT to estimate the RCPT values and evaluate chloride ion penetrability. The specific effects of age will be discussed in greater detail in the following section.

4.3. Effects of Age

Specimen age is a critical factor influencing the relationship between RCPT and SRT results. As concrete cures and matures under suitable temperature and humidity conditions, ongoing hydration and additional pozzolanic activity in mixtures with SCMs lead to a denser microstructure, refined pore structure, and reduced pore connectivity [131,135]. These microstructural changes directly affect ionic transport, which is central to both RCPT and SRT measurements. Therefore, the longer concrete is allowed to cure, the more consistent and accurate the relationship between the RCPT and the SRT becomes, as the concrete permeability stabilizes with age. Extended curing results in more stable permeability characteristics, which are essential for reliable comparison between these tests.
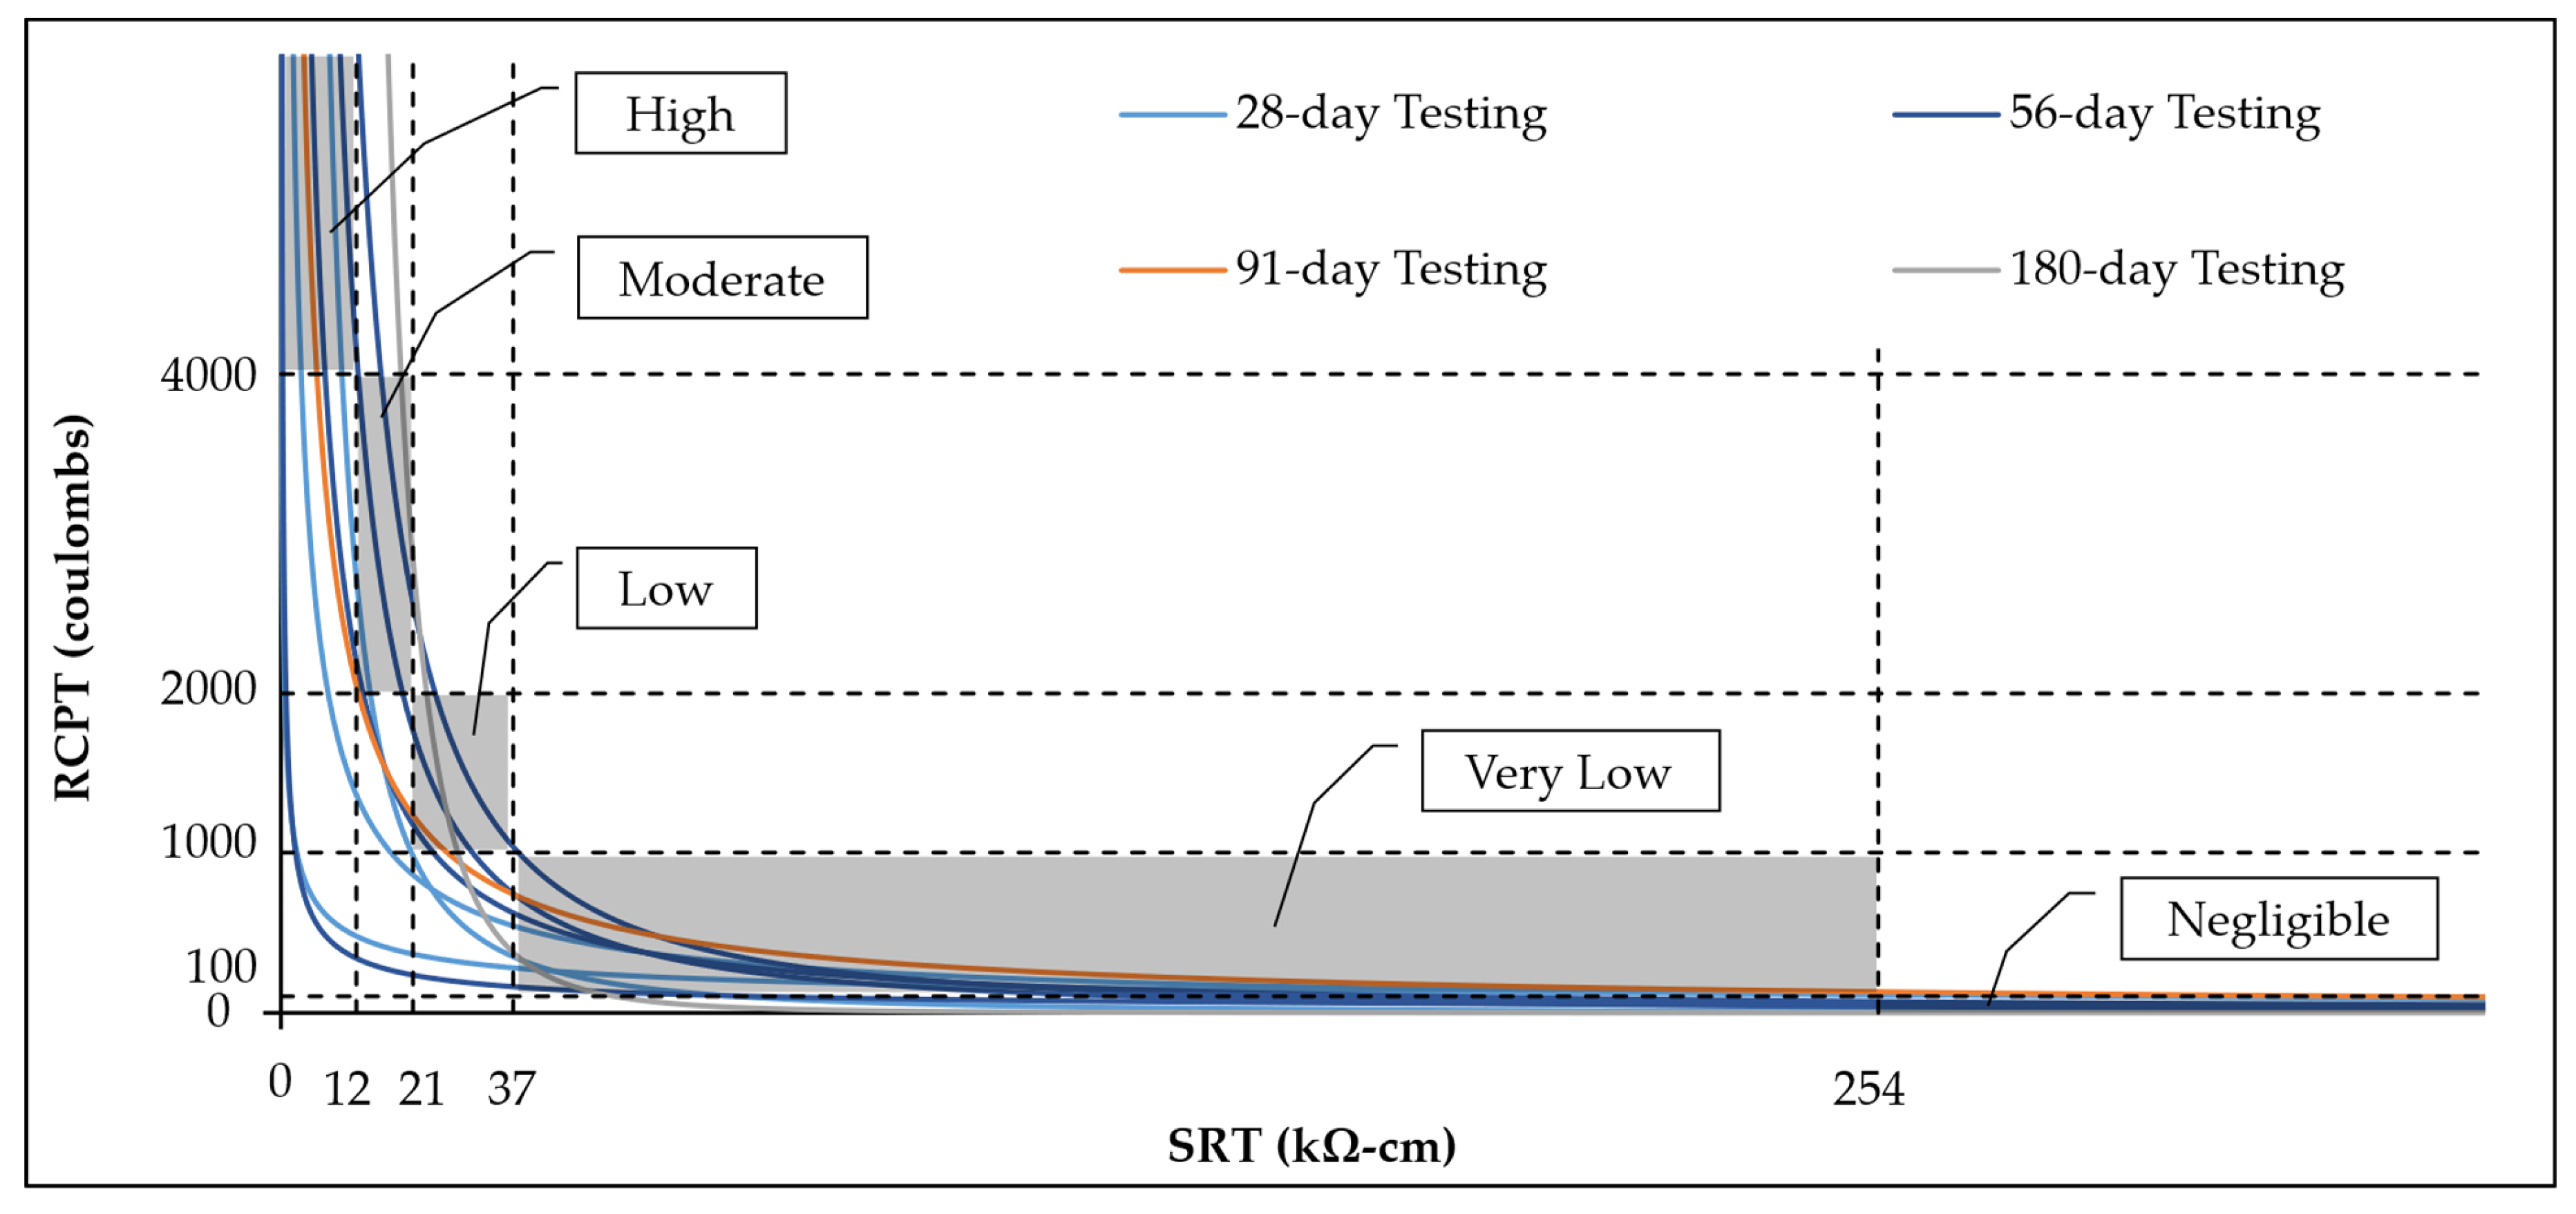
Figure 4 and Figure 5 demonstrate the effects of age on RCPT-SRT relationships for different compressive strength levels. A clear pattern emerges: a greater portion of the RCPT-SRT curves fall within the shaded agreement zones at later ages than at 28 days. This suggests that surface resistivity better reflects chloride permeability classifications determined by the RCPT at later ages, when concrete has undergone more complete hydration. Several researchers [110,111,123,131,132,133,134] also evaluated the RCPT–SRT relationship at different ages (Figure 6). Their results show that a greater portion of the RCPT-SRT curve falls within the agreement zones at the 91-day testing age compared to the 28-day tests. This aligns with the general understanding that the RCPT–SRT relationship becomes more reliable with testing age and highlights that specimen maturity significantly affects how well the two tests yield the same permeability classifications.
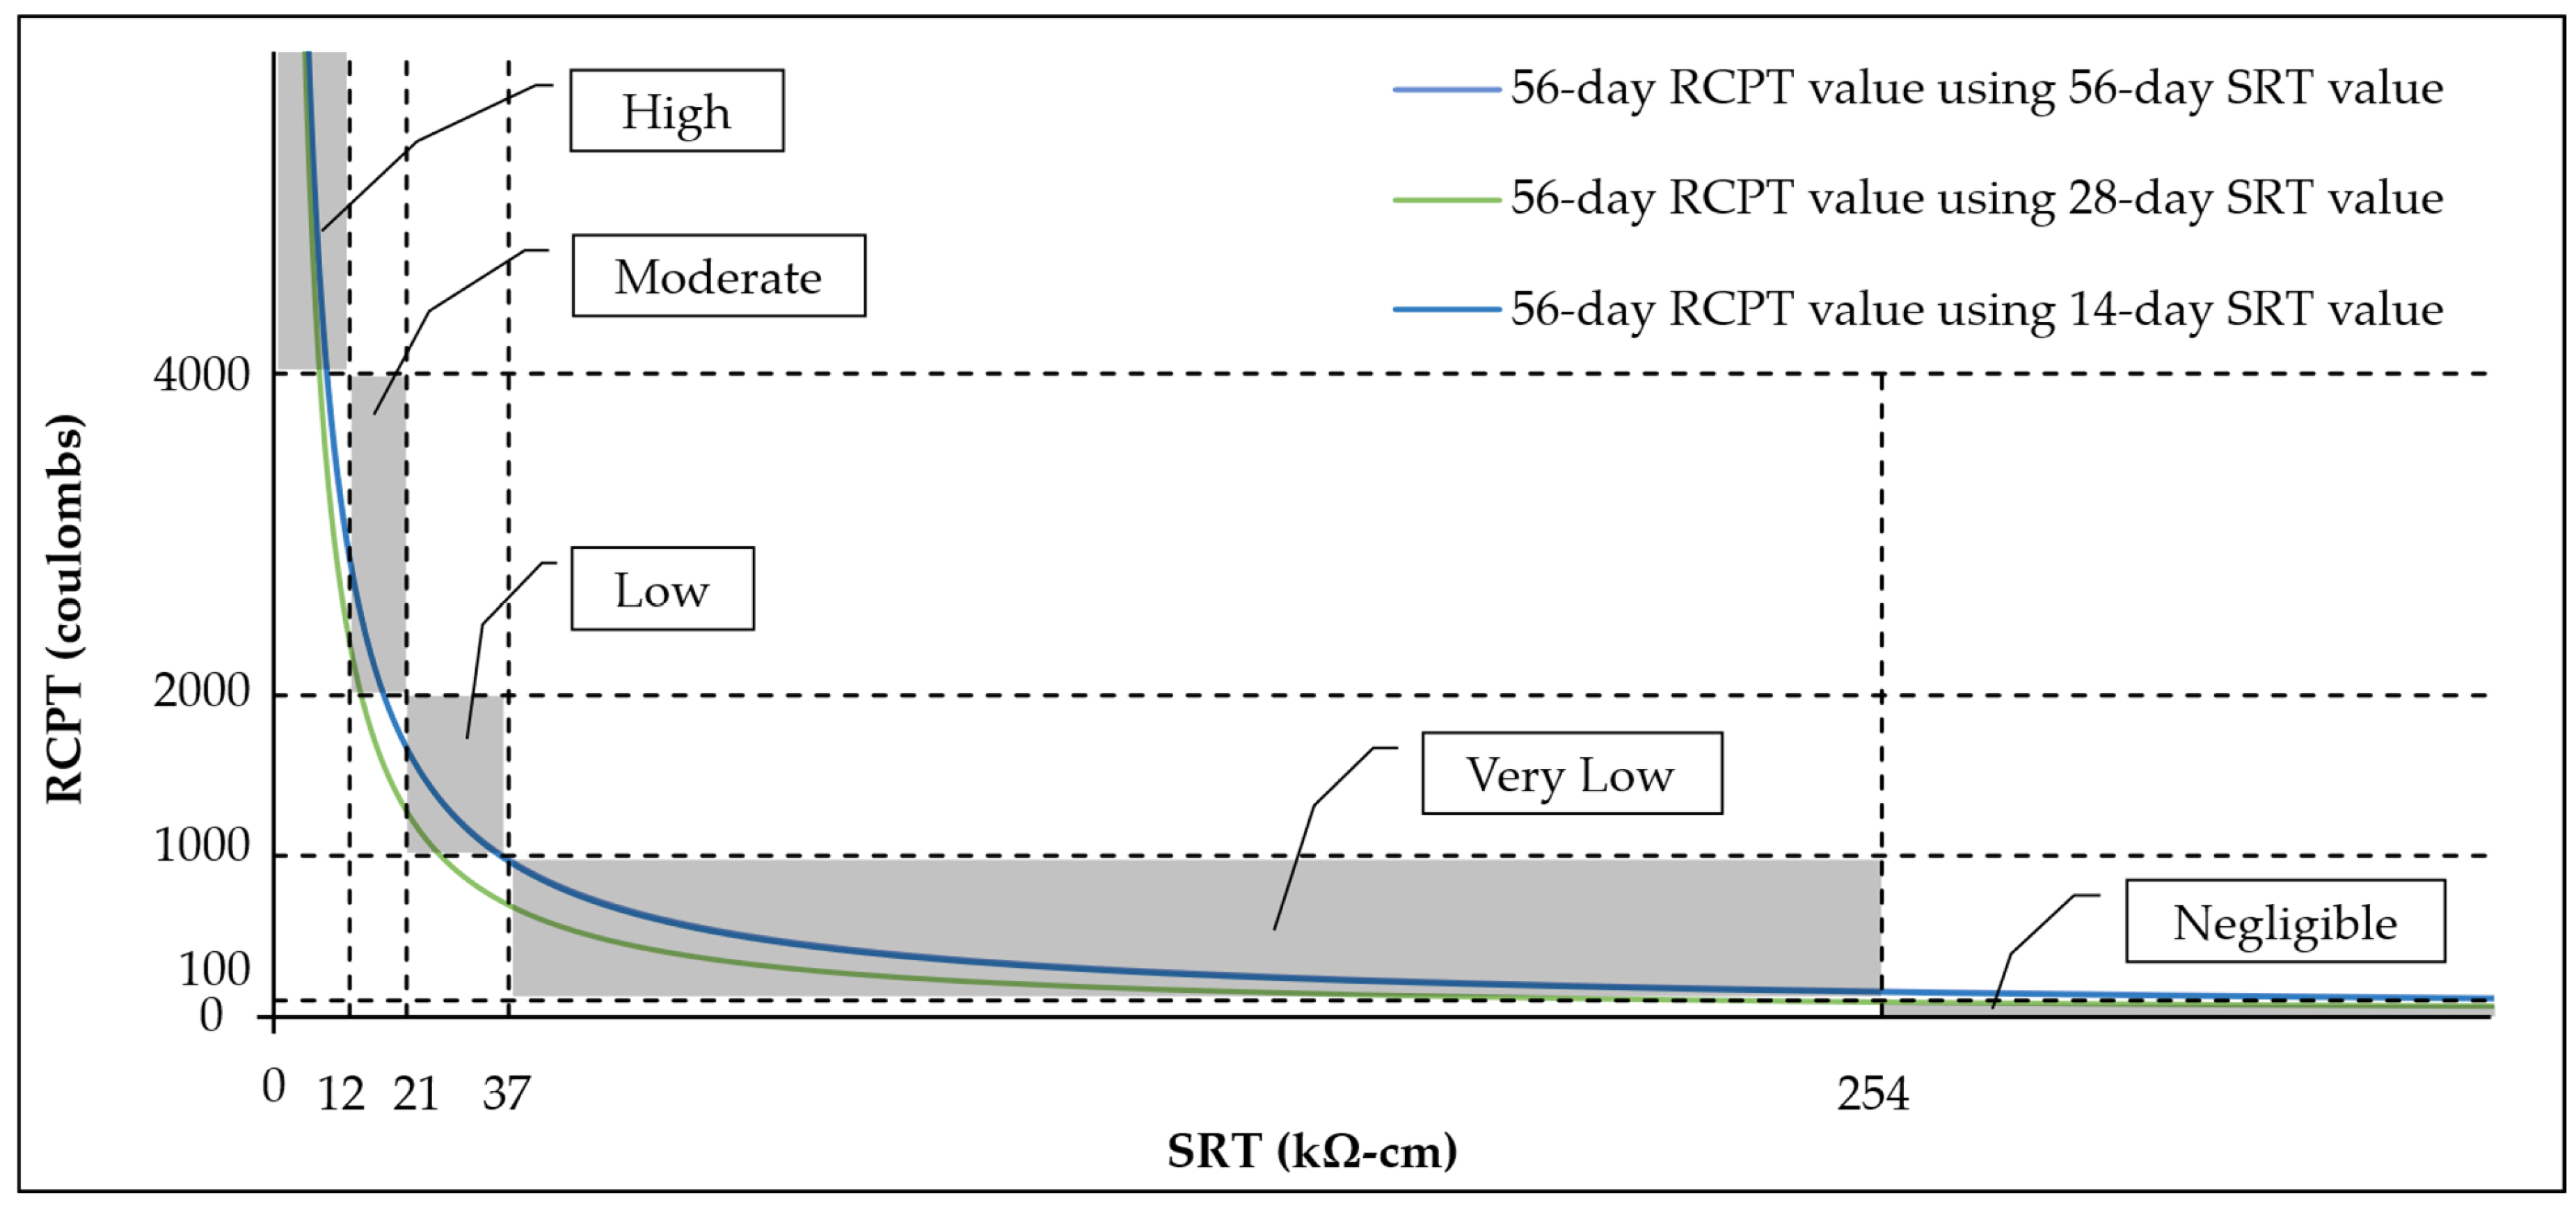
In addition to same-age comparisons, researchers have explored whether SRT results obtained at early ages (14 and 28 days) can be used to predict later-age (56-day) RCPT values. One study [103] investigated this by establishing mathematical relationships between RCPT results at 56 days and SRT results at 56, 28, and 14 days. These relationships were described using inverse power-law equations:
R C P T = 29,647   ×   S R T 0.944   ( R 2 = 0.89 )
R C P T = 33,534   ×   S R T 1.074   ( R 2 = 0.87 )
R C P T = 31,242   ×   S R T 0.962   ( R 2 = 0.80 )
Equations (11)–(13) provide predictive models for estimating 56-day RCPT values using SRT measurements taken at 56, 28, and 14 days, respectively. The corresponding regression curves are presented in Figure 7. Interestingly, the curves based on 56-day and 14-day SRT data (Equations (11) and (13)) are nearly identical and fall closely within the shaded agreement zones, indicating that 14-day SRT measurements can predict 56-day RCPT values with accuracy comparable to same-age (56-day) SRT data. In contrast, the curve from Equation (12), which uses the 28-day SRT value to predict the 56-day RCPT value, shows a greater portion of the RCPT-SRT curve falling outside the agreement zones. This indicates that 28-day SRT measurements may be less reliable than both 14-day and 56-day SRT data for predicting 56-day RCPT values. This reduced reliability may be attributed to transitional changes in the concrete’s pore structure or inherent variability in test data at that intermediate stage. Therefore, based on this study, using 14-day SRT data to estimate 56-day RCPT values is not only time-efficient (requiring shorter curing periods), but may also produce predictions that align more closely with the agreement zones than those based on 28-day data.
The R2 for Equation (13), which uses 14-day SRT data, is 10.1% less than that of Equation (11), which uses 56-day data. This indicates that although 14-day SRT measurements can effectively estimate 56-day RCPT values in terms of matching permeability classifications, a slight reduction in correlation is observed when using earlier-age SRT data. These findings suggest that while same-age testing (i.e., conducting both RCPT and SRT at 56 days) yields the strongest correlation (greatest R2), 14-day SRT measurements can still provide reasonably reliable predictions of 56-day RCPT results, with only minor reductions in predictive power. Consequently, based on this study, early-age SRT may represent a time- and cost-efficient option for preliminary durability assessments, especially when supported by validated predictive models.
In summary, the relationship between the RCPT and the SRT is strongly age-dependent. As concrete matures, it develops more stable microstructural properties and reduced permeability, which enhance the alignment between surface resistivity and charge-passed results. These findings highlight the importance of accounting for both concrete age and compressive strength when interpreting the RCPT-SRT relationships, and they support the feasibility of time-efficient durability evaluations using early-age SRT, particularly when backed by validated prediction models.

4.4. Effects of w/cm Ratio

Although no studies have explicitly investigated how w/cm ratio affects the relationship between RCPT and SRT results, studies have demonstrated that variations in w/cm ratio significantly influence the individual outcomes of both tests. Specifically, reducing the w/cm ratio leads to a denser and less porous cement paste microstructure, which reduces ionic mobility. This change is consistently captured by both RCPT and SRT: lower w/cm ratios result in lower total charge passed in the RCPT and greater surface resistivity in the SRT, both indicating decreased permeability [103,124].
This behavior is attributed to the reduction in capillary pores and improved matrix densification that occur as the w/cm ratio decreases. Since both RCPT and SRT are sensitive to changes in the connectivity and size of pores, they effectively track this densification and reflect similar permeability variations. Thus, while the relationship between the RCPT and the SRT results has not been formally mapped against w/cm ratio variations, their mutual response to decreasing w/cm suggests that they are aligned in capturing permeability reductions associated with more compact microstructures. Studies on concrete mixtures with a fixed w/cm ratio but varying cement content showed that mixtures with lower cement content had lower permeability in both RCPT and SRT. Although the w/cm ratio remained constant, the reduction in cement content effectively increased the concrete solid-to-volume ratio, resulting in more resistive (i.e., less conductive) mixtures. This finding highlights how permeability is influenced not only by the w/cm ratio directly but also by the paste composition and volume, which can also be influenced by w/cm ratio [124].
When silica fume was used to replace part of the cement at a constant w/cm ratio, both RCPT and SRT consistently detected a reduction in permeability. The pozzolanic reaction of silica fume contributes to pore refinement and further decreases ionic transport, demonstrating that even at a fixed w/cm ratio, the effectiveness of the binder system (and the resulting microstructure) plays a key role, again, one that both tests capture similarly [124].
In summary, while no research has directly analyzed the influence of w/cm ratio on the RCPT–SRT relationship, both tests are similarly responsive to permeability changes driven by reductions in w/cm ratio. Their consistent performance across various mixture proportions, including those with modified binder content or SCMs, supports the conclusion that the RCPT and the SRT can comparably reflect the influence of w/cm ratio on concrete durability.

4.5. Effects of Fly Ash

Fly ash, a byproduct of coal combustion in power plants, has been one of the most widely used SCMs in concrete since the 1930s. Several studies have shown that incorporating an optimized amount of fly ash into concrete generally results in reduced permeability [111,136,137,138,139,140,141,142]. This improvement in impermeability can be attributed to two primary mechanisms: (a) the filler and ball-bearing effect that results from the spherical shape and fine particle size of fly ash, which help refine the pore structure and improve the packing density of the cement paste and (b) the pozzolanic reaction where fly ash reacts with CH produced during cement hydration and forms additional CSH gels at later ages. These secondary gels fill capillary pores and densify the microstructure, blocking the pathways for water and ion penetration [136,143]. However, some studies have noted that when fly ash is used in high amounts, typically exceeding 30% of cement replacement by mass, it may have a negative impact on concrete permeability [136,140,141]. This may result from the large number of fine fly ash particles introduced into the mixture, which can disrupt particle packing density. Additionally, reduced early-age strength and delayed pozzolanic activity may hinder complete pore refinement in some cases, further increasing permeability.
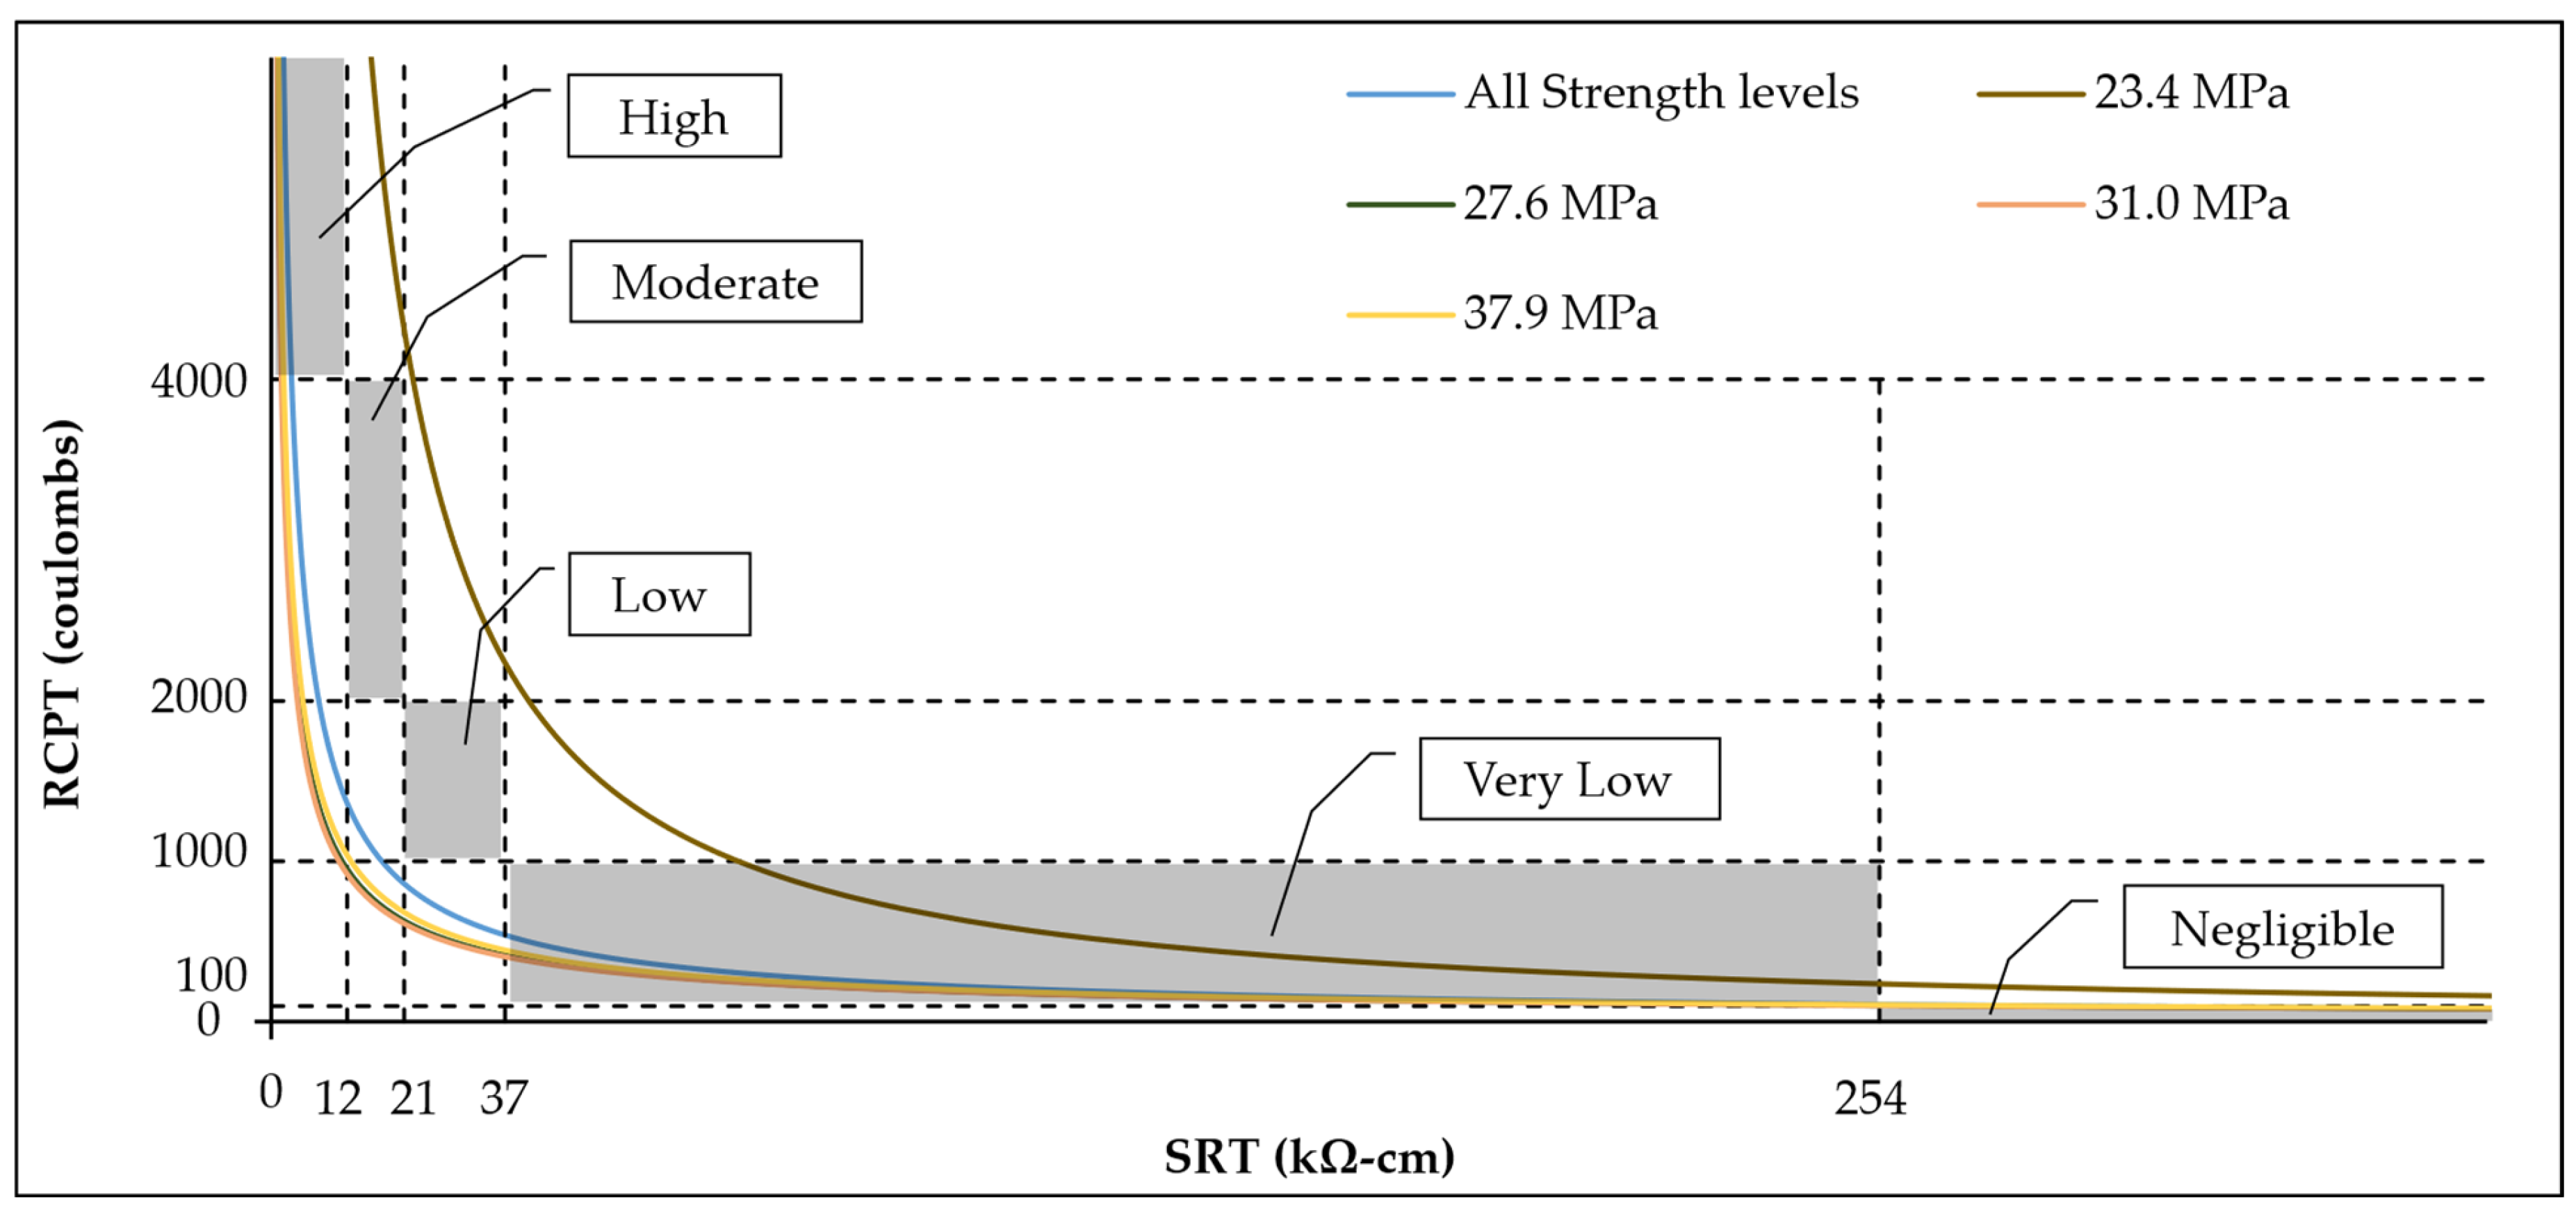
Various researchers have proposed empirical equations to describe the relationship between RCPT and SRT results in concrete mixtures containing fly ash and to evaluate how fly ash content influences this relationship [104,123,125]. Generally, while some SRT results may be slightly more conservative than RCPT results (especially in borderline cases), both methods tend to assign the same permeability class, particularly for concrete falling into the very low and high permeability categories [104]. Additionally, Bagheri et al. [126] and Dhandapani et al. [127] further confirmed that electrical resistivity tests (conducted per the Swedish National Testing and Research Institute method [144]) showed strong correlation with RCPT results (per ASTM C1202 [78]) in capturing changes in permeability as the fly ash content in concrete mixtures was varied. Figure 8 and Figure 9 illustrate the observed relationships between the RCPT and the SRT for fly ash concrete mixtures across different compressive strength levels, tested at both 28 and 91 days, respectively [123].
As discussed in Section 4.3, the age of the specimen significantly influences the RCPT–SRT relationship. The inclusion of fly ash does not alter this age dependency and mixtures with fly ash followed the same trend of improved alignment with the agreement zones at later ages. Specifically, the RCPT–SRT curve were more frequently found within the shaded agreement zones at 91 days compared to 28 days in fly ash mixtures. This improvement can be attributed to the ongoing pozzolanic reactivity of fly ash and the resulting microstructural refinement and stabilization over time [123].
Compressive strength levels also impacted the relationship between RCPT results and SRT results in both age groups. The lowest compressive strength level (23.4 MPa) showed markedly different behavior, while the greatest strength level (41.4 MPa) had the greatest portion of the RCPT-SRT curve within the shaded agreement zones. This trend is consistent with previous observations in Section 4.2, where mixtures with compressive strengths of 37.9 and 44.8 MPa showed good alignment with the agreement zones at both ages. Furthermore, the improvement in this alignment with increasing compressive strength followed the same order across both test ages, with alignment steadily improved as compressive strength increased from 23.4 to 41.4 MPa. This suggests that the effect of compressive strength on the RCPT–SRT relationship is independent of specimen age, even in concrete mixtures containing fly ash.
Gilan et al. [128] further demonstrated the reliability of SRT for evaluating the permeability of fly ash concrete mixtures by employing a hybrid machine learning approach (support vector regression combined with particle swarm optimization). Their predictive model successfully estimated RCPT values for concrete mixtures containing fly ash with high accuracy and robustness, confirming the potential of SRT as a reliable alternative for permeability assessment in such mixtures. Among the various empirical models developed to correlate RCPT and SRT results, one of the most reliable is the equation proposed by Tanesi and Ardani [104], which achieved a high R2 of 0.92. This strong correlation suggests that SRT can effectively predict the permeability of concrete mixtures containing fly ash. Equation (14) presents this relationship:
R C P T = 98,441   ×   S R T 1.35
Despite the strong correlation observed in several studies, some researchers have cautioned against the exclusive use of SRT for permeability classification in concrete mixtures with SCMs, such as fly ash. For instance, Thomas et al. [85] found that while RCPT results for fly ash mixtures closely matched diffusion coefficients obtained from the salt ponding test, which is a more direct measure of chloride ingress, SRT tended to underestimate permeability in comparison. They highlighted that the electrical resistivity of concrete is highly sensitive to the type of binder used, meaning that standard permeability classifications based on resistivity may not always be accurate across different binder systems. Therefore, they recommended that the permeability classification thresholds for SRT be revised and tailored to account for variations in binder composition, particularly in concrete mixtures containing fly ash, to improve the reliability and consistency of surface-resistivity-based evaluations.

4.6. Effects of GGBFS

GGBFS, which is a by-product of iron production during ore extraction in a blast-furnace, has long been used as a SCM in concrete to improve its durability and long-term performance. Due to its cementitious nature, GGBFS has been considered a viable alternative to cement, fly ash, and silica fume in concrete mixtures, particularly for enhancing durability properties [110,145]. However, due to its distinct chemical composition and slower reactivity, GGBFS typically requires greater cement replacement levels than fly ash to achieve comparable durability improvements. Research suggests that at least 50% cement replacement is often necessary to realize the full durability benefits of GGBFS in concrete mixtures [146].
Despite its slow reaction rate, which necessitates extended curing, GGBFS offers considerable long-term benefits. Studies using scanning electron microscopy and energy dispersive spectroscopy have shown that GGBFS particles are more angular than those of portland cement and incorporating it into concrete improves particle packing and bonding, resulting in a denser microstructure [147]. These changes promote the formation of CSH and calcium aluminate silicate hydrate, which fill capillary pores and block ion pathways, leading to reduced permeability and increased strength [148]. While moderate replacement levels (up to 20–30%) have been found to improve both workability and strength, higher dosages may delay early-age strength gain and increase susceptibility to surface scaling if not adequately cured. However, when used appropriately, GGBFS significantly improves concrete’s resistance to chloride ion penetration and contributes to a more refined pore structure, supporting its effectiveness as a durable SCM [147,149,150,151,152,153].
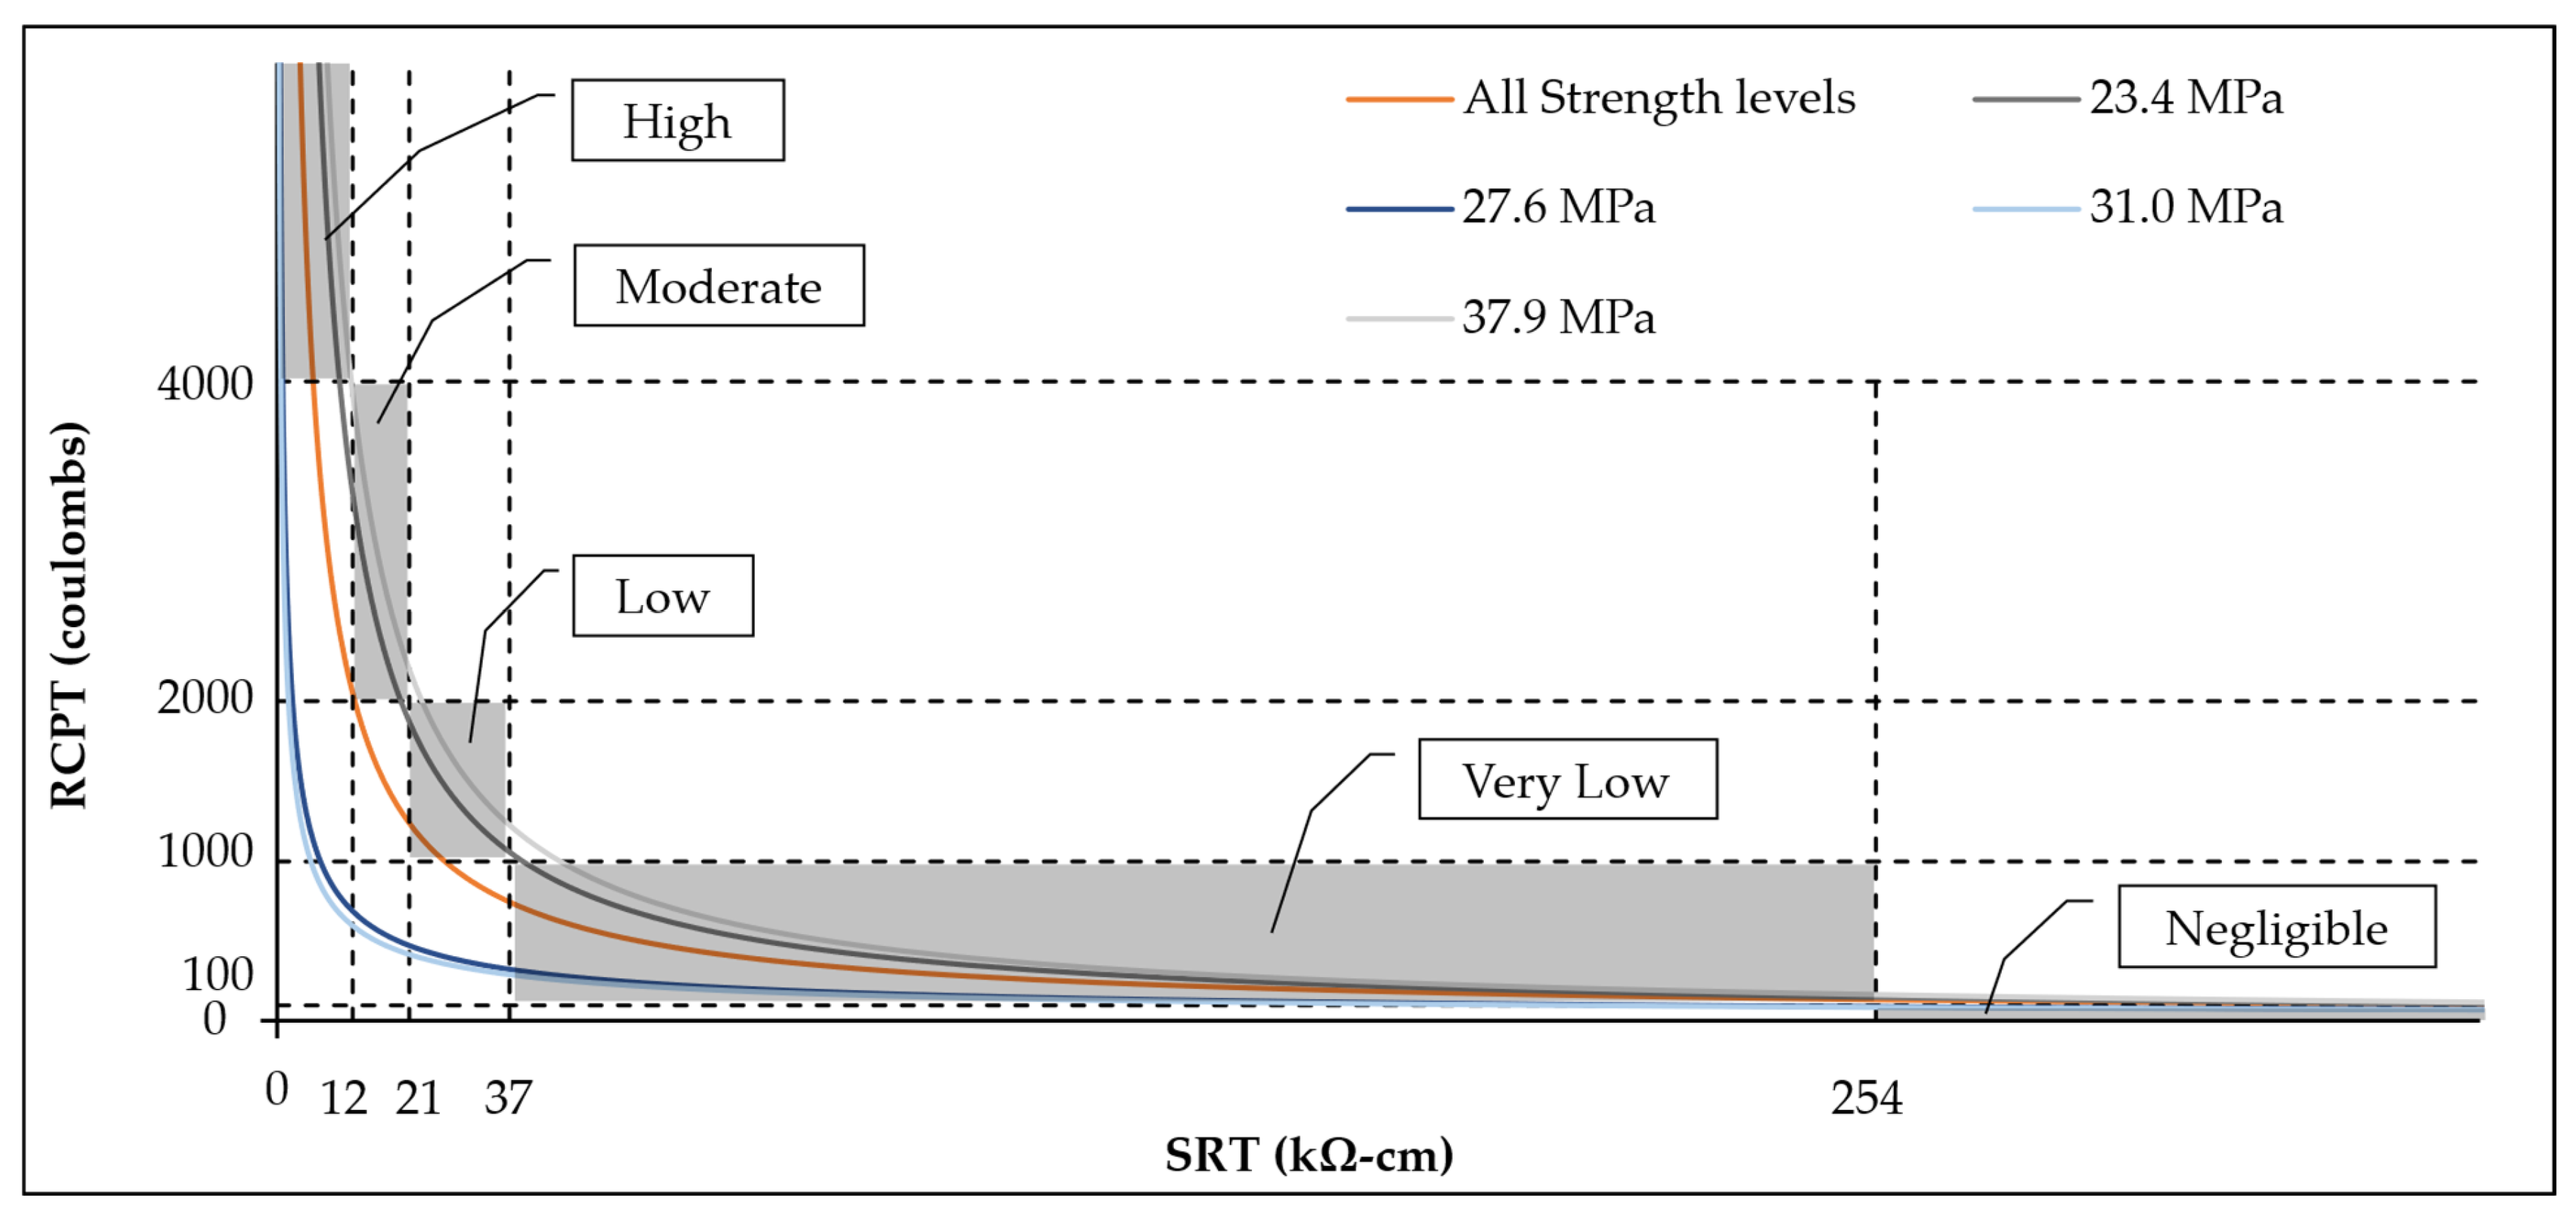
The relationship between RCPT and SRT results in GGBFS mixtures has attracted increasing research attention due to the complex electrochemical and microstructural behavior introduced by this SCM. As shown in Figure 10 and Figure 11, Chini et al. [123] proposed empirical models to relate RCPT and SRT values across concrete mixtures with varying compressive strengths. Similar to observations in fly ash mixtures, GGBFS mixtures also showed a greater portion of the RCPT–SRT curves within the shaded agreement zones at 91 days compared to 28 days. This enhancement is attributed to the delayed pozzolanic and latent hydraulic reactivity of GGBFS, which becomes more pronounced over extended curing durations, leading to a denser pore structure and higher electrical resistivity [67,123].
However, a different trend was observed when analyzing the influence of compressive strength on the RCPT–SRT relationship in GGBFS-containing mixtures compared to fly ash mixtures. Specifically, in GGBFS mixtures, the RCPT–SRT curve corresponding to the lowest compressive strength (23.4 MPa) at 91 days showed the closest alignment with the shaded agreement zones. In contrast, fly ash mixtures had the best alignment from the highest strength mixtures. This contrasting behavior indicates that the influence of compressive strength on the RCPT–SRT relationship is not universally consistent across all SCMs. Instead, it appears to be significantly influenced by the specific binder chemistry, hydration kinetics, and the time-dependent development of the microstructure, particularly the formation and distribution of resistive phases such as CSH and secondary reactions.
When evaluating the RCPT–SRT relationship across various compressive strength levels at both 28 and 91 days for GGBFS mixtures, no clear or consistent trend was observed. This suggests that the relationship between compressive strength and electrical resistivity is more complex in GGBFS-containing concrete mixtures and may be strongly influenced by specimen age. The prolonged hydration and latent pozzolanic activity of GGBFS, combined with its sensitivity to curing conditions, likely contribute to nonlinear microstructural evolution over time. These factors may disrupt the expected relationship patterns by altering pore connectivity and ionic mobility at different strength levels and ages.
Although the overall relationship between RCPT and SRT results for GGBFS-containing concrete mixtures is generally acceptable, some studies have identified discrepancies in permeability classification, particularly for 28-day specimens falling into “low,” “moderate,” and “high” chloride ion permeability ranges based on SRT measurements. Similar to findings for fly ash mixtures, surface resistivity tests for GGBFS mixtures have been shown to either underestimate or overestimate permeability classifications when compared to RCPT results, especially at early ages [85,123].
Chini et al. [123] and Thomas et al. [85] observed that SRT-based classifications frequently diverged from those based on the RCPT and were often not aligned with diffusion coefficients obtained from the salt ponding test, a more direct measure of chloride transport. For example, Chini et al. [123] demonstrated that for 28-day specimens incorporating GGBFS with a compressive strength of 23.4 MPa, SRT results tended to overestimate the resistance to chloride ion penetration relative to the RCPT, indicating a possible misrepresentation of actual permeability performance (Figure 10). These inconsistencies underscore the influence of binder type and age on resistivity-based assessments and highlight the need for more nuanced interpretation of SRT results in GGBFS mixtures. Additionally, Thomas et al. [85] demonstrated that SRT results did not align well with diffusion coefficients derived from the salt ponding test, a direct and standardized measure of chloride ingress. They concluded that the electrical resistivity of concrete is highly sensitive to binder type and that permeability classifications based on resistivity alone may lack universal applicability across different SCMs. Consequently, they recommended that SRT classification boundaries be recalibrated for specific binder types to better reflect actual transport properties and improve the consistency of durability assessments.

4.7. Effects of Silica Fume

Silica fume is an ultrafine byproduct generated during the production of silicon and ferrosilicon alloys. Composed primarily of amorphous silicon dioxide (SiO2), its particles are extremely small, typically less than 1 μm in diameter, making it one of the most reactive pozzolanic SCMs available [154]. Due to its high specific surface area and pozzolanic activity, silica fume makes a significant contribution to microstructural densification. It fills voids within the cement matrix and reacts with CH to form additional CSH, thereby refining the pore structure and enhancing the overall impermeability and mechanical performance of concrete [155,156]. Although the inclusion of silica fume typically leads to notable improvements in strength, durability, and resistance to chloride ion ingress, its use is often limited to specialized concrete applications due to its greater cost relative to other SCMs in North America [146,157].
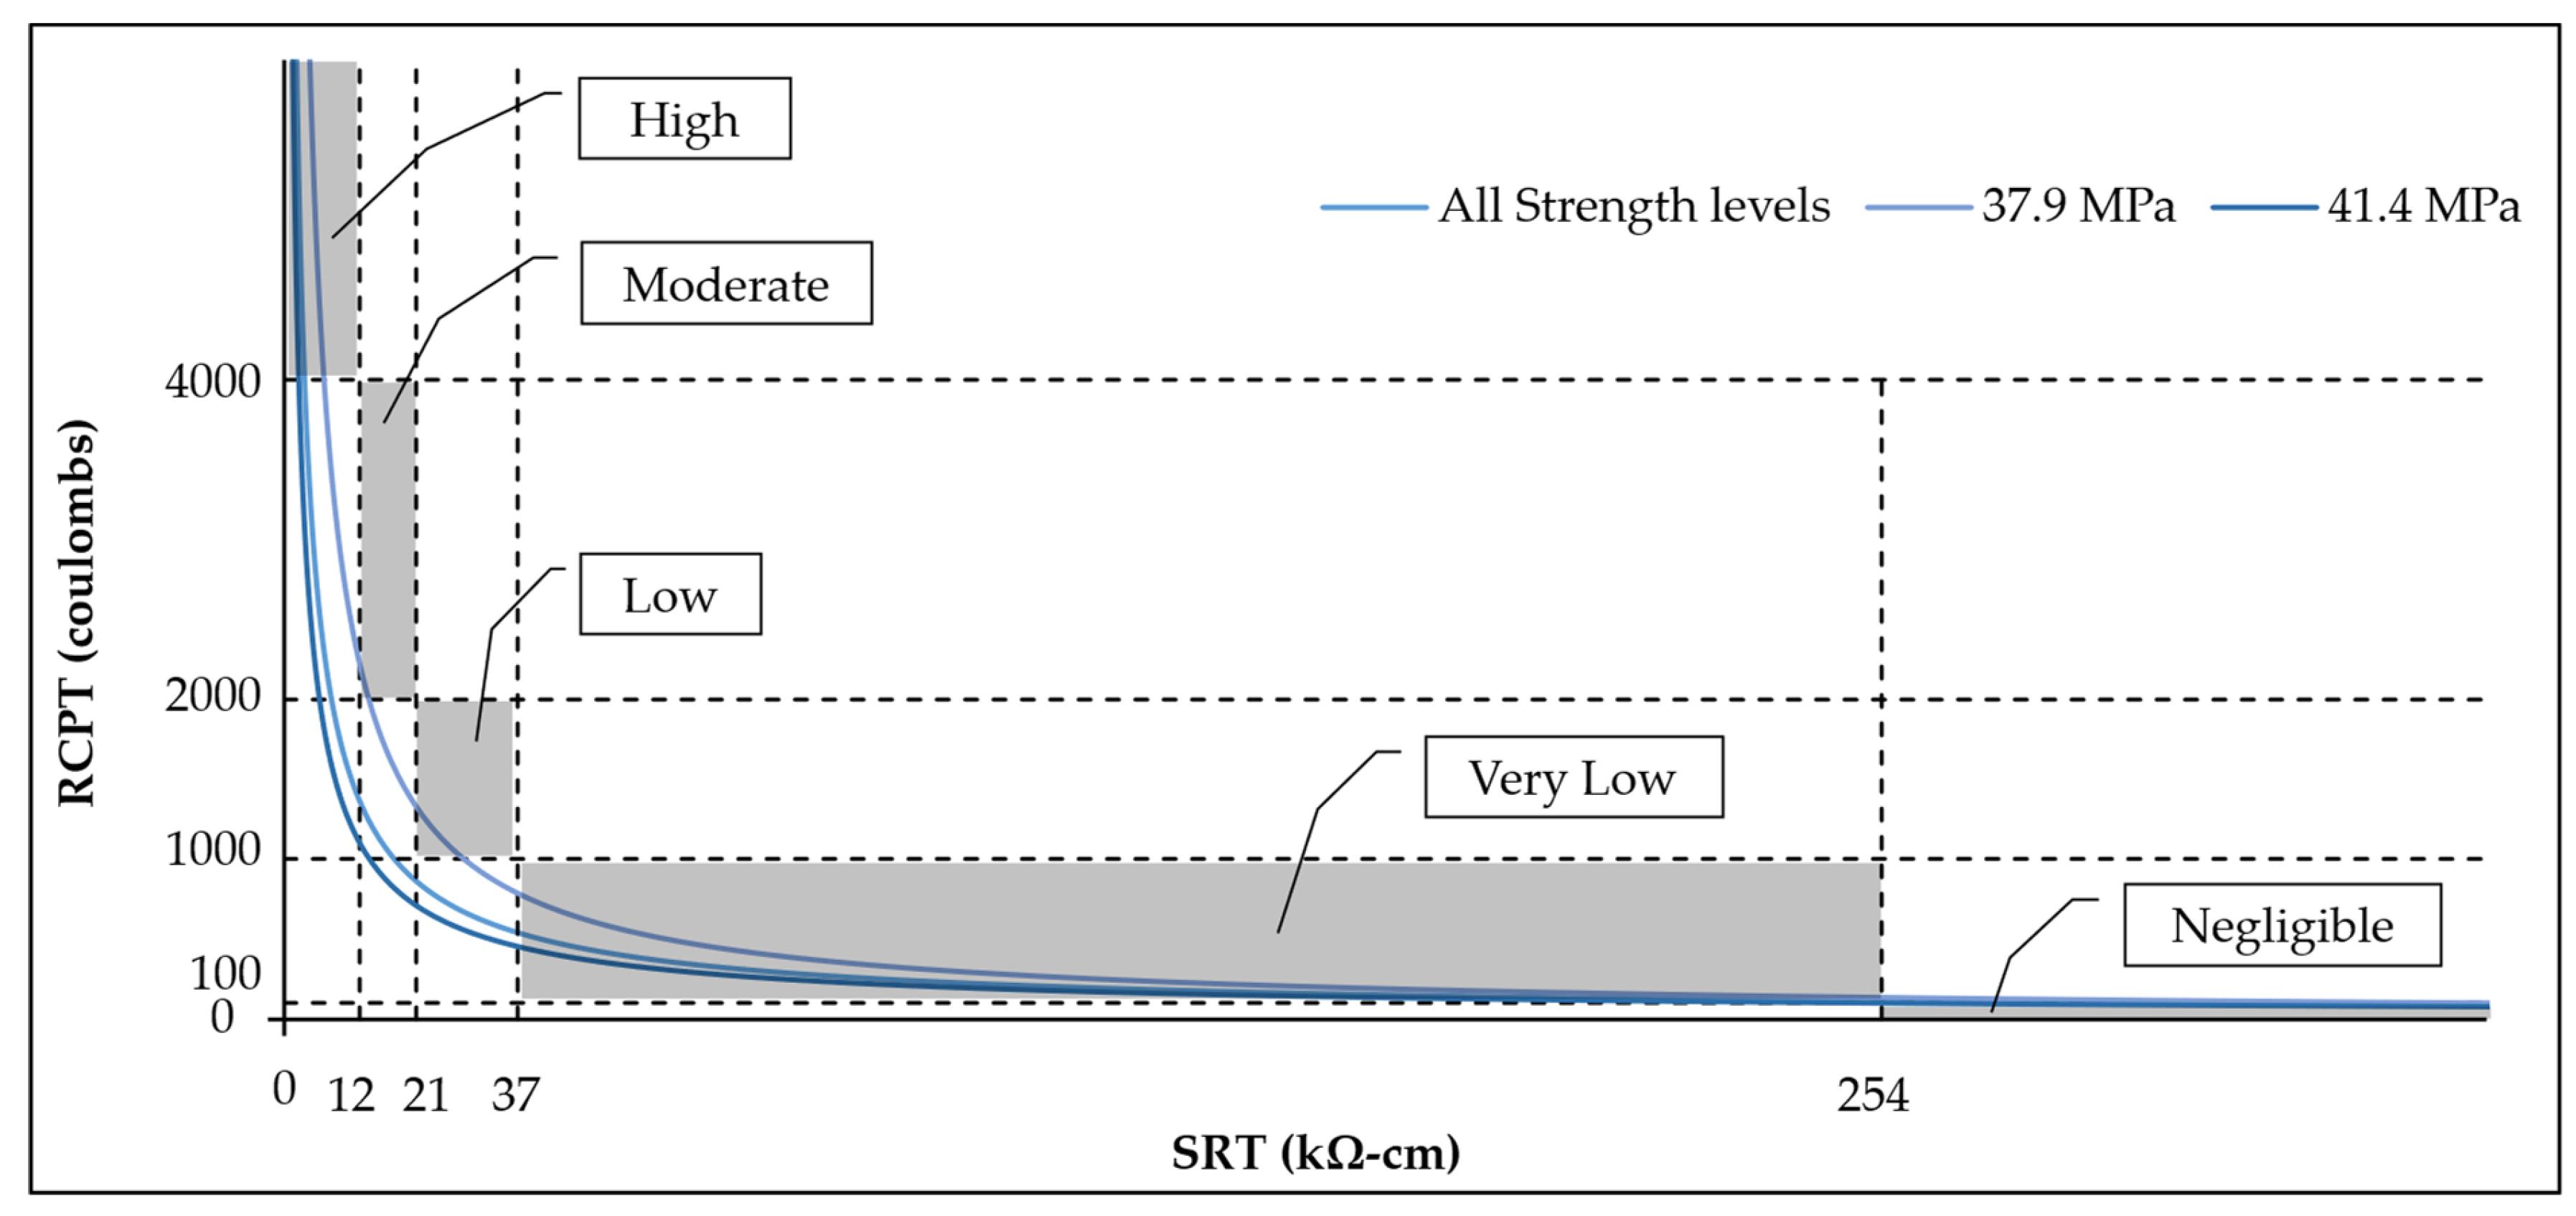
Bagheri et al. [126] demonstrated a strong correlation between SRTs conducted according to the Swedish National Testing and Research Institute protocol [144] and the RCPT conducted per ASTM C1202 [78], for mixtures incorporating varying levels of silica fume. Their findings indicated that both tests captured similar permeability trends in response to changes in silica fume content, validating the potential of resistivity-based techniques for performance evaluation. Researchers also have proposed different equations to compare the results of RCPT and SRT for concrete mixtures with different compressive strengths and silica fume contents, shown in Figure 12 and Figure 13 [123,124]. As illustrated in Figure 12 and Figure 13, however, a substantial portion of the RCPT-SRT curve with surface resistivity values in the 12–37 kΩ-cm range (corresponding to “low” and “moderate” permeability classes per AASHTO T 358) fell outside the shaded agreement zone, indicating differences between predicted and measured RCPT values. This suggests that existing correlation models may not accurately predict chloride permeability for concrete mixtures incorporating silica fume, especially within low to moderate permeability ranges, where small differences in microstructure can significantly affect ion transport behavior.
As discussed in Section 4.2 and Section 4.3, the relationship between RCPT and SRT results is generally influenced by specimen age and compressive strength. The presence of silica fume does not appear to alter this general dependency; however, the specific influence of these variables on this relationship in silica fume mixtures was less consistent compared to fly ash mixtures. The rapid early-age reactivity of silica fume, along with the pronounced sensitivity of its performance to mixture-specific parameters such as w/cm ratio, silica fume dosage, and curing regimen, may contribute to this variability. These factors can significantly influence microstructural development and, consequently, the transport properties of concrete. Previous studies have noted that although silica fume is widely recognized for improving resistance to chloride ion penetration, the permeability-related performance of concrete mixtures containing silica fume is highly dependent on mixture design and curing practices [158,159].

4.8. Effects of Metakaolin

Metakaolin is a manufactured SCM obtained through controlled calcination of kaolinite clay, typically at temperatures between 650 and 800 °C. It is composed primarily of amorphous silica and alumina, which show high pozzolanic reactivity at ambient temperatures. Since metakaolin is manufactured, its production can be tightly controlled to produce a consistent, highly reactive SCM. Upon incorporation into concrete, metakaolin reacts with CH to form additional CSH and alumina-containing phases, contributing to increased matrix densification, reduced porosity, and enhanced durability [160,161,162].
Experimental studies have shown a strong exponential relationship between RCPT and SRT results in concrete mixtures containing metakaolin. For instance, Gilan et al. [128] applied a hybrid support vector regression–particle swarm optimization model and demonstrated that RCPT values for metakaolin-containing concrete mixtures can be accurately predicted using SRT measurements, with high predictive reliability and robustness. Additionally, findings by Ramezanianpour et al. [129] support this relationship. Equation (15) presents the strongest empirical correlation identified in the literature for metakaolin-based mixtures, achieving a high R2 of 0.92:
R C P T = 6454   ×   e 0.04 S R T
This exponential relationship differs in form from the equations typically derived for mixtures containing other SCMs (e.g., fly ash, GGBFS). However, the high R2 value underscores a strong and consistent inverse correlation between RCPT and SRT results for metakaolin-based concrete mixtures. This suggests that the SRT can be a reliable predictor for the RCPT in evaluating chloride ion penetrability in metakaolin-containing mixtures.

4.9. Effects of Other Pozzolans

Although the four SCMs discussed in the preceding sections (fly ash, ground GGBFS, silica fume, and metakaolin) are among the most widely studied and utilized, there exists a broader range of alternative pozzolanic materials that have demonstrated promise in enhancing concrete durability and reducing chloride ion permeability. These alternative SCMs, often regionally available or derived from industrial by-products or natural sources, can also show strong correlations between RCPT and SRT results, indicating their viability for use in performance-based durability assessments.
For instance, calcined crushed perlite rock, a natural pozzolanic material obtained from expanded volcanic glass, has been investigated for its influence on the RCPT-SRT relationship. According to a study by Ramezanianpour et al. [130], a strong power-law relationship was observed between RCPT and SRT results for concrete mixtures incorporating calcined perlite, with a remarkably high R2 of 0.98. The best-fit empirical equation for this relationship is given as:
R C P T = 89,912   ×   S R T 1.12
This high R2 value suggests that the SRT can serve as a highly reliable predictor of the RCPT-measured chloride ion penetrability in perlite-based concrete, similar to or even exceeding the predictive accuracy observed for more conventional SCMs.
Beyond perlite, other alternative pozzolanic materials such as RHA, volcanic ash, natural pozzolans, and thermally processed clays are increasingly being investigated for their favorable environmental benefits and potential to enhance concrete performance. However, the influence of these materials on the relationship between RCPT and SRT results remains largely underexplored in the current literature. Limited experimental data make it difficult to establish generalized predictive models or assess the robustness of the SRT as an alternative to the RCPT for these SCMs. Future research should prioritize the systematic evaluation of the RCPT–SRT relationships for these emerging SCMs to better inform durability-based design, particularly in regions where conventional SCMs are scarce, economically impractical, or environmentally unsustainable.

4.10. Critical Synthesis and Quantitative Evaluation of RCPT–SRT Relationships

A quantitative synthesis of the reviewed studies reveals several consistent trends in the relationship between the RCPT and the SRT. While individual investigations have employed different concrete types, SCMs, curing ages, and regression forms, a unified interpretation can be derived from the collective data.

4.10.1. Overall Correlation Strength

Across the reviewed literature, the relationship between RCPT and SRT results exhibits a strong inverse dependence, most often expressed by inverse power-law or exponential models. Reported R2 commonly ranges from 0.80 to 0.98, with typical values between 0.85 and 0.95. The model proposed by Ramezanianpour et al. (Equation (10), RCPT = 50,219 × SRT−0.9728) achieved R2 = 0.90, while other studies, such as Tanesi and Ardani [104], reported R2 ≈ 0.92, and perlite-based mixtures reached R2 ≈ 0.98. These results confirm that, under controlled conditions, SRT can effectively reproduce RCPT trends across a wide range of mixtures and test ages.

4.10.2. Model Exponent and Physical Interpretation

The exponent b in the power-law expression (RCPT = a × SRTb) generally falls between −0.9 and −1.3. Exponents near −1 represent an almost ideal inverse proportionality between electrical conductivity (RCPT) and resistivity (SRT), indicating stable temperature and ion-migration conditions during testing. More negative exponents (b < −1.1) are typically observed in highly conductive concrete mixtures or those containing SCMs that intensify Joule-heating effects during RCPT, leading to nonlinear increases in current flow. Therefore, these variations in b reflect both intrinsic microstructural differences and artifacts of the RCPT procedure.

4.10.3. Statistical Variability and Repeatability

A comparative analysis of reported variability shows that the RCPT exhibits higher scatter than the SRT. Standard deviations in RCPT results frequently exceed 300 coulombs with coefficients of variation approaching 10%, whereas SRT data typically show standard deviations below 3 kΩ·cm and COV values around 5%. The lower dispersion of SRT outcomes confirms its greater repeatability and makes it more suitable for rapid quality control and field assessments. Nevertheless, the higher sensitivity of RCPT to temperature and pore-solution conductivity can result in classification mismatches. For example, mixtures categorized as “very low” permeability by SRT occasionally yield RCPT charges slightly above the 1000 coulombs limit that defines the “low” class.

4.10.4. Influence of Age and Mixture Characteristics

The consistency of the RCPT–SRT correlation improves with increasing curing age. At later testing ages (56, 91, and 180 days), a greater proportion of regression curves falls within the permeability-class agreement zones shown in Figure 4, Figure 5 and Figure 6, demonstrating that both tests converge as microstructural refinement progresses. Early-age measurements (14 or 28 days) yield lower but still acceptable correlation levels (R2 ≈ 0.80–0.87), suggesting that early-age SRT results can provide useful estimates of later-age RCPT performance when supported by calibrated models.
Binder composition also strongly affects the quality of correlation. Mixtures containing silica fume, slag, or fly ash tend to show stronger inverse relationships (R2 > 0.90) due to improved matrix densification, whereas high-strength or alkali-activated concrete mixtures sometimes deviate because of altered pore chemistry and reduced moisture content. The compiled data show systematic trends among SCM types: fly ash mixtures generally reduce RCPT charge by about 30–50% over 56 days, GGBFS mixtures achieve 50–70% reductions with corresponding increases in surface resistivity, and silica fume mixtures often exhibit the most pronounced improvement, raising resistivity above 100 kΩ·cm and lowering charge passed below 1000 coulombs. Metakaolin provides comparable gains but with greater variability depending on dosage and curing regime. These distinctions confirm that the RCPT–SRT relationship is not universal but binder-dependent. Accordingly, developing SCM-specific calibration equations could enhance the precision of resistivity-based permeability classifications and improve the reliability of using SRT as a rapid, nondestructive alternative to RCPT for durability assessment.

4.10.5. Integrated Interpretation

Taken together, the quantitative evidence demonstrates that the SRT can serve as a reliable, faster, and more repeatable alternative to RCPT for classifying concrete permeability, provided that mixture type, binder system, and age are properly accounted for. Across the compiled studies, most of the data points fell within the same permeability-classification zones for the two methods, confirming a high level of practical equivalence. However, residual discrepancies, primarily in concrete mixtures with extreme SCM contents or measured at very early ages, underscore the need for binder-specific calibration and, where possible, cross-validation with diffusion-based permeability tests. Overall, this quantitative synthesis substantiates the strong empirical relationship between the two test methods while clarifying its limitations and conditions of applicability.

5. Conclusions

This state-of-the-art review critically evaluated findings from a wide range of studies investigating the relationship between the rapid chloride permeability test (RCPT) and the surface resistivity test (SRT) results for concrete mixtures containing various supplementary cementitious materials (SCMs) such as fly ash, ground granulated blast furnace slag (GGBFS), silica fume, and metakaolin. By synthesizing multi-study datasets published over the past two decades, this review identified both key trends and persistent research gaps governing the RCPT–SRT relationship under different testing conditions and mixture designs. While the SRT is increasingly favored for its speed, cost-efficiency, and non-destructive nature, its reliability and accuracy as an alternative to the RCPT is highly dependent on several factors such as testing age, water-to-cementitious materials (w/cm) ratio, compressive strength, and the type and dosage of SCM used.
In most cases, a consistent inverse power-law or exponential relationship between the RCPT and the SRT was observed. typically characterized by coefficients of determination (R2) between 0.85 and 0.95 and exponents ranging from −0.9 to −1.3. These findings confirm the potential of the SRT for permeability classification. One of the most robust relationships identified was:
R C P T = 50,219   ×   S R T 0.9728
which reflects a high degree of correlation and underscores the viability of using SRT results as a predictive tool for estimating chloride ion permeability, particularly when calibration is tailored to the specific binder system and testing conditions. Similar regression trends have been observed across studies using both conventional and blended cement systems, suggesting a broadly applicable inverse RCPT–SRT behavior despite variations in material composition. Furthermore, SRT consistently exhibited lower data variability (standard deviation < 3 kΩ·cm and coefficient of variation ≈ 5%) compared to RCPT (standard deviation > 300 coulombs and coefficient of variation up to 10%), underscoring its better repeatability and suitability for field applications.
However, the current research remains fragmented and somewhat limited in generality. Although this review considered nearly all relevant studies published since 2003, most studies have focused primarily on conventional SCMs, while alternative materials such as rice husk ash (RHA), volcanic ash, natural pozzolans, and thermally treated clays have received far less attention. Variations in mixture design, binder chemistry, and curing further limit general applicability of the existing models. Therefore, achieving broader generality and field implementation of SRT requires comprehensive data harmonization across studies, climates, and binder systems. To address these gaps, future research should focus on:
  • Developing broader binder-specific correlation models that consider unique hydration mechanisms and microstructural developments.
  • Validating the SRT–RCPT relationships using diffusion-based tests such as salt ponding method for improved accuracy.
  • Investigating alternative SCMs to broaden applicability, especially in regions where traditional SCMs are unavailable or unsustainable.
  • Exploring composite SCM systems to better understand interactions between multiple binders and their cumulative effect on resistivity and ion transport.
  • Incorporating additional variables such as cement type, curing conditions, aggregate properties, and broader concrete types (e.g., self-consolidating and ultra-high-performance concrete) to build more comprehensive predictive models.
  • Conducting multi-institutional and meta-analytical studies to refine predictive correlations, reduce inter-laboratory variability, and support global standardization of SRT as a performance-based durability assessment tool.

Funding

This research received no external funding.

Data Availability Statement

No new data were created or analyzed in this study. Data sharing is not applicable to this article.

Conflicts of Interest

The authors declare no conflicts of interest.

Abbreviations

The following abbreviations are used in this manuscript:
AASHTOAmerican Association of State Highway Transportation Officials
BRTBulk Resistivity Test
CHCalcium Hydroxide
CSHCalcium Silicate Hydrate
COVCoefficients Of Variation
GGBFSGround Granulated Blast Furnace Slag
ISATInitial Surface Absorption Test
ITZInterfacial Transition Zone
NaClSodium Chloride
NaOHSodium Hydroxide
OH-Hydroxyl Ions
QCQuality Control
QAQuantity Assurance
RCPTRapid Chloride Permeability Test
RHARice Husk Ash
SDStandard Deviations
SiO2Silicon Dioxide
SCMSupplementary Cementitious Material
SRTSurface Resistivity Test
UHPCUltra-High-Performance Concrete
w/cmWater-to-Cementitious Materials

References

  1. Hornbostel, K.; Larsen, C.K.; Geiker, M.R. Relationship between concrete resistivity and corrosion rate—A literature review. Cem. Concr. Compos. 2013, 39, 60–72. [Google Scholar] [CrossRef]
  2. Ji, Y.; Hu, Y.; Zhang, L.; Bao, Z. Laboratory studies on influence of transverse cracking on chloride-induced corrosion rate in concrete. Cem. Concr. Compos. 2016, 69, 28–37. [Google Scholar] [CrossRef]
  3. Jones, S.; Martys, N.; Lu, Y.; Bentz, D. Simulation studies of methods to delay corrosion and increase service life for cracked concrete exposed to chlorides. Cem. Concr. Compos. 2015, 58, 59–69. [Google Scholar] [CrossRef]
  4. Angst, U.; Elsener, B.; Larsen, C.K.; Vennesland, Ø. Critical chloride content in reinforced concrete—A review. Cem. Concr. Res. 2009, 39, 1122–1138. [Google Scholar] [CrossRef]
  5. Rucker-Gramm, P.; Beddoe, R. Effect of moisture content of concrete on water uptake. Cem. Concr. Res. 2010, 40, 102–108. [Google Scholar] [CrossRef]
  6. Sahmaran, M.; Yaman, I.Ö. Influence of transverse crack width on reinforcement corrosion initiation and propagation in mortar beams. Can. J. Civ. Eng. 2008, 35, 236–245. [Google Scholar] [CrossRef]
  7. CSA/S413-94; Parking Structures-Structural Design. Canadian Standards Association: Rexdale, ON, Canada, 1994.
  8. Stanish, K.D.; Hooton, R.D.; Thomas, M.D.A. Testing the Chloride Penetration Resistance of Concrete: A Literature Review; University of Toronto: Toronto, ON, Canada, 2001. Available online: https://highways.dot.gov/media/2981 (accessed on 17 November 2025).
  9. Saito, M.; Ishimori, H. Chloride Permeability of Concrete Under Static and Repeated Compressive Loading. Cem. Concr. Res. 1995, 25, 803–808. [Google Scholar] [CrossRef]
  10. Samaha, H.R.; Hover, K.C. Influence of Microcracking on the Mass Transport Properties of Concrete. Mater. J. 1992, 89, 416–424. [Google Scholar]
  11. Thomas, M.D.A.; Jones, M.R. A Critical Review of Service Life Modelling of Concretes Exposed to Chlorides. In Concrete in the Service of Mankind: Radical Concrete Technology; Dhir, R.K., Hewlett, P.C., Eds.; E. & F.N. Spon: London, UK, 1996; pp. 723–736. [Google Scholar]
  12. Goodspeed, C.H.; Vanikar, S.; Cook, R.A. High Performance Concrete Defined for Highway Structures. ACI Concr. Int. 1996, 18, 62–67. [Google Scholar]
  13. Julio-Betancourt, G.A.; Hooton, R.D. Study of the Joule effect on rapid chloride permeability values and evaluation of related electrical properties of concretes. Cem. Concr. Res. 2004, 34, 1007–1015. [Google Scholar] [CrossRef]
  14. Nokken, M.; Boddy, A.; Wu, X.; Hooton, R.D. Effects of Temperature, Chemical, and Mineral Admixtures on the Electrical Conductivity of Concrete. J. ASTM Int. 2018, 5, 1–9. [Google Scholar] [CrossRef]
  15. Gardner, T.; Stanish, K.; Alexander, M. Critical review of rapid chloride test methods for concrete. Concr. Beton. Mag. 2006, 113, 11–17. [Google Scholar]
  16. Feldman, R.F.; Chan, G.W.; Brousseau, R.J.M.; Tumidajski, P.J. Investigation of rapid chloride permeability tests. ACI Mater. J. 1994, 91, 246–255. [Google Scholar] [CrossRef] [PubMed]
  17. Hooton, R.D.; Thomas, M.D.A.; Stanish, K. Prediction of Chloride Penetration in Concrete; FHWA-RD-00-142; United State Department of Transportation, Federal Highway Administration: McLean, VA, USA, 2001.
  18. Ozyildirim, C. Rapid Chloride Permeability Testing of Silica-Fume Concrete. Cem. Concr. Aggreg. 1994, 16, 53–56. [Google Scholar] [CrossRef]
  19. Al Martini, S.; Khartabil, A.; Sabouni, R. Evaluation of Thermal Conductivity of Sustainable Concrete Having Supplementary Cementitious Materials (SCMs) and Recycled Aggregate (RCA) Using Needle Probe Test. Sustainability 2023, 15, 109. [Google Scholar] [CrossRef]
  20. Bagheri, A.R.; Zanganeh, H. Comparison of Rapid Tests for Evaluation of Chloride Resistance of Concretes with Supplementary Cementitious Materials. J. Mater. Civ. Eng. 2012, 24, 1175–1182. [Google Scholar] [CrossRef]
  21. Andrade, C.; Alonso, C.; Goñi, S. Possibilities for Electrical Resistivity to Universally Characterise Mass Transport Processes in Concrete. In Proceedings of the Concrete 2000 Conference, Dundee, Scotland, 7–9 September 1993; Dhir, R.K., Jones, M.R., Eds.; E. & FN. Spon.: London, UK, 1993; Volume 2, pp. 1640–1652. [Google Scholar]
  22. Andrade, C. Calculation of Chloride Diffusion Coefficients in Concrete from Ionic Migration Measurements. Cem. Concr. Res. 1993, 23, 724–742. [Google Scholar] [CrossRef]
  23. Buenfeld, N.R.; Glass, G.K.; Hassanein, A.M.; Zhang, J.Z. Chloride transport in concrete subjected to electrical field. J. Mater. Civ. Eng. 1998, 10, 220–228. [Google Scholar] [CrossRef]
  24. Liu, Z.; Beaudoin, J.J. The Permeability of Cement Systems to Chloride Ingress and Related Test Methods. Cem. Concr. Aggreg. 2000, 22, 16–23. [Google Scholar] [CrossRef]
  25. Shi, C. Effect of mixing proportions of concrete on its electrical conductivity and the rapid chloride permeability test (ASTM C1202 or ASSHTO T277) results. Cem. Concr. Res. 2004, 34, 537–545. [Google Scholar] [CrossRef]
  26. Pfeifer, D.W.; McDonald, D.B.; Krauss, P.D. The rapid chloride permeability test and its correlation to the 90-day chloride ponding test. PCI J. 1994, 39, 38–47. [Google Scholar] [CrossRef]
  27. Plauto, P.; Bilodeau, A. Rapid chloride ion permeability test: Data on concretes incorporating supplementary cementing materials. In Proceedings of the 3rd International Conference on the Use of Fly Ash, Silica Fume, Slag, and Natural Pozzolan in Concrete, Trondheim, Norway, 18–23 June 1989; American Concrete Institute (ACI): Farmington Hills, MI, USA; Volume 114, pp. 625–644. [Google Scholar]
  28. Streicher, P.E.; Alexanderm, M.G. A Chloride Conduction Test for Concrete. Cem. Concr. Res. 1995, 25, 1284–1294. [Google Scholar] [CrossRef]
  29. Weiss, J. Relating Transport Properties to Performance in Concrete Pavements, CP Road Map; Shields-Cook, S., Ed.; Iowa State University: Ames, IA, USA, 2014. [Google Scholar]
  30. Mengel, L.; Krauss, H.W.; Lowke, D. Water transport through cracks in plain and reinforced concrete—Influencing factors and open questions. Constr. Build. Mater. 2020, 254, 118990. [Google Scholar] [CrossRef]
  31. Hearn, N.; Hooton, R.D.; Nokken, M.R. Pore Structure, Permeability, and Penetration Resistance Characteristics of Concrete. In Significance of Tests and Properties of Concrete and Concrete-Making Materials; Lamond, J., Pielert, J., Eds.; ASTM International, Bridgeport: West Conshohocken, PA, USA, 2006; pp. 238–252. [Google Scholar]
  32. Wang, K.; Igusa, T.; Shah, S.P. Permeability of concrete—Relationships to its mix proportion, microstructure and microcracks. In The Sidney Diamond Symposium; Cohen, M., Mindess, S., Skalny, J., Eds.; The American Ceramic Society: Westerville, OH, USA, 1998; pp. 45–54. [Google Scholar]
  33. FIB. Model Code, First Complete Draft; International Federation for Structural Concrete (fib): Lausanne, Switzerland, 2010. [Google Scholar]
  34. Šavija, B.; Lukovic, M.; Schlangen, E. Influence of Cracking on Moisture Uptake in Strain-Hardening Cementitious Composites. J. Nanomech. Micromech. 2017, 7, 4016010. [Google Scholar] [CrossRef]
  35. Zhang, P.; Zhao, T.J.; Zhang, L.S.; Wittmann, F.H.; Lehmann, E.; Vontobel, P. Application of Neutron Radiography to Observe Water Absorbtion of Concrete. In Proceedings of the 18th International Conference on Nuclear Engineering, Xi’an, China, 17–21 May 2010; Volume 3, pp. 29–36. [Google Scholar]
  36. Pease, B.; Couch, J.; Geikler, M.; Stang, H.; Weiss, J. Assessing the Portion of the Crack Length Contribution to Water Sorption in Concrete Using X-Ray Absorption. In Proceedings of the ConcreteLife’ 09: Second International RILEM Workshop on Concrete Durability and Service Life Planning, Haifa, Israel, 7–9 September 2009. [Google Scholar]
  37. Mousavinezhad, S.; Toledo, W.K.; Newtson, C.M.; Aguayo, F. Rapid Assessment of Sulfate Resistance in Mortar and Concrete. Materials 2024, 17, 4678. [Google Scholar] [CrossRef]
  38. Shaikh, F.U.A. Effect of Cracking on Corrosion of Steel in Concrete. Int. J. Concr. Struct. Mater. 2018, 12, 3. [Google Scholar] [CrossRef]
  39. Akhavan, A.; Shafaatian, S.M.H.; Rajabipour, F. Quantifying the effects of crack width, tortuosity, and roughness on water permeability of cracked mortars. Cem. Concr. Res. 2012, 42, 313–320. [Google Scholar] [CrossRef]
  40. Rastiello, G.; Boulay, C.; Dal Pont, S.; Tailhan, J.L.; Rossi, P. Real-time water permeability evolution of a localized crack in concrete under loading. Cem. Concr. Res. 2014, 56, 20–28. [Google Scholar] [CrossRef]
  41. Aldea, C.-M.; Surendra, P.S.; Karr, A. Effect of Cracking on Water and Chloride Permeability of Concrete. ASCE J. Mater. Civ. Eng. 1999, 11, 181–187. [Google Scholar] [CrossRef]
  42. Wang, K.; Jansen, D.C.; Shah, S.P.; Karr, A.F. Permeability study of cracked concrete. Cem. Concr. Res. 1997, 27, 381–393. [Google Scholar] [CrossRef]
  43. Todak, H.; Lucero, C.; Weiss, W.J. Why Is the Air There? Thinking about Freeze-Thaw in Terms of Saturation. Concr. Focus Spring 2015, 14, OC3–OC7. [Google Scholar]
  44. Ren, F.; Zhou, C.; Zeng, Q.; Wang, Z.; Wang, W. Numerical investigations into the physical significance of sorptivity for cement-based materials considering water sensitivity. J. Build. Eng. 2023, 66, 105952. [Google Scholar] [CrossRef]
  45. Wei, J.; Tao, B.; Weiss, W.J. Water Absorption in Cementitious Materials at Different Temperatures. Adv. Civ. Eng. Mater. 2017, 6, 280–295. [Google Scholar] [CrossRef]
  46. Gräf, H.; Setzer, M.J. Influence of Water Cement Ratio and Curing on the Permeability and Structure of Hardened Cement Paste and Concrete. MRS Online Proc. Libr. 1988, 137, 337–347. [Google Scholar] [CrossRef]
  47. Volkwein, A. Investigations on the penetration of water and chloride into concrete. Beton-Stahlbetonbau 1993, 88, 223–226. (In German) [Google Scholar] [CrossRef]
  48. Beddoe, R.; Springenschmid, R. Moisture transport through concrete structural components. Beton-Stahlbetonbau 1999, 94, 158–166. (In German) [Google Scholar] [CrossRef]
  49. Zaccardi, Y.V.; Alderete, N.; De Belie, N. Lucas-Washburn vs Richards equation for the modelling of water absorption in cementitious materials. MATEC Web Conf. 2018, 199, 02019. [Google Scholar] [CrossRef]
  50. Villagrán Zaccardi, Y.A.; Alderete, N.M.; de Belie, N. Improved model for capillary absorption in cementitious materials: Progress over the fourth root of time. Cem. Concr. Res. 2017, 100, 153–165. [Google Scholar] [CrossRef]
  51. Yuan, Q.; Shi, C.; De Schutter, G.; Audenaert, K.; Deng, D. Chloride binding of cement-based materials subjected to external chloride environment—A review. Constr. Build. Mater. 2009, 23, 1–13. [Google Scholar] [CrossRef]
  52. Mc Carter, W.J.; Emerson, M.; Ezirim, H. Properties of concrete in the cover zone: Developments in monitoring techniques. Mag. Concr. Res. 1995, 47, 243–251. [Google Scholar] [CrossRef]
  53. Suryavanshi, A.K.; Swamy, R.N.; Cardew, G.E. Estimation of diffusion coefficients for chloride ion penetration into structural concrete. ACI Mater. J. 2002, 99, 441–449. [Google Scholar] [CrossRef]
  54. Samson, E.; Marchand, J.; Snyder, K.A. Calculation of Ionic Diffusion Coefficients on the Basis of Migration Test Results. Mater. Struct. 2003, 36, 156–165. [Google Scholar] [CrossRef]
  55. Marchand, J.; Odler, I.; Skalny, J.P. Sulfate Attack on Concrete; CRC Press: London, UK, 2002. [Google Scholar]
  56. Taylor, H.F.W. Cement Chemistry; Thomas Telford: London, UK, 1997. [Google Scholar]
  57. Safiuddin, M.; Hearn, N. Comparison of ASTM Saturation Techniques for Measuring the Permeable Porosity of Concrete. Cem. Concr. Res. 2005, 35, 1008–1013. [Google Scholar] [CrossRef]
  58. Bazant, Z.P.; Najjar, L.J. Nonlinear water diffusion in nonsaturated concrete. Mater. Struct. 1972, 5, 3–20. [Google Scholar] [CrossRef]
  59. Lin, M.; Sasano, H.; Maruyama, I. Fundamental study on water diffusion coefficient of cement based material. In Proceedings of the JCI Annual Convention, Nagoya, Japan, 9–11 July 2013; pp. 595–600. [Google Scholar]
  60. Reinhardt, H.-W.; Jooss, M. Permeability, diffusion, and capillary absorption of concrete at elevated temperature in service range. Otto-Graf-J. 1998, 9, 34. [Google Scholar]
  61. Zhang, J.; Hou, D.; Gao, Y.; Wei, S. Determination of Moisture Diffusion Coefficient of Concrete at Early Age from Interior Humidity Measurements. Drying Technol. 2011, 29, 689–696. [Google Scholar] [CrossRef]
  62. ACI Committee. ACI 201.2R-16 Guide to Durable Concrete; American Concrete Institute: Farmington Hills, MI, USA, 2016. [Google Scholar]
  63. Pettersson, K. Olika Faktorers Inverkan på Kloriddiffusion i Betongkonstruktioner. In The Effect of Different Factors on the Chloride Diffusion in Concrete, CBI Rapport 4:94; Cement och Betong Institutet: Stockholm, Sweden, 1994. [Google Scholar]
  64. Bu, Y.; Luo, D.; Weiss, J. Using Fick’s Second Law and Nernst–Planck Approach in Prediction of Chloride Ingress in Concrete Materials. Adv. Civ. Eng. Mater. 2014, 3, 566–585. [Google Scholar] [CrossRef]
  65. Nokken, M.; Boddy, A.; Hooton, R.D.; Thomas, M.D.A. Time Dependent Diffusion in Concrete—Three Laboratory Studies. Cem. Concr. Res. 2006, 36, 200–207. [Google Scholar] [CrossRef]
  66. Martín-Pérez, B.; Zibara, H.; Hooton, R.D.; Thomas, M.D.A. A Study of the Effect of Chloride Binding on Service Life Predictions. Cem. Concr. Res. 2000, 30, 1215–1223. [Google Scholar] [CrossRef]
  67. Tumidajski, P.J. Application of Danckwerts’ Solution to Simultaneous Diffusion and Chemical Reaction in Concrete. Cem. Concr. Res. 1996, 26, 697–700. [Google Scholar] [CrossRef]
  68. Soutsos, M. Concrete Durability: A Practical Guide to the Design of Durable Concrete Structures; Thomas Telford: London, UK, 2010. [Google Scholar]
  69. BS 1881-208:1996; Testing Concrete, Recommendations for the Determination of the Initial Surface Absorption of Concrete. British Standards Institution: London, UK, 1996.
  70. ASTM C1585-20; Standard Test Method for Measurement of Rate of Absorption of Water by Hydraulic-Cement Concretes. ASTM International: West Conshohocken, PA, USA, 2020.
  71. Marchand, J.; Gerard, B.; Delagrave, A. Ion Transport Mechanisms in Cement-Based Materials. In Materials Science of Concrete; Skalny, J.P., Mindess, S., Eds.; American Ceramic Society: Westerville, OH, USA, 1998; pp. 307–400. [Google Scholar]
  72. Nilsson, L.O.; Poulsen, E.; Sandberg, P.; Sørensen, H.E.; Klinghoffer, O. HETEK, Chloride Penetration into Concrete, State-of-the-Art, Transport Processes, Corrosion Initiation, Test Methods and Prediction Models; Danish Road Directorate: Copenhagen, Denmark, 1996. [Google Scholar]
  73. Dhir, R.K.; Jones, M.R.; Ahmed, H.E.H.; Seneviratne, A.M.G. Rapid estimation of chloride diffusion coefficient in concrete. Mag. Concr. Res. 1990, 42, 177–185. [Google Scholar] [CrossRef]
  74. Streicher, P.E.; Alexander, M.G. A critical evaluation of chloride diffusion test methods for concrete. In Proceedings of the third CANMET/ACI International Conference on Concrete Durability, Nice, France, 22–28 May 1994; pp. 517–530. [Google Scholar]
  75. AASHTO T259; Standard method of test for resistance of concrete to chloride ion penetration. American Association of State and Highway Transportation Officials: Washington, DC, USA, 2002.
  76. ASTM C1556–11a(2016); Standard Test Method for Determining the Apparent Chloride Diffusion Coefficient of Cementitious Mixtures by Bulk Diffusion. ASTM International: West Conshohocken, PA, USA, 2016. [CrossRef]
  77. Nordtest, N.T. Concrete, Hardened: Accelerated Chloride Penetration, NT Build 443; Nordtest: Espoo, Finland, 1995. [Google Scholar]
  78. ASTM C1202-22; Standard Test Method for Electrical Indication of Concrete’s Ability to Resist Chloride Ion Penetration. ASTM International: West Conshohocken, PA, USA, 2022.
  79. NT Build 355; Concrete, Mortar and Cement-Based Repair Materials: Chloride Diffusion Coefficient from Migration Cell Experiments. Nordtest: Espoo, Finland, 1997.
  80. JSCE-G571-2003; Test Method for Effective Diffusion Coefficient of Chloride Ion in Concrete by Migration. Japan Society of Civil Engineers: Tokyo, Japan, 2003.
  81. NT Build 492; Concrete, Mortar and Cement-Based Repair Materials: Chloride Migration Coefficient from Non-Steady-State Migration Experiments. Nordtest: Espoo, Finland, 1999.
  82. Whiting, D. Rapid measurement of the chloride permeability of concrete. Public Roads 1981, 45, 101–112. [Google Scholar]
  83. Whiting, D. Rapid Determination of the Chloride Permeability of Concrete, in Final Report No. FHWA-RD-81/119; Portland Cement Association, Federal Highway Administration: Skokie, IL, USA, 1981. [Google Scholar]
  84. Whiting, D.; Mitchell, T.M. History of the rapid chloride permeability test. Transp. Res. Board 1992, 1335, 55–62. [Google Scholar]
  85. Thomas, R.J.; Ariyachandra, E.; Lezama, D.; Peethamparan, S. Comparison of chloride permeability methods for Alkali-Activated concrete. Constr. Build. Mater. 2018, 165, 104–111. [Google Scholar] [CrossRef]
  86. Sharfuddin, A.; Kayali, O.; Anderson, W. Chloride penetration in binary and ternary blended cement concretes as measured by two different rapid methods. Cem. Concr. Compos. 2008, 30, 576–582. [Google Scholar] [CrossRef]
  87. Gowripalan, N.; Mohamed, H.M. Chloride-ion induced corrosion of galvanized and ordinary steel reinforcement in high-performance concrete. Cem. Concr. Res. 1998, 28, 1119–1131. [Google Scholar] [CrossRef]
  88. Hale, M.; Russell, B.W.; Bush, T.D. An assessment of the rapid chloride ion penetrability test. In Proceedings of the International Conference on Concrete for Extreme Conditions, Dundee, Scotland, UK, 9–11 September 2002; pp. 447–456. [Google Scholar]
  89. Polder, R.B. Critical chloride content for reinforced concrete and its relationship to concrete resistivity. Mater. Corros. 2009, 60, 623–630. [Google Scholar] [CrossRef]
  90. Nadelman, E.I.; Kurtis, K.E.A. A Resistivity-Based Approach to Optimizing Concrete Performance. Concr. Int. 2014, 36, 50–54. [Google Scholar]
  91. Gulikers, J. Theoretical considerations on the supposed linear relationship between concrete resistivity and corrosion rate of steel reinforcement. Mater. Corros. 2005, 56, 393–403. [Google Scholar] [CrossRef]
  92. Andrade, C.; Sanjuan, M.A.; Alonso, M.C. Measurement of chloride diffusion coefficient from migration tests. In Proceedings of the NACE Corrosion’93, New Orleans, LA, USA, 7–12 March 1993; pp. 289–298. [Google Scholar]
  93. Polder, R.B. Chloride diffusion and resistivity testing of five concrete mixes for marine environment. In Proceedings of the RILEM International Workshop on Chloride Penetration into Concrete, St-Remy-les-Chevreuses, France, 15–18 October 1995. [Google Scholar]
  94. Polder, R.B.; Peelen Willy, H.A. Characterisation of chloride transport and reinforcement corrosion in concrete under cyclic wetting and drying by electrical resistivity. Cem. Concr. Compos. 2002, 24, 427–435. [Google Scholar] [CrossRef]
  95. Andrade, C.; d’Andrea, R. Electrical Resistivity as Microstructural Parameter for the Modelling of Service Life of Reinforced Concrete Structures. In Proceedings of the Second International Symposium on Service Life Design for Infrastructures, Delft, The Netherlands, 4–6 October 2010; Van, K., Breugel, G., Yuan, Y.Y., Eds.; RILEM: Paris, France, 2010; pp. 379–388. [Google Scholar]
  96. Andrade, C.; d’Andrea, R.; Rebolledo, N. Chloride Ion Penetration in Concrete: The Reaction Factor in the Electrical Resistivity Model. Cem. Concr. Comp. 2014, 47, 41–46. [Google Scholar] [CrossRef]
  97. Beushausen, H.; Fernandez Luco, L. Performance-Based Specifications and Control of Concrete Durability: State-of-the Art Report RILEM TC 230-PSC; Springer: Dordrecht, the Netherlands, 2016. [Google Scholar]
  98. AASHTO T 358; Standard Method of Test for Surface Resistivity Indication of Concrete’s Ability to Resist Chloride Ion Penetration. American Association of State Highway and Transportation Officials: Washington, DC, USA, 2019.
  99. ASTM C1876-23; Standard Test Method for Bulk Electrical Resistivity or Bulk Conductivity of Concrete. ASTM International: West Conshohocken, PA, USA, 2023.
  100. Horňáková, M.; Lehner, P. Relationship of Surface and Bulk Resistivity in the Case of Mechanically Damaged Fibre Reinforced Red Ceramic Waste Aggregate Concrete. Materials 2020, 13, 5501. [Google Scholar] [CrossRef] [PubMed]
  101. Kessler Richard, J.; Powers Rodney, G.; Viva, E.; Paredes Mario, A.; Virmani, Y.P. Surface resistivity as an indicator of concrete chloride penetration resistance. In Proceedings of the Concrete Bridge Conference, St. Louis, MO, USA, 4–7 May 2008. [Google Scholar]
  102. AASHTO TP 95–14; Standard Test Method for Surface Resistivity Indication of Concrete’s Ability to Resist Chloride Ion Penetration. American Association of State Highway Transportation Officials (AASHTO): Washington, DC, USA, 2014.
  103. Rupnow, T.D.; Icenogle, P. Evaluation of Surface Resistivity Measurements as an Alternative to the Rapid Chloride Permeability Test for Quality Assurance and Acceptance; Louisiana Department of Transportation and Development: Baton Rouge, LA, USA, 2011. [Google Scholar]
  104. Tanesi, J.; Ardani, A. Surface Resistivity Test Evaluation as an Indicator of the Chloride Permeability of Concrete (FHWA-HRT-13-024); FHWA: McLean, VA, USA, 2012. [Google Scholar]
  105. Spragg, R.P.; Castro, J.; Nantung, T.; Paredes, M.; Weiss, J. Variability analysis of the bulk resistivity measured using concrete cylinders. Adv. Civ. Eng. Mater. 2012, 1, ACEM104596. [Google Scholar] [CrossRef]
  106. Elkeyand, W.; Sellevold, E.J. Electrical Resistivity of Concrete; Directorate of Public Roads-Norwegian Road Research Laboratory: Oslo, Norway, 1995. [Google Scholar]
  107. Spragg, R.; Bu, Y.; Snyder, K.; Bentz, D.; Weiss, J. Electrical Testing of Cement-Based Materials: Role of Testing Techniques, Sample Conditioning, and Accelerated Curing; FHWA, Indiana Department of Transportation: Indianapolis, IN, USA, 2013. [Google Scholar]
  108. Spragg, R.; Villani, C.; Snyder, K.; Bentz, D.; Bullard, J.; Weiss, J. Electrical Resistivity Measurements in Cementitious Systems: Observations of Factors that Influence the Measurements; Transportation Research Board: Washington, DC, USA, 2013; pp. 90–98. [Google Scholar]
  109. Jhatial, A.A.; Nováková, I.; Gjerløw, E. A Review on Emerging Cementitious Materials, Reactivity Evaluation and Treatment Methods. Buildings 2023, 13, 526. [Google Scholar] [CrossRef]
  110. Mousavinezhad, S.; Gonzales, G.J.; Toledo, W.K.; Garcia, J.M.; Newtson, C.M.; Allena, S. A Comprehensive Study on Non-Proprietary Ultra-High-Performance Concrete Containing Supplementary Cementitious Materials. Materials 2023, 16, 2622. [Google Scholar] [CrossRef]
  111. Mousavinezhad, S.; Garcia, J.M.; Toledo, W.K.; Newtson, C.M. A Locally Available Natural Pozzolan as a Supplementary Cementitious Material in Portland Cement Concrete. Buildings 2023, 13, 2364. [Google Scholar] [CrossRef]
  112. Newtson, C.; Mousavinezhad, S.; Gonzales, G.J.; Toledo, W.K.; Garcia, J.M. Alternative Supplementary Cementitious Materials in Ultra-High Performance Concrete. 2022. Available online: https://repository.lsu.edu/transet_pubs/145 (accessed on 15 May 2025).
  113. Song, H.W.; Pack, S.W.; Nam, S.H.; Jang, J.C.; Saraswathy, V. Estimation of the permeability of silica fume cement concrete, Constr. Build. Mater. 2010, 24, 315–321. [Google Scholar] [CrossRef]
  114. Hamada, H.M.; Abed, F.; Katman, H.Y.B.; Humada, A.M.; Al Jawahery, M.S.; Majdi, A.; Yousif, S.T.; Thomas, B.S. Effect of silica fume on the properties of sustainable cement concrete. J. Mater. Res. Technol. 2023, 24, 8887–8908. [Google Scholar] [CrossRef]
  115. Saha, A.K. Effect of class F fly ash on the durability properties of concrete. Sustain. Environ. Res. 2018, 28, 25–31. [Google Scholar] [CrossRef]
  116. Ezziane, K.; Bougara, A.; Kadri, A.; Khelafi, H.; Kadri, E. Compressive strength of mortar containing natural pozzolan under various curing temperature. Cem. Concr. Comp. 2007, 29, 587–593. [Google Scholar] [CrossRef]
  117. Lam, L.; Wong, M.O.; Poon, C.S. Degree of hydration and gel/space ratio of high-volume fly ash/cement systems. Cem. Concr. Res. 2000, 30, 747–756. [Google Scholar] [CrossRef]
  118. Ramezanianpour, A.A.; Pilvar, A.; Mahdikhani, M.; Moodi, F. Practical evaluation of relationship between concrete resistivity, water penetration, rapid chloride penetration and compressive strength. Constr. Build. Mater. 2011, 25, 2472–2479. [Google Scholar] [CrossRef]
  119. McGrath, P.; Hooton, R.D. Re-Evaluation of the AASHTO T259 90-Day Salt Ponding Test. Cem. Concr. Res. 1999, 29, 1239–1248. [Google Scholar] [CrossRef]
  120. Lane, D.S. Supplanting the Rapid Chloride Permeability Test with a Quick Measurement of Concrete Conductivity; Report VTRC 05-R22; Virginia Department of Transportation: Richmond, VA, USA, 2005. [Google Scholar]
  121. Fukute, T.; Hamada, H.; Mashimo, M.; Watanabe, Y. Chloride Permeability of High Strength Concrete Containing Various Admixtures. In Proceedings of the 4th International Symposium on the Utilization of High Strength/High Performance Concrete, Ecole Nationale des Ponts et Chaussees, Paris, France, 29–31 May 1996; pp. 489–498. [Google Scholar]
  122. El Dieb, A.S. Evaluating Concrete Durability using Simple Non-Destructive Test Towards Performance-Based Specification. MOJ Civ. Eng. 2018, 4, 100–102. [Google Scholar] [CrossRef]
  123. Chini, A.R.; Muszynski, L.C.; Hicks, J. Determination of Acceptance Permeability Characteristics for Performance-Related Specifications for Portland Cement Concrete; Florida Department of Transportation Report: Tallahassee, FL, USA, 2003. [Google Scholar]
  124. Pilvar, A.; Ramezanianpour, A.A.; Rajaie, H. New method development for evaluation concrete chloride ion permeability. Constr. Build. Mater. 2015, 93, 790–797. [Google Scholar] [CrossRef]
  125. Dhanya, B.S.; Santhanam, M. Performance evaluation of rapid chloride permeability test in concretes with supplementary cementitious materials. Mater. Struct. 2017, 50, 67. [Google Scholar] [CrossRef]
  126. Bagheri, A.; Zanganeh, H.; Alizadeh, H.; Shakerinia, M.; Marian, M.A.S. Comparing the performance of fine fly ash and silica fume in enhancing the properties of concretes containing fly ash. Constr. Build. Mater. 2013, 47, 1402–1408. [Google Scholar] [CrossRef]
  127. Dhandapani, Y.; Sakthivel, T.; Santhanam, M.; Gettu, R.; Pillai, R.G. Mechanical properties and durability performance of concretes with Limestone Calcined Clay Cement (LC3). Cem. Concr. Res. 2018, 107, 136–151. [Google Scholar] [CrossRef]
  128. Gilan, S.S.; Jovein, H.B.; Ramezanianpour, A.A. Hybrid support vector regression—Particle swarm optimization for prediction of compressive strength and RCPT of concretes containing metakaolin. Constr. Build. Mater. 2012, 34, 321–329. [Google Scholar] [CrossRef]
  129. Ramezanianpour, A.A.; Jovein, H.B. Influence of metakaolin as supplementary cementing material on strength and durability of concretes. Constr. Build. Mater. 2012, 30, 470–479. [Google Scholar] [CrossRef]
  130. Ramezanianpour, A.A.; Karein, S.M.M.; Vosoughi, P.; Pilvar, A.; Isapour, S.; Moodi, F. Effects of calcined perlite powder as a SCM on the strength and permeability of concrete. Constr. Build. Mater. 2014, 66, 222–228. [Google Scholar] [CrossRef]
  131. Newtson, C.; Weldon, B.; Garcia, J.; Mousavinezhad, S.; Toledo, W. Durability of Concrete Produced with Alternative Supplementary Cementitious Material. 2021. Available online: https://repository.lsu.edu/transet_pubs/109 (accessed on 15 May 2025).
  132. Gudimettla, J.; Crawford, G. Resistivity Tests for Concrete—Recent Field Experience. ACI Mater. J. 2016, 113, 505–512. [Google Scholar] [CrossRef]
  133. Ryan, E.; Burdette, E.; Ankabrandt, R.; Nidiffer, R.; Buchanan, B. Comparison of Two Methods to Assess the Resistance of Concrete to Chloride Ion Penetration. J. Mater. Civ. Eng. (ASCE) 2013, 26, 698–704. [Google Scholar] [CrossRef]
  134. Jenkins, A. Surface Resistivity as an Alternative for Rapid Chloride Permeability Test of Hardened Concrete. 2015. Available online: https://rosap.ntl.bts.gov/view/dot/28687 (accessed on 10 October 2025).
  135. Han, F.; Wang, J.; Ji, X.; Chen, S.; Liu, J.; Wu, M.; Liu, J. Insights into the hydration kinetics and microstructural evolution of ultra-high performance cementitious composite at mid-to-low curing temperatures. Constr. Build. Mater. 2025, 468, 140403. [Google Scholar] [CrossRef]
  136. Wang, L.; Zhou, S.; Shi, Y.; Huang, Y.; Zhao, F.; Huo, T.; Tang, S. The Influence of Fly Ash Dosages on the Permeability, Pore Structure and Fractal Features of Face Slab Concrete. Fractal Fract. 2022, 6, 476. [Google Scholar] [CrossRef]
  137. Mohsen, M.O.; Aburumman, M.O.; Al Diseet, M.M.; Taha, R.; Abdel-Jaber, M.; Senouci, A.; Abu Taqa, A. Fly Ash and Natural Pozzolana Impacts on Sustainable Concrete Permeability and Mechanical Properties. Buildings 2023, 13, 1927. [Google Scholar] [CrossRef]
  138. Akid, A.S.M.; Hossain, S.; Munshi, M.I.U.; Elahi, M.M.A.; Sobuz, M.H.R.; Tam, V.W.Y.; Islam, M.S. Assessing the influence of fly ash and polypropylene fiber on fresh, mechanical and durability properties of concrete. J. King Saud Univ.-Eng. Sci. 2021, 35, 474–484. [Google Scholar] [CrossRef]
  139. Bogă, A.R.; Topçu, I.B. Influence of fly ash on corrosion resistance and chloride ion permeability of concrete. Constr. Build. Mater. 2012, 31, 258–264. [Google Scholar] [CrossRef]
  140. Liu, J.; Ou, G.; Qiu, Q.; Chen, X.; Hong, J.; Xing, F. Chloride transport and microstructure of concrete with/without fly ash under atmospheric chloride condition. Constr. Build. Mater. 2017, 146, 493–501. [Google Scholar] [CrossRef]
  141. Kizilkanat, A.B.; Oktay, D.; Kabay, N.; Tufekci, M.M. Comparative experimental study of mortars incorporating pumice powder or fly ash. J. Mater. Civ. Eng. 2016, 28, 04015119. [Google Scholar] [CrossRef]
  142. Zhao, Y.; Chen, X.; Wang, Z.; Zhang, Y.; Leng, Y. An experimental study on the influence of fly ash and crumb rubber on the mechanical property and permeability of Engineered Cementitious Composite (ECC). J. Build. Eng. 2023, 76, 106998. [Google Scholar] [CrossRef]
  143. Wu, K.; Shi, H.S.; Xu, L.L.; Ye, G.; De Schutter, G. Microstructural characterization of ITZ in blended cement concretes and its relation to transport properties. Cem. Concr. Res. 2016, 79, 243–256. [Google Scholar] [CrossRef]
  144. Tang, L. Guidelines for Practical Use of Methods for Testing the Resistance of Concrete to Chloride Ingress; Chlortest, Report D23; SP Swedish National Testing and Research Institute: Borås, Sweden, 2005. [Google Scholar]
  145. Yazıcı, H.; Yigiter, H.; Karabulut, A.S.; Baradan, B. Utilization of Fly Ash and Ground Granulated Blast Furnace Slag as an Alternative Silica Source in Reactive Powder Concrete. Fuel 2008, 87, 2401–2407. [Google Scholar] [CrossRef]
  146. Sutter, L.L. Supplementary Cementitious Materials—Best Practices for Concrete Pavements; FHWA, U.S. Department of Transportation: Washington, DC, USA, 2016.
  147. Chen, W.; Wu, M.; Liang, Y. Effect of SF and GGBS on Pore Structure and Transport Properties of Concrete. Materials 2024, 17, 1365. [Google Scholar] [CrossRef] [PubMed]
  148. Duan, P.; Shui, Z.; Chen, W.; Shen, C. Enhancing Microstructure and Durability of Concrete from Ground Granulated Blast Furnace Slag and Metakaolin as Cement Replacement Materials. J. Mater. Res. Technol. 2013, 2, 52–59. [Google Scholar] [CrossRef]
  149. Shen, D.; Jiao, Y.; Gao, Y.; Zhu, S.; Jiang, G. Influence of Ground Granulated Blast Furnace Slag on Cracking Potential of High Performance Concrete at Early Age. Constr. Build. Mater. 2020, 241, 117839. [Google Scholar] [CrossRef]
  150. Ozturk, M.; Karaaslan, M.; Akgol, O.; Sevim, U.K. Mechanical and Electromagnetic Performance of Cement Based Composites Containing Different Replacement Levels of Ground Granulated Blast Furnace Slag, Fly Ash, Silica Fume and Rice Husk Ash. Cem. Concr. Res. 2020, 136, 106177. [Google Scholar] [CrossRef]
  151. Öner, M.; Erdoğdu, K.; Günlü, A. Effect of Components Fineness on Strength of Blast Furnace Slag Cement. Cem. Concr. Res. 2003, 33, 463–469. [Google Scholar] [CrossRef]
  152. Ding, Q.; Yang, J.; Hou, D.; Zhang, G. Insight on the Mechanism of Sulfate Attacking on the Cement Paste with Granulated Blast Furnace Slag: An Experimental and Molecular Dynamics Study. Constr. Build. Mater. 2018, 169, 601–611. [Google Scholar] [CrossRef]
  153. Elahi, M.M.A.; Shearer, C.R.; Reza, A.N.R.; Saha, A.K.; Khan, M.N.N.; Hossain, M.M.; Sarker, P.K. Improving the Sulfate Attack Resistance of Concrete by Using Supplementary Cementitious Materials (SCMs): A Review. Constr. Build. Mater. 2021, 281, 122628. [Google Scholar] [CrossRef]
  154. Kosmatka, S.H.; Wilson, M.L. Design and Control of Concrete Mixtures, 15th ed.; Portland Cement Association: Washington, DC, USA, 2011. [Google Scholar]
  155. Richard, P.; Cheyrezy, M. Composition of Reactive Powder Concretes. Cem. Concr. Res. 1995, 25, 1501–1511. [Google Scholar] [CrossRef]
  156. Soliman, N.A.; Tagnit-Hamou, A. Partial substitution of silica fume with fine glass powder in UHPC: Filling the micro gap. Constr. Build. Mater. 2017, 139, 374–383. [Google Scholar] [CrossRef]
  157. American Coal Ash Association (ACAA). Fly Ash Use in Concrete Increases Slightly as Overall Coal Ash Recycling Rate Declines. Available online: https://acaa-usa.org (accessed on 10 July 2025).
  158. Bentz, D.P. Influence of silica fume on diffusivity in cement-based materials: II. Multi-scale modeling of concrete diffusivity. Cem. Concr. Res. 2000, 30, 1121–1129. [Google Scholar] [CrossRef]
  159. Wally, G.B.; Magalhães, F.C.; Sell Junior, F.K. Estimating service life of reinforced concrete structures with binders containing silica fume and metakaolin under chloride environment: Durability indicators and probabilistic assessment. Mater. Struct. 2021, 54, 98. [Google Scholar] [CrossRef]
  160. Sabir, B.B.; Wild, S.; Bai, J. Metakaolin and calcined clays as pozzolans for concrete: A review. Cem. Concr. Comp. 2001, 23, 441–454. [Google Scholar] [CrossRef]
  161. Rashad, A.M. Metakaolin as cementitious material: History, scours, production and composition—A comprehensive overview. Constr. Build. Mater. 2013, 41, 303–318. [Google Scholar] [CrossRef]
  162. Al-Hashem, M.N.; Amin, M.N.; Ajwad, A.; Afzal, M.; Khan, K.; Faraz, M.I.; Qadir, M.G.; Khan, H. Mechanical and Durability Evaluation of Metakaolin as Cement Replacement Material in Concrete. Materials 2022, 15, 7868. [Google Scholar] [CrossRef] [PubMed]
Figure 1. Illustration of water absorption showing the sequential filling of capillary pores (1–4) in the initial absorption phase and the subsequent filling of entrained and entrapped air voids during secondary absorption (5–8). (Adopted from [29]).
Buildings 15 04216 g001
Figure 2. Surface resistivity test configuration.
Buildings 15 04216 g002
Figure 3. Correlation between RCPT and SRT results for concrete specimens with different strength levels, ages, and SCMs [85,103,104,107,110,111,118,122,123,124,125,126,127,128,129,130,131,132,133,134].
Buildings 15 04216 g003
Figure 4. Correlation between RCPT and SRT results for concrete specimens with different strength levels at 28 days [104,123,131].
Buildings 15 04216 g004
Figure 5. Correlation between RCPT and SRT results for concrete specimens with different strength levels at later ages (56, 91, and 180 days) [110,111,123].
Buildings 15 04216 g005
Figure 6. Correlation between RCPT and SRT results for concrete specimens with different testing ages [110,111,123,131,132,133,134].
Buildings 15 04216 g006
Figure 7. RCPT estimation based on 14-, 28-, and 56-day SRT results [103].
Buildings 15 04216 g007
Figure 8. Correlation between 28-day RCPT and SRT results for concrete specimens with fly ash [123].
Buildings 15 04216 g008
Figure 9. Correlation between 91-day RCPT and SRT results for concrete specimens with fly ash [123].
Buildings 15 04216 g009
Figure 10. Correlation between 28-day RCPT and SRT results for concrete specimens with GGBFS [123].
Buildings 15 04216 g010
Figure 11. Correlation between 91-day RCPT and SRT results for concrete specimens with GGBFS [123].
Buildings 15 04216 g011
Figure 12. Correlation between 28-day RCPT and SRT results for concrete specimens with silica fume [123].
Buildings 15 04216 g012
Figure 13. Correlation between 91-day RCPT and SRT results for concrete specimens with silica fume [123].
Buildings 15 04216 g013
Table 1. RCPT interpretation [78].
Chloride Ion PenetrabilityRCPT (Total Charge Passed)
(Coulombs)
High>4000
Moderate2000–4000
Low1000–2000
Very Low100–1000
Negligible<100
Table 2. Surface resistivity test interpretation [98].
Chloride Ion PenetrabilitySurface Resistivity Test
kΩ-cm
High>4000
Moderate2000–4000
Low1000–2000
Very Low100–1000
Negligible<100
Table 3. Summary of RCPT-SRT correlation data [85,103,104,107,110,111,118,122,123,124,125,126,127,128,129,130,131,132,133,134].
Author(s)YearEquationR2Compressive Strength
(MPa)
Testing Age
(Days)
w/c RaioSCM Type
(Where Applicable)
Mousavinezhad et al.2024 R C P T = 1757.1   ×   S R T 0.663 0.82126.4 (average)560.14 (ultra-high-performance concrete)Varying (FA, GGBFS, SF, and Metakaolin)
Mousavinezhad et al.2023 R C P T = 154,500,000   ×   S R T 3.58 0.8035.0 (average)1800.35Varying (NP and FA)
Newtson et al.2021 R C P T = 1566.7   ×   S R T 0.478 -35.0 (average)280.35Varying (NP and FA)
El Dieb2018 R C P T = 26,068   ×   S R T 1.097 0.951925–8028 and 900.34–0.61Ceramic Waste Powder
Gudimettla and Crawford2016 R C P T = 335,260.8   ×   S R T 1.6 0.89-560.37–45Varying (FA and GGBFS)
Gudimettla and Crawford2016 R C P T = 250,744.8   ×   S R T 1.82 0.47-280.37–45Varying (FA and GGBFS)
Ramezanianpour et al.2014 R C P T = 89,912   ×   S R T 1.12 0.9847.0 (average)7, 28, and 910.35 and 0.45Calcined Perlite
Spragg et al.2013 R C P T = 20,700   ×   S R T 1.0 --7 and 91--
Ryan et al.2013 R C P T = 209,093.9   ×   S R T 1.53 0.88236.928 and 56--
Ryan et al.2013 R C P T = 183,208   ×   S R T 1.524 0.84136.956--
Ramezanianpour et al.2012 R C P T = 6454   ×   S R T 0.04 0.92-7, 28, 90, and 1800.35, 0.4, and 0.5Metakaolin
Tanesi and Ardani2012 R C P T = 98,441   ×   S R T 1.35 0.9235.0 (average)280.37–0.47Varying (FA, GGBFS)
Rupnow and Icenogle2011 R C P T = 29,647   ×   S R T 0.944 0.8922-560.35, 0.50, and 0.65Varying (FA, GGBFS, SF)
Rupnow and Icenogle2011 R C P T = 33,534   ×   S R T 1.074 0.87-56 (using 28 SRT results)0.35, 0.50, and 0.65Varying (FA, GGBFS, SF)
Rupnow and Icenogle2011 R C P T = 31,242   ×   S R T 0.962 0.8024-56 (using 14 SRT results)0.35, 0.50, and 0.65Varying (FA, GGBFS, SF)
Ramezanianpour et al.2011 R C P T = 50,219   ×   S R T 0.9728 0.897747.0 (average)28–890 0.4, 0.45, 0.5, 0.55, and 0.6Varying (NPs, RHA, SF, …)
Chini et al.2003 R C P T = 10,442   ×   S R T 0.819 0.948123.4–58.628-Varying (FA, GGBFS, SF)
Chini et al.2003 R C P T = 16,351   ×   S R T 0.8754 0.940623.428-Varying (FA, GGBFS)
Chini et al.2003 R C P T = 2156   ×   S R T 0.6463 0.784623.428-FA
Chini et al.2003 R C P T = 148,414   ×   S R T 1.1625 0.865323.428-GGBFS
Chini et al.2003 R C P T = 8402   ×   S R T 0.7869 0.94827.628-Varying (FA, GGBFS)
Chini et al.2003 R C P T = 9824   ×   S R T 0.8054 0.78827.628-FA
Chini et al.2003 R C P T = 5989   ×   S R T 0.742 0.831427.628-GGBFS
Chini et al.2003 R C P T = 12,670   ×   S R T 0.8246 0.954431.028-Varying (FA, GGBFS)
Chini et al.2003 R C P T = 7898   ×   S R T 0.7891 0.873131.028-FA
Chini et al.2003 R C P T = 5637   ×   S R T 0.7312 0.545831.028-GGBFS
Chini et al.2003 R C P T = 11,713   ×   S R T 0.8282 0.930637.928-Varying (FA, GGBFS, SF)
Chini et al.2003 R C P T = 11,713   ×   S R T 0.8288 0.930637.928-FA
Chini et al.2003 R C P T = 6718   ×   S R T 0.7532 0.860337.928-GGBFS
Chini et al.2003 R C P T = 12,816   ×   S R T 0.9194 0.967437.928-SF
Chini et al.2003 R C P T = 9152   ×   S R T 0.8073 0.972641.428-Varying (FA, SF)
Chini et al.2003 R C P T = 20,808   ×   S R T 0.9047 0.831841.428-FA
Chini et al.2003 R C P T = 7737   ×   S R T 0.7843 0.920841.428-SF
Chini et al.2003 R C P T = 18,534   ×   S R T 0.8868 0.959144.828-Varying (FA, GGBFS, SF)
Chini et al.2003 R C P T = 1639   ×   S R T 0.5995 0.641258.628-Varying (FA, GGBFS, SF)
Chini et al.2003 R C P T = 19,457   ×   S R T 0.9057 0.932123.4–58.691-Varying (FA, GGBFS, SF)
Chini et al.2003 R C P T = 9847   ×   S R T 0.8161 0.898523.491-Varying (FA, GGBFS)
Chini et al.2003 R C P T = 4156   ×   S R T 0.7055 0.812123.491-FA
Chini et al.2003 R C P T = 40,898   ×   S R T 1.0122 0.919323.491-GGBFS
Chini et al.2003 R C P T = 6639   ×   S R T 0.7591 0.68627.691-Varying (FA, GGBFS)
Chini et al.2003 R C P T = 6487   ×   S R T 0.7641 0.727927.691-FA
Chini et al.2003 R C P T = 3665   ×   S R T 0.6742 0.583727.691-GGBFS
Chini et al.2003 R C P T = 21,127   ×   S R T 0.9188 0.874931.091-Varying (FA, GGBFS)
Chini et al.2003 R C P T = 18,811   ×   S R T 0.9043 0.847931.091-FA
Chini et al.2003 R C P T = 2931   ×   S R T 0.6414 0.478331.091-GGBFS
Chini et al.2003 R C P T = 41,237   ×   S R T 1.0061 0.870837.991-Varying (FA, GGBFS, SF)
Chini et al.2003 R C P T = 26,849   ×   S R T 0.9509 0.911537.991-FA
Chini et al.2003 R C P T = 51,594   ×   S R T 1.0357 0.856237.991-GGBFS
Chini et al.2003 R C P T = 77,888   ×   S R T 1.0832 0.964937.991-SF
Chini et al.2003 R C P T = 27,707   ×   S R T 0.9549 0.958341.491-Varying (FA, SF)
Chini et al.2003 R C P T = 36,405   ×   S R T 0.9924 0.82441.491-FA
Chini et al.2003 R C P T = 8679   ×   S R T 0.7735 0.870541.491-SF
Chini et al.2003 R C P T = 39,366   ×   S R T 1.0063 0.978744.891-Varying (FA, GGBFS, SF)
Chini et al.2003 R C P T = 29,121   ×   S R T 0.9665 0.88858.691-Varying (FA, GGBFS, SF)
Disclaimer/Publisher’s Note: The statements, opinions and data contained in all publications are solely those of the individual author(s) and contributor(s) and not of MDPI and/or the editor(s). MDPI and/or the editor(s) disclaim responsibility for any injury to people or property resulting from any ideas, methods, instructions or products referred to in the content.