Article

Construction Control of Long-Span Combined Rail-Cum-Road Continuous Steel Truss Girder Bridge of High-Speed Railway

1
CCCC Second Harbor Engineering Company Ltd., Wuhan 430040, China
2
State Key Laboratory of Safety and Resilience of Civil Engineering in Mountain Area, East China Jiaotong University, Nanchang 330013, China
*
Author to whom correspondence should be addressed.
Buildings 2025, 15(22), 4204; https://doi.org/10.3390/buildings15224204
Submission received: 8 October 2025 / Revised: 12 November 2025 / Accepted: 14 November 2025 / Published: 20 November 2025
(This article belongs to the Special Issue Application of Experiment and Simulation Techniques in Engineering)

Abstract

The construction of long-span continuous steel truss rail-cum-road bridges for high-speed railways presents significant challenges, primarily due to structural complexity, stringent deformation tolerances, and intricate construction sequences. This paper presents a comprehensive construction control methodology developed and implemented for such bridges. Using a real-world bridge project in China as a case study, the methodology integrates mechanical analysis of key construction stages, deformation prediction, real-time monitoring, and adjustment techniques. Furthermore, the application of machine learning (ML) for camber prediction is explored. Key findings indicate that the longitudinal displacement (X-direction) of the top chord at the upper-deck closure segment is highly sensitive to temperature variations, with a differential of about 10–12 mm observed under a 15 °C temperature change. Consequently, closure welding is recommended near the design reference temperature, with field measurements guiding final fit-up adjustments. A comparative analysis between ML predictions and theoretical methods for member elongation revealed that the Extra Trees (ET) model and K-Nearest Neighbors (KNN) model achieved excellent accuracy, with errors within 2 mm, demonstrating the feasibility of ML-based camber setting. The proposed integrated approach, combining finite element analysis, real-time monitoring, and detailed sensitivity analysis of closure accuracy, proves effective in ensuring structural safety and meeting precise alignment requirements, particularly for high-speed railway track. The findings offer valuable insights for the construction control of similar long-span steel truss rail-cum-road bridges.

1. Introduction

Rail-cum-road bridges are frequently built in densely populated urban areas requiring connections for both railway and highway networks in order to reduce costs and accelerate construction schedules [1]. Their design must account for stringent structural and bearing capacity requirements due to the superimposed effects of dual-loading scenarios [2]. Steel truss bridges, owing to their advantageous strength-to-weight ratio, structural efficiency, and high rigidity, are particularly well-suited for such large-scale rail-cum-road bridges crossings over rivers, straits, or other significant obstacles [3,4]. Their characteristics make them particularly suitable for double-deck configurations, especially for long-span combined rail-cum-road bridges [5], which effectively segregate railway tracks and road lanes onto distinct levels, significantly enhancing operational safety—as demonstrated by major crossings like the Wuhan Yangtze River Bridge and the Nanjing Yangtze River Bridge in China [6,7]. Nevertheless, the complexities of design and construction control for these bridges remain substantial challenges [8].
With the rapid development of high-speed railway (HSR) in China in recent years, high-speed railway and highway often use combined rail-cum-road bridges to save resources and protect the environment. However, the construction of such bridges introduces significant complexities. The inherent flexibility of long-span continuous girders makes them highly sensitive to construction sequences, environmental loads (wind, temperature), material properties, and erection tolerances. The integration of both railway and road decks, often with distinct stiffness characteristics and loading requirements, introduces asymmetric loading effects and complex structural behavior during staged construction. Crucially, the high-speed railway deck demands exceptionally strict geometric control (sub-millimeter-level alignment tolerances) to ensure ride safety, stability, and passenger comfort. Traditional construction methods often fall short in guaranteeing these stringent requirements throughout the inherently variable erection process, which makes the construction control more difficult than the conventional rail-cum-road bridges. Therefore, sophisticated construction control systems are paramount.
At present, the construction methods of steel truss bridges mainly include cantilever assembly construction [9,10,11] and ILM (incremental launching method) construction [12,13,14,15]. Scholars have studied the mechanical characteristics and construction control method of steel truss girder bridges [16,17,18]. Liu [19] discusses the design, analysis, and construction of a steel truss bridge over water under high water level and rapid flow conditions. Zhao [20] investigates the longitudinal behaviors and girder end reliability of a jointless steel truss arch railway bridge in operation. Chen et al. [21] studied a steel truss bridge under construction subjected to sudden member breakages with an extensive monitoring system. Sun et al. [22] proposed a multi objective optimization method for determining the launching construction parameters of bridges while considering local stress constraints and showed that the construction parameters can affect the trade-off between the cost and the shape results. Yu et al. [23] studied the key issues of ILM construction of a steel truss bridge associated with structural design, including disconnections in stringers. Aksar et al. [24] examined the combined behavior of steel and masonry materials and investigated the structural behavior of steel truss and masonry bridge interaction. Tran et al.’s [25] study presented and tested a comprehensive solution on an actual steel truss bridge. To determine and quantify the damage from the steel truss bridge, efforts were made to combine artificial neural network and vibration measurement results. Wang et al. [26] investigate the temperature field and response of a double-layer steel truss continuous girder under shielding effects using an advanced numerical simulation model. Li et al. [27] conducted a mechanical analysis of the key nodes of a steel truss bridge under construction and evaluated the feasibility and safety of the ILM construction of the large steel truss bridge. Lou et al. [28] analyzed mechanical behavior during ILM construction, noting variations in the static–dynamic friction coefficient at slide beam interfaces. Chen et al. [29] performed detailed finite element analysis on node plate stresses during the critical cantilever assembly stage.
The mechanical characteristics of long-span combined rail-cum-road continuous steel truss bridges during construction are highly sensitive to environmental factors (e.g., temperature variations), construction loads, foundation settlements, and other uncertainties. The controlling of internal forces and geometry during the construction of high-speed railway rail-cum-road steel truss bridges remains relatively scarce. The application of real-time online monitoring for feedback and control during the construction process has not been largely explored for construction control for these types of bridges, and the influence of ambient temperature on alignment errors during the installation has not been deeply investigated. Consequently, it is necessary to research these specific aspects of construction control for this bridge type. Hence, in this paper, taking the construction of a (78 + 134 + 152 + 134 + 78) m continuous steel truss girder bridge in the Nanchang Yangtze Ganjiang River combined rail-cum-road bridge of the Beijing–Hong Kong High-Speed Railway as case study, the construction control strategies through pre-camber control, closure segment control, and real-time online monitoring are investigated based on the mechanical analysis of the construction process, and a comprehensive method for construction control of this bridge type is ultimately proposed to enhance the precision and efficiency of bridge construction control.

2. Engineering Background

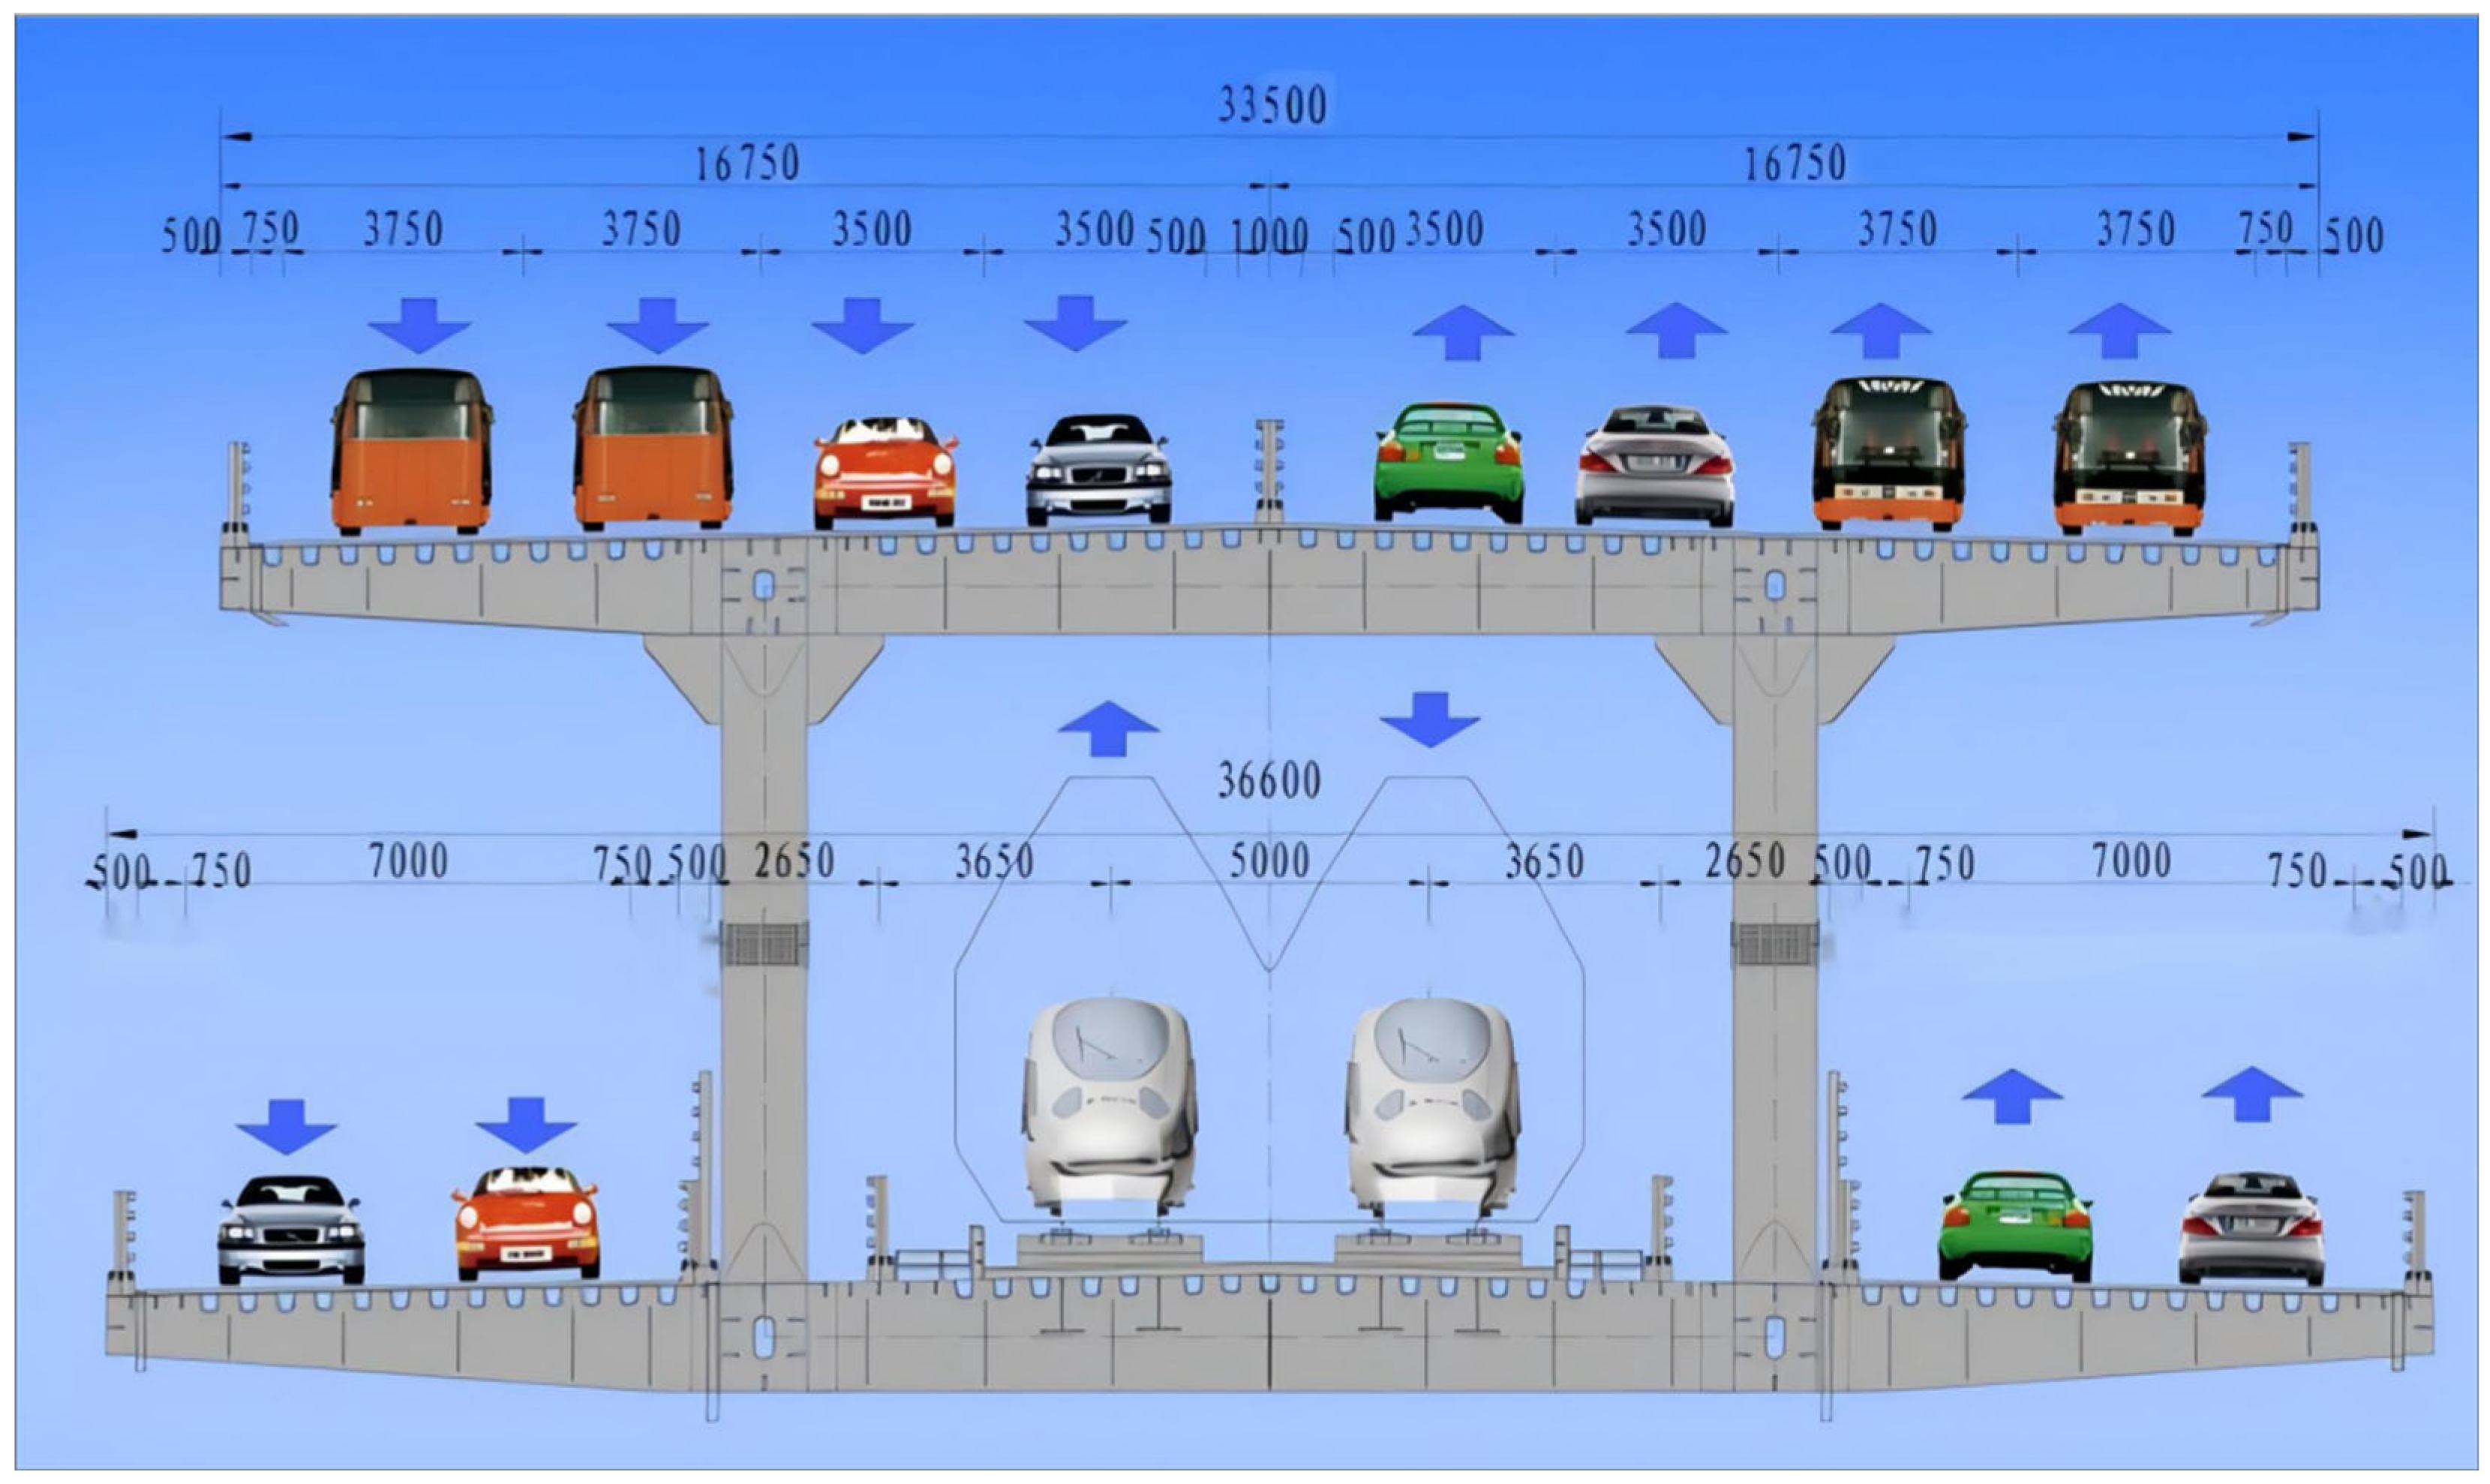
This study focuses on the construction control of a representative long-span continuous steel truss girder rail-cum-road bridge designed for high-speed railway operation, which is a (78 + 134 + 152 + 134 + 78) m steel truss continuous girder bridge serving as a critical shared crossing for the Beijing–Hong Kong High-Speed Railway and the city road of Nanchang City. This large-span integrated structure accommodates three distinct traffic modes: high-speed rail, an urban expressway, and an urban arterial road, as shown in Figure 1. The bridge features a two-level configuration: the upper level carries an eight-lane urban expressway, and the lower level accommodates dual-track high-speed railway and a four-lane urban arterial road. The superstructure employs a triangular Warren truss pattern. Key structural parameters include the following:
Local Geological Conditions: The bridge site is located within the middle branch of the Ganjiang River, where the channel width is approximately 500 m. The subsurface strata at the bridge location and support foundation primarily consist of silty clay, fine sand, fine rounded gravelly soil, and argillaceous sandstone in sequential order. The riverbed overburden is relatively shallow, with underlying bedrock composed of argillaceous sandstone at depths ranging from approximately 4.2 m to 8.5 m.
Truss Configuration: The steel truss girder of the bridge adopts a plate–truss combined section with an upper and lower boom, and a section of the steel truss girder is shown in Figure 2. The two main trusses are spaced at 15.9 m centers, and the standard panel lengths are 12 m and 13 m.
Fabrication and Erection Methodology: To meet the lifting requirements for both deck levels, the main truss was designed for integrated unit lifting. Each unit combines upper chord members and the corresponding segment of the upper deck system, with a transverse width of 36.6 m, and lower chord members and the corresponding segment of the lower deck system, with a transverse width of 33.5 m.
HSR Track Section (Within Lower Deck): The track bed plate is 16 mm thick and is stiffened by a combination of flat stiffeners (200 mm × 18 mm, spaced at 320 mm), “U” stiffeners (300 mm width, 280 mm height, 8 mm thickness, spaced at 600 mm), and T-shaped longitudinal rail girders positioned directly beneath each rail line.
Construction Methodology: The main bridge superstructure was erected using the “floating crane supported on in situ temporary trestles” method. The key construction sequence was as follows:
Prefabrication and Delivery: All steel components for the hybrid plate–truss girders, including the orthotropic deck systems, were manufactured, trial-assembled, and pre-fitted in the fabrication plant. Components were then transported to the site in batches according to the erection schedule.
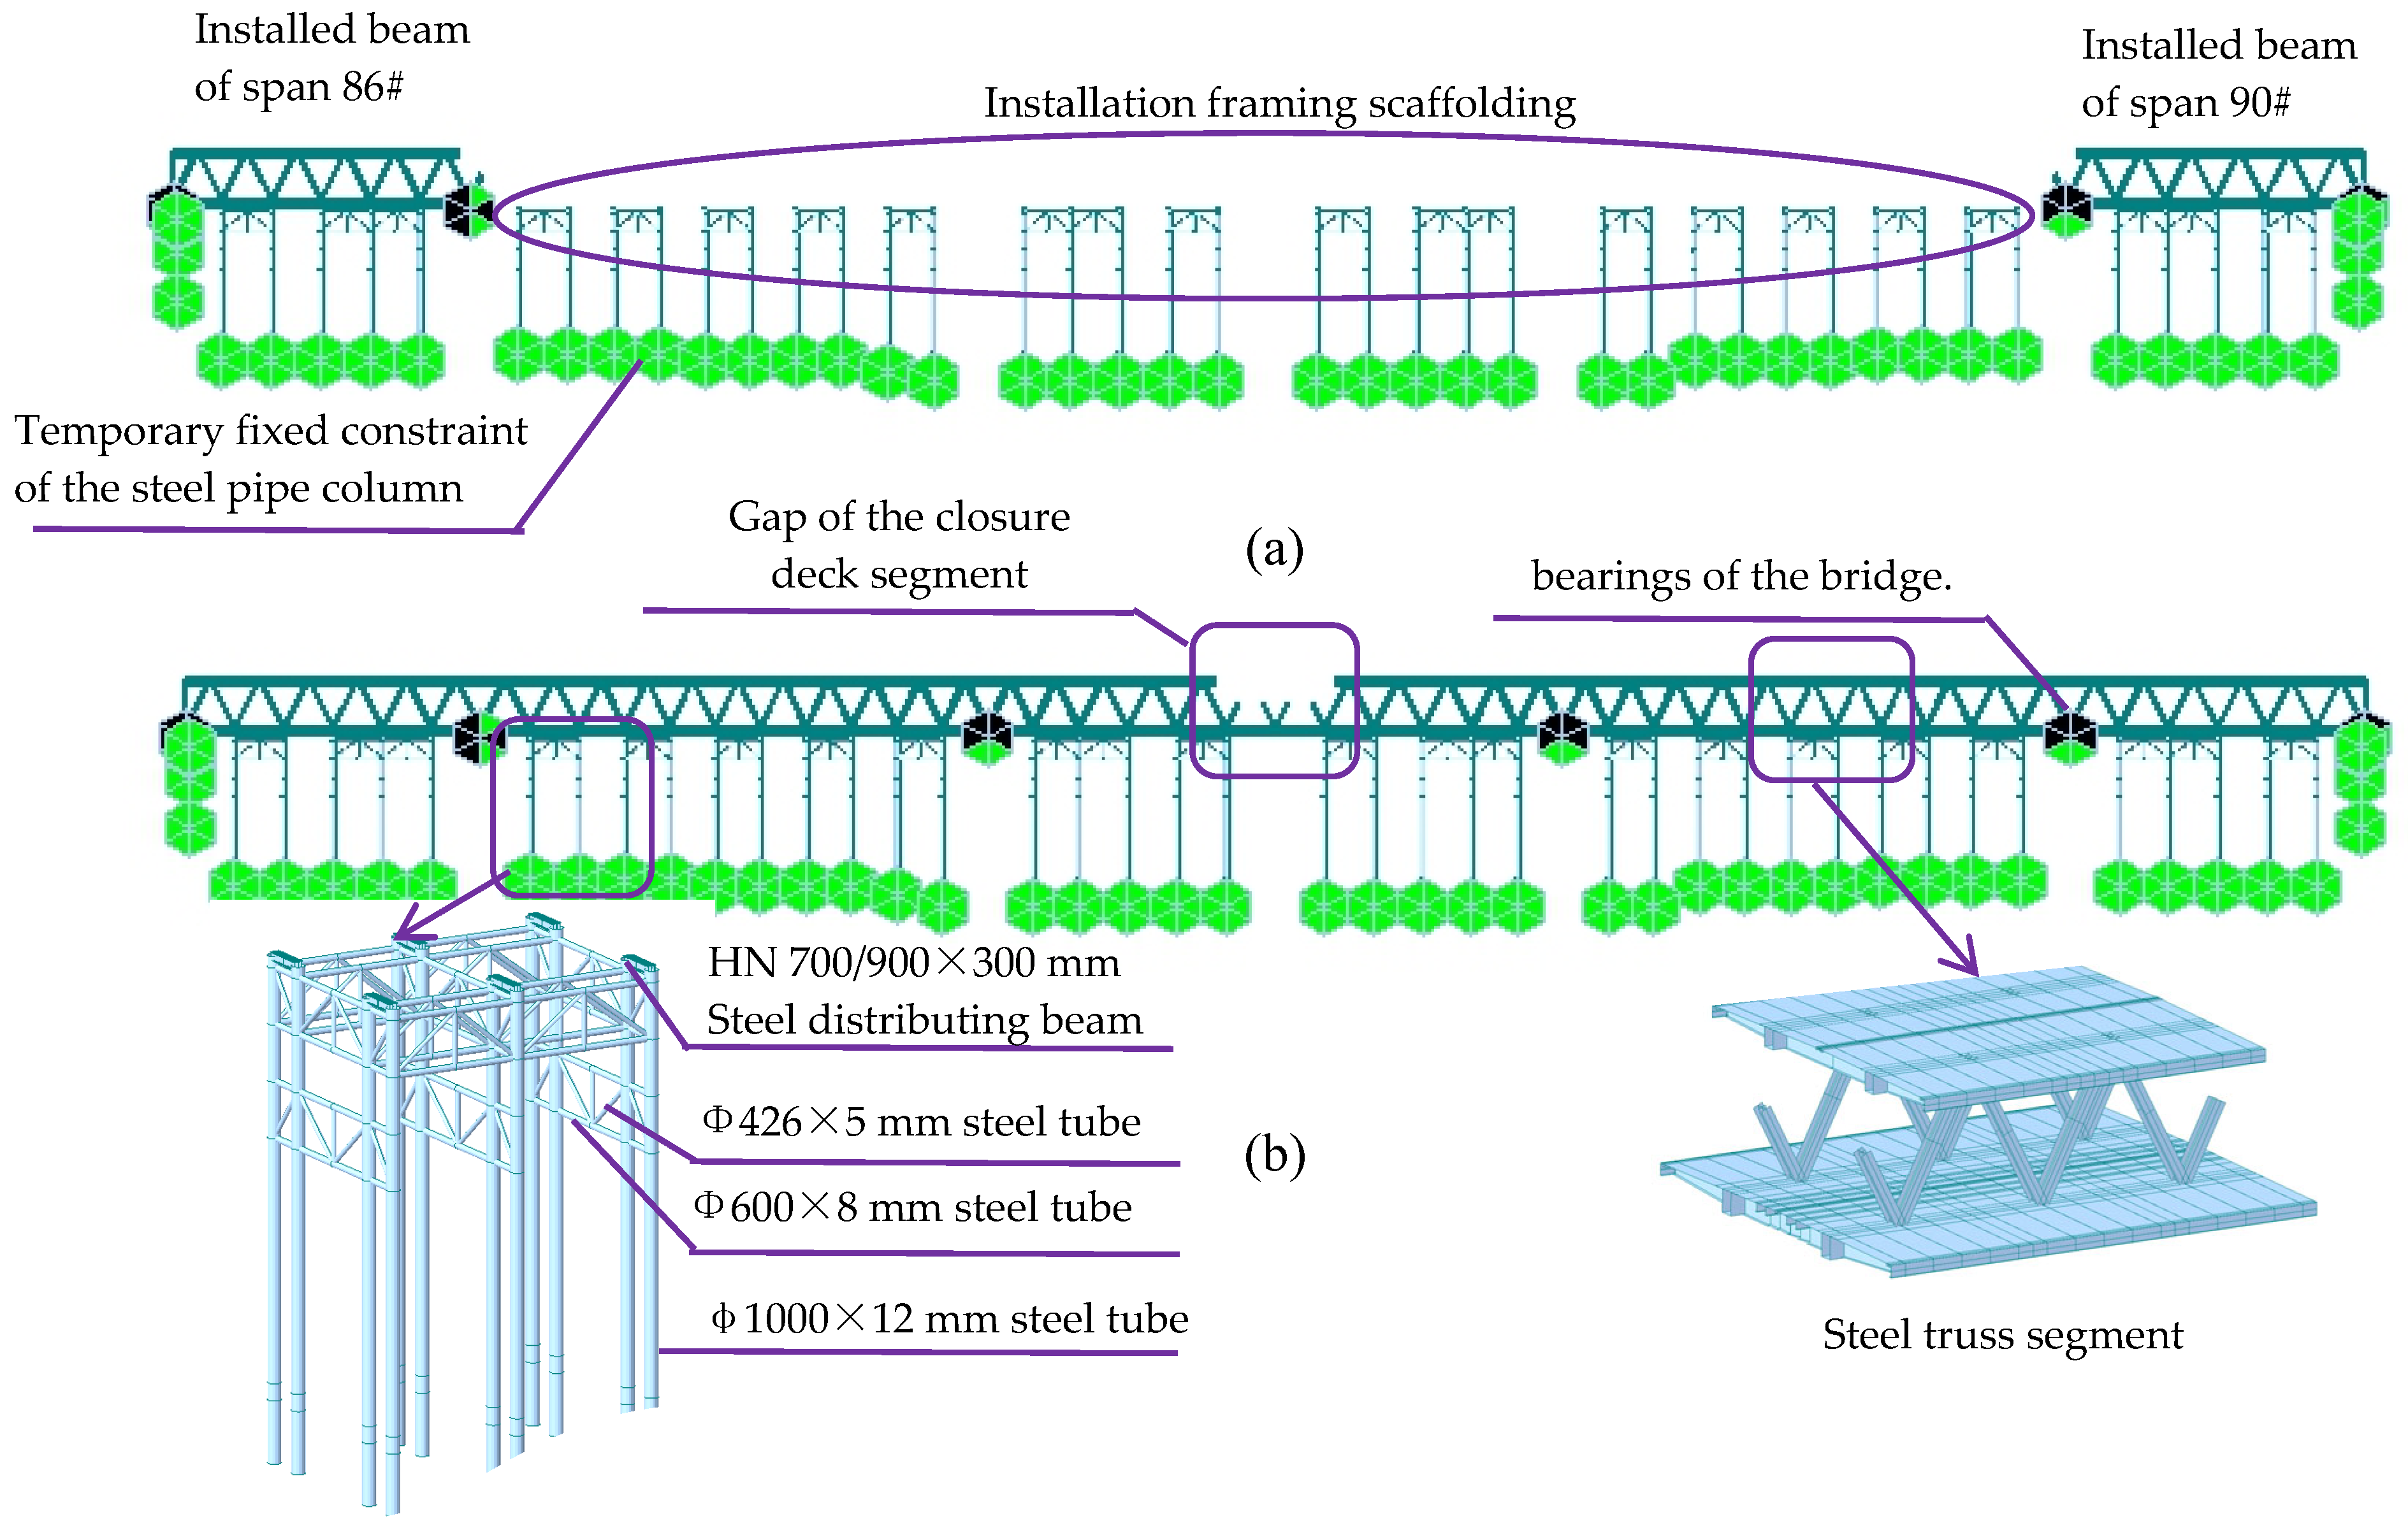
Temporary Support System: A system of temporary trestle piers were erected directly beneath the lower chord panel points along the entire bridge length (Figure 3). These trestles provided the primary support framework for the sequential assembly of the steel truss units. A 26 m navigation channel was maintained within the main span throughout construction. Heavy-duty hydraulic jacks positioned atop the main piers and temporary trestles were employed to adjust the elevation and rotation (pitch) of the existing truss ends. The temporary supports for the bridge utilized steel pipe end-bearing piles installed by embedding the piles approximately 3 m into the argillaceous sandstone bedrock to prevent steel pipe settlement. Based on the geotechnical investigation report, the recommended allowable bearing capacity of the bedrock at the pile tip is 450 kPa.
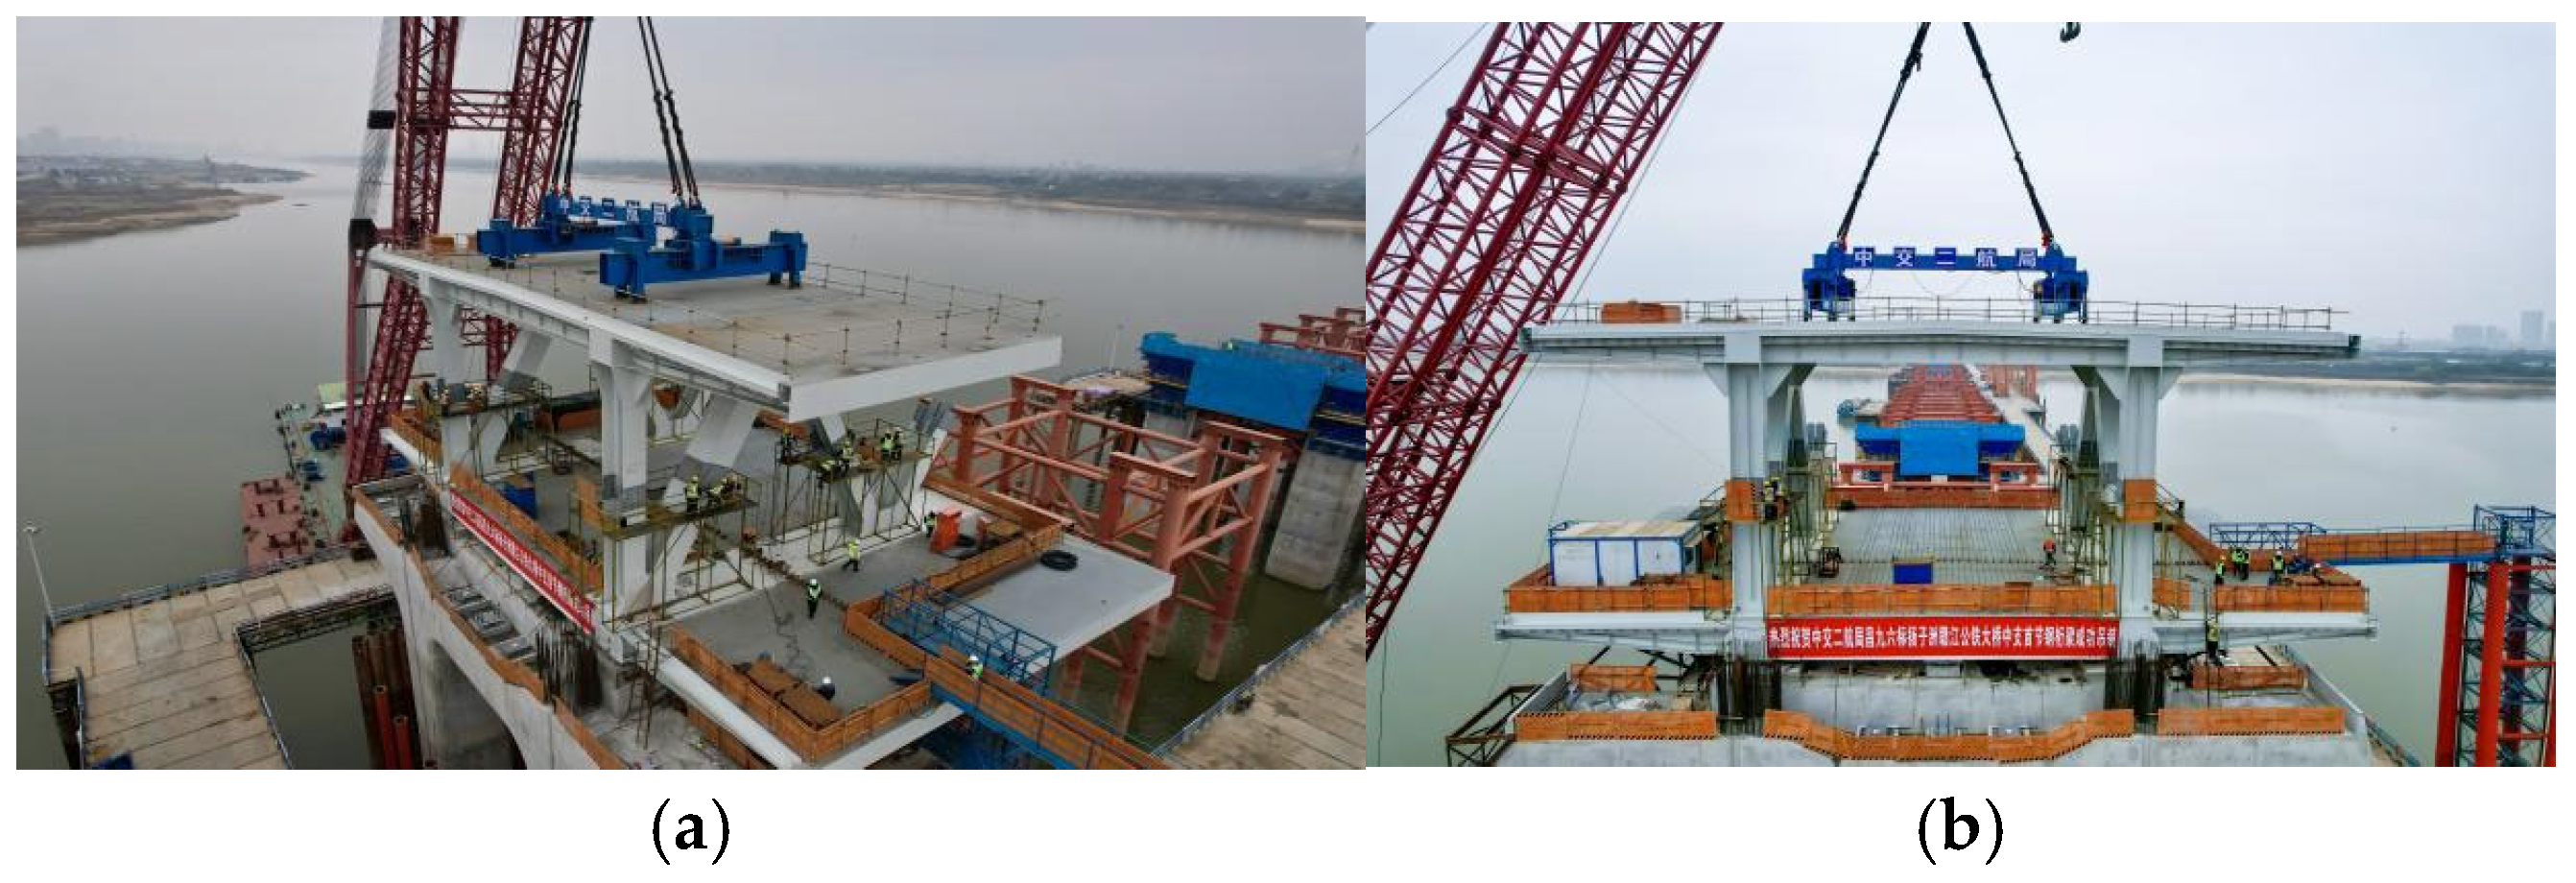
Sequential Erection of Units: Installation commenced with the lower-level units. Each unit, comprising a lower chord member segment and its corresponding section of the lower orthotropic deck system, was lifted into position using floating cranes, as shown in Figure 4a. Following the lower level, the upper-level units were installed. Each upper unit, consisting of an upper chord member segment and its corresponding section of the upper orthotropic deck system, was similarly lifted by floating cranes, as shown in Figure 4b. The remaining half of the diagonal members linking the upper and lower chords were then installed, Figure 5 shows an on-site work photo of the lifting construction of the first steel truss segment.
Midspan Closure: The critical midspan closure segment was installed using a cantilever closure technique. Prior to closure, precise adjustments were made to ensure proper fit-up. Longitudinal movements for closure gap adjustment were achieved either by exploiting diurnal temperature variations or by controlled forced longitudinal displacement (where feasible).
Subsequent construction: Upon successful completion of the midspan closure and verification of geometry and initial stresses, the structural system was transformed from its temporarily supported state into the final continuous condition. This involved the activation of permanent bearings and potential load transfer adjustments. Following the system transformation and structural verification, all temporary trestles, support equipment, and floating cranes were dismantled and removed. Subsequent construction phases then commenced, involving installation of the roadway and railway systems (e.g., paving, rail tracks, and ballast, where applicable) along with ancillary structures.

3. Mechanical Performance Analysis

3.1. Finite Element Model (FEM)

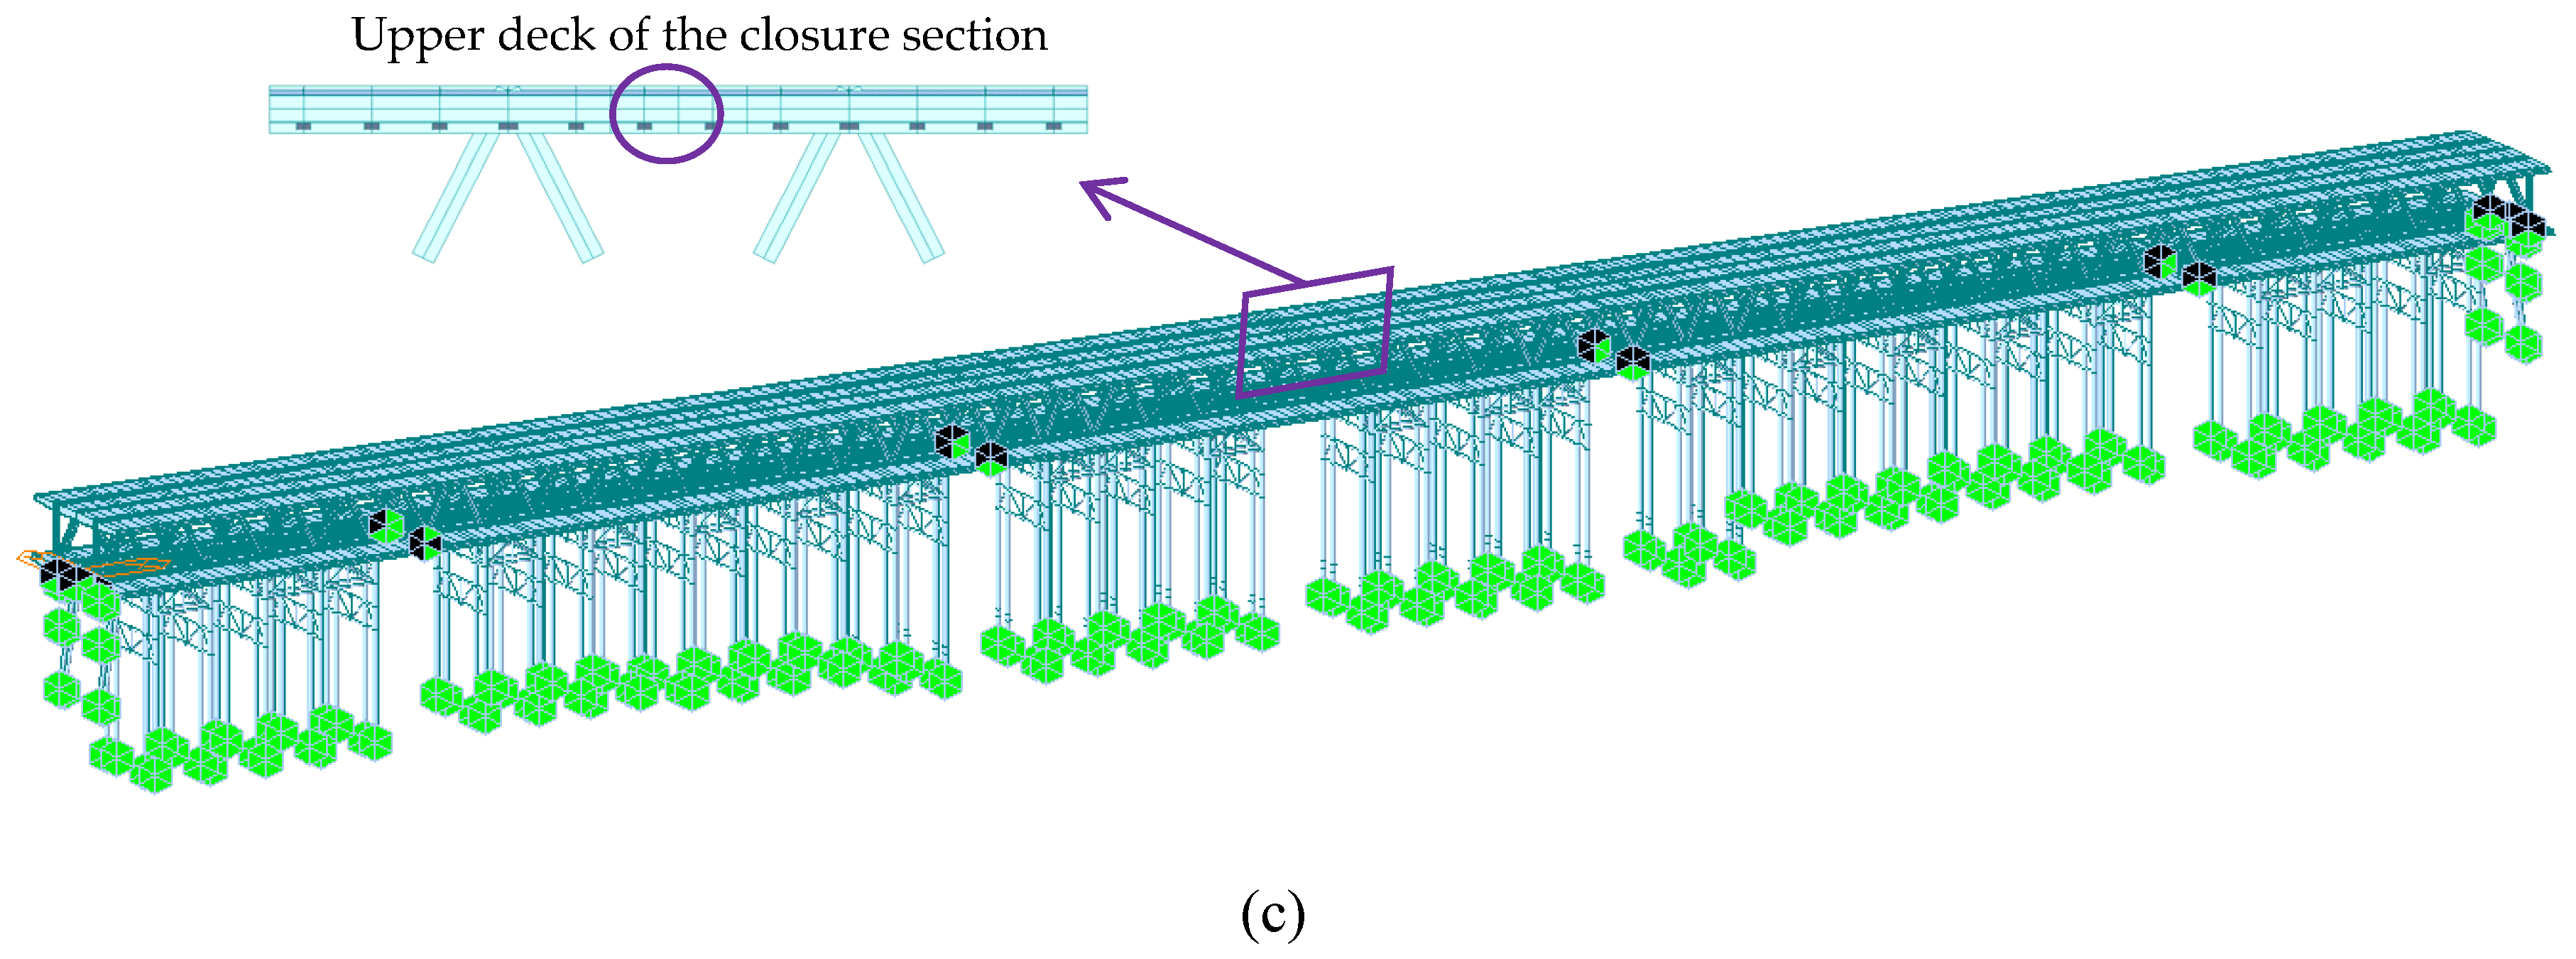
A finite-element-based structural simulation was performed using Midas Civil to investigate the mechanical response of the bridge throughout the assembly process. The three-dimensional numerical model incorporated linear beam elements for primary structural members—including main trusses, cross frames, deck stringers, and floor beams—while the bridge deck was discretized using shell elements. The support–girder interaction was modeled with compression-only elastic connections to simulate realistic boundary constraints. Boundary conditions were sequentially updated in accordance with the actual construction phases. The analysis took into account the structural self-weight, thermal effects, and temporary construction loads, with the construction stage simulation (CSS) carried out according to the segmental assembly sequence; the FEM model of the bridge obtained using Midas Civil is depicted in Figure 6.
The constitutive properties assigned to steel elements were as follows: elastic modulus, Poisson’s ratio μ = 0.3, and coefficient of thermal expansion α = 1.2 × 10⁻⁵/°C. The unit weight of steel was taken as 78.5 kN/m3. The self-weight was applied in the form of equivalent nodal and distributed loads: the beam members were loaded with line loads derived from their mass per unit length, the deck panels were subjected to area loads based on mass per unit area, and gusset plates were modeled as concentrated nodal masses.

3.2. Analysis Results

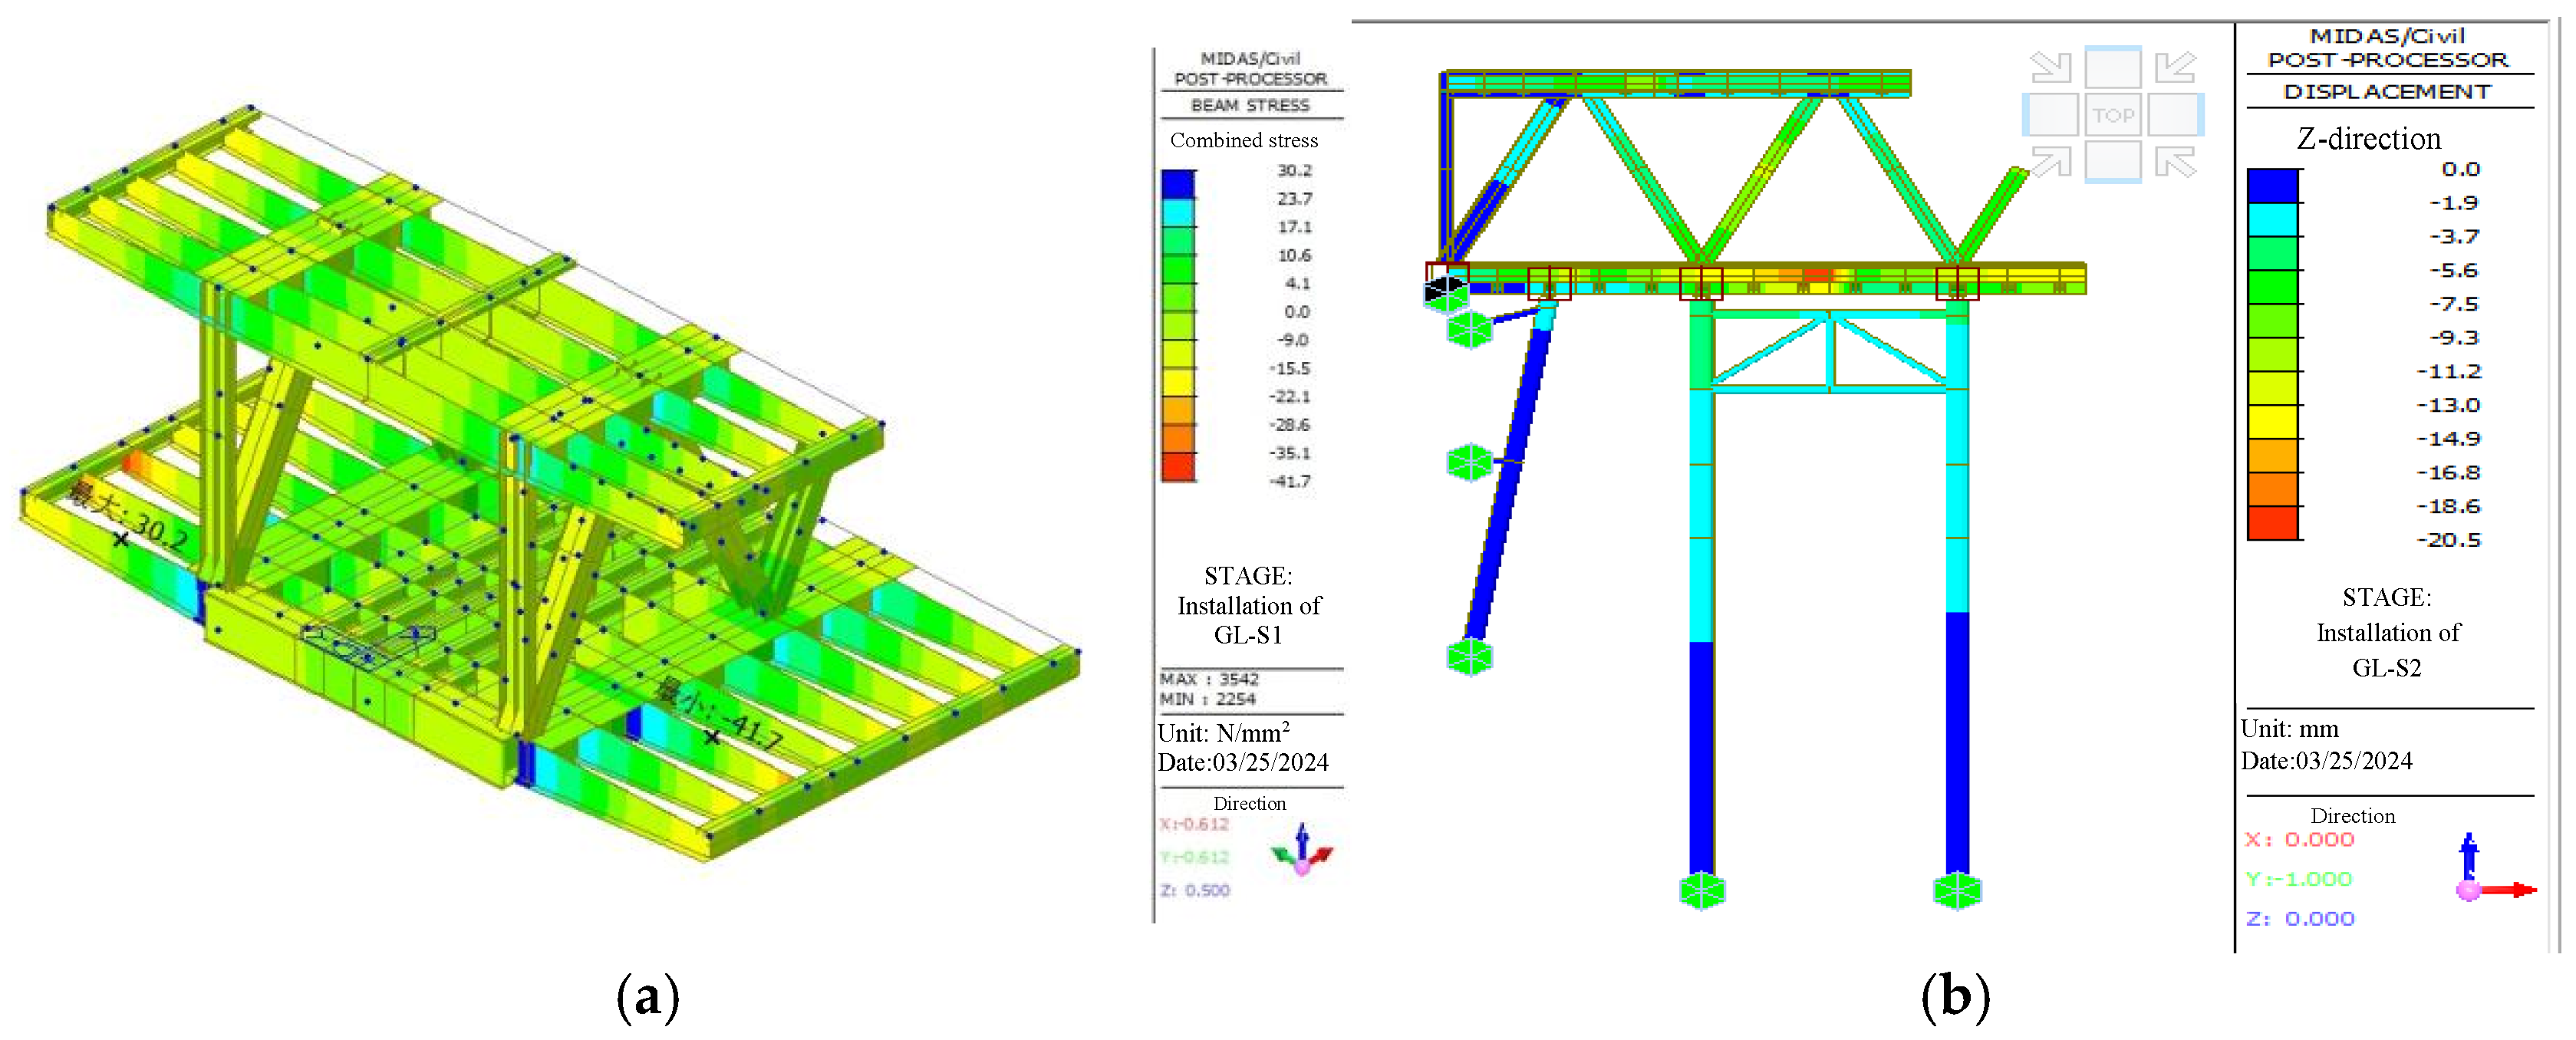
During the maximum cantilever stage of the main girder assembly, the maximum tensile stress in the top chord was 35.5 MPa, which increased to 38.1 MPa after the midspan closure. Under the application of secondary dead loads from the upper highway deck, lower highway deck, and lower railway deck, the maximum stresses reached 131.1 MPa. The stress and deformation of the install stage of the fifth segment of the side span are shown in Figure 7. The maximum vertical displacements at critical sections of the main girder during key construction stages are shown Table 1. As indicated, the maximum vertical displacement at the midspan during the most critical construction stage—the maximum cantilever phase—was 7.6 mm. After the removal of the temporary supports, the vertical displacement of the midspan was −68.1 mm, respectively. The maximum cumulative vertical displacement of the bridge deck, including transverse deformation, reached −117.5 mm.
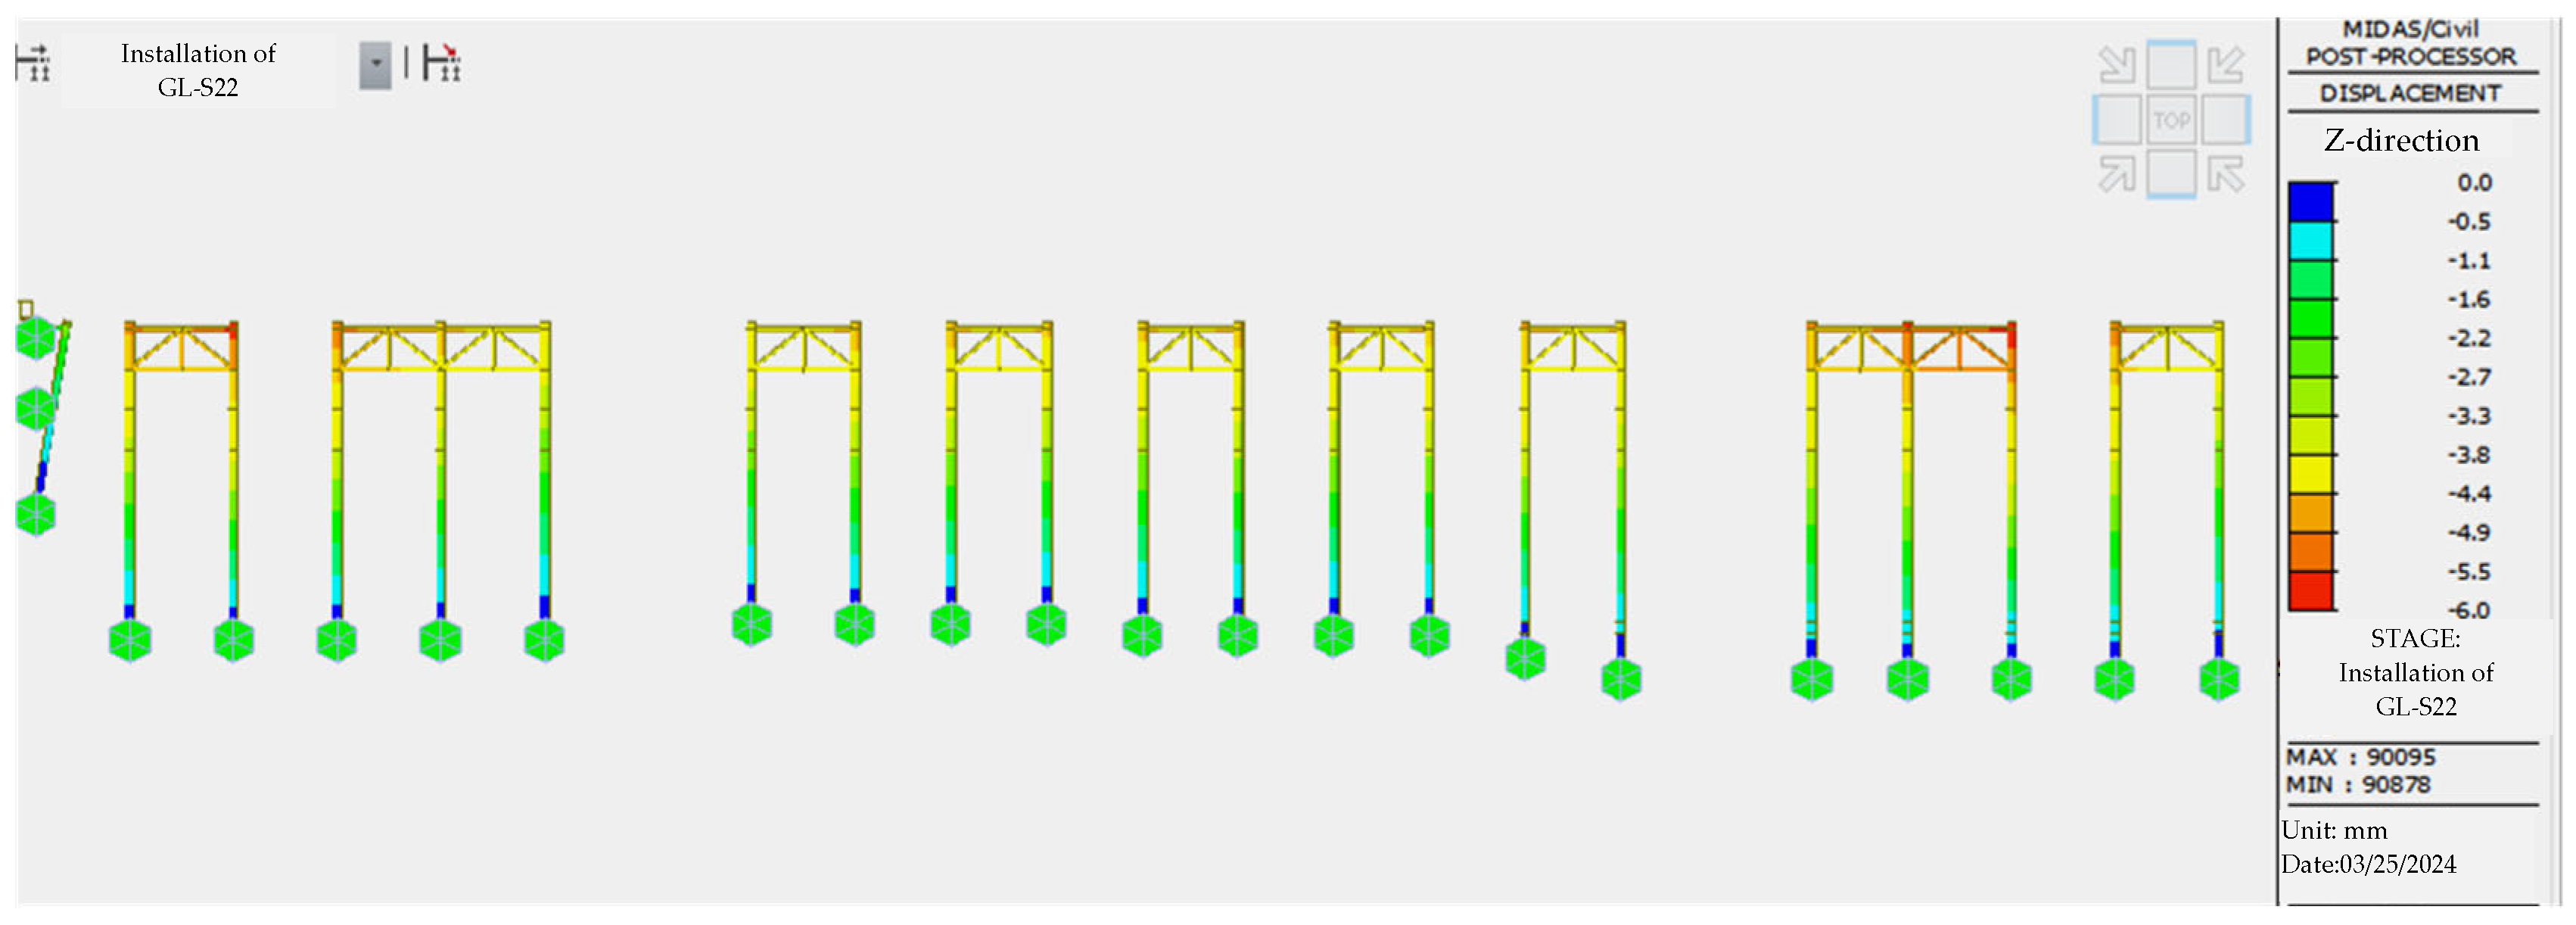
Figure 8 illustrates the corresponding displacement contour of the supports, showing a maximum displacement of 6 mm, indicating acceptable deformation control.
To evaluate the torsional behavior of the truss joint under the conditions of having only half of the diagonal members installed, finite element analysis was conducted, taking the partial lattice stage of the lower and upper part of the second installation stage of the steel truss as an example. The results shown in Figure 9 indicate that, prior to the installation of the upper truss, the end displacement of the diagonal members in the lower truss was 2.4 mm. After the upper truss was installed, this displacement increased to 3.0 mm. This confirms that displacements remain minor during staged assembly and can be controlled within an acceptable tolerance of 5 mm due to the inherent rigidity of the deck system. Minor adjustments were made using on-site methods such as chain hoists or jacking systems to ensure proper alignment during the connection of the upper and lower diagonals. The installation tolerances were as follows: Vertical misalignment between truss segments was controlled within 5 mm and within 10 mm at the pier and closure sections. Lateral misalignment of the truss axis between adjacent segments was limited to 5 mm, while the overall lateral deviation of the truss axis was controlled within 10 mm.
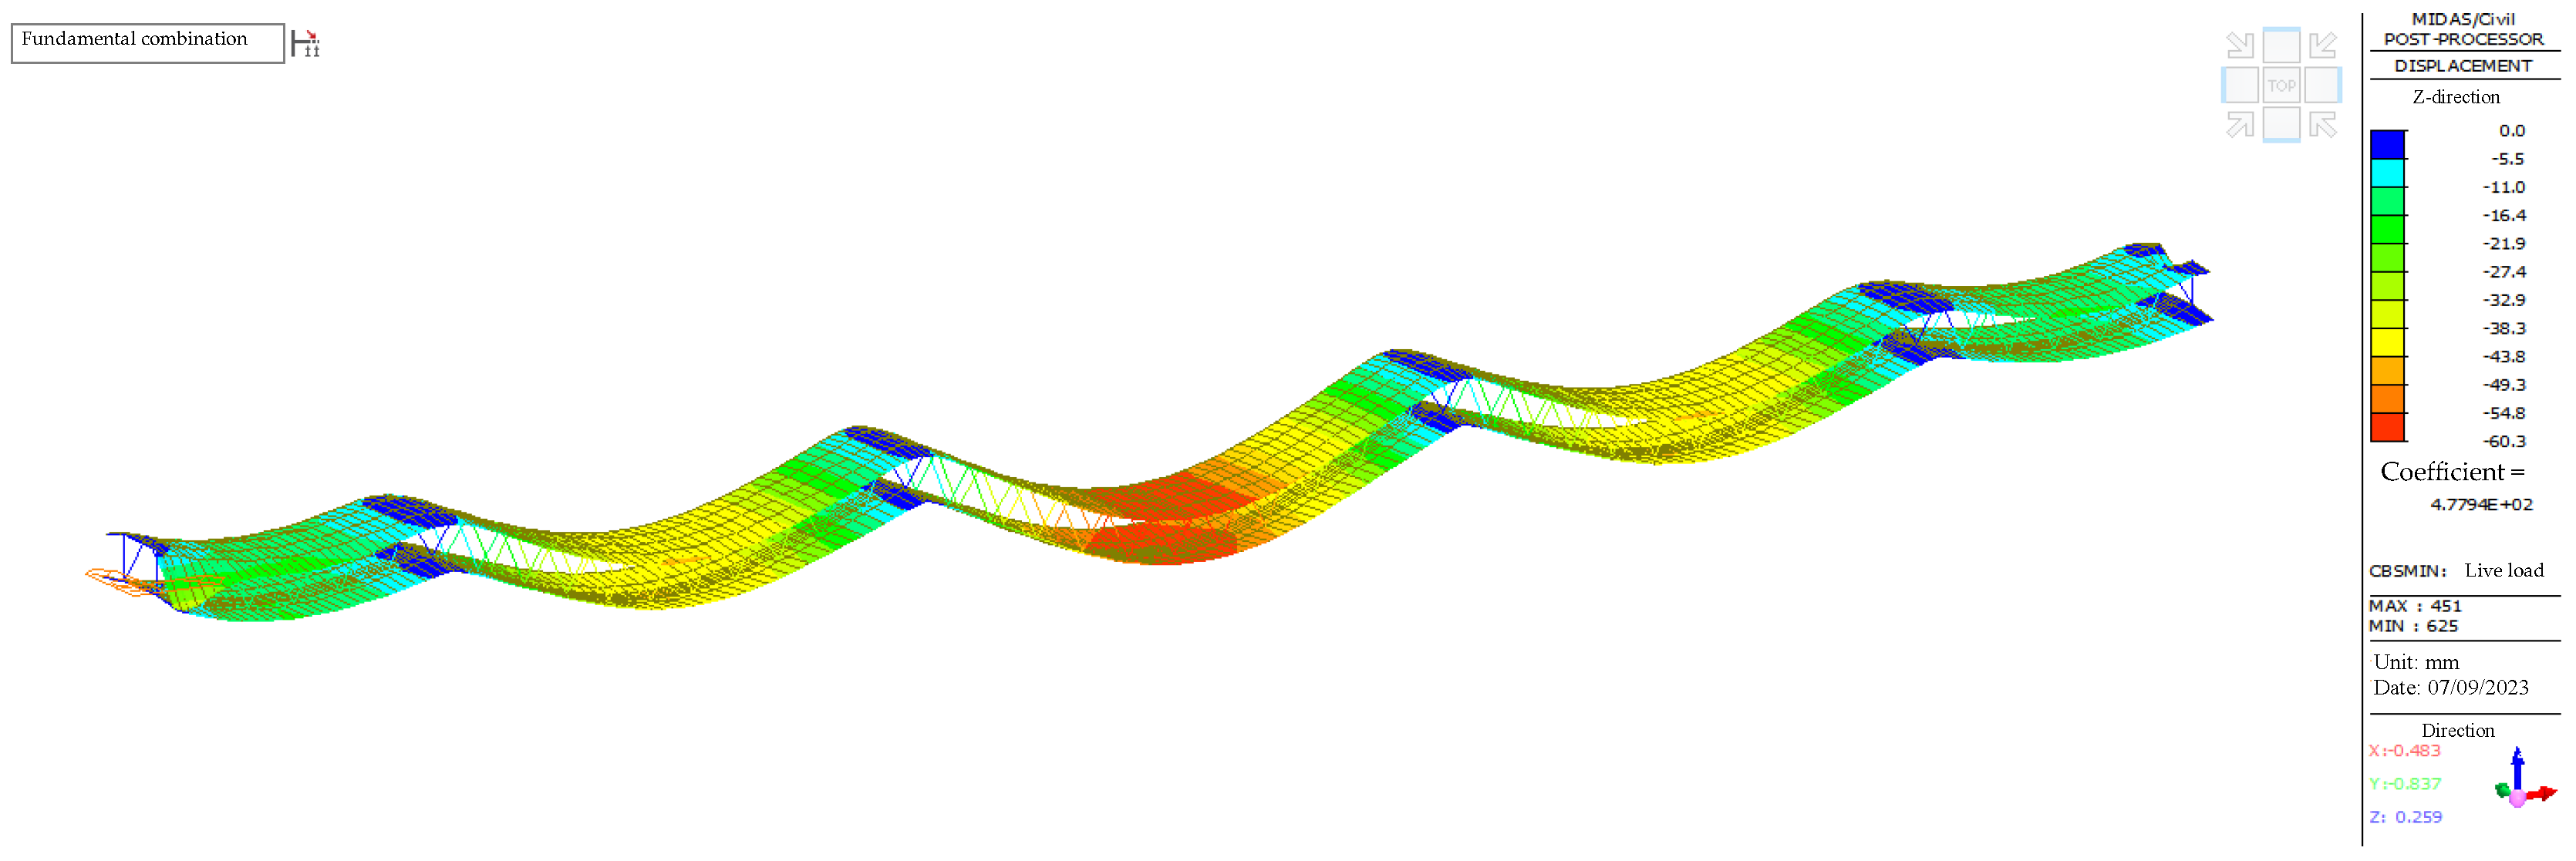
For live load analysis, lane loads were applied using eight lanes for the upper highway, four lanes for the lower highway, and two lanes for the lower high-speed railway. The live load was modeled in accordance with the Chinese codes (JT/T 1246-2019, TB 10002-2017, CJJ 11-2011, 2019 edition) [30,31,32]. As shown in Figure 10, the maximum live load vertical deflection of the entire bridge occurred at the midspan, with a value of 60.3 mm, while the deflection at the secondary side span midspan was 43.5 mm.

4. Control Method of Construction Process

The construction process analysis presented in the preceding section indicates that displacements during the in situ assembly stage during simulation are relatively small, which facilitates the control of erection accuracy. The construction control primarily relies on three key aspects: camber setting, real-time monitoring during construction, and closure segment control [33,34].

4.1. Application and Prediction of Camber Setting in Steel Truss Girder

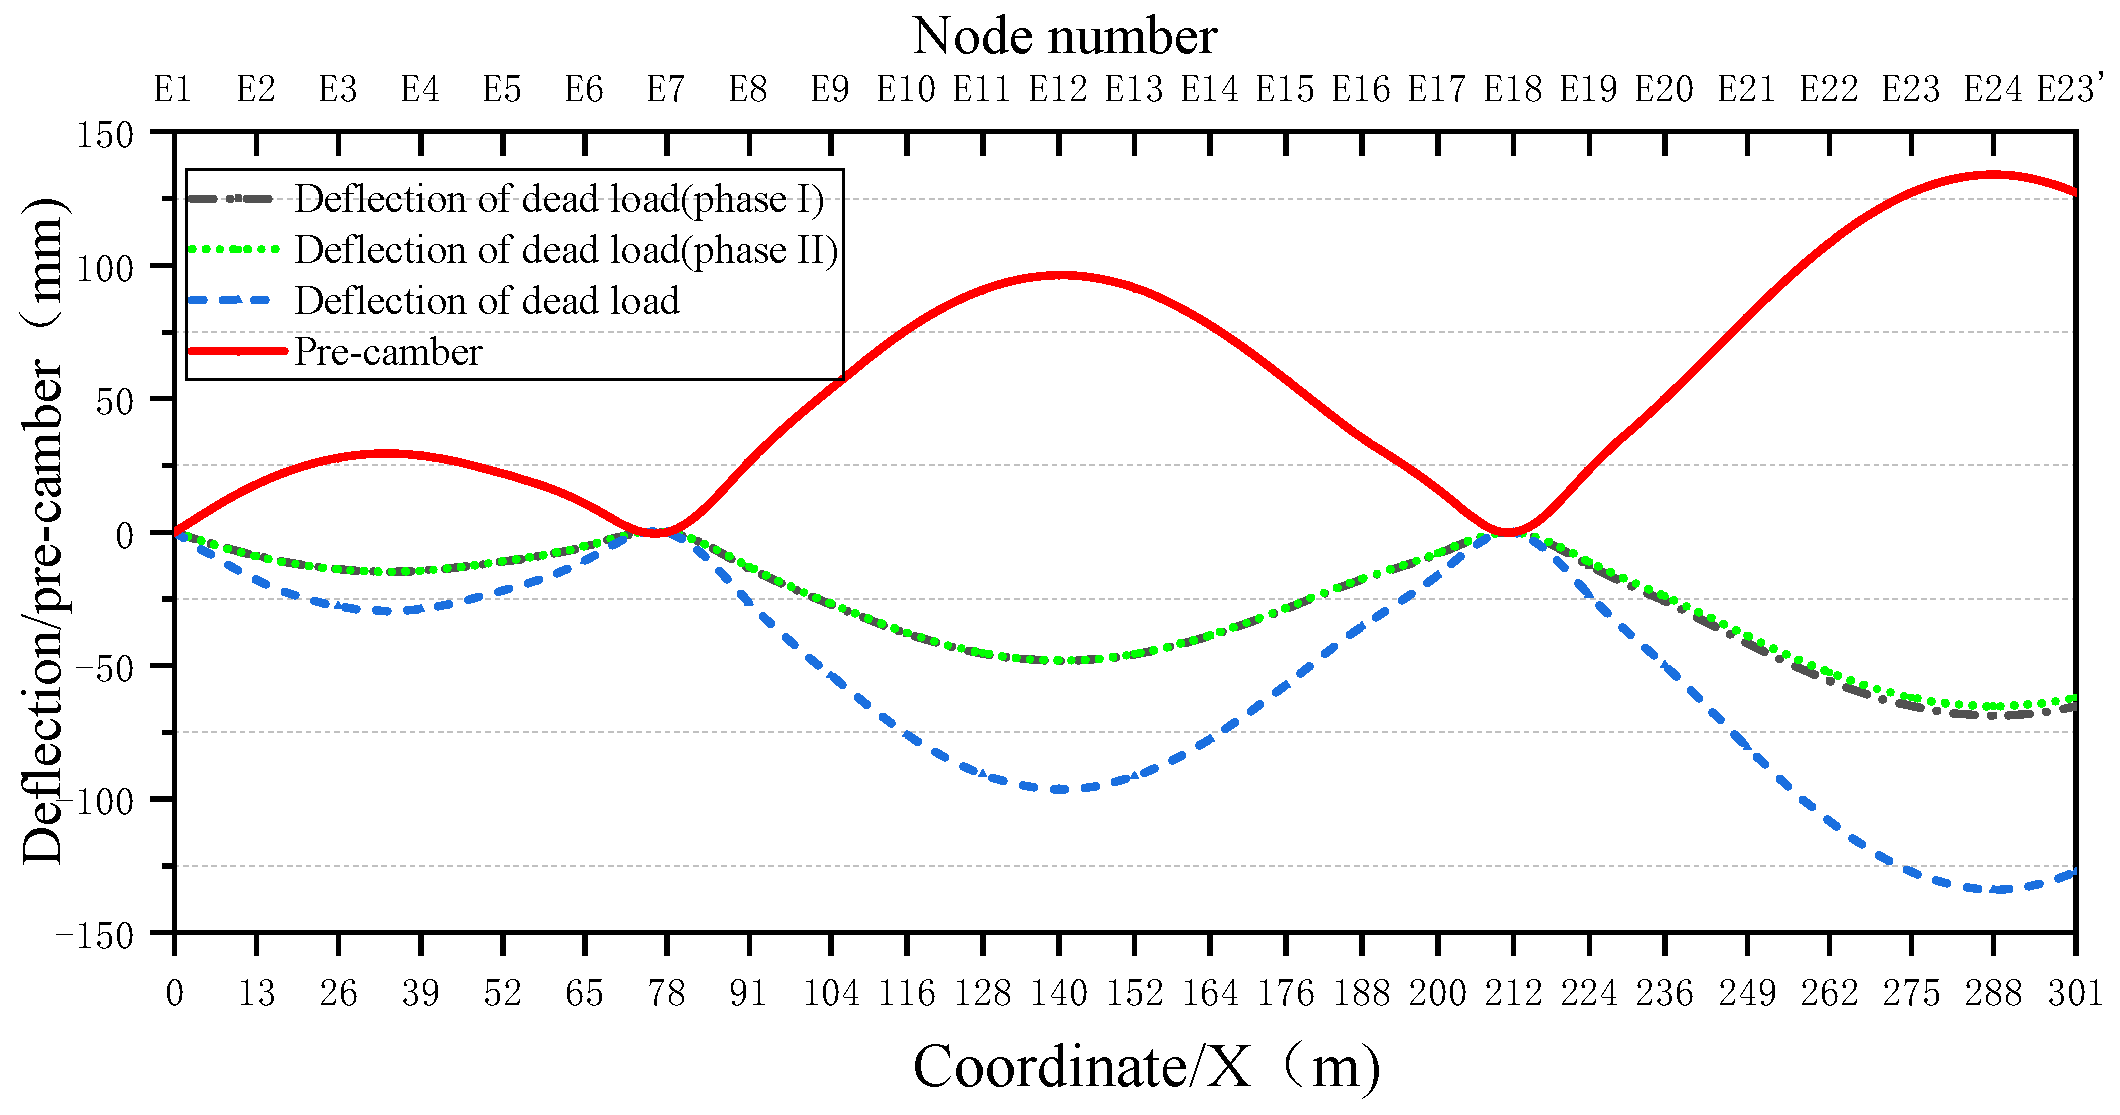
According to the technical code for static acceptance of high-speed railway engineering in China [35], the target as-built geometry of the main girder is defined as the elevation alignment under permanent loads (i.e., primary and secondary dead loads), which corresponds to the girder elevation specified in the design drawings. Therefore, geometric control is based on the calculated deformation under permanent loads. The deflection due to dead load and the corresponding fabricated camber of the steel girder are illustrated in Figure 11 and Figure 12.
Camber design involves adjusting the unstressed length or curvature of structural members so that the final structural geometry under permanent and live loads aligns with the target design profile [36]. In steel truss girders, this is typically achieved by modifying the unstressed lengths of the top chord members to offset deflections induced by dead loads and partial live loads. Based on the unstressed state control theory, the camber is implemented by keeping the lengths of the bottom chord and deck system unchanged while appropriately elongating or shortening the top chord and deck members. Common implementation methods include the following methods [37].
Temperature Method: A fictitious temperature load is applied to simulate thermal expansion or contraction, from which the required adjustment in unstressed length is derived. This approach is highly parameterized but requires careful control of member forces to avoid over stress.
Geometric Method: The member geometry is directly adjusted so that the top or bottom chord aligns with the desired camber curve. This method, however, involves frequent adjustments and is less efficient.
Optimized Temperature Load Method: Aiming to minimize secondary internal forces during assembly, this method establishes relationships among fictitious temperature loads applied to members, nodal displacements of the deck, and reactions of redundant framing scaffolding. It solves for a set of member elongation/shortening values that satisfy camber requirements while minimizing secondary forces in redundant framing scaffolding.
To explore a more efficient camber control strategy based on member length adjustments, this study employs machine learning (ML) techniques trained on finite element simulation results. Using a real bridge project as a case study, the prediction accuracy and feasibility of the proposed approach are analyzed.
Accordingly, leveraging Python 3.8 on PyCharm Community Edition 2020 platform, this research applies a range of widely used machine learning models—including eight supervised learning algorithms and two neural network architectures—to thoroughly explore the relationship between bridge parameters and camber values. The selected algorithms encompass fundamental traditional methods such as Support Vector Machine (SVM), K-Nearest Neighbors (KNN) [38], and Decision Tree (DT) [39], as well as advanced ensemble learning techniques including Random Forest (RF) [40], eXtreme Gradient Boosting (XGBoost) [41], Gradient Boosting (GB) [42], Extra Trees (ET) [43], and Adaptive Boosting (AdaBoost) [44]. Additionally, neural network approaches are incorporated, namely Multilayer Perceptron (MLP) [45] and a Particle Swarm Optimization–Back Propagation Neural Network (PSO-BP) [46,47,48].
(1)
Data set Configuration
To facilitate more efficient analysis of segment Elongating or Shortening Length Values (ESLVs) for camber setting in steel truss girders, this study compiled a comprehensive dataset derived from a case study project for the ML models. Based on feature importance analysis and in order to mitigate overfitting, fourteen features were selected as training variables. These were the total number of spans ( T p ), the span location of the calculation segment ( S p , where 1 denotes side span, 2 denotes secondary side span, and 3 denotes middle span), the distance to the nearest support ( X 0 ), the upper segment length ( L 1 ), the weight of the upper chord member ( X 1 ), the weight of upper splice plates ( G 1 ), the upper deck plate thickness ( h 1 ), the segment hoisting weight (T), the weight of the upper segment ( T 1 ), the lower segment length ( L 2 ), the weight of the lower chord member ( X 2 ), the weight of lower splice plates ( G 2 ), and the weight of the lower segment ( T 2 ). The output target variable is the ESLV obtained from the FEM and geometric method for the camber setting in the steel truss girder. The training set comprises data from 36 steel truss girder segments, as detailed in Table 2.
(2)
Training and prediction
Five methods—AdaBoost, Gradient Boosting, Decision Tree, Random Forest, Extra Trees, KNN, MLP, and PSO-BP neural network—were trained using parameters from 15 segments located in the two side spans. Regression evaluation metrics [43] for training set predictions included Mean Squared Error (MSE), Root Mean Squared Error (RMSE), Mean Absolute Error (MAE), and the Coefficient of Determination (R2). The equations are defined as follows:
R 2 = 1 i = 0 n y s i m y i 2 i = 0 n y ¯ y i 2
M S E = 1 n i = 0 n y s i m y i 2
M A E = 1 n i = 0 n y s i m y i
R M S E = 1 n i = 0 n y s i m y i 2
where y i is the observed value of the i-th sample, y ¯ is the mean of observed values, y s i m is the predicted value of the i-th sample, and n is the number of samples in the dataset.
The training dataset was partitioned into five distinct subsets. For each validation round, four subsets were used for training, while the remaining one subset served as the validation set. This process was repeated five times, with each subset used exactly once for validation.
Taking KNN as an example, K-fold cross-validation with k = 5 was employed to reliably evaluate model performance and select optimal hyperparameters, subsets were created using randomized partitioning across segments to maintain distributional representativeness. Prior to training, the size of the training subset was explicitly verified. The maximum neighbor parameter (k_max) was constrained to be less than the number of samples in the training subset to ensure validity. A dedicated test set, comprising 10% of the full dataset, was held out for final evaluation. The neighbor parameter k was systematically evaluated across a defined range (k = 1 to 30). Model performance was assessed for each value within this range. As the sensitivity analysis of k shows in Figure 13, the analysis revealed an optimal k value of 4 for this model, indicating good fit. However, performance was found to be highly sensitive to k, where minor changes in k induced significant fluctuations in the composition of the nearest neighbor set. Notably, larger k values did not universally yield superior results.
The trained models were then used to predict the camber adjustments for 10 unknown segments in the midspan, and the evaluation indicators of the training set and test set for the different models are shown in Table 3.
The predictions were compared against theoretical values obtained from the FEM and geometric method, and the results are summarized in Table 4. The performance of each model was evaluated using the Maximum Absolute Error (MaxAE) between predicted and theoretical values. A smaller MaxAE indicates better predictive accuracy. The models were ranked from best to worst as follows:
ET (1.21 mm) < KNN (1.40 mm) < AdaBoost (1.63 mm) < RF (2.78 mm) < MLP (3.97 mm) < GB (4.60 mm).
The results indicate that the ET and KNN model achieved good prediction accuracy, with deviations within 1.5 mm, demonstrating superior overall performance. Other models, such as AdaBoost and RF, performed well on the test set but exhibited poorer generalization in practical prediction, largely due to the limited dataset size. The MLP and GB models showed the poorest performance, with the largest MaxAE (e.g., 4.60 mm for segment A8’–A7’2 in GB).
This study confirms the high feasibility of using machine learning for camber prediction in steel truss bridges, which can significantly reduce computational time and improve efficiency. However, the limited samples may fail to adequately characterize data distribution complexity, inducing models to capture spurious noise artifacts instead of learning generalizable patterns. This fundamental limitation affects the results of the machine learning as follows: exacerbated overfitting when parameters exceed sample size, non-convex optimization instability from high-variance gradient estimates, and statistically unreliable evaluation metrics. A larger database of steel truss bridge projects would further enhance the accuracy and robustness of the predictive models.

4.2. Closure Segment Construction Control

The successful closure of a steel truss girder bridge is critically dependent on mitigating the geometric discrepancies at the closure interface, which include vertical differential deflection (grade difference) and angular rotation induced by dead loads and erection sequences. The primary control strategy involves precise adjustments to align the closure segments. Vertical jacks installed on the temporary piers at the closure interface are employed to adjust the elevation, ensuring the two faces are plumb and the grade difference falls within the design tolerance, thereby eliminating the effects of rotation and vertical misalignment. To address misalignment of the bridge centerline, diagonal pulling using chain hoists across the interface can be applied. Among these challenges, compensating for longitudinal displacements due to thermal effects is often the most complex, necessitating a precise understanding of the temperature-induced behavior of the truss before closure, with adjustments made by leveraging temperature differentials.
The results of FEM indicate that when the erection reaches the lower deck closure interface, the cantilever end exhibits a vertical deformation of 4.0 mm. This can be corrected by actuating the vertical jacks on the adjacent temporary pier to raise the girder to its designed elevation. For the web member closure, the upper segment demonstrates a displacement of 2.8 mm, which can be accommodated by tailoring the length of the lower segment’s end for direct fit-up. Similarly, the displacement at the leading edge of the upper deck closure interface is 3.2 mm, which also allows for direct closure without additional compensatory measures.
A rigorous temperature monitoring regime is imperative prior to closure. The thermal expansion/contraction of the steel girder is governed by the following equation: ΔL = α × ΔT × L, where ΔL is the change in length, α is the coefficient of thermal expansion (1.2 × 10⁻⁵/°C for steel), ΔT is the temperature differential, and L is the original member length. The closure operation was scheduled for September. Based on historical meteorological data for Nanchang, the maximum diurnal temperature variation in September is approximately 15/°C. With the Nanchang side temporarily fixed at Pier #88, the calculated thermal movement at the closure joint is as follows: L_south = 69,500 × 1.2 × 10−5 × 15 ≈ 13 mm. The design temperature of the bridge is 20 °C, and the temperature recordings from the week preceding the planned closure showed ambient temperatures ranging from 2.5/°C to 20/°C. The deformation of the main components of the bridge is analyzed by the overall heating and cooling load based on the recorded temperature.
Table 5 illustrates the deformations in the X, Y, and Z directions under a uniform temperature ranging from 2.5 °C to 20/°C. Results for other uniform temperature scenarios are summarized in Table 4 and Table 5. The analysis reveals that the (X-direction longitudinal) displacement is highly sensitive to uniform temperature changes. The X-direction displacement is approximately 12 mm at the upper chord, and the Z-direction displacement (vertical) is approximately 8.3 mm at the web members when the temperature reaches 35/°C. The sensitivity of the Y-direction (Transverse) displacements is significantly lower than in the X-direction, with displacements around 0.2 mm for the chord and 1.5 mm for the web members. The smallest deformations of the upper chord occur at a reference temperature of 20 °C. Therefore, it is strongly recommended to schedule closure operations during periods of mild and stable temperatures at 20 °C, avoiding conditions with large diurnal variations or extremes, which induce significant deformations.
Furthermore, the effect of solar radiation was simulated by applying a temperatures gradient of 10 °C between the upper and lower decks, and the deformations of the respective elements are shown in Table 6. The analysis demonstrates that the X-direction displacement is most significantly affected by this gradient, inducing a deformation of up to 1.8 mm. Displacement in the Y-direction is minimally influenced. The Z-direction displacement is predominantly governed by the dead load, and the upper deck exhibits greater vertical movement than the lower deck. Consequently, selecting conditions with a minimal inter-deck temperature difference will also help reduce Dx variations.
Based on the preceding analysis, closure operations should be scheduled during periods of suitable ambient temperature. Construction under conditions of significant diurnal temperature variation is strongly discouraged due to the pronounced adverse effects on structural deformation. Based on the thermal displacement behavior summarized in Table 5 and Table 6 of the original manuscript, the following quantitative thresholds are proposed:
Welding is permissible when the following conditions are met simultaneously:
| T a m b T r e f | 2.5   ° C and | Δ T u l | = | T u p p e r T l o w e r | 10   ° C ; under these conditions, the corresponding longitudinal displacement is constrained below 2.0 mm.
In the above, T a m b represents the ambient temperature, T r e f is the reference design temperature, and Δ T u l denotes the temperature difference between the upper deck ( T u p p e r ) and lower deck.
If either temperature difference is exceeded, fit-up adjustments and pre-cut length should be performed prior to welding.
Reflecting the above principle, the background project developed distinct pre-cut length schemes calibrated for 10 °C and 5 °C scenarios, explicitly accounting for anticipated thermal deformation. Closure welding was subsequently conducted during nighttime hours when the ambient air temperature remained consistently at approximately 10 °C. The closure segment was joined to the existing steel truss sections strictly according to the 10 °C pre-cut length scheme to ensure proper alignment and minimize residual stresses.

4.3. Real-Time Monitoring

Real-time construction monitoring involves the implementation of an on-site measurement system to continuously track internal forces, displacements (geometry), and temperature variations in the structure during the erection process. This system provides essential field data to ensure structural safety and supplies measured parameters for validating and calibrating numerical models used in construction control. Following the installation of each steel segment, nodal elevations, mileage coordinates, and axial deviations are promptly measured. These measurements are compared with the design geometry provided by the monitoring team. Any identified deviations are analyzed to formulate corrective measures, and adjustment instructions for subsequent segments are issued accordingly. As the erection approaches the closure stage, continuous monitoring is conducted for the bridge center line alignment, elevation difference at the closure interface, and distance between closure points, as well as ambient and steel temperatures.
(1)
Steel truss girder deformation monitoring
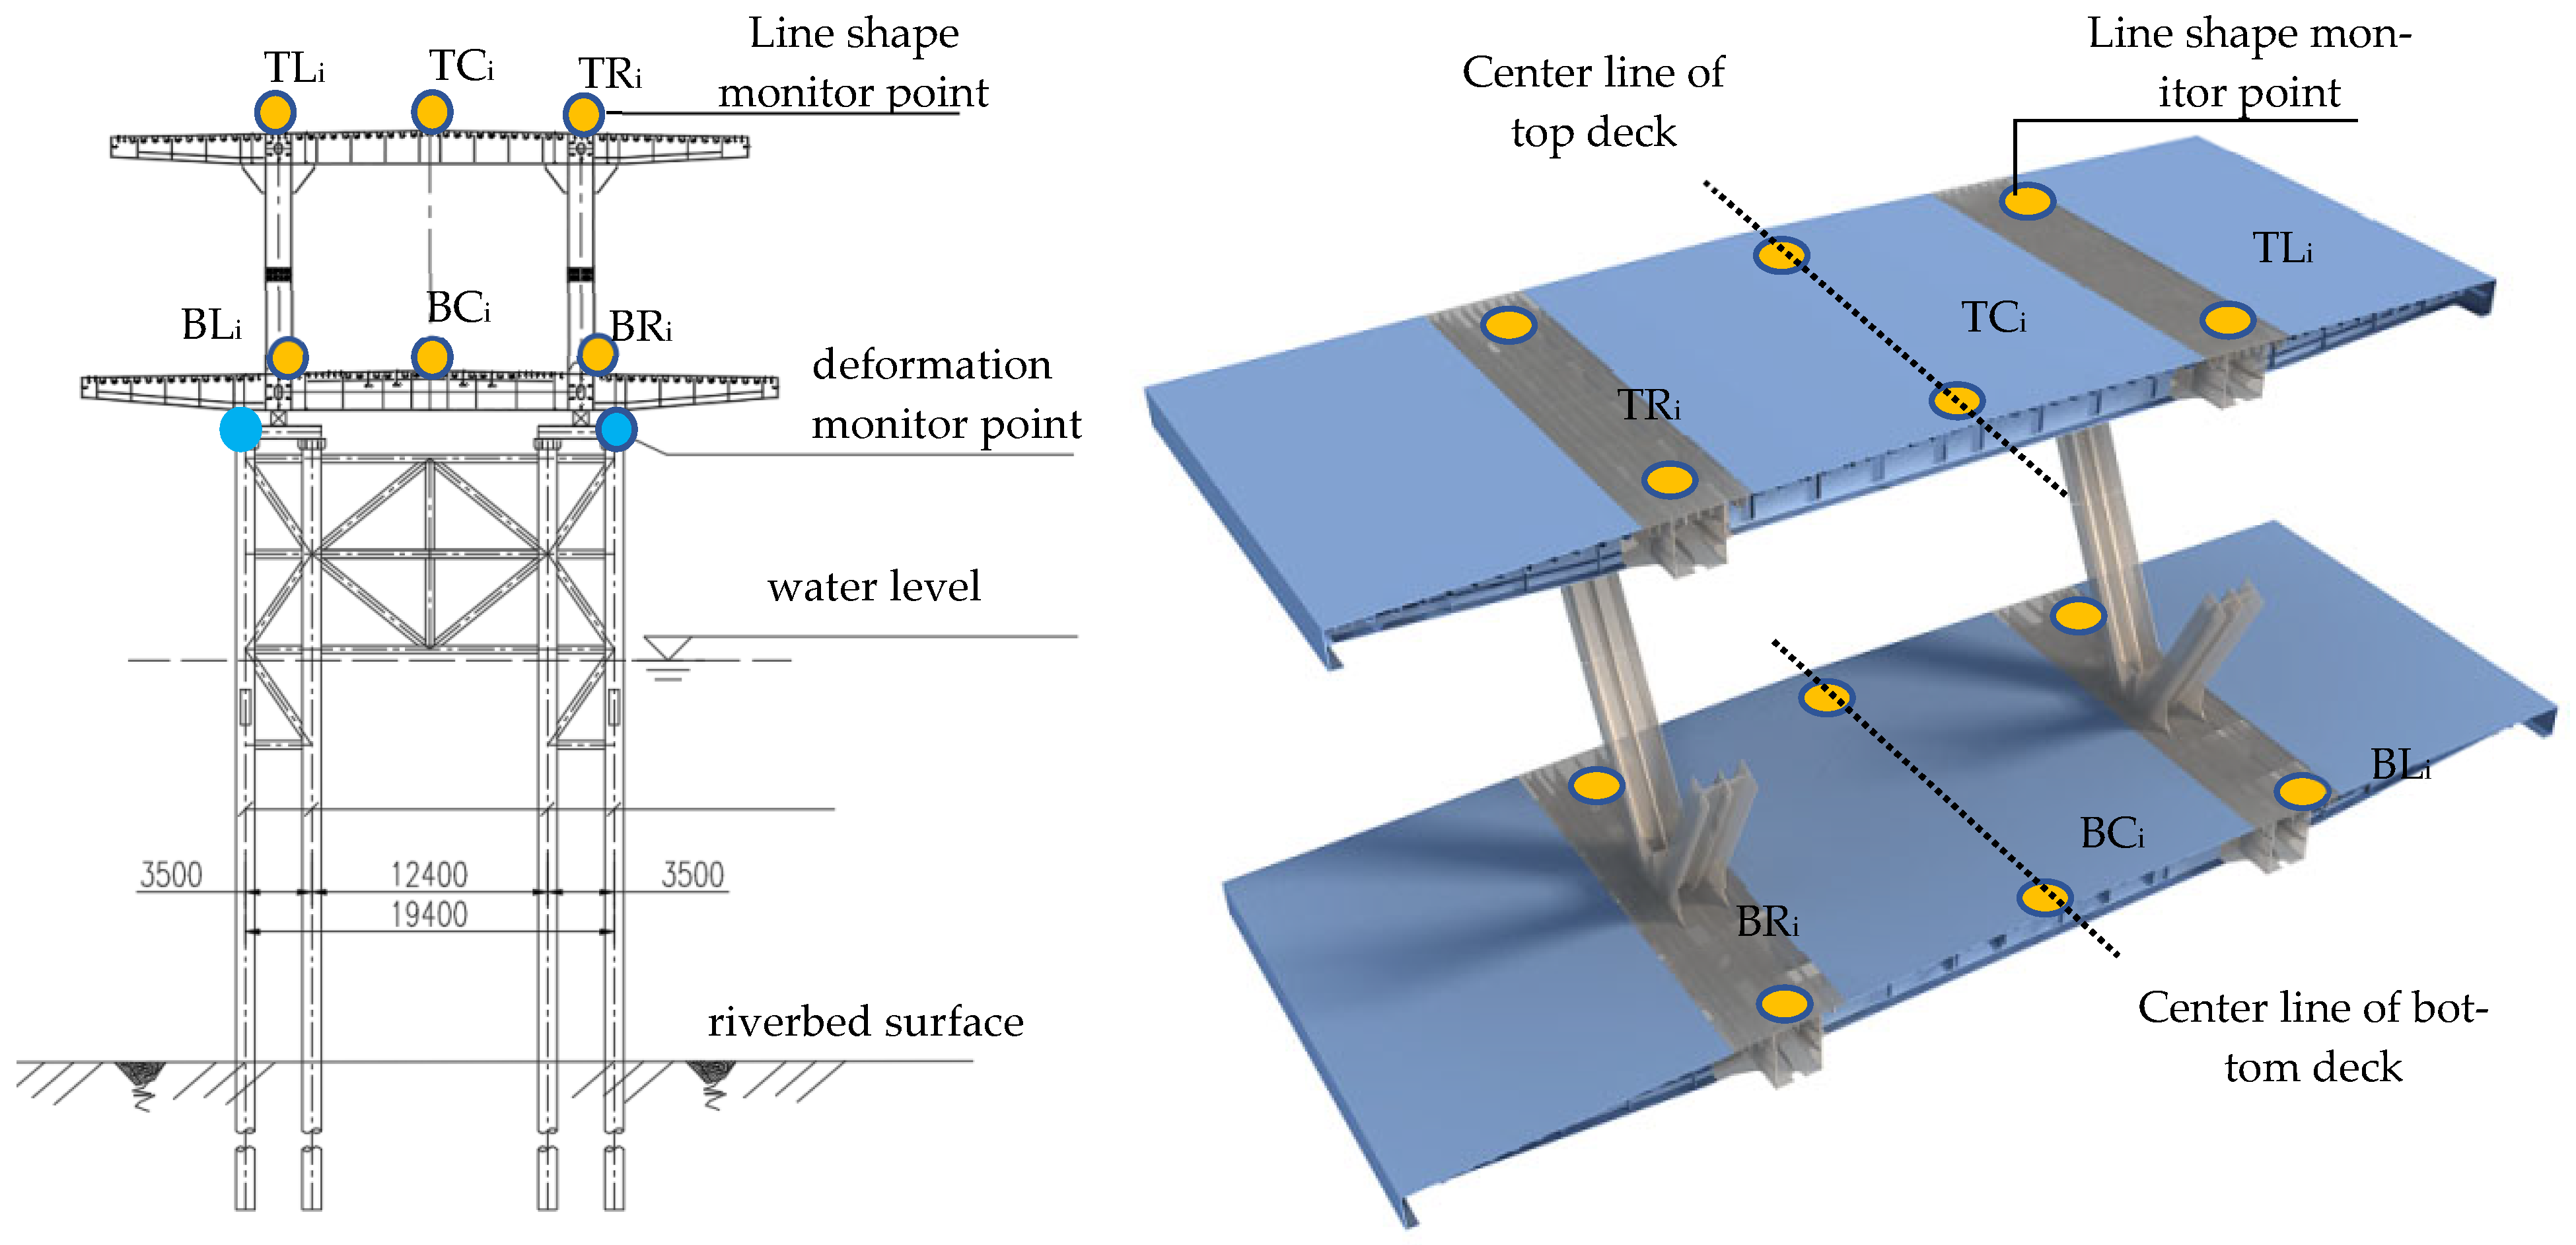
Monitoring of the truss’s vertical deflection provides critical data on deformation trends under various construction stages. These measured deflections serve as initial input for analytical models, allowing for verification of the computational model’s accuracy. Based on field data, the deflection prediction model is iteratively refined to more reliably guide the installation of subsequent segments, as shown in Figure 14 and Figure 15.
(2)
Stress and temperature monitoring
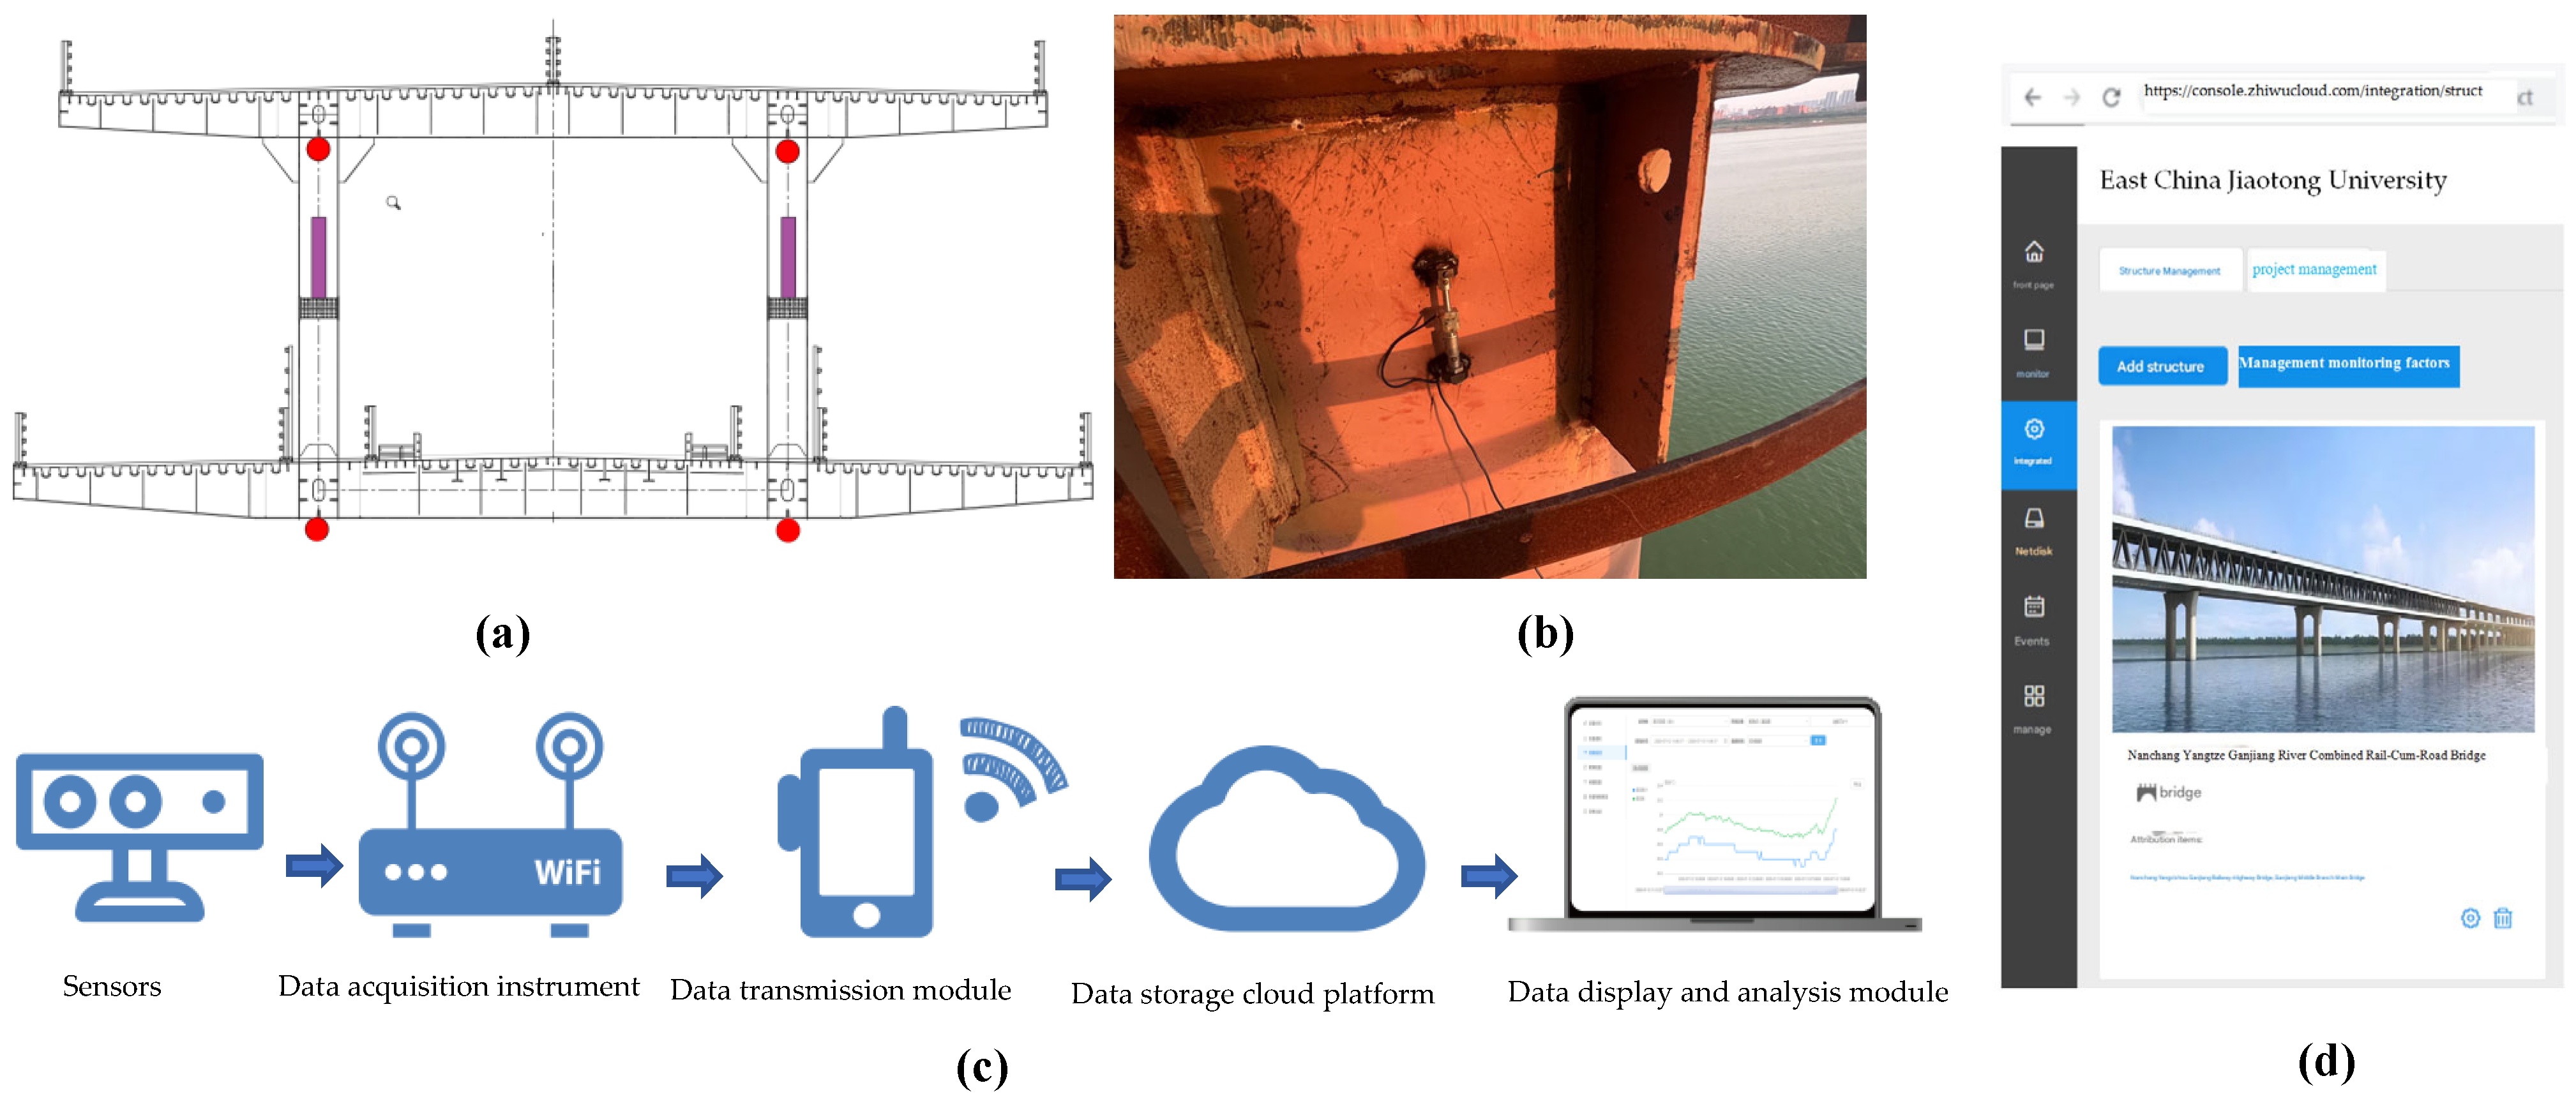
Stress monitoring at key sections of the steel truss and main piers, conducted by a third party commissioned by the owner, captures stress variations throughout construction. Given the structural characteristics of the bridge, critical sections are selected for stress measurement, including the midspan of the side spans, midspan of the secondary side spans, quarter- and three-quarter points of the main span, and the midspan of the main span, as shown in Figure 16.
Owing to the long span of the steel girder, temperature fluctuations induce significant deformations and internal force redistributions in both the girder and temporary framing scaffolding. To accurately understand the actual temperature distribution within the structure and provide reliable data for thermal effect analysis and compensation, monitoring of ambient conditions and the structural temperature field is essential, as shown in Figure 17. Temperature sensors are co-located with stress sensors at the same sections, utilizing instruments capable of simultaneous stress and temperature measurement.

5. Application Results of Engineering

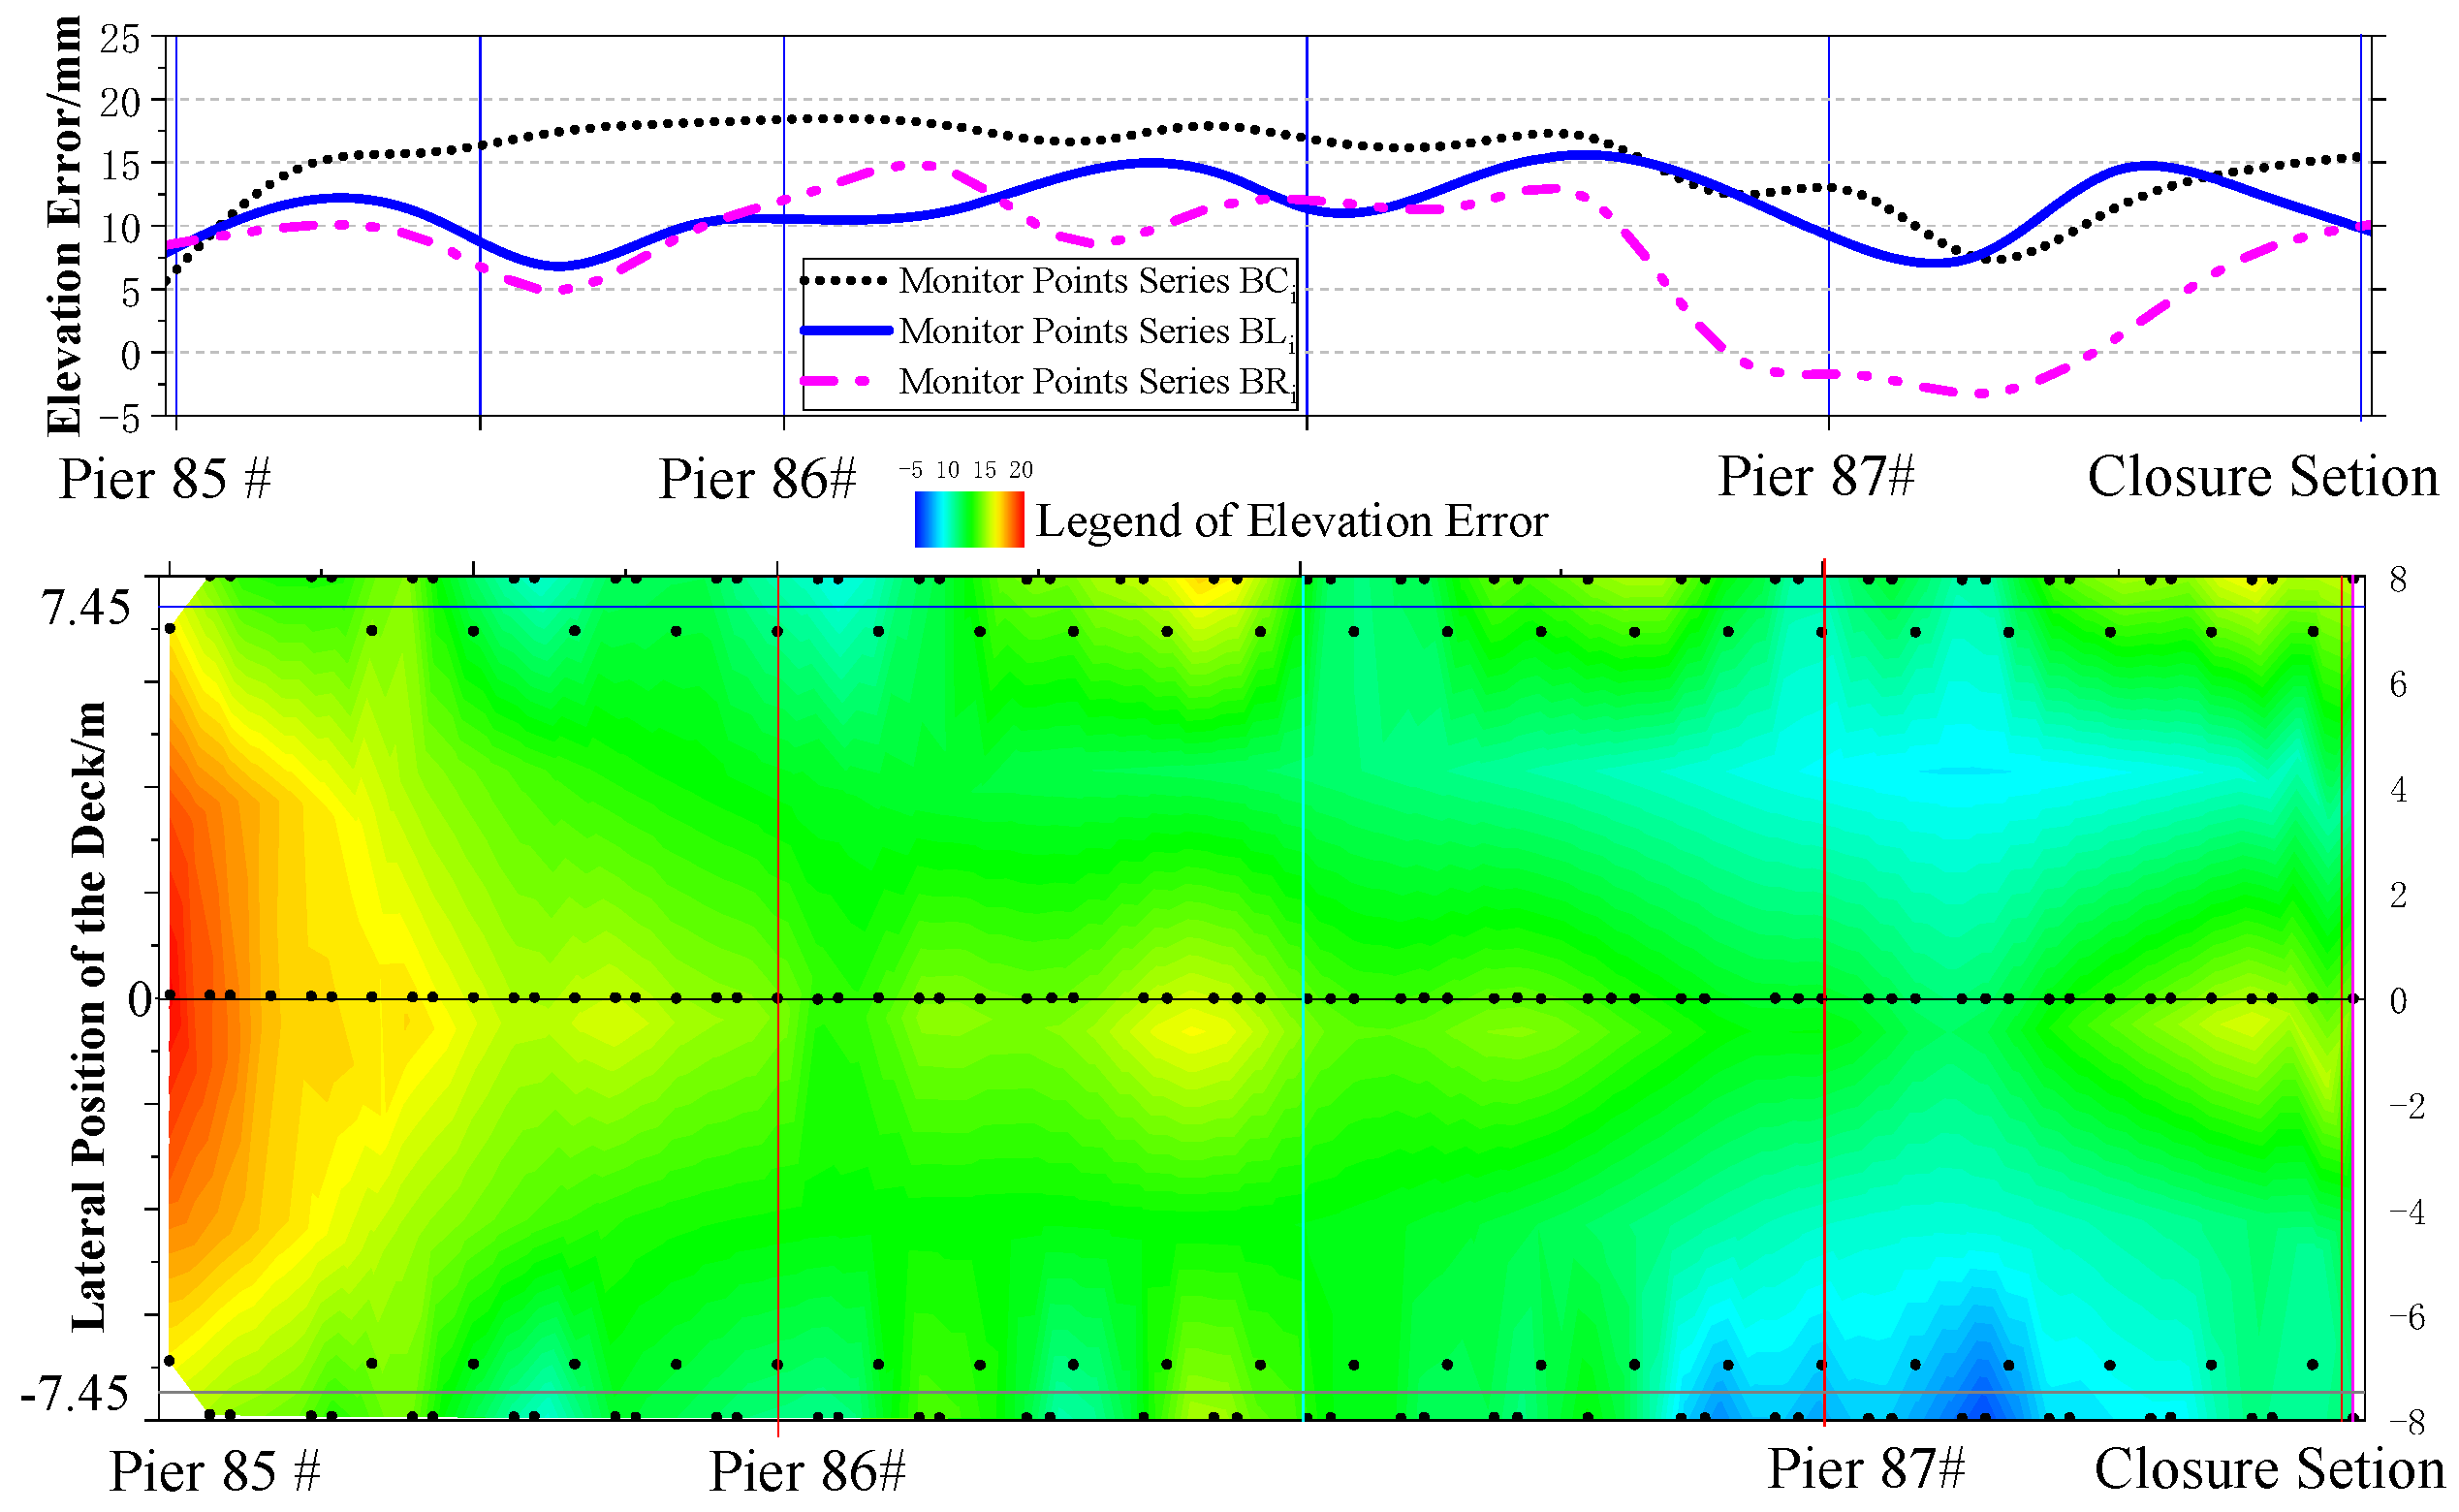
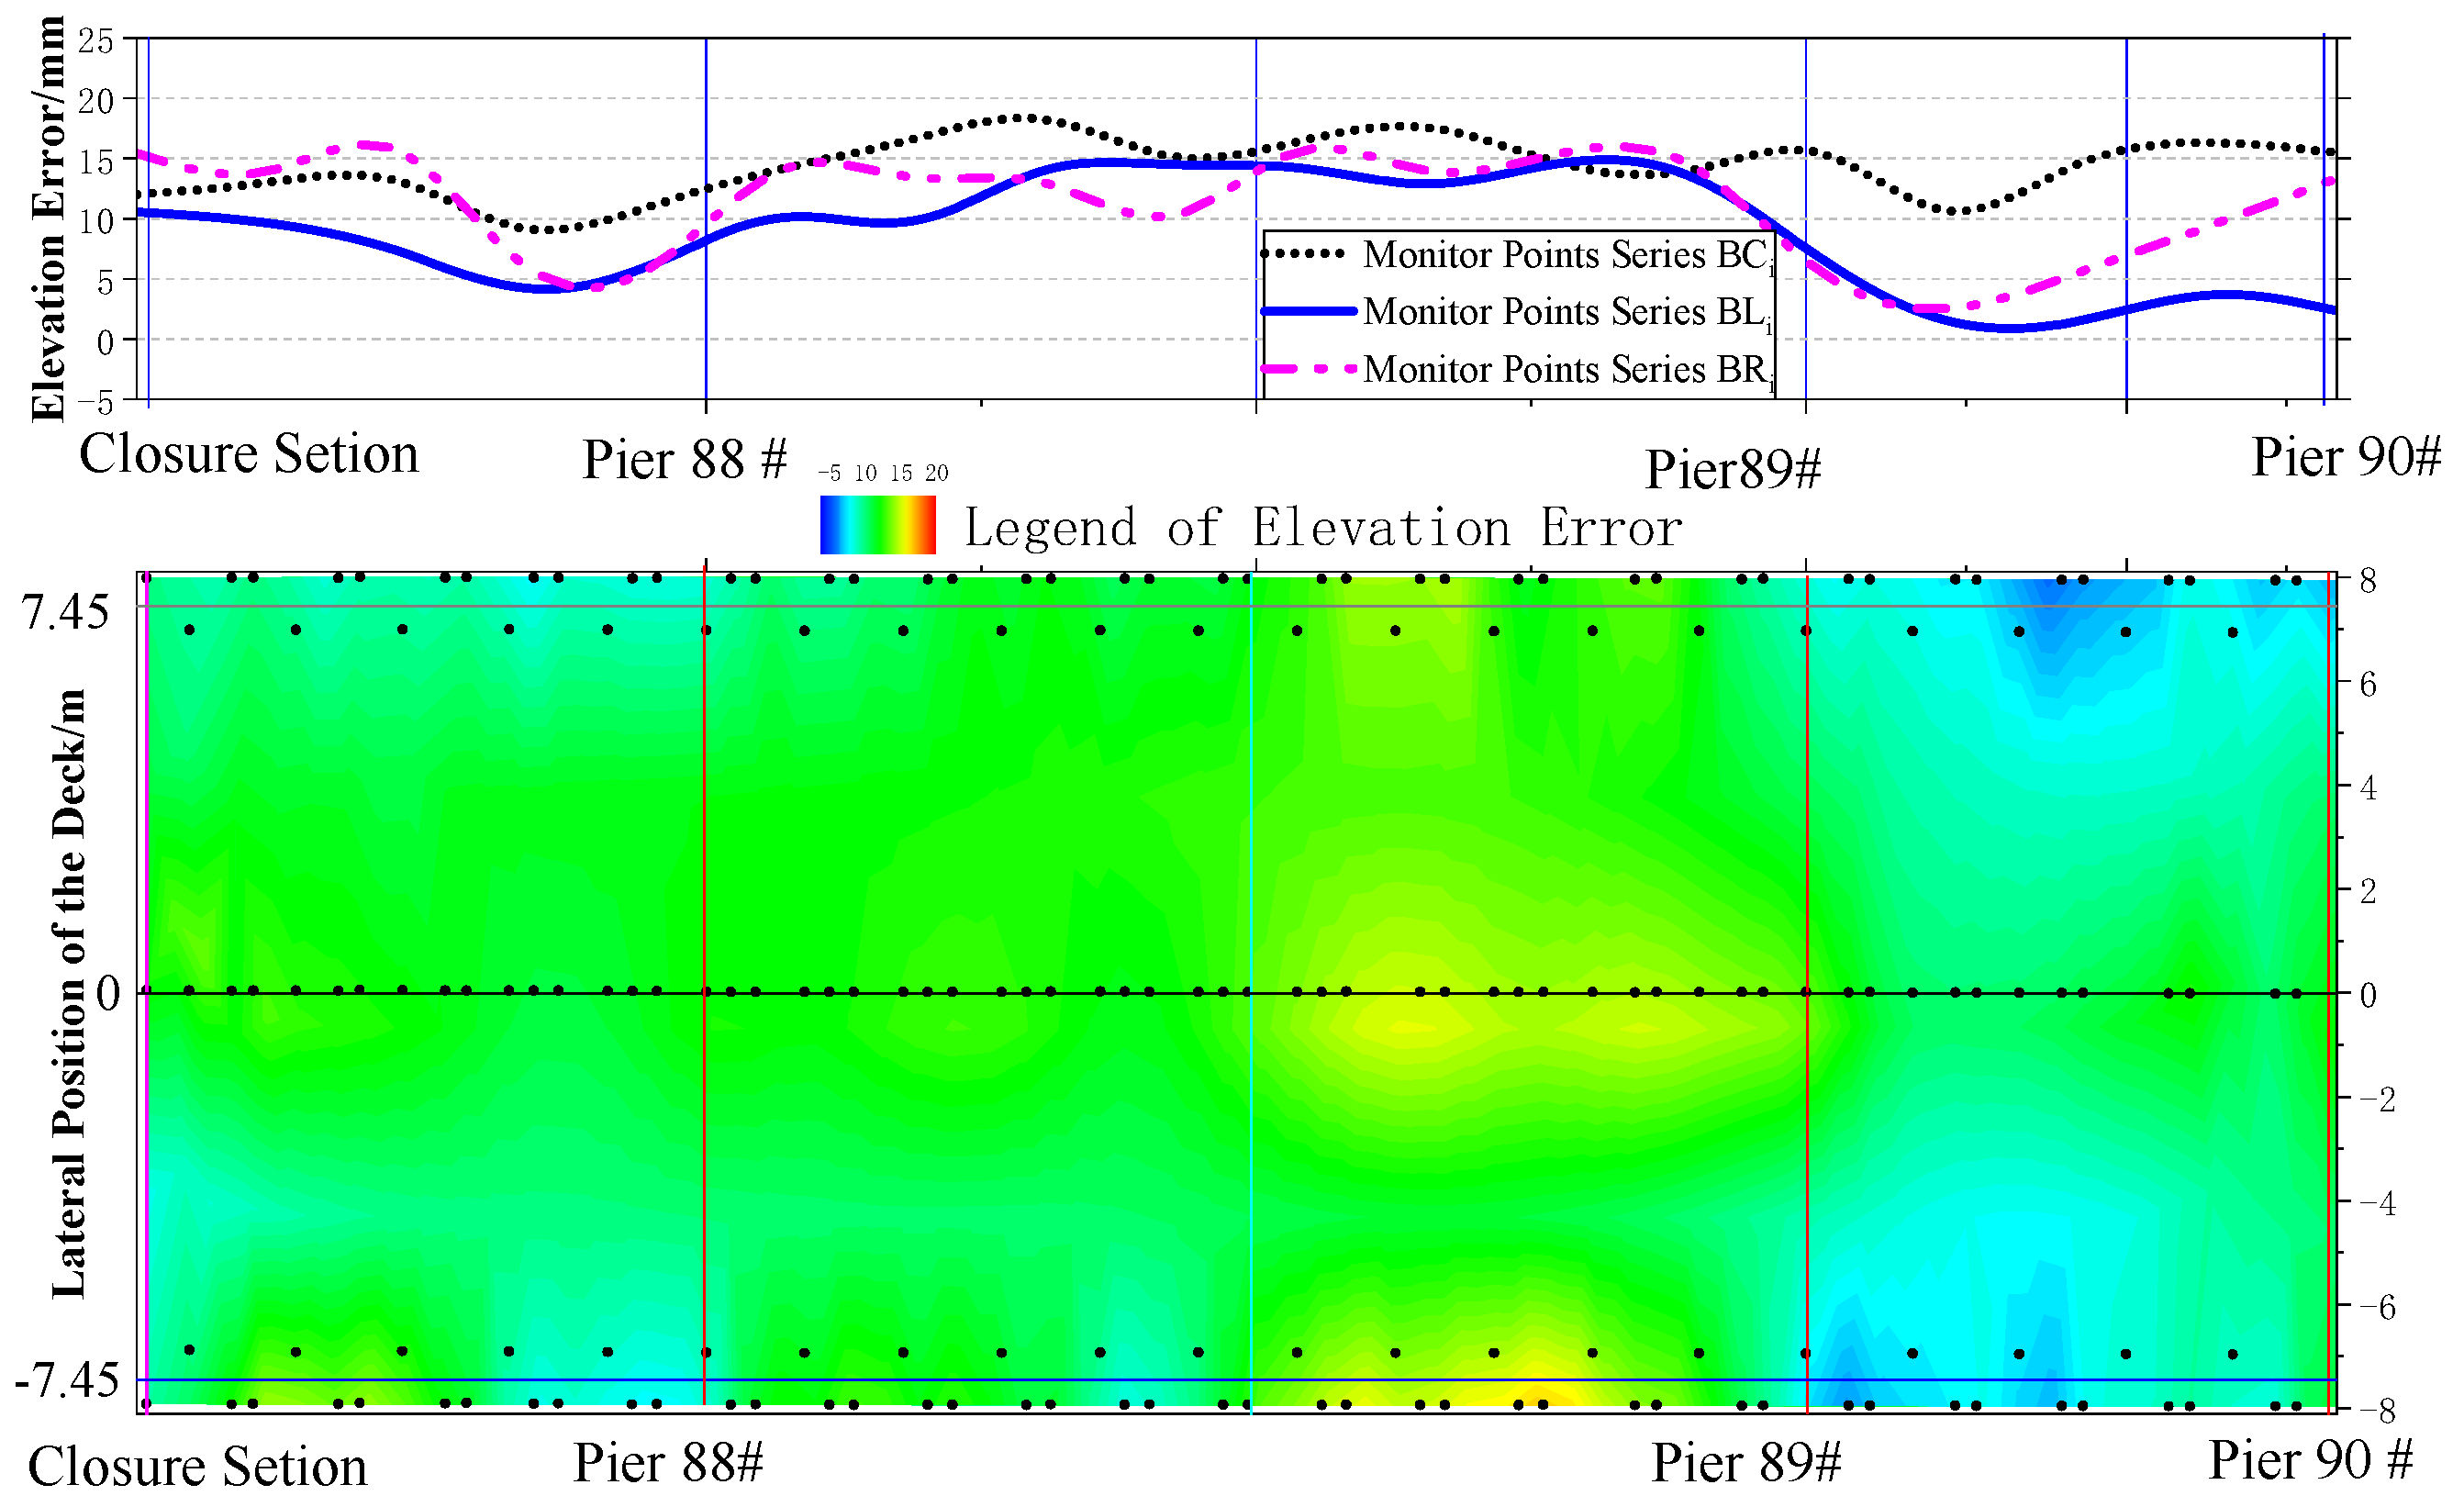
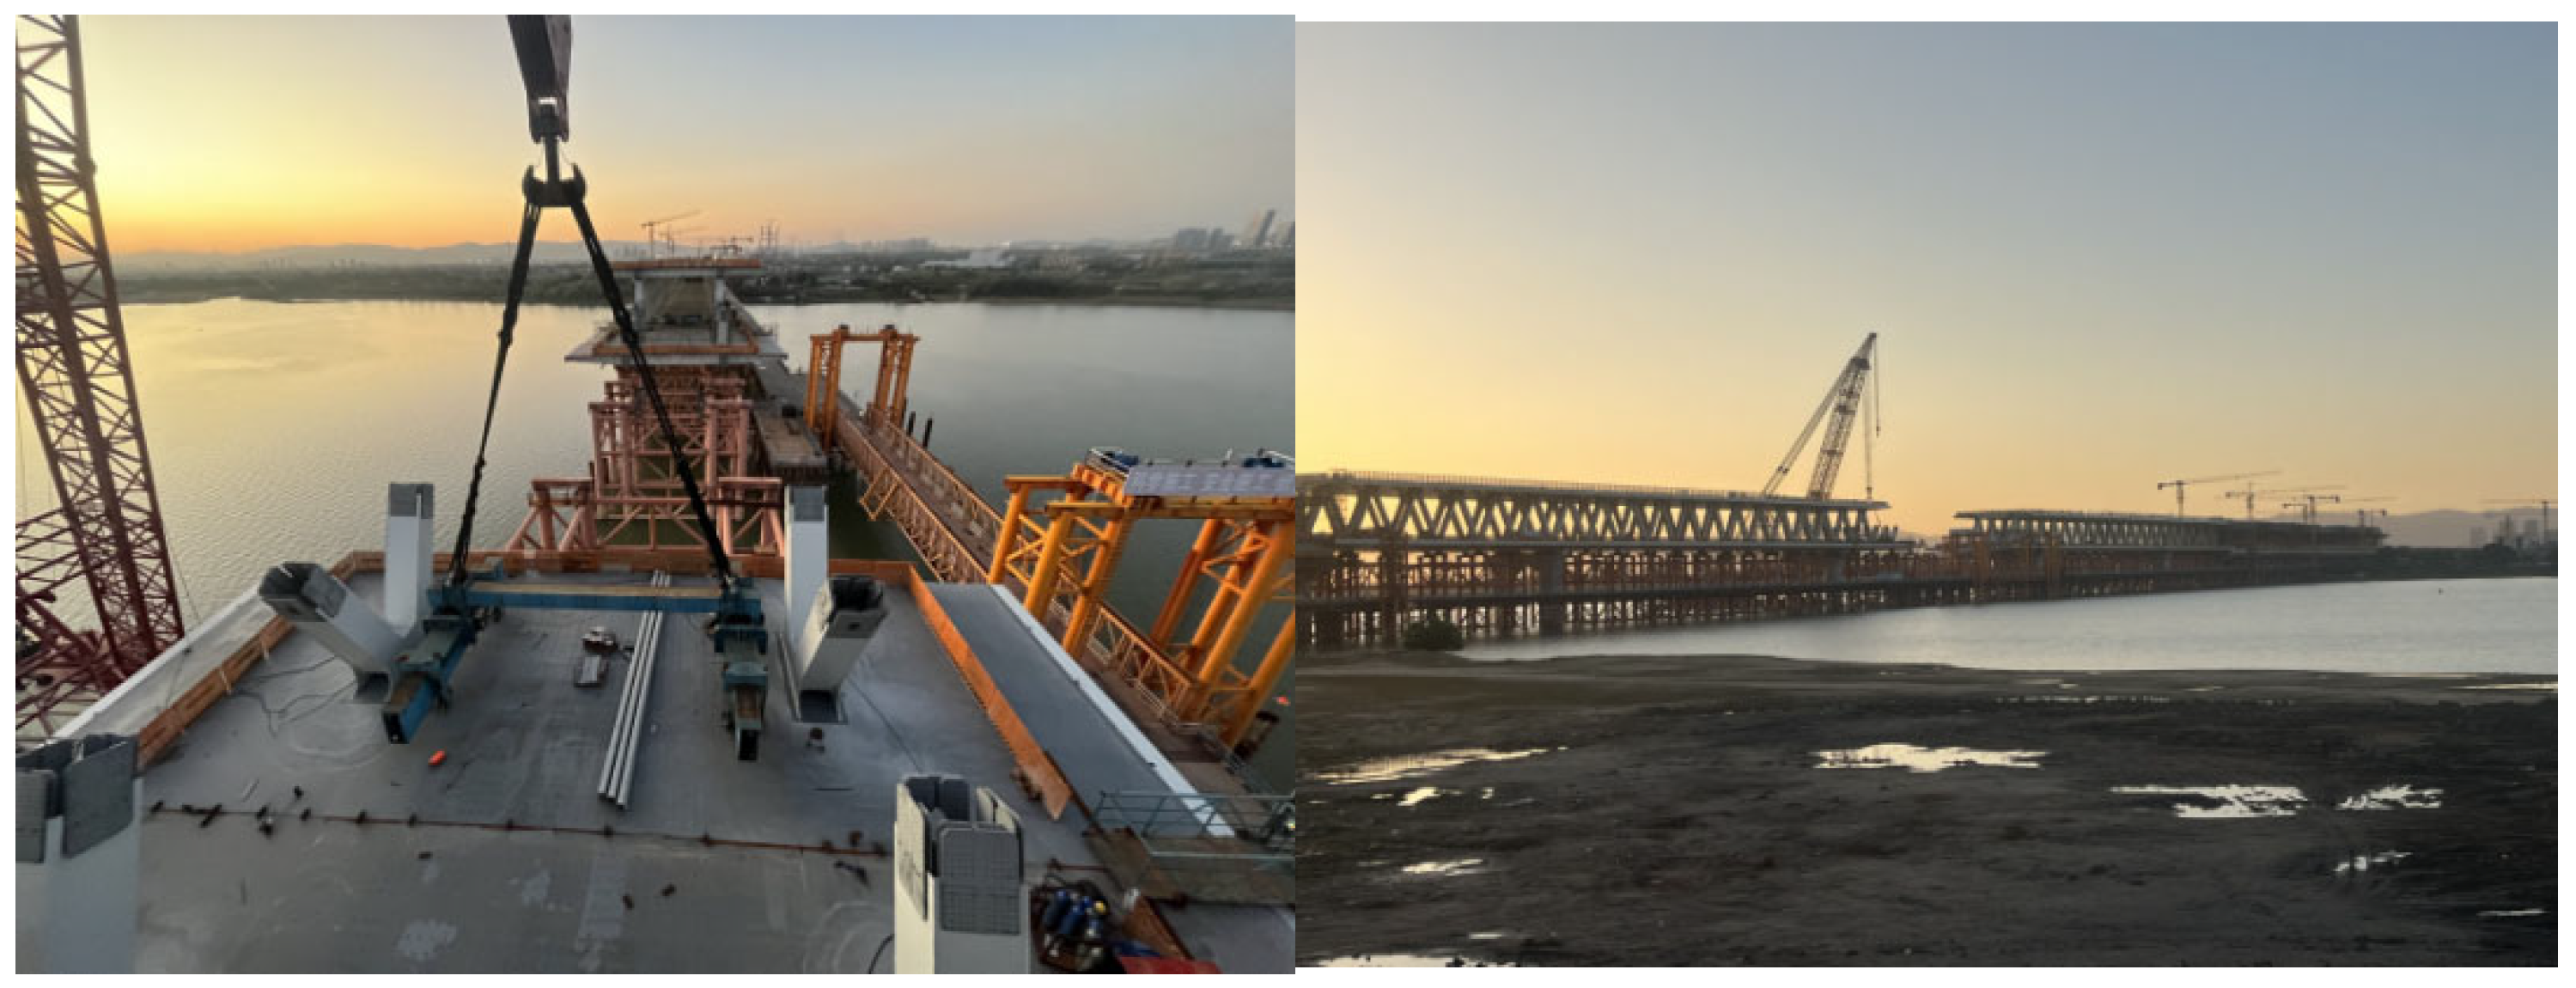
Figure 18 and Figure 19 present the construction deviations in the deck elevation prior to bridge closure, measured under conditions close to the design reference temperature. The theoretical deck elevation is the sum of the design elevation and the pre-camber value. As shown in Figure 10, for the 85# pier-side steel girder, the deviation between the measured and theoretical values of the alignment elevation monitoring points within the range of the two lower chords and the central axis falls within −5~15 mm. The deviation at the central axis alignment elevation monitoring points ranges from −5~18 mm. As illustrated in Figure 11, for the 90# pier-side steel girder, the corresponding deviations are within 0~16 mm for the area spanning the two lower chords and the central axis and 10~18 mm for the central axis monitoring points. The relative elevation error at the closure joint is minimal, indicating effective construction control. Overall photographs of the bridge before closure are provided in Figure 20.
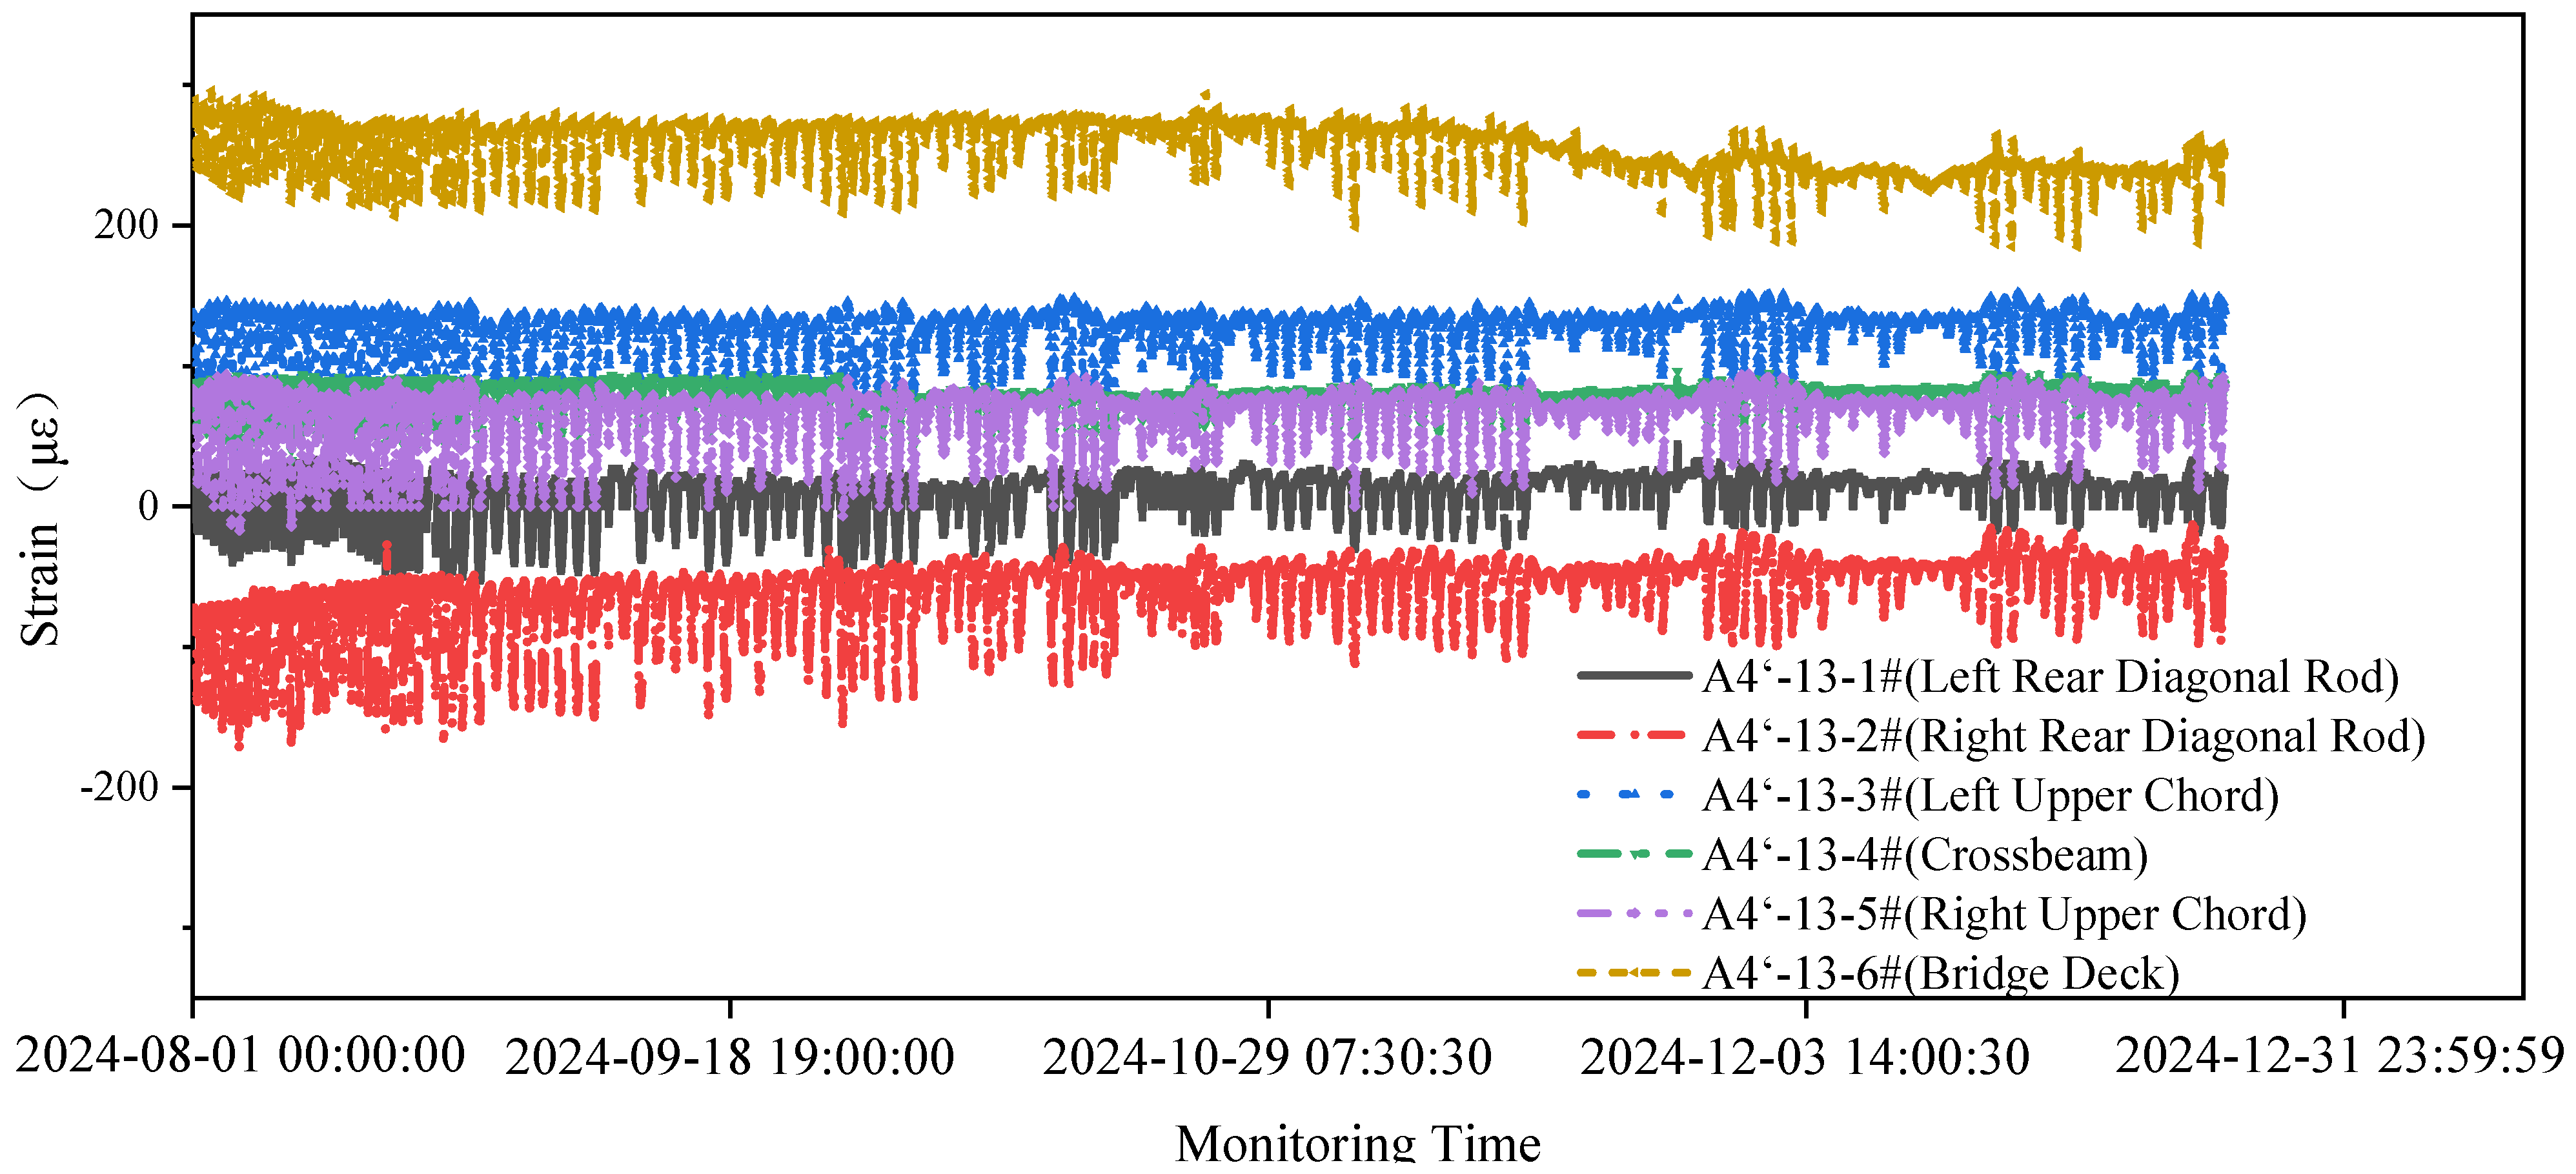
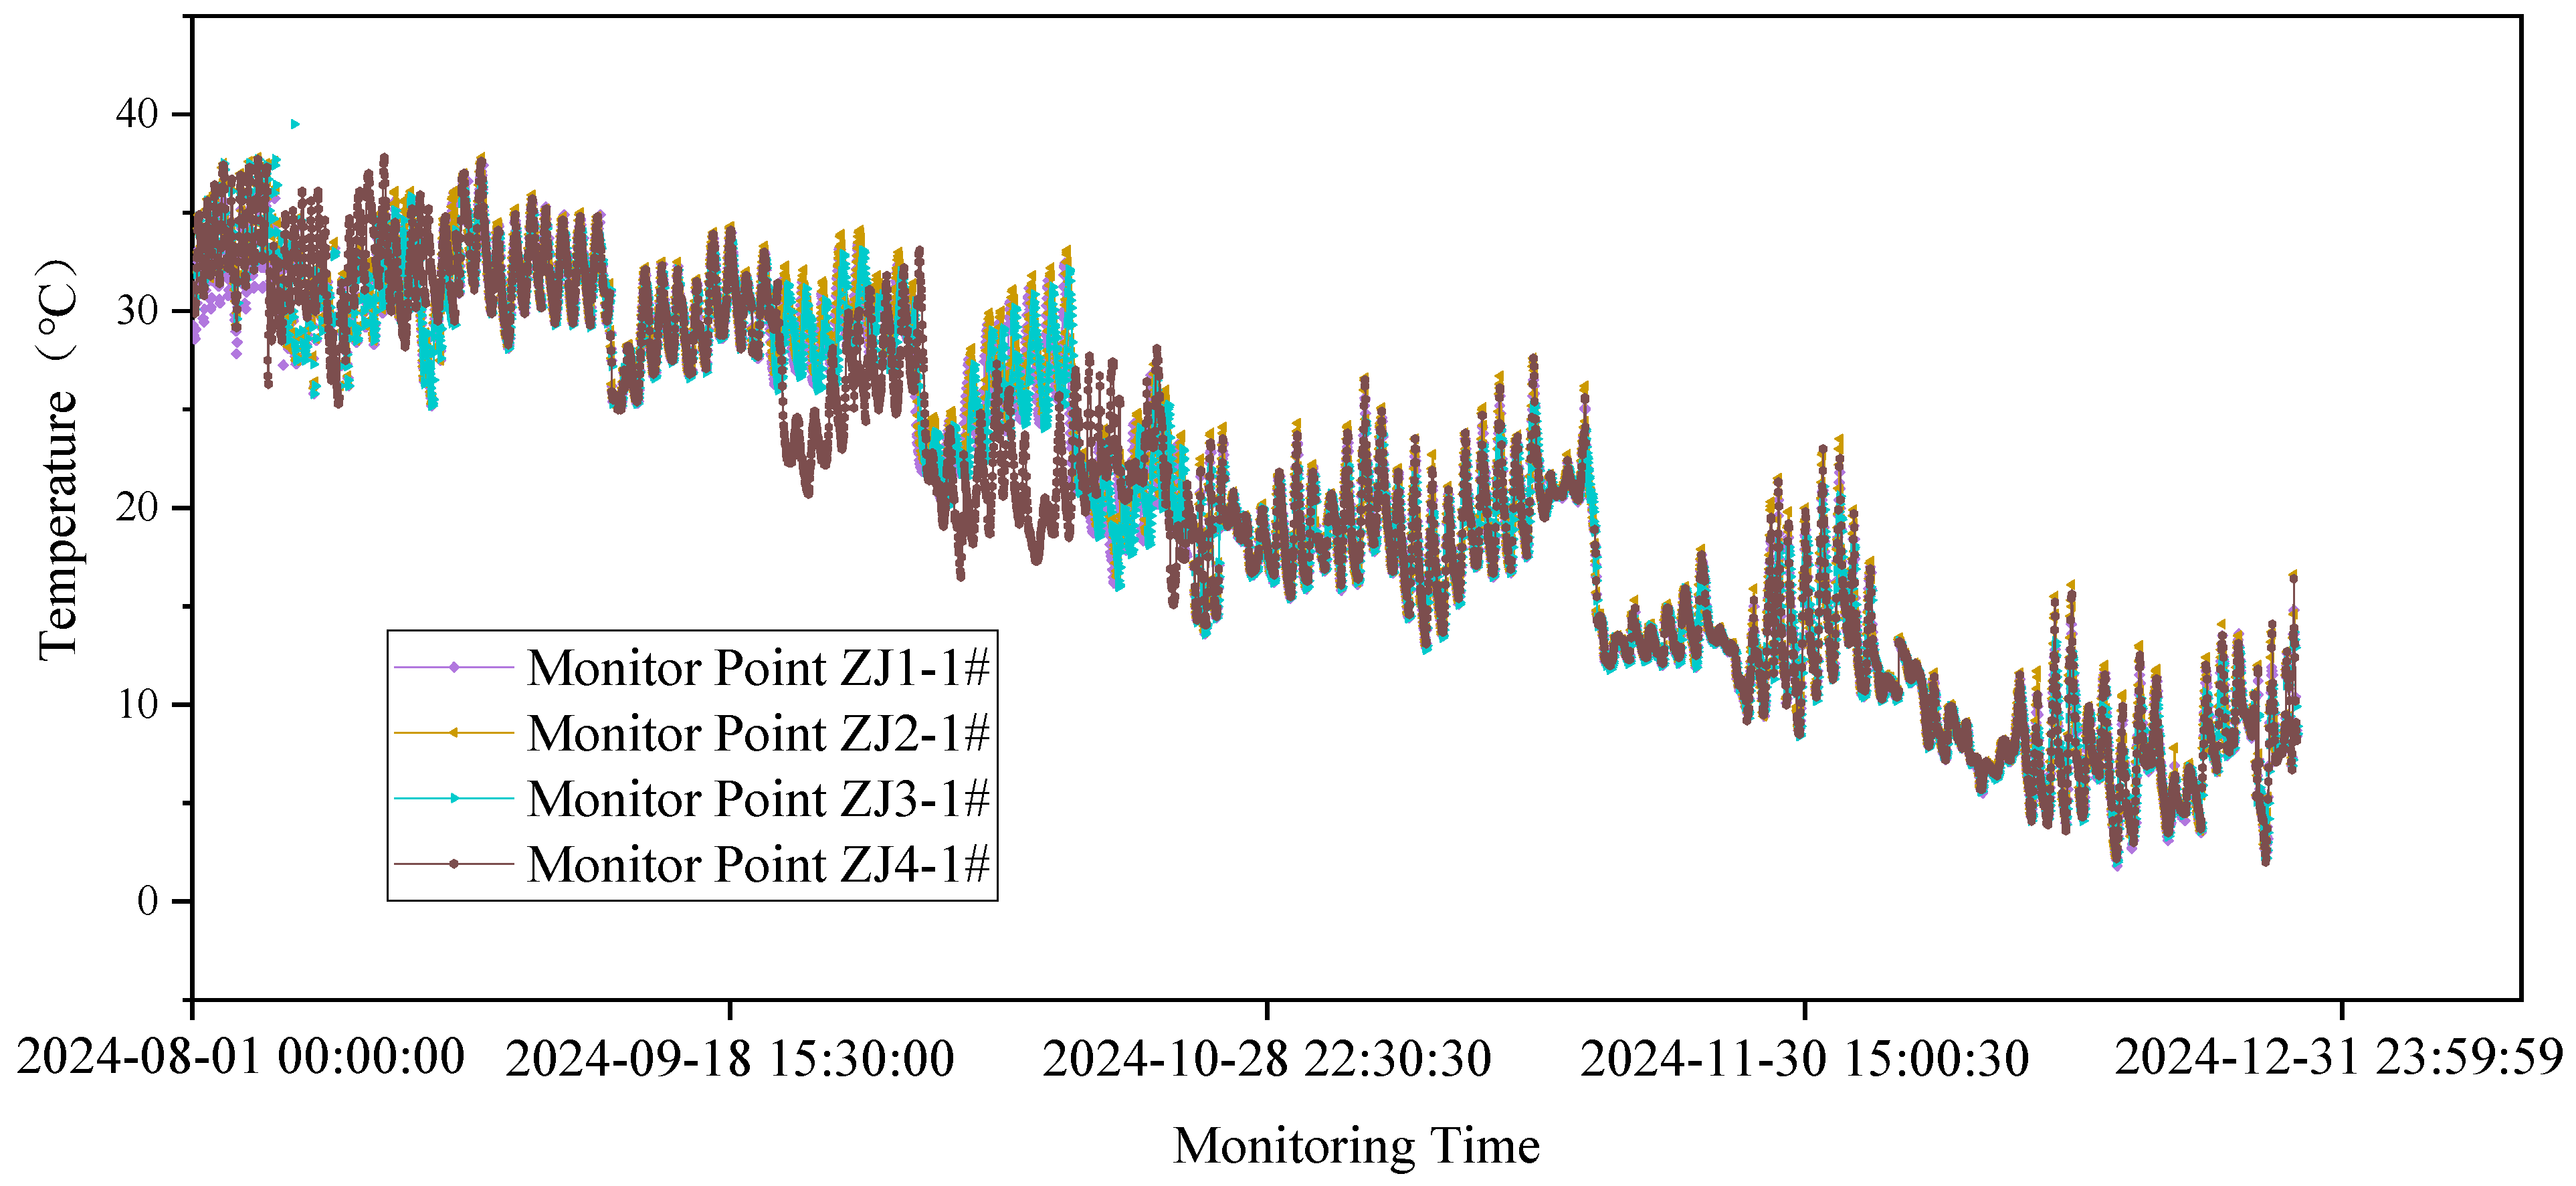
Figure 21 presents an analysis of the typical stress monitoring section at node A13 of the steel truss girder, with selected data before the temporary support removal. Monitoring data from 1 August 2024 to 31 December 2024 show that the strain variation trend of the steel girder remains stable after closure, exhibiting daily periodic fluctuations primarily influenced by temperature. Measured strains in the upper chord and diagonal web members ranged from 5 to 150, with a peak recorded stress of 30.9 MPa. This aligns closely with the maximum theoretical stress of 38.1 MPa obtained from the finite element model, demonstrating good agreement between monitoring and computational results. Stresses in other structural members, such as the bottom chord rod, right bottom chord rod, and cross beam, remain relatively stable. Among these, the strains in the upper chord and the oblique web members are relatively low, falling within the range of −200~200 μ ε .
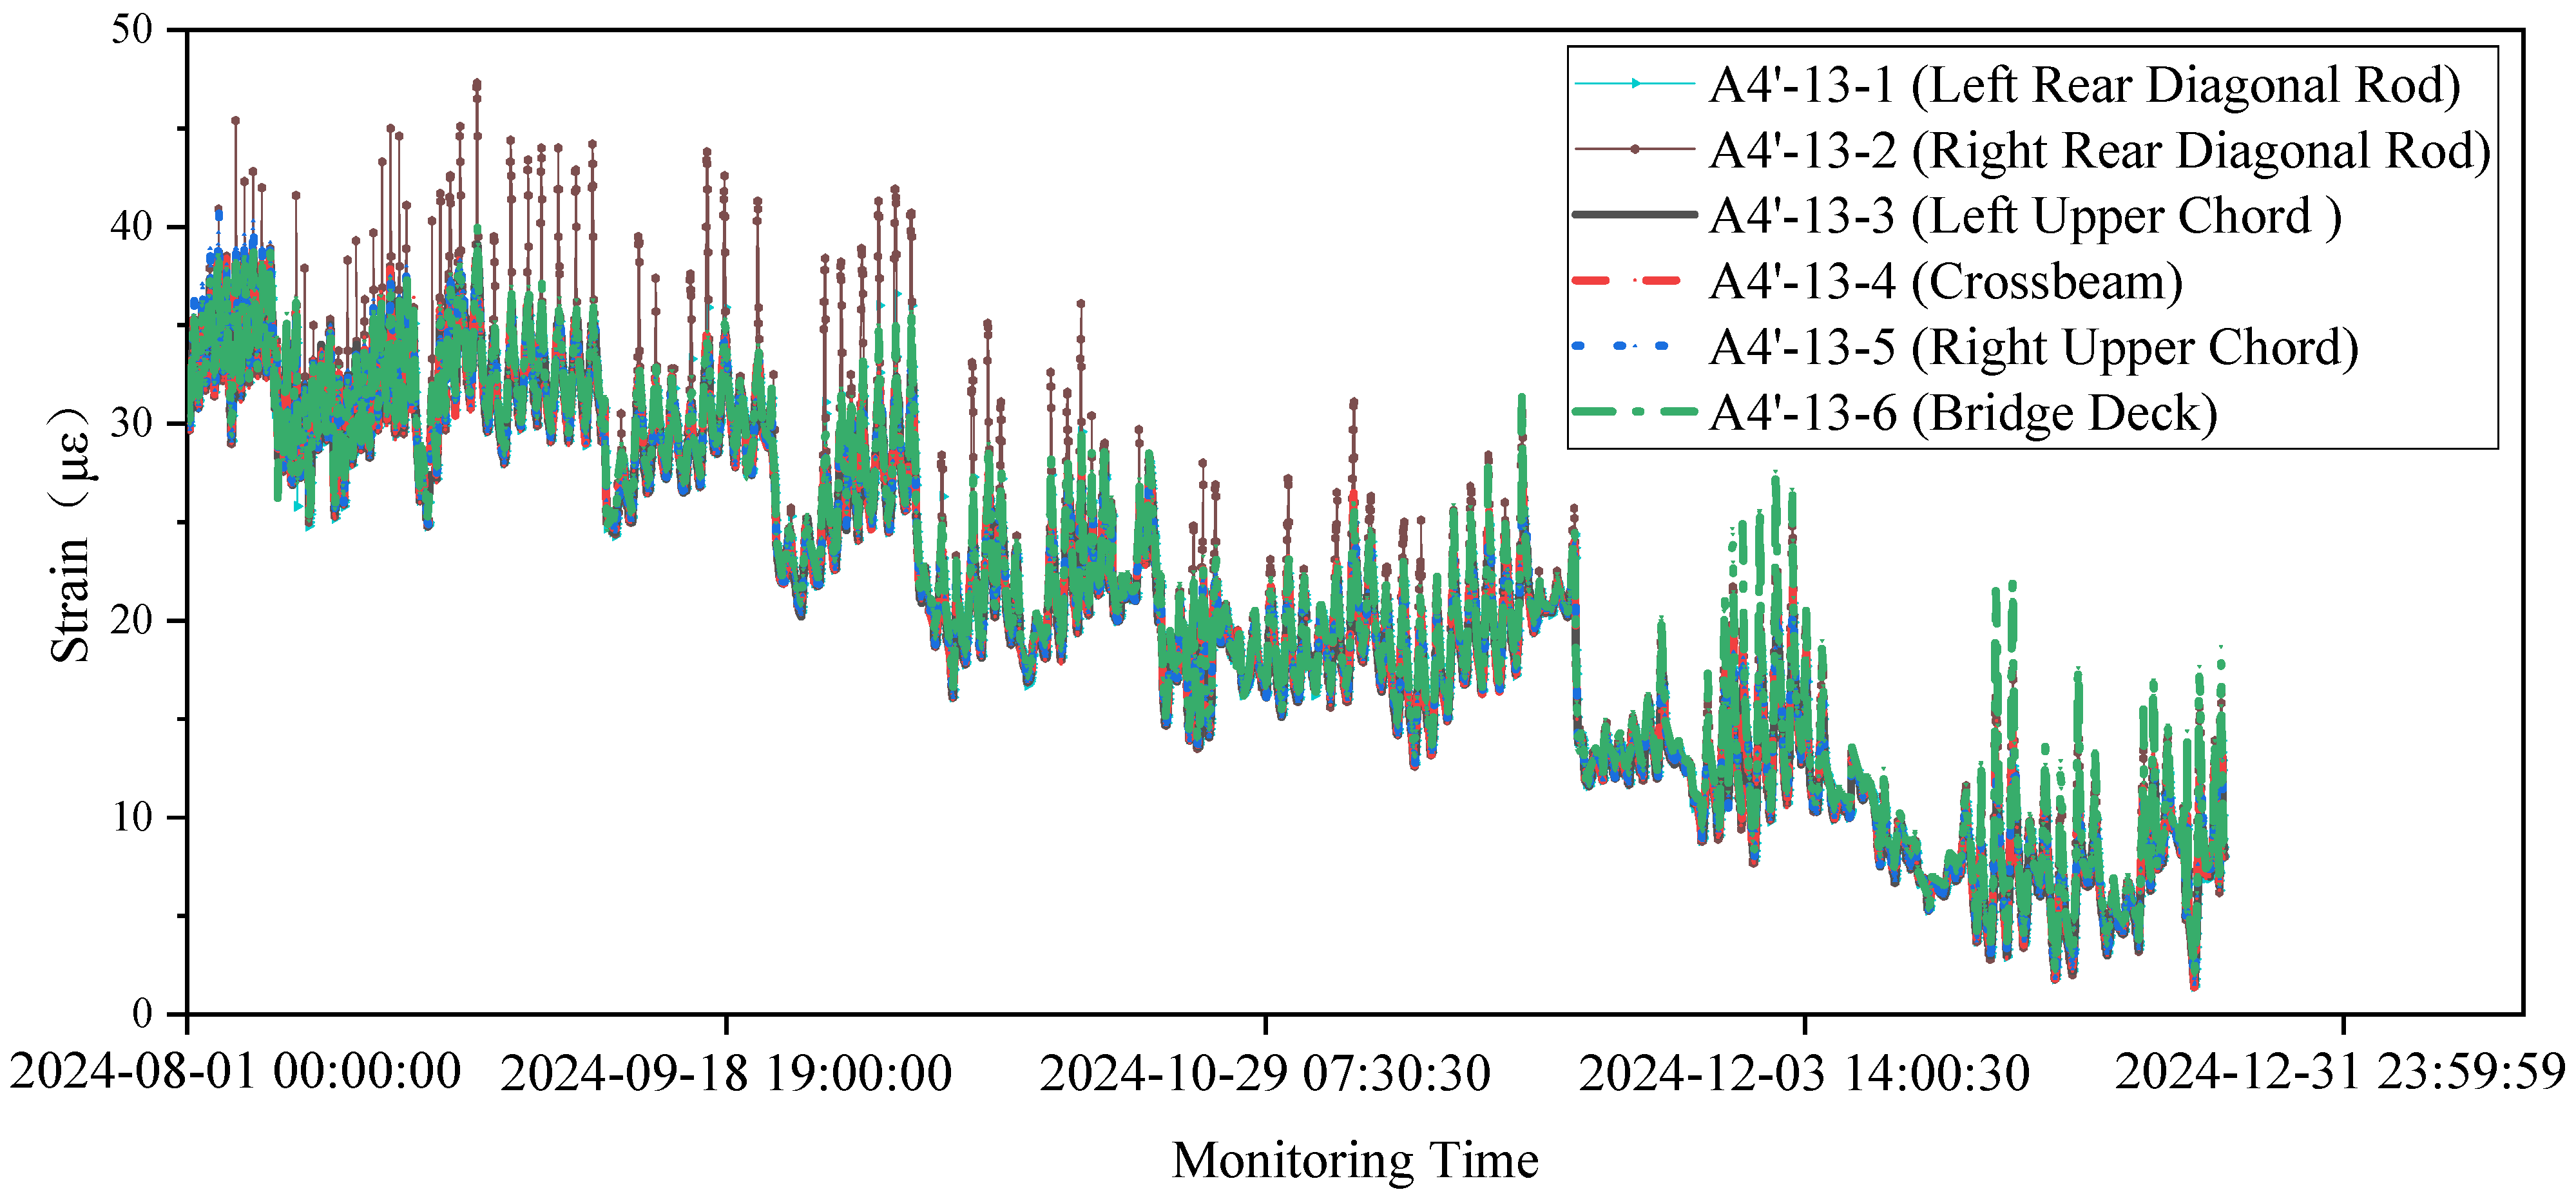
Additionally, the typical temperature monitoring section at node A13 was analyzed before support removal. As shown in Figure 22, data from 1 August 2024 to 31 December 2024 indicate a general seasonal downward trend in the overall bridge temperature, starting from 1 August, superimposed with daily fluctuations due to solar radiation. The highest temperature recorded during this period was 48 °C at the oblique web member monitoring section, which consistently exhibited higher temperatures than other locations, indicating that the oblique web members are most affected by daily solar radiation. The cross beam and lower deck slab temperatures were relatively lower. The minimum nighttime temperature recorded in January was 3 °C. The overall temperature variation amplitude during the monitoring period was approximately 45 °C.
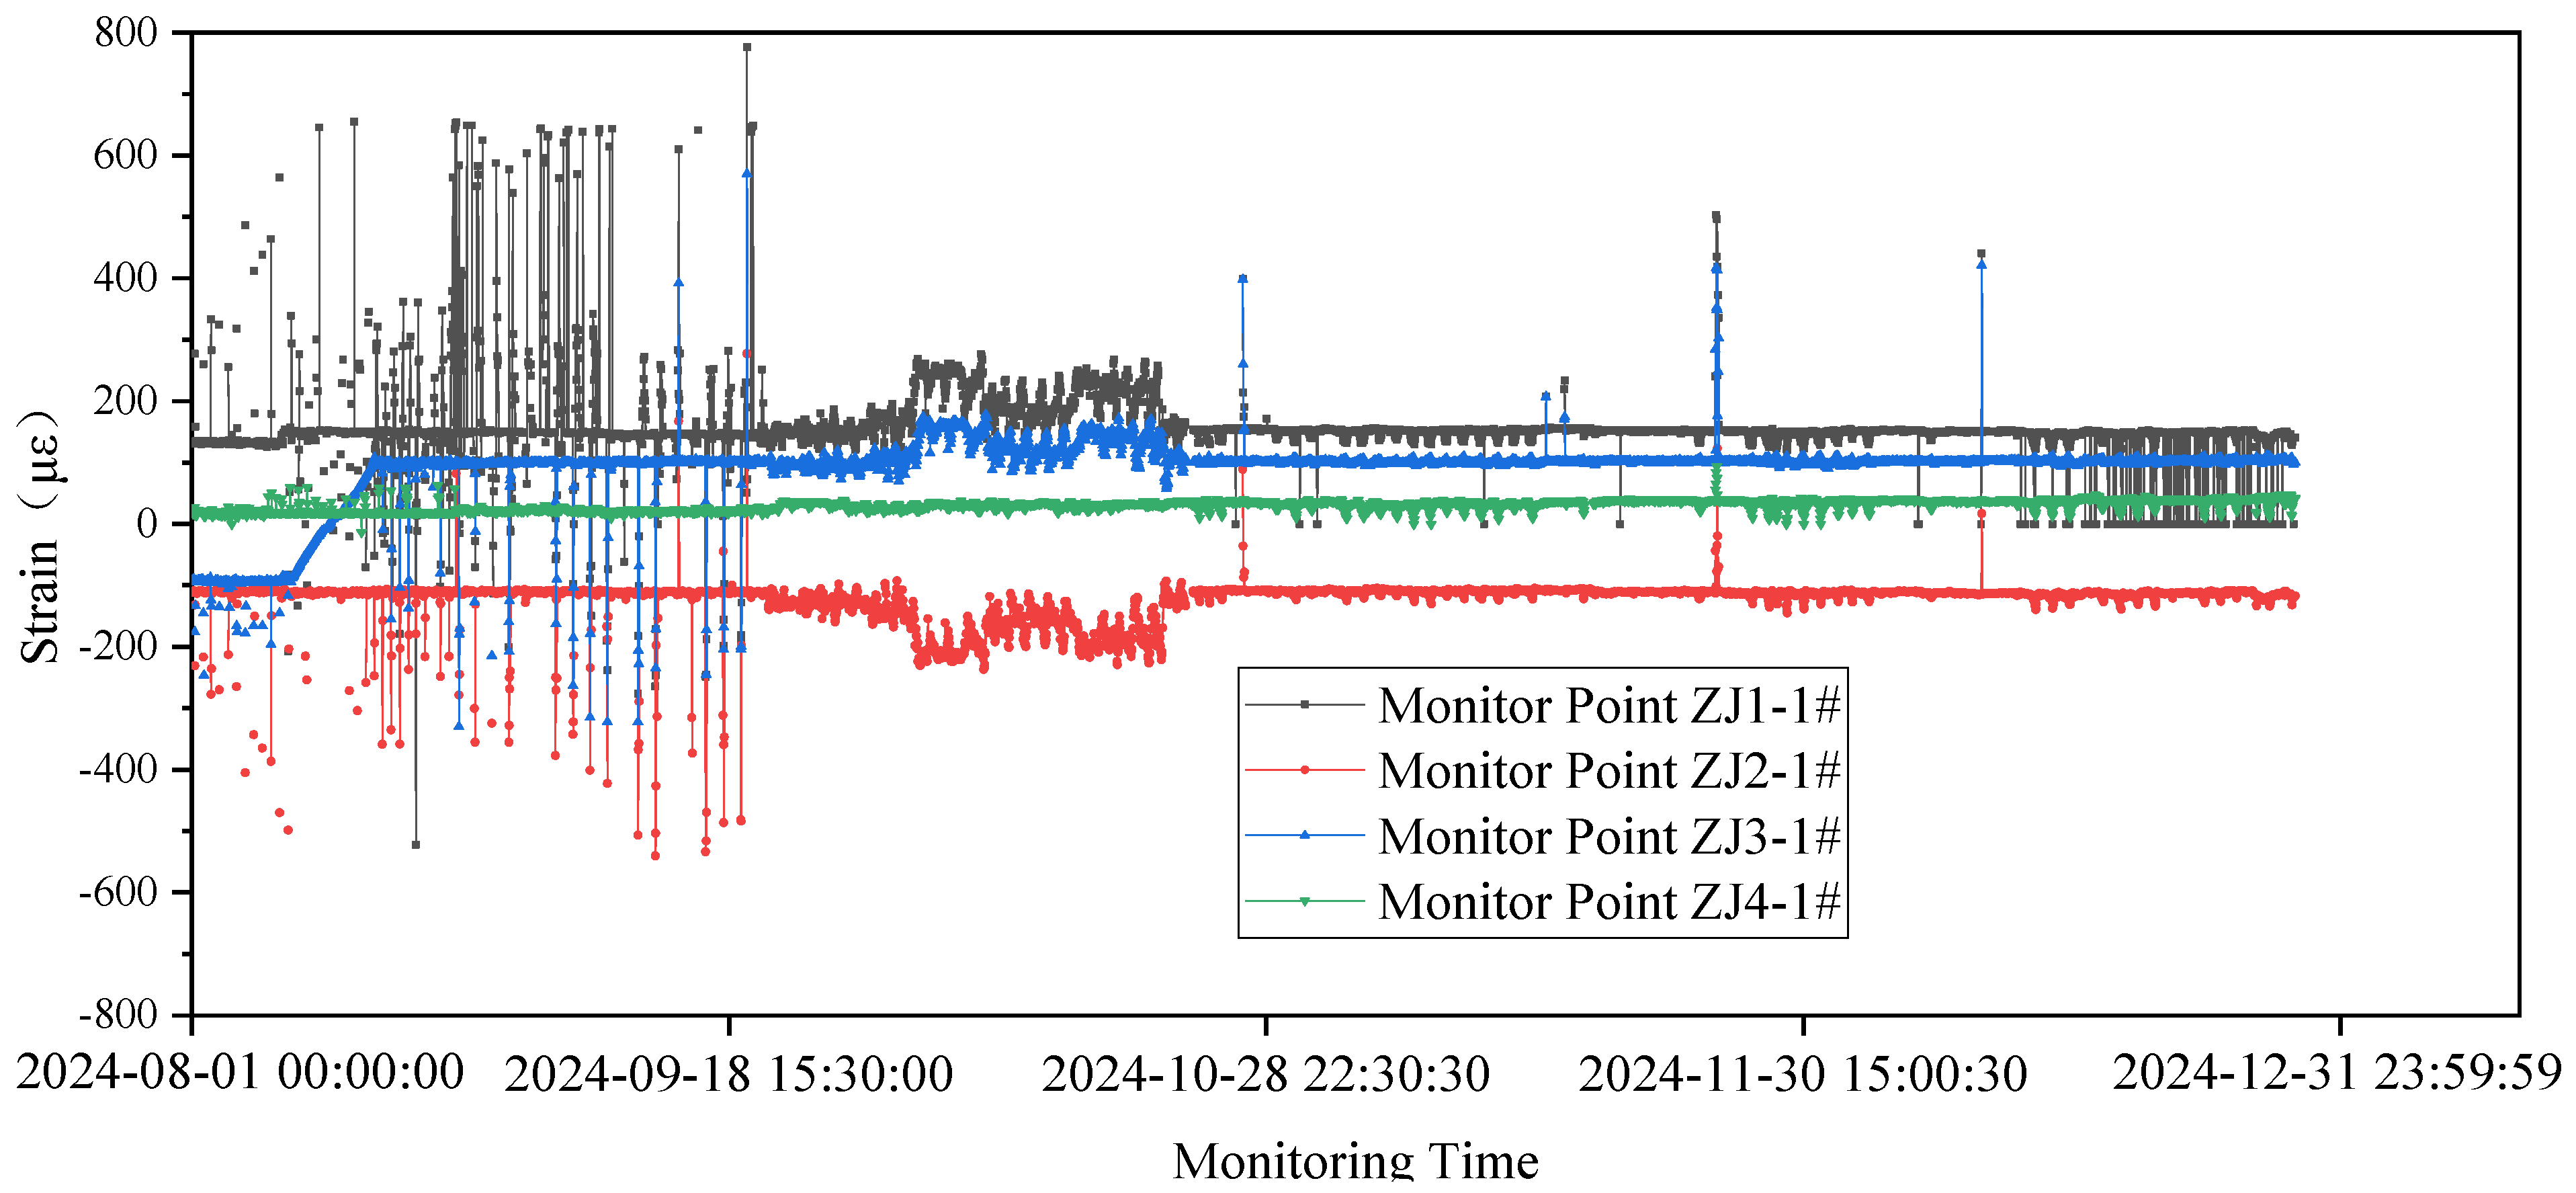
As shown in Figure 23, before 1 October 2024, the strain monitored by the framing scaffolding exhibited significant fluctuations. This was primarily due to the intensive installation of steel truss girder segments prior to this date, during which the structure was subjected to construction loads such as hoisting and lowering of girders. These activities frequently induced abrupt strain changes, which were confirmed on-site to be mainly caused by mechanical impacts and vibrations from construction equipment affecting the strain sensors. After 1 October 2024, the strain variation trend gradually stabilized. Some fluctuations persisted in areas where segmental construction activities remained in close proximity, but the majority of cumulative strains settled within a range of approximately −100 μ ε to 200   μ ε , with minor daily variations influenced by solar radiation and other environmental factors.
To rigorously assess the degree of construction load interference on the strain gauge (ZJ1-1#) and ZJ1-3#) during the pre-installation period, we implemented an approach employing the structural health monitoring (SHM) response analysis method. A detailed analysis of the data fluctuations and spectral characteristics was performed, as detailed in Figure 24. The results exhibited substantial data fluctuations of ZJ1-1# during August–September 2024, indicating pronounced susceptibility to construction interference. Data stabilized significantly after October 2024. Subsequent Fast Fourier Transform (FFT) analysis revealed a disordered spectral signature, further confirming the presence of random, construction-load-induced data anomalies. In fact, this sensor generated recurrent alarms during construction; subsequent on-site verification confirmed their correlation with transient construction loads, leading to their justified exclusion. Data fluctuations of ZJ1-3# were observed during August–September 2024, showing that the majority of cumulative strains settled within a range of approximately −50 μ ε to 50   μ ε , within the stress safety range.
Figure 25 also displays temperature monitoring data from four representative support sections before removal, covering the period from 1 August 2024 to 31 December 2024. A general seasonal cooling trend is observed, starting on 1 August, with daily variations due to solar radiation. The maximum support temperature recorded was 38 °C, which is 10 °C lower than the maximum bridge temperature. The minimum support temperature in January was 3 °C, consistent with the bridge’s minimum. The daily temperature amplitude of the framing scaffolding was slightly smaller than that of the bridge, and temperatures at different support monitoring locations were generally similar.
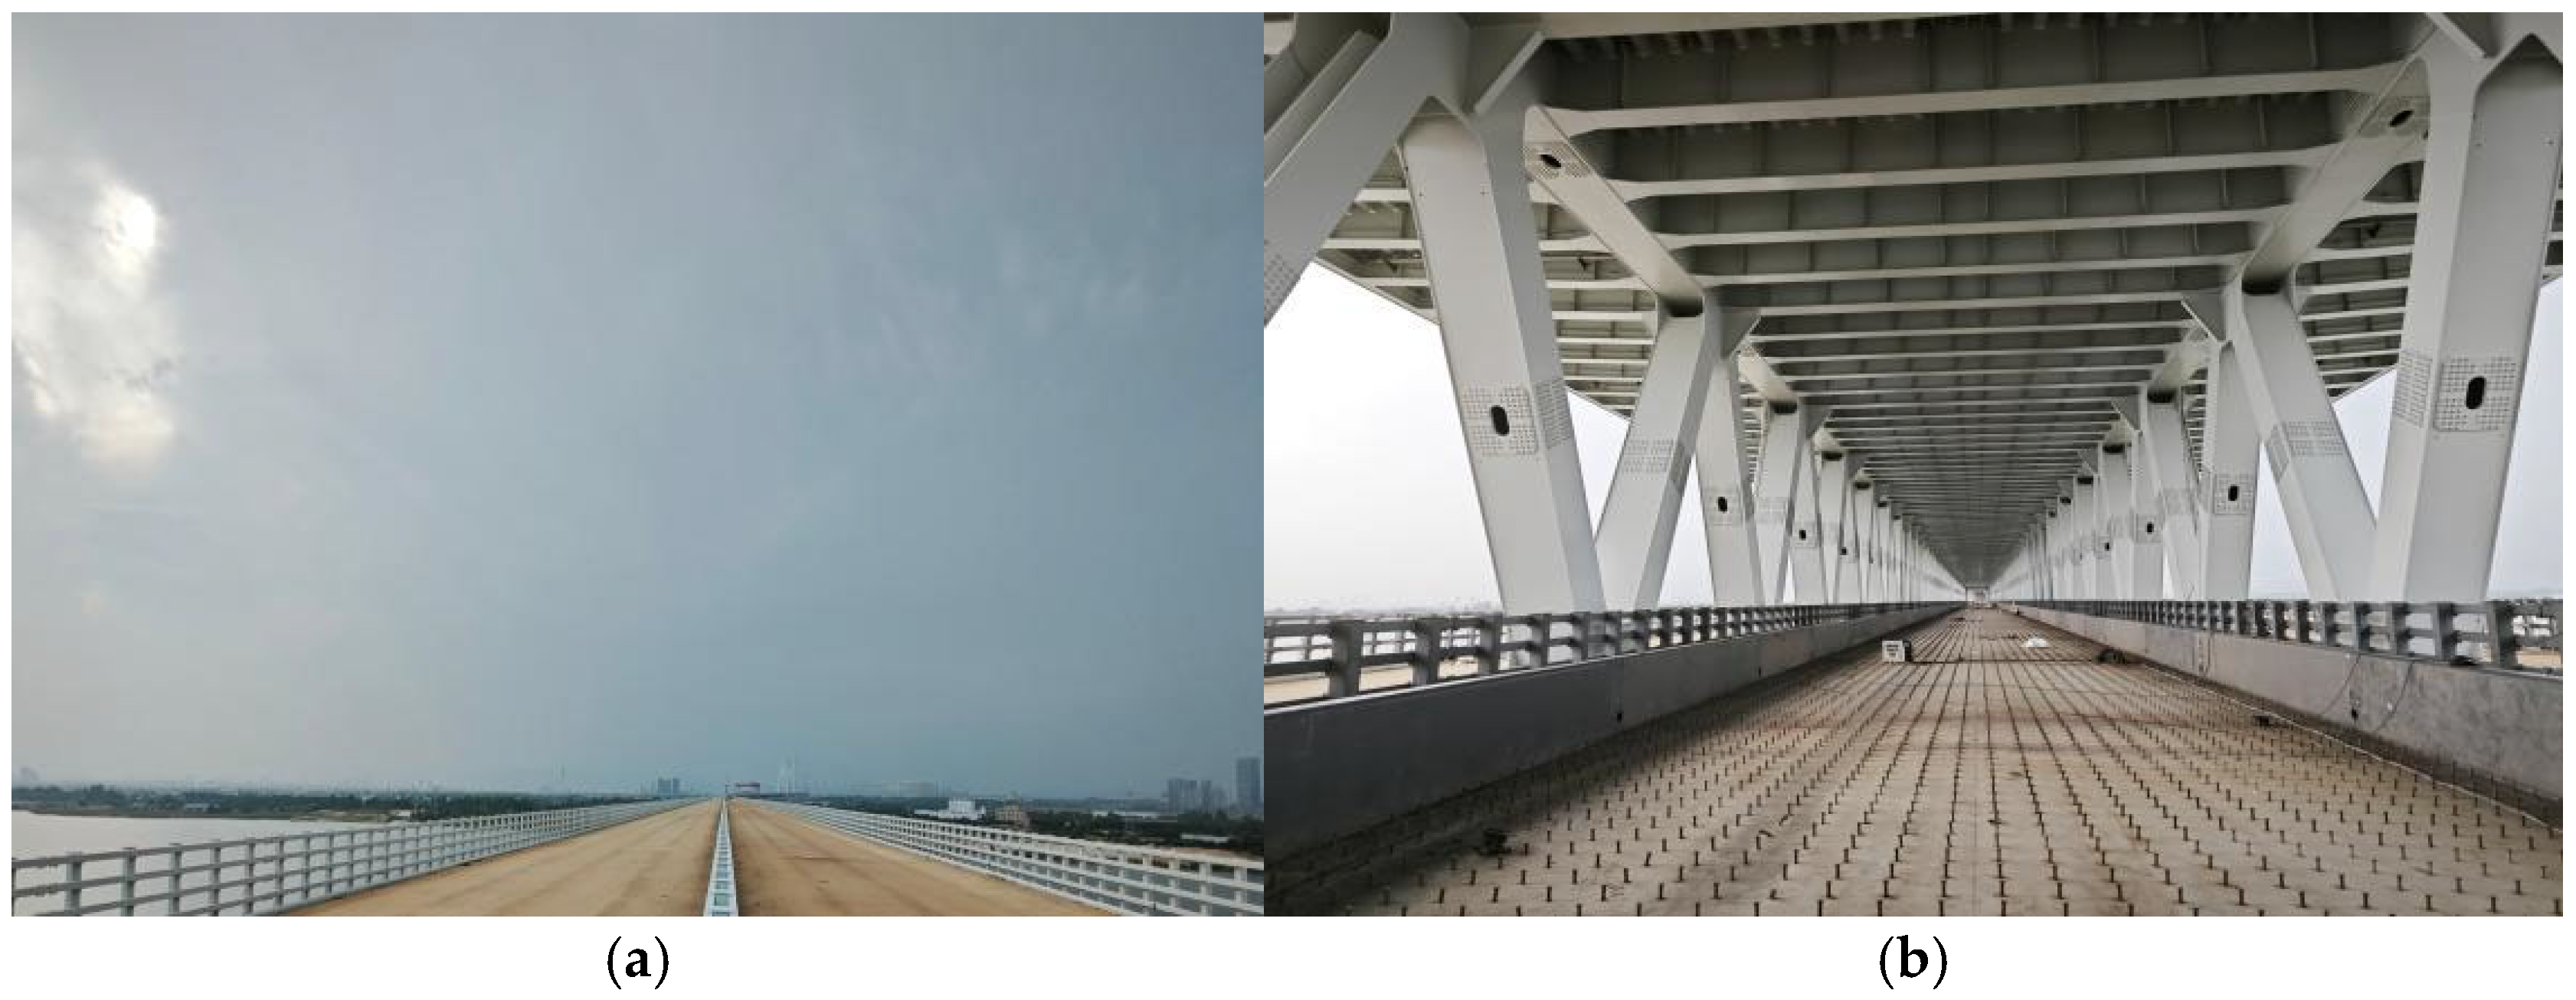
Figure 26 shows the deck elevation construction deviations after bridge closure, framing scaffolding removal, and system transformation, under conditions near the design reference temperature. The theoretical deck elevation remains the sum of the design elevation and the pre-camber value, as well as the theoretical deck deformation from FEM prediction. As indicated in Figure 12, for the 85# pier-side steel girder, deviations between measured and theoretical alignment elevation values within the two lower chords and central axis range from −5~15 mm, and from −5 ~18 mm along the central axis. For the 90# pier-side steel girder (Figure 13), deviations are within 0–16 mm for the lower chords and central axis area and 10~18 mm along the central axis. The relative elevation error at the closure joint remains very small, and the good agreement between the measurement data and the FEM prediction results demonstrate satisfactory construction control. Overall photographs of the bridge after support removal are provided in Figure 27 and Figure 28.

6. Conclusions

The successful construction of a long-span continuous steel truss rail-cum-road bridge for high-speed railway applications demonstrates the essential role of comprehensive construction-phase analysis, parameter sensitivity studies, and precise geometry control through pre-camber design. The following conclusions are drawn:
  • The project validates the effectiveness of an integrated construction control system. This system combined high-fidelity FEM analysis, real-time multi-parameter monitoring, and well-defined closure techniques. The close alignment within 1.8 cm between the predicted and measured final bridge line shape confirms the system’s robustness.
  • Continuous high-precision monitoring of geometry, structural stress, and temperature provided a critical feedback mechanism for the early detection of deviations. The closure segment was joined to the existing steel truss sections strictly according to the monitoring temperature of 10 °C using a pre-cut length scheme to ensure proper alignment and minimize residual stresses. This data-informed approach was vital for timely decision-making for steering the structure toward its intended geometric state and mitigating risks associated with cumulative errors.
  • The feasibility of machine learning for efficient camber prediction is established, A comparative analysis between ML predictions and theoretical methods for member elongation revealed that the Extra Trees (ET) model and K-Nearest Neighbors (KNN) model achieved the excellent accuracy, with errors within 2 mm, paving the way for future applications whose robustness hinges on the development of more extensive databases of continuous steel truss rail-cum-road bridges.
  • Parameter sensitivity analysis quantified the significant impact of temperature on closure precision. Longitudinal displacement (X-direction) of the top chord at the closure interface was highly sensitive to uniform temperature changes, with a 15 °C differential inducing approximately 10–12 mm of movement. Therefore, it is strongly recommended to perform closure welding when the ambient temperature is stable and close to the design reference temperature based on real-time field measurements. Construction under significant thermal differentials should be avoided to ensure closure accuracy.

Author Contributions

Investigation, J.Z. and F.W.; software, Y.L. and Z.L.; analysis, J.Z. and F.Z.; resources, J.Z.; writing—original draft preparation, J.Z.; writing—review and editing, F.W. and Y.L.; supervision, M.F.; project administration, J.Z.; funding acquisition, J.Z. and M.F. All authors have read and agreed to the published version of the manuscript.

Funding

This research was funded by the National Natural Science Foundation of China (Grant No. 52068022), the Fundamental Research Funds for the Central Universities, CHD (Grant No. 300102213517), the Science and Technology Research Program of China State Railway Group Co., Ltd. (Grant No. 2023G040).

Data Availability Statement

The data presented in this study are available on request from the corresponding author due to the specialized nature of the data.

Conflicts of Interest

Authors Jun Zhou and Fangwen Weng were employed by the company CCCC Second Harbor Engineering Company Ltd. The remaining authors declare that the research was conducted in the absence of any commercial or financial relationships that could be construed as a potential conflict of interest.

References

  1. Robin, S.H. Design of the Padma road and rail bridge, Bangladesh. Proc. Inst. Civ. Eng. Bridge Eng. 2015, 168, 181–192. [Google Scholar] [CrossRef]
  2. Chen, H.P.; Lu, S.H.; Wu, W.B.; Da, I.L.; Ceravolo, R. Fatigue damage assessment of a large rail-cum-road steel truss-arch bridge using structural health monitoring dynamic data. Case Stud. Constr. Mater. 2024, 21, e03772. [Google Scholar] [CrossRef]
  3. Xie, X.; Su, H.; Pang, M. Mechanical Properties and Experimental Study of a New Laminated Girder Single Tower Cable-Stayed Bridge. Int. J. Steel Struct. 2023, 23, 872–885. [Google Scholar] [CrossRef]
  4. Wang, G.; Zhou, X.; Ding, Y.; Liu, X. Long-term monitoring of temperature differences in a steel truss bridge with two-layer decks compared with bridge codes: Case study. J. Bridge Eng. 2021, 26, 05020013. [Google Scholar] [CrossRef]
  5. Wang, Y.; Saul, R. Wide Cable-supported Bridges for r ail-cum-road Traffic. Struct. Eng. Int. 2020, 30, 551–559. [Google Scholar] [CrossRef]
  6. Xu, W.; Bao, L.X.; Liu, H. Retrofitting design of roadway bridge of main bridge of Jiujiang Changjiang river bridge. Bridge Constr. 2017, 47, 88–93. [Google Scholar]
  7. Chen, Y.; Sun, H.; Feng, Z. Study on seismic isolation of long span double deck steel truss continuous girder bridge. Appl. Sci. 2022, 12, 2567. [Google Scholar] [CrossRef]
  8. Yi, L.; Mei, D.P.; Zhou, C. Design of a rail–road asymmetrical low-pylon cable-stayed bridge with a main span of 588 m. Proc. Inst. Civil Eng. Bridge Eng. 2020, 173, 190–197. [Google Scholar] [CrossRef]
  9. Luo, X.; Fu, S.X.; Gu, X.L.; Cai, L.R. Analysis of Effect of Fetching Girder from Trestle of Long-Span Steel Truss Bridge under Cantilever Erection. Appl. Mech. Mater. 2014, 3308, 1522–1526. [Google Scholar] [CrossRef]
  10. Nathan, M.; Reuben, Z. Temporary works for dismantling steel cantilever truss bridges in the USA. Proc. Inst. Civ. Eng. Civ. Eng. 2023, 176, 40–47. [Google Scholar]
  11. Wang, L.; Xu, J.; Li, Y.; Zhou, S. Closure technology of large span steel truss arch bridge with temporarily fixed edge supports. Nonlinear Eng. 2025, 14, 20240067. [Google Scholar] [CrossRef]
  12. Wu, X.; Wu, T.; Chen, W. Analysis of height difference between three trusses of a steel truss bridge during incremental launching. Stahlbau 2018, 87, 910–922. [Google Scholar] [CrossRef]
  13. Ding, S.H.; Fang, J.; Zhang, S.L.; Liang, S.S. A Construction Technique of Incremental Launching for a Continuous Steel Truss Girder Bridge with Suspension Cable Stiffening Chords. Struct. Eng. Int. 2020, 31, 93–98. [Google Scholar] [CrossRef]
  14. Shi, H.; Zhang, M.; Jin, T.; Shi, X.; Zhang, J.; Xu, Y.; Guo, X.; Cai, X.; Peng, W. Computer Vision-Based Monitoring of Bridge Structural Vibration During Incremental Launching Construction. Buildings 2025, 15, 1139. [Google Scholar] [CrossRef]
  15. Martins, M.H.; Thrall, P.A.; Byers, D.D.; Zoliet, T.P. Behavior of incrementally launched modular steel truss bridges. Eng. Struct. 2025, 326, 119509. [Google Scholar] [CrossRef]
  16. López, S.; Makoond, N.; Sánchez-Rodríguez, A.; Adam, J.M.; Riveiro, B. Learning from failure propagation in steel truss bridges. Eng. Fail. Anal. 2023, 152, 107488. [Google Scholar] [CrossRef]
  17. Kim, D.; Kwak, Y.; Sohn, H. Accelerated cable-stayed bridge construction using terrestrial laser scanning. Autom. Constr. 2020, 117, 103269. [Google Scholar] [CrossRef]
  18. Wang, X.; Wang, H.; Sun, Y.; Mao, X.; Tang, S. Process-independent construction stage analysis of self-anchored suspension bridges. Autom. Constr. 2020, 117, 103227. [Google Scholar] [CrossRef]
  19. Liu, H.; Li, M.; Dai, Y.; Ou, M. Key Construction Technologies for Steel Truss Bridges in High Water Level and High Flow Velocity Conditions: A Case Study for Shoupanyan Bridge. In Proceedings of the Conference on Sustainable Traffic and Transportation Engineering in 2023. CSTTE 2023, Yinchuan, China, 22–24 November 2023; Lecture Notes in Civil Engineering. Springer: Singapore, 2023; Volume 603. [Google Scholar]
  20. Zhao, H.; Ding, Y.; Nagarajaiah, S.; Li, A. Longitudinal Displacement Behavior and Girder End Reliability of a Jointless Steel-Truss Arch Railway Bridge during Operation. Appl. Sci. 2019, 9, 2222. [Google Scholar] [CrossRef]
  21. Chen, Y.; Liao, Y.; Zhu, L.; Chen, L.; Chen, Y. Robustness of a Steel Truss Bridge Subjected to Sudden Member Breakage during the Continuous-to-Simply-Supported Transition. Buildings 2024, 14, 3035. [Google Scholar] [CrossRef]
  22. Sun, Y.; Tai, X.; Liu, K.; Zhu, A.Z.; Zhu, H.P. Determining launching construction parameters of superlong superwide bridges: A multiobjective optimization method using machine learning techniques. Structures 2022, 41, 15–28. [Google Scholar] [CrossRef]
  23. Yu, X.; Deng, Y.; Yan, B. Case study of the 156 m simply supported steel truss railway bridge. Struct. Eng. Int. 2017, 27, 563–568. [Google Scholar] [CrossRef]
  24. Aksar, B.; Ozdemir, M.A.; Tutar, A.I.; Cakir, F. Structural Analysis of Steel Truss and Masonry Bridge Interaction: A Case of Ali Fuat Pasha Bridge in Sakarya, Türkiye. J. Inst. Sci. Technol. 2023, 13, 1784–1798. [Google Scholar]
  25. Tran, M.Q.; Sousa, H.S.; Ngo, T.V.; Nguyen, B.D.; Nguyen, Q.T.; Nguyen, H.X.; Baron, E.; Matos, J.; Dang, S.N. Structural Assessment Based on Vibration Measurement Test Combined with an Artificial Neural Network for the Steel Truss Bridge. Appl. Sci. 2023, 13, 7484. [Google Scholar] [CrossRef]
  26. Wang, S.; Zhang, G.; Li, J.; Wang, Y.; Chen, B. Temperature Response of Double-Layer Steel Truss Bridge Girders. Buildings 2023, 13, 2889. [Google Scholar] [CrossRef]
  27. Li, Z.F.; Niu, Z.G.; Fang, J.; Ding, S.H.; Li, W.J. Mechanical Analysis of Key Joints of Super-spanned Steel Truss Girder in Incremental Launching Construction. J. China Railw. Soc. 2021, 43, 158–165. [Google Scholar]
  28. Lou, S.; Wu, F.; Jiang, Y.; Wang, J. Mechanical Analysis of Walking—Type Incremental Launching and Sliding Construction of Large Tonnage Steel Truss Girder. Bridge Constr. 2020, 37, 35–40. [Google Scholar]
  29. Chen, H.; Li, J.; Li, Y.X. Local stress analysis of integral joint of continuous steel truss girder at construction stage. Bridge Constr. 2011, 5, 21–25+58. [Google Scholar]
  30. Edward, P.; Elena, M.; Daniel, G.; Băncilă, R. Pre-cambering in steel and composite bridge structures. Adv. Mater. Res. 2015, 1111, 169–174. [Google Scholar] [CrossRef]
  31. UT/T 1246-2019; Technical Specifications for Design of Highway Steel-Concrete Composite Beam Bridges. China Communications Press: Beijing, China, 2019.
  32. TB 10002-2017; Code for Design of Railway Bridge and Culvert. China Railway Publishing House: Beijing, China, 2017.
  33. CJJ11-2011; Code of Design for City Bridge. China Architecture & Building Press: Beijing, China, 2011.
  34. Qin, S.Q. Theory and Practice of Unstressed State Method for Bridge Construction Control; Communications Press: Beijing, China, 2006. (In Chinese) [Google Scholar]
  35. TB10760-2021; Technical Code for Static Acceptance of High-Speed Railway Engineering in China. China Railway Publishing House: Beijing, China, 2011.
  36. Qin, S.Q. Unstressed state control methodfor bridges constructed in stages. Bridge Constr. 2008, 1, 8–14. (In Chinese) [Google Scholar]
  37. Li, Z.; Dong, X.; Chen, H.; Chi, L.; Zhang, Z. Overall Lifting Construction Control Method for Large-Segment Steel Arch Bridges Based on Unstressed State Control Theory. Buildings 2025, 15, 523. [Google Scholar] [CrossRef]
  38. Lin, C.; Doyog, N.D. Applying a Four-Way Factorial Experimental Model to Diagnose Optimum kNN Parameters for Precise Aboveground Biomass Mapping. IEEE J. Sel. Top. Appl. Earth Obs. Remote Sens. 2024, 18, 479–495. [Google Scholar] [CrossRef]
  39. Tetteh, E.T.; Zielosko, B. Greedy Algorithm for Deriving Decision Rules from Decision Tree Ensembles. Entropy 2025, 27, 35. [Google Scholar] [CrossRef]
  40. Bai, X.; Zhang, L.; Feng, Y.; Yan, H.; Mi, Q. Multivariate temperature prediction model based on CNN-BiLSTM and RandomForest. J. Supercomput. 2025, 81, 162. [Google Scholar] [CrossRef]
  41. Wang, F.; Wang, J. Establishment and validation of a prognostic risk early-warning model for retinoblastoma based on XGBoost. Am. J. Cancer Res. 2025, 15, 99. [Google Scholar] [CrossRef]
  42. Bentéjac, C.; Csörgő, A.; Martínez-Muñoz, G. A comparative analysis of gradient boosting algorithms. Artif. Intell. Rev. 2021, 54, 1937–1967. [Google Scholar] [CrossRef]
  43. Salih, A.K.; Hussein, H.A.A. Lost circulation prediction using decision tree, random forest, and extra trees algorithms for an Iraqi oil field. Iraqi Geol. J. 2022, 55, 111–127. [Google Scholar] [CrossRef]
  44. Fang, R.; Zhou, T.; Yu, B.; Li, Z.; Ma, L.; Luo, T.; Zhang, Y.; Liu, X. Prediction model of middle school student performance based on MBSO and MDBO-BP-Adaboost method. Front. Big Data 2025, 7, 1518939. [Google Scholar] [CrossRef] [PubMed]
  45. Zhao, Q.; Wang, F.; Wang, W.; Zhang, T.; Wu, H.; Ning, W. Research on intrusion detection model based on improved MLP algorithm. Sci. Rep. 2025, 15, 5159. [Google Scholar] [CrossRef] [PubMed]
  46. Sun, B. Gray Model and Back Propagation Neural Network Fusion Forecast for Real-Time Temperature in Utility Tunnel Fires. Combust. Sci. Technol. 2025, 1–17. [Google Scholar] [CrossRef]
  47. Xu, B.; Wang, R.; Zhou, K.; Zhou, X.; Xu, T.; Bian, Q. Research on the physical characteristics of a novel modified foamed cement slurry with non-foamed PVA material. Constr. Build. Mater. 2025, 459, 139710. [Google Scholar] [CrossRef]
  48. Wang, X.; Miao, C.; Wang, X. Prediction analysis of deflection in the construction of composite box-girder bridge with corrugated steel webs based on MEC-BP neural networks. Structures 2021, 32, 691–700. [Google Scholar] [CrossRef]
Figure 1. General layout of the continuous steel truss girder bridge (unit: cm).
Buildings 15 04204 g001
Figure 2. Cross section of steel truss girder (unit: mm).
Buildings 15 04204 g002
Figure 3. Layout of installation scheme of the bridge.
Buildings 15 04204 g003
Figure 4. Layout of lifting construction the first steel truss segment: (a) lifting of lower deck system; (b) lifting of upper deck system.
Buildings 15 04204 g004
Figure 5. On-site work photo of lifting construction of the first steel truss segment: (a) side view; (b) front view.
Buildings 15 04204 g005
Figure 6. FEM model for the construction stage simulation of the bridge: (a) the stage of assembling steel truss beams for the side spans; (b) the stage of assembling steel truss beams for the central spans; (c) the stage of finishing the closing of the entire bridge.
Buildings 15 04204 g006aBuildings 15 04204 g006b
Figure 7. Stress and deformation of the truss and brackets in the install stage of the side span. (最大: maximum; 最小: minimum).
Buildings 15 04204 g007
Figure 8. Deformation of brackets at the cantilever assembly stage.
Buildings 15 04204 g008
Figure 9. Deformation of truss joint of the 5th segment install stage: (a) before the installation of the upper truss; (b) after the installation of the upper truss.
Buildings 15 04204 g009
Figure 10. The vertical deflection of the entire bridge by the live load.
Buildings 15 04204 g010
Figure 11. Sample of partial continuous steel truss data set configuration.
Buildings 15 04204 g011
Figure 12. Deflection and pre-arch of steel girder fabrication.
Buildings 15 04204 g012
Figure 13. Hyperparameter tuning and sensitivity analysis results of KNN model: (a) performance sensitive to k; (b) sensitivity index of k.
Buildings 15 04204 g013
Figure 14. Layout diagram of bridge line shape monitor section (unit: m).
Buildings 15 04204 g014
Figure 15. Layout diagram of bridge line shape monitor points (unit: mm).
Buildings 15 04204 g015
Figure 16. Layout diagram of bridge stress and temperature monitoring section.
Buildings 15 04204 g016
Figure 17. System of real-time monitoring: (a) strain monitor point of main truss girder; (b) strain sensor installation of framing scaffolding; (c) diagram of networking process; (d) monitoring platform with internet.
Buildings 15 04204 g017
Figure 18. Results of line shape monitoring on the deck before closure (span 86#–88#).
Buildings 15 04204 g018
Figure 19. Results of line shape monitoring on the deck before closure (span 88#–90#).
Buildings 15 04204 g019
Figure 20. The erection construction of steel truss segment before closure.
Buildings 15 04204 g020
Figure 21. Strain real-time monitoring results of main truss girder.
Buildings 15 04204 g021
Figure 22. Temperature real-time monitoring results of main truss girder.
Buildings 15 04204 g022
Figure 23. Strain real-time monitoring results of the framing scaffolding.
Buildings 15 04204 g023
Figure 24. Separate stability metrics of strain monitoring results of the framing scaffolding: (a) the strain variation wave figure of monitoring pointZH1-1# of the scaffolding; (b) the strain variation wave figure of monitoring point ZH3-1# of the scaffolding; (c) the spectral characteristics of the strain variation at monitoring point ZH3-1#.
Buildings 15 04204 g024
Figure 25. Temperature real-time monitoring results of the framing scaffolding.
Buildings 15 04204 g025
Figure 26. Results of line shape monitoring on the deck after framing scaffolding removal.
Buildings 15 04204 g026
Figure 27. Overall view of the bridge after closure.
Buildings 15 04204 g027
Figure 28. The deck after closure: (a) the upper deck; (b) the lower deck.
Buildings 15 04204 g028
Table 1. Analysis results of the key construction stages.
Construction StageMax Def. of Span 86Max Def. of Span 87Max Def. of Span 88Max Stress of TrussMax Def. of BracketsMax Stress of Brackets
Cantilever Stage−7.7 mm−6.7 mm−7.6 mm35.5 MPa6 mm61.6 MPa
Closure Stage−7.7 mm−6.6 mm−9.0 mm38.1 MPa4 mm28.5 MPa
Removal of Brackets−21.8 mm−53.0 mm−68.1 mm59.5 MPa//
Deck Construction−32.8 mm−89.4 mm−117.5 mm131.1 MPa//
Table 2. Data set configuration.
Num.Seg. Num.TpSpx0/m L 1 /m X 1 /T G 1 /T h 1 /mm T 1 /T L 2 /m X 2 /T G 2 /T h 2 /mm T 2 /TT/TΔL/mm
1A1–A25111.2511.253.516149247.87.3576.513.316142.09231.9−15.01
2A2–A35122.511.253.516147.3237.81388.511.216169.68269.46.37
3A3–A45135.5133.516147.3237.71388.511.216169.68269.47.55
4A4–A551−39133.516147.3240.11388.511.216169.68269.46.47
5A5–A651−26133.916147.3246.61398.812.216169.68280.74.12
6A6–A751−13133.924170.1276.313116.119.116169.68304.90
7A7–A8510133.924170.1283.313155.122.816204.78382.8−33.26
8A8–A95213133.216142.7247.313121.918.316169.68309.90.1
9A9–A105225.3512.353.516149245.313.5104.215.116173.54292.85.31
10A10–A115238.613.253.516143.7230.112.588.211.516152.74252.46.37
11A11–A125251.112.53.516129.82141282.111.216148.88242.28.5
12A12–A135263.1123.516129.82141282.111.216148.88242.29.03
13A13–A1452−60.5123.516129.8215.81282.111.216148.88242.28.29
14A14–A1552−48.5123.516129.8220.11286.811.516148.88247.15.74
15A15–A1652−36.5123.916129.8230.71297.415.816148.88262.12.02
16A16–A1752−24.5124.516129.8247.512125.521.216148.88295.6−1.28
17A17–A1852−12.5124.524176302.31214435.716148.88328.7−2.13
18A18–A1952012.54.524171.6295.612177.735.716196.92410.4−39.96
19A19–A205312.5123.924141.2255.712136.92816148.88313.8−1.91
20A20-A215324.512.53.516143.7250.91111720.916141.17279.1−2.45
21A21–A225337123.516147.3243.813103.515.116169.68288.23.14
22A22–A235349123.516147.32401393.611.516169.68274.87.26
23A23–A245361123.516147.3237.81388.511.216169.68269.49.9
24A24–A24′53−72.5120165880.21388.27.116169.682650
25A24′–A23′53−60.5123.516147.3237.81388.511.216169.68269.49.81
26A23–A22′53−48.5123.516147.32401393.611.516169.68274.87.45
27A22′–A21’53−36.5123.516147.3243.813103.515.116169.68288.23.04
28A21–A20’53−24.512.53.516143.7250.91111720.916141.17279.1−2.45
29A20’–A19’53−12123.924141.2255.712136.92816148.88313.8−1.91
30A19’–A18’53012.54.524171.6295.612177.735.716196.92410.4−39.75
31A18’–A17’5212.5124.524176302.31214435.716148.88328.7−2.44
32A17–A16’5224.5124.516129.8247.512125.521.216148.88295.6−1.28
33A15’–A14’5236.5123.916129.8230.71297.415.816148.88262.12.12
34A14–A13’5248.5123.516129.8220.11286.811.516148.88247.15.84
35A13’–A12’5260.5123.516129.8215.81282.111.216148.88242.28.18
36A12–A11’5272.5123.516129.82141282.111.216148.88242.29.14
Table 3. Evaluation indicators of training set and test set for different models.
ML ModelTraining Set IndicatorsTest Set Indicators
MSERMSEMAER2MSERMSEMAER2
Random Forest5.946 2.438 1.584 0.669 7.321 2.706 1.668 0.950
XGBoost8.140 2.853 1.743 0.546 2.704 1.645 1.134 0.982
Gradient Boosting0.225 0.474 0.326 0.987 2.718 1.649 1.040 0.982
Extra Trees1.079 1.039 0.908 0.940 0.542 0.736 0.630 0.996
AdaBoost2.087 1.445 1.390 0.884 0.644 0.802 0.651 0.995
SVM5.628 2.372 1.721 0.686 11.064 3.326 2.684 0.925
KNN4.754 2.180 1.818 0.735 17.100 4.135 2.608 0.884
Decision Tree1.308 1.144 0.951 0.936 17.571 4.192 2.687 0.881
MLP3.734 1.932 1.541 0.8182.688 1.640 1.197 0.982
Table 4. Predicted and theoretical values of extension of selected model rods (unit: mm).
Num.Seg. Num.Theoretical ValuesRFXGBoostGBETAdBSVMKNNDTMLP
1A11’–A10’6.376.55 6.08 6.29 7.17 7.04 8.18 6.38 6.23 10.34
2A10’–A9’5.213.96 4.59 5.23 4.53 4.65 4.18 4.85 3.34 5.52
3A9’–A8’0−0.44 0.07 0.10 0.02 −0.59 −3.66 0.18 −3.11 0.57
4A8’–A7’−33.26−30.48 −29.26 −35.05 −32.91 −33.26 −26.57 −33.66 −37.66 −34.58
5A7’–A6’0.29−2.10 −0.48 −0.07 0.12 −1.34 1.22 0.41 −3.11 −0.90
6A6’–A5’4.323.34 3.95 3.80 5.17 4.65 2.58 4.05 3.34 3.87
7A5’–A4’6.377.01 8.22 7.51 7.46 7.04 6.14 6.05 6.23 6.25
8A4’–A3’7.657.27 7.17 7.38 7.52 7.04 4.48 7.01 6.23 7.57
9A3’–A2’6.287.05 7.47 7.38 7.49 7.04 4.68 6.05 6.23 7.43
10A2’–A1’−15.01−14.08 −10.27 −10.35 −14.17 −15.01 −19.67 −14.99 −13.11 −17.60
Table 5. Deformation of steel beam closure under different temperature increases and decreases.
T (°C)Upper Chord (A24–A23) Deformation (mm)Diagonal Web (A24–A23) Deformation (mm)
DxDyDzDxDyDz
22.52.5−0.1−2.37.5−1.4−9.8
200.6−0.1−3.26.5−1.5−10.1
17.5−1.3−0.0−4.25.5−1.5−10.4
15−3.2−0.0−5.14.5−1.6−10.7
12.5−5.10.0−6.13.5−1.6−11.1
10−7.00.0−7.12.5−1.7−11.3
7.5−8.90.1−8.0−1.5−1.7−11.7
5−10.80.1−9.00.5−1.8−11.9
Table 6. Deformation of steel beam closure under temperature gradient of 10 °C.
Installation PartsLeft String Pole Deformation (mm)Right String Pole Deformation (mm)
DxDyDzDxDyDz
GL-S201.10.7−2.21.1−0.6−2.1
TL-X22−0.4−0.4−4.0−0.40.5−2.1
GL-S211.10.7−2.31.1−0.6−2.3
TL-X23−0.4−0.5−3.8−0.40.5−2.9
GL-S221.00.7−2.31.0−0.6−2.3
TL-X240.3−0.7−4.20.40.8−2.2
GL-S231.80.7−5.01.80.5−5.2
GL-S241.70.8−6.31.7−0.8−6.5
Disclaimer/Publisher’s Note: The statements, opinions and data contained in all publications are solely those of the individual author(s) and contributor(s) and not of MDPI and/or the editor(s). MDPI and/or the editor(s) disclaim responsibility for any injury to people or property resulting from any ideas, methods, instructions or products referred to in the content.