Article

Experimental Study and Machine Learning Prediction of Shear Capacity of Panel-Sheathing Nailed Connections in Wood Structures

by
Weide Song
1,
Zhaohui Wang
1,*,
Kai Jia
1,
Hongbo Zhao
1,
Xiaoxia Wang
1 and
Yunxuan Wang
2
1
Research Institute of Wood Industry, Chinese Academy of Forestry, Beijing 100091, China
2
Department of Electrical and Electronic Engineering, Imperial College London, London SW7 2AZ, UK
*
Author to whom correspondence should be addressed.
Buildings 2025, 15(22), 4158; https://doi.org/10.3390/buildings15224158
Submission received: 21 October 2025 / Revised: 9 November 2025 / Accepted: 13 November 2025 / Published: 18 November 2025
(This article belongs to the Special Issue Research on Timber and Timber–Concrete Buildings)

Abstract

Machine learning methods have demonstrated significant advantages in predicting the shear mechanical performance of concrete connectors. However, the application to nailed connections in wood structures remains limited. Accurate prediction of the shear capacity of nailed connections is essential for assessing the seismic performance and safety of wood structures. In this study, a series of push-out tests were conducted on panel-sheathing nailed connections, and the obtained load–displacement curves were analyzed to characterize their mechanical behavior. Six ML models were trained and tested using a dataset comprising 101 push-out tests. Eight key features, including both mechanical properties (E, G, fes, fem) and geometric parameters (d, l, s, D), were selected as input parameters, and three characteristic values including ultimate load, initial shear stiffness, and ultimate displacement were chosen as output parameters. The results indicated that the support vector regression (SVR) model exhibited the best performance in predicting the three output parameters of nailed connections, with corresponding R2 values reaching of 0.9950, 0.9976, and 0.9994, respectively. The study employed the Shapley additive explanations (SHAP) method to investigate the importance of features. The findings revealed that the elastic modulus of the side plate significantly influenced ultimate load and initial shear stiffness. Additionally, the initial shear stiffness was primarily affected by the nail spacing, whereas the shear modulus and pin-bearing strength substantially affected ultimate displacement. The prediction results of the machine learning model were compared with existing empirical, confirming that the machine learning model achieved high accuracy and strong applicability in predicting the shear bearing capacity of nailed connections in wood structures.

1. Introduction

Wood structures have attracted increasing attention as sustainable and low-carbon building systems due to their favorable strength-to-weight ratio and inherent environmental benefits. The mechanical behavior of joints critically determines the global structural performance under seismic loading in wood structures. Among various connection types, nailed joints are the most widely used in panel-sheathing assemblies, serving as key load-transferring and energy-dissipating components. The shear performance of these connections directly governs the overall lateral stiffness, energy dissipation capacity, and seismic resilience of timber structures during earthquakes. Therefore, understanding the shear behavior of nailed joints is fundamental to evaluating and enhancing the seismic performance of wood structures [1].
The load–displacement curve is a critical indicator of the shear resistance of nailed connections, providing essential information on initial shear stiffness, and the ultimate load capacity of the connector, while also depicting the progression of shear force and displacement. Numerous researchers have extensively examined the shear performance of nailed connections in wood structures [2,3,4,5]. Chen et al. [6,7] investigated the mechanical properties of nailed connections in laminated bamboo lumber (LBL) specimens and reported that the yield shear capacity of single-nailed connections ranged from 2.05 to 4.17 kN, while that of multi-nailed connections ranged from 11.24 to 32.75 kN. The corresponding initial stiffness values were 1.61–2.95 kN/mm for single-nailed connections and 5.28–13.92 kN/mm for multi-nailed configurations. Their results demonstrated that both the number of nails and configuration of nails significantly influenced stiffness and ultimate load. The most common failure modes were shear failure of the wood or the yielding of nails. Due to the group effect of nails, the strength of multi-nailed connections was typically 17–25% lower than the sum of individual single-nailed connections. This research validated the applicability of the Folz model for predicting load–displacement behavior in LBL connections. A novel composite connection was developed by Wahan et al. [8], combining H-shaped glass-fiber-reinforced polymer (GFRP) profiles with engineered bamboo. Forty-six specimens were tested for shear strength and stiffness using push-out tests, exhibiting ultimate loads between 50 and 101 kN and stiffness values of approximately 12.8–49.7 kN/mm. Shahin et al. [9] examined the shear performance of an innovative adhesive-free timber–steel composite connection, which utilized self-tapping screws and D-head nails, reporting shear capacities in the range of 3.8–19.95 kN depending on steel plate thickness and fastener spacing. Compared with traditional timber–timber joints, the composite connections demonstrated a significant improvement in mechanical performance, with the ultimate load capacity increased by approximately 3–4 times and the stiffness by 3–6 times. Their investigation used pull-out tests and considered the effects of steel plate thickness, fastener type, size, and spacing.
With the rapid advancement of artificial intelligence, machine learning (ML) techniques have shown significant potential in structural engineering due to their superior predictive capability and adaptability [10,11,12]. Several studies have applied ML algorithms to address various challenges associated with concrete structures. Li et al. [13] developed ML models using experimental and numerical data to predict the bearing capacity of angle steel bolted connections, revealing that bolt end and edge distances were the most influential parameters. Sarothi et al. [14] were among the first to apply ML methods to estimate the bearing strength of double-shear bolted connections in structural steel, demonstrating improved prediction accuracy compared to empirical equations. Subsequently, Wang et al. [15] developed an integrated ML model that was automatically optimized via a sequential model, to predict the shear strength of stud connectors in concrete slabs. Zhu and Farouk [16] enhanced an artificial neural network (ANN) with a meta-heuristic optimization algorithm to estimate the shear capacity of grouped studs embedded in concrete, achieving high consistency with experimental results. Similarly, Zhou et al. [17] applied ML models to evaluate the shear strength of stud connectors in ultra-high-performance concrete, further confirming the robustness of data-driven approaches in connection performance prediction.
Although ML-based prediction of the shear behavior of concrete connectors has been extensively investigated and reached a relatively mature stage, applications in wood structures remain limited. A few pioneering studies have recently emerged in this field. Lu et al. [18] applied ML techniques to predict the slip modulus of screw connections in timber–concrete composite structures and used SHAP analysis to identify the most influential factors affecting the slip modulus. Similarly, F. Kazemi et al. [19] developed an ensemble ML model to estimate the axial load–displacement and stress–strain behavior of circular timber-filled steel tube (CTFST) columns. Their results confirmed the reliability of ensemble ML approaches in predicting the elastic stiffness and ultimate axial load capacity of CTFST specimens. These studies highlight the growing potential of ML methods in modeling the complex mechanical behavior of timber connections and composite systems, but research on nailed connections, key load-transferring and energy-dissipating components in wood shear walls, remains scarce. Motivated by this gap, the present study applies ML algorithms to predict the shear performance of panel-sheathing nailed connections using experimental data, aiming to improve the accuracy and interpretability of connection behavior prediction for seismic design of wood structures.
Unlike concrete or steel connectors with isotropic and homogeneous properties, nailed timber joints exhibit pronounced anisotropy, material heterogeneity, and nonlinear dowel-bearing behavior, making their mechanical behavior far more complex to model. Moreover, data on such connections are typically limited and highly variable, further increasing the modeling difficulty. This study represents one of the first systematic applications of machine learning to capture these unique features, highlighting its potential for accurate and reliable performance prediction of nailed timber connections in wood structures. Therefore, it is necessary to explore alternative approaches to traditional modeling methods for predicting the mechanical performance of panel-sheathing nailed connections.
This study aimed to predict key parameters of the load–displacement behavior of nailed connections in wood structures by using ML method. Push-out tests were conducted on 22 groups of panel-sheathing nail-connected specimens with varying parameter configurations. Based on the test results, the key features of the load–displacement curves were analyzed. A comprehensive database comprising test results from 101 nailed connection specimens was developed. Using this database, six ML algorithms were employed to predict key characteristics of the load–displacement curves, including ultimate load, initial shear stiffness, and displacement at ultimate load. The optimal ML models for predicting each characteristic value were determined using statistical indicators. Furthermore, the Shapley Additive Explanations (SHAP) method was applied to interpret the decision-making process of the optimal models across the entire dataset. This research improves the accuracy of predicting the performance of nailed connections in wood structures and introduces a novel technical approach for their design and evaluation.

2. Materials and Methods

2.1. Specimen Preparation

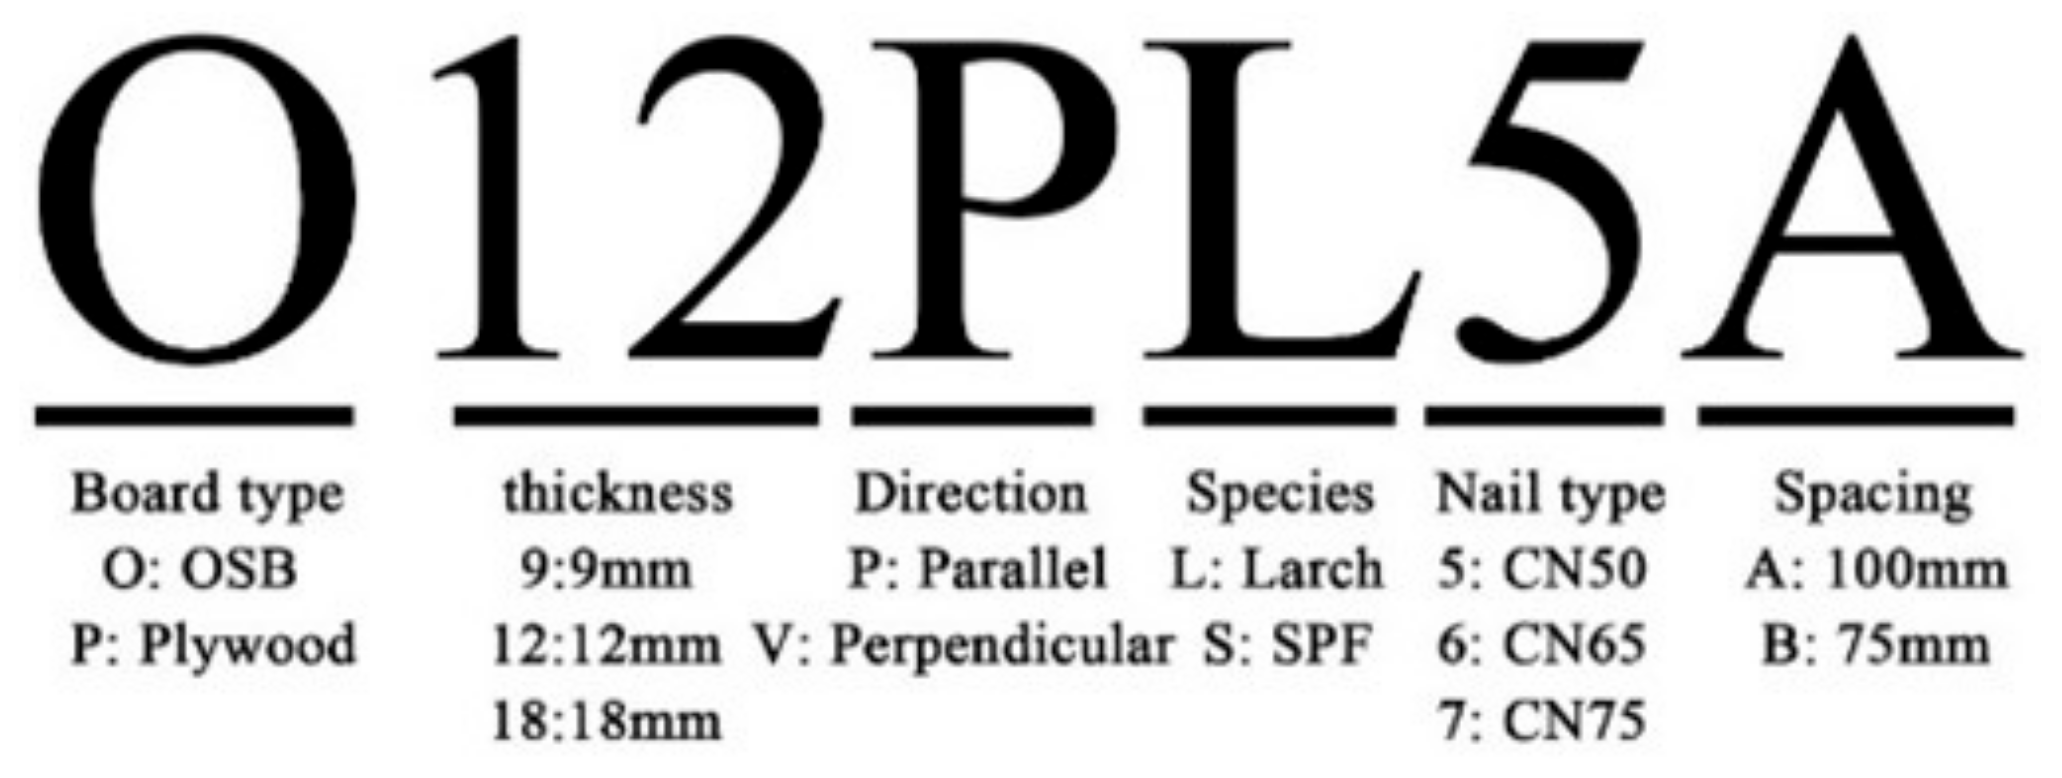
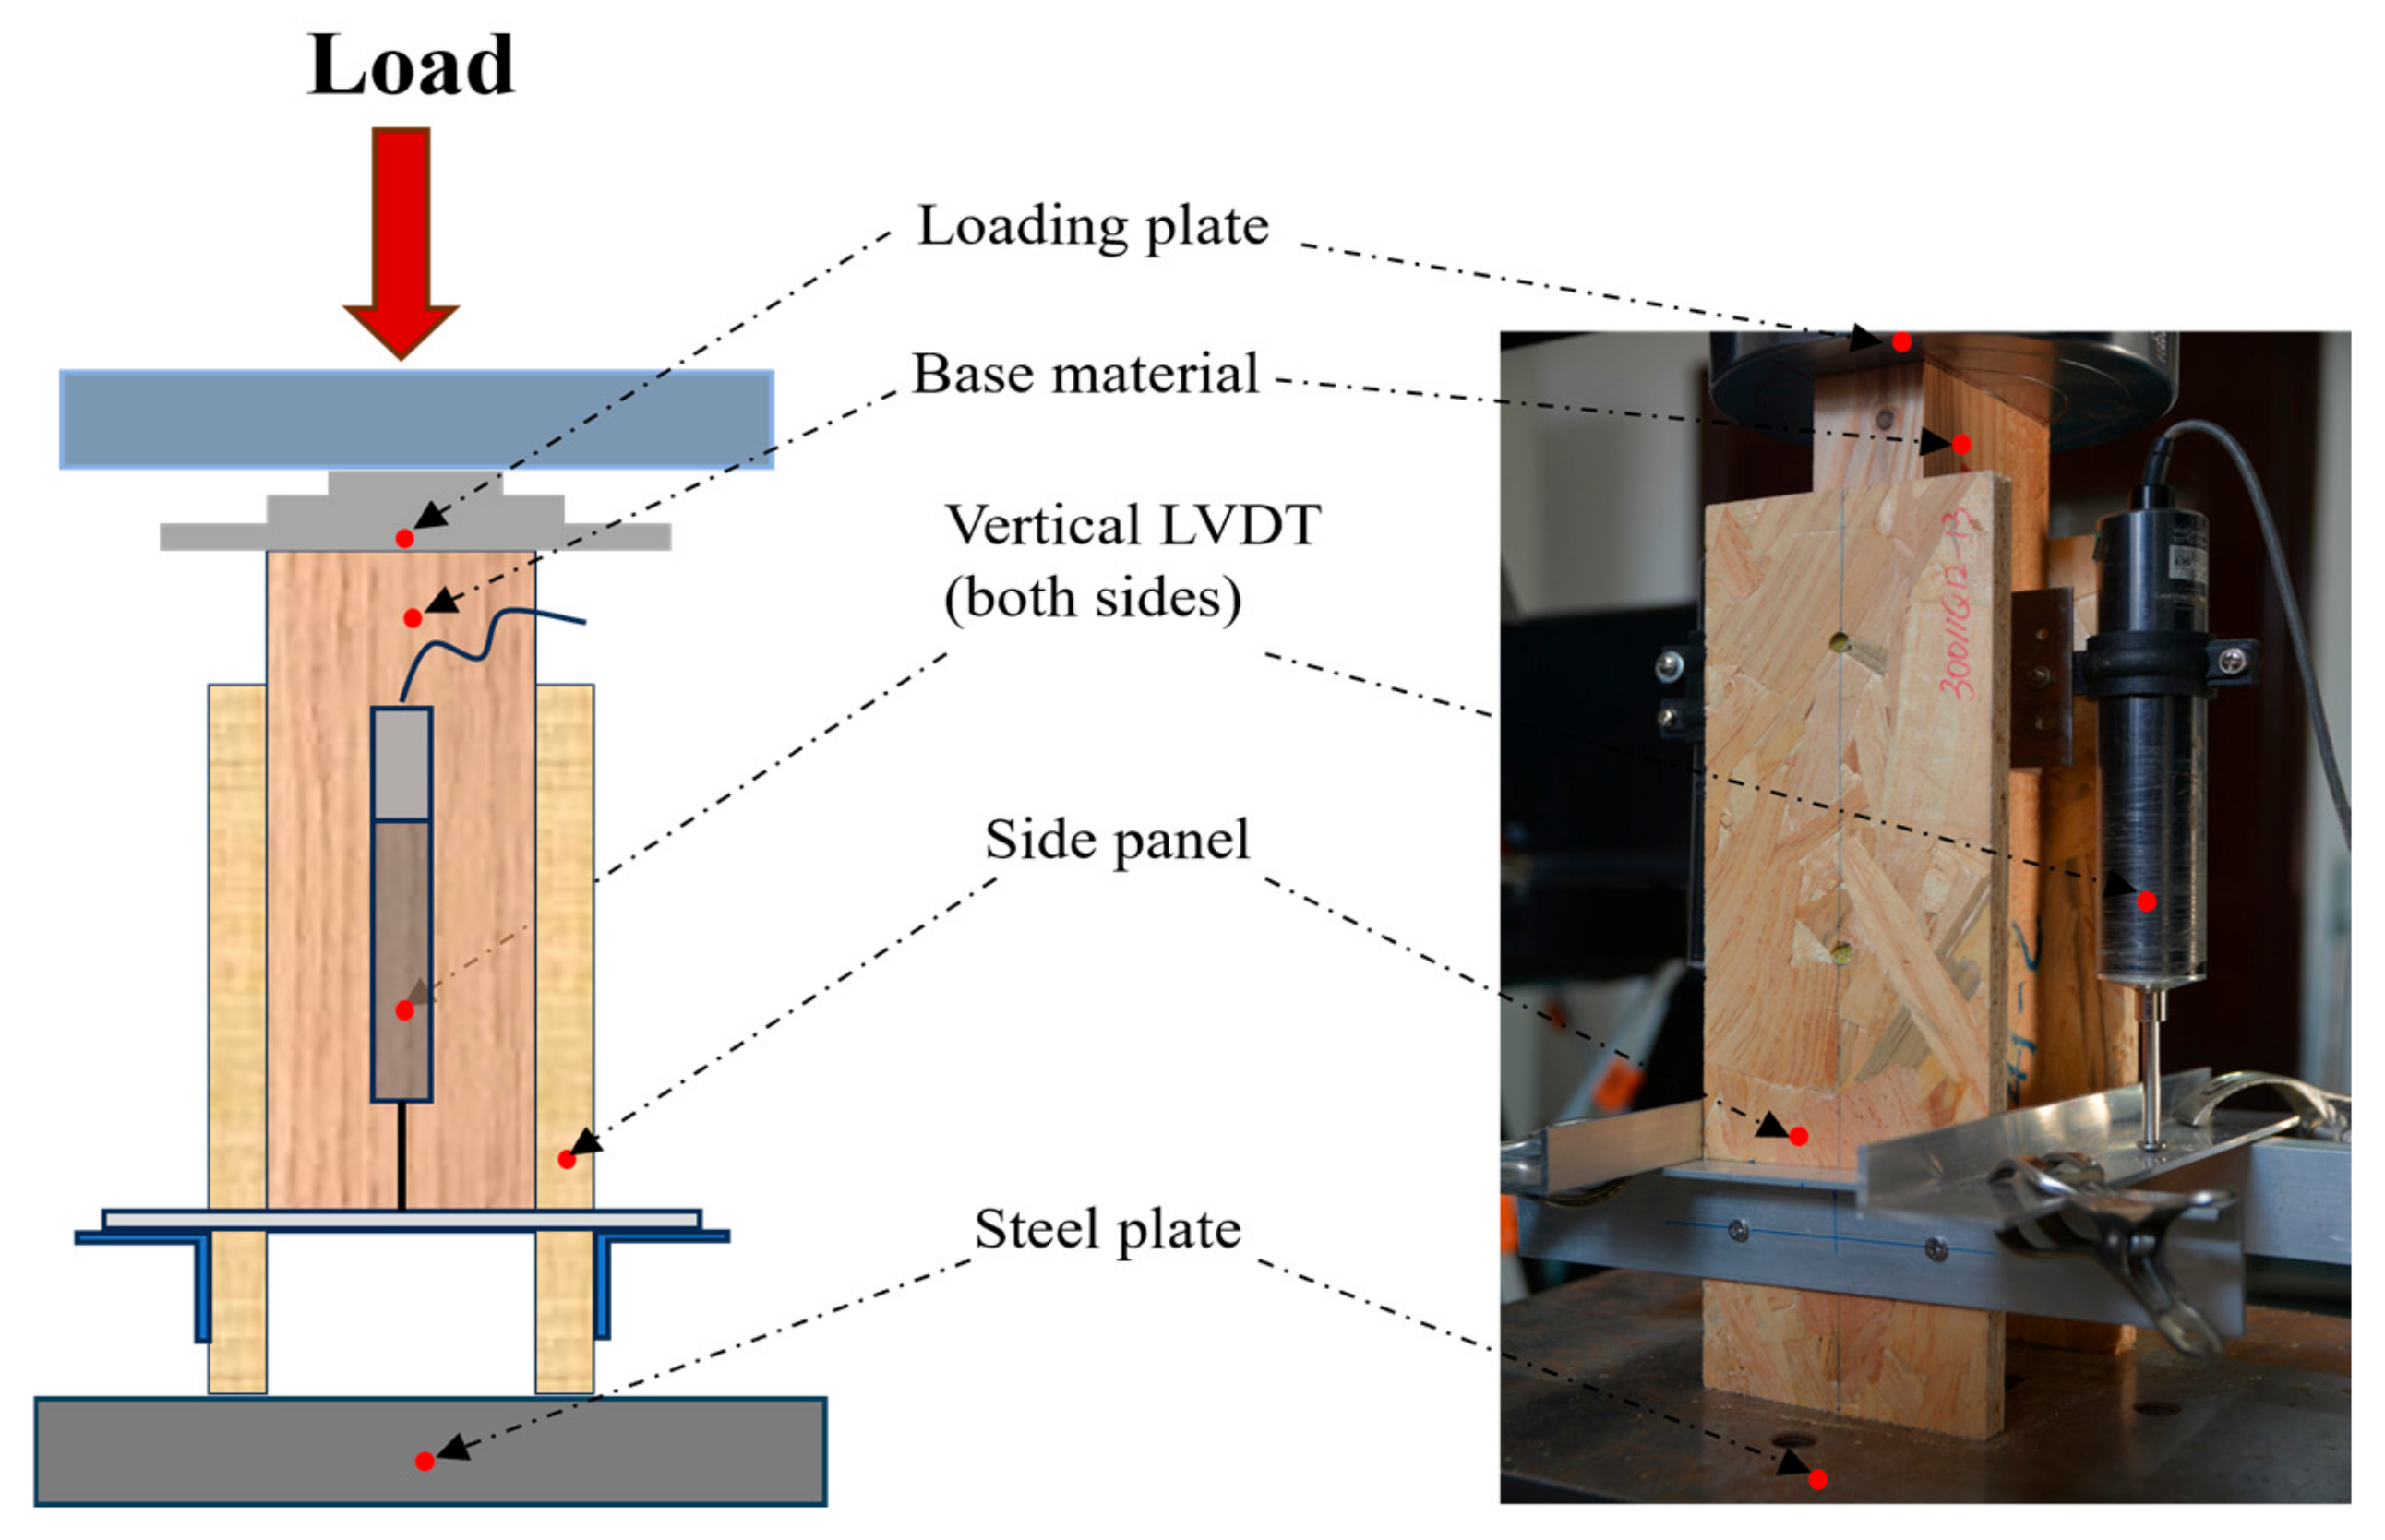
According to the Japanese Standard JAS 0360:2019 [20], 22 groups of panel-sheathing nail-connected specimens with varying parameters were designed and fabricated in this study, with five identical specimens prepared for each group to ensure experimental repeatability. The investigated parameters included the type, thickness, and grain direction of the side plate, as well as the nail length, and nail spacing. Figure 1 shows the schematic diagram of the nail-connected specimens. The specimen numbering scheme is detailed in Figure 2. Smooth shank nails of different lengths were inserted centrally to connect the base material and side plates. The Supplementary Materials lists the specimen identifiers and their corresponding parameters, including density and moisture content (the values in parentheses indicate the standard deviation).

2.2. Material Properties

Three types of oriented strand board (OSB) with thicknesses of 9, 12, and 18 mm were selected from products manufactured by the Treezo New Material Technology Group Co., Ltd. (Hangzhou, China). The modulus of rupture (MOR) measured along the major axis was 33.0, 32.1, and 42.0 MPa along the minor axis and 21.4, 21.7, and 23.0 MPa along the minor axis, respectively. The measured modulus of elasticity (MOE) values was 5320, 4880, and 6500 MPa along the major axis, and 2930, 2580, and 2990 MPa along the minor axis, respectively. All measured values complied with the LY/T 1580–2010 standard [21].
The structural plywood was produced by Daxinganling Mohe Yijia Wood Product Co., Ltd. (Mohe, China). The material consisted of larch veneers bonded with urea-formaldehyde adhesive, resulting in a nominal thickness of approximately 12 mm. The modulus of rupture (MOR) was determined to be 61.7 MPa along the major axis and 32.7 MPa along the minor axis. The modulus of elasticity (MOE) was determined to be 8360 MPa along the major axis and 3840 MPa along the minor axis. All values complied with the GB/T 22349-2008 standard [22].
Larch and spruce lumber were chosen for framing. The larch lumber had an MOR of 119.55 MPa and an MOE of 13.25 GPa. The spruce lumber had an MOR of 101.56 MPa and an MOE of 12.68 GPa. Three steel nail types (CN 50, CN 65, and CN 75) were obtained from Tianjin Zhuangte Hardware Industry Co., Ltd. (Tianjin, China), were selected. Based on the load-deflection curve using a 5% diameter offset method, the average bending yield strengths of the nails were 690 MPa, 696 MPa, and 640 MPa, meeting the Class A requirements in LY/T 2059-93 2012 [23].

2.3. Experimental Methodology

Figure 3 shows the test setup with a universal testing machine (Instron 5582, 100 kN max, Instron, Norwood, MA, USA). We measured the relative displacement between the base and side plate and used drilled holes with attached aluminum strips as a reference. Two linear variable differential transformers (LVDTs) (CDP-50, 50 mm) on opposite sides collected displacement data at 1 Hz. The loading procedure followed the method specified in ASTM D 1761-12 [24], with the nail-connected specimens loaded at 2 mm/min until failure (6–10 min total). It should be emphasized that the present study employed monotonic loading tests to capture the fundamental load–displacement response and failure mechanisms of nailed connections. Cyclic degradation, hysteretic energy dissipation, and cumulative damage effects commonly observed under seismic loading were not included in this investigation. Therefore, the experimental findings are intended to provide a reference for evaluating the shear capacity and stiffness characteristics of nailed connections in wood structures, rather than a comprehensive representation of their cyclic or seismic performance.

3. Experimental Results and Analysis

3.1. Load–Displacement Curves

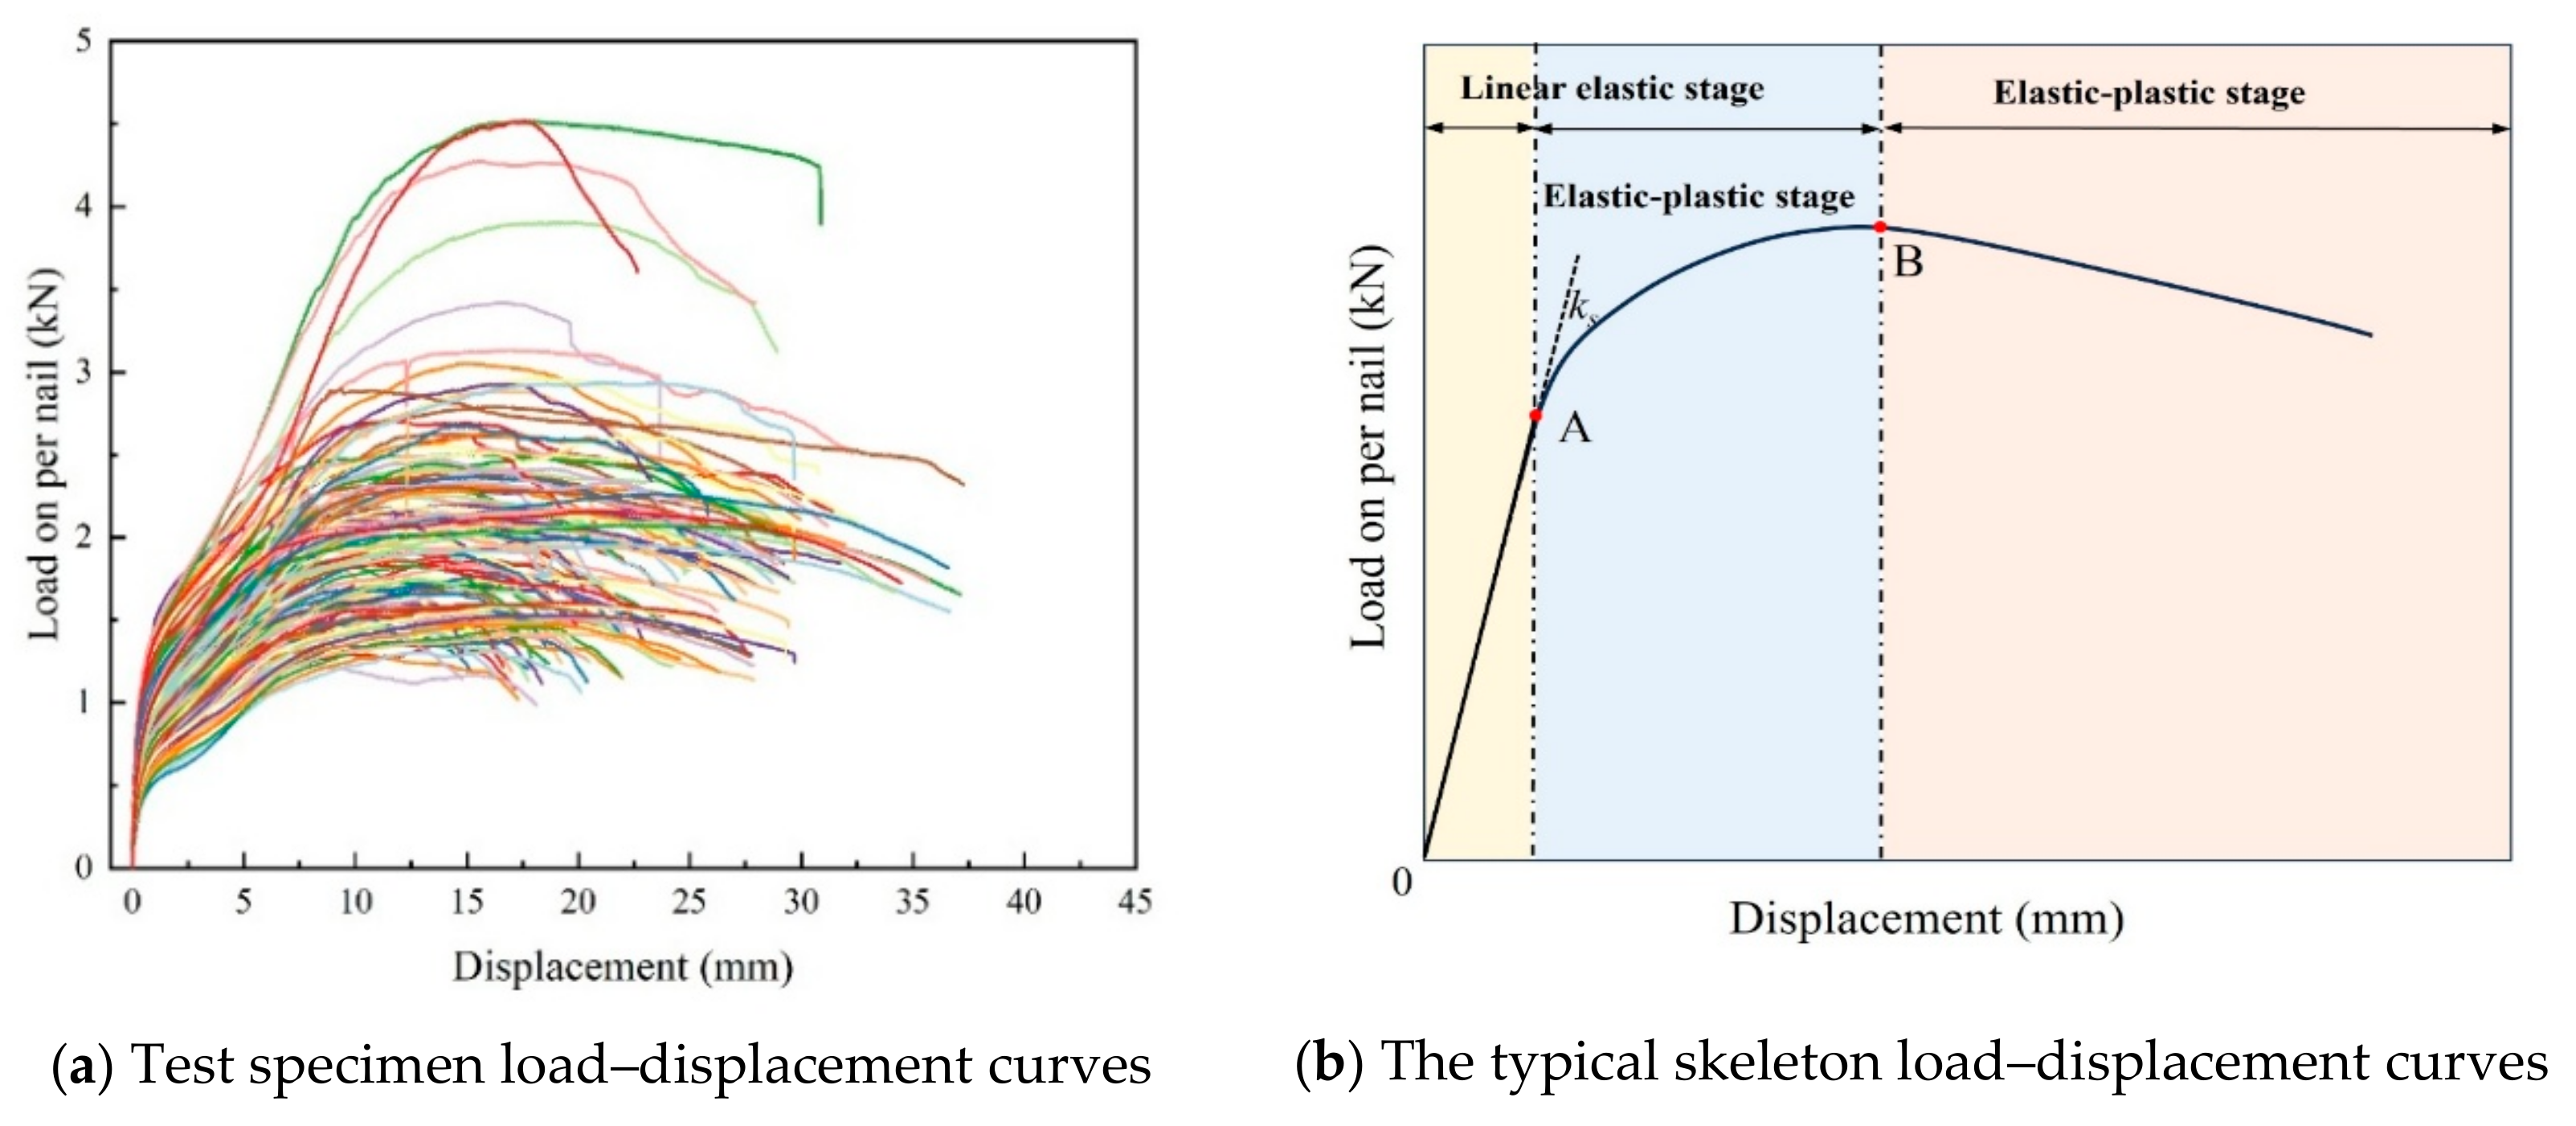
Figure 4 shows typical load–displacement curves derived from the push-out tests of the panel-sheathing nail-connected specimens. After the ultimate load is reached, the curve enters the failure stage, where the displacement increases but the load decreases due to wood fiber crushing and nail strain hardening, leading to board failure. Since the failure stage is not the primary focus of most engineering investigations, this study does not examine it in detail.
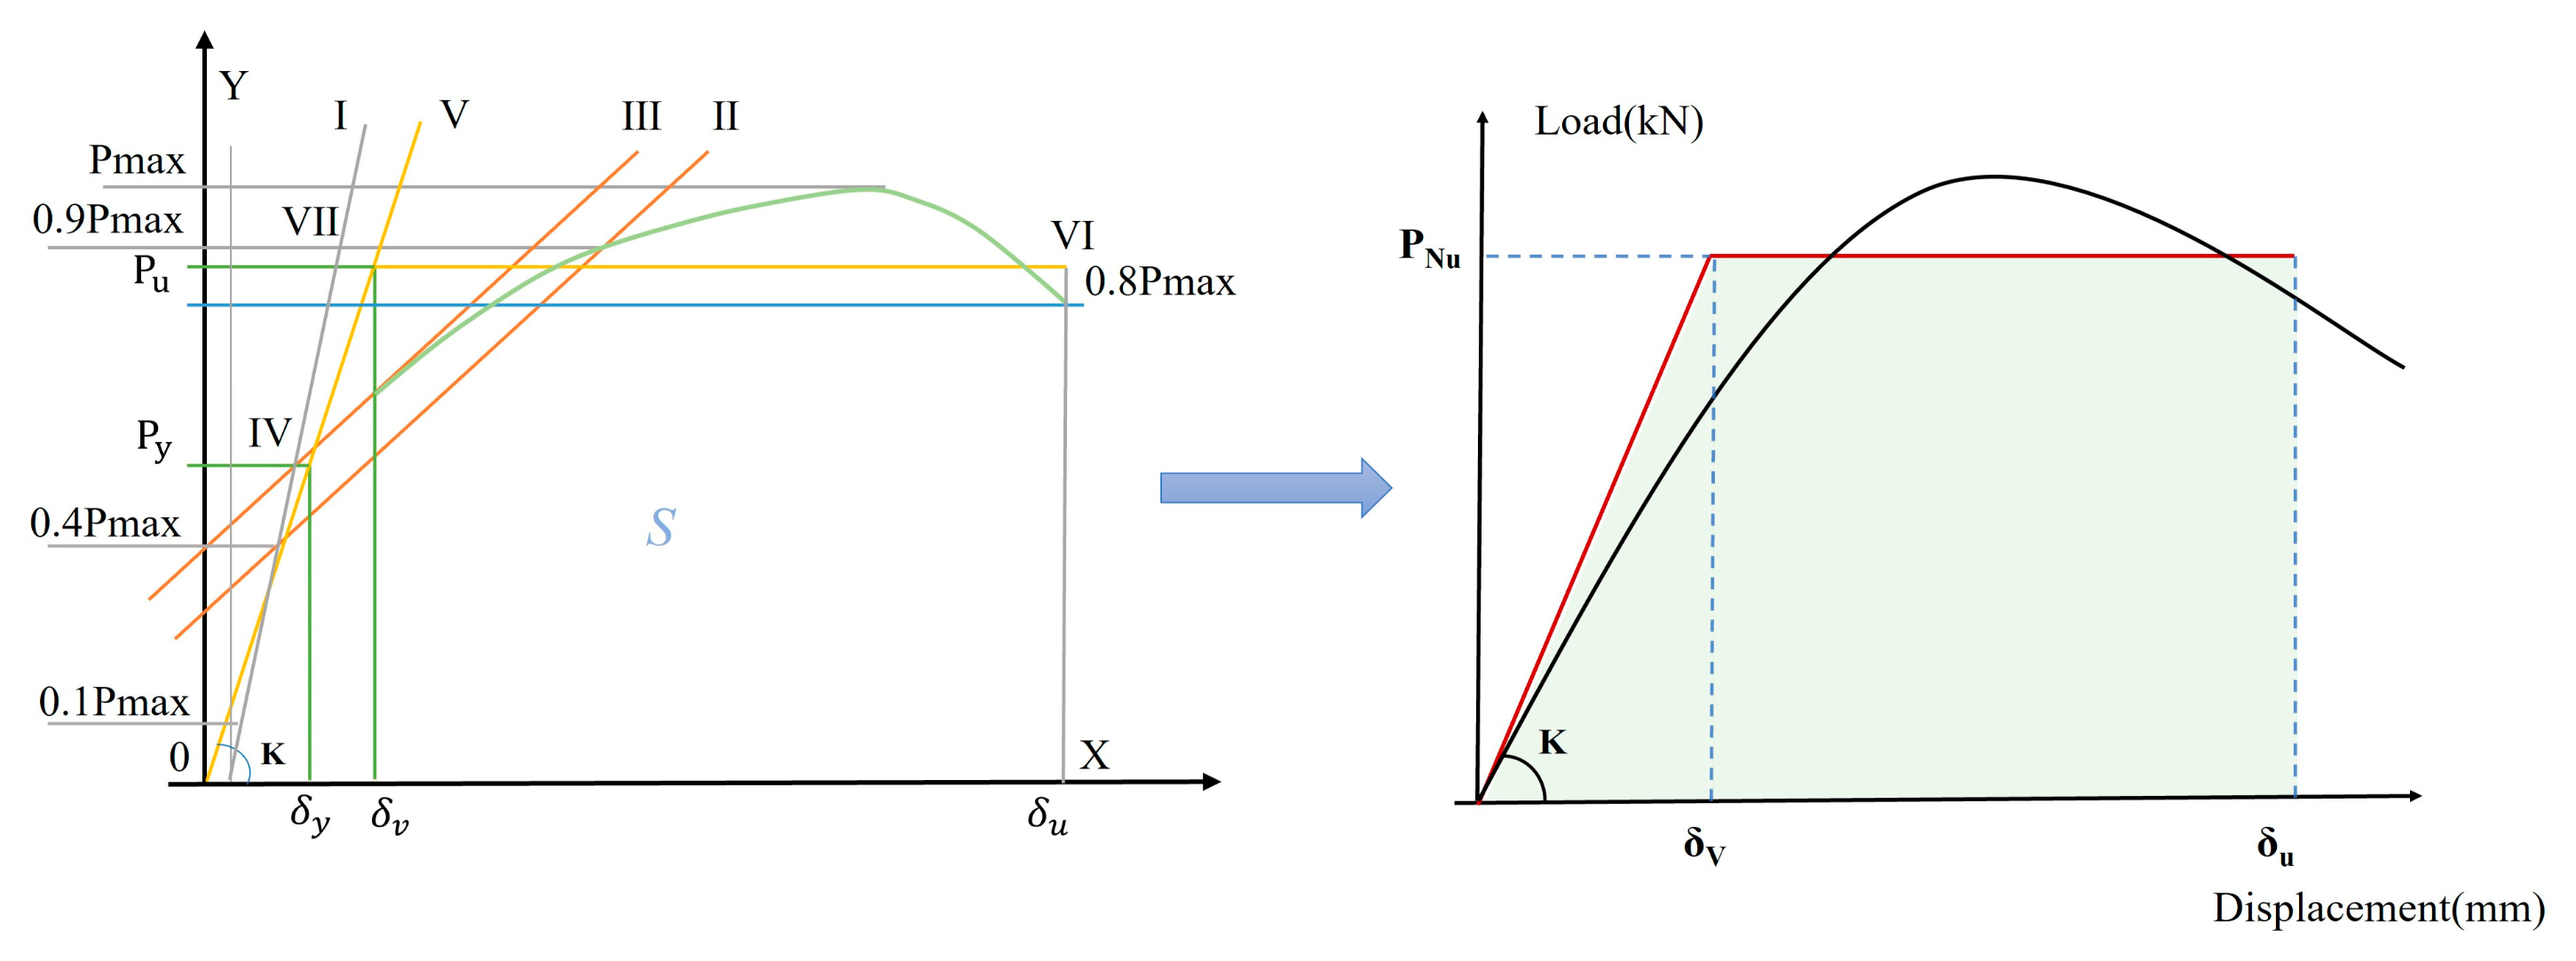
The nailed connection’s mechanical performance was analyzed by interpreting the load–displacement curves following the method in Figure 5 [25]. This approach can be used to evaluate the performance of wood shear walls, nailed connections, and their improvement. Two points corresponding to load values of 0.1 Pmax and 0.4 Pmax were selected on the curve, and a straight line I was drawn between the points. Another two points with load values of 0.4 Pmax and 0.9 Pmax were selected to create line II. We moved straight line until it was tangent to the curve to obtain straight line III. A horizontal line IV was II drawn at the intersection of lines III and I. Its longitudinal coordinate was Py, and the corresponding transverse coordinate was δy. The straight line V was drawn connecting the origin to the intersection of line IV and the curve. The slope K was the initial shear stiffness. The horizontal coordinate δu was obtained at the intersection point of the horizontal line at 0.8 Pmax and the curve. The horizontal line VI was placed to ensure that the trapezoidal area S was enclosed by the x-axis, line V, and line x = δu. Its vertical coordinate was Pu. The line VII represents the horizontal line at 0.9 Pmax. Thus, the load–displacement curve was predicted by determining the ultimate load, initial shear stiffness, and ultimate displacement with a suitable analytical model.

3.2. Observations from the Experiment

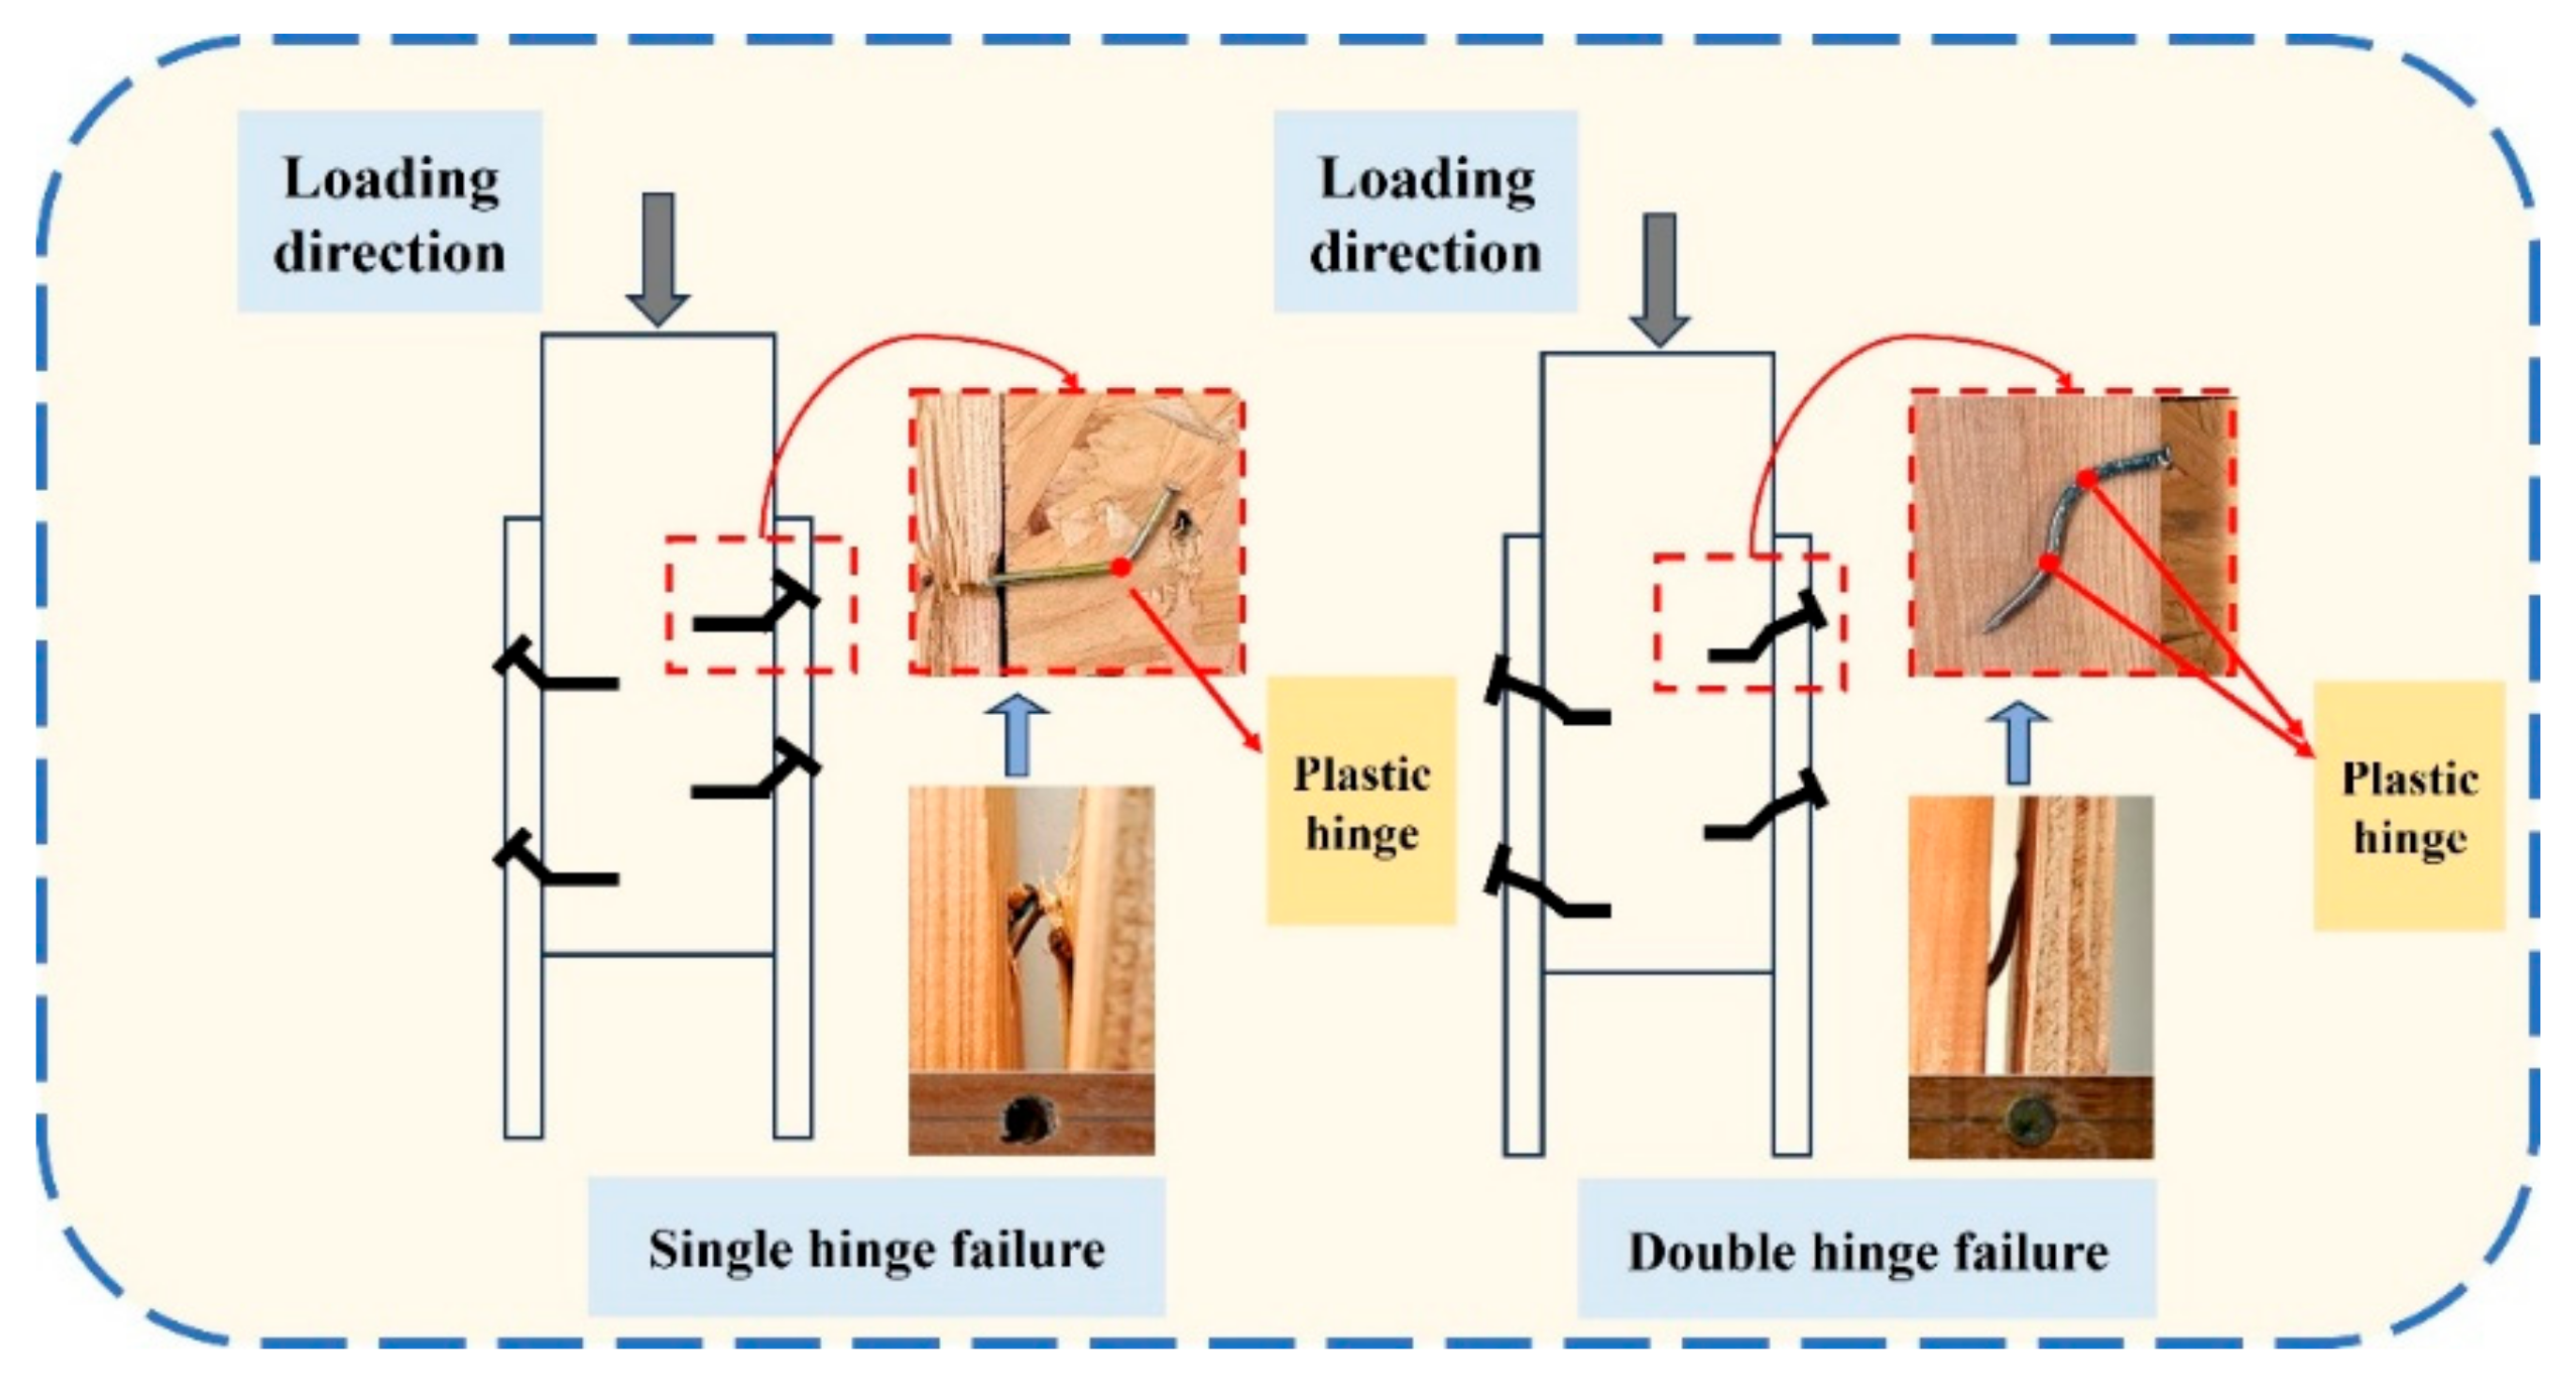
The Eurocode 5, Design of Timber Structures, describes six typical yield modes have been identified for failures in nailed connections [27]. In this study, the push-out specimens primarily exhibited two shear yield modes: Mode IIIm and Mode IV, as illustrated in Figure 6. The penetration of the nail head into the side panel was found to be a critical factor affecting the shear yield mode. Mode IIIm tends to occur when no penetration exists. Moreover, the thickness of the side panel significantly influences the yield mode. For example, Mode IV was not observed in the OSB specimens with a 9 mm side panel. The failure and yield modes observed for specimens with OSB and plywood side panels were consistent with the findings reported by Rintaro [28] and Chen [29]. A comparison of specimens O12PS5A, P12PS5A, O12PL6A, and P12PL6A further revealed that the relative density between the side panel and the base material markedly affected the yield mode. For the same base material, a lower side panel density increases the likelihood of connection failure. In contrast, the fiber direction of the side panel has a negligible influence on the yield failure mode.

4. Machine Learning Model Evaluation

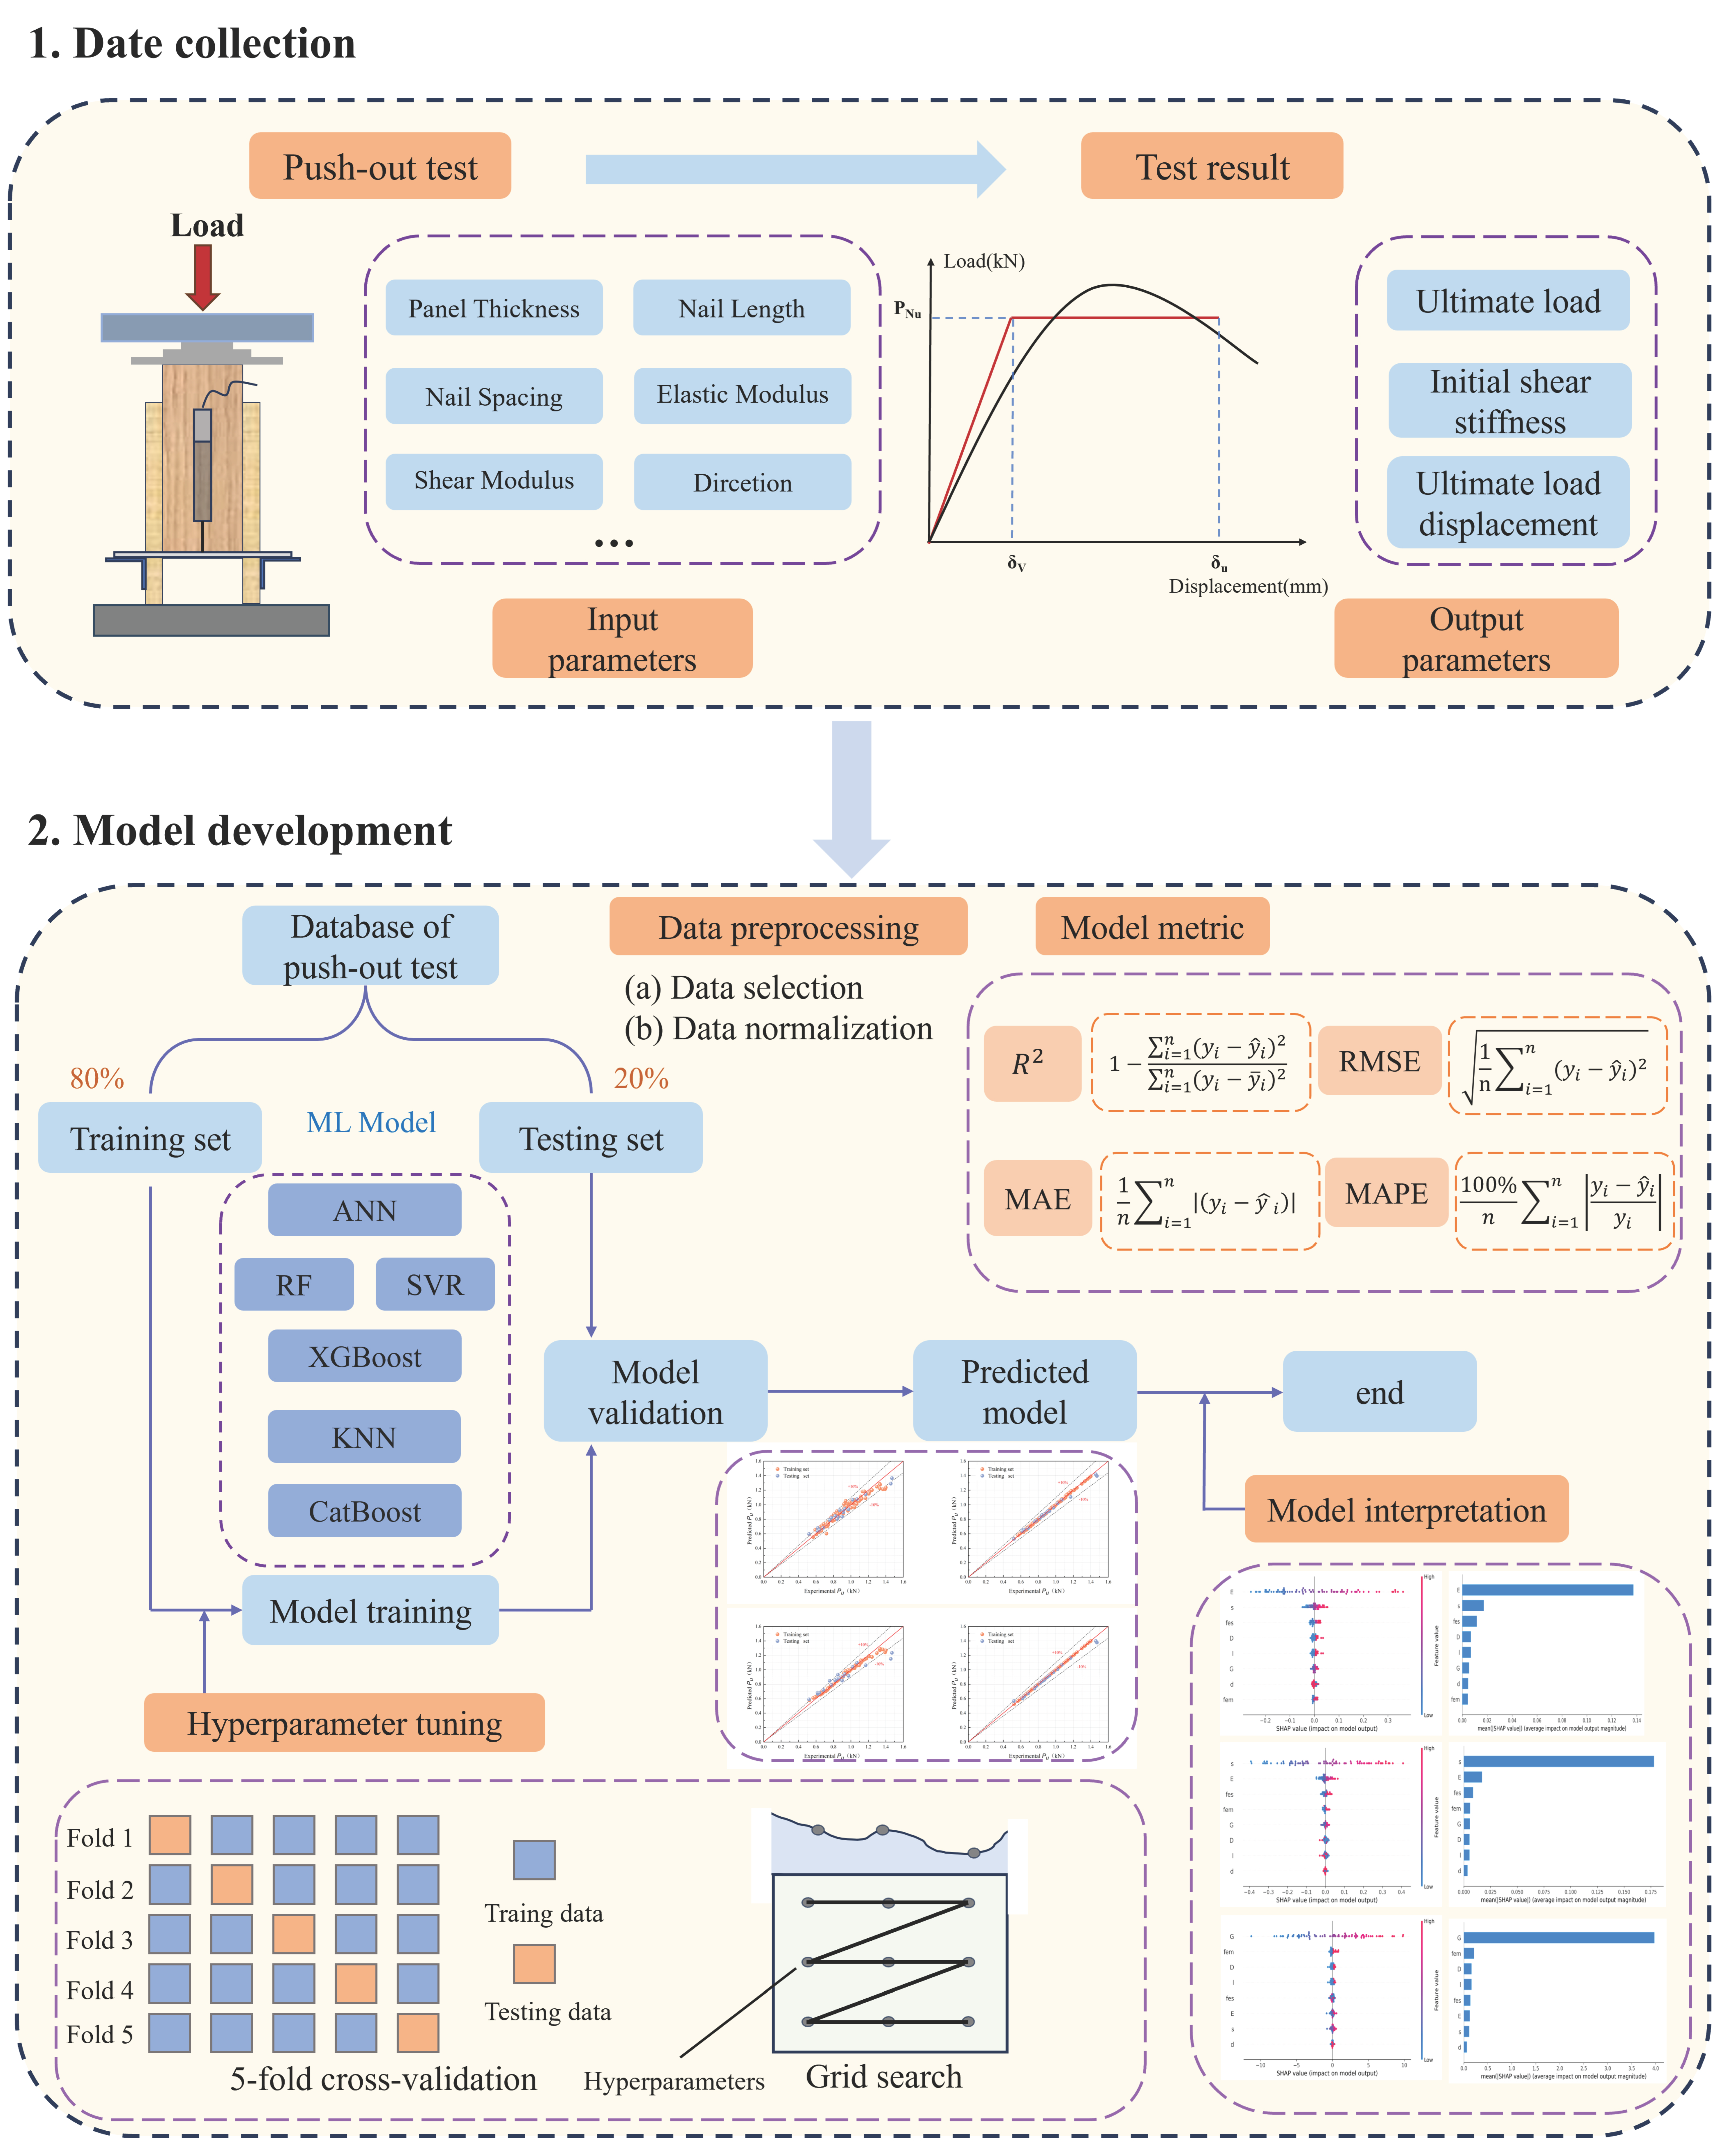
Six ML models were developed in Python 3.9.0 to predict key characteristics of the load–displacement curves for nailed connections. The models included support vector regression (SVR), ANN, random forest (RF), extreme gradient boosting (XGBoost), K-nearest neighbor (KNN), and categorical boosting (CatBoost). The model development process, illustrated in Figure 7, comprised several key stages: data processing, model training, performance evaluation, interpretability analysis, and further analysis.

4.1. Dataset for ML Application

The results from previous push-out tests conducted on 110 nailed connection specimens, the results from the tests were selected, compiled, and analyzed. The geometrical dimensions of the panel-sheathing nail-connected specimens included plate thickness (d, mm), nail length (l, mm), loading direction (D), nail spacing (s, mm). The loading direction (D) is defined as the orientation of the panel grain relative to the framing member, which is either perpendicular or parallel to the grain direction of the framing member. The material properties collected for model input included the elastic modulus of the face sheet (E, MPa), shear modulus (G, MPa), dowel-bearing strength of the face sheet (fes, N/mm2), and dowel-bearing strength of the base material (fem, N/mm2). The output parameters were defined as ultimate load (Pu, kN), initial shear stiffness (Ks, kN/mm), and ultimate displacement (δu, mm). Notably, objective exclusion criteria were applied during dataset preparation to ensure data quality and model reliability. Data were removed only under the following conditions:
(1)
Missing or malfunctioning LVDT readings;
(2)
Visually observed fixture slippage during testing;
(3)
Incomplete specimen failure.
In total, nine out of 110 specimens were excluded based on these criteria. This procedure ensures transparency and reproducibility of the dataset used for machine learning model development.

4.2. Model Evaluation Metrics

Four evaluation metrics were utilized to quantify the differences between experimental and predicted values: coefficient of determination (R2), mean absolute error (MAE), root mean square error (RMSE), and mean absolute percentage error (MAPE). They were calculated as follows:
R 2 = 1 i = 1 n y i y ^ i 2 i = 1 n y i y ¯ i 2
M S E = 1 n i = 1 n y i y ^ i
R M S E = 1 n i = 1 n y i y ^ i 2
M A P E = 100 % n i = 1 n y i y ^ i y i
where n is the sample size, y i is the experimental output value, y ^ i is the predicted output value, and y ¯ i is the average of the experimental output values.

4.3. Five-Fold Cross-Validation and Hyperparameter Tuning

The inconsistent magnitudes of input parameters may lead to performance degradation in distance-based models (such as KNN) and hinder the optimization process. To mitigate the effects of differing feature scales, standardization was applied to normalize all input variables to a common scale. Subsequently, the entire dataset was partitioned into 80% for training and 20% for testing using the train_test_split function from the Scikit-learn library. A five-fold cross-validation approach was employed in this study, whereby the training dataset was randomly divided into five subsets [30]. Each model was trained on four subsets under various hyperparameter configurations and subsequently evaluated on the remaining subset [31]. The training subset was employed for model training and hyperparameter tuning, whereas the independent testing subset was reserved for evaluating the predictive performance of the trained regression models.
Hyperparameter optimization plays a crucial role in the model training process, as it directly influences both model performance and computational efficiency. Unlike model parameters that are automatically updated during training, hyperparameters must be predefined prior to model fitting. In this study, the optimal hyperparameter configurations were determined using a grid search combined with 5-fold cross-validation, implemented through the Grid-Search CV function in the Scikit-learn library. Table 1 summarizes the optimal hyperparameter settings identified for the six models in predicting the characteristic parameters of the load–displacement curve. Hyperparameters not listed in the table were kept at their default values.

4.4. Machine Learning Algorithm

4.4.1. Artificial Neural Network (ANN)

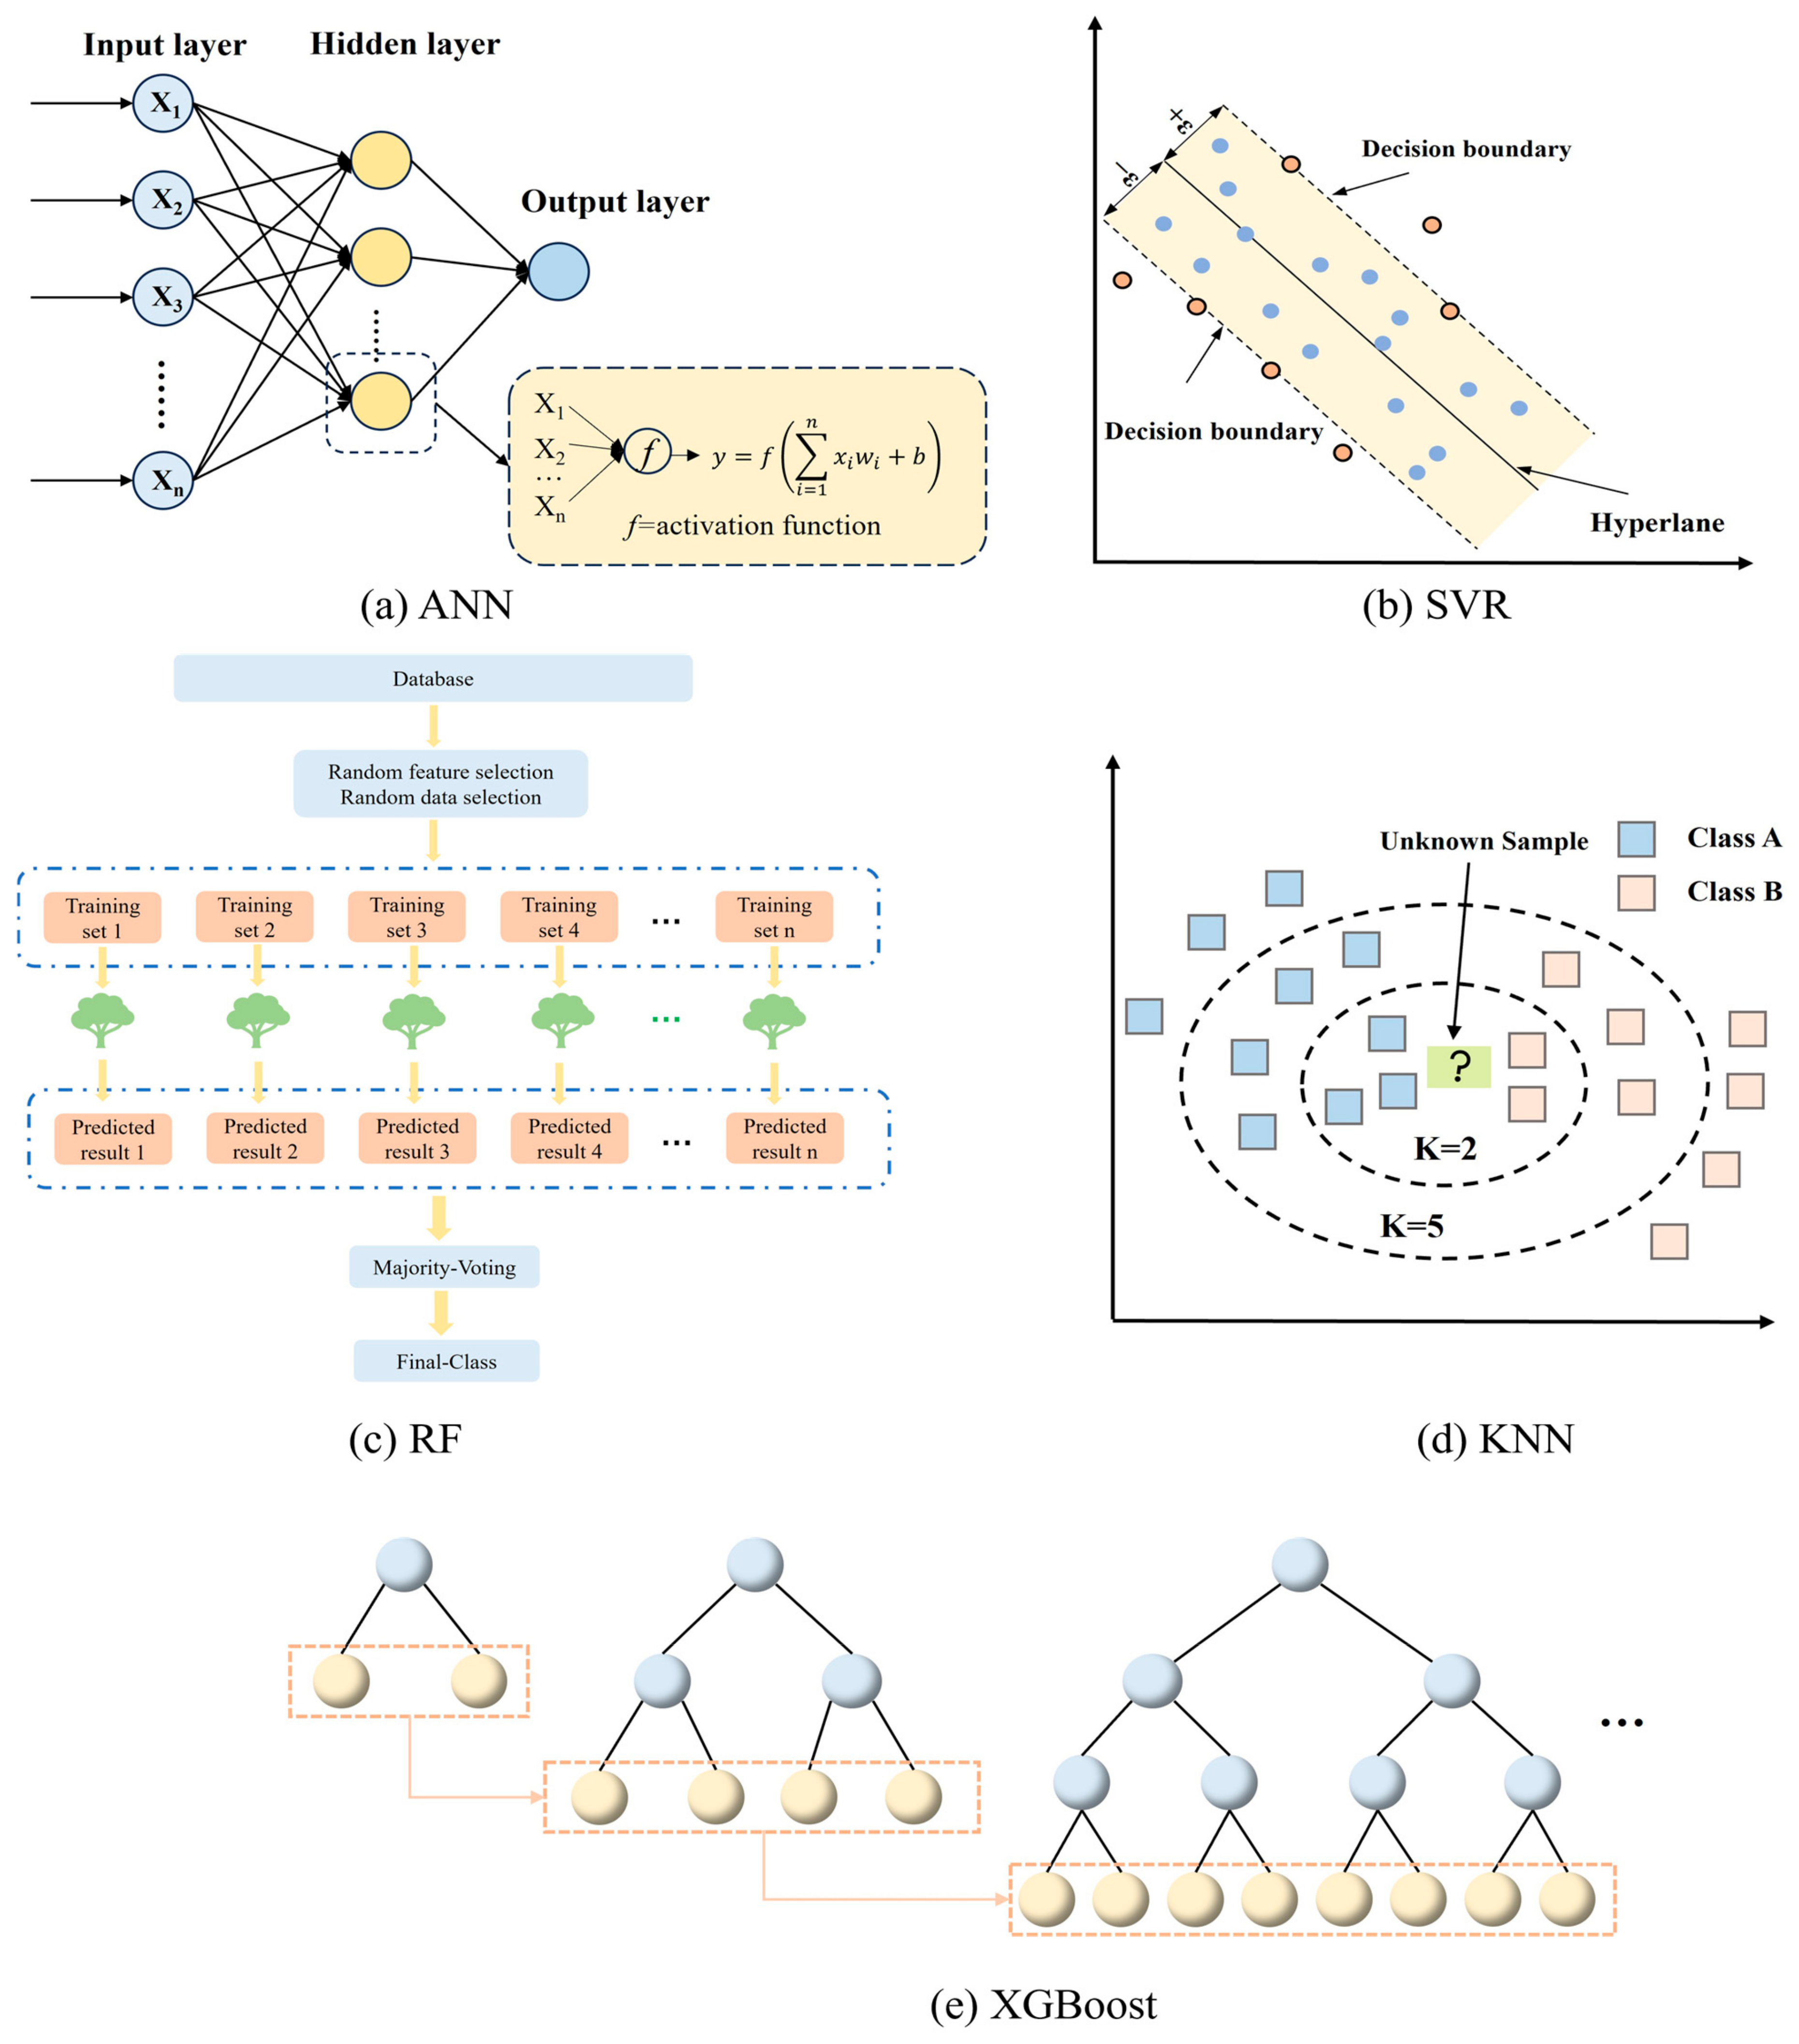
An artificial neural network (ANN) is a computational model inspired by the structure and function of biological neural networks, aiming to emulate the information processing capabilities of the human brain. This model employs numerous basic neuron units to process data and identify complex nonlinear relationships within datasets [32]. The most prevalent structure is the multi-layer perceptron (MLP), which comprises an input layer, hidden layers, and an output layer. During training, the error between the predicted and target values is back-propagated through the network using the gradient descent algorithm to optimize the neuron weights. Figure 8a illustrates the architecture of an ANN model. The calculation for neuron is as follows:
y = f i = 1 n w i x i + h
where x i denotes the input of the neuron, which is typically either the input from the input layer or an intermediate value from the hidden layer. h denotes the bias term. w i denotes the weight associated with the input. f is the activation function, which introduces nonlinearity into the model and enables the ANN to model complex, nonlinear relationships within the data.

4.4.2. Support Vector Regression (SVR)

Support vector regression (SVR) is a predictive model derived from the support vector machine (SVM) framework to solve linear and nonlinear regression problems. Its core concept is to find an optimal hyperplane that best approximates the relationship between input and output variables within a specified error tolerance ε, as shown in Figure 8b. SVR employs kernel functions to map input data into a higher-dimensional feature space, thereby enabling the modeling of complex nonlinear relationships. Commonly used kernel functions include linear, polynomial, and radial basis function (RBF) kernels, whose appropriate selection greatly influences the model’s predictive accuracy and generalization performance.

4.4.3. Random Forest (RF)

Random forest (RF) is a robust ensemble learning algorithm that integrates bagging and random feature selection to construct multiple decision trees in parallel. The final regression output is obtained by averaging the predictions of all individual trees [33]. Each tree is trained on a bootstrap-sampled subset of the dataset, which reduces overfitting and improves generalization. The structure of the RF model is illustrated in Figure 8c. In this study, RF was employed regression-based decision trees to predict the load-bearing capacity of the nailed connection.

4.4.4. Extreme Gradient Boosting (XGBoost)

XGBoost is an efficient and powerful ensemble algorithm built upon gradient-boosted decision trees. It minimizes prediction error by iteratively constructing new trees, forming a strong predictive model composed of multiple weak learners (as shown in Figure 8e). During training, XGBoost evaluates the gain of each potential split and performs the split only when the gain exceeds a predefined complexity penalty, thus controlling overfitting and maintaining model simplicity. The final prediction is obtained by aggregating the outputs of all trees [34], and the objective function of the XGBoost algorithm is expressed as follows [35]:
L φ = i l y ^ i + y i + k Ω f k
where l is the loss function, which measures the difference between the predicted value y ^ i and the true value y i . Ω is the regularization term, which reduces model complexity and prevent overfitting.

4.4.5. K-Nearest Neighbor (KNN)

K-nearest neighbor (KNN) is a non-parametric supervised learning algorithm applicable to both classification and regression tasks. It predicts the output of an unknown sample by identifying its K-nearest neighbors in the training set based on a chosen distance metric, such as Euclidean, Manhattan, or Minkowski distance [36]. In classification tasks, KNN assigns the class label that appears most frequently among the neighbors using majority voting, whereas the prediction is typically computed as the average of the neighbors’ target values in regression tasks. Its performance is significantly influenced by the number of neighbors (K), the distance metric, and feature scaling. Consequently, cross-validation and normalization techniques are commonly employed to optimize its performance. The architecture of the KNN model is illustrated in Figure 8d.

4.4.6. Categorical Boosting (CatBoost)

CatBoost is a supervised machine learning algorithm based on gradient boosting rather than traditional decision trees, offering high efficiency and excellent performance in large-scale regression and classification tasks [37]. In each iteration, it updates the model by computing the gradient of the loss function to progressively reduce prediction error. CatBoost employs target encoding with dynamic bias correction to prevent overfitting and mitigate target leakage, while its symmetric tree structure accelerates inference and supports hardware optimization. Owing to its robustness in handling high-cardinality categorical features and noisy data, CatBoost demonstrates strong generalization and predictive capabilities across diverse applications.

5. Results and Discussion

5.1. Model Performance

Figure 9 illustrates the predicted and experimental ultimate load of the nail-connected push-out specimens. The predicted data points for each model are tightly clustered around the ideal line (y = x), indicating a good agreement between the predicted and experimental results. The SVR and XGBoost models exhibit a higher density of predictions within the ±10% error band, highlighting their excellent predictive stability. Table 2 summarizes the performance metrics for the six ML models in predicting the ultimate load of nailed connections. The RF model exhibits the lowest performance, with the highest MAE and RMSE of 0.1181 and 0.1637, respectively, and an R2 value of 0.8887. In contrast, the R2 values for the other models exceed 0.90. The SVR model achieves the highest prediction accuracy, with an R2 value of 0.995, and the lowest MAE, RMSE, and MAPE values of 0.016, 0.0370, and 0.89%, respectively. Thus, it is identified as the optimal approach for predicting the ultimate load of nailed connections.
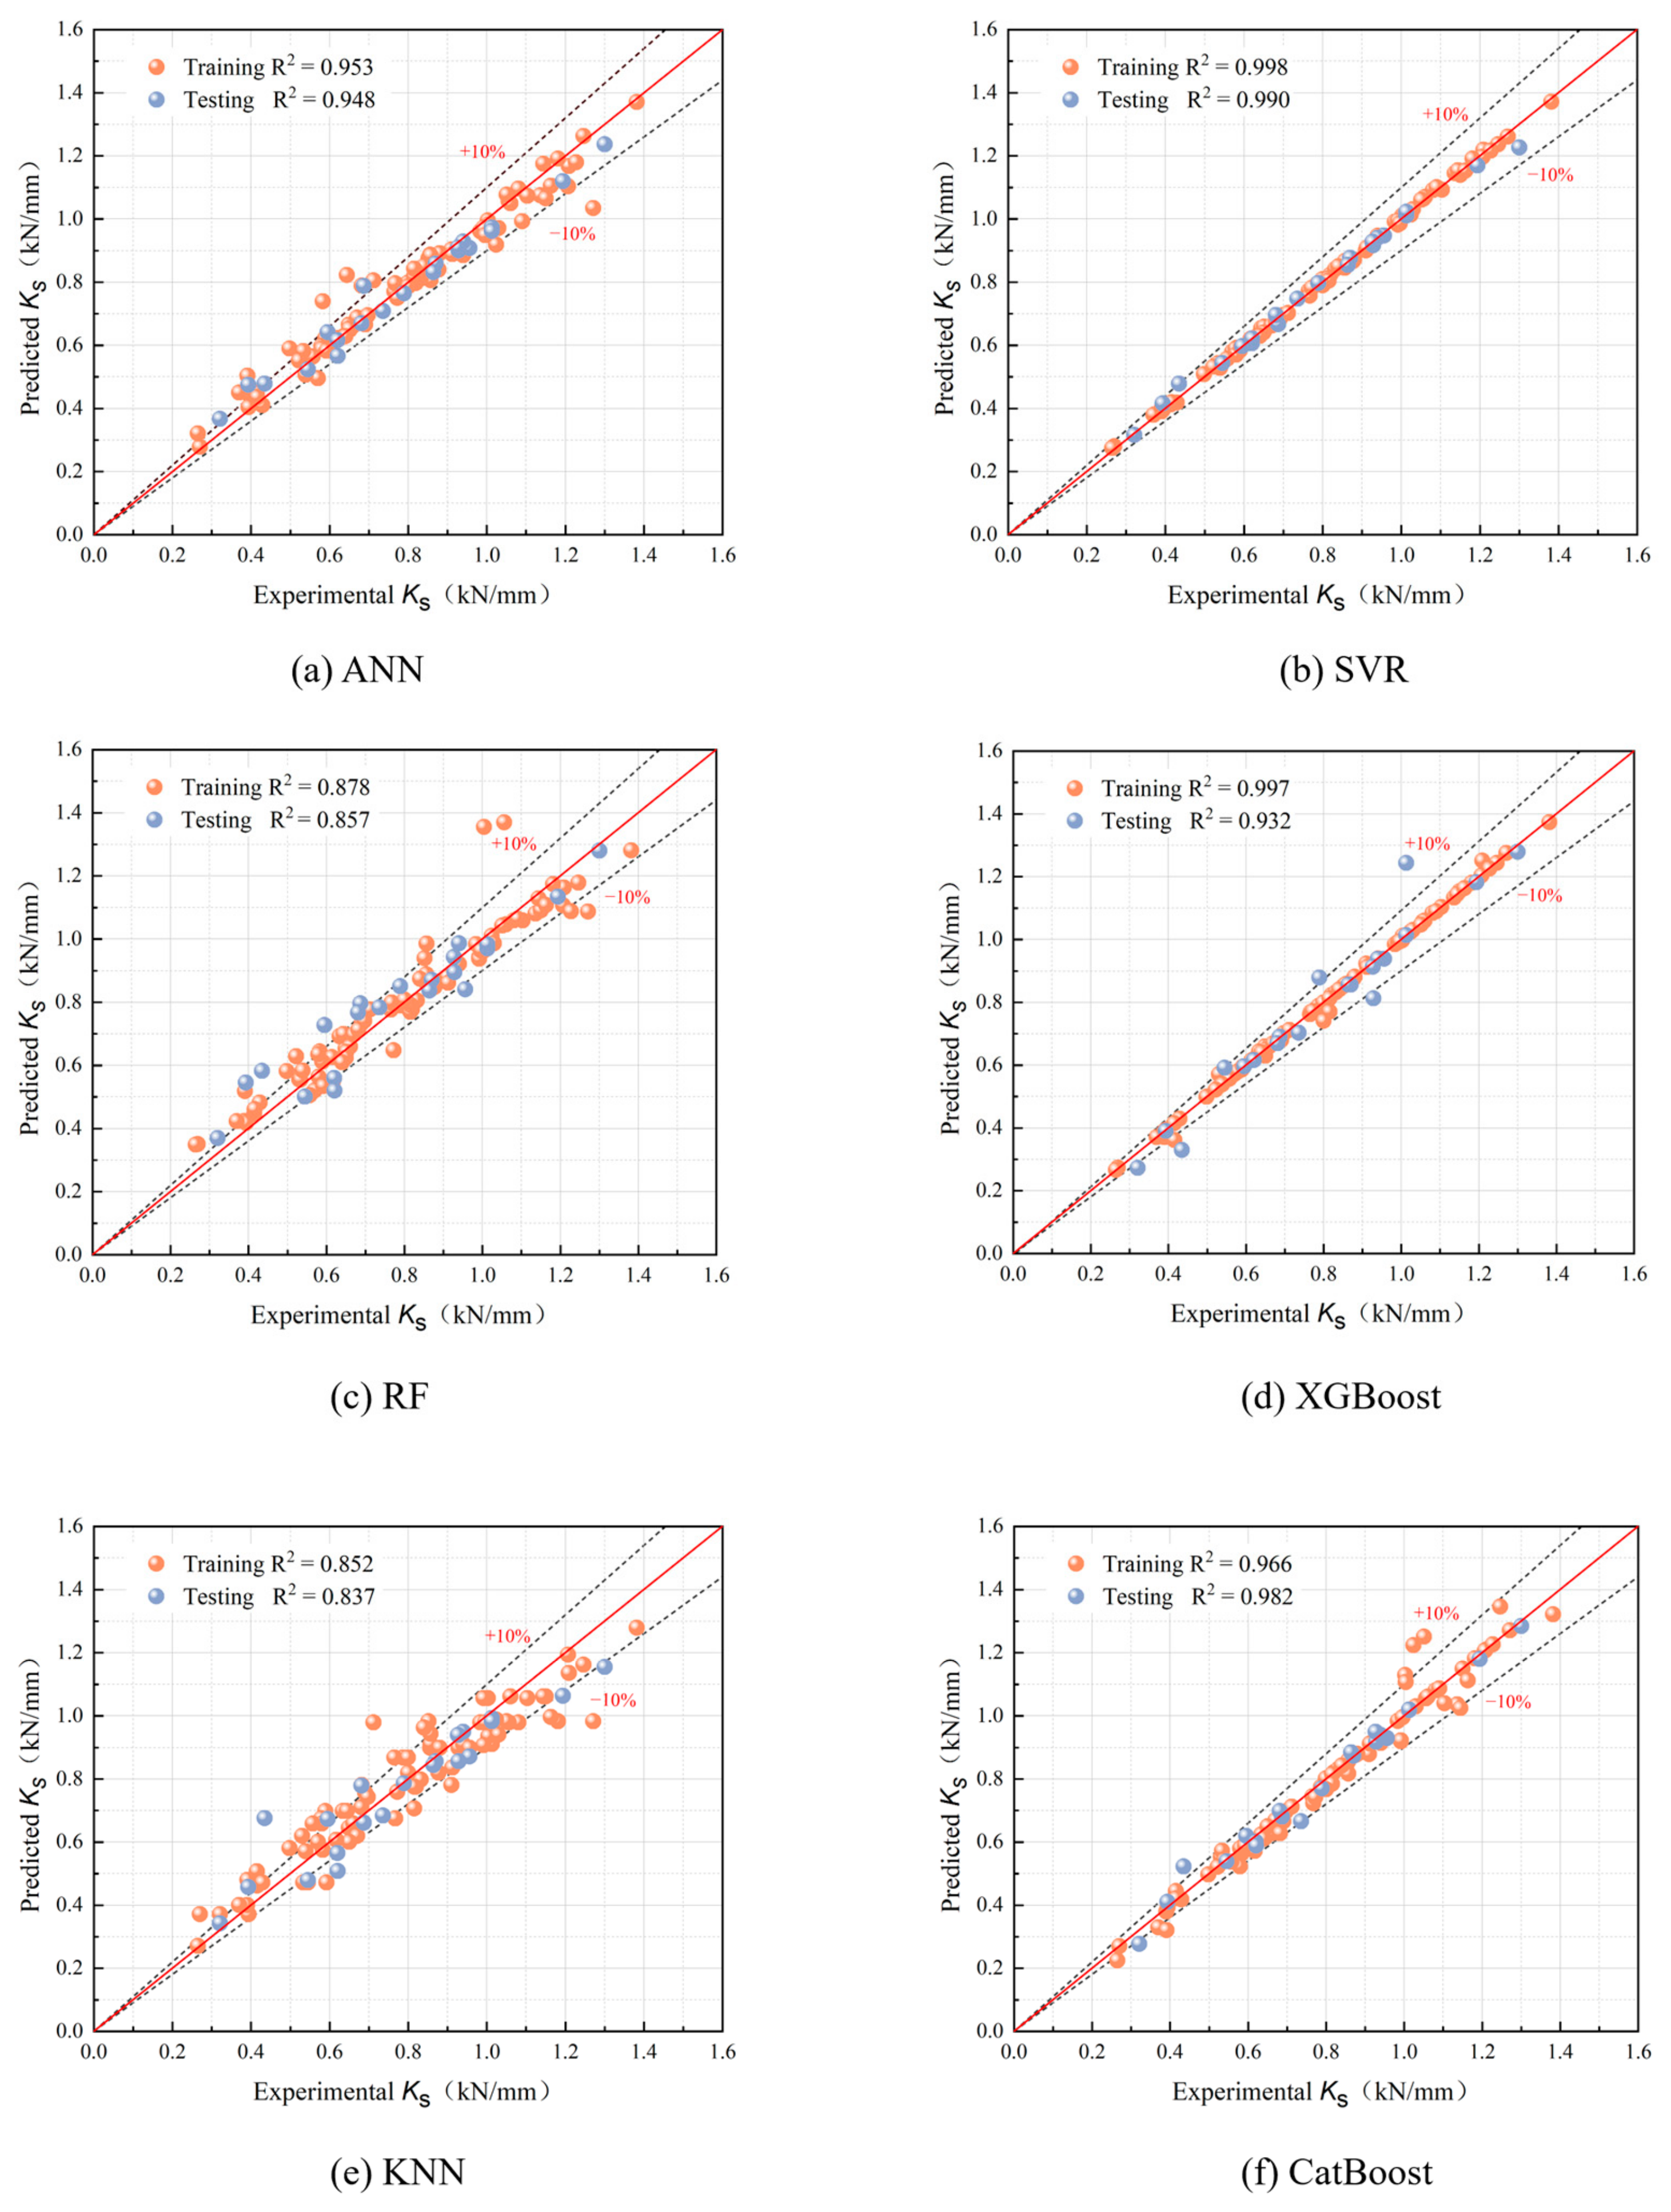
Figure 10 shows the predicted and experimental initial shear stiffness values of the panel-sheathing nail-connected specimens. The predicted data points closely follow the line (y = x), indicating a good agreement between the predicted and actual values. The SVR and XGBoost models exhibit superior prediction accuracy, with the majority of predictions within or near the ±10% error band. Table 3 summarizes the performance metrics for the six ML models in predicting the initial shear stiffness. A comparative analysis reveals that the KNN model exhibits lower performance, with an R2 of only 0.8515, whereas the other models achieve R2 values are close to or greater than 0.90. Furthermore, both the RF and ANN models exhibit higher MAE, RMSE, and MAPE values, indicating lower prediction accuracy. The SVR and XGBoost models show the best performance in predicting the initial shear stiffness of nailed connections. The SVR model achieves an R2 of 0.9976, and the XGBoost model achieves an R2 of 0.9849, reflecting exceptionally high prediction accuracies. Although the MAE and RMSE values for these two models are comparable, the XGBoost model has a significantly higher MAPE than that for the SVR model. Consequently, the SVR model is recommended to predict the initial shear stiffness Ks of panel-sheathing nail connection accurately.
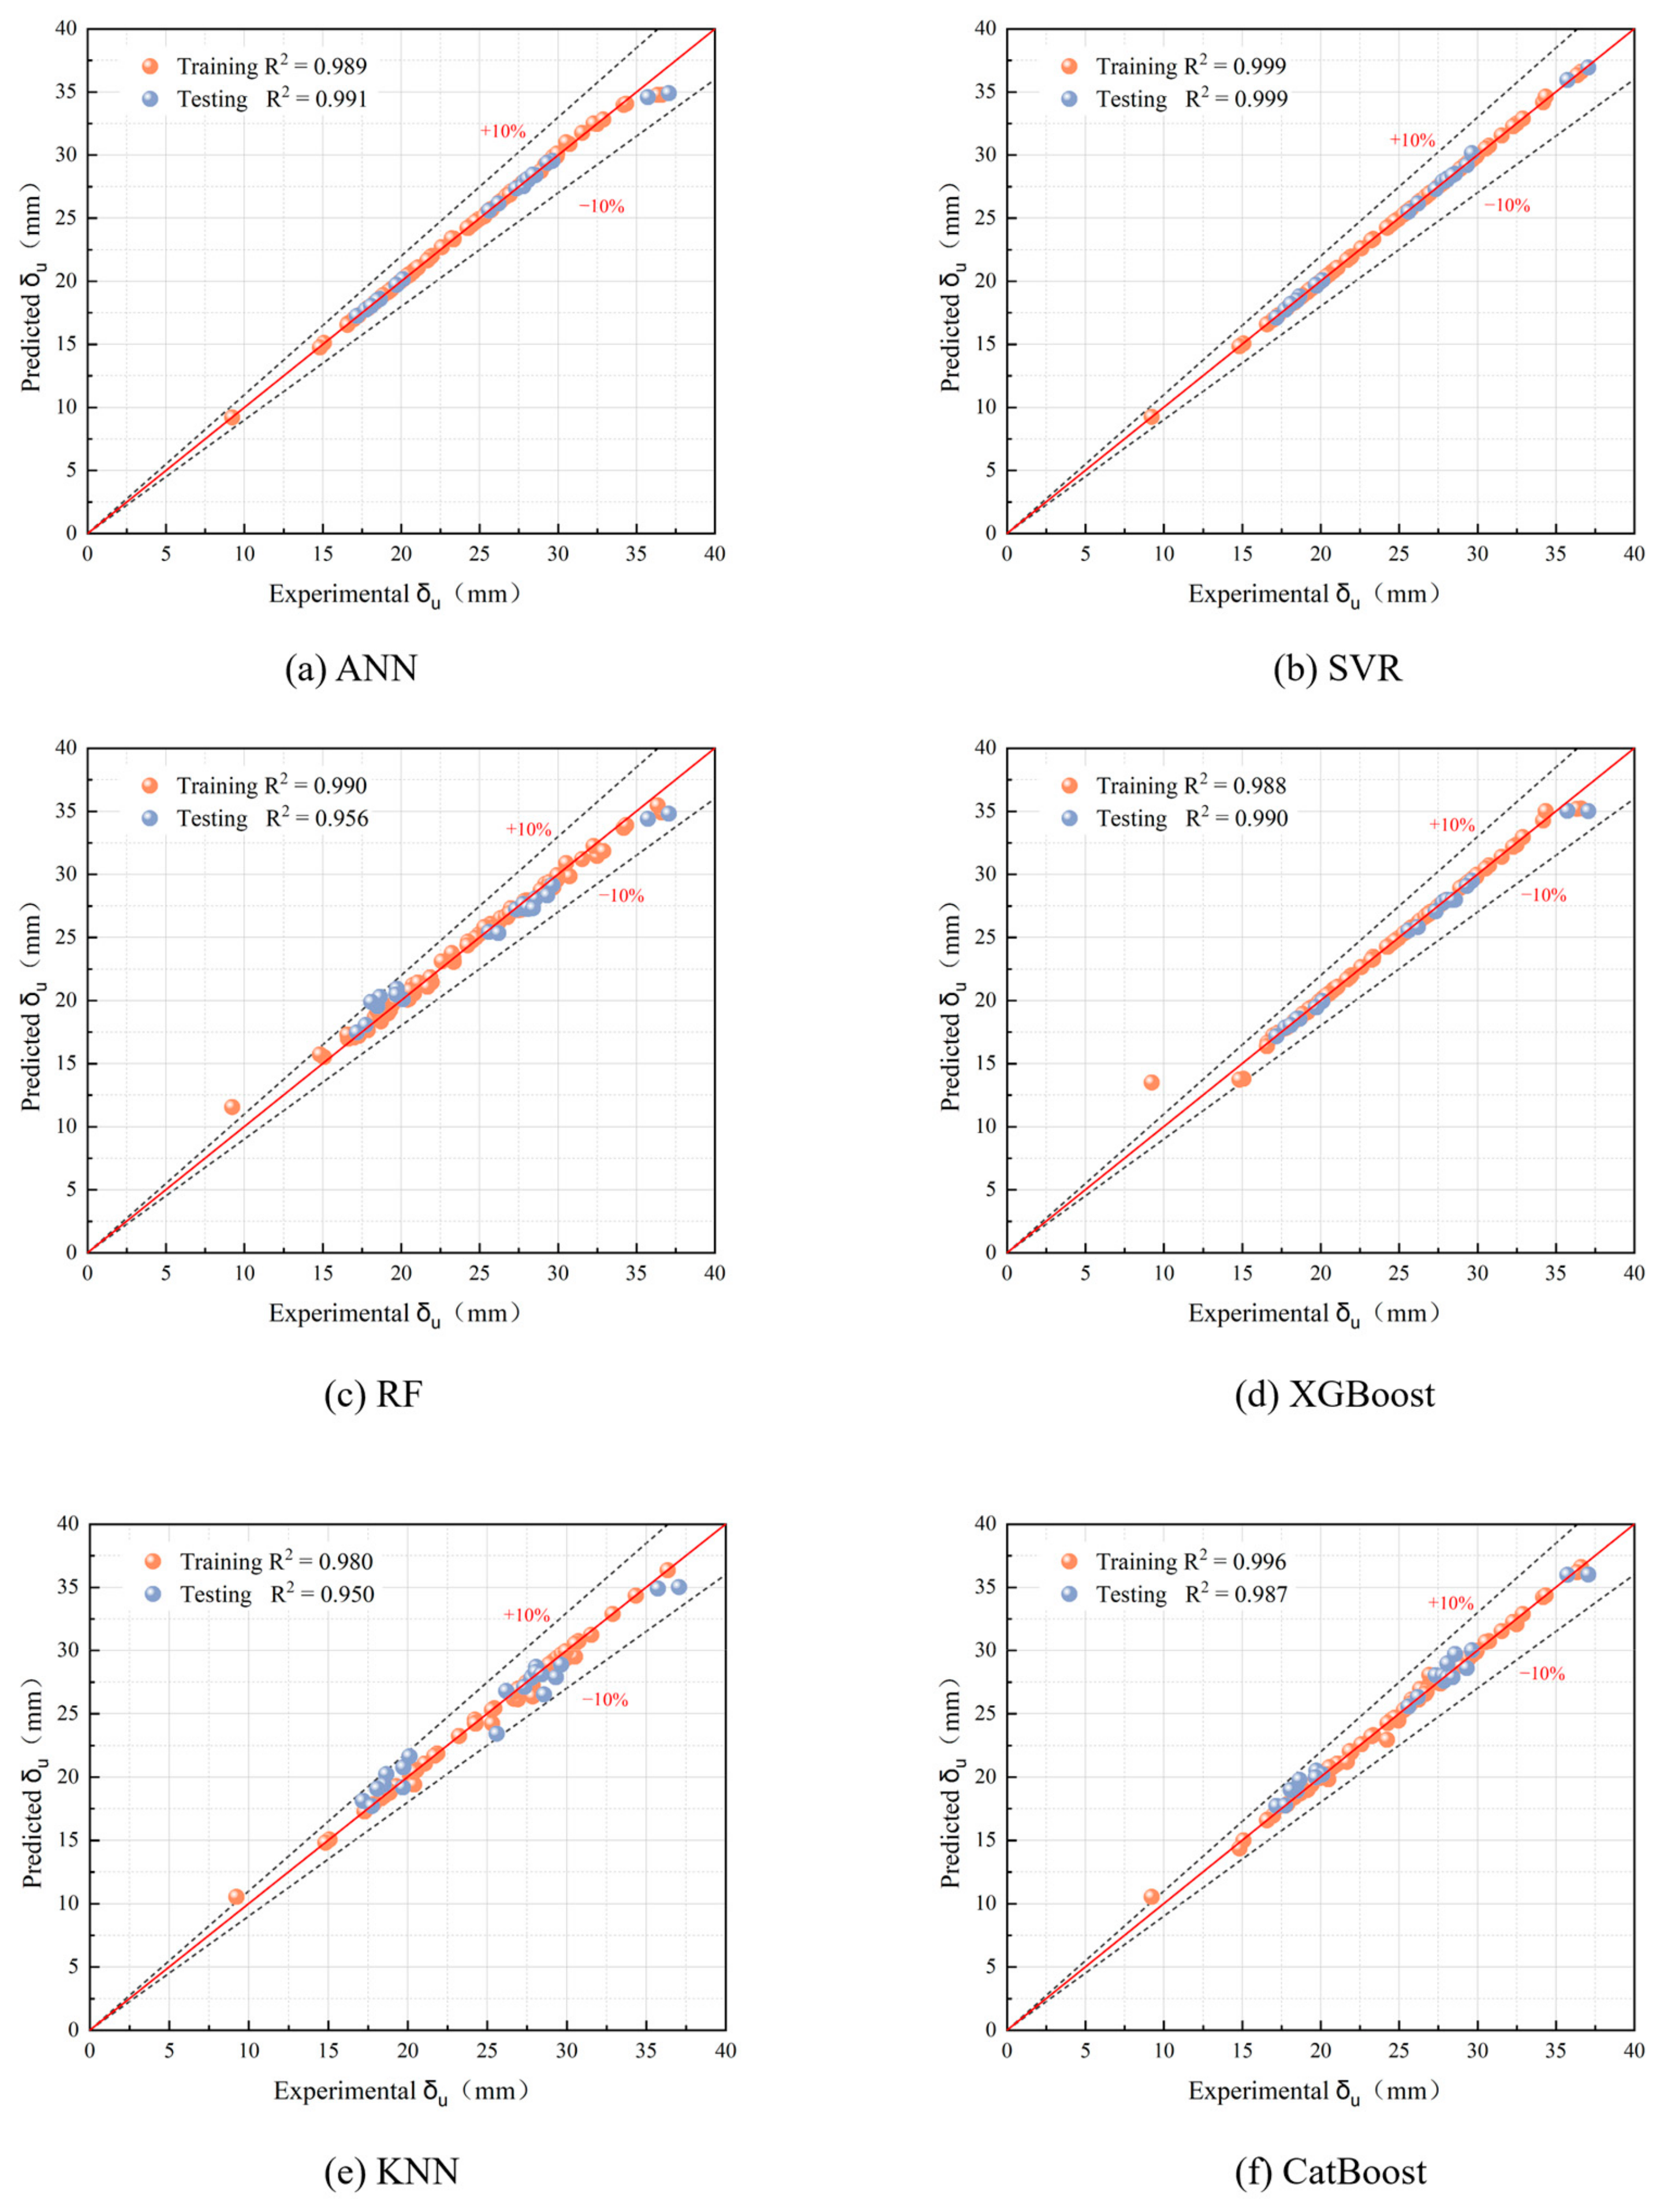
Figure 11 shows the predicted and experimental ultimate displacement values. The predictions from the ANN and RF models are relatively scattered, indicating lower predictive capability. In contrast, the SVR, ANN and CatBoost models demonstrate superior predictive performance, with most predicted values falling within or near the ±10% error band. Table 4 summarizes the performance metrics for the six ML models in predicting the ultimate displacement. Notably, the R2 values for the ANN, SVR, and CatBoost models exceed 0.99, with relatively low MAE, RMSE, and MAPE values. The SVR model achieves the best prediction performance, with the highest R2 value of 0.9994 and the lowest MAE, RMSE, and MAPE values (0.0294, 0.0709, and 0.11%, respectively). Therefore, the SVR model is the optimal choice for predicting the ultimate displacement in nailed connections.

5.2. Model Interpretation

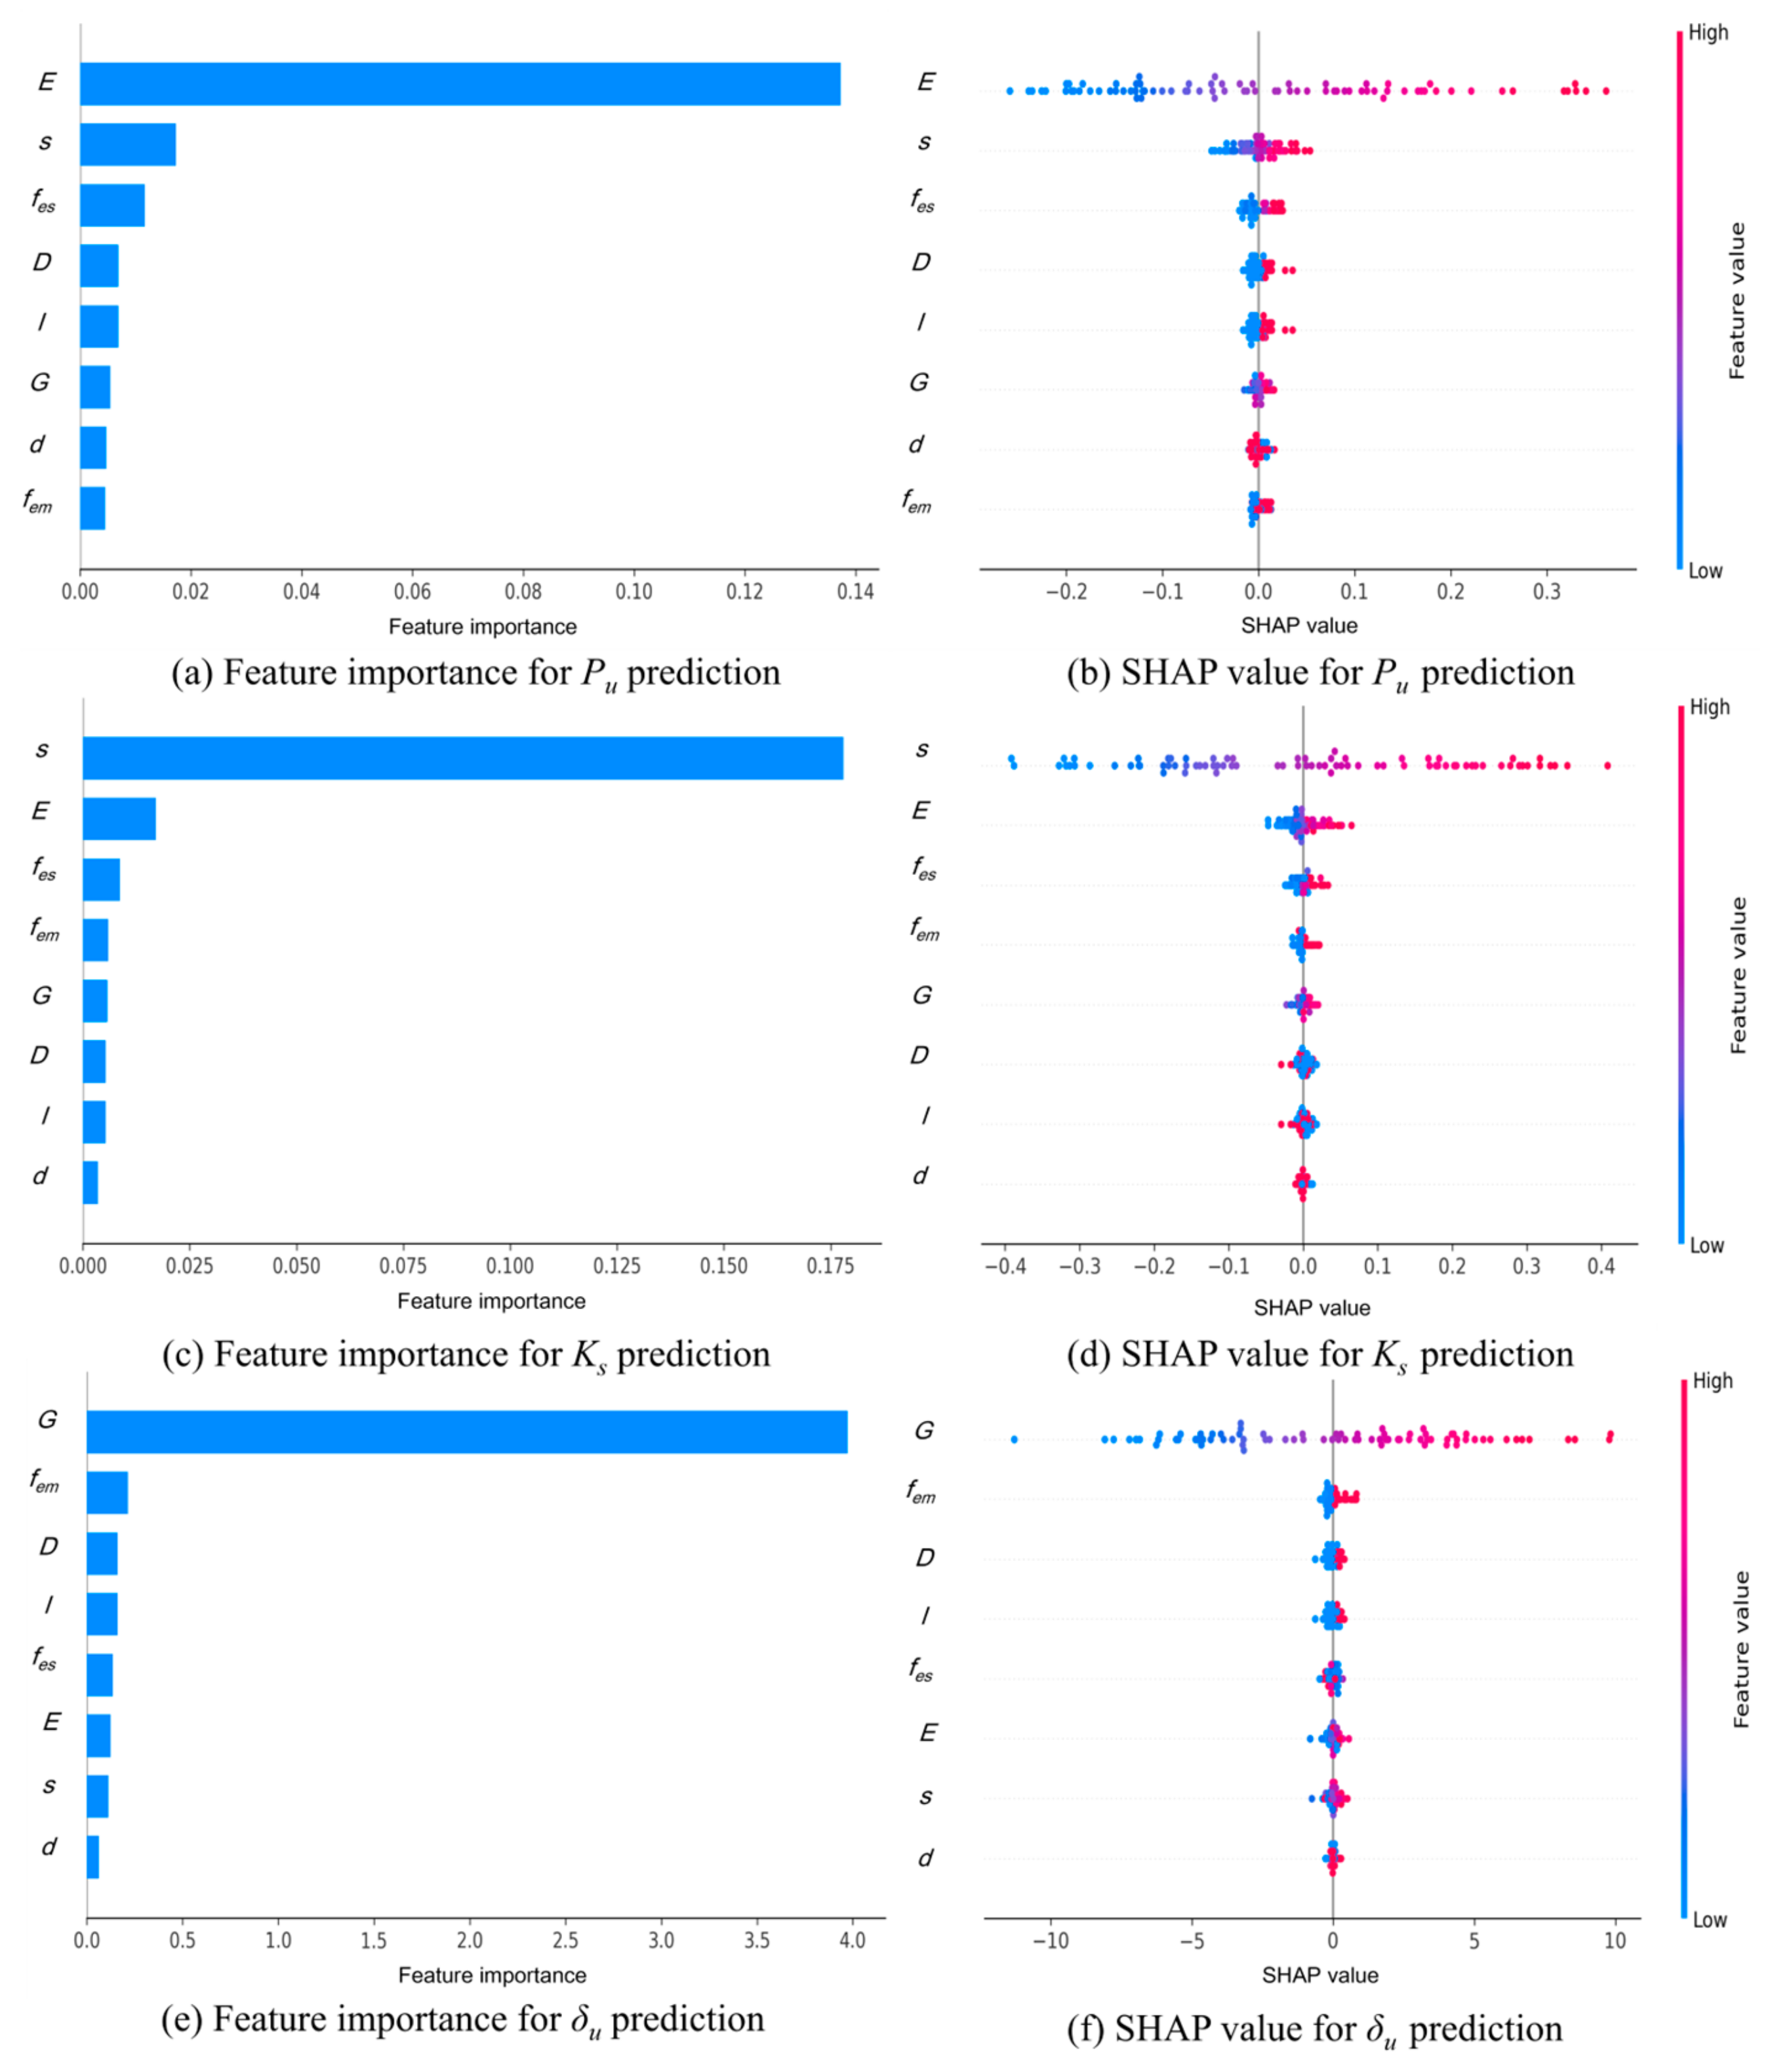
This study employed the SHAP method to identify the key input parameters that significantly influence the output performance of the ML model. Owing to space constraints, the SHAP analysis was exclusively conducted on the ML model with the highest performance in predicting the three characteristic values of the load–displacement curve. Figure 12 presents the feature importance and SHAP values of the input parameters. They are arranged in descending order of importance for the three output variables. Figure 12a,b illustrate the feature importance and SHAP values for predicting the ultimate load of the nailed connection. The results indicate that the elastic modulus of the side plate is the primary influential factor, followed by nail spacing and pin-bearing strength of the side plate. A higher elastic modulus enhances the embedment stiffness between the nail and the surrounding wood fibers, making nail embedment into the side plate more difficult and improving shear load transfer efficiency across the interface. Consequently, specimens with stiffer side plates exhibit greater resistance to deformation, requiring a higher load to reach failure. Meanwhile, the elastic modulus of wood materials is positively correlated with density, denser side plates usually exhibit higher stiffness and greater nail resistance, resulting in improved shear performance. This physical mechanism explains the strong positive correlation between the elastic modulus and the ultimate load within a certain range. In contrast, the nail spacing and the pin-bearing strength of the side plate have moderate influenced because specimen failure primarily results from the bearing failure of the inner side plate and the crushing of the face plate.
Figure 12c,d indicate that the nail spacing is the most critical factor affecting the initial shear stiffness, with a smaller spacing significantly enhancing it. A higher elastic modulus and pin-bearing strength of the side plate also improve the initial shear stiffness, by maintaining dimensional stability and load capacity.
Figure 12e,f depict the feature importance and SHAP values for predicting the ultimate displacement. The results indicate that the shear modulus of the side plate is the most critical factor affecting the ultimate displacement, followed by the pin-bearing strength of the base material. A positive correlation exists between the shear modulus and the ultimate displacement because a larger shear modulus enables the side plate to sustain a greater load and delay deformation, increasing the ultimate displacement. The pin-bearing capacity of the base material is the dominant factor in later stages, with its failure defining the ultimate displacement.

5.3. Calculation of Bearing Capacity

5.3.1. Calculation Using Eurocode 5-1995

The calculation method for determining the design value F d of the shear bearing capacity of a single-shear nailed connection, as specified in Eurocode 5 [27], is presented in Equation (7):
F d = m i n   f T T d   a   f t t s d     b f t t d 1 + β f β f + 2 β f 2 1 + β t + β t 2 + β f 3 β t 2 β f 1 + β t + F w k 4   c 1.05 f t T d 1 + 2 β f 2 β f 2 1 + β f + 4 β f 1 + 2 β f M y f t T 2 d β f + F w k 4     d 1.05 f t t d 1 + 2 β f 2 β f 1 + β f + 4 β f 1 + 2 β f M y f t t 2 d β f + F w k 4     e   1.15 2 β f 1 + β f 2 M y f t d + F w k 4     f                          
where f t is the standard value of the dowel-bearing strength of the side plate member; t is the thickness of the side plate member; f T is the standard value of the dowel-bearing strength of the base material member; T is the thickness of the base material member; β f is the ratio of the standard values of the dowel-bearing strength between the base material member and the side plate member; β t is the ratio of the thickness between the base material member and the side plate member; M y is the standard value of the yield flexural strength of the nail; F w k is the standard value of the pull-out bearing capacity of the nail.

5.3.2. Calculation Using GB/T 50005-2017

According to GB/T 50005-2017 [38], the design bearing capacity of single-shear dowel-type fasteners in nail connections is calculated using Equation (8).
F d = C m C n C t k g F
where C m represents the moisture content adjustment coefficient. Since the moisture content of the wood in the test was less than 15%, it was 1.00. C n represents the adjustment coefficient of the design service life; it was 1.00. C t represents the temperature adjustment coefficient; it was 1.00. k g represents the combination of nails; it was 1.00.
F represents the design value of the bearing capacity. It is calculated using according to Equation (9).
F = k m i n t s d f e s
where t s represents the thickness of the side plate. k m i n represents the minimum effective length coefficient of the bearing pressure of the pin groove on the side plate. f e s represents the standard value of the bearing pressure strength of the pin groove of the side plate member. d represents the diameter of the nail.
k m i n can be calculated using Equations (10)–(13).
For failure mode IIIm:
k m i n = k s III γ III
k s III = R e 2 + R e 2 1 + R e R e + 1.647 1 + 2 R e k e p f y k d 2 3 R e f e s t s 2 1
For failure mode IV:
k m i n = k s IV γ IV
k s IV = d t s 1.647 R e k e p f y k 3 1 + R e f e s
R e = f e m f e s
where k e p represents the elastoplastic coefficient of the nail, which was 1.00. f y k represents the standard value of the flexural yield strength of the nail. γ III and γ IV represent the partial coefficients of resistance, which were 2.22 and 1.88, respectively.
Table 5 presents the design shear bearing capacity values of the nailed connections calculated according to Eurocode 5 and GB/T 50005-2017. Figure 13 compares the experimental results and the predicted values. Table 6 presents the performance metrics of the empirical formulas. The statistical results reveal a considerable deviation between the predicted and experimental values obtained from the traditional empirical equations. In particular, the GB/T 50005-2017 formula adopts a conservative calculation approach to ensure safety, which leads to a significant underestimation of the actual load-bearing capacity. The predictions based on Eurocode 5 show a trend generally consistent with the experimental results. However, they still fail to accurately capture the detailed characteristics of the measured data. The discrepancies may be attributed to the material property differences and simplifications inherent in the Eurocode 5 model. Therefore, the traditional empirical formulations are not suitable for accurate design evaluation of modern wood structures. Compared with the empirical formulas’ predictions, the ML model provides significantly higher accuracy and smaller deviation highlighting its potential for improved reliability in engineering applications.

6. Conclusions

This study predicted the key characteristic values of the load–displacement curves of panel-sheathing nailed connection in wood structures. A comprehensive database was established, and six ML models were developed to predict ultimate load, initial shear stiffness, and ultimate displacement. Interpretability analyses identified the most influential input features, and the ML results were compared with existing empirical equations. The results showed high accuracy in predicting the shear bearing capacity of nailed connections. The following conclusions were obtained.
(1)
The test results indicate that the performance of nailed connections in wood structures depends on the nail type, substrate, and the thickness and type of the side plates. Thus, it is essential to consider these factors in designing and researching wood structure shear walls or floor slabs to establish an effective collaborative load-bearing mechanism.
(2)
The failure modes of the panel-sheathing nailed connection included Mode IIIm (single plastic hinge failure) and Mode IV (double plastic hinge failure). These two failure modes depended on the thickness of the side plates and the length of the nails. Additionally, the grain direction of the side plates had a negligible effect on the shear bearing capacity of the specimens.
(3)
The test results demonstrate that the load–displacement curves of the nailed connections exhibited a consistent pattern of three stages: linear elastic, elastoplastic, and failure stages. This finding indicates that employing ML models to predict a simplified load–displacement curve is feasible and justified.
(4)
Six ML methods (ANN, SVR, RF, XGBoost, KNN, and CatBoost) were employed to predict the ultimate load, initial shear stiffness, and ultimate displacement of the nailed connections. A comparison analysis revealed that the SVR exhibited the best performance in predicting the three characteristic values of the load–displacement curves of the nailed connection push-out specimens, achieving R2 values of 0.9950, 0.9976, and 0.9994, respectively.
(5)
The ML model demonstrated significantly higher predictive accuracy and broader applicability than existing empirical equations in predicting the characteristic values of the load–displacement curves of nailed connections. These models can be used for the structural design of nailed connectors in wood structures.
Although this study is limited by the size of the available dataset, the results confirm the feasibility of using machine learning models to predict the shear behavior of nailed connections in wood structures. Future work will expand the experimental database and input parameters to enhance model robustness. Cyclic loading tests will also be conducted to capture degradation and hysteretic energy dissipation under realistic seismic conditions, while independent validation using external datasets will be performed to assess model generalization. In addition, advanced ML-based tools will be developed to facilitate practical engineering applications in wood seismic design.

Supplementary Materials

The following supporting information can be downloaded at: https://www.mdpi.com/article/10.3390/buildings15224158/s1, Table S1: The number and corresponding parameters of the specimens.

Author Contributions

Conceptualization, W.S. and K.J.; methodology, W.S.; software, W.S.; validation, H.Z. and Z.W.; formal analysis, W.S. and X.W.; investigation, K.J.; resources, Z.W.; data curation, W.S., K.J. and H.Z.; writing—original draft preparation, W.S.; writing—review and editing, Z.W. and Y.W.; visualization, W.S.; supervision, Y.W.; project administration, K.J.; funding acquisition, Z.W. All authors have read and agreed to the published version of the manuscript.

Funding

This research was funded by the Special Funds for the Central Public-interest Scientific Institution Basal Research Fund, Chinese Academy of Forestry (Grant No. CAFYBB2020SY046).

Data Availability Statement

The original contributions presented in the study are included in the article; further inquiries can be directed to the corresponding author.

Conflicts of Interest

The authors declare that they have no conflicts of interest in this work.

References

  1. Derakhshan, S.S.; Zhou, L.; Ni, C. Influence of the Loading Protocol and Loading Rate on the Characteristics of Timber Nail Joints. J. Renew. Mater. 2022, 10, 2655–2667. [Google Scholar] [CrossRef]
  2. Que, Z.; Ling, Y.; Dan, Z.; Wang, Y.; Yong, W. Experimental Study of Nail Joints of Shear Walls under Different Cladding Conditions in Wood Frame Structures. Build. Struct. 2014, 44, 81–85. [Google Scholar]
  3. Yan, L.; Zou, X.; Yun, G. Test Research of the Nail Joints on Light Wood Structure. In Proceedings of the World Conference on Timber Engineering 2010, Trentino, Italy, 20–24 June 2010. [Google Scholar]
  4. Zheng, W.; Lu, W.; Liu, W.; Wang, L.; Ling, Z. Experimental Investigation of Laterally Loaded Double-Shear-Nail Connections Used in Midply Wood Shear Walls. Constr. Build. Mater. 2015, 101, 761–771. [Google Scholar] [CrossRef]
  5. Wang, S.; Lin, J.; Dong, S.; Chen, Z.; Kong, F.; Ma, P.; Wang, F.; Que, Z. Lateral Resistance Performance of Wood-Frame Shear Walls with Wooden Nail Connections: Experimental and Finite Element Analysis. J. Bioresour. Bioprod. 2025, 10, 410–424. [Google Scholar] [CrossRef]
  6. Chen, G.; Jiang, H.; Yu, Y.F.; Zhou, T.; Wu, J.; Li, X. Experimental Analysis of Nailed LBL-to-LBL Connections Loaded Parallel to Grain. Mater. Struct. 2020, 53, 81. [Google Scholar] [CrossRef]
  7. Chen, G.; Yang, W.; Zhou, T.; Yu, Y.; Wu, J.; Jiang, H.; Li, X.; Zhang, Y. Experiments on Laminated Bamboo Lumber Nailed Connections. Constr. Build. Mater. 2021, 269, 121321. [Google Scholar] [CrossRef]
  8. Wahan, M.Y.; Zhang, Z.; Meng, X.; Gao, Y.; Ji, X. Mechanical Behavior of GFRP-Bamboo Composite Shear Connections. Constr. Build. Mater. 2022, 331, 127333. [Google Scholar] [CrossRef]
  9. Shahin, A.; Cowled, C.J.; Bailleres, H.; Fawzia, S. Experimental Study on Shear Performance of Nail and Screw-Laminated Timber-Steel Composite and Timber-Timber Systems Using Low-Grade Timber and Mechanical Fasteners. Constr. Build. Mater. 2024, 418, 135403. [Google Scholar] [CrossRef]
  10. Yan, B.; Zhang, W.; Ye, Y.; Yi, W. Study on the Prediction of Shear Capacity of New and Old Concrete Interfaces Based on Explainable Machine Learning Algorithms. Structures 2025, 71, 108065. [Google Scholar] [CrossRef]
  11. Zhao, Y.; Tian, J.; Zhou, W.; Liu, G.; Lu, J. Prediction of Shear Capacity of PRC Coupling Beams Using Machine Learning Methods. Structures 2025, 75, 108783. [Google Scholar] [CrossRef]
  12. Ge, P.; Yang, O.; He, J.; Zhang, K.; Wu, S. A Machine Learning Based Method for Predicting the Shear Strength of Fiber-Reinforced Concrete Joints in Precast Segmental Bridges. Eng. Struct. 2024, 302, 117324. [Google Scholar] [CrossRef]
  13. Li, X.; Liu, C.; Xue, Y.; Xue, S.; Liao, S.; Zhou, Y. Predicting Bearing Capacity of Angle Steel Bolted Connections Using Machine Learning Based on Experimental and Numerical Database. Structures 2024, 67, 107014. [Google Scholar] [CrossRef]
  14. Sarothi, S.Z.; Ahmed, K.S.; Khan, N.I.; Ahmed, A.; Nehdi, M.L. Predicting Bearing Capacity of Double Shear Bolted Connections Using Machine Learning. Eng. Struct. 2022, 251, 113497. [Google Scholar] [CrossRef]
  15. Wang, X.; Liu, Y.; Chen, A.; Ruan, X. Auto-Tuning Ensemble Models for Estimating Shear Resistance of Headed Studs in Concrete. J. Build. Eng. 2022, 52, 104470. [Google Scholar] [CrossRef]
  16. Zhu, J.; Farouk, A.I.B. Development of Hybrid Models for Shear Resistance Prediction of Grouped Stud Connectors in Concrete Using Improved Metaheuristic Optimization Techniques. Structures 2023, 50, 286–302. [Google Scholar] [CrossRef]
  17. Zhou, C.; Wang, W.; Zheng, Y. Data-Driven Shear Capacity Analysis of Headed Stud in Steel-UHPC Composite Structures. Eng. Struct. 2024, 321, 118946. [Google Scholar] [CrossRef]
  18. Lu, W.-W.; Chen, Y.-W.; Xu, J.-G.; Yang, H.-F.; Tao, H.-T.; Zheng, W.; Shi, B.-K. Prediction on Slip Modulus of Screwed Connection for Timber–Concrete Composite Structures Based on Machine Learning. Buildings 2025, 15, 2458. [Google Scholar] [CrossRef]
  19. Kazemi, F.; Asgarkhani, N.; Ghanbari-Ghazijahani, T.; Jankowski, R. Ensemble Machine Learning Models for Estimating Mechanical Curves of Concrete-Timber-Filled Steel Tubes. Eng. Appl. Artif. Intell. 2025, 156, 111234. [Google Scholar] [CrossRef]
  20. JAS-0360-2019; Structural Panel. Ministry of Agriculture, Forestry and Fisheries of Japan: Tokyo, Japan, 2019. (In Japanese)
  21. LY/T 1580-2010; Oriented Strand Board. National Forestry and Grassland Administration: Beijing, China, 2010. (In Chinese)
  22. GB/T 22349-2008; Plywood for Structural Wood Sheathing. National Forestry and Grassland Administration: Beijing, China, 2008. (In Chinese)
  23. LY/T 2059-2012; Steel Nail for Wood Structure. National Forestry and Grassland Administration: Beijing, China, 2012. (In Chinese)
  24. ASTM D1761-12; Standard Test Methods for Mechanical Fasteners in Wood. ASTM International: West Conshohocken, PA, USA, 2012.
  25. Specification for the Evaluation Method of Wood Shear Wall and Its Amplification Performance; Japan Housing and Wood Technology Center (HOWTEC): Tokyo, Japan, 2013. (In Japanese)
  26. Zhao, H.; Song, W.; Zhang, D.; Jia, K.; Wang, Z. Quasi-Static Test Study of Bamboo-Wood Composite Panel Diaphragm and Its Corresponding Nail Connection. Eng. Struct. 2025, 333, 119994. [Google Scholar] [CrossRef]
  27. EN 1995-1-1; Eurocode 5: Design of Timber Structures-Part 1-1: General-Common Rules and Rules for Buildings. European Union: Maastricht, The Netherlands, 2004.
  28. Ueda, R.; Sawata, K.; Sasaki, T.; Sasaki, Y. Effects of Decay on the Shear Properties of Nailed Joints Parallel and Perpendicular to the Grain. J. Wood Sci. 2021, 67, 70. [Google Scholar] [CrossRef]
  29. Chen, Z. Performance of Nail Connection in Shear-Walls of Light Wood Frame Houses—An Experimental Study. Master’s Thesis, Harbin Institute of Technology, Harbin, China, 2006. [Google Scholar]
  30. Wong, T.T.; Yeh, P.Y. Reliable Accuracy Estimates from k-Fold Cross Validation. IEEE Trans. Knowl. Data Eng. 2019, 32, 1586–1597. [Google Scholar] [CrossRef]
  31. Ghawi, R.; Pfeffer, J. Efficient Hyperparameter Tuning with Grid Search for Text Categorization Using kNN Approach with BM25 Similarity. Open Comput. Sci. 2019, 9, 160–180. [Google Scholar] [CrossRef]
  32. Yang, X. Artificial Neural Networks. In Handbook of Research on Geoinformatics; IGI Global: Hershey, PA, USA, 2009; pp. 122–128. [Google Scholar]
  33. Breiman, L. Random Forests. Mach. Learn. 2001, 45, 5–32. [Google Scholar] [CrossRef]
  34. Deng, Z.; Zhu, X.; Cheng, D.; Zong, M.; Zhang, S. Efficient kNN Classification Algorithm for Big Data. Neurocomputing 2016, 195, 143–148. [Google Scholar] [CrossRef]
  35. Prokhorenkova, L.; Gusev, G.; Vorobev, A.; Dorogush, A.V.; Gulin, A. CatBoost: Unbiased Boosting with Categorical Features. In Proceedings of the Advances in Neural Information Processing Systems 31 (NeurIPS 2018), Montreal, QC, Canada, 3–8 December 2018. [Google Scholar]
  36. Chen, T.; Guestrin, C. XGBoost: A Scalable Tree Boosting System. In Proceedings of the 22nd ACM SIGKDD International Conference on Knowledge Discovery and Data Mining, San Francisco, CA, USA, 13–17 August 2016; Association for Computing Machinery: New York, NY, USA, 2016; pp. 785–794. [Google Scholar]
  37. Dong, W.; Huang, Y.; Lehane, B.; Ma, G. XGBoost Algorithm-Based Prediction of Concrete Electrical Resistivity for Structural Health Monitoring. Autom. Constr. 2020, 114, 103155. [Google Scholar] [CrossRef]
  38. GB/T 50005-2017; Wood-Structure Design Standards. China State Engineering and Construction Press: Beijing, China, 2017. (In Chinese)
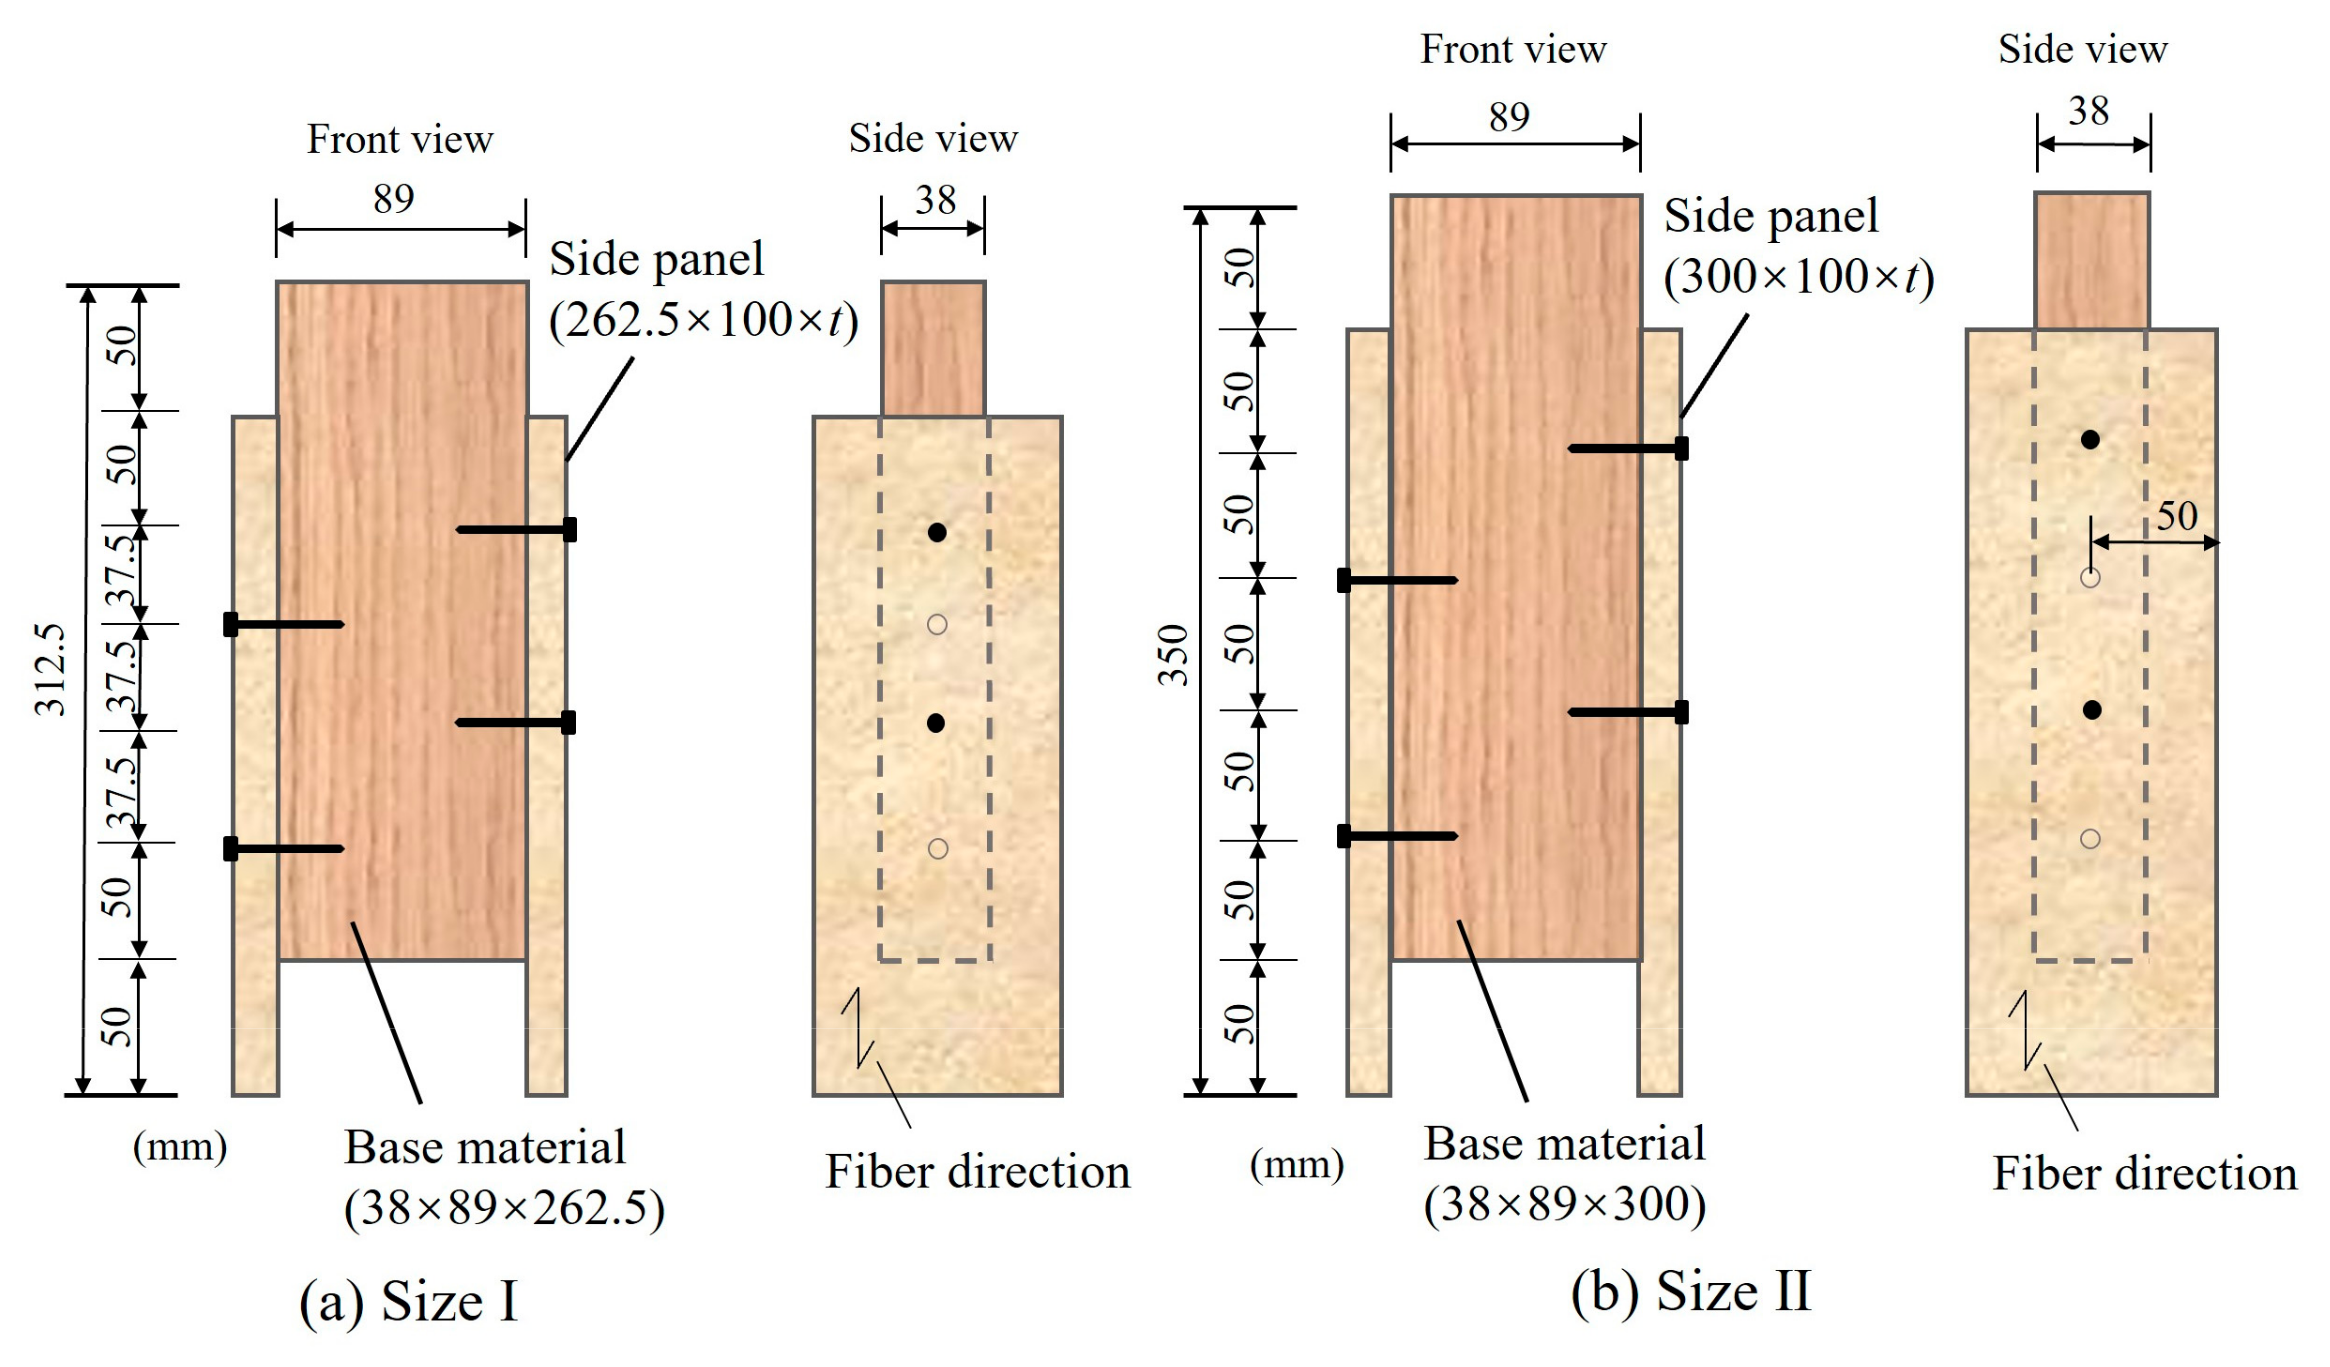
Figure 1. Schematic diagram of the panel-sheathing nail-connected specimens.
Buildings 15 04158 g001
Figure 2. The specimen numbering scheme.
Buildings 15 04158 g002
Figure 3. Setup for the test experiment.
Buildings 15 04158 g003
Figure 4. Typical load–displacement curves derived from the push-out tests of the panel-sheathing nail-connected specimens.
Buildings 15 04158 g004
Figure 5. Method for determining the panel-sheathing nail connection node performance. (Reprinted with permission from Ref. [26]).
Buildings 15 04158 g005
Figure 6. Failure mode of panel-sheathing nail-connected specimens.
Buildings 15 04158 g006
Figure 7. Development of ML models.
Buildings 15 04158 g007
Figure 8. Schematic diagram of the ML model architecture.
Buildings 15 04158 g008
Figure 9. The ultimate load of nail-connected specimens.
Buildings 15 04158 g009
Figure 10. The initial shear stiffness of the nail-connected specimens.
Buildings 15 04158 g010
Figure 11. The ultimate displacement of the nail-connected specimen.
Buildings 15 04158 g011
Figure 12. SHAP diagrams for the predicting process of the output parameters.
Buildings 15 04158 g012
Figure 13. Comparison of experimental results and calculated theoretical values.
Buildings 15 04158 g013
Table 1. A summary of the optimal hyperparameter setting for the six ML models.
ML ModelsHyperparameterOptimized Hyperparameter Value
PuKsδu
ANNhidden_layer_sizes(128, 64)(128, 64)(64, 32)
learning_rate_init0.010.010.01
alpha0.10.10.1
activationrelurelutanh
SVRkernelrbfrbfpoly
C10010050
epsilon0.10.010.1
RFn_estimators500800800
max_depth202020
min_samples_split222
min_samples_leaf121
XGBoostlearning_rate0.150.010.01
max_depth556
n_estimators500500500
subsample0.81.01.0
KNNweightdistanceuniformuniform
n_neighbors584
CatBoostdepth8106
learning_rate0.10.050.1
l2_leaf_reg353
Table 2. Performance indicators of the ultimate load predictions.
ModelR2MAERMSEMAPE (%)
ANN0.96860.07080.09504.05
SVR0.99500.01600.03700.89
RF0.88870.11810.16376.20
XGBoost0.90710.08990.16404.65
KNN0.92160.10490.14285.61
CatBoost0.95230.08290.11564.53
Table 3. Performance indicators of the initial shear stiffness predictions.
ModelR2MAERMSEMAPE (%)
ANN0.94870.03730.05295.11
SVR0.99760.00920.01251.27
RF0.89200.05510.07787.45
XGBoost0.98490.01210.03261.86
KNN0.85150.06750.08549.33
CatBoost0.96930.02690.04643.73
Table 4. Performance indicators of the ultimate load displacement predictions.
ModelR2MAERMSEMAPE (%)
ANN0.99560.12480.35770.41
SVR0.99940.02940.07090.11
RF0.98390.45470.64381.99
XGBoost0.98910.19100.55510.94
KNN0.97500.49971.11892.15
CatBoost0.99480.21640.39990.98
Table 5. The shear capacities predicted using different design specifications.
Specimen NumberExperimental Value (Kn)Predicted Value (kN)Error
(%)
GB/T 50005-2017
(kN)
Error
(%)
Eurocode 5
(kN)
Error
(%)
O9PL5A1.3641.3600.00290.578−57.611.5076 10.53
O9VL5A1.2821.2830.10140.578−54.901.5076 17.60
O9PL5B1.3801.3750.38410.578−58.101.6364 18.58
O9PL6A1.4261.4280.11920.756−47.012.0750 45.51
O12PL5A1.3811.3991.29620.653−52.721.4761 6.88
O12PV5A1.5431.5641.38430.653−57.681.4761 −4.34
O12PL5B1.5841.5890.34470.653−58.781.4761 −6.81
O12PL6A1.6521.6600.46550.814−50.722.0395 23.45
O12PL7A1.8521.8630.59290.919−50.402.3206 25.30
P12PL5A1.5571.5520.31410.653−58.061.4761 −5.20
P12VL5A1.9361.9360.00460.653−66.271.4761 −23.76
P12PL5B2.0052.0090.19700.653−67.431.4761 −26.38
P12PL6A2.3662.3610.20750.814−65.592.0395 −13.80
P12PL7A3.8643.8660.04110.919−76.232.2531 −41.69
O18PL6A1.9281.9792.64260.999−48.171.9628 1.80
O18VL6A2.0452.0420.14620.999−51.141.9628 −4.02
O18PL6B2.0992.0980.05960.999−52.401.9628 −6.49
O18PL7A2.5052.4990.23951.091−56.432.4204 −3.38
Note: Error (%) = (Calculated value − Experimental value)/Experimental value × 100%.
Table 6. Performance metrics of the empirical formulae in predicting shear capacities.
ModelR2MAERMSEMAPE (%)
ML model0.99940.00850.01440.4908
GB/T 50005-2017−3.17681.10041.213557.2024
Eurocode 50.34030.31920.482315.8627
Disclaimer/Publisher’s Note: The statements, opinions and data contained in all publications are solely those of the individual author(s) and contributor(s) and not of MDPI and/or the editor(s). MDPI and/or the editor(s) disclaim responsibility for any injury to people or property resulting from any ideas, methods, instructions or products referred to in the content.