Abstract
Although computer vision methods have advanced in construction helmet detection in recent years, their performance heavily depends on large-scale, class-balanced, and diverse annotated datasets. To address the high cost and labor-intensive nature of traditional data collection and annotation, this study introduces a novel helmet detection dataset named AIGC-HWD (Artificial Intelligence-Generated Content–Helmet Wearing Detection), automatically generated using generative AI tools. The dataset contains five categories of labels, supporting both helmet-wearing detection and color classification tasks. We evaluate the standalone performance of AIGC-HWD, as well as its augmentation effect when combined with the real-world dataset GDUT-HWD, using multiple algorithms, including YOLO v8, YOLO v10, YOLO 11, YOLO v11-MobileNet v4, YOLO v13, Faster R-CNN, and RT-DETR. Experimental results show that models trained solely on AIGC-generated images can achieve mAP@50 scores exceeding 0.7 and 0.8 on real-world images in two separate tests, demonstrating a certain level of generalization. When used for data augmentation alongside real-world images, the performance improves to varying degrees—by approximately 1% on the YOLO series, and by over 10% on the two-stage algorithm Faster R-CNN. These findings validate the potential of generative AI images for safety monitoring in construction scenarios and provide new insights into the integration of synthetic and real-world data.
1. Introduction
Construction sites often involve multiple types of work being carried out simultaneously, leading to complex management and elevated safety risks. According to data released by the Ministry of Housing and Urban–Rural Development of the People’s Republic of China (MOHURD), there have been approximately 600 construction-related accidents reported annually in mainland China in recent years, resulting in a significant number of fatalities and injuries [1]. Among the various types of construction accidents, falling from a height and being struck by objects are the two most frequent categories [1]. Additionally, a study covering the period from 2003 to 2010 found that traumatic brain injuries (TBI) accounted for 25% of all fatalities in the U.S. construction industry [2].
The National Institute for Occupational Safety and Health (NIOSH) categorizes the Hierarchy of Control (HOC) into five levels: Personal Protective Equipment (PPE), Administrative Controls (AC), Engineering Controls (EC), Substitution, and Elimination [3]. Although PPE is the least effective measure within the HOC framework, it remains the most fundamental line of defense in protecting construction workers. As a result, many countries have implemented mandatory regulations and policies regarding its use [4,5]. To ensure that construction personnel use PPE correctly, external supervision is also required. Given the limitations of manual oversight and the need to control supervisory costs, intelligent technologies have been increasingly adopted in recent years.
Among various intelligent technologies, computer vision based on deep learning demonstrates strong nonlinear representation capabilities, enabling it to learn deep features from images. Techniques such as object detection and semantic segmentation are well-suited for handling complex visual tasks [6]. In recent years, a considerable number of deep learning studies in the construction domain have focused on detecting safety helmet usage, with most of them achieving high levels of accuracy [1,7,8,9,10,11,12,13,14,15,16,17]. However, some of these studies rely on self-constructed datasets [1,7,8,11,12,15], while others develop or utilize different publicly available datasets [9,10,13,16,17,18,19,20]. This variation makes it difficult to establish a unified benchmark for comparing the performance of different algorithms. In general, developing computer vision-based helmet detection models requires high-quality image datasets, and class balance within the dataset is also a critical factor [21].
On construction sites, different helmet colors typically correspond to different categories of construction individuals. In mainland China, for example, red helmets are usually worn by safety supervisors and visitors, white helmets indicate project owners or senior management, yellow helmets are associated with general construction workers, and blue helmets are commonly worn by technical personnel. To develop a vision-based model that can not only detect helmet usage but also classify construction individuals, the dataset must include various helmet colors as well as cases where no helmet is worn. However, collecting images of helmets in different colors requires extensive online searching, and it is difficult to control the quantity of each color category within the dataset.
Considering that enhancing the sample diversity of helmet datasets can improve the accuracy of multi-class object detection tasks, we explored the use of generative AI technologies. By leveraging generative AI, images can be created based on specific instructions, allowing precise control over the number of samples for each helmet color category. This facilitates the construction of datasets with a more balanced label distribution. In recent years, the use of synthetically generated images to support computer vision model development in the construction field has also become increasingly common [22,23].
To this end, we propose a new helmet object detection dataset in which all images are generated using generative AI. This dataset, named AIGC-HWD (Artificial Intelligence-Generated Content—Helmet Wearing Detection), includes five categories: red helmet (red), white helmet (white), blue helmet (blue), yellow helmet (yellow), and no helmet (none). Models trained on this dataset can simultaneously detect helmet usage and classify individuals. To evaluate the practical effectiveness of models trained on this dataset and to assess whether generative AI images can effectively supplement real-world images through data augmentation, this paper conducts tests using multiple object detection algorithms.
The rest of this paper is organized as follows: Section 2 provides a literature review summarizing recent advances in helmet detection using computer vision. Section 3 presents the research methodology, including a detailed description of the AIGC-HWD dataset. In Section 4, we evaluate the AIGC-HWD dataset using various object detection algorithms and analyze the experimental results. Section 5 and Section 6 present the discussion and conclusions, respectively.
2. Literature Review
2.1. Research Progress on Helmet Detection Using Object Detection
Object detection algorithms can automatically extract multi-scale features using deep backbone networks, and subsequently output the location and class of detected objects [24]. These backbone networks are typically based on Convolutional Neural Networks (CNNs), which were first proposed by LeCun in 1990 [25]. The initial application of CNNs to object detection was realized through R-CNN [26], followed by Fast R-CNN [27] and Faster R-CNN [28], which improved both detection speed and accuracy. In recent years, single-stage algorithms have made notable progress in detection performance. Lightweight models such as YOLO enable efficient object detection on mobile devices without relying on cloud servers [29,30,31]. Against this backdrop, object detection algorithms have been widely applied in various fields, including traffic monitoring [32] and structural health monitoring [33,34].
Among the various types of PPE, safety helmets can protect the heads of individual construction personnel and can prevent object-striking accidents. In images or videos, helmets typically appear in specific sizes or colors, and the distinction between wearing and not wearing one is relatively clear, making them well-suited for object detection algorithms. Fang et al. [7] applied the Faster R-CNN algorithm to detect cases of not wearing a helmet, using a single class labeled as “No Hat”. Their model achieved a detection accuracy of over 90%. Li et al. [8] were the first to apply MobileNet-SSD to helmet detection, using a dataset with only one class, “Helmet”, achieving a precision of 95% and a recall of 77%. Wu et al. [9] introduced Reverse Progressive Attention (RPA) into the SSD algorithm to enhance the detection of small objects, resulting in a mean Average Precision (mAP) of 83.89%.
Nath et al. [10] proposed three PPE detection strategies, among which the single-stage end-to-end detection method demonstrated the best performance, with YOLO v3 achieving a mAP of 72.3%. Wang et al. [11] improved MobileNet with a Top-Down Module, enabling detection of both helmet-wearing and non-wearing cases, achieving a mAP of 88.4%. Chen et al. [12] also used YOLO v3 to build a PPE detection model capable of identifying hard hats, masks, safety glasses, and safety belts, achieving a precision of 94% and a recall of 83%. Additionally, their study incorporated pose estimation to further determine whether the PPE was correctly worn. Li et al. [1] conducted a similar study, using YOLO v5 to detect helmets and safety harness hooks, and further combined OpenPose and 1D-CNN to assess whether these types of PPE were properly used. Liu et al. [13] proposed an object detection method called CA-CentripetalNet, which was built upon the dataset introduced by Wu et al. [9], and achieves a mAP of 88.63%. Wei et al. [14] improved YOLO v5s in terms of backbone structure, feature fusion, loss function, and post-processing, increasing the mAP from 81.9% to 82.8%.
In recent years, the YOLO v8 algorithm has demonstrated strong stability across various applications. Jiao et al. [15] used YOLO v8 to detect helmet usage in drone-captured images of construction workers, achieving a mAP of 97.5%. Zhang et al. [16] introduced four improvements to YOLO v8, enhancing its ability to detect small objects and improving accuracy, with mAP values increasing across different helmet datasets. Zhang et al. [17] proposed a helmet-wearing detection method based on YOLO v9, YOLO-Pose, and StrongSORT. By matching head regions, the model verifies helmet usage and achieved a mAP of 96.7% in the object detection component. Lee et al. [20] observed that in practical scenarios, ordinary hats are often confused with helmets and that helmets are typically small objects, making detection challenging. To address this, they proposed a two-stage YOLO-EfficientNet detection approach, which achieved a mAP of 91.4%.
To more clearly synthesize previous research findings, Table 1 summarizes representative studies in helmet detection, highlighting datasets, algorithms, key contributions, and limitations. As shown, previous work achieved high accuracy through continuous improvement of algorithms like Faster R-CNN and YOLO. These approaches heavily rely on large-scale, well-annotated real-world datasets, the construction of which is time-consuming. Section 2.2 provides a detailed summary of the helmet dataset.

Table 1.
Summary of representative studies on helmet detection.
2.2. Object Detection Datasets for Helmet
For object detection models, the quantity and quality of the training dataset are critical factors that determine model performance [35,36]. Existing datasets are generally categorized into two types. The first type consists of general-purpose datasets, which contain commonly seen objects from everyday life. Representative examples include the PASCAL VOC dataset [37] and ImageNet [38]. The second type comprises domain-specific datasets, which are developed for particular application areas. For instance, in the field of civil engineering, Tongji University developed a dataset called UDTIRI [39], specifically designed for detecting pavement potholes. Duan et al. [40] introduced SODA (Site Object Detection Dataset), a large-scale dataset related to construction sites, which includes multiple categories such as construction workers, building materials, and construction machinery.
In the context of helmet detection, several publicly available datasets have been developed and adopted by researchers. Nath et al. [10] proposed three different PPE detection strategies and simultaneously introduced a dataset named Pictor v3, which contains approximately 1500 images categorized based on the PPE-wearing status of construction workers. Chen et al. [12] conducted their study on the Pictor v3 dataset, but further expanded the number of images used in the experiments. The Safety Helmet Wearing Dataset (SHWD) [18] is another publicly available dataset focused on helmet detection. It contains 7581 images labeled with two categories—person and hat—with annotations limited to the head region. SHWD has been used in studies by Zhang et al. [16] and Zhang et al. [17] for evaluating improved YOLO algorithms.
Otgonbold et al. [19] proposed the SHEL5K dataset, an extended version of the open-source SHD dataset. SHEL5K includes 5000 images and provides six annotation classes: helmet, head with helmet, person with helmet, head, person without helmet, and face. The dataset used by Lee et al. [20] is a further extension of SHEL5K, and defines three categories: hat, helmet, and head.
In general, different helmet colors on construction sites correspond to different categories of individuals. Therefore, recognizing helmet color in addition to detecting helmet usage can support personnel classification. Based on this need, Wu et al. [9] established a dataset named GDUT-HWD, which consists of 3174 images collected under various site conditions, covering a range of scenes, lighting environments, and occlusions. The dataset includes annotations only for head regions and defines five classes: Red, White, Yellow, Blue, and None, where “None” represents the absence of a helmet. The GDUT-HWD dataset has been used by Liu et al. [13] and Zhang et al. [16] to validate their proposed object detection algorithms.
In addition to the publicly available datasets mentioned above, many researchers prefer to construct their own datasets to validate proposed object detection algorithms. For example, the dataset used by Li et al. [8] contains 3261 images, some of which were extracted from construction site surveillance footage, while others were collected from the internet. Wang et al. [11] utilized a dataset comprising 7064 images, divided into two categories: hard hat and no hardhat. Jiao et al. [15] employed a self-constructed dataset consisting primarily of drone-captured images, with a total of 1584 images categorized into two classes: person and helmet. Unlike the SHWD, the “person” class in this dataset refers to full-body annotations. In addition, several datasets focus on multi-class PPE detection, and models trained on them are also applicable to helmet detection tasks. Table 2 summarizes the datasets mentioned in this section.
Table 2.
Summary of representative studies on helmet detection dataset.
As described in Section 2.1 and shown in Table 2, most existing studies focus on improving detection algorithms or constructing new real-world datasets. Different studies tend to adopt different datasets, and the variation in annotation standards leads to inconsistencies in detection strategies. To enhance detection performance, using synthetic or virtual images as auxiliary data is also a viable approach. However, no existing research has attempted to use generative artificial intelligence to produce construction site images for the purposes of balancing class distribution, reducing the time cost of image collection, and improving real-world helmet detection performance. This gap motivated us to develop the AIGC-HWD dataset, which serves as the foundation for the subsequent research. Section 2.3 provides a detailed explanation of the motivation and the formation of the research approach presented in this paper.
2.3. Why This Study Was Conducted
Overall, helmet detection models based on object detection have undergone diverse developments in recent years. In terms of datasets, we observe that different researchers tend to adopt different datasets when establishing visual models, making it difficult to evaluate these models using consistent metrics. Furthermore, we find that the models trained on these datasets support various functionalities. For example, in the studies by Jiao et al. [15] and Zhang et al. [17], the datasets used contain only two categories—“person” and “hat”—yet still achieve high accuracy, with mAP values reaching 97.5% and 96.7%, respectively. Datasets that focus solely on helmet-wearing status, such as these, already offer sufficient diversity and image volume to support the training of high-accuracy object detection models.
In contrast, the GDUT-HWD dataset developed by Wu et al. [9] enables not only helmet-wearing detection but also personnel classification on construction sites, which is considered more beneficial for construction management. However, this dataset only annotates head regions, resulting in relatively small object sizes, and includes as many as five categories. These factors make it more challenging for models trained on GDUT-HWD to achieve the same level of accuracy reported in [15,17].
To improve detection performance, in addition to enhancing object detection algorithms at the code level, expanding the dataset size is also a viable strategy. For datasets similar to SHWD, image acquisition is relatively straightforward. However, expanding the GDUT-HWD dataset to improve both helmet detection accuracy and personnel classification accuracy presents greater challenges. This is because GDUT-HWD not only addresses helmet-wearing status but also includes color information. Moreover, the balance of samples across different helmet colors significantly affects model performance [21].
To maintain this balance, acquiring images through internet searches or extracting frames from construction site videos can be time-consuming. Moreover, images obtained from the internet often suffer from issues such as watermarks or low image quality. Therefore, when expanding the dataset, it is necessary to ensure both an increase in the total number of images and a reasonable balance among categories.
Currently, the use of synthetically generated images as datasets has become a common practice. For example, Liu et al. [41] used a virtual platform to generate simulated actions of substation personnel, which were combined with real-world data to train a safety risk recognition model. Hieu et al. [42] employed Unity to create virtual images of excavators for training a 3D pose estimation model. In addition to virtual platforms, generative artificial intelligence can achieve similar results. Generative AI has already brought transformative changes across various industries [43,44,45,46]. With AIGC tools, users can generate desired content by inputting prompts.
Initially, AIGC tools were primarily used as chatbots, but they have since evolved to support multimodal processing. Tools such as DALL·E 3 and Midjourney v6 can generate images based on user descriptions, often with visual quality comparable to real photographs. Building on this capability, we developed the idea of using AIGC tools to construct a helmet dataset and conducted a data augmentation experiment inspired by the GDUT-HWD dataset. This paper presents our exploratory work in this direction.
The significance and necessity of this study are reflected in the following aspects:
(1) To explore a new method for dataset generation by using AIGC-generated images for data augmentation. This study aims to leverage prompt-based control to better manage the distribution of helmet colors in the dataset.
(2) To investigate whether models trained on AIGC-generated images can be applied to real-world detection scenarios. This question has not been previously explored, and this work attempts to address it, providing a reference value for future research.
(3) To examine whether integrating AIGC-generated images with existing real-world datasets as a form of data augmentation can improve model performance. This topic has also received limited attention, representing another important motivation for this study.
3. Methodology
3.1. Design of Model Training and Testing Strategies
Figure 1 illustrates the technical framework of this study. The objective is to generate dataset images using AIGC tools. The first step involves selecting a suitable generative AI tool with multimodal capabilities. During this process, we tested three different generative AI tools. Subsequently, we selected Midjourney as the final choice. Following the GDUT-HWD architecture, we generated dataset images using text prompts and named the resulting dataset AIGC-HWD. Similar to GDUT-HWD, it comprises five categories: red, blue, yellow, white, and none.
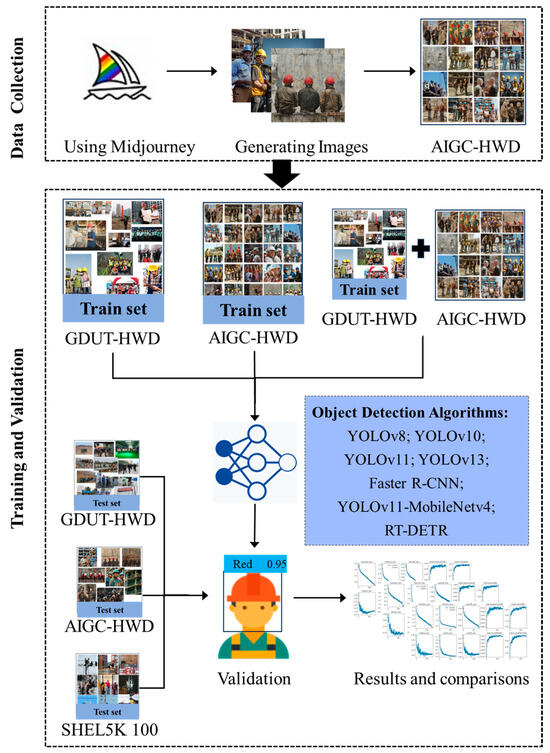
Figure 1.
Research Framework.
Subsequently, to validate the performance of models trained on the AIGC-HWD dataset, we conducted the following tests using the YOLO v8, YOLO v10, YOLO v11, FasterR-CNN, YOLO v11-MobileNet v4, YOLO v13, and RT-DETR algorithms:
(1) We partitioned both AIGC-HWD and GDUT-HWD into training and validation sets. An object detection model was then trained using the AIGC-HWD training set and evaluated on both the AIGC-HWD validation set and the GDUT-HWD validation set. Since all images in the GDUT-HWD dataset originate from the real world, this approach offers some insight into how well a model trained on synthetic data performs in real-world scenarios. However, the AIGC-HWD training set contains significantly fewer samples than that of GDUT-HWD. To enable a fairer comparison, we additionally created a smaller validation set from GDUT-HWD, referred to as GDUT-HWD-validation-2.
(2) To test the generalization of object detection models trained on real-world images when applied to generative AI images, we trained an object detection model using the GDUT-HWD training set and evaluated it on the AIGC-HWD validation set. These models were then compared against object detection models trained using the AIGC-HWD training dataset.
(3) To further validate generalization capabilities, we selected 100 images from the SHEL5K dataset as a validation set. Models were trained using images from both GDUT-HWD and AIGC-HWD, followed by testing and comparison. Considering the larger sample size in GDUT-HWD, we additionally created a training subset with a similar number of images to AIGC-HWD-training, named GDUT-HWD-training-2.
(4) To validate the effectiveness of generative AI-generated images as a data augmentation method, we first trained object detection models using the GDUT-HWD training set and evaluated them on the GDUT-HWD validation set. Subsequently, we augmented the GDUT-HWD training set by incorporating all AIGC-HWD images and compared the results with those obtained from the original training set.
(5) To further validate generalization capabilities, SHEL5K was employed as the test set. For comparison, the GDUT training set was augmented with all AIGC-HWD images. Additionally, models were trained on GDUT-HWD-training-2 augmented with all AIGC-HWD images to minimize the impact of image quantity differences.
Figure 2 illustrates the training strategy adopted in this study.
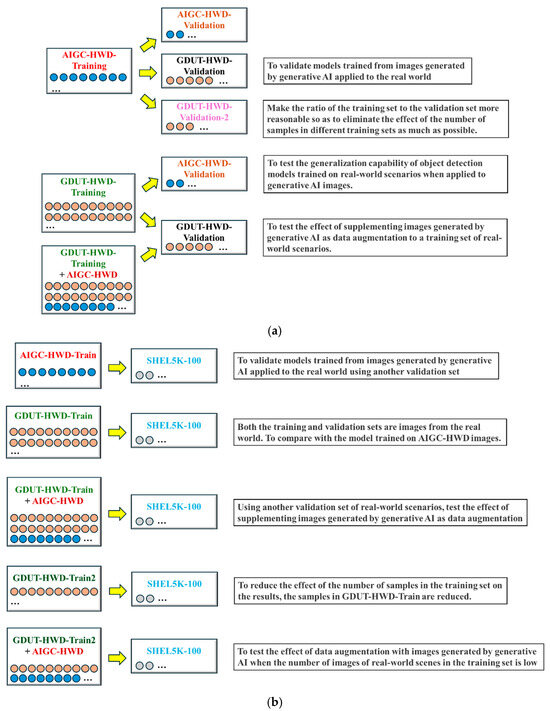
Figure 2.
Training Strategies: (a) GDUT-HWD as validation set; (b) SHEL5K-100 as validation set.
To provide a more intuitive understanding of the overall research process illustrated in Figure 1 and Figure 2, Algorithm 1 presents an end-to-end pseudocode description covering the entire pipeline, including dataset generation, model training, and performance evaluation.
| Algorithm 1. End-to-End Pipeline for the AIGC-HWD Study (corresponding to Figure 1 and Figure 2) |
| Input: G ← Midjourney generator D_real ← {GDUT-HWD, SHEL5K-100} Models ← {YOLO v8, YOLO v10, YOLO 11, YOLO 11-MobileNet v4, YOLO v13, Faster R-CNN, RT-DETR} Output: Performance metrics (mAP@50, mAP@50:95, F1-score, AP@50 per class) --------------------------------------------------------------- # 1. Build synthetic dataset for each helmet_color in {red, yellow, blue, white, none}: images ← G.generate(prompt = helmet_color + construction_scene) images ← QualityCheck(images) labels ← ManualAnnotate(images) AIGC_HWD ← Split(images, labels, train=0.8, val=0.2) # 2. Prepare real datasets (GDUT_train, GDUT_val) ← Load(GDUT-HWD) SHEL100 ← Load(SHEL5K-100) (GDUT_train2, GDUT_val2) ← Subsample(GDUT_train, GDUT_val) # 3. Train and evaluate for each model in Models: θ_A ← Train(model, AIGC_HWD.train) Eval(model, θ_A, {AIGC_HWD.val, GDUT_val, GDUT_val2}) θ_B ← Train(model, GDUT_train) Eval(model, θ_B, {GDUT_val, AIGC_HWD_val. SHEL100}) θ_C ← Train(model, GDUT_train ∪ AIGC_HWD.train) Eval(model, θ_C, {GDUT_val, SHEL100}) θ_D ← Train(model, GDUT_train2) Eval(model, θ_D, {SHEL100}) θ_E ← Train(model, GDUT_train2 ∪ AIGC_HWD.train) Eval(model, θ_E, {SHEL100}) # 4. Compute metrics For all experiments: Compute mAP@50, mAP@50:95, AP@50_per_class Store results for comparison --------------------------------------------------------------- Return summary of improvements using AIGC data |
3.2. AIGC-HWD Dataset
3.2.1. Datasets Overview and Comparison
This study involves three core datasets: (1) the self-constructed AIGC-HWD dataset, in which all images are generated using generative AI tools; (2) the real-world GDUT-HWD dataset, which includes five label categories—yellow, blue, white, red, and none—allowing not only helmet-wearing detection but also identity distinction based on helmet color. The AIGC-HWD dataset developed in this study follows the same labeling strategy as GDUT-HWD and also includes five categories: (3) SHEL5K-100, a subset randomly selected from the SHEL5K dataset, used for third-party cross-validation; and (4) GDUT-HWD-training-2 and GDUT-HWD-validation-2, which are randomly sampled subsets of GDUT-HWD-training and GDUT-HWD-validation, respectively, designed to control for the variable of sample size. The core functions, sources, scales, and labeling schemes of each dataset are summarized in Table 3.
Table 3.
Datasets involved in this study.
3.2.2. Image Generation Method
Currently, there are many AIGC tools capable of generating images based on user prompts, such as Midjourney, Doubao (Seedream 2.0), and ChatGPT 4o. Among these, Midjourney has been updated to version v6, enabling it to produce images in various styles and generate photorealistic, photo-like visuals. Doubao primarily relies on Seedream 2.0 for its text-to-image functionality, utilizing technologies like text and image encoding and Transformers. ChatGPT 4o, developed by OpenAI, is one of the most widely used generative AI tools today. It achieves text-to-image capabilities through DALL·E, which employs multiple technologies including Transformers and Generative Adversarial Networks (GANs).
Using the same prompt for all three models (Building construction site; three workers wearing blue helmets working on supporting formwork; Clear colors of helmets; More detailed; more realistic; realistic details; photo; clear) to generate images, with results shown in Figure 3. As shown in Figure 3, both Midjourney and Doubao demonstrate high consistency in controlling the number of workers within the generated images. In terms of image resolution, Midjourney supports outputting higher-resolution images with visual effects that better align with real-world physical laws. This feature enhances the clarity and fidelity of small objects, which is crucial for object detection. Regarding scene diversity, Midjourney also shows clear advantages. It can generate a wider range of background variations and allows reproducible outputs through fixed seed values, which facilitates dataset expansion with diverse image content. In contrast, images generated by Doubao typically place helmets and human subjects prominently in the foreground, with relatively large helmet sizes. This hinders the model’s ability to effectively learn small object detection. Moreover, the backgrounds in Doubao’s images tend to be less varied. The DALL·E model from ChatGPT underperforms compared to the other two generative AI tools in aspects such as texture quality, semantic coherence, and scene diversity. Considering three key factors—prompt controllability and stability, resolution and realism, and scene diversity and reproducibility—Midjourney v6 was selected as the final image generation tool for this study.
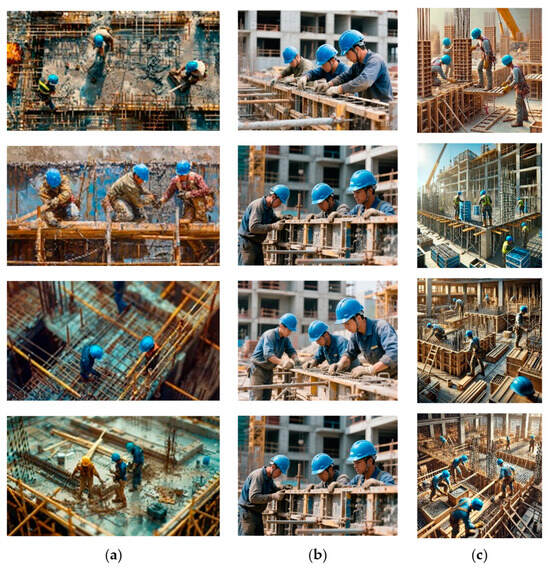
Figure 3.
Images generated by different AIGC tools: (a) Midjourney; (b) Doubao; (c) Dall-E.
Midjourney’s core principle is based on deep learning and GAN, with its basic network architecture shown in Figure 4. As depicted, the GAN comprises a generator and a discriminator. The generator receives random noise and processes it through the network to produce “fake data.” The discriminator receives both the generated “fake data” and real data, determining whether the input is real or fake. This adversarial game unfolds as the generator strives to “pass off fakes as real,” while the discriminator focuses on “detecting fakes.” Through iteration, the generated data progressively approximates the true distribution, making the output increasingly realistic.
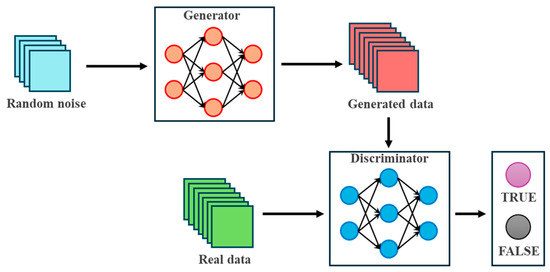
Figure 4.
Basic Network Structure of GAN.
The steps for generating images using Midjourney software are as follows: (1) Download Midjourney software and create your own server; (2) Add the Midjourney bot to the server; (3) In the bot’s dialog box, use “/imagine” followed by entering English keywords in the prompt command line to obtain the desired image. Table 4 presents examples of images generated using selected commands. To ensure the model’s robustness to target scale variations, images of different dimensions were generated during dataset construction, including sizes such as 1024 × 1024 and 1456 × 816. A total of 1510 images were retained after manual selection.
Table 4.
Examples of images generated by some prompts.
3.2.3. Annotation and Statistical Details
After generating images using Midjourney, to ensure label accuracy, each image was manually annotated with LabelImg to ensure label accuracy, and the annotations were saved in VOC format. The annotation process is presented in Figure 5. Additionally, 100 randomly selected images from SHEL5K were annotated in the same VOC format.
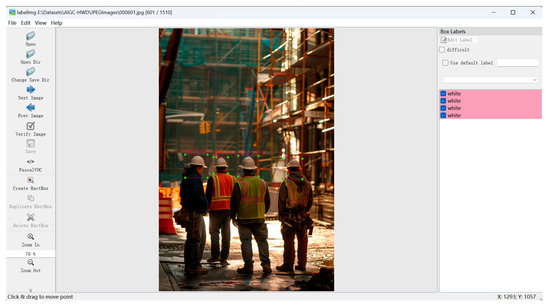
Figure 5.
Annotating images using LabelImg.
For the AIGC-HWD images generated by Midjourney, we conducted a supplementary analysis of the relevant data. The label quantities and distributions for both the AIGC-HWD and GDUT-HWD datasets are illustrated in Figure 6. It can be observed that datasets composed of generative AI images tend to exhibit a more balanced distribution across sample categories.
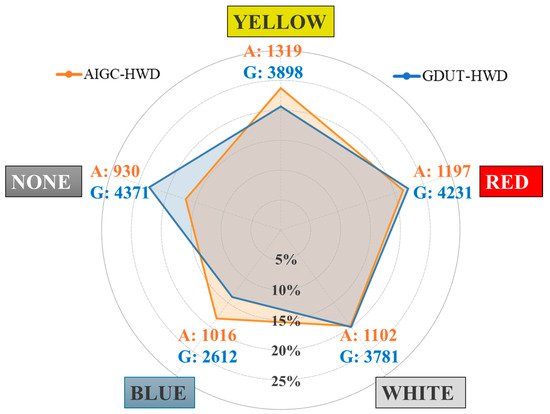
Figure 6.
Distribution of all class instances.
It is important to note that although the AIGC-HWD dataset does not yet match large-scale real-world benchmark datasets such as SHWD or SHEL5K in terms of image quantity, its sample size is comparable to that of Pictor v3 and the dataset used in [15]. Given the inherent differences between generative AI images and real-world images at this stage, we currently consider AIGC-HWD primarily as a data augmentation resource. We are concerned that when mixed with real-world data, an excessive proportion of generative images may lead visual algorithms to overfit to the features specific to synthetic data, potentially weakening their generalization to real-world scenarios. It should also be emphasized that the development of AIGC-HWD in this study serves as a proof of concept to demonstrate how a dataset suitable for construction scenarios can be created using generative AI. Replacing large-scale real-world datasets is not the current goal of this work. However, with ongoing advancements in generative AI technology, future synthetic images may more closely resemble real-world scenes. Therefore, we plan to expand the dataset progressively as the technology evolves and to incorporate automated annotation methods to further enhance the scalability and practicality of the dataset.
The images from the AIGC-HWD and GDUT-HWD datasets were randomly split into training and validation sets in an 8:2 ratio. The AIGC-HWD training set comprises 1208 images, while the validation set contains 302 images. The GDUT-HWD training set includes 2539 images, and the validation set contains 635 images. The number of instances in each training and validation set is detailed in Table 5.
Table 5.
Dataset statistics.
As mentioned above, when testing object detection models based on generative AI images using real-world images from GDUT-HWD, a controlled variable approach was adopted. We extracted a subset of images from GDUT-HWD-validation to establish GDUT-HWD-validation-2. In this new validation set, the number of images is 300 and the total number of labels is 1326, both of which are relatively close to the validation set of AIGC-HWD.
Similarly, when evaluating object detection models based on AIGC-HWD and GDUT-HWD using SHEL5K-100, a controlled variable approach was adopted. This involved extracting a subset of images from the GDUT-HWD training dataset to form GDUT-HWD-training-2. This new training set comprises 994 images and 9512 instances.
3.3. Selection and Description of Object Detection Algorithms
Currently, numerous object detection algorithms based on convolutional neural networks have been developed in the field of deep learning. Depending on their detection principles, these algorithms can be categorized into single-stage and two-stage object detection algorithms.
Single-stage object detection algorithms apply dense sampling of varying sizes at different positions within an image and utilize CNNs to extract features for direct classification and regression in a single step. Common examples include the YOLO series and SSD. Two-stage object detection algorithms first generate a set of sparse candidate boxes for object localization, followed by classification and regression on these candidate boxes. Representative two-stage object detection algorithms include R-CNN and Faster R-CNN.
This paper aims to evaluate the performance of AIGC-HWD across various object detection algorithms. For single-stage object detection algorithms, we selected YOLO v8, YOLO 11, YOLO 11-MobileNet v4, YOLO v10, YOLO v13, and RT-DETR. Among these, YOLO v8 demonstrated exceptional stability across diverse object detection tasks and outperformed newer iterations in multiple scenarios. YOLO 11, developed by Ultralytics like YOLO v8, features an optimized network architecture and convolutional modules. YOLO v10 and YOLO v13 are improved versions proposed by other institutions, released in 2024 and 2025, respectively. YOLO v10 adopts an NMS-free design, while YOLO v13 integrates depthwise separable convolutions into its backbone. Both versions aim to achieve lightweight architecture designs. Both algorithms can be categorized into five models based on parameter count and floating-point operations per second (FLOPs). To test from different perspectives, this paper selected the lowest FLOPs variant “n” for YOLO v8, YOLO v10, and YOLO v13, and the highest FLOPs variant “x” for YOLO 11. YOLO 11-MobileNet v4 replaces the backbone network in YOLO 11 from CSPDarkNet to MobileNet v4, further reducing parameters to enhance mobile device compatibility. RT-DETR (Real-Time Detection Transformer) is a novel one-stage algorithm proposed in recent years [47]. Unlike previous CNN-based approaches, RT-DETR is built upon the Transformer architecture and has demonstrated capabilities comparable to YOLO algorithms across multiple domains.
Faster R-CNN is a classic two-stage object detection algorithm selected for this study. Its core architecture consists of a Region Proposal Network (RPN), which significantly improves the accuracy of two-stage detection algorithms. To this day, it remains an important reference model for high-precision detection tasks.
4. Experimental Results and Analysis
4.1. Definition of Experimental Evaluation Metrics
This study employs the widely used Average Precision (AP) and mean Average Precision (mAP) to evaluate the performance of the trained models. AP is calculated by integrating the area under the Precision–Recall curve, with values closer to 1 indicating better model performance. mAP represents the average of the AP values across all category labels. The F1-score is calculated as the harmonic mean of precision and recall, and is used to evaluate the performance of binary or multi-class classification models. Its value ranges from 0 to 1, with higher values indicating better model performance.
To obtain the above metrics, we need to calculate TP (True Positive), TN (True Negative), FP (False Positive), and FN (False Negative). TP indicates a positive sample predicted correctly, TN indicates a negative sample predicted correctly, FP indicates a negative sample predicted incorrectly, and FN indicates a positive sample predicted incorrectly. For each category, precision and recall are calculated as follows:
Precision = TP/(TP + FP)
Recall = TP/(TP + FN)
F1 = 2 × (Precision × Recall)/(Precision + Recall)
4.2. Results and Comparisons
We employed seven object detection algorithms with a learning rate of 0.01 and a batch size of 8, training for 150 epochs. The detection results are shown in Table 3. The table presents mAP@50 and mAP@50:95, along with AP@50 for each category.
Specifically, mAP@50 refers to the mAP calculated by using a single IoU threshold of 0.5, where the AP is computed for each class and then averaged. In contrast, mAP@50:95 represents the mean of mAP values computed at ten different IoU thresholds ranging from 0.5 to 0.95 in increments of 0.05 (i.e., 0.5, 0.55, 0.6, …, 0.95). Therefore, mAP@50 emphasizes whether an object can be detected, while mAP@50:95 reflects how precisely the object can be localized. Both metrics, along with AP@50, can be automatically generated by the algorithm during evaluation on the validation set.
4.2.1. Generalization of AIGC-HWD-Trained Models to Real Scenes (GDUT-HWD as Validation Set)
As shown in Table 6, models trained on AIGC-HWD-training using seven different algorithms achieve exceptionally high accuracy when validated on AIGC-HWD-validation. Even the least effective Faster R-CNN achieves an mAP@50 of 0.976. However, when testing images are switched to GDUT-HWD-validation and GDUT-HWD-validation-2, detection performance declines to varying degrees, with YOLO v13 experiencing the most significant drop. In contrast, YOLO v8 shows a relatively small performance drop, achieving mAP@50 scores of 0.701 and 0.711, mAP@50:95 scores of 0.418 and 0.443, and F1-scores of 0.66 and 0.67 on the GDUT-HWD-validation and GDUT-HWD-validation-2, respectively. This performance drop likely stems from significant differences between AI-generated and real-world images in lighting conditions, textures, and backgrounds. However, as shown in Figure 7, YOLO v8 achieves an mAP@50 exceeding 0.7. This enables the detector to identify helmets of various colors in most scenarios, as long as the environment is not extremely complex. This demonstrates that detectors based on generative AI images exhibit a certain degree of generalization capability in real-world scenarios.
Table 6.
Detection Results. (AT: AIGC-HWD-Training, AV: AIGC-HWD-Va, GV: GDUT-HWD-Validation, GV2: GDUT-HWD-Validation-2, T: Train, V: Validation).
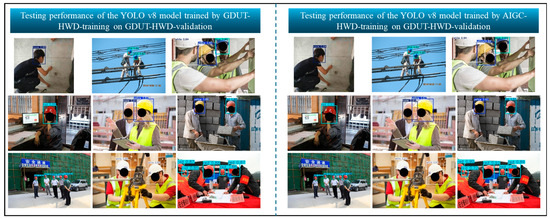
Figure 7.
Some images of GDUT-HWD-validation tested using the YOLO v8 model built using AIGC-HWD-training and GDUT-HWD-training, respectively.
It is notable that the AP@50 for the “none” category shows the most significant decline. Taking YOLO v8 as an example, detectors trained on GDUT-HWD-training and AIGC-HWD-training exhibit AP@50 values of 0.906 and 0.423, respectively, for the “none” category. We believe this phenomenon likely arises because the “none” label is the least among all categories in the AIGC-HWD dataset. Consequently, the algorithm fails to learn this category adequately, leading to limited generalization capabilities. When excluding the “none” category, mAP@50 values are 0.927 and 0.783, respectively, showing a significantly narrowed gap. This further demonstrates that the YOLO v8 detector trained on generative AI images exhibits certain generalization capabilities for helmets when applied to real-world scene images.
4.2.2. Performance via AIGC Data Augmentation (GDUT-HWD as Training Set)
Next, to verify whether generative AI images can enhance the detection performance of real-world helmet scenarios as supplementary data, all AIGC-HWD images were added to the GDUT-HWD-training. Testing was still conducted using GDUT-HWD-validation. The test results are again presented in Table 7. Compared to single-stage algorithms, the two-stage Faster R-CNN algorithm showed the most significant improvement in detection performance, achieving an 8% increase. Meanwhile, the mAP@50 improvements for other algorithms were generally around 0.8%. This improvement likely stems from Faster R-CNN’s reliance on the RPN, which learns diverse features within images and proposes regions potentially containing targets. When training data encompasses more varied scenes and object configurations, the RPN acquires broader feature representations. The overall test results confirm that images generated by generative AI can enhance helmet detection performance in real-world scenarios to varying degrees.
Table 7.
Results on performance via AIGC data augmentation (A: All AIGC-HWD, GT: GDUT-HWD-Training, GV: GDUT-HWD-Validation, T: Train, V: Validation).
As shown in Table 7, the mAP@50:95 of single-stage algorithms also demonstrates varying degrees of improvement. However, the F1-score remains largely unchanged. This is because the AI-generated images in AIGC-HWD v1.0 did not significantly expand the range of hard-to-detect scenarios, resulting in little change in recall. Since the F1-score balances precision and recall, a slight increase in precision with an almost unchanged recall leads to a nearly stable F1-score. Moreover, as illustrated in the confusion matrices of YOLO v8 in Figure 8 the classification accuracy improved by 1.2% after incorporating generative AI images, indicating that synthetic data serves as an effective data augmentation method.
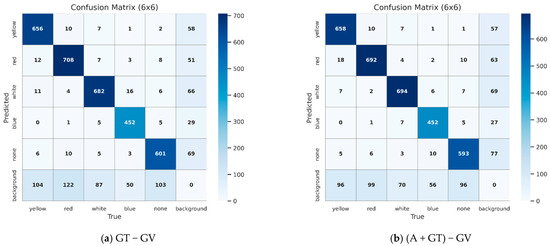
Figure 8.
Confusion matrices generated by the YOLO v8 algorithm when tested on GDUT-HWD-validation.
4.2.3. Generalization of GDUT-HWD-Trained Models to AI-Generated Scenes (AIGC − HWD as Validation Set)
We also tested the generalization capability of object detection models trained on real-world images when applied to generative AI images. As shown in Table 8, models trained on GDUT-HWD demonstrated slightly lower detection performance on generative AI images compared to AIGC-HWD-based models, yet maintained high standards across all evaluation metrics. For instance, the mAP@50 of all algorithms exceeded 0.9. This is because, although images in the AIGC-HWD dataset are AI-generated, their design and generation processes likely reference real-world scene styles. Furthermore, real-world images exhibit greater diversity, covering multiple scenarios and lighting conditions. When the AIGC-HWD test set does not introduce significantly novel features compared to the GDUT training set, the model can effectively generalize and make accurate predictions.
Table 8.
Results on generalization of GDUT-HWD-Trained models to AI-generated scenes (AT: AIGC-HWD-training, AV: AIGC-HWD-validation, GT: GDUT-HWD-Training, T: Train, V: Validation).
4.2.4. Cross-Dataset Validation
To further validate the impact of AIGC-HWD on real-world scenarios, we introduced a new dataset—SHEL5K 100—which consists of 100 randomly selected images from the SHEL5K dataset as a new test set, as shown in Figure 9. The trained model was tested on SHEL5K 100, with the results presented in Table 9.
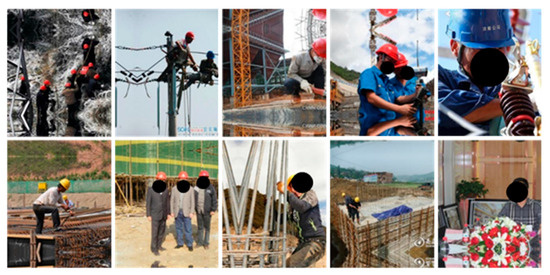
Figure 9.
Some images of SHEL5K-100.
Table 9.
Test results on SHEL5K-100 (A: All AIGC-HWD; AT: AIGC-HWD-Training; GT: GDUT-HWD-Training; GT2: GDUT-HWD-Training-2).
As summarized from the data in Table 9, when GDUT-HWD-training is mixed with AIGC-HWD images, the detector trained with YOLO v8 achieves the highest mAP@50 and mAP@50:95. Both of them improved by 1.0% compared to using only GDUT-HWD-training, and other algorithms also showed varying degrees of improvement. Similar to the conclusion in Section 4.2.2, the two-stage algorithm Faster R-CNN achieved the largest improvement, reaching 4.2%. Additionally, as shown in the confusion matrices in Figure 10, the classification accuracy of YOLO v8 increased from 81.1% to 82.0% after incorporating generative AI data, which is consistent with the improvement observed in Figure 8.
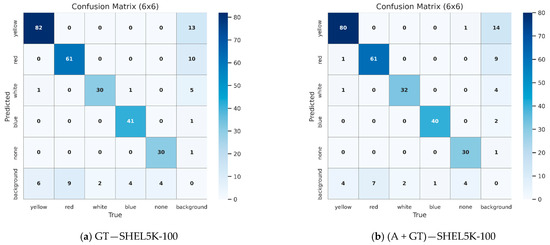
Figure 10.
Confusion matrices generated by the YOLO v8 algorithm when tested on SHEL5K-100.
Subsequently, we tested using GDUT-HWD-training-2, which has a more comparable number of images to AIGC-HWD-training. In this scenario, after mixing generative AI images, the YOLO v8 algorithm showed improvements of 1.3% in mAP@50 and 6.5% in mAP@50:95. The improvement was even greater for the Faster R-CNN algorithm, with an 11.8% increase in mAP@50. However, metrics slightly decreased for YOLO v11-MobileNet v4 and RT-DETR. This may stem from the former being a lightweight network with limited feature extraction capabilities, making it susceptible to noise interference. The latter, being transformer-based, is sensitive to training data distribution; when the styles of training samples are inconsistent, attention mechanisms may shift, impacting detection performance. Therefore, the proportion of generative AI images should be reasonably controlled according to the characteristics of the specific algorithm.
Additionally, consistent with the observations in Table 3, we found that models trained on generative AI images exhibit reduced cross-domain recognition performance for the “none” category. This is primarily due to the relatively small number of “none” samples in the training data. Moreover, features such as clothing, lighting conditions, and head pose variations associated with the “none” category in generative AI images differ to some extent from those in real-world images, further increasing the learning difficulty for the algorithm.
Additionally, it is worth noting that when building a detector using only generative AI images, the mAP@50 can reach 0.813 with the YOLO v8 algorithm, enabling detection of most objects, as shown in Figure 11.
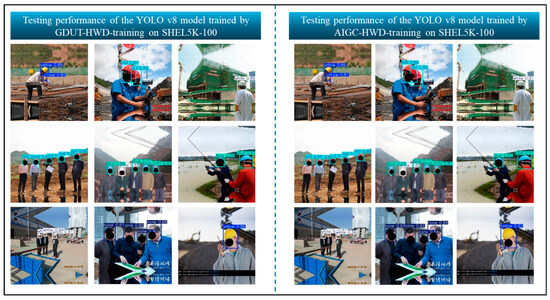
Figure 11.
Some images of SHEL5K were tested using the YOLO v8 model built using AIGC-HWD-training and GDUT-HWD-training, respectively.
4.2.5. Summary
Based on the tests conducted in Section 4.2.1, Section 4.2.2, Section 4.2.3 and Section 4.2.4 the following conclusions can be drawn:
1. Taking the YOLO v8 algorithm as an example, models trained solely with AIGC-HWD achieved mAP scores exceeding 0.7 and 0.8 when tested on real-world scene datasets GDUT-HWD and SHEL5K100, respectively. While not reaching extremely high detection accuracy, these results suffice for most common scenarios.
2. Generative AI images can serve as a data augmentation method in most algorithms. Based on the results obtained in this paper, they can enhance mAP@50 by approximately 1% in single-stage algorithms like the YOLO series. For the two-stage algorithm Faster R-CNN, the improvement is highly significant, reaching over 10%.
3. When tested with real-world images, detectors based on GDUT-HWD demonstrated significantly better detection performance compared to detectors built solely on AIGC-HWD. This indicates that generative AI-generated images still exhibit gaps in details such as lighting and texture compared to real-world images. Therefore, the ratio of real-world images to AI-generated images within the dataset is crucial.
4. Although YOLO v8 is no longer the latest algorithm, it demonstrates high stability across multiple scenarios. Particularly when learning features from generative AI-generated images, the YOLO v8 algorithm achieves the best results. Transformer-based RT-DETR performs better when both training and testing datasets contain a large number of samples.
5. Discussion
5.1. Contributions to the Body of Knowledge
This paper proposes a novel approach for computer vision-based helmet inspection by introducing the AIGC-HWD dataset and conducting considerable validation. The main contributions of this work are as follows:
1. This paper attempts to establish a construction-related object detection dataset using generative AI, which is likely the first of its kind in the engineering construction field and represents an innovative effort. By leveraging generative AI and recently developed AI annotation tools, the efficiency of large-scale dataset creation can be significantly improved, while allowing a certain degree of control over category balance. As generative AI technology continues to advance, dataset generation through such methods may become an increasingly promising approach.
2. We investigated the performance of hybrid datasets that combine generative AI images with real-world data. The AIGC-HWD dataset effectively complements real-world images, thereby enhancing detection accuracy to some extent. This improvement is particularly noted when applied to the two-stage Faster R-CNN algorithm. Furthermore, even when using AIGC-HWD alone, the trained object detection models demonstrate good performance (as shown in Figure 7 and Figure 11).
3. By comparing the performance of different algorithms across various datasets, this study reveals the sensitivity of algorithms to data source types. Such findings help future researchers in making more informed decisions when selecting models and refining training strategies.
4. Beyond the primary task of helmet detection, the AIGC-HWD dataset holds further potential for applications in various construction-related vision tasks. For example, it can be extended for multi-class PPE detection and worker re-identification studies.
5.2. Limitations and Possible Future Research Directions
As an exploratory study, the findings presented in this paper have certain limitations, which we aim to refine and address in future research:
1. The prompts for generating images still require ongoing refinement. Currently, in our experiments, we have not identified a prompt capable of precisely controlling the generation of varying quantities and colors of safety helmets within a single image. Therefore, when establishing AIGC-HWD v1.0, the generated images contained only helmets of the same color. Consequently, in future work, the prompts must be continually refined to more accurately generate the images we truly desire.
2. This paper tested two data augmentation strategies: GDUT-HWD-training + AIGC-HWD and GDUT-HWD-training-2 + AIGC-HWD. In these two approaches, the proportion of labels of generative AI images accounted for 22.4% and 31.8%, respectively. Detection performance improved across YOLO v8, YOLO v10, YOLO 11, YOLO v13, and Faster R-CNN. For YOLO v11-MobileNet v4 and RT-DETR, the first data augmentation strategy enhances detection performance, whereas the second strategy does not. This indicates that for these two algorithms, using generative AI images for data augmentation requires carefully controlling their proportion in the training set to prevent deterioration in generalization capability. Future research should thoroughly investigate the optimal range of generative AI label proportions that achieves the best data augmentation effects for various algorithms.
3. Based on the results presented in this paper, when using only generative AI images as the training set, the mAP does not achieve extremely high performance during real-world testing. Although generative AI tools efficiently generate balanced and diverse samples, they still cannot fully replicate the complexity of real construction environments. Compared to real images, synthetic samples typically exhibit idealized lighting conditions, uniform texture details, and simplified backgrounds. While this reduces noise, it also limits the model’s adaptability to variations in real-world scenarios. Additionally, generative models often produce helmets and dresses with consistent shapes and harmonious colors, resulting in low intra-class variance. This leads to domain overfitting—where models perform well on synthetic validation sets but exhibit reduced generalization capabilities in real-world scenarios. Future work may explore strategies such as image-to-image generation to further narrow the gap between generated and real images. Alternatively, producing a larger volume of generative AI images could enrich the diversity of the AIGC-HWD dataset, thereby enhancing detection performance.
4. In cross-domain testing, the decline in detection accuracy for the “none” category highlights the issue of class imbalance in the dataset. Future work will address this by using prompt-based generative AI to specifically generate more “no-helmet” scenarios, aiming to achieve a more balanced class distribution. Additionally, we plan to introduce algorithmic improvements such as semi-supervised domain adaptation to reduce the model’s bias toward dominant categories.
5.3. Interpretation of Performance Variations
The performance differences across datasets and algorithms can be explained by their inherent characteristics. Due to domain discrepancies such as lighting and texture variations, object detection models trained on generative AI images tend to perform poorly in real-world scenarios. This suggests that while generative AI data can help visual models learn the geometric and color features of helmets, it lacks the random noise and complexity found in actual construction sites, which limits the model’s generalization ability.
In contrast, when generative AI images are combined with real-world images for training, the most significant performance improvement is observed in the Faster R-CNN model. As a two-stage detector, Faster R-CNN leverages its region proposal network to better utilize diverse contextual information. The scene variations introduced by AIGC data expand the candidate proposal space, resulting in greater performance gains compared to single-stage YOLO models.
Single-stage algorithms like YOLO are more sensitive to consistency in data distribution due to the design of their detection heads. When the training and testing domains do not match, classification scores and localization accuracy are more prone to errors, limiting their overall benefit.
The performance of the Transformer-based RT-DETR model shows instability, as its architecture is highly dependent on the distribution of the training data. Similarly, the YOLO v11-MobileNet v4 model, with its lightweight backbone, has limited capacity to learn from the diversity of synthetic data, leading to marginal improvements or even slight performance drops.
5.4. Ethical and Practical Considerations of Using Synthetic Data
When applying generative AI data in key areas such as construction safety, ethical and practical considerations must be carefully weighed. While synthetic images offer advantages in scalability, diversity, and category balance, they may also introduce visual artifacts that are unrealistic and do not exist in real-world scenes. To minimize risks, all generative AI images in this study were manually screened for rationality, ensuring that model training and evaluation did not rely solely on synthetic content.
From an ethical perspective, all images are AI-generated and contain no identifiable information about real individuals, thereby avoiding privacy concerns. At the same time, we recognize that overreliance on generative AI images without sufficient on-site verification may lead to misjudgments of actual safety risks. Therefore, generative AI data should currently be used primarily as an assistive data augmentation tool. If generative AI data is required during actual deployment, it must always be placed under human supervision. Future research should explore establishing standardized ethical guidelines and review processes for using generative AI data to ensure its responsible application in safety-related domains.
6. Conclusions
This study developed a generative AI dataset named AIGC-HWD to support helmet detection in construction scenarios. Through prompts, the balance of sample quantities across categories within the dataset can be better controlled. Subsequently, the practical effectiveness of this dataset was validated using multiple deep learning algorithms.
The results demonstrate that object detection models based on generative AI images exhibit reasonable generalization capabilities in real-world scenarios. Generative AI images effectively supplement real-world datasets, enhancing detection accuracy while reducing the cost and workload of manual data collection. These findings confirm the feasibility of integrating generative AI technology into computer vision-based safety monitoring. Moreover, these results provide new ideas for developing safety management solutions that can be scaled up for construction sites.
Future research will refine text-to-image prompts to make generated images more realistic and varied, test the best proportions of generative AI data and real-world data for different algorithms, and apply this method to more scenarios like personal protective equipment detection and safety monitoring.
Author Contributions
Conceptualization, J.L. and Q.M.; methodology, Q.M. and H.Z.; software, H.Z.; validation, Z.Z. and L.K.; formal analysis, Z.L.; investigation, L.K.; resources, Z.L. and L.K.; data curation, Q.M.; writing—original draft preparation, J.L. and Q.M.; writing—review and editing, J.L. and Q.M.; visualization, J.L., Q.M. and Z.Z.; supervision, Z.L.; project administration, J.L. and L.K.; funding acquisition, J.L. All authors have read and agreed to the published version of the manuscript.
Funding
This work was supported by the Liaoning Provincial Joint Science and Technology Program (Grant No. 2025-BSLH-185), and the Basic Research Program for Universities of the Educational Department of Liaoning Province (Grant No. JYTQN2023241).
Data Availability Statement
For pictures and annotations of AIGC-HWD, start an immediate download from this link: https://github.com/Drlijiaqi/AIGC-HWD (accessed on 21 October 2025). Data regarding the process of this study can be reasonably obtained from the corresponding author.
Conflicts of Interest
The authors declare no conflicts of interest.
References
- Li, J.; Zhao, X.; Zhou, G.; Zhang, M. Standardized Use Inspection of Workers’ Personal Protective Equipment Based on Deep Learning. Saf. Sci. 2022, 150, 105689. [Google Scholar] [CrossRef]
- Konda, S.; Tiesman, H.M.; Reichard, A.A. Fatal Traumatic Brain Injuries in the Construction Industry, 2003−2010. Am. J. Ind. Med. 2016, 59, 212–220. [Google Scholar] [CrossRef]
- Team, S.I. The 5 Levels of the Hierarchy of Controls Explained; Safety International, LLC: Chesterfield, MO, USA, 2022. [Google Scholar]
- GB/T 11651-2008; Code of practice for selection of personal protective equipment. Standardization Administration of the People’s Republic of China: Beijing, China, 2008.
- 1926.100; Head Protection.|Occupational Safety and Health Administration. U.S. Department of Labor: Washington, DC, USA, 1972. Available online: https://www.osha.gov/laws-regs/regulations/standardnumber/1926/1926.100 (accessed on 9 May 2023).
- Li, J.; Miao, Q.; Zou, Z.; Gao, H.; Zhang, L.; Li, Z.; Wang, N. A Review of Computer Vision-Based Monitoring Approaches for Construction Workers’ Work-Related Behaviors. IEEE Access 2024, 12, 7134–7155. [Google Scholar] [CrossRef]
- Fang, Q.; Li, H.; Luo, X.; Ding, L.; Luo, H.; Rose, T.M.; An, W. Detecting Non-Hardhat-Use by a Deep Learning Method from Far-Field Surveillance Videos. Autom. Constr. 2018, 85, 1–9. [Google Scholar] [CrossRef]
- Li, Y.; Wei, H.; Han, Z.; Huang, J.; Wang, W. Deep Learning-Based Safety Helmet Detection in Engineering Management Based on Convolutional Neural Networks. Adv. Civ. Eng. 2020, 2020, 1–10. [Google Scholar] [CrossRef]
- Wu, J.; Cai, N.; Chen, W.; Wang, H.; Wang, G. Automatic Detection of Hardhats Worn by Construction Personnel: A Deep Learning Approach and Benchmark Dataset. Autom. Constr. 2019, 106, 102894. [Google Scholar] [CrossRef]
- Nath, N.D.; Behzadan, A.H.; Paal, S.G. Deep Learning for Site Safety: Real-Time Detection of Personal Protective Equipment. Autom. Constr. 2020, 112, 103085. [Google Scholar] [CrossRef]
- Wang, L.; Xie, L.; Yang, P.; Deng, Q.; Du, S.; Xu, L. Hardhat-Wearing Detection Based on a Lightweight Convolutional Neural Network with Multi-Scale Features and a Top-Down Module. Sensors 2020, 20, 1868. [Google Scholar] [CrossRef] [PubMed]
- Chen, S.; Demachi, K. Towards On-Site Hazards Identification of Improper Use of Personal Protective Equipment Using Deep Learning-Based Geometric Relationships and Hierarchical Scene Graph. Autom. Constr. 2021, 125, 103619. [Google Scholar] [CrossRef]
- Liu, Z.; Cai, N.; Ouyang, W.; Zhang, C.; Tian, N.; Wang, H. CA-CentripetalNet: A Novel Anchor-Free Deep Learning Framework for Hardhat Wearing Detection. Signal Image Video Process. 2023, 17, 4067–4075. [Google Scholar] [CrossRef]
- Wei, L.; Liu, P.; Ren, H.; Xiao, D. Research on Helmet Wearing Detection Method Based on Deep Learning. Sci. Rep. 2024, 14, 7010. [Google Scholar] [CrossRef] [PubMed]
- Jiao, X.; Li, C.; Zhang, X.; Fan, J.; Cai, Z.; Zhou, Z.; Wang, Y. Detection Method for Safety Helmet Wearing on Construction Sites Based on UAV Images and YOLO v8. Buildings 2025, 15, 354. [Google Scholar] [CrossRef]
- Zhang, Y.; Lin, C.; Chen, G. Efficient Helmet Detection Based on Deep Learning and Pruning Methods. J. Electron. Imaging 2025, 34, 023006. [Google Scholar] [CrossRef]
- Zhang, Y.; Huang, S.; Qin, J.; Li, X.; Zhang, Z.; Fan, Q.; Tan, Q. Detection of Helmet Use among Construction Workers via Helmet-Head Region Matching and State Tracking. Autom. Constr. 2025, 171, 105987. [Google Scholar] [CrossRef]
- Njvisionpower. Safety-Helmet-Wearing-Dataset 2025. Available online: https://github.com/njvisionpower/Safety-Helmet-Wearing-Dataset (accessed on 21 October 2025).
- Otgonbold, M.-E.; Gochoo, M.; Alnajjar, F.; Ali, L.; Tan, T.-H.; Hsieh, J.-W.; Chen, P.-Y. SHEL5K: An Extended Dataset and Benchmarking for Safety Helmet Detection. Sensors 2022, 22, 2315. [Google Scholar] [CrossRef]
- Lee, J.-Y.; Choi, W.-S.; Choi, S.-H. Verification and Performance Comparison of CNN-Based Algorithms for Two-Step Helmet-Wearing Detection. Expert Syst. Appl. 2023, 225, 120096. [Google Scholar] [CrossRef]
- Li, B.; Liu, Y.; Wang, X. Gradient Harmonized Single-Stage Detector. In Proceedings of the Proceedings of the Thirty-Third AAAI Conference on Artificial Intelligence and Thirty-First Innovative Applications of Artificial Intelligence Conference and Ninth AAAI Symposium on Educational Advances in Artificial Intelligence, Honolulu, HI, USA, 27 January 2019; AAAI Press: Honolulu, HI, USA; Volume 33, pp. 8577–8584. [Google Scholar]
- Horvath, B. Synthetic Data for Deep Learning. Quant. Financ. 2022, 22, 423–425. [Google Scholar] [CrossRef]
- Lališ, A.; Socha, V.; Křemen, P.; Vittek, P.; Socha, L.; Kraus, J. Generating Synthetic Aviation Safety Data to Resample or Establish New Datasets. Saf. Sci. 2018, 106, 154–161. [Google Scholar] [CrossRef]
- Trigka, M.; Dritsas, E. A Comprehensive Survey of Machine Learning Techniques and Models for Object Detection. Sensors 2025, 25, 214. [Google Scholar] [CrossRef]
- Lecun, Y.; Bottou, L.; Bengio, Y.; Haffner, P. Gradient-Based Learning Applied to Document Recognition. Proc. IEEE 1998, 86, 2278–2324. [Google Scholar] [CrossRef]
- Girshick, R.; Donahue, J.; Darrell, T.; Malik, J. Rich Feature Hierarchies for Accurate Object Detection and Semantic Segmentation. In Proceedings of the 2014 IEEE Conference on Computer Vision and Pattern Recognition, Columbus, OH, USA, 23–28 June 2014; pp. 580–587. [Google Scholar]
- Girshick, R. Fast R-CNN. In Proceedings of the 2015 IEEE International Conference on Computer Vision (ICCV), Santiago, Chile, 7–13 December 2015; pp. 1440–1448. [Google Scholar]
- Ren, S.; He, K.; Girshick, R.; Sun, J. Faster R-CNN: Towards Real-Time Object Detection with Region Proposal Networks. arXiv 2016, arXiv:1506.01497. [Google Scholar] [CrossRef]
- Bochkovskiy, A.; Wang, C.-Y.; Liao, H.-Y.M. YOLO v4: Optimal Speed and Accuracy of Object Detection 2020. arXiv 2020, arXiv:2004.10934. [Google Scholar]
- Hou, T.; Leng, C.; Wang, J.; Pei, Z.; Peng, J.; Cheng, I.; Basu, A. MFEL-YOLO for Small Object Detection in UAV Aerial Images. Expert Syst. Appl. 2025, 291, 128459. [Google Scholar] [CrossRef]
- Zhang, X.; Chen, X.; Ding, Y.; Zhang, Y.; Wang, Z.; Shi, J.; Johansson, N.; Huang, X. Smart Real-Time Evaluation of Tunnel Fire Risk and Evacuation Safety via Computer Vision. Saf. Sci. 2024, 177, 106563. [Google Scholar] [CrossRef]
- Ammour, N.; Alhichri, H.; Bazi, Y.; Benjdira, B.; Alajlan, N.; Zuair, M. Deep Learning Approach for Car Detection in UAV Imagery. Remote Sens. 2017, 9, 312. [Google Scholar] [CrossRef]
- Zheng, Z.; Zhao, X.; Zhao, P.; Qi, F.; Wang, N. CNN-Based Statistics and Location Estimation of Missing Components in Routine Inspection of Historic Buildings. J. Cult. Herit. 2019, 38, 221–230. [Google Scholar] [CrossRef]
- Zhang, Y.; Yuen, K.-V. Bolt Damage Identification Based on Orientation-Aware Center Point Estimation Network. Struct. Health Monit. 2021, 21, 147592172110042. [Google Scholar] [CrossRef]
- Sharma, H.; Kanwal, N. Intelligent Video-Based Fire Detection: A Novel Dataset and Real-Time Multi-Stage Classification Approach. Expert Syst. Appl. 2025, 271, 126655. [Google Scholar] [CrossRef]
- Dávila-Soberón, S.; Morales-Díaz, A.; Castelán, M. A Novel Image Dataset for Detecting and Classifying Mobility Aid Users. Expert Syst. Appl. 2025, 293, 128697. [Google Scholar] [CrossRef]
- Everingham, M.; Van Gool, L.; Williams, C.K.I.; Winn, J.; Zisserman, A. The Pascal Visual Object Classes (VOC) Challenge. Int. J. Comput. Vis. 2010, 88, 303–338. [Google Scholar] [CrossRef]
- Deng, J.; Dong, W.; Socher, R.; Li, L.-J.; Li, K.; Fei-Fei, L. ImageNet: A Large-Scale Hierarchical Image Database. In Proceedings of the 2009 IEEE Conference on Computer Vision and Pattern Recognition, Miami, FL, USA, 20–25 June 2009. [Google Scholar]
- UDTIRI. Available online: https://www.kaggle.com/datasets/jiahangli617/udtiri (accessed on 21 June 2025).
- Duan, R.; Deng, H.; Tian, M.; Deng, Y.; Lin, J. SODA: A Large-Scale Open Site Object Detection Dataset for Deep Learning in Construction. Autom. Constr. 2022, 142, 104499. [Google Scholar] [CrossRef]
- Liu, C.; Zhang, W.; Xu, W.; Lu, B.; Li, W.; Zhao, X. Substation Inspection Safety Risk Identification Based on Synthetic Data and Spatiotemporal Action Detection. Sensors 2025, 25, 2720. [Google Scholar] [CrossRef]
- Pham, H.T.T.L.; Han, S. Generating Realistic Training Images from Synthetic Data for Excavator Pose Estimation. Autom. Constr. 2024, 167, 105718. [Google Scholar] [CrossRef]
- Messer, U. Co-Creating Art with Generative Artificial Intelligence: Implications for Artworks and Artists. Comput. Hum. Behav. Artif. Hum. 2024, 2, 100056. [Google Scholar] [CrossRef]
- Liu, S.; Chen, J.; Feng, Y.; Xie, Z.; Pan, T.; Xie, J. Generative Artificial Intelligence and Data Augmentation for Prognostic and Health Management: Taxonomy, Progress, and Prospects. Expert Syst. Appl. 2024, 255, 124511. [Google Scholar] [CrossRef]
- Aladağ, H. Assessing the Accuracy of ChatGPT Use for Risk Management in Construction Projects. Sustainability 2023, 15, 16071. [Google Scholar] [CrossRef]
- Cai, J.; Yuan, Y.; Sui, X.; Lin, Y.; Zhuang, K.; Xu, Y.; Zhang, Q.; Ukrainczyk, N.; Xie, T. Chatting about ChatGPT: How Does ChatGPT 4.0 Perform on the Understanding and Design of Cementitious Composite? Constr. Build. Mater. 2024, 425, 135965. [Google Scholar] [CrossRef]
- Zhao, Y.; Lv, W.; Xu, S.; Wei, J.; Wang, G.; Dang, Q.; Liu, Y.; Chen, J. DETRs Beat YOLOs on Real-Time Object Detection 2024. arXiv 2024, arXiv:2304.08069. [Google Scholar]


Disclaimer/Publisher’s Note: The statements, opinions and data contained in all publications are solely those of the individual author(s) and contributor(s) and not of MDPI and/or the editor(s). MDPI and/or the editor(s) disclaim responsibility for any injury to people or property resulting from any ideas, methods, instructions or products referred to in the content. |
© 2025 by the authors. Licensee MDPI, Basel, Switzerland. This article is an open access article distributed under the terms and conditions of the Creative Commons Attribution (CC BY) license (https://creativecommons.org/licenses/by/4.0/).