Article

Screen Façade Pattern Design Driven by Generative Adversarial Networks and Machine Learning Classification for the Evaluation of a Daylight Environment

1
Department of Architecture, Kwangwoon University, Seoul 01897, Republic of Korea
2
Department of Refrigeration and Air-Conditioning Engineering, Chonnam National University, Yeosu 59626, Republic of Korea
*
Author to whom correspondence should be addressed.
Buildings 2025, 15(22), 4056; https://doi.org/10.3390/buildings15224056
Submission received: 11 September 2025 / Revised: 6 November 2025 / Accepted: 7 November 2025 / Published: 11 November 2025
(This article belongs to the Special Issue Artificial Intelligence in Architecture and Interior Design)

Abstract

This research seeks to identify optimised screen façade patterns and ratios for the effective management of daylight ingress and glare effects. It employs generative adversarial networks (GANs) to generate pattern variations and further evaluates the resultant variations through daylight simulations for application in screen façades. The generated pattern data were classified by hierarchical clustering to distinguish distinct feature groups, and they were subsequently utilised as façade configurations. The pattern data were assessed through daylight performance metrics: spatial daylight autonomy (sDA), annual sunlight exposure (ASE), and daylight glare probability (DGP). The results of the annual-based simulations indicate that façade patterns with frame ratios in the range of 50–65% are useful in reducing the areas exposed to intensive glare on the façade side while maintaining the minimum required lighting conditions. The overall influence of screen façades on interior daylighting in a large space (e.g., 10 m × 10 m) was found to be limited. Their performance is notable in reducing glare discomfort areas within approximately 2.5 m of south-facing façades. This study supports an application strategy in which screen façades are used to manage the extent of areas exposed to daylight ingress within an interior space.

1. Introduction

The façade of a building serves as its ‘face’ or ‘frontage’, which combines exterior features with essential functions for building performance [1]. As façades act as filters and complex systems connecting interior and exterior environments, the early design stage involves multi-disciplinary processes that require the integration of human comfort, structural safety, durability, material efficiency, and cost effectiveness [2]. To meet the indoor occupants’ needs, one of the major building design criteria is human comfort. This includes the sub-categories of visual comfort, daylight control, acoustics, and heating/cooling [3]. The aesthetic perception of building façades is determined by a blend of visual, cultural and psychological factors, depending on how people identify the outward appearance of buildings [4,5]. Façade design often entails challenges in achieving a balance between practical performance and visual qualities.
To achieve the dual purpose of combining environmental responsiveness with aesthetics, screen façades (often referred to as perforated façades) can be employed as a façade design type [6]. They are designed with geometric patterns, and play a crucial role in solar shading. The perforated portions allow controlled daylight penetration, to reduce heat gain and enhance building performance, while maintaining visual connections with the exterior environment [7]. With increasing interest in the aspect of sustainability-related building performance, contemporary versions of screen façades have focused on building envelopes that distribute daylight in indoor spaces [8]. Recent research has addressed the assessment of visual comfort, glare reduction, and outside views for occupants, and the geometric aspects of façade design [8]. For instance, the performance-oriented design approach combines architectural designs with environmental technologies to enhance building performance. Advancements in computational design methods have fostered new pathways using building data in this design process [9].
Artificial intelligence (AI) technologies, coupled with high-performance computing capacity, have supported designers’ decision-making methods for generating and evaluating architectural designs. This allows architects to assess both design variations and functional properties [10,11]. While visual qualities in architectural design are generally based on aesthetic considerations, data-driven metrics enable the use of measurable outcomes to support design alternatives [12]. In the research domain of building façades integrated with AI techniques, key trending data metrics include energy performance, thermal comfort assessment, and daylight optimisation [13]. The process of decision-making for generating design options is based on building contexts such as geometry, geography and typology, and follows a systematic methodology. This involves the preparation and configuring of relevant data; the application of generative models; performance evaluations; assessment of compliance with predefined requirements; and the development of final design solutions [14].
For this research, generative adversarial networks (GANs) and machine learning (ML) classification based on convolutional neural networks (CNNs) are employed to explore a data-driven design methodology, which concentrates on generative screen façade patterns and the clustering of their features. Furthermore, the features’ effects on indoor environmental quality are evaluated. Previous design automation methods in architecture have included evolutionary computation, artificial neural networks, fractals, swarm intelligence, and cellular automata [15]. Given a remarkable increase in studies employing AI methods, GANs have emerged as a transformative technique in architectural research. GAN models are primarily applied in computer vision, as they enable image synthesis, translation and enhancement, for generating images or two-dimensional representations [16]. To address the relationship between image generative techniques and three-dimensional model simulations that are suitable for practical applications, this study investigates the generative method of designing screen façade features using GANs, and their integration with daylight simulation analyses.

1.1. GANs in the Architectural Context

Proposed by Goodfellow et al. in 2014 [17], the adversarial nets framework has been widely applied across various industries. The learning process is formalised to train the Generator and Discriminator simultaneously, in order to optimise the final Generator to produce increasingly improved data outputs. Following this model, the applications of deep convolutional generative adversarial networks (DCGAN) illustrated the potential of black-and-white feature generation, but this depended on large volumes of data, and required addressing the challenge of blurry images [18,19,20]. As early GANs suffered from drawbacks such as mode collapse and training instability, Wasserstein GAN (WGAN) improved the issue by proposing the Wasserstein loss function [21]. StyleGAN advanced the modelling framework by enabling fine-grained control over image synthesis, while it required fewer datasets compared to previous approaches [22].
The GAN model has been increasingly integrated into architectural and urban studies, supported by deep neural networks that enable image translation, text-to-image synthesis, and graph-based generation. For instance, Pix2Pix, a conditional GAN model, performs image-to-image translation tasks utilising segmentation mapping, in order to generate façade or urban street representations [23]. CycleGAN facilitates the synthesis of paired datasets, such as perspective street images or urban aerial views with corresponding labels [24]. In addition, text-to-image synthesis techniques, such as AttnGAN, enable the generation of building images from textual descriptions by utilising attention mechanisms, for detailed visual outputs [25]. Furthermore, GraphGAN has extended GAN’s ability to handle textual and graph-structured data [26].
For spatial and volumetric studies, the GAN model has been employed across a range of applications, from 2D layout composition to 3D object modelling. For example, House-GAN is a graph-constrained house layout generator designed to provide multiple options for compatible room compositions, by employing bubble diagrams [27]. GTGAN and Roof-GAN produce roof geometry that fits into the building footprint, incorporating a graph-transformer-based generator [28,29]. Moreover, there has been a growing trend towards advancing the technique to incorporate 3D models. Building-GAN presents a volumetric design approach to generate buildings’ rough 3D geometry, defined by programmes and a 2D layout based on node networks [30]. In addition, 3DGAN has developed 3D volume generation, represented in voxel grids, by training on 3D data to create 3D objects [31]. Studies on GANs related to architectural and urban contexts have involved the subject of generating room layout, building envelope and volumetric shape [32].

1.2. Façade Design Integrated with AI and Daylight Simulation

A wide range of design strategies for façade shading devices have been developed to enhance indoor daylight quality. These strategies involve two-dimensional patterned screens that provide shading, airflow, privacy, ornamentation (e.g., Mashrabiya, Kumiko, Jali) and configurable architectural elements (e.g., membranes, shutters, kinetic devices) [33]. Research on façade systems can be generally categorised into static and dynamic devices [34]. Façade systems manage changing environmental conditions and are responsive to environmental data, subject to temporal variation. Optimally responsive static devices and spontaneously adaptive dynamic systems have been examined.
In studies on adaptable façade materials, shading devices have been investigated using glass with varying light transmittance that reacts to specific solar incidence angles [33]. For fabric-based devices, openness and angular configuration are crucial factors in determining effective daylight infiltration [35]. The research domain investigating the design optimisation of static devices has focused on identifying effective solutions for balancing daylight controls with reducing dependence on artificial lighting.
Louvres represent one of the most widely used strategies for daylight control. The examination of geometrical configurations has increasingly been applied to achieve optimised performance. Supported by computational methods, these investigations significantly reduce the time required, compared to conventional evaluation processes, and they enable testing beyond a limited set of design options [34,36]. Furthermore, ML techniques for daylight prediction, combined with genetic algorithms for optimisation, have emerged as contemporary approaches in façade design.
Ongoing research has emphasised the optimisation of façade systems to enhance daylight performance and occupant comfort. The deployment of double-skin façades, integrated with perforated screen layers, has demonstrated notable capacity in enhancing luminance distribution and reducing visual discomfort from glare [37]. Building orientations influence the optimal perforation ratios for screen façades that require customised solutions for sunlight exposure [38,39]. Façade performance simulations have adopted an integrative framework combining daylighting metrics with site-specific environmental data to enable rigorous performance assessment [40,41]. AI techniques allow the efficient evaluation of daylight metrics through data-driven methodologies.
When combining the CNN and GAN methods for building performance estimations related to façade design, this involves the challenge of translating the ML techniques into design decision-making solutions. CNN models are effective for data classification, detection and segmentation, while GAN models are useful for data prediction, synthesis and transformation [42]. To evaluate façade performance, commonly used daylight metrics include illuminance calculations, spatial daylight autonomy (sDA), annual sunlight exposure (ASE), daylight glare probability (DGP), useful daylight illuminance (UDI), and daylight factor (DF). Studies on façade design have mainly centred on developing daylight prediction models driven by deep learning to estimate performance metrics [43].
Regarding building façade design, the GAN model has facilitated the technique of manipulating building exterior images, such as reproducing traditional features, restoring partial façade images, modifying window details, and synthesising textures for 3D models. Combined with segmentation mapping and text-to-image techniques, the model could be trained with a collection of historical building façade image data, to reproduce varied traditional styles of building exterior features [44,45,46]. For image in-painting, its application fills in missing parts of façade images, or removes elements arranged in front of buildings, such as trees, cars and pedestrians [47]. GAN further automates the modelling of window frames images, including the details of width, subdivision and profile, by combining CNN-based recognition of architectural features [48]. For texture 3D mapping, FrankenGAN enables the integration of façade and roof image textures into volumetric virtual environments [49,50].
Although generative AI models have been primarily utilised for architectural image manipulation, their potential has been increasingly recognised for the rapid exploration of design alternatives. While image manipulation of building visuals has been widely investigated, relatively few studies have focused on using generative AI to create or newly produce forms for architectural element designs, based on training data.

2. Methods

2.1. Research Process and Objective

The aim of this study is to utilise GAN to generate façade pattern designs, which are then evaluated using daylight performance simulation. This research contributes to the investigation of AI-driven generative design approaches that facilitate the exploration of performance-based strategies and support the evaluation of façade design effectiveness. This study focuses on employing a trained generative model to produce form alternatives for façade element design. The application of generative AI was not limited to two-dimensional image manipulations of architectural representations, but aimed to utilise AI-generated patterns applied to architectural elements. This enabled their simulation within three-dimensional environments that incorporate daylight evaluations.
The daylight simulations were conducted with the environmental data specified by a south-oriented test space in South Korea. The research consisted of three main processes: pattern-making, variation-categorising, and daylight performance evaluation (see Figure 1). In Step 1, the StyleGAN model produced variations in screen façade patterns, in order to allow the exploration of design features. In Step 2, a hierarchical classification approach was employed using the Orange tool integrated with the SqueezeNet CNN model, to identify pattern features. In Step 3, the daylight effects of selected patterns were measured through performance simulations. The simulations were conducted using Rhino and Grasshopper plugins, including the Climate Studio tool.
For pattern making, 664 black-and-white images were collected. These were resized to 256 × 256 pixels for training. The StyleGAN3 model was utilised, as it can generate fine details and variations with limited datasets; this facilitates the manipulation of features through unsupervised training processes. The output of 5000 newly generated image data produced by the StyleGAN model were classified by resembling features though CNN classification processes. The augmented pattern data provided more available variations, and a wider range of proportions of frame (black part) and void (white part) in the pattern images. After the phase of clustering the data, the percentages of frame and void parts in similar patterns were assessed. The categorised pattern images were placed on a south-side building façade with 3D modelling. They were used as varied options to measure illuminance calculations—specifically, sDA, ASE, and DGP, which are key metrics for a building’s daylight performance. The simulation-based approach evaluated the daylight performance of screen façade designs in a regularly occupied space.
ML techniques were employed as a supporting method for the design of an architectural component. Recent GAN models have enabled high-resolution image feature generation. Previously, training early GAN models required over 100,000 images. In this study, a relatively small dataset of black-and-white binary frame feature images was used to train façade frame design models. In addition, the Climate Studio tool excels in delivering highly accurate daylight simulations for passive solar strategies, glare control, and sustainable building compliance. The simulations with this tool verified the detailed measurement of daylight effects for occupant comfort and the climate-specific analysis.

2.2. Framework of the CNN and GAN Model

As a deep learning model, CNNs are composed of multiple layers of processing, and all the weights in the CNNs are learned using the back-propagation technique [51]. For computer vision, starting with the input image whose pixels are building blocks, CNN models process four stages: a convolutional layer, a normalisation layer, a pooling layer, and a fully connected layer. First, the convolutional layer applies filters. It multiplies its values with overlapping values, and adds them all together to form a single output value. In the normalisation layer, the feature maps, produced via the filters, can be inserted into a non-linear function, such as ReLU activation. From the feature maps, the pooling (sub-sampling) layer calculates a summary statistic of the neighbouring outputs and shrinks the feature’s spatial size. The fully connected layer receives its input from the final outputs of the pooling or convolutional layer, and its flattening process involves converting all the values into a one-dimensional vector [52].
The output is compared using a loss function for classification tasks. In ML, loss refers to the difference between a model’s predicted value and the actual value for a single sample: the loss function calculates this difference. A lower loss indicates better model performance, as it signifies a closer match between predictions and actual values. The error is propagated back through the network using back-propagation, which computes gradients for weight updates. The activation functions can adaptively adjust the parameters of the correction unit, thereby enhancing recognition accuracy during training [53]. The process is repeated across multiple training processes, to refine the model’s ability to classify images. The final feature map is passed through fully connected layers to produce a probability distribution over possible classes, with the class having the highest probability as the output.
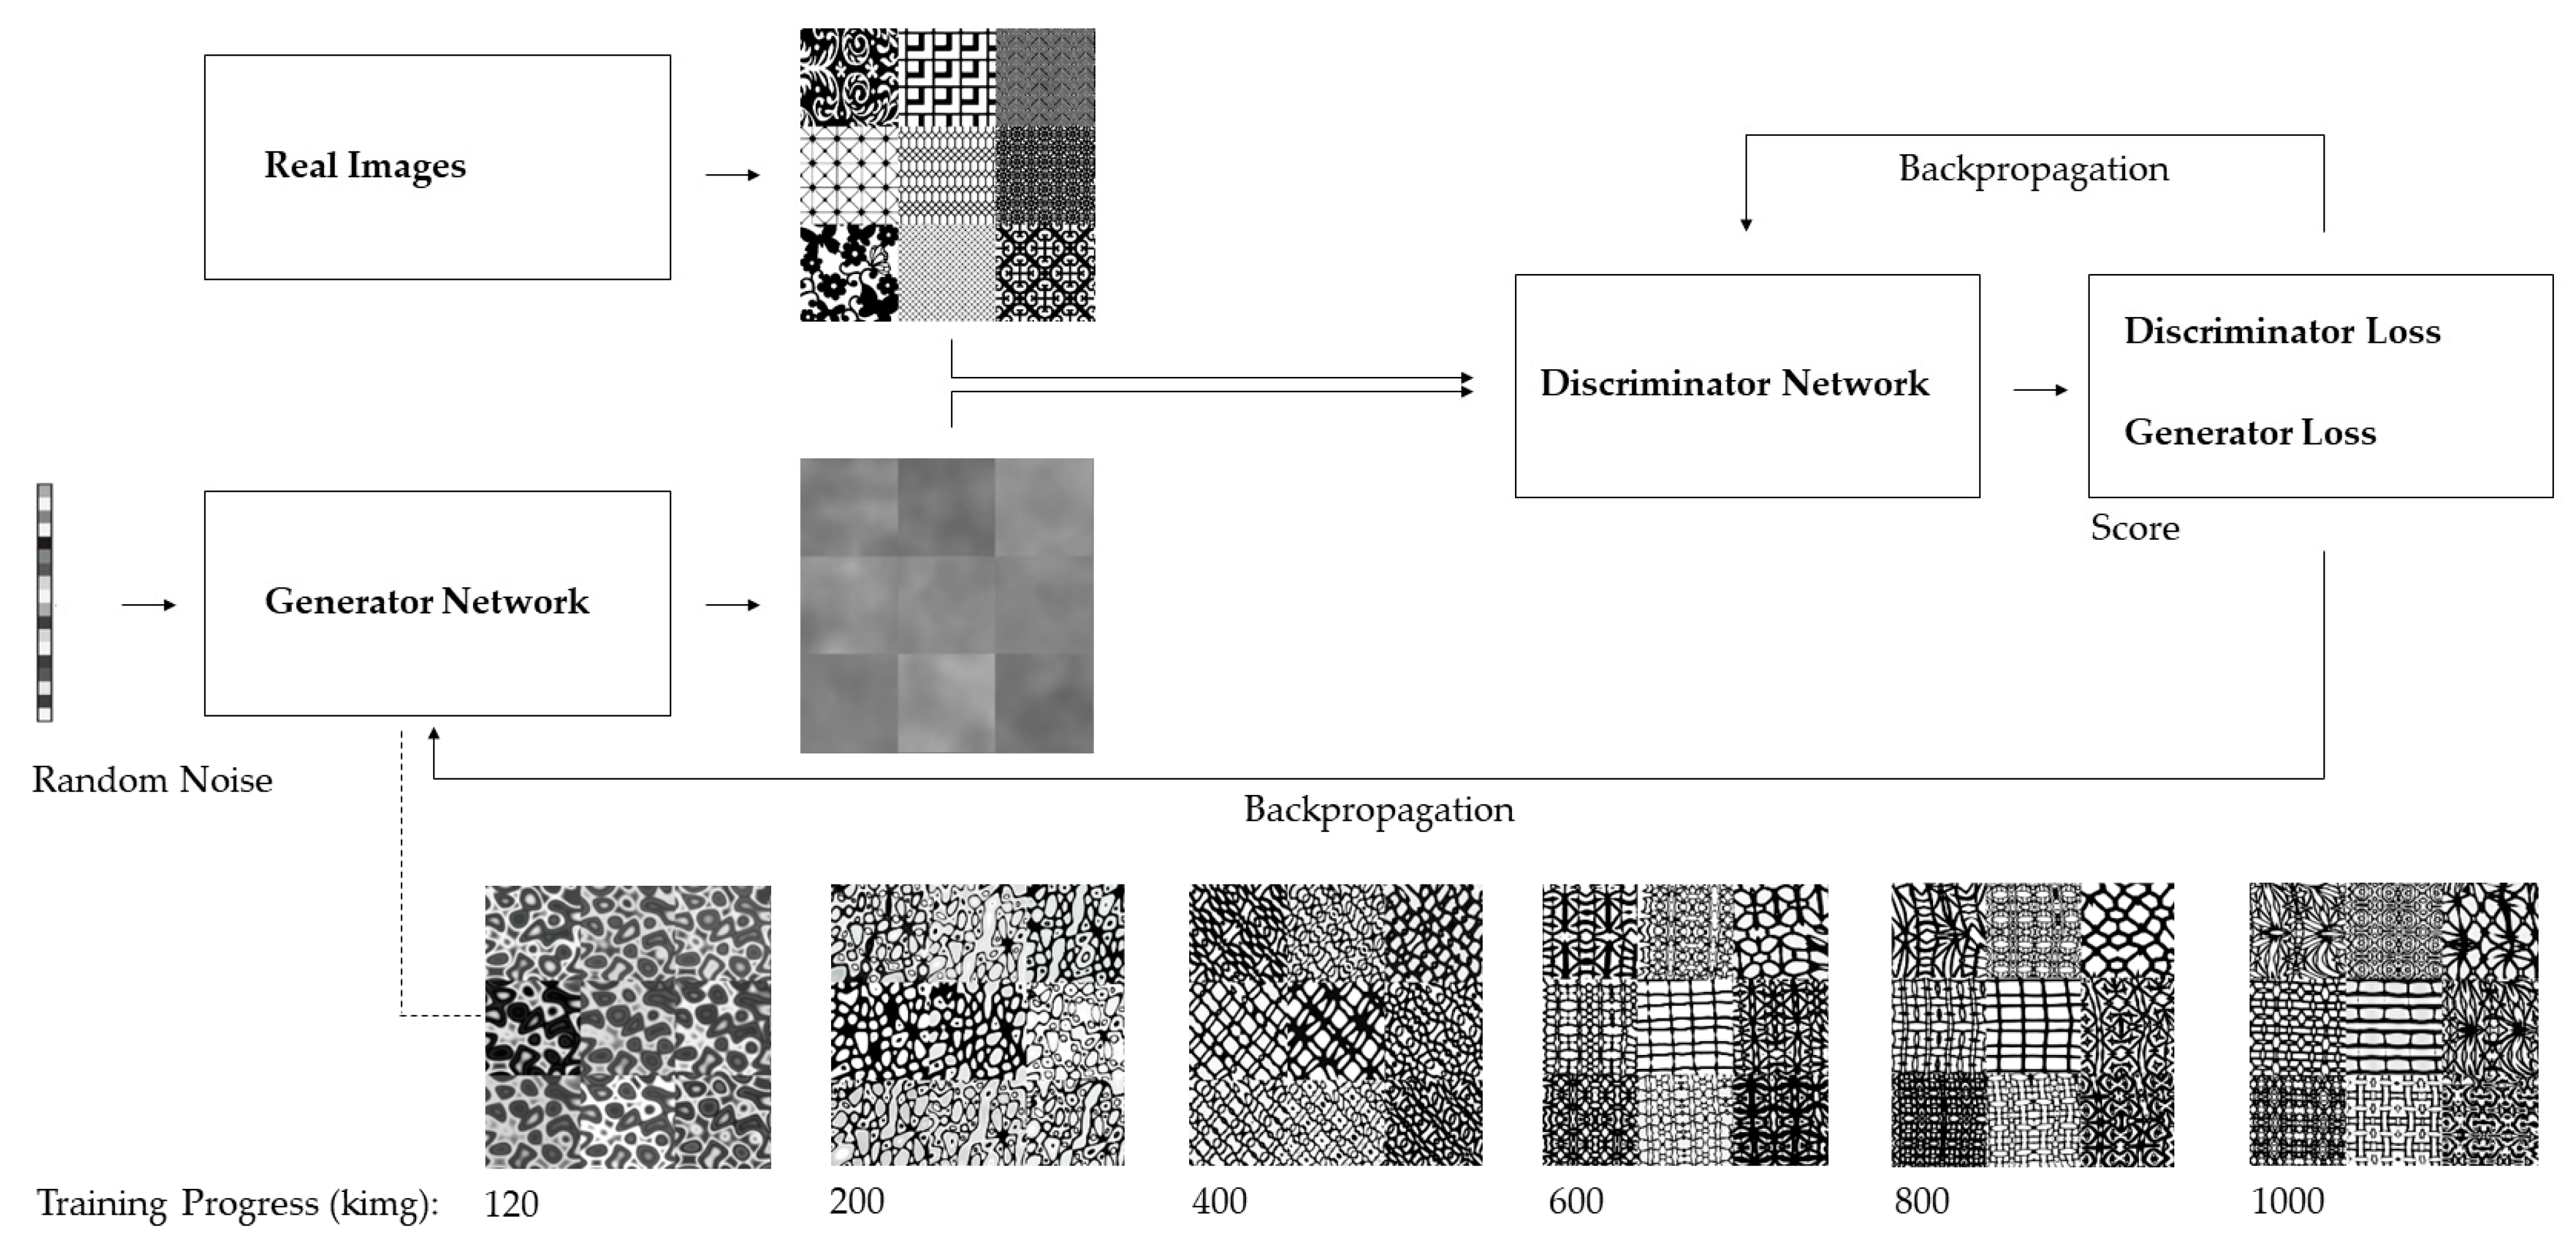
In the model for generating GANs, CNNs are employed in both the generator and the discriminator networks, where classification processes are manipulated by training the discriminator to output probabilities that guide the generator to produce more accurate images (see Figure 2). As training progresses, the generator increasingly produces data that closely resemble authentic images, while the discriminator improves its ability to distinguish between genuine and synthesised samples.
The basic formula underlying the StyleGAN model is derived from the standard GAN framework, expressed as follows [17]:
min G   max D V D , G =   E x P data ( x ) log D ( x ) + E z P z ( z ) l o g ( 1 D ( G ( z ) ) )
In this formula, the generator (G) and discriminator (D) are engaged in a two-player min-max game with value function V(D,G). The discriminator aims to distinguish real data (x) from generated ones by maximising the former’s score (D(x)) while minimising that of the latter (D(G(z))). The generator tries to deceive the discriminator by producing data that resemble real data, to minimise their likelihood of being identified as fake. The goal is to train G to produce realistic images that D cannot distinguish from real ones.
The StyleGAN model amends the traditional GAN generator, so that random noise is mapped to intermediate latent spaces in order to control specific visual features. Noise injection at each layer further adds fine details. Random noise is added at each generator layer to introduce stochastic variations, thus creating fine-grained and confirming diversity in the generated outputs. Instead of feeding noise directly into the generator, StyleGAN maps into an intermediate latent space using a fully connected mapping network.
In the StyleGAN model, the convolutional layers refine and transform features progressively as the image resolution increases. In progressive growing, the image resolution is increased step-by-step by adding convolutional blocks. Adaptive Instance Normalisation (AdaIN) replaces the need for traditional transposed convolution by allowing the latent vector to control the activations in the generator. The latent vector is transformed into styles at different layers, thus modulating the convolutional layers’ output through AdaIN. This provides precise control over various aspects of the generated image. Hence, StyleGAN enables the control of details such as shape, composition, texture, and sharpness in images, and is useful for generating high-contrast images with clear feature separation.

2.3. Daylight Assessment

Screen façades use patterned designs to enhance visual appeal and indoor privacy, control daylight, and adapt to environmental conditions for improved thermal efficiency. Regarding these objectives, regulating the ratio between solid frames and voids is essential for retaining a connection between interior and exterior spaces and filtering natural light. The standards of building sustainability provide guidelines for daylight maintenance, in order to effectively regulate sunlight, reduce electrical lighting usage, and minimise glare.
Design strategies for achieving daylighting management indicate the use of annual computer simulations to analyse two key metrics: sufficient daylight (sDA) and extent of excessive sunlight exposure (ASE) [54]. sDA is a widely utilised metric in daylighting analysis: it quantifies the percentage of floor area receiving adequate daylight illuminance within an interior space, and is typically defined as achieving at least 300 lux for a minimum of 50% of annual occupied hours. This metric evaluates how natural light sufficiently illuminates the space during periods of occupancy. In addition, ASE measures the percentage of floor area receiving sunlight above a specified threshold for more than a specified number of hours per year. The thresholds in the ASE standards are generally 1000 lux and 250 h. This metric identifies areas at risk of excessive solar exposure, which can lead to visual discomfort from glare. sDA and ASE calculations assess daylight performance from an occupant’s perspective. The analysis grids need to be no more than 0.6 m2, and positioned at a height of 0.76 m above the finished floor.
The approved daylight metrics method, IES LM-83-12 (2012) [55], introduced by the Illuminating Engineering Society, defines spatiotemporal metrics through sDA300/50% and ASE1000/250h [56]. These metrics represent the percentage of a space that receives sDA and the ASE, respectively. The sDA metric evaluates the sufficiency of natural daylight in an indoor space. The formula measures the percentage of a space that meets or exceeds a specified illuminance level (e.g., 300 lux) for a given fraction (e.g., 50%) of occupied time annually. It is defined as follows:
s D A 300 / 50 % =   i S ( i )   i P i     0 ,   1 ,   S i = 1                   i f     s i       τ t y 0                   i f     s i     <   τ t y    
The function S(i) estimates whether the illuminance target at points ( P i ) meets daylight requirements, where sᵢ counts illuminance exceedances of the target, τ is the required time fraction, and t y represents annual occupied timesteps. ASE measures annual glare risk from excessive sunlight exposure, calculated as follows:
A S E 1000 / 250 h =   i A ( i )   i P i     0 ,   1 ,   A i = 1                   i f     a i       T y 0                   i f     a i     <   T y    
The function A(i) evaluates whether the illuminance target the points ( P i ) exceeds annual glare limits, where a i counts illuminance surpasses a threshold (e.g., 1000 lux) and T y   is the annual hour threshold (e.g., 250).
DGP measures daylight glare by evaluating the likelihood of uncomfortable glare caused by direct sunlight through windows. sDA and ASE evaluate annual daylight availability and usability, while illuminance calculations and DGP assess specific lighting levels and glare conditions at a given moment. In the method of illuminance calculation, daylight can be measured by illuminance levels at two key times of the year (21 September and 21 March) at 9 a.m. and 3 p.m. under clear sky conditions [54]. These times are designated as representative of the equinoxes, when day and night are of equal length. The recommended daylight illuminance range for the regularly occupied floor area spans from 300 lux to 3000 lux, to provide sufficient natural lighting to support occupant comfort and optimal visual performance [54].
The DGP formula predicts visual discomfort caused by daylight glare in indoor environments. The formula is defined by the following [57]:
D G P = 5.87 × 10 5 E v + 9.18 × 10 2   log 1 +   i L s , i 2 ω s , i E v 1.87 P i 2 + 0.16
E v   represents the vertical illuminance at eye level, indicating the surrounding brightness at the observer’s position. L s , i refers to the luminance of glare source, and ω s , i is the solid angle of the glare source. P i   is the position index, which accounts for how centrally a glare source appears within the viewer’s field of vision. The relative contribution of each glare source increases with its brightness, size in the field of view, and proximity to the centre of vision, while it decreases as the surrounding vertical illuminance becomes higher due to visual adaptation. DGP combines the global brightness and contrast-based glare effects from individual bright sources [57,58].
According to the relationship between glare rating and DGP range, a DGP ≤ 0.35 indicates no glare, values between 0.35 and 0.40 represent acceptable glare, and values above 0.40 correspond to uncomfortable glare [59]. Lower DGP values indicate less glare, leading to a more comfortable visual environment. Thus, a well-balanced daylighting design maximises natural light, while minimising glare and excessive sunlight exposure.
For glare measurement, spatial disturbing glare (sDG) indicates the percentage of views across the regularly occupied floor area that experience discomfort glare for at least 5% of the working time in a year. The calculation method is based on spatial temporal DGP values for different view directions in a simulation space [60].
The EN 17037:2018 ‘Daylight of Buildings’ Standard [61] provides the minimum target daylight factor and the recommended lux values. It specifies that the daylighting condition should maintain 300 lux for 50% of the space and 100 lux minimum over 95% of the space. It also states that the range of 500–750 lux is the average level for daylight [62]. In the IES LM-83-12 (2012) standard, sDA uses a minimum threshold of 300 lux to indicate sufficient daylight conditions, whereas ASE applies a 1000 lux threshold to identify potential glare exposure.
The abovementioned measurement methods are recommended in the standards of sustainable building design for aspects of daylight management. In the LEED Daylight Credit options (EQ Credit), the measurement methods involve sDA and ASE. The lux levels ranging from 300 to 3000 are specified for either simulation-based modelling or on-site measurement, conducted at a specific time. The 3000 lux threshold serves as an upper limit for ASE, to prevent visual discomfort.

2.4. Screen Façade Design and Daylight Simulation

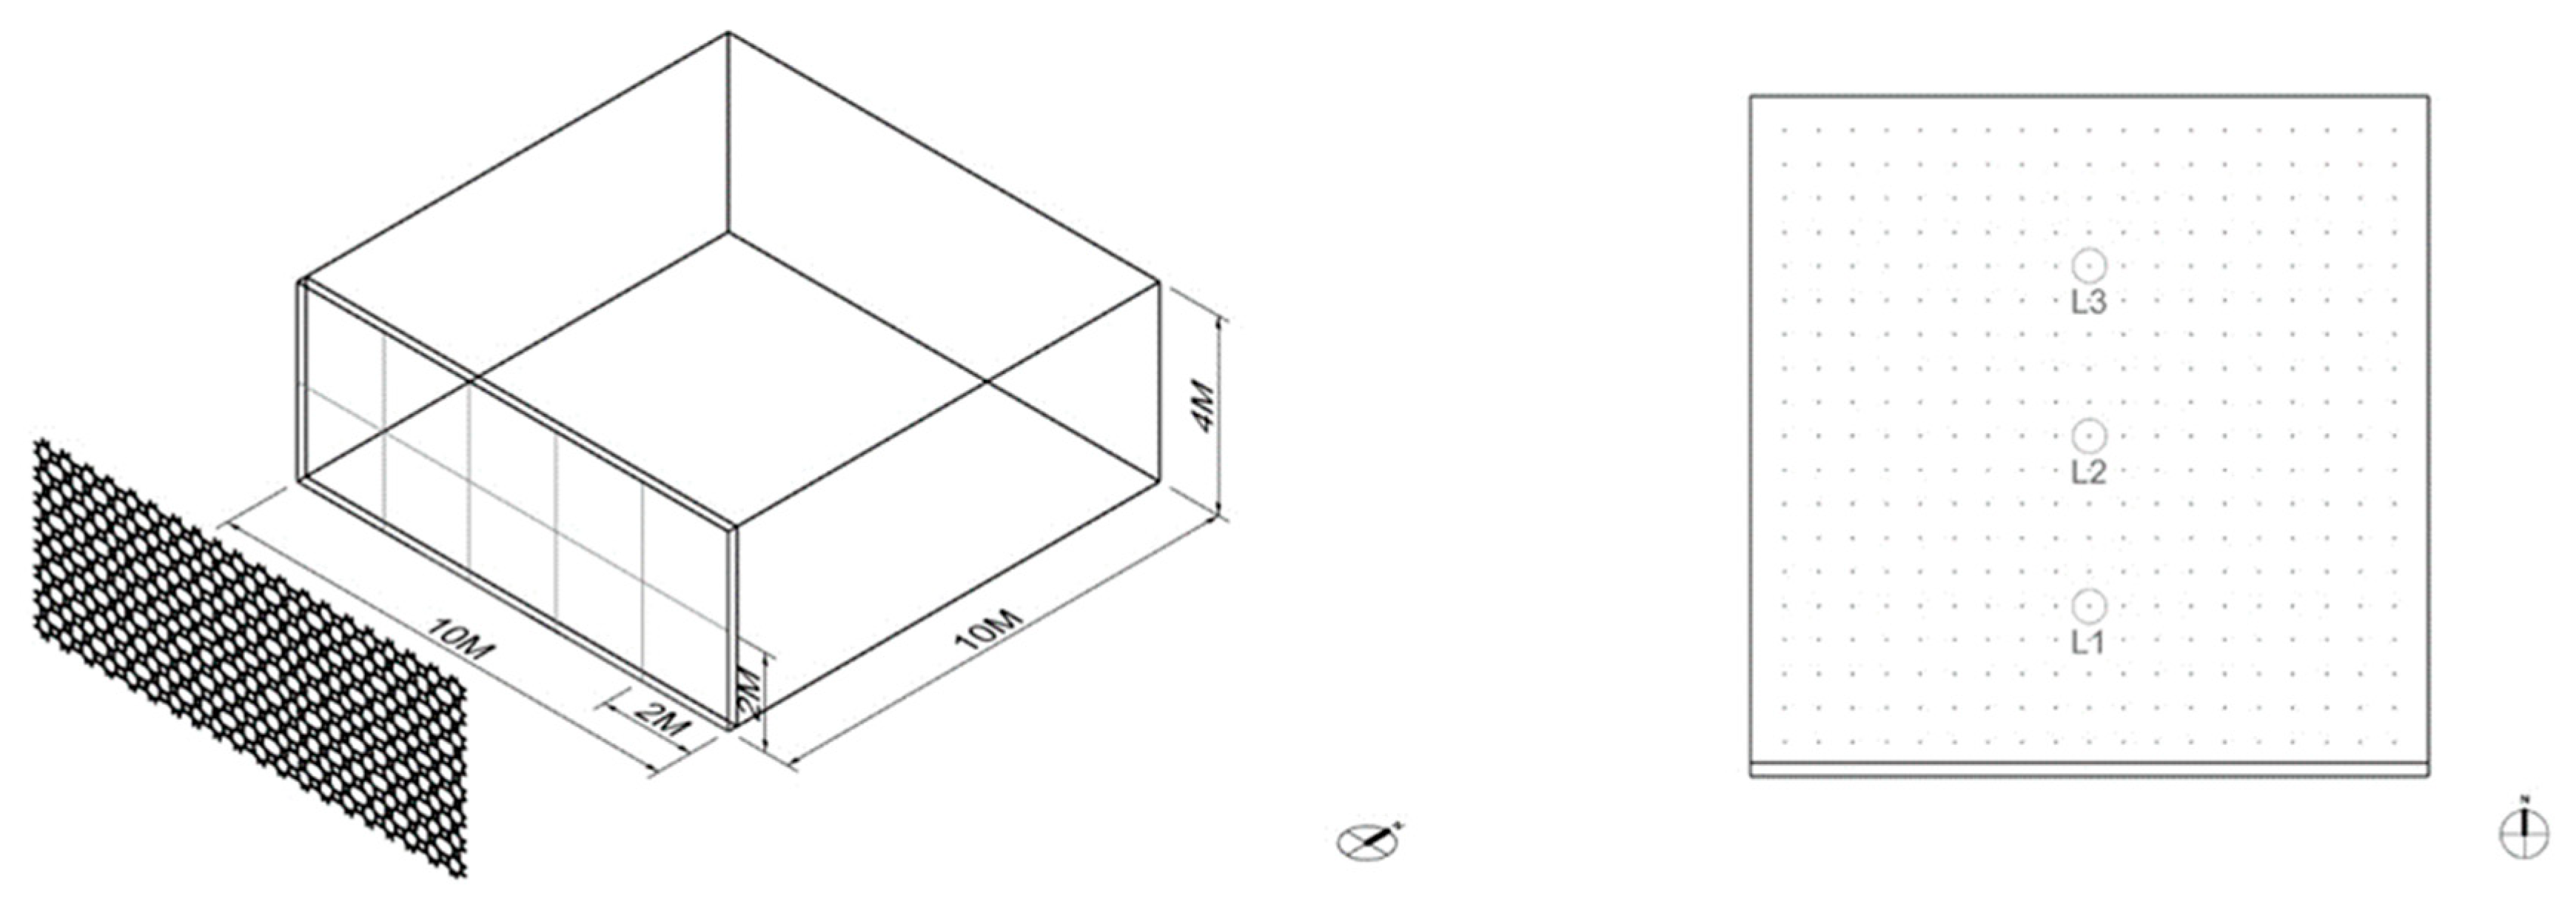
Daylight simulations were conducted using façade patterns generated by GAN models. The test space for this study was an open-plan office type space, located in Seoul, South Korea (37.56° N, 126.97° E). The simulations employed the Seoul EPW weather file (KOR_SO_Seoul.WS.471080_TMYx.2004–2018) under an 8 a.m.–6 p.m. occupancy schedule with Daylight Saving Time (DST). The space has a south-facing window and an external façade system. It is composed of a floor area of 10 m × 10 m with a ceiling height of 4 m; each façade panel is 2 m × 2 m and made of grey aluminium (see Figure 3, left).
The interior materials followed the LM83 standards, which were developed by the Illuminating Engineering Society (IES); these define the metrics for evaluating daylight performance in buildings, with reflectance values of 70% for the ceiling, 50% for the walls, and 20% for the floor. The window glazing was Clear—Solarban 90 (3), with a visible light transmittance (VLT) of 50%, a visible light reflectance (VLR) of 19%, a U-value of 1.63, and a solar heat gain coefficient (SHGC) of 0.33. Daylight simulations were performed using the Climate Studio plug-in for Rhino, to calculate daylight metrics with the grid setting, as shown in Figure 3 right, and Table 1.

3. Results

3.1. Classification of Pattern Features

Hierarchical clustering was applied to assess the similarity between pattern images. In the resulting groupings (Figure 4 and Figure 5), the X-axis represents the images arranged according to clusters, while the Y-axis shows the Euclidean distance between clusters. A cut-off line defines the threshold used to group the data into clusters. Below the dendrograms in Figure 4 and Figure 5, example images corresponding to clusters are displayed.
By applying hierarchical classification, the CNN model grouped the collection of input pattern (IP) image data into distinct classes. For clustering the 664 input training data images, a 35% cut-off threshold was applied. The classification tree was trimmed to preserve 35% of its structure, while grouping similar patterns accordingly. This process resulted in eight distinct categories, organising the images based on their pattern characteristics. As illustrated in Figure 4, which presents the clustering groups and corresponding samples (IP1 to IP8), the input images form two main branches: tightly structured regular patterns (IP1 to IP4) and large irregular patterns (IP5 to IP8). IP4 and IP8 deviate from the main grouping, and it is noticed that the patterns in these groups are less similar in their subdivisions.
The CNN classification of the 5000 images which are the generated pattern (GP) images from StyleGAN3, treated with a 28% cut-off, represents nine categories (see Figure 5). Similar to the abovementioned input data classification case, the clustering of the GP images is divided into two main groups that show regular patterns (GP1 to GP4) and relatively irregular patterns (GP5 to GP9). Figure 6 depicts one of the groupings of subdivisions in the GP7 cluster, which contains similar patterns. The output results, based on training with input data that include available pattern designs, show a varied mix of patterns.
For the implementation of GP images as façade frames, the proportions of black (frame) and white (void) regions were initially quantified. The distribution of pattern feature proportions shows IP and GP values for each percentage range as follows: 0–20% (IP: 20, 3.0%; GP: 12, 0.2%), 20–30% (IP: 52, 7.8%; GP: 307, 6.1%), 30–40% (IP: 102, 15.4%; GP: 844, 16.9%), 40–50% (IP: 137, 20.6%; GP: 1200, 24.0%), 50–60% (IP: 196, 29.5%; GP: 1382, 27.6%), 60–70% (IP: 112, 16.9%; GP: 990, 19.8%), and 70–80% (IP: 45, 6.8%; GP: 265, 5.3%), thus demonstrating that the output GPs closely match the proportional distribution of the input IPs across all ranges. The percentage differences between IP and GP distributions vary between 1.5% and 3.4% throughout the ranges. This shows that, through training, new images were generated that closely correspond to the ratio of the input image numbers.

3.2. Assessment of ASE and sDA Results

To determine the optimal screen façade frame ratio for daylight performance, ASE and sDA simulations were conducted under the conditions specified in Table 1. The percentages of frames corresponding to each pattern were verified. Some of the clustered patterns presenting similar form characteristics, as classified by the aforementioned CNN categorisation, were selected to compare ASE and sDA outcomes. The simulation results demonstrate that both metrics were influenced more significantly by the frame density than by the frame shape. Table 2 provides the simulation visual data, showing two samples selected from clustered patterns for frame ratios ranging from 40% to 80%, at 5% intervals. According to Table 2, the two different features present similar values that differ by less than 2%. In the tables, the simulation visualisations are presented as plan views, with south positioned at the bottom and north at the top.
The results illustrate that, when the simulated frame density exceeds 70%, sDA values significantly decline, and the graphically represented sunlight distribution further indicates that the annual sunlight exposure fails to reach the rear of the room. For the frames above 70% density, the ASE value’s rate of decline nearly doubles, compared to those below this threshold. With respect to the unit of illuminance, the 45% frame exhibits average lux values near 3000, and the values above this percentage remain below 3000.
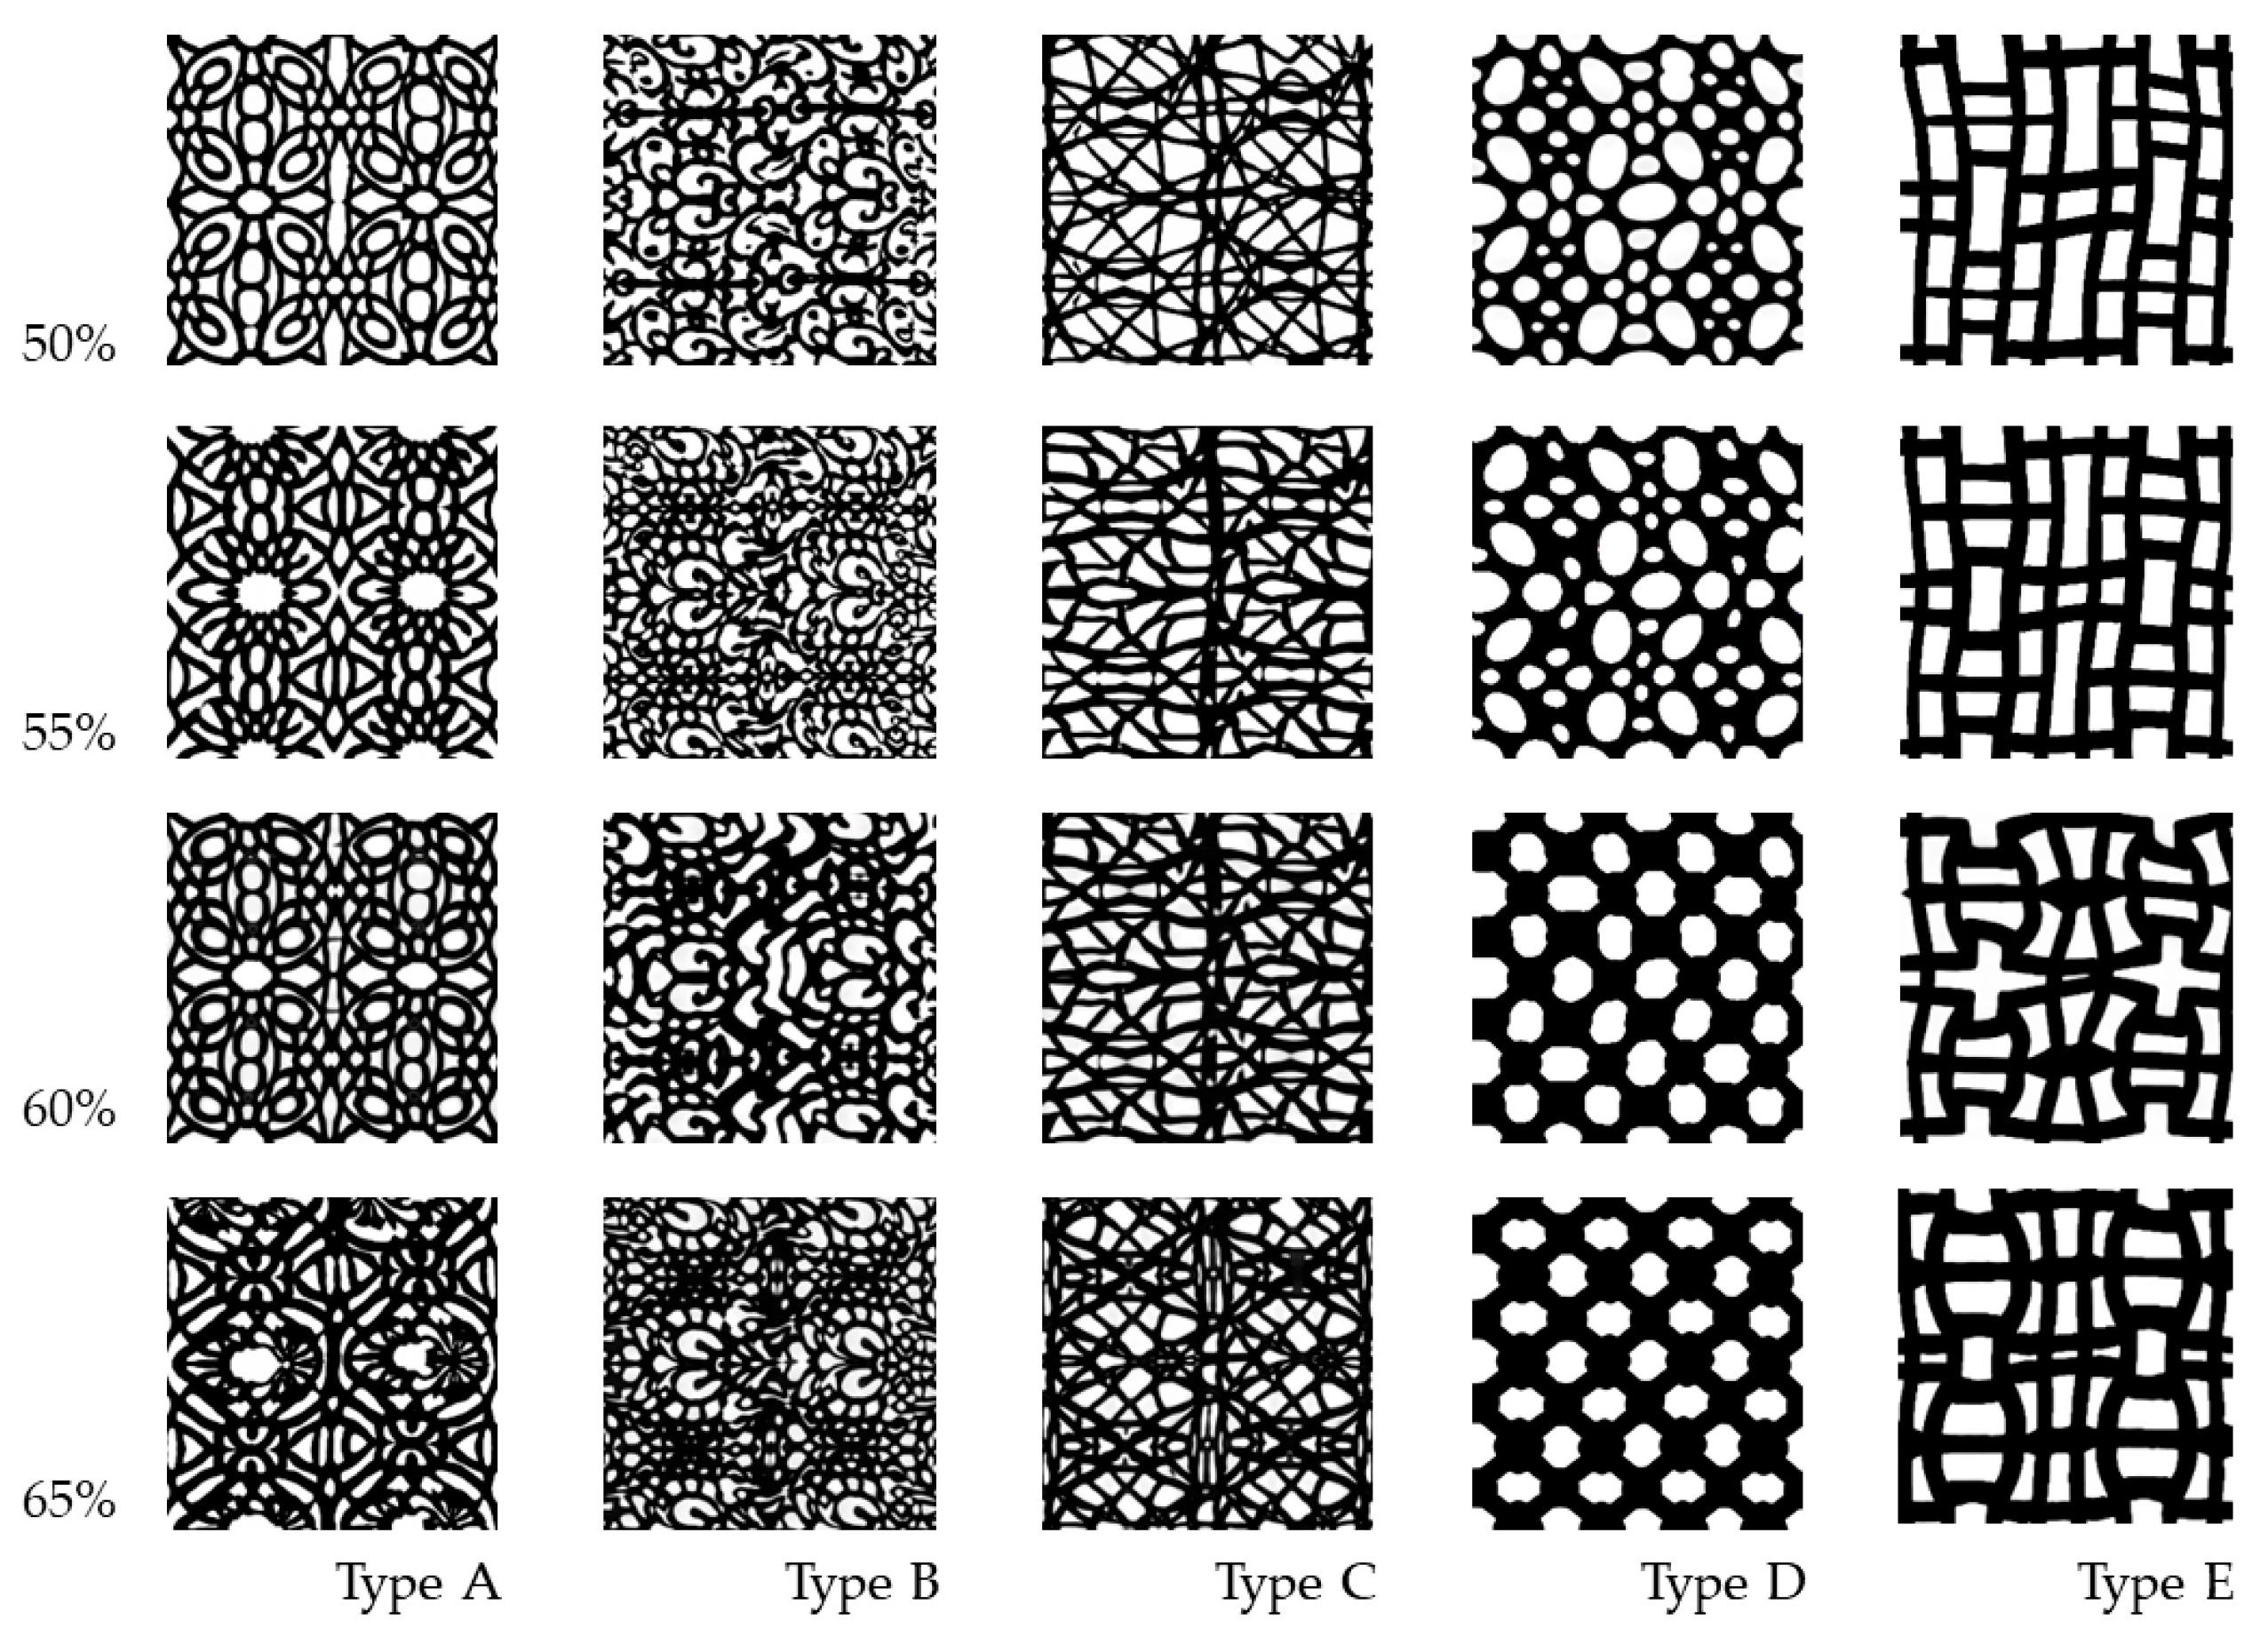
For more detailed simulations using glare effective frame density, the analysis examined the limited percentage of frame densities ranging from 50% to 65%, with clustered similar frame features. Percentages of 40% and 45% were excluded, as they were close to the average lux level of 3000, while 75% and 80% were also excluded, for being near the 70% threshold. Thus, the analysis focused on transmission percentages with detailed comparisons at 50%, 55%, 60%, and 65%. These percentages were tested across five different types of frame features: geometrical, floral, random, circular, and linear patterns, which provide a total of 20 samples (see Figure 7). Precedent studies and design applications frequently reference these patterns as commonly used typologies in screen façade design, which establishes their relevance and validity for architectural analysis and daylight simulation. The specified comparisons focused on glare effects, to ensure the evaluation of visual comfort under differing light transmission conditions.

3.3. Comparison of DGP Effects Simulated Using Five Pattern Types

The DGP simulations were conducted using five distinct pattern features. The annual glare effects were measured at the sensor locations illustrated in Figure 3 (right), and each point includes four directional pie slices. Table 3 presents the measurement data for Type A frames, which show an example of DGP simulation results. In the DGP visualisation (Table 3), the south side is positioned at the bottom. For a comparison of DGP results for all frame types, Figure 8 shows detailed data, including the different levels of glare effects measured at three sensor points.
As presented in Table 3, the total discomfort glare incidence (intolerable and disturbing) without a frame is 25%. When a frame of 50% density is installed, it decreases to 10%. The simulation results for every 5% reduction in frame density result in a corresponding 1% decrease in the uncomfortable glare effects. Additionally, the sDG-5 (spatial daylight glare) metric evaluated discomfort glare potential by analysing the worst 5% of lighting conditions across the entire space. The results demonstrate a reduction from 56% (unframed condition) to 35% (with 50% frame density), with each 5% increase in frame density resulting in approximately a 3% reduction in sDG-5.
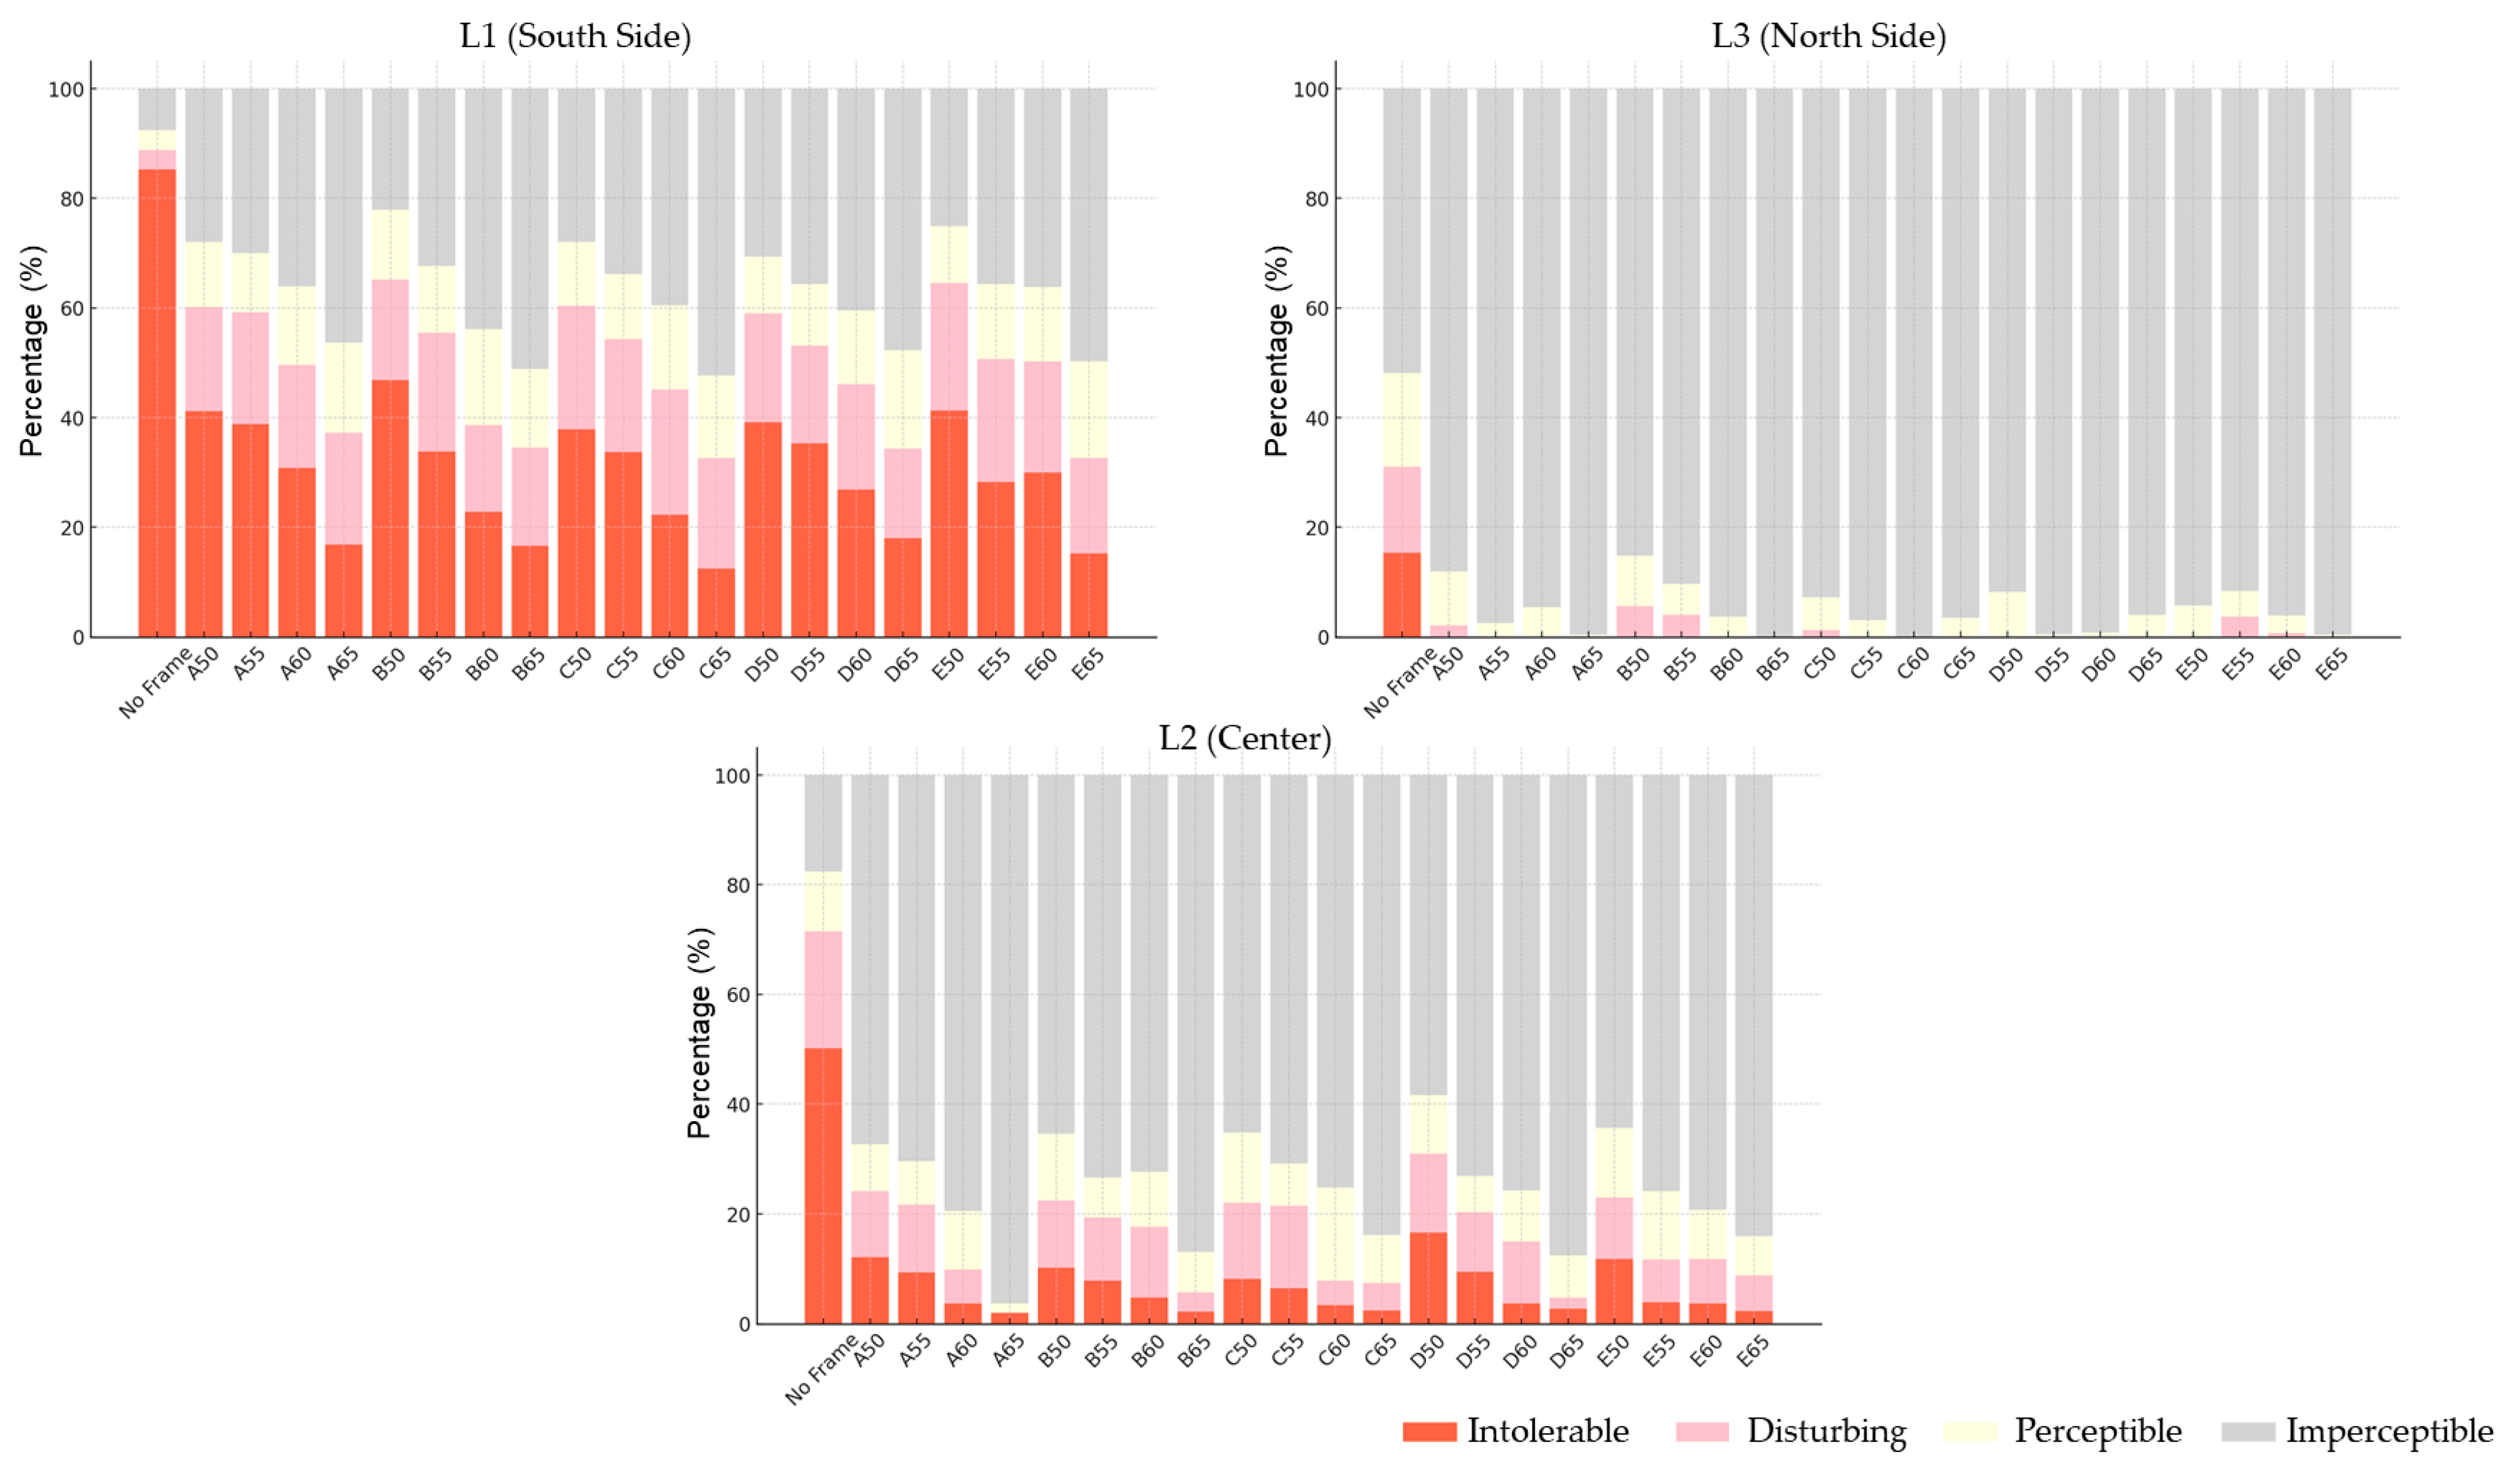
Figure 8 presents stacked column charts comparing five different façade types and their frame densities. In the charts, the letters represent the façade type, and the number indicates the frame density percentage (e.g., A50 refers to Type A with 50% frame density). The DGP metric was assessed at the evaluation points L1, L2, and L3 (as defined in Figure 3), to assess the likelihood of visual discomfort caused by glare. This metric was used to compare glare levels across the three points.
The effectiveness of screen façade frames in reducing visual discomfort is obvious across all three observation points. This effect is more noticeable towards the back of the room, which is probably due to the decreased reach of light reflections. At point L1 (located on the south side, about 2.5 m from the frontage), the intolerable rate is reduced by nearly half when any of the 50% screen façade frames are used, compared to no frame. At this point, the intolerable rate without any screen frame is 85.3%, whereas with 50% framing, it drops to between 37.9% and 46.8%. At point L2, the intolerable rate without a frame is 50.2%, and with 50% frames, it decreases significantly, to between 8.2% and 16.7%. At point L3 (about 2.5 m from the back side), the intolerable rate is 15.4% with no frame, while all 20 types of frames reduce the intolerable rate to 0%. At L3, the imperceptible rate (no detectable glare) is 51.9% without a frame, whereas with the frames, the results range from 85.2% to 100%.
Among the five types tested, there are only minor differences in terms of decreasing the glare effects. At L1, Type B is slightly less effective in reducing glare effects. At L2, Type D is also not very effective, but at L3, Type D shows almost no detectable glare. Although numerical comparisons reveal these variations, the overall rate of glare reduction is not dramatically different across types. However, when comparing 50% and 65% frame density, all types show noticeable reductions in glare effects. In fact, increasing the frame density from 50% to 65% results in more than double the rate of glare reduction.

3.4. Evaluation of Measured Daylight Intensity Levels on March 21 and September 21

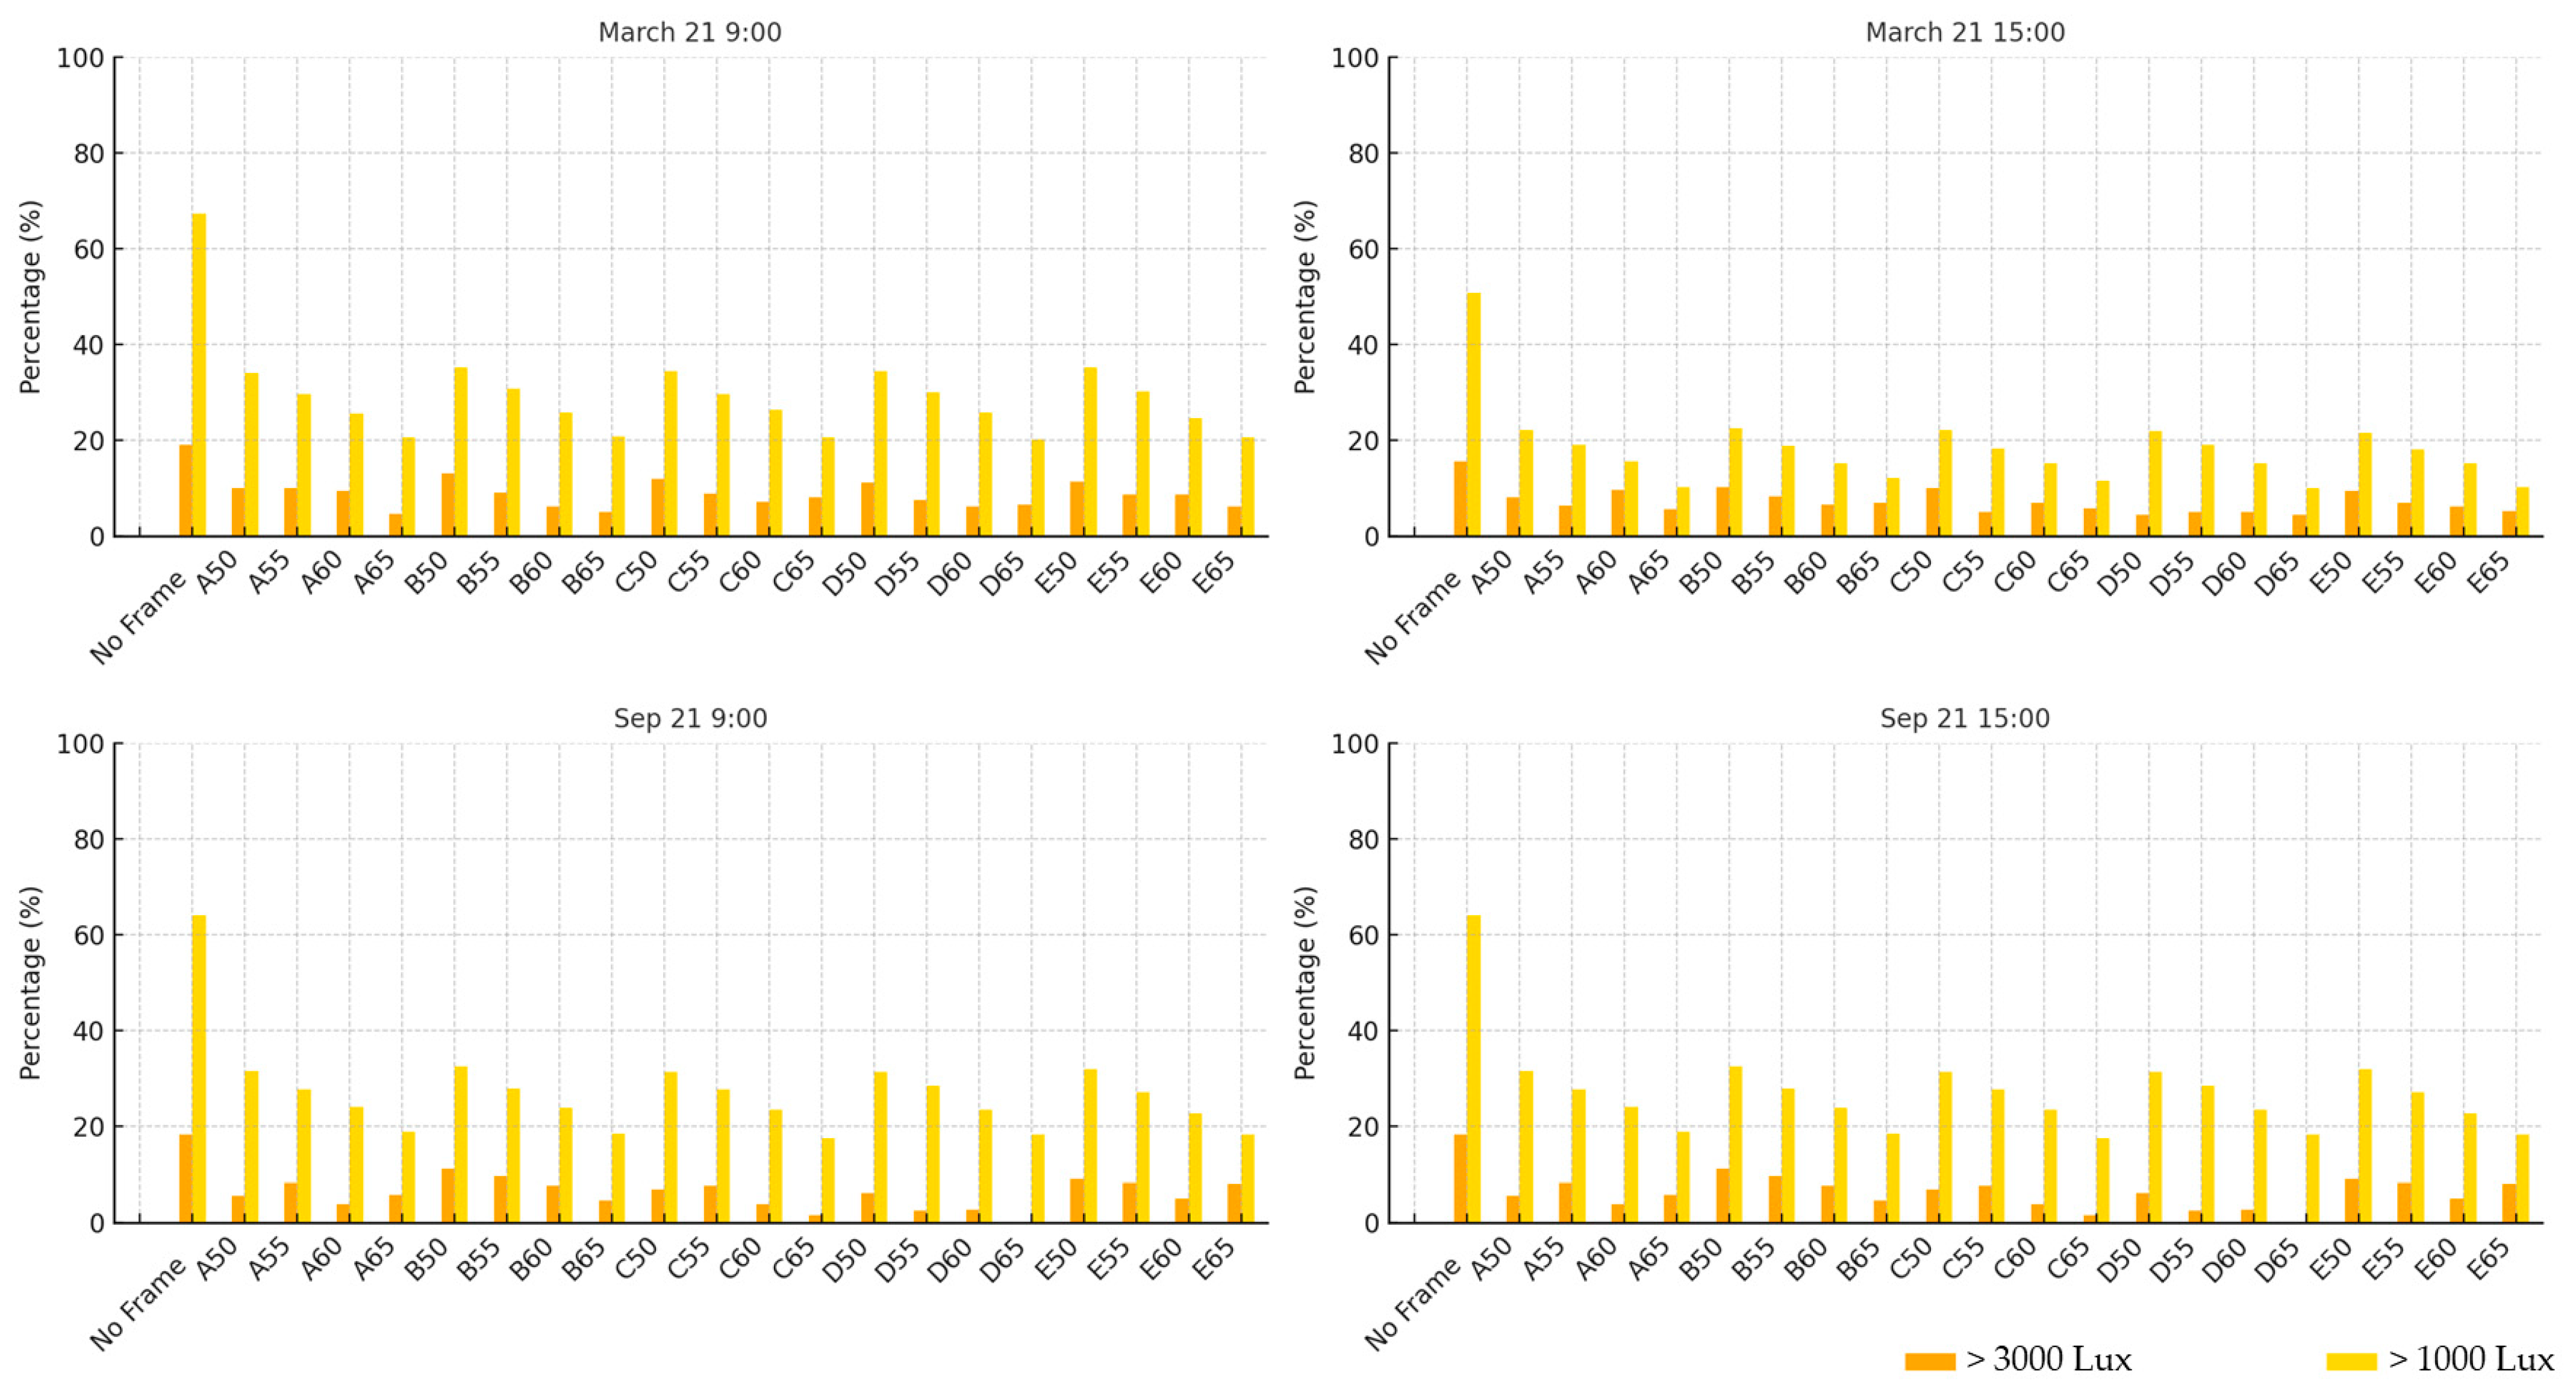
To assess glare discomfort across frame variations, the percentages of areas exceeding the two lux thresholds of 1000 and 3000 were assessed, measured on specified dates in March and September. Two specific dates (21 March and 21 September) offer a moderate condition for evaluating typical daylight performance, without seasonal extremes. Whereas lux levels above 1000 indicate the minimum daylight requirements for typical indoor lighting conditions, those exceeding 3000 specify areas exposed to strong direct sunlight, where glare controls may be necessary to maintain visual comfort. Table 4 shows one of samples using Type A; this includes simulated area illustrations and measured values, categorised at the specific time points. It illustrates the distribution of areas gaining intensive daylight, and the percentage of areas that exceed the two lux thresholds.
As shown in Figure 9, describing the comparison of all variations, the overall result indicates that the percentage of areas above 1000 lux consistently decreases with increasing frame ratios. In contrast, for areas exceeding 3000 lux, some of the values are irregular and not apt to regularly decreasing. The steady decrease in values above 1000 lux is mirrored by a consistent increase in values below 1000 lux, corresponding to the proportional changes in frame ratio. Thus, the front side areas may receive filtered direct sunlight, which affects glare depending on the frame shape, whereas the back areas are relatively less influenced by the differences in frame ratios and features. Variations in frame ratio and shape have trivial impacts on daylight effects in areas to the back of the space. Despite minor differences in values above the 3000 lux level, the measurements recorded on 21 September at 09:00 and 15:00 demonstrate that lower values are mostly associated with Types A and D. Similarly, data from March reveal a tendency of lower values in these types; however, the differences compared to other types are not notable.
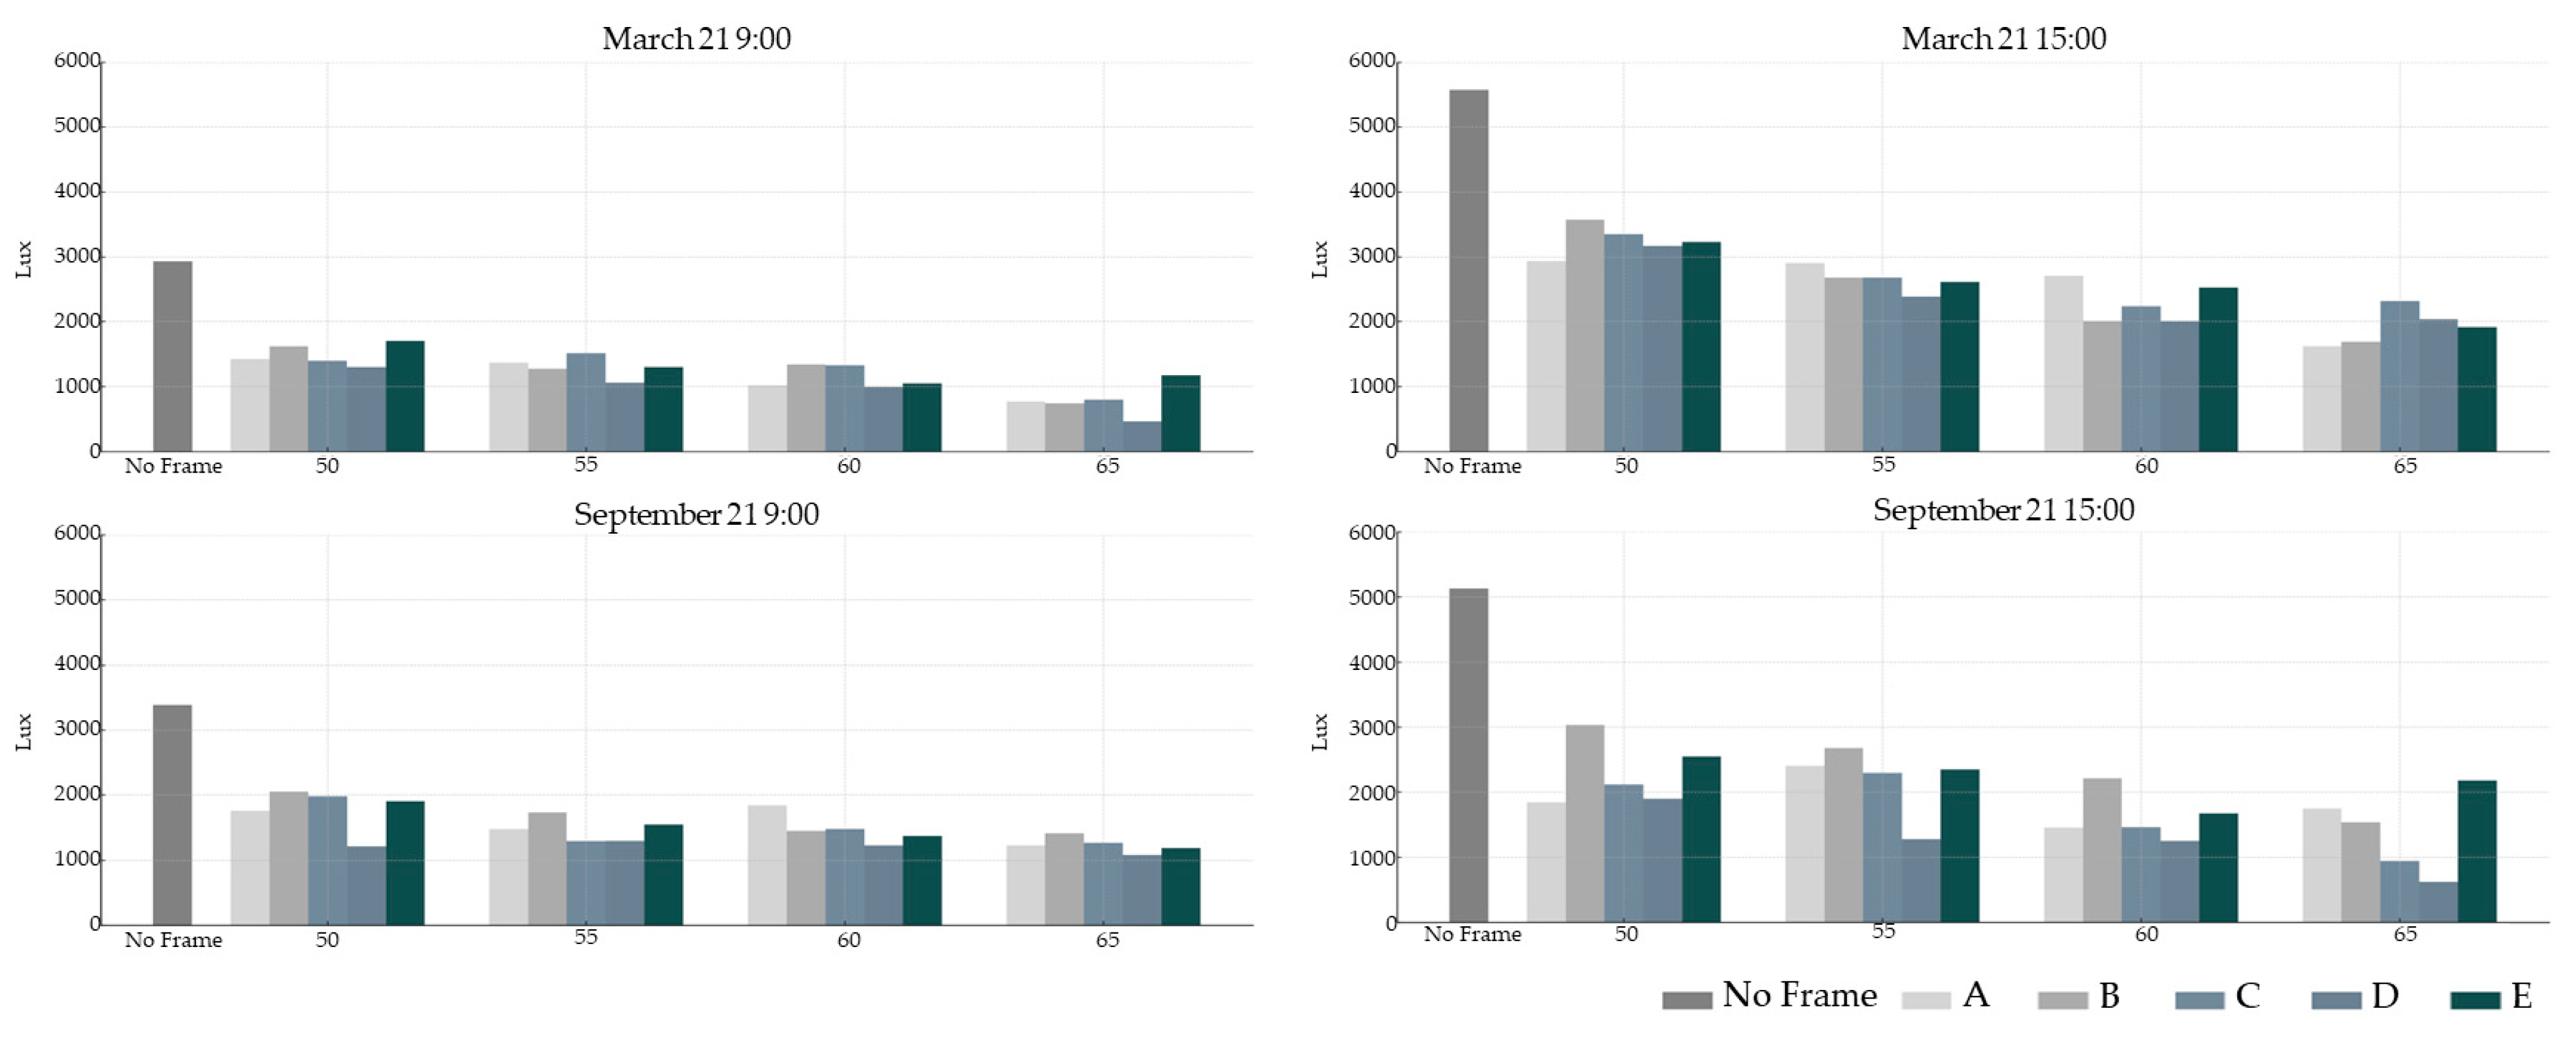
By grouping the same ratio of frames, the compared evaluation of mean values of the types accessed the distribution of intense daylight lux that causes extreme glare discomfort levels (see Figure 10). The comparison of mean values of this daylight simulation may indicate how the dissimilar ranges of min and max values are arranged. The abovementioned simulations illustrate that the lux values in the back side of the room are less influenced than in the front side. High lux values, including some extreme levels, are mostly recorded in the front side. Regarding the mean value measurement, the more extreme high values there are, the higher the mean value results. This can help to evaluate the uniformity of daylight scattering. According to this assessment, some of the Type A and D values are slightly lower, but not noticeably different. However, the mean values of Type B and E are mostly high, which suggests that more high daylight intensities are gained in the front side when projecting some frame figures and ratios in the two types.
For the 21 September, 15:00 dataset, Type E exhibits notably higher values compared to the other types. This may be caused by the frame features, which are linear-based figures with large voids or open portions, and may lead to elevated lux measurements, thus directly influencing the mean value in the graph. Moreover, Type A (a geometrically repeated shape with a very dense frame) and Type D (a circular-based shape with relatively large voids) show only minimal impact on the mean values. Thus, the differences in those mean values are too marginal to be considered practically significant. Type E demonstrates high mean lux values, which represent more glare discomfort areas, and it requires higher effectiveness for sunlight filtering control. This performance is attributable to the generated design of relatively large open parts, which allow more intense light transmission.
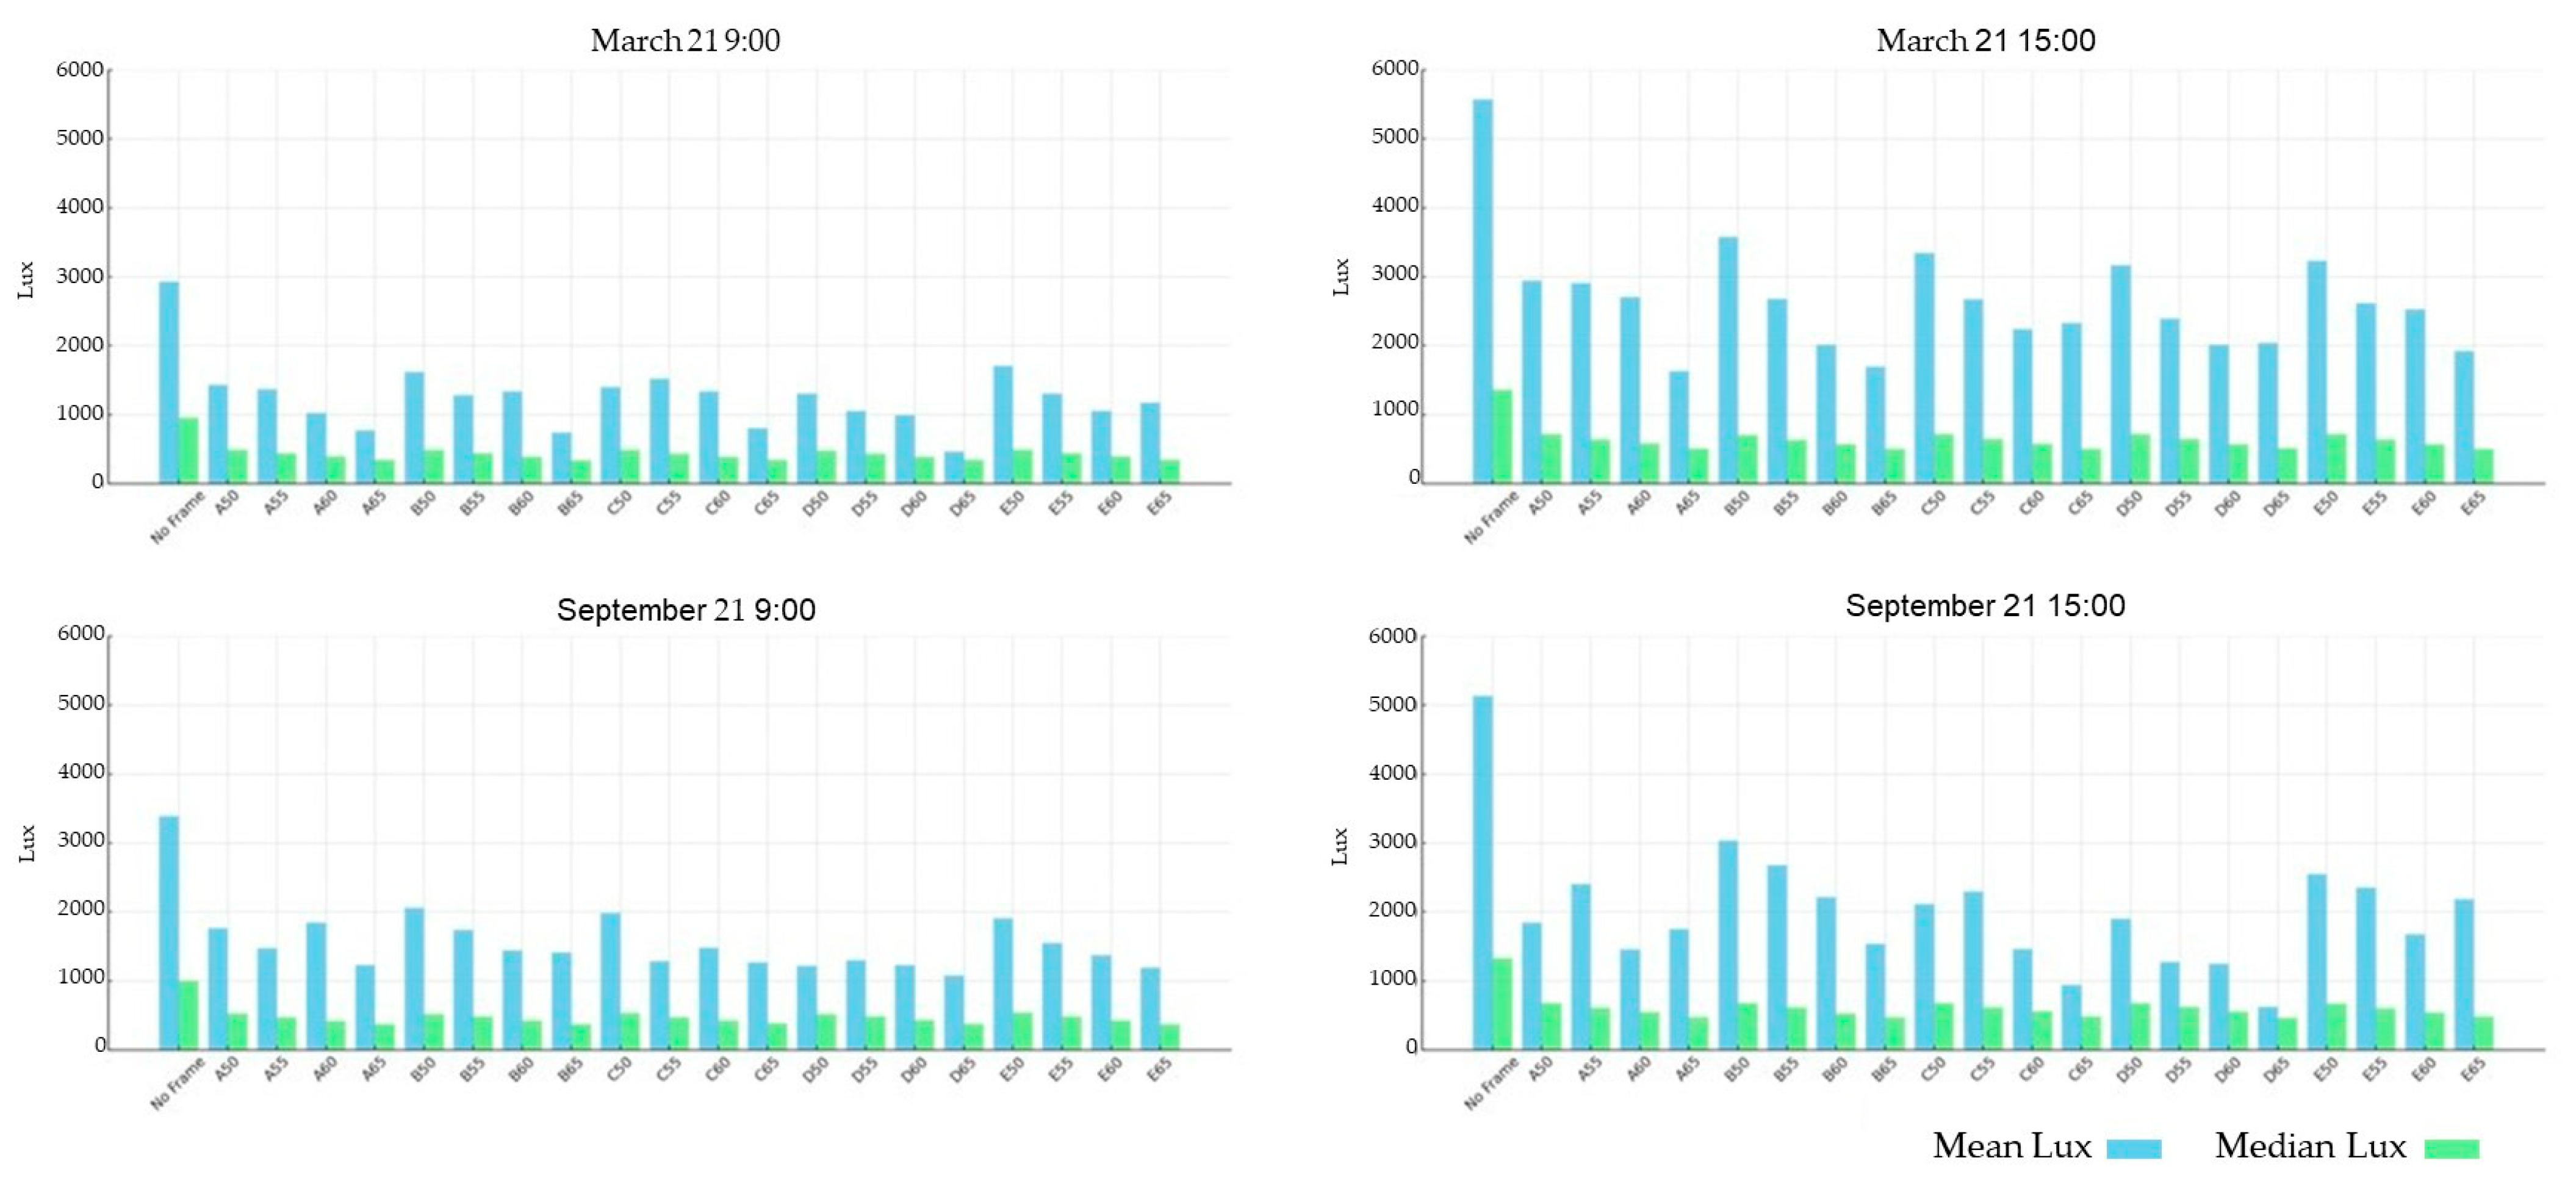
As shown in Figure 11, which compares the mean and median values, the latter consistently decrease with the frame ratio. Estimation of median values provides a measure of central tendency that is less influenced by extreme values, compared to the mean values. The tendency of consistently decreasing median values, and the irregular variations in mean values corresponding to decreasing frame ratios, indicate that certain front areas experience extreme lux values depending on frame configurations. A comparison of the mean and median values demonstrates that the areas exposed to daylight ingress are still affected by direct sunlight. Nevertheless, the research shows that frames can help to reduce the extent of interior areas exposed to intensive daylight ingress.

4. Conclusions

The generated outputs, produced by blending input images containing typical pattern examples, provided an increased variety of variations for testing simulations of similar configurations with different frame ratios. It was noticed that the generated results were highly dependent on the diversity of the training dataset. The CNN-based classification of IP and GP images confirmed that the classes and volume of the augmented output data closely corresponded to the types and similar patterns present in the original inputs. The learning processes in the StyleGAN3 model enabled new images to be generated, even with a small number of training datasets. However, the unsupervised processes used in generating the output features pose challenges for their direct application in façade design.
On the basis of the augmented pattern feature set, this investigation identified effective patterns for a south-facing test space under environmental conditions in South Korea. The evaluation of frame ratios, ranging from 40% to 80%, showed that frame shapes had little significant effect on the ASE and sDA metrics. The annual sunlight analyses of sDA demonstrated that at frame ratios above 70%, daylight ingress reaching to the rear areas was measurably reduced, and for frame ratios below 45%, the filtering effect maintained average light levels at below 3000 lux. The annual daylight simulation results showed that screen façade patterns with frame ratios of 50–65% managed daylight ingress to reduce the extent of areas exposed to intensive glare while maintaining the minimum required lighting conditions. Within the range of 50–65%, illuminance level tests for DGP with five different patterns demonstrated that regularly repeated pattern designs produced a slight improvement in glare comfort. The rear area in the 10 m × 10 m space was minimally affected by daylight in the simulation. Screen façade systems remain effective in reducing the extent of glare discomfort areas adjacent to the façade.
The annual-based simulations indicate that the tendency of decreasing daylight effects with decreasing frame ratios is consistent. However, simulations conducted at specific times show that different frame shapes can irregularly influence the mean values depending on their configurations. Through the comparison of numerical results, this study demonstrates the daylight-control effectiveness of both frame ratios and types. While the research focuses on a single factor, pattern density, in relation to visual comfort, multiple factors, such as material properties and spatial layout, contribute to further details of screen façade performance. Incorporating these additional factors in future studies is expected to provide a comprehensive evaluation of the effectiveness of screen façades.

Author Contributions

Conceptualization, H.N.; methodology, H.N. and D.Y.P.; software, H.N.; validation, H.N. and D.Y.P.; formal analysis, H.N.; investigation, H.N.; resources, H.N. and D.Y.P.; data curation, H.N.; writing—original draft preparation, H.N.; writing—review and editing, H.N. and D.Y.P.; visualisation, H.N. All authors have read and agreed to the published version of the manuscript.

Funding

This research received no external funding.

Data Availability Statement

The original contributions presented in this study are included in the article. Further inquiries can be directed to the corresponding author.

Conflicts of Interest

The authors declare no conflicts of interest.

Abbreviations

The following abbreviations are used in this manuscript:
AI Artificial intelligence
GANsGenerative adversarial networks
ML Machine learning
CNNsConvolutional neural networks
sDASpatial daylight autonomy
ASEAnnual sunlight exposure
DGPDaylight glare probability
sDGSpatial daylight glare
IPInput pattern
GPGenerated pattern

References

  1. Simpson, J.A. Oxford English Dictionary, 2nd ed.; Oxford University Press: Oxford, UK, 1989; p. 728. [Google Scholar]
  2. Moghtadernejad, S.; Mirza, M.S.; Chouinard, L.E. Façade design stages: Issues and considerations. J. Archit. Eng. 2018, 25, 04018033. [Google Scholar] [CrossRef]
  3. Bianchi, S.; Andriotis, C.; Klein, T.; Overend, M. Multi-criteria design methods in façade engineering: State-of-the-art and future trends. Build. Environ. 2024, 250, 111184. [Google Scholar] [CrossRef]
  4. Hoces, A.P.; Oldenhave, M. What makes a façade beautiful? J. Facade Des. Eng. 2021, 9, 21–46. [Google Scholar] [CrossRef]
  5. Moscoso, C.; Chamilothori, K.; Wienold, J.; Andersen, M.; Matusiak, B. Regional differences in the perception of daylit scenes across Europe using virtual reality. Part I: Effects of window size. LEUKOS 2021, 18, 294–315. [Google Scholar] [CrossRef]
  6. Emami, N.; Giles, H. Geometric patterns, light and shade: Quantifying aperture ratio and pattern resolution in the performance of shading screens. Nexus Netw. J. 2016, 18, 197–222. [Google Scholar] [CrossRef]
  7. Chi, D.A.; Moreno, D.; Navarro, J. Design optimisation of perforated solar façades in order to balance daylighting with thermal performance. Build. Environ. 2017, 125, 383–400. [Google Scholar] [CrossRef]
  8. Dastoum, M.; Guevara, C.S.; Arranz, B. Efficient daylighting and thermal performance through tessellation of geometric patterns in building façade: A systematic review. Energy Sustain. Dev. 2024, 83, 101563. [Google Scholar] [CrossRef]
  9. Li, S.; Liu, L.; Peng, C. A review of performance-oriented architectural design and optimization in the context of sustainability: Dividends and challenges. Sustainability 2020, 12, 1427. [Google Scholar] [CrossRef]
  10. Zheng, H.; Yuan, P.F. A generative architectural and urban design method through artificial neural networks. Build. Environ. 2021, 205, 108178. [Google Scholar] [CrossRef]
  11. Özerol, G.; Selçuk, S.A. Machine learning in the discipline of architecture: A review on the research trends between 2014 and 2020. Int. J. Archit. Comput. 2022, 21, 23–41. [Google Scholar] [CrossRef]
  12. Demir, G.; Çekmiş, A.; Yeşilkaynak, V.B.; Unal, G. Detecting visual design principles in art and architecture through deep convolutional neural networks. Autom. Constr. 2021, 130, 103826. [Google Scholar] [CrossRef]
  13. Shan, R.; Junghans, L. Multi-objective optimization for high-performance building façade design: A systematic literature review. Sustainability 2023, 15, 15596. [Google Scholar] [CrossRef]
  14. Jiang, F.; Ma, J.; Webster, C.J.; Chiaradia, A.J.; Zhou, Y.; Zhao, Z.; Zhang, X. Generative urban design: A systematic review on problem formulation, design generation, and decision-making. Prog. Plann. 2023, 180, 100795. [Google Scholar] [CrossRef]
  15. Pena, M.L.C.; Carballal, A.; Rodríguez-Fernández, N.; Santos, I.; Romero, J. Artificial intelligence applied to conceptual design: A review of its use in architecture. Autom. Constr. 2021, 124, 103550. [Google Scholar] [CrossRef]
  16. Wu, A.N.; Stouffs, R.; Biljecki, F. Generative adversarial networks in the built environment: A comprehensive review of the application of GANs across data types and scales. Build. Environ. 2022, 223, 109477. [Google Scholar] [CrossRef]
  17. Goodfellow, I.; Pouget-Abadie, J.; Mirza, M.; Xu, B.; Warde-Farley, D.; Ozair, S.; Courville, A.; Bengio, Y. Generative adversarial nets. arXiv 2014, arXiv:1406.2661. [Google Scholar] [CrossRef]
  18. Oh, S.; Jung, Y.; Kim, S.; Lee, I.; Kang, N. Deep generative design: Integration of topology optimization and generative models. J. Mech. Des. 2019, 141, 111405. [Google Scholar] [CrossRef]
  19. Zhang, T.; Tilke, P.; Dupont, E.; Zhu, L.; Liang, L.; Bailey, W. Generating geologically realistic 3D reservoir facies models using deep learning of sedimentary architecture with generative adversarial networks. Pet. Sci. 2019, 16, 541–549. [Google Scholar] [CrossRef]
  20. Radford, A.; Metz, L.; Chintala, S. Unsupervised representation learning with deep convolutional generative adversarial networks. arXiv 2015, arXiv:1511.06434. [Google Scholar] [CrossRef]
  21. Arjovsky, M.; Chintala, S.; Bottou, L. Wasserstein GAN. arXiv 2017, arXiv:1701.07875. [Google Scholar] [CrossRef]
  22. Karras, T.; Laine, S.; Aila, T. A style-based generator architecture for generative adversarial networks. arXiv 2018, arXiv:1812.04948. [Google Scholar] [CrossRef]
  23. Isola, P.; Zhu, J.; Zhou, T.; Efros, A.A. Image-to-image translation with conditional adversarial networks. arXiv 2016, arXiv:1611.07004. [Google Scholar] [CrossRef]
  24. Zhu, J.; Park, T.; Isola, P.; Efros, A.A. Unpaired image-to-image translation using cycle-consistent adversarial networks. arXiv 2017, arXiv:1703.10593. [Google Scholar] [CrossRef]
  25. Xu, T.; Zhang, P.; Huang, Q.; Zhang, H.; Gan, Z.; Huang, X.; He, X. AttnGAN: Fine-grained text to image generation with attentional generative adversarial networks. arXiv 2017, arXiv:1711.10485. [Google Scholar] [CrossRef]
  26. Wang, H.; Wang, J.; Wang, J.; Zhao, M.; Zhang, W.; Zhang, F.; Xie, X.; Guo, M. GraphGAN: Graph representation learning with generative adversarial nets. arXiv 2017, arXiv:1711.08267. [Google Scholar] [CrossRef]
  27. Nauata, N.; Chang, K.; Cheng, C.; Mori, G.; Furukawa, Y. House-GAN: Relational generative adversarial networks for graph-constrained house layout generation. arXiv 2020, arXiv:2003.06988. [Google Scholar] [CrossRef]
  28. Tang, H.; Zhang, Z.; Shi, H.; Li, B.; Shao, L.; Sebe, N.; Timofte, R.; Luc, V.G. Graph transformer GANs for graph-constrained house generation. arXiv 2023, arXiv:2303.08225. [Google Scholar] [CrossRef]
  29. Qian, Y.; Zhang, H.; Furukawa, Y. Roof-GAN: Learning to generate roof geometry and relations for residential houses. arXiv 2020, arXiv:2012.09340. [Google Scholar] [CrossRef]
  30. Chang, K.; Cheng, C.; Luo, J.; Murata, S.; Nourbakhsh, M.; Tsuji, Y. Building-GAN: Graph-conditioned architectural volumetric design generation. arXiv 2021, arXiv:2104.13316. [Google Scholar] [CrossRef]
  31. Wu, J.; Zhang, C.; Xue, T.; Freeman, W.T.; Tenenbaum, J.B. Learning a probabilistic latent space of object shapes via 3D generative-adversarial modeling. arXiv 2016, arXiv:1610.07584. [Google Scholar] [CrossRef]
  32. Parente, J.; Rodrigues, E.; Rangel, B.; Martins, J.P. Integration of convolutional and adversarial networks into building design: A review. J. Build. Eng. 2023, 76, 107155. [Google Scholar] [CrossRef]
  33. Premier, A. Solar shading devices integrating smart materials: An overview of projects, prototypes and products for advanced façade design. Archit. Sci. Rev. 2019, 62, 455–465. [Google Scholar] [CrossRef]
  34. Hazbei, M.; Rafati, N.; Kharma, N.; Eicker, U. Optimizing architectural multi-dimensional forms; a hybrid approach integrating approximate evolutionary search, clustering and local optimization. Energy Build. 2024, 318, 114460. [Google Scholar] [CrossRef]
  35. Wienold, J.; Kuhn, T.E.; Christoffersen, J.; Andersen, M. Annual glare evaluation for fabrics. In Proceedings of the PLEA 2017 Conference, Edinburgh, UK, 3–5 July 2017; Available online: https://www.researchgate.net/publication/329538959 (accessed on 8 November 2025).
  36. Rafati, N.; Hazbei, M.; Eicker, U. Louver configuration comparison in three Canadian cities utilizing NSGA-II. Build. Environ. 2023, 229, 109939. [Google Scholar] [CrossRef]
  37. Srisamranrungruang, T.; Hiyama, K. Balancing of natural ventilation, daylight, thermal effect for a building with double-skin perforated facade (DSPF). Energy Build. 2020, 210, 109765. [Google Scholar] [CrossRef]
  38. Srisamranrungruang, T.; Hiyama, K. Correlations between building performances and design parameters of double-skin facade utilizing perforated screen. Jpn. Archit. Rev. 2021, 4, 537–550. [Google Scholar] [CrossRef]
  39. Abdelhamid, Y.M.S.; Wahba, S.M.; ElHusseiny, M. The Effect of Parametric Patterned Façade Variations on Daylight Quality, Visual Comfort, and Daylight Performance in Architecture Studio-Based Tutoring. J. Daylighting 2023, 10, 173–191. [Google Scholar] [CrossRef]
  40. Lin, C.-H.; Tsay, Y.-S. A metamodel based on intermediary features for daylight performance prediction of façade design. Build. Environ. 2021, 206, 108371. [Google Scholar] [CrossRef]
  41. Nourkojouri, H.; Zomorodian, Z.S.; Tahsildoost, M.; Shaghaghian, Z. A machine-learning framework for daylight and visual comfort assessment in early design stages. In Proceedings of the Building Simulation 2021: 17th Conference of IBPSA, Bruges, Belgium, 1–3 September 2021; pp. 1268–1275. [Google Scholar] [CrossRef]
  42. Li, X.; Yuan, Y.; Liu, G.; Han, Z.; Stouffs, R. A predictive model for daylight performance based on multimodal generative adversarial networks at the early design stage. Energy Build. 2024, 305, 113876. [Google Scholar] [CrossRef]
  43. Lu, Y.; Wu, W.; Geng, X.; Liu, Y.; Zheng, H.; Hou, M. Multi-Objective Optimization of Building Environmental Performance: An Integrated Parametric Design Method Based on Machine Learning Approaches. Energies 2022, 15, 7031. [Google Scholar] [CrossRef]
  44. Yu, Q.; Malaeb, J.; Ma, W. Architectural facade recognition and generation through generative adversarial networks. In Proceedings of the 2020 International Conference on Big Data & Artificial Intelligence & Software Engineering (ICBASE), Chengdu, China, 23–25 October 2020; IEEE: New York, NY, USA, 2020; pp. 310–316. [Google Scholar] [CrossRef]
  45. Chen, F.; Mai, M.; Huang, X.; Li, Y. Enhancing the sustainability of AI technology in architectural design: Improving the matching accuracy of Chinese-style buildings. Sustainability 2024, 16, 8414. [Google Scholar] [CrossRef]
  46. Sun, C.; Zhou, Y.; Han, Y. Automatic generation of architecture facade for historical urban renovation using generative adversarial network. Build. Environ. 2022, 212, 108781. [Google Scholar] [CrossRef]
  47. Zhang, J.; Fukuda, T.; Yabuki, N. Automatic object removal with obstructed façades completion using semantic segmentation and generative adversarial inpainting. IEEE Access 2021, 9, 117486–117495. [Google Scholar] [CrossRef]
  48. Hu, H.; Liang, X.; Ding, Y.; Yuan, X.; Shang, Q.; Xu, B.; Ge, X.; Chen, M.; Zhong, R.; Zhu, Q. Semi-supervised adversarial recognition of refined window structures for inverse procedural façade modelling. ISPRS J. Photogramm. Remote Sens. 2022, 192, 215–231. [Google Scholar] [CrossRef]
  49. Kelly, T.; Guerrero, P.; Steed, A.; Wonka, P.; Mitra, N.J. FrankenGAN. ACM Trans. Graph. 2018, 37, 1–14. [Google Scholar] [CrossRef]
  50. Du, Z.; Shen, H.; Li, X.; Wang, M. 3D building fabrication with geometry and texture coordination via hybrid GAN. J. Ambient Intell. Humaniz. Comput. 2020, 13, 5177–5188. [Google Scholar] [CrossRef]
  51. Alhichri, H.; Bazi, Y.; Alajlan, N.; Bin Jdira, B. Helping the Visually Impaired See via Image Multi-labeling Based on SqueezeNet CNN. Appl. Sci. 2019, 9, 4656. [Google Scholar] [CrossRef]
  52. Bhatt, D.; Patel, C.; Talsania, H.; Patel, J.; Vaghela, R.; Pandya, S.; Modi, K.; Ghayvat, H. CNN Variants for Computer Vision: History, Architecture, Application, Challenges and Future Scope. Electronics 2021, 10, 2470. [Google Scholar] [CrossRef]
  53. Al-Saffar, A.A.M.; Tao, H.; Talab, M.A. Review of Deep Convolution Neural Network in Image Classification. In Proceedings of the 2017 International Conference on Radar, Antenna, Microwave, Electronics, and Telecommunications (ICRAMET), Kuala Lumpur, Malaysia, 3–5 July 2017; IEEE: Piscataway, NJ, USA, 2017; pp. 1–5. [Google Scholar] [CrossRef]
  54. U.S. Green Building Council. LEED v4 for Building Design and Construction (BD+C); Updated 2 July 2018; U.S. Green Building Council: Washington, DC, USA, 2018; Available online: https://www.usgbc.org/resources/leed-v4-building-design-and-construction-current-version (accessed on 8 November 2025).
  55. Illuminating Engineering Society (IES). IES Spatial Daylight Autonomy (sDA) and Annual Sunlight Exposure (ASE)—Approved Method; IES: New York, NY, USA, 2012; Available online: https://www.ies.org/standards (accessed on 8 November 2025).
  56. Ayoub, M. A Review on Machine Learning Algorithms to Predict Daylighting inside Buildings. Sol. Energy 2020, 202, 249–275. [Google Scholar] [CrossRef]
  57. Wienold, J.; Christoffersen, J. Evaluation methods and development of a new glare prediction model for daylight environments with the use of CCD cameras. Energy Build. 2006, 38, 743–757. [Google Scholar] [CrossRef]
  58. Reinhart, C.F.; Wienold, J. The daylighting dashboard: A simulation-based design analysis for daylit spaces. Build. Environ. 2011, 46, 386–396. [Google Scholar] [CrossRef]
  59. McNeil, A.; Burrell, G. Applicability of DGP and DGI for Evaluating Glare in a Brightly Daylit Space. In Proceedings of the ASHRAE & IBPSA-USA SimBuild 2016: Building Performance Modeling Conference, Salt Lake City, UT, USA, 10–12 August 2016; pp. 57–64. Available online: https://publications.ibpsa.org/conference/paper/?id=simbuild2016_C008 (accessed on 8 November 2025).
  60. Lu, S.; Tzempelikos, A. Comparison of Simulation Methods for Glare Risk Assessment with Roller Shades. Buildings 2024, 14, 1773. [Google Scholar] [CrossRef]
  61. EN 17037:2018; Daylight in Buildings. European Committee for Standardization (CEN): Brussels, Belgium, 2018.
  62. Hraška, J.; Čurpek, J. The practical implications of the EN 17037 minimum target daylight factor for building design and urban daylight in several European countries. Heliyon 2023, 10, e23297. [Google Scholar] [CrossRef] [PubMed]
Figure 1. Workflow of the research process.
Buildings 15 04056 g001
Figure 2. Framework of GAN process.
Buildings 15 04056 g002
Figure 3. Simulation space dimension (left) and DGP sensor locations (right).
Buildings 15 04056 g003
Figure 4. Hierarchical classification of input pattern features of 664 images grouped by 35% cut-off (8 categories).
Buildings 15 04056 g004
Figure 5. Hierarchical classification of generated pattern features of 5000 images grouped by 28% cut-off (9 categories).
Buildings 15 04056 g005
Figure 6. Samples of classified pattern features in a clustered group of a subcategory in G7.
Buildings 15 04056 g006
Figure 7. Classified variations in pattern for the simulation of daylight. Five types: geometrical (A), floral (B), random (C), circular (D), linear patterns (E).
Buildings 15 04056 g007
Figure 8. Comparison of glare effects for five screen façade types: results for south (L1), centre (L2), and north (L3) zones, showing Intolerable, Disturbing, Perceptible, and Imperceptible glare categories.
Buildings 15 04056 g008
Figure 9. Comparison of area percentages exceeding 1000 lux and 3000 lux thresholds on 21 March and 21 September, according to frame variations.
Buildings 15 04056 g009
Figure 10. Assessment of mean lux values on 21 March and 21 September, arranged by the same proportions of frame variations.
Buildings 15 04056 g010
Figure 11. Comparison of the mean and median values on 21 March and 21 September for different frame configurations.
Buildings 15 04056 g011
Table 1. Simulation space input parameters.
Simulation ConditionsInput Parameters
Location DataSeoul, South Korea (latitude 37.56° N, longitude 126.97° E)
KOR_SO_Seoul.WS.471080_TMYx.2004–2018
Occupancy Schedule8 a.m.–6 p.m. with DST
Space Dimensions (m)Floor: 10 m × 10 m, Height: 4 m
Interior MaterialsCeiling: LM83 (VLR: 70%), Wall: LM83 (VLR: 50%), Floor: LM83 (VLR: 20%)
Window Glass TypeClear—Solarban 90 (3) (VLT: 50%, VLR: 19%, UVal: 1.63, SHGC: 0.33)
Window OrientationSouth Side
Total Window Area40 m2
Façade Panel Dimensions2 m × 2 m
Façade Panel MaterialGrey Aluminium Façade (VLR: 37%)
Daylight Availability GridSensor Spacing: 0.5 m, Work-plane Offset: 0.76 m
Point-in-time Illuminance GridSensor Spacing: 0.5 m, Work-plane Offset: 0.76 m
Annual Glare GridSensor Spacing: 0.5 m, View-plane Offset: 1.2 m
Table 2. ASE and sDA Simulation by 40 to 80 percentage of pattern features.
No Frame404550556065707580
Frame Buildings 15 04056 i001Buildings 15 04056 i002Buildings 15 04056 i003Buildings 15 04056 i004Buildings 15 04056 i005Buildings 15 04056 i006Buildings 15 04056 i007Buildings 15 04056 i008Buildings 15 04056 i009
sDABuildings 15 04056 i010Buildings 15 04056 i011Buildings 15 04056 i012Buildings 15 04056 i013Buildings 15 04056 i014Buildings 15 04056 i015Buildings 15 04056 i016Buildings 15 04056 i017Buildings 15 04056 i018Buildings 15 04056 i019
sDA (%)10010010010010010099.594.877.864.5
ASEBuildings 15 04056 i020Buildings 15 04056 i021Buildings 15 04056 i022Buildings 15 04056 i023Buildings 15 04056 i024Buildings 15 04056 i025Buildings 15 04056 i026Buildings 15 04056 i027Buildings 15 04056 i028Buildings 15 04056 i029
ASE (%)56.349.545.343.342.337.836.533.524.819.0
Avg. Lux5173318429392663240121601877162913531088
Frame Buildings 15 04056 i030Buildings 15 04056 i031Buildings 15 04056 i032Buildings 15 04056 i033Buildings 15 04056 i034Buildings 15 04056 i035Buildings 15 04056 i036Buildings 15 04056 i037Buildings 15 04056 i038
sDABuildings 15 04056 i039Buildings 15 04056 i040Buildings 15 04056 i041Buildings 15 04056 i042Buildings 15 04056 i043Buildings 15 04056 i044Buildings 15 04056 i045Buildings 15 04056 i046Buildings 15 04056 i047Buildings 15 04056 i048
sDA (%)10010010010010010099.395.078.865.3
ASEBuildings 15 04056 i049Buildings 15 04056 i050Buildings 15 04056 i051Buildings 15 04056 i052Buildings 15 04056 i053Buildings 15 04056 i054Buildings 15 04056 i055Buildings 15 04056 i056Buildings 15 04056 i057Buildings 15 04056 i058
ASE (%)56.350.345.545.843.339.835.831.525.319.0
Avg. Lux5173318629302676241021661884162313681081
Buildings 15 04056 i059
Table 3. Glare simulation results for Type A frames with 50% to 65% density.
No FrameA50A55A60A65
DGP VisualisationBuildings 15 04056 i060Buildings 15 04056 i061Buildings 15 04056 i062Buildings 15 04056 i063Buildings 15 04056 i064
Imperceptible (%)6986889092
Perceptible (%)64332
Disturbing (%)73322
Intolerable (%)187654
sDG-5 (%)56.0935.6032.5529.526.45
Buildings 15 04056 i065
Table 4. Lux measurements at specific time points (50% to 65% of Type A).
No FrameA50A55A60A65
21 March 9:00Buildings 15 04056 i066Buildings 15 04056 i067Buildings 15 04056 i068Buildings 15 04056 i069Buildings 15 04056 i070
Above 1000 lux (%)46.520.216.313.07.4
Above 3000 lux (%)14.96.96.94.42.7
21 March 15:00Buildings 15 04056 i071Buildings 15 04056 i072Buildings 15 04056 i073Buildings 15 04056 i074Buildings 15 04056 i075
Above 1000 lux (%)67.334.029.625.420.4
Above 3000 lux (%)19.19.99.99.44.7
21 September 9:00Buildings 15 04056 i076Buildings 15 04056 i077Buildings 15 04056 i078Buildings 15 04056 i079Buildings 15 04056 i080
Above 1000 lux (%)50.622.119.115.510.2
Above 3000 lux (%)15.58.06.39.65.5
21 September 15:00Buildings 15 04056 i081Buildings 15 04056 i082Buildings 15 04056 i083Buildings 15 04056 i084Buildings 15 04056 i085
Above 1000 lux (%)63.931.527.724.018.8
Above 3000 lux (%)18.25.58.33.85.8
Buildings 15 04056 i086
Disclaimer/Publisher’s Note: The statements, opinions and data contained in all publications are solely those of the individual author(s) and contributor(s) and not of MDPI and/or the editor(s). MDPI and/or the editor(s) disclaim responsibility for any injury to people or property resulting from any ideas, methods, instructions or products referred to in the content.