Abstract
This paper examines the seismic performance evaluation methodology for underground structures. Through analysis of seismic damage and failure characteristics of underground structures, this study proposes a novel evaluation approach for frame-type underground structures based on the sectional curvature deformation indicator of structural components. The research establishes a classification system for seismic performance levels with corresponding state descriptions. A comprehensive seismic vulnerability analysis is conducted on a typical two-story-three-span station structure, generating vulnerability curves based on the proposed indicator. For comparison with traditional methods, vulnerability curves are also developed using the interstory displacement angle indicator. The comparison results indicate that relying solely on interstory displacement angle provides an insufficient assessment of the seismic performance of underground structures. The proposed methodology more effectively captures the influence of critical parameters, such as the axial compression ratio of interior columns, on overall seismic performance. This methodology demonstrates robust applicability across diverse frame-type underground structures in practical engineering scenarios, enabling precise evaluation of their seismic performance.
1. Introduction
China is situated between two major global seismic belts—the Circum-Pacific and Eurasian seismic zones—with more than half of its cities facing potential earthquake hazards. Virtually all existing and planned urban underground rail transit systems are located in seismic fortification zones, and a considerable number of these cities are classified as high-intensity fortification regions. Consequently, the seismic performance evaluation of urban underground rail transit systems has become critically important [1]. The occurrence of numerous earthquake damage incidents of underground structures further validates this viewpoint [2,3,4]. The performance-based seismic design framework has gained widespread recognition in engineering practice due to its rational multi-scale assessment framework through well-defined performance indicator systems [5,6,7,8,9]. The evaluation approach not only ensures structural safety before and during earthquakes but also considers post-earthquake functionality and reparability. Therefore, it has significantly advanced the development of seismic resilience concepts for underground rail transit systems and has emerged as a focal research area in recent scientific studies [10].
The prevailing consensus acknowledges that establishing a well-defined classification of performance levels and constructing a seismic performance indicator system for structures serve as prerequisites for advancing the seismic design methodology of underground structures. Various approaches exist for formulating seismic performance indicators, with common systems including those based on strength failure criteria, deformation failure criteria, and energy dissipation failure criteria [11]. Among these, the widely adopted strength-based performance indicator employs sectional flexural capacity as its basis [12,13,14,15,16]. The indicator, first proposed by Argyroudis et al. [15,16], was defined as the ratio between the actual bending moment (M) and the bending moment resistance (MR) at critical cross-sections of underground structures. The seismic performance of underground structures could be categorized into five distinct damage states utilizing this indicator, namely, no damage, slight damage, moderate damage, severe damage, and complete collapse, with corresponding threshold values, as summarized in Table 1.

Table 1.
The performance indicators based on the bending moment capacity [12].
Beyond strength-based performance indicators, current seismic performance evaluations for underground structures predominantly employ deformation-based indicators. The interstory displacement angle (IDA) has been widely adopted as a primary performance indicator for frame-type underground structures [17,18,19,20,21,22,23,24]. Notable achievements have been made in this domain by researchers. Du Xiu-L et al. [17] conducted pushover analyses on 18 shallow-buried rectangular station structures with different cross-sectional configurations. Their findings proposed more stringent quantitative criteria than those stipulated in the Code for Seismic Design of Urban Rail Transit Structures [5], challenging the applicability of above-ground structure performance indicators for the seismic design of underground structures. Wang Guo-B et al. [18], referencing China’s Code for Seismic Design of Buildings (GB50011-2010) [19], developed component deformation and strength evaluation methodologies. Their analysis suggested that the code-specified elastic IDA limit of 1/550 appears overly conservative, while the elastoplastic limit of 1/250 might be insufficiently rigorous. Huang Zhong-K et al. [20] systematically traced the historical development of seismic performance indicators and performance level classification systems for underground structures through comprehensive vulnerability concept and global literature review. Zhong Zi-L et al. [21] established a dual-index system combining IDA and crack width for subway stations, defining five distinct performance levels and corresponding assessment criteria. Zhuang Hai-Y et al. [22,23] formulated complete failure criteria for both two-story-three-span and three-story-three-span station structures, developing site-specific performance level classifications with physical descriptions based on IDAs. Wang Jian-N et al. [24] delineated the seismic damage progression in irregular-span frame-type underground structures and developed corresponding performance evaluation approaches integrating IDA with damage states. Bao X et al. [11] conducted comparative analyses across four typical frame-type configurations, establishing quantitative seismic performance thresholds considering structural typology, site conditions, material properties, and burial depths. Qiu D-P et al. [25] performed vulnerability analyses using both IDAs and rotation angles, elucidating their interrelationships. Ma C et al. [26] proposed a methodology for evaluating the seismic vulnerability of underground structures by considering the combined effects of horizontal and vertical ground motions. Additionally, they established a seismic vulnerability surface based on component damage weights and analyzed the seismic vulnerability characteristics of underground structures. Huang P-F et al. [27] proposed a novel PSDM for conducting fragility analysis of subway stations based on artificial neural network. Compared with the traditional PSDM, this method could better evaluate the structural performance of subway stations. Dalmasso M et al. [28] proposed a conditional generative adversarial Network technique, thereby incrementing the available data on seismic damage to underground structures and overcoming the data scarcity issue.
Research has demonstrated that in underground structures, the peak IDA and peak axial compression ratio of interior columns do not occur simultaneously. The degree of structural damage may vary considerably under identical IDAs [20,29]. This suggests that relying solely on the interlayer displacement angle may be insufficient for a comprehensive evaluation of the seismic performance of underground structures. Therefore, this study proposes a novel seismic performance indicator for frame-type underground structures—the sectional curvature. This proposed indicator offers a more thorough characterization of structural damage behavior compared to the IDA and exhibits notable advantages in assessing the overall seismic performance of underground structures.
2. Numerical Simulation Method
This section presents a comprehensive overview of the numerical simulation methodologies utilized in the study.
2.1. Material Constitutive Model
The constitutive models for concrete and steel reinforcement are implemented through the development of corresponding UMAT and VUMAT (User-defined Material) subroutines. For the concrete material, a modified Kent-Park uniaxial constitutive model is employed [30], with its backbone curve and loading/unloading rules illustrated in Figure 1. In the figure, represents the initial stiffness under compression, denotes the axial compressive strength of concrete; corresponds to the residual compressive strength of concrete, taken as ; represents the axial tensile strength; is the tensile softening coefficient, set to 0.1. and indicate the strain corresponding to the peak compressive and tensile strengths, respectively; and represent the ultimate compressive strains for unconfined and confined concrete, respectively; denotes the confinement improvement factor; and and represent the damage stiffness coefficients under compression and tension, respectively.

Figure 1.
Uniaxial constitutive models for concrete. (a) Stress–strain envelope curve; (b) loading–unloading criteria [1].
For steel reinforcement, a bilinear elastoplastic model is adopted with loading-unloading rules based on the Clough model [31], incorporating failure criteria for both tensile and compressive stresses, as shown in Figure 2. In the figure, represents the elastic modulus of the steel; denotes the yield strength; corresponds to the yield strain; is the post-yield stiffness coefficient, set to 0.001.

Figure 2.
Uniaxial constitutive model for reinforcement [1].
To verify the accuracy of the above constitutive models for concrete and reinforcing steel, a numerical model of a cantilever column referenced from prior work was developed [32]. The quasi-static pushover test was numerically replicated and evaluated. Figure 3 presents the comparative curves of the experimental measurements and numerical simulation results at the same location. At lower loading amplitudes, the simulated reaction force closely matches experimental observations, accurately capturing the load-unload behavior of the component. However, as the loading amplitude increases, minor discrepancies emerge between the numerical and experimental results. These deviations are hypothesized to stem from two factors: (1) misalignment between the vertical actuator and column axis at high loads, introducing errors in axial compression ratio (ACR) measurements, and (2) unaccounted damage at the column–base interface in the simulation. Despite these limitations, the constitutive models effectively simulate the mechanical response and damage progression of reinforced concrete members under cyclic loading conditions.
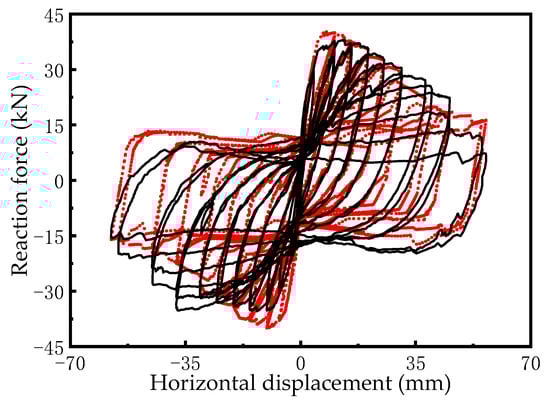
Figure 3.
Comparison between experimental results and numerical analysis results [1].
An extended Drucker-Prager constitutive model is adopted for the soil constitutive model, which extends the classical Drucker-Prager constitutive model by adopting a non-associated flow rule to avoid the phenomenon of non-unique plastic flow directions at the sharp corners of the yield surface. The soil properties are determined by the equivalent linear method (EERA) based on frequency domain analysis to approximately characterize the nonlinear properties of soil under dynamic loads. The relationships between the dynamic shear modulus ratio, damping ratio, and shear strain are illustrated in Figure 4. The equivalent damping of soil is represented by the Rayleigh damping, which can be reflected by the coefficients α and β. Considering that the seismic response of soil-underground structure system is dominated by low-order vibration mode, the first natural frequency of the site and the dominant frequency of the ground motion were adopted for calculating the coefficients α and β, as suggested by Du Xiu-L et al. [33] in their study. The values α and β are 0.21938 and 0.01116, respectively. The specific solution principles, formulas and procedures are detailed in the first reference [1].
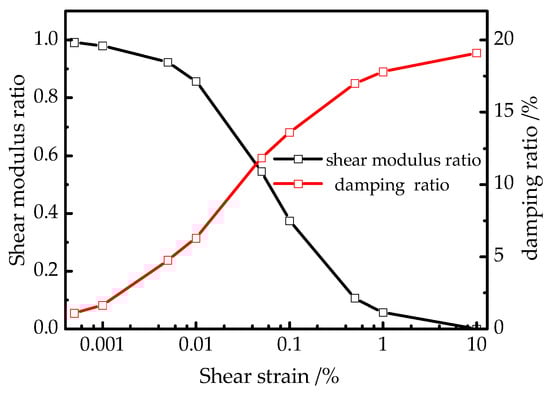
Figure 4.
Dynamic shear modulus ratio and damping ratio with dynamic shear strain of soil [34].
2.2. Model Parameters
This study examines a typical cut and cover two-story-three-span underground subway station, with its standard cross-section simplified as a plane-strain problem. The dimensions of the subway station are presented in Figure 5, with interior columns spaced at 8 m longitudinally. Longitudinal beams connect the interior columns to the top, middle, and bottom plates. The interior columns utilize C50 concrete, while C35 concrete is used for other structural components. The longitudinal reinforcement and column stirrups employ HRB400 and HPB300 grade steels, respectively. The structure features symmetric reinforcement to meet seismic design and durability requirements. The structural material parameters and reinforcement ratios of main components are listed in Table 2 and Table 3. The middle and bottom plates bear combined decoration, equipment, and crowd loads totaling 16 kPa.
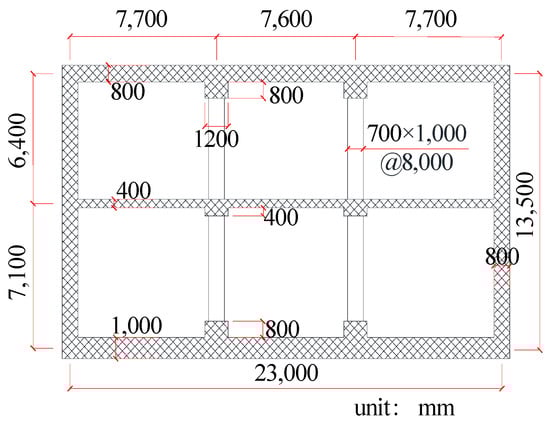
Figure 5.
Dimensions of subway station.
Table 2.
Structure parameters.
Table 3.
Reinforcement ratios of underground structure.
The sites in the analysis are composed of sandy soil, underlain by rigid bedrock. The soil thickness is 70 m. Disregarding soil stratification and earthquake liquefaction effects, a set of validated soil parameters implemented are listed in Table 4 [1,35].
Table 4.
Soil parameters [1].
2.3. Finite Element Model
A two-dimensional (2D) numerical model is constructed, as depicted in Figure 6. The model dimensions are set to 200 m in width and 70 m in height to minimize lateral and bottom boundary effects on the dynamic response of underground structures [36,37]. A mesh size sensitivity analysis for the model was discussed. The sensitivity analysis results in Table 5 demonstrate that the selected maximum grid size of 2 m is sufficiently refined to ensure computational accuracy. Moreover, this grid size can effectively reproduce all waveforms across the frequency range, ensuring the spatial resolution of each element remains below 1/8 to 1/10 of the wavelength corresponding to dominant seismic frequencies [38]. The grid density increases near the underground structure.
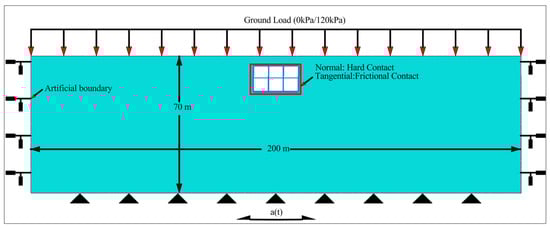
Figure 6.
Two-dimensional numerical model.
Table 5.
Grid sensitivity analysis.
The model thickness is set to one column spacing (8 m) to prevent interior column stiffness degradation from affecting results. A simplified 3D beam-shell model (Figure 7) was developed for direct comparative analysis against the aforementioned 2D plane-strain model. Table 6 provides the structural response results under different earthquake intensities. The comparative analysis demonstrates that the sectional curvature demand, contact slip/separation, and key force resultant are insensitive to the out-of-plane assumption, thereby validating the reliability of the 2D simulation results presented in this study.
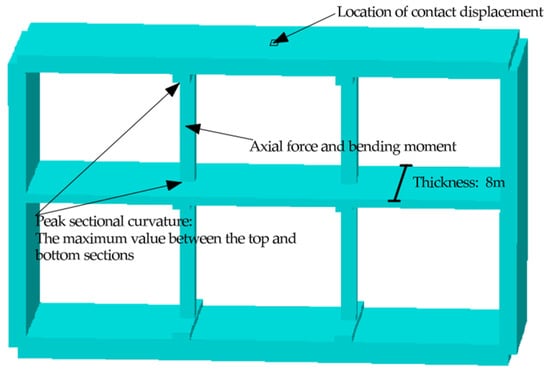
Figure 7.
Three-dimensional beam-shell model.
Table 6.
Comparative analysis results of 2D and 3D models.
The soil is modeled using four-node plane strain elements, while the station structure employs fiber beam elements [39]. The longitudinal beams connecting the interior column at top, middle, and bottom levels are treated as linearly elastic components, excluding potential failure modes. The reinforcement is represented by longitudinal beam elements (Stringer element) with shared nodes. The concrete beam element and reinforcement beam element share nodes and deform coordinately, without considering concrete-reinforcement slip. The concrete section is divided into 19 × 19 fibers, with their sectional distribution shown in Figure 8. The cross-sectional dimensions of the reinforcement elements are determined through equivalent transformation, considering distribution positions and cross-sectional areas (Figure 5 and Table 3). Distinct reinforcement section geometries are employed in interior columns and other structural components, namely rectangular and I-section configurations, respectively, as detailed in Figure 8. The web thickness of the equivalent I-shaped section adopts a tiny value so that its effect can be ignored. A “hard contact” model addresses mutual sliding and local detachment between the underground structure and surrounding soils, allowing only compressive force transmission across contact surfaces, permitting separation but preventing mutual penetration. Tangential contact follows the Coulomb friction law using the penalty function method, with a friction coefficient of 0.4 [2]. Energy transmitting boundary and viscous boundary are implemented along the lateral boundaries of the explicit dynamic analysis model through the integration of spring and dashpot elements, as suggested by Lysmer and Kuhlemeyer [40,41]. Free field responses are considered as force boundaries along lateral boundaries. The bottom boundary represents the underlying bedrock formation interface, where seismic wave inputs are applied as horizontal acceleration time histories (Figure 6). Unified static soil mechanical parameters determine initial site soil stress for subsequent explicit dynamic analysis. The specific analysis procedure is detailed in the first reference [1].
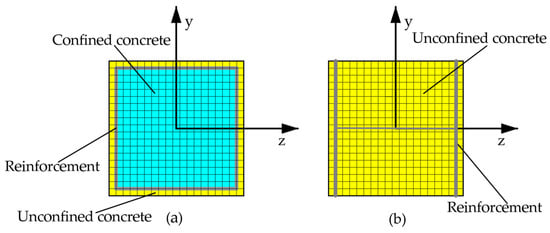
Figure 8.
Diagram of Sectional distributions. (a) Interior column section. (b) Other section.
2.4. Input Ground Motion
The selection of input ground motions should adequately capture the inherent randomness and general applicability of seismic responses of the underground structure [41]. According to the research by Vamvatsikos et al. [42], employing 15 to 20 ground motion records with considerable variations in magnitude, location, and epicentral distance within the IDA analysis framework could effectively represent the uncertainty arising from differences in ground motion characteristics.
Therefore, the study selected 16 ground motion records from the PEER database based on the key criteria of epicentral distance, ground motion intensity, and site conditions, following the ground motion selection principles outlined in FEMA P695 [43]. Among these records, eight represent far-field events and eight represent near-field events, with moment magnitudes (Mw) ranging from 6.5 to 7.5 and epicentral distances varying from 2.7 to 131.2 km, as detailed in Table 7.
Table 7.
Ground motion records.
The selected input ground motions derive from distinct seismic events and represent surface acceleration data recorded at individual stations. Their response spectra are presented in Figure 9a. In seismic analysis of underground structures, direct application of surface ground motion records at the bedrock level is inherently inappropriate. Therefore, the surface ground motion records undergo inversion based on the frequency-domain equivalent linearization method to obtain acceleration time-histories of bedrock ground motion, with corresponding response spectra shown in Figure 9b. The inverted bedrock ground motions were filtered and their peak accelerations scaled to 0.05 g, 0.10 g, 0.20 g, 0.30 g, 0.40 g, 0.50 g, 0.60 g, and 0.70 g, respectively.
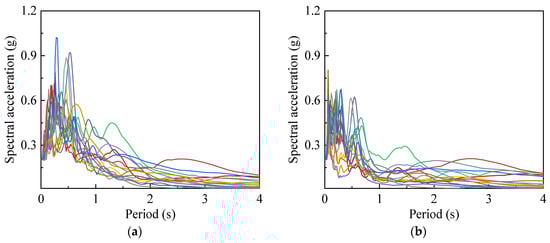
Figure 9.
Acceleration response spectra of seismic waves. (a) Surface response spectra. (b) Bedrock response spectra.
3. Seismic Performance Indicator and Seismic Performance Levels
3.1. Seismic Performance Indicator
Seismic performance indicators, which quantitatively characterize the degree of structural seismic damage, should comprehensively reflect both seismic response and damage failure mechanisms. Previous studies indicated that typical failure modes of underground structures under strong seismic loading, including top plate collapse, middle plate settlement, and sidewall overturning, frequently initiated from damage or failure of structural members such as interior columns and top plates [2,44]. This demonstrates that local structural member performance inherently relates to overall structural seismic performance. Therefore, utilizing damage parameters of local structural members as indicators of overall structural performance aligns with the seismic damage characteristics of underground structures. To accurately quantify seismic damage degree and facilitate performance evaluation, the sectional curvature of components is selected as the seismic performance demand measure (DM). As a linking parameter between concrete material strain and structural component deformation, sectional curvature provides a superior characterization of internal damage states compared to displacement-based indicators. Furthermore, it proves operationally more advantageous than strain or energy indicators [45].
In subway station structural systems, the underground structure consists of multiple tiers, each supported by load-bearing structural members. The failure of any critical member within a designated tier may initiate localized collapse propagation, potentially leading to global structural failure. This establishes the most severely compromised cross-section within each tier as the representative critical section, where its performance indicator defines the seismic performance threshold of that tier. Similarly, the critical tier exhibiting the most severe structural damage within a subway station serves as the representative tier for seismic assessment, with its corresponding seismic performance indicator functioning as a reliable measure for evaluating overall structural seismic performance.
In summary, the seismic performance level of underground structures is primarily determined by the most severely damaged structural components, while seismic performance levels of their components are quantified by their most severely compromised cross-sections. Additionally, structural components designed with appropriate shear considerations demonstrate improved shear capacity, effectively preventing pure shear failure. Consequently, the proposed seismic performance indicator focuses on the bending failure mechanism of cross-sections, temporarily excluding shear failure mechanism considerations.
3.2. Classification of Seismic Performance Levels
The typical framework structure of underground stations consists of interior columns, top plates, bottom plates, middle plates, and sidewalls. As discussed in the paper, the overall structural seismic performance level significantly depends on the degree of structural component seismic damage. Therefore, the paper categorizes underground structural seismic damage degree based on cross-section deformation failure criteria while providing comprehensive descriptions of structural performance status.
Using the interior column of a two-story subway station as an example, Figure 10 demonstrated the moment-curvature relationship curve of its cross-section under a specific ACR. These values of this curve are structure-specific, which means that each type of cross-section will yield a specific curve. However, the flexural state of sectional curvature under loading in reinforced concrete structures exhibits universality [46,47]. This study employs the farthest-point method to determine the yield point of the cross-section. In this method, the point on the curve farthest from the line connecting the origin and the peak point is identified as the yield point [48]. Draw a line connecting point O with the extremum point of the generalized force. Draw a parallel line to this line and find the farthest point B on the curve from this parallel line, which is the yield point (Figure 11). This approach offers clear physical significance and demonstrates strong applicability.
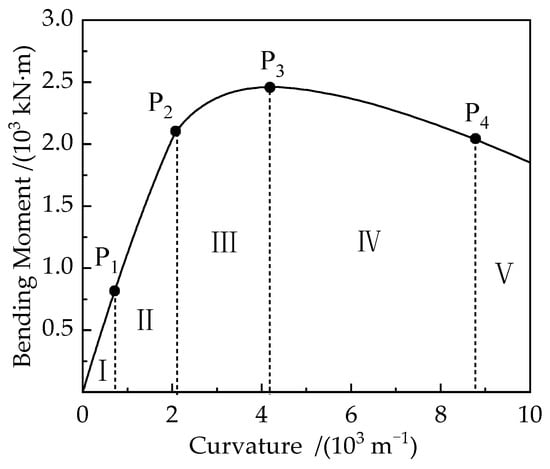
Figure 10.
Flexural performance states of structural cross-section.

Figure 11.
The farthest-point method.
Based on previous numerical simulations and experimental tests, structural components with limited cross-sectional deformation demonstrate the following characteristics: both concrete and reinforcing steel remain in the elastic phase, with only localized micro-cracks appearing on the concrete cover surface. During this phase (Stage I, as shown in Figure 10 before performance point P1), the bending moment and curvature of the cross-section display an approximately linear relationship, indicating that the structural integrity remains intact in this elastic regime. Increased loading leads to macroscopically visible cracks on the concrete surface, accompanied by localized plastic deformation regions. The cross-sectional response progresses through this transitional phase until reaching yield deformation (Stage II, as depicted in Figure 10 between performance points P1 and P2). Throughout this mechanical behavior progression, the cross-section maintains structural integrity with limited damage accumulation, showing only minor degradation in load-carrying capacity. As loading continues, both concrete and reinforcing steel plastic deformation intensify, resulting in significant crack widening on the structural surface. The mechanical progression reaches its peak when the cross-section achieves its ultimate bending capacity (Stage III, as illustrated in Figure 10 between performance points P2 and P3). At this stage, the cross-sectional properties exhibit moderate damage characteristics. After reaching peak bending moment, the cross-sectional moment begins to decline progressively. When the bending moment decreases to 85% of the peak value, the cross-section enters a state of severe damage (Stage IV, as shown in Figure 10 between performance points P3 and P4). Simultaneously, significant material property degradation occurs, characterized by extensive concrete spalling with interconnected cracks, rendering the structure unable to sustain additional loads. Post-peak moment reduction exceeding 15% residual capacity (≤85% of peak bending moment) indicates structural failure criteria. This threshold corresponds with irreversible material deterioration characterized by complete loss of load-bearing capacity, structural instability, and collapse mechanism initiation, as shown in Figure 10 after performance points P4 (Stage V). Based on the four performance points on the moment-curvature relationship curve of its cross-section, the entire loading process can be divided into five distinct stages, each corresponding to a specific damage grade of the cross-section, as presented in Table 8.
Table 8.
Seismic performance levels of underground structure.
The seismic performance of interior columns demonstrates high sensitivity to ACRs, necessitating the determination of performance levels based on either the initial ACR of interior columns or the critical ACR corresponding to peak sectional curvature response. Conversely, flexural members such as plates and walls, due to their inherently larger cross-sectional dimensions, exhibit substantially reduced sensitivity to axial loading effects on load-bearing capacity. This fundamental characteristic eliminates the necessity to consider the ACR, enabling direct evaluation of seismic performance levels of these flexural members through cross-sectional moment-curvature analysis under conventional axial load ranges.
4. Result Analysis
The section conducted seismic vulnerability analysis on frame-type underground structures utilizing incremental dynamic analysis. Using structural seismic damage grade as the benchmark, comparative analyses evaluated the validity of employing IDAs to evaluate the seismic performance of underground structures. Additionally, seismic vulnerability curves were developed using sectional curvature and IDA as performance indicators. The analysis examined structure exceedance probabilities at different performance levels.
4.1. Analysis of the Limitations of IDA
During numerical simulation, different ACRs of the interior column were implemented through ground load application at the top of the model, as shown in Figure 12. ACR represents the ratio between axial force and the cross-sectional area of the compressive segment. The damage factor represents the ratio of stiffness degradation to initial stiffness during reloading under compressive or tensile stress states in concrete materials, with higher values indicating greater structural damage.
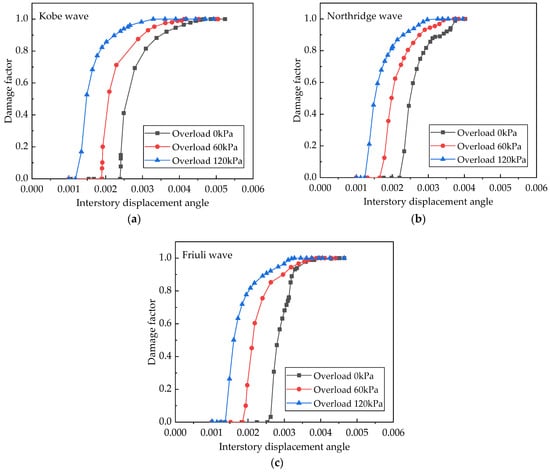
Figure 12.
Time-history comparison curves of IDA and damage factor. (a) Kobe wave; (b) Northridge wave; (c) Friuli wave.
Figure 12 illustrates the variation curves of the IDA at the top of the station structure and the damage factor of the interior column under three seismic waves and three ground load conditions. The results indicate that despite consistent IDAs, the damage degree of interior columns varies due to ACR influence. Moreover, under identical IDA conditions, higher ACR values result in more rapid attainment of the damage limit by the interior column. Similar phenomena are observed under other earthquake conditions.
These findings indicate that utilizing the IDA alone to characterize and evaluate seismic characteristics of underground structures lacks sufficient accuracy, suggesting that the current seismic evaluation methodology for underground structures based on this indicator requires enhancement.
4.2. Seismic Vulnerability Analysis
4.2.1. Applicability Assessment of the IM
Selecting an appropriate intensity measure (IM) represents a crucial step in developing seismic vulnerability curves for underground structures. Following an extensive literature review [49,50,51], peak ground acceleration (PGA) was adopted as the IM. The rationale for the IM selection will be validated within this section by demonstrating its efficiency and sufficiency. Since non-long interior column failure primarily results from damage at column end sections, with mid-span instability being relatively rare, this study focuses on analyzing the top and bottom cross-sections of interior columns. The maximum sectional curvature observed among interior columns served as the DM.
Research indicates that the DM for shallow-buried underground structures exhibits a generally logarithmic-linear relationship with the IM [52,53], as defined by Equation . In the formula, both A and B are fitting coefficients.
A total of 256 dynamic working conditions were calculated in the paper. The distribution of the sectional curvatures of the interior column under different seismic intensities was statistically obtained, as shown in Figure 13, and the corresponding fitting results were presented in Figure 14.
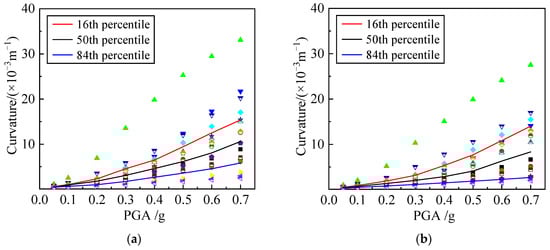
Figure 13.
Sectional curvature distribution under different PGAs. (a) Overload of 0 kPa. (b) Overload of 120 kPa.
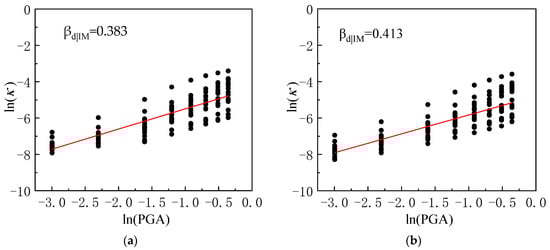
Figure 14.
Linear regression of peak sectional curvature. (a) Overload of 0 kPa. (b) Overload of 120 kPa.
The fitting relationships between the sectional curvature of the interior column and PGA under two working conditions were as follows:
Table 9 presented linear regression results of IM and DM data samples under two loading conditions, where denotes the log-standard deviation. A lower value indicates higher efficacy of the corresponding IM. The calculation formula for log-standard deviation is as follows:
where n is the total number of time-history analysis results.
Table 9.
Regression analysis results of efficiency and sufficiency.
Comparative analysis with prior references on IM selection [49,50,51] reveals that the PGA adopted in this study demonstrates notably superior efficiency.
Furthermore, regression analyses were performed on the residual-magnitude and residual-epicentral distance datasets. As demonstrated in Table 9, all obtained p-values exceed 0.05, indicating no statistically significant correlation between the selection of PGA as the IM and either seismic magnitude or epicentral distance.
4.2.2. Seismic Vulnerability Curves Based on Sectional Curvature
Research indicated that the seismic vulnerability curve of shallow-buried underground structures conformed to a lognormal distribution and could be described using the following formula [54]:
In the formula, denotes the probability of structural response exceeding a specified performance level under a given seismic intensity; refers to the standard normal distribution function; represents the threshold value for the structural performance level indicators; quantifies the uncertainty attributed to deviations in structural damage state definitions and is assigned a value of 0.4 based on recommendations in the HAZUS99; characterizes the uncertainty associated with structural form. Given the uniqueness of the analytical subject in this study, this parameter is omitted in the computational procedure.
Based on the aforementioned fitting formula results and incorporating the seismic performance level classification presented previously, substituting Equations (1) and (2) into Equation (4), respectively, yielded the seismic vulnerability curves of underground structures under 0 kPa overloading and 120 kPa overloading conditions, as shown in Figure 15. The selection criteria for seismic performance indicators refer to Section 3.2, with threshold results presented in Table 10.
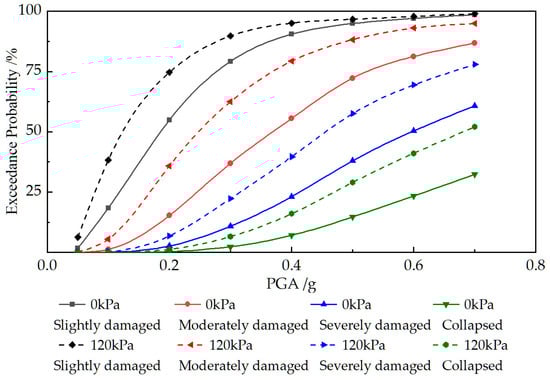
Figure 15.
Seismic vulnerability curves based on the sectional curvature of interior column.
Table 10.
Seismic performance levels based on sectional curvature/×10−3 m−1.
As demonstrated in Figure 15, seismic damage to underground structures intensifies progressively with increasing PGA. For example, under 0.2 g PGA with 0 kPa overloading, the probability of the underground station structure exceeding performance point P1 (indicating slight damage) is 54.97%, while the probability of exceeding performance point P2 (indicating moderate damage) is 15.28%. These results suggest that under PGA below 0.2 g, underground structures primarily experience minor damage, with relatively low moderate damage probability. At 0.4 g PGA, the probability of exceeding performance point P2 reaches 55.51%, while the likelihood of surpassing performance point P3 (indicating severe damage) is 23.07%. These findings demonstrate that when PGA ranges between 0.2 g and 0.4 g, underground structures predominantly experience moderate damage, with relatively low severe damage probability. At 0.7 g PGA, the probability of exceeding performance point P2 increases to 86.86%, performance point P3 to 60.76%, and performance point P4 to 32.33%. These results indicate predominantly severe damage state of the station structure, with significantly elevated collapse and structural failure probability.
Furthermore, the structural vulnerability curves under 120 kPa overloading consistently demonstrate higher values compared to those under 0 kPa overloading condition, exhibiting increased exceedance probabilities across all seismic performance levels. This pattern is primarily attributable to the elevated ACR of the interior columns within the underground structure, resulting from the additional surcharge load, which subsequently intensifies both the probability and magnitude of structural damage.
4.3. Comparative Analysis
4.3.1. Seismic Vulnerability Curves Based on IDA
Employing the same analytical methodology, the IDA of the underground structure served as the seismic performance demand measure for structural vulnerability analysis. The fitting relationships between the sectional curvature of the interior column and PGA under two working conditions were as follows:
Based on the limit values of the IDA indicator used for classifying seismic performance of underground structures in existing references (Table 11), the structural vulnerability curve based on this performance indicator was constructed, as shown in Figure 16.
Table 11.
Seismic performance levels based on IDA [17].
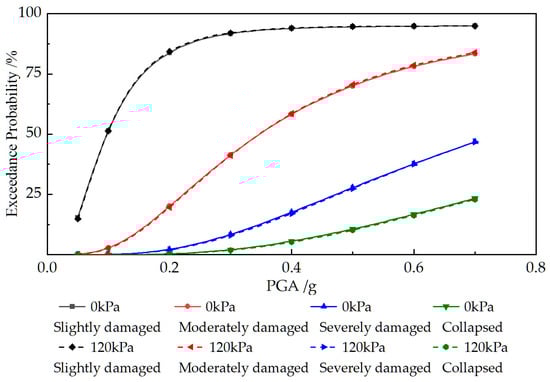
Figure 16.
Seismic vulnerability curves based on the IDA.
The fragility curves of the station structure under two overloading conditions, based on the IDA indicator, demonstrate nearly complete overlap, suggesting that the influence of the overlying load on structural damage characteristics remains undetected. Using the Kobe wave with a PGA of 0.4 g as an example, the IDA at the top of the structure under 0 kPa overloading and 120 kPa overloading conditions are 1/142 and 1/139, respectively (a difference of 2.1%), while those at the bottom are 1/158 and 1/152, respectively (a difference of 3.7%). These findings indicate that the deformation modes and magnitudes of the underground structure under two loading conditions demonstrate high consistency.
4.3.2. Comparative Analysis of Two Method
The seismic fragility curves derived in Section 4.2.2 and Section 4.3.1 (Figure 15 and Figure 16) were comparatively analyzed, and the areas between the two loading curves under four performance levels were quantified, as summarized in Table 12.
Table 12.
Areas between two loading conditions.
Table 12 demonstrates that the area between vulnerability curves corresponding to the two loading conditions is significantly larger when derived using the sectional curvature indicator compared to that obtained through the IDA indicator. This phenomenon indicates that the sectional curvature metric constitutes a more appropriate indicator than IDA for evaluating the seismic performance of underground structures. Furthermore, the sectional curvature indicator exhibits heightened sensitivity to the ACR of interior columns (ground surface overload).
Additionally, seismic vulnerability analyses incorporating diverse site characteristics were also conducted, and details are omitted in this article due to space limitations. Under different parametric conditions, the fragility curves derived from the two performance indicators (sectional curvature and IDA) consistently exhibited significant discrepancies, similar to those in Figure 15 and Figure 16. The area discrepancies between vulnerability curves consistently exceeded a factor of 30 across all comparisons.
To further illustrate the limitations of the IDA indicator, concrete compressive damage factors at the critical sections of the structural components are extracted under the aforementioned conditions, as presented in Figure 17.
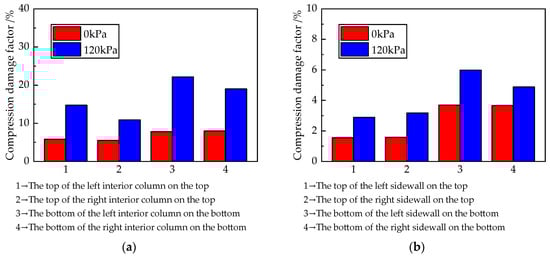
Figure 17.
Concrete compressive damage factors. (a) Critical sections of interior column. (b) Critical sections of sidewall.
As illustrated in Figure 17, under the 120 kPa overloading condition, the concrete damage factors of component sections of the underground structure exceed those observed under the 0 kPa condition. The extent of influence from overloading varies significantly among different component sections. The bottom section at the base of the left interior column exhibited the most substantial influence, with the compressive damage factor increasing by 184.4% compared to the 0 kPa condition. Conversely, the bottom section of the right sidewall showed the smallest increase, with a compressive damage factor rise of 33.3% compared to the 0 kPa condition.
Due to a minimal IDA difference of approximately 3%, a performance evaluation system based on IDAs may yield similar assessment outcomes. However, the actual structural damages show significant variations, with the end section of the interior column displaying particular sensitivity. This observation indicates that while surface load variations minimally affect the overall deformation behavior (IDA) of the underground structure, they substantially influence individual structural component damage manifestation.
This evidence suggests that utilizing only the IDA to characterize and evaluate seismic damage behavior of underground structures may lead to significant inaccuracies. The performance indicators and evaluation approaches proposed in this study demonstrate superior alignment with the mechanical behavior and damage characteristics of frame-type underground structures.
4.3.3. Parametric Sensitivity Analysis
To rigorously validate the robustness of the proposed method, a parametric sensitivity analysis was performed on the numerical model. Critical parameters including Rayleigh damping parameters and soil-structure interface friction μ were investigated, with their quantitative impacts on curvature response and probability of exceedance under representative PGAs systematically evaluated, as shown in Table 13.
Table 13.
Parametric sensitivity analysis.
Tabular evidence establishes that parametric perturbations induce merely marginal oscillations (<±2%) in derived sectional curvatures and probability of exceedance metrics. This quantitatively verifies the methodological insensitivity to interfacial friction and damping variabilities, thus indicating limited parametric influence on the proposed methodology. Notably, when conducting comparative analysis between the two methods (sectional curvature and IDA), such discrepancies become statistically negligible.
5. Limitations and Furthers
The present study intentionally simplifies the numerical simulation by omitting certain secondary factors that, while influencing computational outcomes, exhibit negligible effects on the core conclusions. The deliberate simplifications include (1) Soil stratification and liquefaction characteristics; (2) Concrete-reinforcement interfacial slippage; (3) Spatial constraints of 3D modeling; (4) Directionality of input ground motion; and (5) Shear-dominated failure modes.
Furthermore, the performance evaluation indicator presented in this paper exhibits intrinsic variability contingent upon cross-sectional configurations of underground structural components. Consequently, subsequent studies will systematically discuss representative structural cross-sections to derive design guidelines, facilitating the integration of this theoretical framework into current specifications.
6. Conclusions
This research presents a systematic analysis of seismic damage characteristics in underground structures and proposes a deformation index-based seismic evaluation approach. The study refines the categorization criteria for seismic performance levels and details the performance states corresponding to different damage levels within the proposed framework. Through application of the new evaluation approach, the seismic performance of conventional frame-type underground stations is examined, and seismic vulnerability analyses under two distinct surface loading conditions (0 kPa and 120 kPa) are performed. The comparative analysis against conventional IDA-based assessment methods validates the proposed methodology for underground structural systems. Despite certain limitations in the analysis, the key findings can nevertheless be drawn:
- For frame-type underground structures, the global seismic performance level is governed by the most severely damaged structural component. The damage degree of this critical component can be quantified through sectional curvature at its maximum damage location.
- Five distinct damage phases are established based on characteristic points (elastic, yield, peak, and ultimate) in the moment-curvature relationship of structural members: (I) Basically intact, (II) Slightly damaged, (III) Moderately damaged, (IV) severe damaged, and (V) Collapsed.
- Although the IDA remains the same, the damage degree of the interior column varies due to the influence of the ACR. Furthermore, under identical IDA conditions, a higher ACR leads to a more rapid attainment of the damage limit by the interior column.
The findings demonstrate that relying solely on the IDA to characterize and evaluate seismic characteristics of underground structures provides insufficient accuracy. Compared to the IDR, the method proposed herein enables more precise quantification and assessment of the seismic performance levels of underground structures. Excluding factors such as soil liquefaction, directionality of input ground motion and pure shear failure of structural members, it demonstrates superior efficacy in evaluating the seismic performance of frame-type underground structures.
Author Contributions
Z.-Y.Y.: Conceptualization, Methodology, Writing—original draft, and Writing—review and editing. J.-K.Z.: Conceptualization and Methodology. Z.-Q.Y.: Conceptualization, Supervision, and Funding acquisition. J.-J.L.: Conceptualization, Data curation, Formal analysis, Investigation, and Validation. K.-B.Z.: Data curation and Resources. J.-M.Z.: Supervision and Funding acquisition. All authors have read and agreed to the published version of the manuscript.
Funding
This research was funded by the National Natural Science Foundation of China (No. 52078033) and the National Key Research and Development Program of China (No. 2024YFF1700504, No. 2024YFF1700505). The financial support is much appreciated.
Data Availability Statement
The data presented in this study are available on request from the corresponding author. The data are not publicly available due to copyright restrictions.
Conflicts of Interest
Author Jing-Kun Zhang was employed by the company The Fourth Construction Co., Ltd. of China Electronics System Engineering. The remaining authors declare that the research was conducted in the absence of any commercial or financial relationships that could be construed as a potential conflict of interest.
References
- Zhang, J.-K.; Yu, Z.-Y.; Zhang, H.-R.; Qiu, Y.-J. Damage and failure of underground subway stations under different soil constraint conditions. PLoS ONE 2023, 18, e0284074. [Google Scholar] [CrossRef]
- Huo, H.; Bobet, A.; Fernandez, G.; Ramirez, J. Load transfer mechanisms between underground structure and surrounding ground: Evaluation of the failure of the Daikai station. J. Geotech. Geoenviron. Eng. 2005, 131, 1522–1533. [Google Scholar] [CrossRef]
- Yao, C.; He, C.; Wang, T.; Chen, C.; Geng, P.; Dong, W.; Yuan, F.; Xu, G. Damages of highway tunnels during 2022 Luding earthquake (Mw = 6.6). Soil Dyn. Earthq. Eng. 2024, 177, 108357. [Google Scholar] [CrossRef]
- Huang, S.; Xin, C.; Song, D.; Feng, W.; Liu, X.; Wang, E.; Xu, T.; Xiong, X. Resilience assessment of the seismic damage mechanism of the Daliang high-speed railway tunnel in the 2022 Menyuan earthquake (Mw 6.7) in China. Transp. Geotech. 2024, 49, 101417. [Google Scholar] [CrossRef]
- GB 50909-2014; Code for Seismic Design of Urban Rail Transit Structures. China Planning Press: Beijing, China, 2014. (In Chinese)
- GB/T 51336-2018; Standard for Seismic Design of Underground Structures. China Architecture and Building Press: Beijing, China, 2018. (In Chinese)
- ASCE 41-13; Seismic Evaluation and Upgrade of Existing Buildings. American Society of Civil Engineers: Reston, VA, USA, 2013.
- FEMA-P58-1; Seismic Performance Assessment of Buildings (Volume 1-Methodology). Federal Emergency Management Agency: Washington, DC, USA, 2018.
- FEMA-P58-2; Seismic Performance Assessment of Buildings (Volume 2-Methodology). Federal Emergency Management Agency: Washington, DC, USA, 2018.
- Lu, D.-C.; Ma, C.; Du, X.-L.; Wang, Z.-H. Earthquake resilience of urban underground structures: State of the art. Sci. Sin. Technol. 2021, 51, 1469–1483. (In Chinese) [Google Scholar] [CrossRef]
- Bao, X.; Liu, J.-B.; Wang, W.-H.; Lu, X.-H. Seismic performance indicator and seismic performance levels of rectangular underground structures. Structures 2022, 41, 117–127. [Google Scholar] [CrossRef]
- Le, T.; Huh, J.; Park, J. Earthquake fragility assessment of the underground tunnel using an efficient SSI analysis approach. J. Appl. Math. 2014, 2, 1073. [Google Scholar] [CrossRef][Green Version]
- Nguyen, D.; Park, D.; Shamsher, S.; Nguyen, V.; Lee, T. Seismic vulnerability assessment of rectangular cut-and-cover subway tunnels. Tunn. Undergr. Space Technol. 2019, 86, 247. [Google Scholar] [CrossRef]
- Huang, Z.; Pitilakis, K.; Tsinidis, G.; Argyroudis, S.A.; Zhang, D.M. Seismic vulnerability of circular tunnels in soft soil deposits: The case of Shanghai metropolitan system. Tunn. Undergr. Space Technol. 2020, 98, 103341. [Google Scholar] [CrossRef]
- Argyroudis, S.; Pitilakis, K. Seismic fragility curves of shallow tunnels in alluvial deposits. Soil Dyn. Earthq. Eng. 2012, 35, 1–12. [Google Scholar] [CrossRef]
- Argyroudis, S.; Tsinidis, G.; Gatti, F.; Pitilakis, K. Effects of SSI and lining corrosion on the seismic vulnerability of shallow circular tunnels. Soil Dyn. Earthq. Eng. 2017, 98, 244. [Google Scholar] [CrossRef]
- Du, X.-L.; Jiang, J.-W.; Xu, Z.-G.; Xu, C.-S.; Liu, S.Q. Study on quantification of seismic performance index for rectangular frame subway station structure. China Civ. Eng. J. 2019, 52, 112–128. (In Chinese) [Google Scholar]
- Wang, G.-B.; Xie, W.-P.; Sun, M.; Liu, W.-G. Evaluation method for seismic behaviors of underground frame structures. Chin. J. Geotech. Eng. 2011, 33, 593–598. (In Chinese) [Google Scholar]
- GB50011-2010; Code for Seismic Design of Buildings. China Architecture and Building Press: Beijing, China, 2018. (In Chinese)
- Huang, Z.K.; Zhang, D.M. Recent advance in seismic fragility research of underground structures. J. Tongji. Univ. 2021, 49, 49–59. (In Chinese) [Google Scholar]
- Zhong, Z.-L.; Tang, J.-C.; Chen, J.-N.; Xu, C.-S.; Du, X.-L. Multi-index and thresholds for seismic performance evaluation of prefabricated subway station structure. Chin. J. Geotech. Eng. 2025, 1–9. (In Chinese). Available online: https://link.cnki.net/urlid/32.1124.TU.20250120.1135.004 (accessed on 5 November 2025).
- Zhuang, H.-Y.; Ren, J.-W.; Wang, R.; Miao, Y.; Chen, G.-X. Elasto-plastic working states and seismic performance levels of frame-type subway under-ground station with two layers and three spans. Chin. J. Geotech. Eng. 2019, 41, 131–138. (In Chinese) [Google Scholar]
- Yang, J.; Yun, L.; Zhuang, H.-Y.; Ren, J.-W.; Chen, W.-B. Seismic performance levels of frame-type subway underground station with three layers and three spans. Chin. J. Geotech. Eng. 2020, 42, 2240–2248. (In Chinese) [Google Scholar]
- Wang, J.-N.; Ma, G.-G.; Dou, Y.-M.; Zhuang, H.-Y.; Fu, J.-S. Performance levels and evaluation method for seismic behaviors of a large-scale underground subway station with unequal-span frame. J. Vib. Shock 2020, 39, 92–100. (In Chinese) [Google Scholar]
- Qiu, D.-P.; Ren, W.-J.; Chen, J.Y. The multi-dimensional fragility analysis of the underground large-scale frame structure based on the internal relationships of different seismic performance evaluating indexes. Tunn. Undergr. Space Technol. 2023, 136, 105093. [Google Scholar] [CrossRef]
- Ma, C.; Li, K.; Lu, D.; Li, X.; Liu, Z.; Du, X. Seismic fragility analysis of underground structures subjected to bi-directional ground motions based on the damage weight coefficients of components. Soil Dyn. Earthq. Eng. 2024, 178, 108437. [Google Scholar] [CrossRef]
- Huang, P.-F.; Chen, Z.-Y. Fragility Analysis for Subway Station Using Artificial Neural Network. J. Earthq. Eng. 2022, 26, 6724–6744. [Google Scholar] [CrossRef]
- Dalmasso, M.; Civera, M.; De Biagi, V.; Surace, C.; Chiaia, B. Conditional generative adversarial networks for the data generation and seismic analysis of above and underground infrastructures. Tunn. Undergr. Space Technol. 2025, 157, 106285. [Google Scholar] [CrossRef]
- Liu, Z.-C.; Deng, P.; Li, Y.-L.; Chen, R.-P. Analysis of axial force variations and seismic performance of subway station columns under earthquake loading. Soil Dyn. Earthq. Eng. 2024, 186, 108878. [Google Scholar] [CrossRef]
- Scott, B.D.; Park, R.; Priestley, M.J.N. Stress-strain behavior of concrete Confined by overlapping hoops at low and high strain rates. Aci Struct. J. 1982, 79, 13–27. [Google Scholar]
- Clough, R.W.; Johnston, S.B. Effect of stiffness degradation on earthquake ductility requirements. In Proceedings of the Second Japan National Conference on Earthquake Engineering, Tokyo, Japan, 23–28 June 1966. [Google Scholar]
- Lu, X.-Z.; Ye, L.-P.; Pan, P.; Tang, D.-Y.; Qian, J.-R. Pseudo-static collapse experiments and numerical prediction competition of RC frame structure II: Key elements experiment. Build. Struct. 2012, 42, 23–26. (In Chinese) [Google Scholar]
- Du, X.-L.; Xu, Z.-G.; Xu, C.-S.; Li, Y.; Jiang, J.-W. Time-history analysis method for soil-underground structure system based on equivalent linear method. Chin. J. Geotech. Eng. 2018, 40, 2155–2163. (In Chinese) [Google Scholar]
- Chen, G.-X.; Liu, X.-Z.; Zhu, D.-H.; Hu, Q.-X. The Experimental study on dynamic shear modulus ratio and damping ratio of recently deposited soils in the southern area of Jiangsu province in China. In Proceedings of the 1st International Conference on Geotechnical Engineering for Disaster Mitigation and Rehabilitation, Singapore, 12–13 December 2005. [Google Scholar]
- Yan, F.-Y.; Chang, J.; Liu, Z.-Y. A return mapping implicit algorithm for coupled viscoelastic and hyperbolic Drucker-Prager plastic modeling. Rock Soil Mech. 2017, 38, 1797–1804. [Google Scholar]
- Lou, M.-L.; Pan, D.-G.; Fan, L.-C. Effect of vertical artificial boundary on seismic response of soil layer. J. Tongji Univ. 2003, 31, 757–761. (In Chinese) [Google Scholar]
- Pan, D.-G.; Lou, M.-L.; Dong, C. Effect of vertical artificial boundary on seismic response of soil layer under traveling wave excitations. Chin. J. Geotech. Eng. 2005, 27, 308–312. (In Chinese) [Google Scholar]
- Wang, H.-F.; Lou, M.-L.; Zhang, R.-L. Influence of presence of adjacent surface structure on seismic response of underground structure. Soil Dyn. Earthq. Eng. 2017, 100, 131–143. [Google Scholar] [CrossRef]
- Tsinidis, G. Response characteristics of rectangular tunnels in soft soil subjected to transversal ground shaking. Tunn. Undergr. Space Technol. 2017, 62, 1–22. [Google Scholar] [CrossRef]
- Lysmer, J.; Kuhlemeyer, R.-L. Finite dynamicmodel for infinite media. J. Eng. Mech. Div. 1969, 95, 859–877. [Google Scholar] [CrossRef]
- Jiang, J.-W.; Gao, Q.-B.; Chen, G.-X.; Xu, C.-S.; Du, X.-L. Quantification of ground motion record sets scale in the ida method for vulnerability analysis of underground structures. J. Dis. Prev. Mitig. Eng. 2022, 42, 1144–1152. (In Chinese) [Google Scholar]
- Vamvatsikos, D.; Cornell, C.A. Incremental dynamic analysis. Earthq. Eng. Struct. D 2002, 31, 491–514. [Google Scholar] [CrossRef]
- FEMAP695; Quantification of Building Seismic Performance Factors. ATC for the FEMA: Washington, DC, USA, 2009.
- Parra-Montesinos, G.J.; Bobet, A.; Ramirez, J.A. Evaluation of soil-structure interaction and structural collapse in Daikai subway station during kobe earthquake. ACI Struct. J. 2006, 103, 113–122. [Google Scholar] [CrossRef]
- Kowalsky, M.J. Deformation limit states for circular reinforced concrete bridge columns. J. Struct. Eng. 2000, 126, 869–878. [Google Scholar] [CrossRef]
- Mohammad, S. Curvature ductility of reinforced concrete beams under low high strain rates. ACI Struct. J. 1995, 92, 526–634. [Google Scholar]
- Ozbolt, J.; Mestrovic, D. Compression failure of beams made of different concrete types and sizes. J. Struct. Eng. 2002, 2, 200–209. [Google Scholar] [CrossRef]
- Feng, P.; Qiang, H.-L.; Ye, L.-P. Discussion and definition on yield points of materials, members and structures. Eng. Mech. 2017, 34, 36–46. (In Chinese) [Google Scholar]
- Jiang, J.-W.; Xu, C.-S.; Du, X.-L.; Chen, G.-X.; Xu, Z.-G. Optimal index of earthquake intensity measures for seismic design of underground frame structure of shallow-buried subway station. Chin. J. Geotech. Eng. 2023, 45, 3183–3325. (In Chinese) [Google Scholar]
- Zhuang, H.-Y.; Yang, J.; Chen, S.; Dong, Z.; Chen, G. Statistical numerical method for determining seismic performance and fragility of shallow-buried underground structure. Tunn. Undergr. Space Technol. 2021, 116, 104090. [Google Scholar] [CrossRef]
- Huang, Z.K.; Pitilakis, K.; Argyroudis, S.; Tsinidis, G.; Zhang, D.M. Selection of optimal intensity measures for fragility assessment of circular tunnels in soft soil deposits. Soil Dyn. Earthq. Eng. 2021, 145, 106724. [Google Scholar] [CrossRef]
- Karim, K.R.; Yamazaki, F. Effect of earthquake ground motions on fragility curves of highway bridge piers based on numerical simulation. Earthq. Eng. Struct. Dyn. 2001, 30, 1839–1856. [Google Scholar] [CrossRef]
- Chen, J.-N.; Du, X.-L.; Xu, C.-S.; Liu, H.-T.; Jiang, J.-W.; Liu, D. Seismic vulnerability evaluation of rectangular prefabricated subway station structure based on IDA method. J. Build. Struct. 2023, 44, 37–46. (In Chinese) [Google Scholar]
- Qiu, W.-G.; Huang, G.; Zhou, H.-C.; Xu, W.-P. Seismic vulnerability analysis of rock mountain tunnel. Int. J. Geomech. 2018, 18, 04018002. [Google Scholar] [CrossRef]
Disclaimer/Publisher’s Note: The statements, opinions and data contained in all publications are solely those of the individual author(s) and contributor(s) and not of MDPI and/or the editor(s). MDPI and/or the editor(s) disclaim responsibility for any injury to people or property resulting from any ideas, methods, instructions or products referred to in the content. |
© 2025 by the authors. Licensee MDPI, Basel, Switzerland. This article is an open access article distributed under the terms and conditions of the Creative Commons Attribution (CC BY) license (https://creativecommons.org/licenses/by/4.0/).