Abstract
This study establishes a refined numerical model of circular concrete-filled steel tube (CFST) columns using finite element software, and its effectiveness was verified through simulation of low-cycle reciprocating load tests. Based on this, a systematic analysis was conducted to investigate the effects of three key parameters—axial compression ratio (0.1–0.3), slenderness ratio (22.2–46.8), and confinement coefficient (0.65–1.56)—on the seismic performance of CFST columns, including failure modes, hysteretic behavior, skeleton curves, ductility, and energy dissipation capacity. The local buckling behavior was also studied. The results indicate that increasing the axial compression ratio slightly enhances the bearing capacity but reduces ductility, increasing the slenderness ratio significantly reduces the bearing capacity but improves ductility, and increasing the confinement coefficient substantially improves the bearing capacity, ductility, and energy dissipation capacity simultaneously. Based on the parametric analysis, the existing calculation formula for the local buckling length of circular CFST columns was modified. The average error between the predicted and simulated values is only 10%, demonstrating high engineering applicability. This research provides a theoretical basis and a practical calculation method for the seismic design and performance evaluation of CFST building and bridge columns.
1. Introduction
With the advancement of modernization, urbanization has correspondingly increased and spread. Through better traffic management, commuters can enjoy more comfortable and convenient travel. The damage or collapse of buildings and bridges can induce significance to the city and transportation networks [1,2,3,4]. In order to improve the reliability of buildings and bridges, the application of concrete-filled steel tube (CFST) columns was explored in building and bridge engineering [5].
CFST columns possess the following advantages: high bearing capacity, strong deformation capacity, excellent seismic performance, and simple joint construction [6,7,8]. Gardner and Jacobson [9] revealed that there is an interaction between steel pipes and concrete, which significantly enhances the mechanical properties of components. Chang et al. [10] found that the performance of concrete short columns under axial compression is primarily related to the confinement performance of the tube material, through comparing the performance of such columns with different tube materials. Han et al. [11] and Tao et al. [12], utilizing finite element models and test results, proposed constitutive calculation methods for the stress–strain curve of the confined concrete. Both of the constitutive models can effectively calculate the mechanical properties of CFST short columns under axial compressive load. Ibañez et al. [13] analyzed the influence of steel tube thickness on the axial compression performance of CFST columns. Wang et al. [14] and Subedi et al. [15] proposed calculation methods for the axial compressive capacity of CFST short columns through the collection of experimental data and finite element analysis. In addition, Lai et al. [16] proposed a calculation method for the axial compressive capacity of CFST short columns. Han et al. [17] found that the local buckling of steel tubes can be effectively avoided using filled concrete. Lakshmi et al. [18] proposed a calculation method for the deformation and bending capacity of CFST columns under the combination of axial and lateral loadings, which agreed well with the experimental results. Tu et al. [19] proposed a calculation method for the bending capacity of CFST columns with high-strength steel tubes based on experimental results.
Nakahara et al. [20] conducted a quasi-static experimental study on six frame structures composed of CFST columns and H-shaped steel beams to investigate the seismic performance of CFST frame structures. The study revealed that under lower axial forces with an axial compression ratio of 0.12, the tested parameters had little influence on the test results. However, under higher axial forces with an axial compression ratio of 0.31, the bond between the steel tube and concrete made it difficult for the axial force to be effectively transmitted between them [20]. Zubydan et al. [21] established a rectangular CSFT fiber model and a constitutive model considering the unloading rules due to local buckling of the steel tube. Wu et al. [22] found that the capacity of partially filled and removed concrete with thin-walled steel pipes is slightly lower than that of ordinary concrete with thin-walled steel pipes, but the overall performance is similar, with good ductility and energy dissipation performance. Petrus et al. [23] conducted push-out and axial compression tests on thin-walled CFST short columns with cold-formed straight ribs and tab ribs. Research has shown that stiffeners can significantly enhance the bond between concrete and steel pipes, and as the strength of concrete increases, the bond strength also increases. Strengthening ribs have a certain enhancing effect on the ductility and load-bearing capacity of components. Lee et al. [24] conducted axial compression tests on 15 square steel-reinforced concrete short columns (including members with diagonal ribs). The experimental results indicate that the location of concrete crushing corresponds to the location of local buckling of the steel pipe, and diagonal stiffeners can delay the local buckling of the steel pipe. Wang et al. [25] conducted axial compression tests on 14 square steel tube concrete members (including cold-formed straight ribbed members, cold-formed straight ribbed inner circular steel tubes, and ribbed members) and established finite element models. The experimental results show that all three types of stiffening methods cause local buckling to occur after the component reaches its peak bearing capacity, resulting in an increase in component strength. Through analysis of the finite element model, it was found that stiffeners can enhance the restraining ability of steel pipes on concrete. Wang et al. [26,27] conducted axial compression tests on one ordinary CFST column and four CFST columns welded with different forms of stiffeners, analyzed the influence of stiffeners on bearing capacity, ductility, and failure modes, and conducted theoretical and numerical simulation analysis. The experimental results indicate that all components experience local buckling before reaching their peak value. The steel pipe of ordinary components undergoes local buckling before yielding, while the stiffeners delay the local buckling, causing the steel pipe to only undergo local buckling near yielding.
It was found that ignoring the local buckling effect would overestimate the seismic performance of CFST columns. This study established a refined finite element model of circular CFST columns, which can consider the local buckling of steel tubes. Then, a parameter analysis was conducted to investigate the effect of axial compression ratio, slenderness ratio, and confinement coefficient on the seismic performance of CFST columns. A modified calculation formula for the local buckling length of circular CFST columns was proposed based on the parameter analysis. Therefore, this study can provide a reference for building and bridge engineers to fully utilize the mechanical properties of materials and to improve the seismic performance of circular CFST columns.
2. Model Validation and Expansion
2.1. Model Establishment and Validation
This article selects the specimen named GH-10-280 from Ref. [28] as the physical reference model. The height of the CFST column is 2800 mm, with an outer diameter of 325 mm, and the thickness of the seamless steel tube is 10 mm. The column and the footing are connected as a whole by being filled with concrete, with a compressive strength of 34.1 MPa. The specific dimensions of the test specimen are shown in Figure 1a. Considering the self-weight of the upper structure, the design axial compression ratio of the column is 0.1. First, the footing is fixed integrally using bolts, and a vertical load of 528 kN is applied to the top. Then, a horizontal actuator is used to apply a displacement load, as shown in Figure 1b.
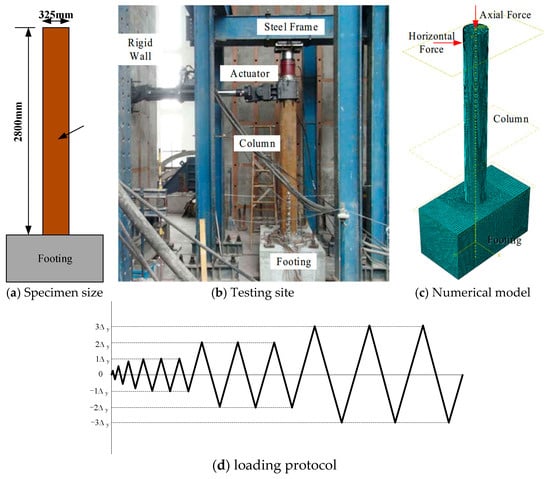
Figure 1.
Test and numerical model.
This article employs Abaqus/Standard [29] to simulate low-cycle repeated load tests on concrete-filled steel tubes. This software is widely used in static analysis, large deformation analysis of components, and corrosion analysis, among others [30,31,32]. To better simulate the stiffness degradation characteristics of concrete under low-cycle repeated loads, this article utilizes a plastic damage model to characterize its properties. The stress–strain relationship of the CDP model [33,34] under uniaxial compression and tension is shown in Figure 2. The CDP model was first proposed by Lubliner et al. [35] and modified by Lee and Fenves [36]. The stress–strain relationships for concrete’s uniaxial compressive and tensile behavior, including the post-peak inelastic section with material stiffness degradation, can be expressed as
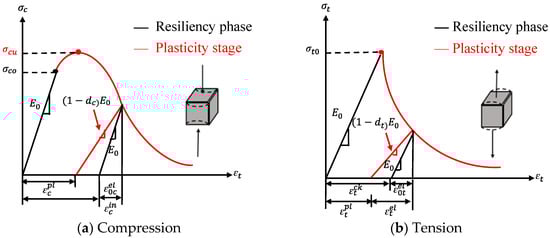
Figure 2.
Plastic damage model of concrete.
Here, and are the total axial compressive stress and axial tensile stress of the concrete, and are the total axial compressive strain and axial tensile strain of the concrete, is the compressive inelastic strain of the grouting material, is the tensile cracking strain of the concrete, and is the initial stiffness of the material.
The stress–strain of the plastic segment can be expressed as follows:
Here, and are the compression damage factors and tensile damage factors of concrete and and represent the plastic strain tensors generated during concrete compression and tension, respectively.
The CDP model is based on five plastic parameters and two sets of basic uniaxial concrete data. The five parameters are, respectively, , e, , Kc, and to define the yield surface functions, potential flow trends, and viscous properties of materials. Uniaxial concrete data are the stress–strain behavior of its tension and compression, and the stiffness of concrete members under low-cycle cyclic repeated loading is reduced by defining the damage factor. The detailed material parameters, including elastic modulus, Poisson’s ratio, and yield strength, are listed in Table 1. The five plasticity parameters for CDP are given in Table 2.

Table 1.
Plastic damage model parameters.
Table 2.
Material properties.
In this study, a bilinear model was employed to simulate steel reinforcement, as illustrated in Figure 3. The specific parameters of steel can be referred to in Table 2. The yield strength of steel is 277 MPa, the ultimate strength is 316 MPa, and the yield strain is 1300 με. Additionally, in this paper, concrete is represented using hexahedral 8-node solid elements, while steel tubes are represented using shell elements. The contact between the two is set to frictional hard contact, with the friction parameter set to 0.3. The boundary conditions are consistent with the experimental conditions, where the ground beam is fully restrained and a vertical load of 528 kN is applied to the top. Subsequently, a horizontal load is applied to the coupled reference points, and the loading system adopts displacement loading.
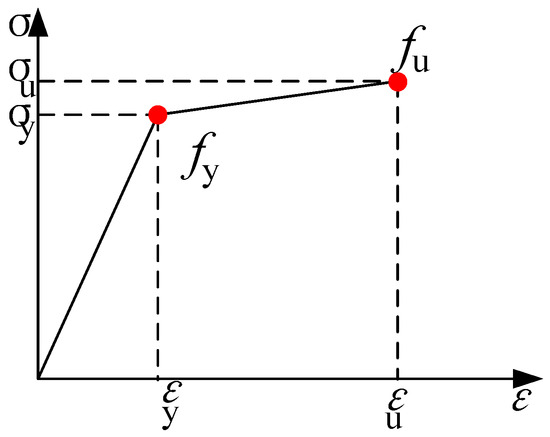
Figure 3.
Two-fold line constitutive model of steel.
Figure 4 shows the comparison between numerical results and experimental results of CFST columns. At the beginning of loading, the CFST column is in an elastic state. As the top displacement reaches 91 mm, severe plastic damage occurs at the bottom of the column. When it finally fails, severe buckling occurs at the bottom of the column, which is consistent with the experimental phenomenon. In addition, as can be seen from Figure 5, the hysteresis curves of the two are almost identical, and the skeleton curves are also highly similar. The peak loads of the experiment and numerical simulation are 135.9 kN and 137.1 kN, respectively. In summary, the numerical model successfully reproduces the experimental phenomena and results, verifying the reliability and effectiveness of the model.
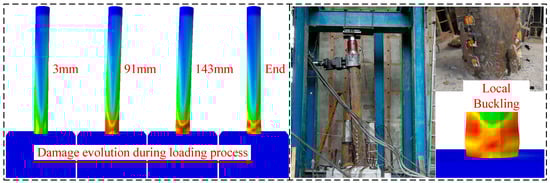
Figure 4.
The failure modes of test and simulation.
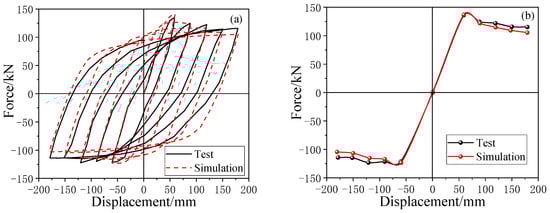
Figure 5.
Load–displacement curves of test and simulation. (a) Hysteresis curve (b) Skeleton curve.
2.2. Parameter Analysis
CFST columns are important vertical load-bearing components, and their mechanical properties are influenced by both their own properties and external loads. This article focuses on analyzing the effects of parameters such as axial compression ratio, slenderness ratio, and confinement coefficient, as shown in Table 3. The confinement coefficient is a parameter for measuring the constraining effect in concrete structures. The verification model is used as the benchmark model. The range of axial compression ratio in the table has increased from 0.1 to 0.3, with a total of 5 cases. The aspect ratio was increased from 22.2 to 46.8 by changing the height of the column from 1800 mm to 3800 mm. In addition, the influence of the confinement coefficient was studied by changing the wall thickness of the steel pipe.
Table 3.
Research parameters of steel tube.
3. Result Analysis
3.1. Failure Mode
Figure 6 illustrates the failure modes of CFST columns. As shown in Figure 6a, the failure locations of the columns are primarily concentrated at the bottom, where significant plastic damage and local buckling occur. The local buckling was induced by the compression of the stretched-out steel tube. The ultimate state is defined as the state with the displacement corresponding to the 85% of the maximum lateral force in the descending stage. As the axial compression ratio increases, the extent of damage presented as the strain in the bottom region gradually expands. The specimen with an axial compression ratio of 0.15 ultimately exhibits a horizontal distance of 348 mm in terms of damage deformation, whereas the horizontal distance for the specimen with an axial compression ratio of 0.3 is 458 mm. Additionally, local separation occurs between the inner wall of the steel tube and the concrete core. This separation is attributed to the large deformation of the steel tube due to local yielding, coupled with the relatively poor deformation capacity of the concrete. The inability of the two materials to coordinate leads to this separation phenomenon.
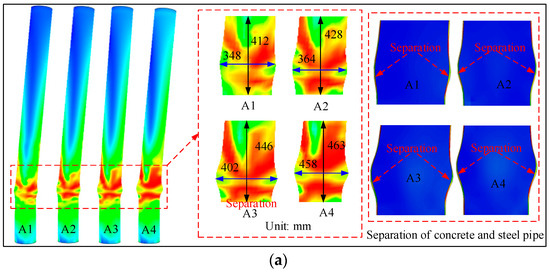
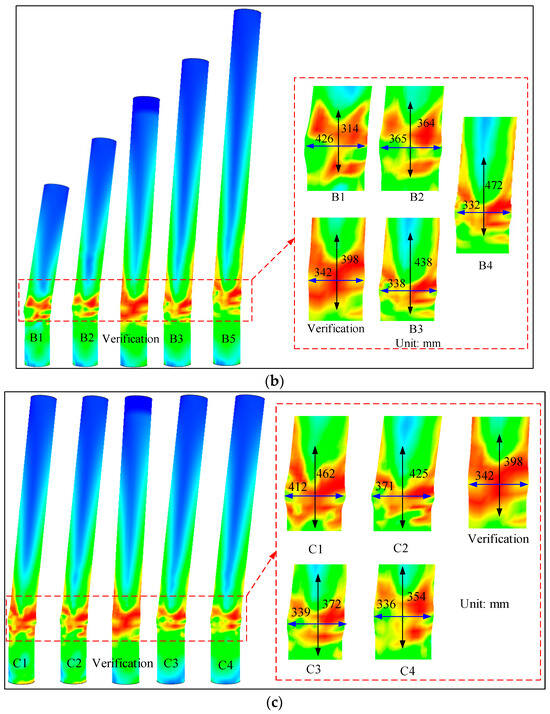
Figure 6.
Failure mode of concrete-filled steel tube: (a) axial compression ratio; (b) slenderness ratio; (c) confinement coefficient.
Figure 6b shows the failure modes of CFST columns under different slenderness ratios. From the figure, it can be seen that as the slenderness ratio increases, the damage range in the height direction gradually increases, while the buckling length in the horizontal direction tends to decrease. The buckling length of a CFST column with a height of 1800 mm is 314 mm, while that of a column with a height of 3800 mm is 438 mm. This phenomenon is due to the fact that as the length increases, the bottom of the CFST column under the same horizontal load bears a greater bending moment load, resulting in an increase in vertical damage height and a decrease in horizontal buckling range.
In addition, the damage modes of CFST column with different confinement coefficients are shown in Figure 6c. In this paper, the confinement coefficient is increased by increasing the thickness of the steel tube, which improves the overall performance of the CFST column and enhances its restraining ability. Therefore, the local damage range tends to decrease.
3.2. Load–Displacement Curve
Figure 7 depicts the hysteresis curve of the CFST column. As evident from Figure 7, the hysteresis curve of the CFST column is full and exhibits a shuttle shape. As the slenderness ratio decreases, the curve becomes full, and the peak bearing capacity increases. When the confinement coefficient of the steel tube concrete is increased, the fullness of the hysteresis curve is greatly enhanced, indicating an increase in its energy dissipation performance, and the peak bearing capacity is also significantly improved. As for increasing the axial compression ratio of the CFST column, its hysteresis curve does not undergo significant changes, and its peak bearing capacity increases slightly. The skeleton curve of the steel tube concrete is shown in Figure 8.
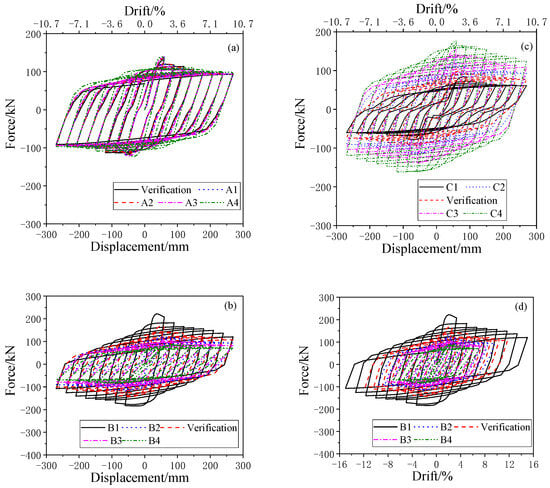
Figure 7.
Hysteresis curves of concrete-filled steel tube: (a) axial compression ratio, (b) slenderness ratio, (c) confinement coefficient presented by displacement and (d) confinement coefficient presented by drift.
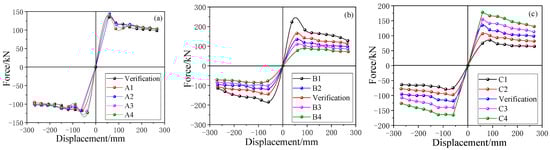
Figure 8.
Skeleton curves of concrete-filled steel tube: (a) axial compression ratio, (b) slenderness ratio, and (c) confinement coefficient.
From Figure 4 and Table 4, it can be seen that the axial compression ratio slightly increases the peak load, mainly because the steel tube thickness is relatively thin, and increasing the axial compression ratio does not improve its overall restraint ability. When the slenderness ratio increases from 22.2 to 46.8, the peak load decreases from 235.6 kN to 69.9 kN. This conclusion is due to the decrease in stability coefficient caused by the increase in slenderness ratio. When the confinement coefficient increases from 0.65 to 1.56, the peak load increases by 232%. It can be seen that the slenderness ratio and confinement coefficient are factors that seriously affect the steel tube concrete specimens.
Table 4.
Feature point average values of CFST columns.
3.3. Ductility Performance
Ductility is an important indicator for measuring the seismic performance of structures. It is typically evaluated using the ductility coefficient, which is measured by comparing the ultimate displacement to the yield displacement, as follows:
In the formula, represents the ductility coefficient of the corner, represents the ultimate displacement of the component, and represents the yield displacement of the specimen.
Figure 9 depicts the ductility coefficient of steel-tube concrete. It can be observed from the figure that as the axial compression ratio increases, the ductility coefficient decreases. However, the ductility coefficient of the component remains greater than 3, satisfying the requirements of the specifications. As for increasing the slenderness ratio and confinement ratio, the ductility coefficient gradually increases. When the slenderness ratio is 46.8, the ductility coefficient is 6.1. When the confinement ratio is 1.56, the ductility coefficient increases to 7.1.
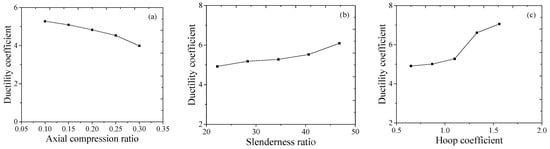
Figure 9.
Ductility coefficient of concrete-filled steel tube: (a) axial compression ratio, (b) slenderness ratio, and (c) confinement coefficient.
3.4. Energy Consumption Capacity
The energy dissipation capacity of a structure refers to its ability to absorb energy during earthquakes under horizontal forces, and has always been an important indicator for evaluating the seismic performance of structures. Generally, the area of the hysteresis curve is first calculated, and the area is used to reflect the energy dissipation capacity of a structure under horizontal seismic forces. As shown in Figure 10, the area of the hysteresis loop is indicated by the formula S1 + S2.
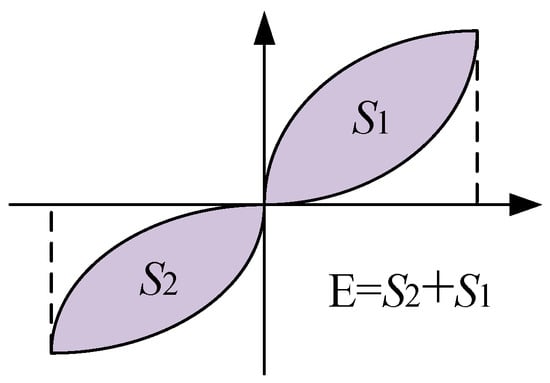
Figure 10.
Schematic diagram of energy dissipation calculation for test specimens.
Figure 11 depicts the energy dissipation curves of various specimens of CFST columns. As evident from the figure, the axial compression ratio has a minor impact on the energy dissipation performance of columns. The energy dissipation capacity gradually decreases with an increase in the slenderness ratio. The confinement ratio positively influences the energy dissipation performance of columns. To more precisely compare the differences in energy dissipation, this paper calculates the total energy dissipation values of each specimen. For the specimen with an axial compression ratio of 0.1, the total energy dissipation value is 334 kJ, while the corresponding value for a ratio of 0.3 is 384 kJ. Furthermore, when the slenderness ratio is 22.2, the total energy dissipation of steel tube concrete is 501 kJ, which is 1.50 times higher than that of the initial verification model. The total energy dissipation of steel tube concrete with a confinement ratio of 1.56 is 487 kJ, which is 1.46 times higher than that of the initial verification model.
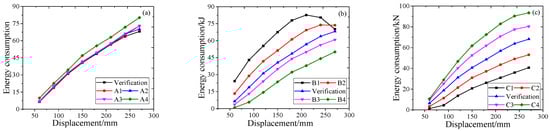
Figure 11.
Energy dissipation curves of concrete-filled steel tube specimens: (a) axial compression ratio, (b) slenderness ratio, and (c) confinement coefficient.
4. Local Buckling Length
Based on the final failure results of the specimens, this article measured the local buckling length at the bottom of the circular CFST column, as shown in Figure 12. As shown in Figure 12, the external steel pipe is in a bi-directional stress state of axial compression and circumferential tension under load, so its local buckling is concentrated in a certain area at the bottom of the column.
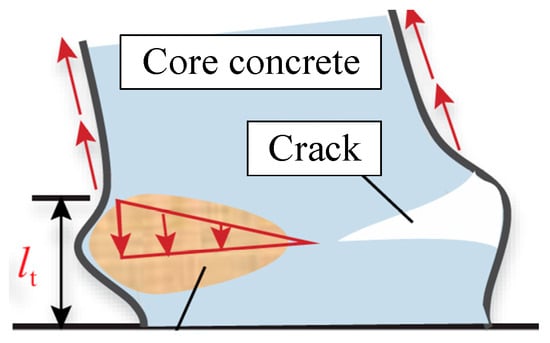
Figure 12.
Localized buckling area of steel tube concrete.
Figure 13 shows the calculation formula proposed by YASUI [37] and WU et al. [38] for the local buckling length of circular steel reinforced concrete columns. From Figure 13, it can be seen that there is a significant error between the predicted results of the calculation formulas of YASUI [37] and WU et al. [38] and the experimental results, underestimating the local buckling length of the circular CFST column. Based on the existing calculation formula and combined with experimental data for fitting by the least squares method (determination coefficient R2 = 0.937), this paper modifies and obtains the calculation formula applicable to the local buckling length lt of circular CFST columns, as follows:
where D is the diameter of steel tube, and t is the thickness of steel tube.
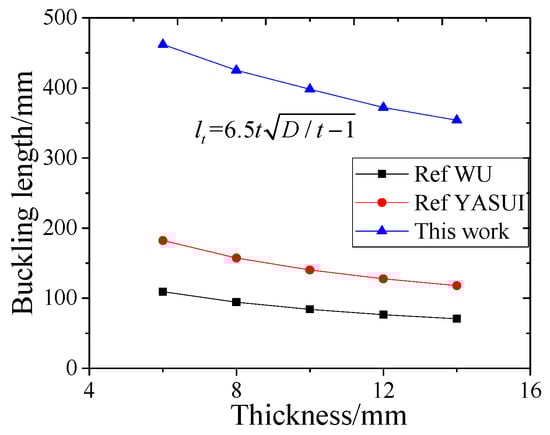
Figure 13.
Comparison between simulation and calculated values of local buckling length.
The average error between the predicted value and the simulated value of the calculation formula for local buckling length proposed in this article is 10%, which is relatively small. Therefore, the formula proposed in this article can effectively predict the local buckling length of circular CFST columns.
5. Conclusions
This paper investigates the failure modes, hysteresis behavior, and seismic performance of circular CFST columns using finite element models, which are verified by experimental results. Then a parameter analysis is conducted, including the axial compression ratio, slenderness ratio, and confinement coefficient. In addition, a modified method is developed for calculating local buckling length. The following conclusions were drawn.
The peak lateral capacity of CFST columns slightly increases with the increase in axial compression ratio within the range of 0.1 to 0.3. However, the ductility coefficient gradually decreases, and the change in energy dissipation capacity is not significant. The ductility coefficient is greater than 3 in all cases, which suggests strong seismic performance.
A 70% decrease in the peak load and an increase in the ductility coefficient are induced by the increase in the slenderness ratio from 22.2 to 46.8. With the increase in the confinement coefficient from 0.65 to 1.56, the peak load increases by 232% and the ductility coefficient reaches 7.1, which presents a significant improvement in the bearing capacity and the deformation capacity of CFST columns.
With a higher confinement coefficient, the hysteresis curve is fuller and the energy dissipation capacity is stronger. When the confinement coefficient is 1.56, the total energy dissipation reaches 487 kJ, which is 1.46 times that of the initial validation model, indicating that enhancing steel pipe confinement can effectively improve the seismic energy dissipation performance of the structure.
Based on existing formulas, this study proposes a new calculation formula for the local buckling length of circular steel tube concrete columns. The average error between the predicted and simulated values of the new formula is about 10%, which indicates strong potential engineering applicability.
This study employed a common method for the parameter analysis. The analysis results can provide a fundamental basis for the seismic design of buildings and bridges. However, it is still necessary to analyze the parameter interactions in the future.
Author Contributions
Conceptualization, H.H. and X.T.; methodology, Y.Z.; validation, S.C. and Z.F.; writing—original draft preparation, T.Z. and M.W. All authors have read and agreed to the published version of the manuscript.
Funding
This research is funded by the Special Fund Project for Basic Scientific Research Business Expenses of Central Public Welfare Research Institutes (2025-9061) and the Hunan Provincial Department of Education Fund (23C0146).
Data Availability Statement
The original contributions presented in the study are included in the article, further inquiries can be directed to the corresponding author.
Conflicts of Interest
Author Shu Cao was employed by the company Bengbu Highway Management Service Center’s Directly Affiliated Branch Center. Author Zhixuan Fei was employed by the company Chongqing Highway Affairs Center. The remaining authors declare that the research was conducted in the absence of any commercial or financial relationships that could be construed as potential conflicts of interest.
References
- Yang, J.; Feng, P. Analysis-oriented model for FRP confined high-strength concrete: 3D interpretation of path dependency. Compos. Struct. 2021, 278, 114695. [Google Scholar] [CrossRef]
- Zhou, Y.; Han, Q.; Du, X.; Jia, Z.-L. Shaking table tests of post-tensioned rocking bridge with double-column bents. J. Bridge Eng. 2019, 24, 04019080. [Google Scholar] [CrossRef]
- He, H.; Zhou, Y.; Cheng, S.; An, N.; Liu, H.; Fe, Z. Stability Analysis of “321” prefabricated highway steel truss bridge. Buildings 2024, 14, 1626. [Google Scholar] [CrossRef]
- Zhou, Y.; Han, Q.; Du, X.; Zhang, J.-Q.; Cheng, S.-S.; Chen, J.-Y. Additional viscous dampers for double-column rocking bridge system: Seismic response and overturning analysis. Soil Dyn. Earthq. Eng. 2021, 141, 106504. [Google Scholar] [CrossRef]
- Han, L.; Li, W.; Bjorhovede, R. Developments and advanced applications of concrete-filled steel tubular (CFST) structures: Members. J. Constr. Steel Res. 2014, 100, 211–228. [Google Scholar] [CrossRef]
- Shanmugam, N.E.; Lakshmi, B. State of the art report on steel–concrete composite columns. J. Constr. Steel Res. 2001, 57, 1041–1080. [Google Scholar] [CrossRef]
- Han, D.; Tao, Z.; Ghafar, W.; Hasan, M.; Xiao, W.; Wang, T.; Zhou, K.; Dai, H. Experimental study on the seismic performance of L-shaped CFST columns in different combinations. Buildings 2023, 13, 2320. [Google Scholar] [CrossRef]
- Wang, J.; Sun, Q.; Li, J. Experimental study on seismic behavior of high strength circular concrete-filled thin-walled steel tubular columns. Eng. Struct. 2019, 182, 403–415. [Google Scholar] [CrossRef]
- Gardner, N.J.; Jacobson, E. Structural Behavior of Concrete Filled Steel Tubes. ACI J. 1967, 64, 404–413. [Google Scholar]
- Chang, Y.; Chen, W.; Xiao, Q.; Rong, E.; Peng, L. Theoretical and experimental study on axial compression concrete-filled tubes with different confinements. J. Constr. Steel Res. 2021, 185, 106862. [Google Scholar] [CrossRef]
- Han, L.; Yao, G.; Tao, Z. Performance of concrete-filled thin-walled steel tubes under pure torsion. Thin-Walled Struct. 2007, 45, 24–36. [Google Scholar] [CrossRef]
- Tao, Z.; Wang, Z.; Yu, Q. Finite element modelling of concrete-filled steel stub columns under axial compression. J. Constr. Steel Res. 2013, 89, 121–131. [Google Scholar] [CrossRef]
- Ibañez, C.; Hernández-Figueirido, D.; Piquer, A. Effect of steel tube thickness on the behaviour of CFST columns: Experimental tests and design assessment. Eng. Struct. 2021, 230, 111687. [Google Scholar] [CrossRef]
- Wang, X.; Fan, F.; Lai, J. Strength behavior of circular concrete-filled steel tube stub columns under axial compression: A review. Constr. Build. Mater. 2022, 322, 126144. [Google Scholar] [CrossRef]
- Subedi, N.; Obara, T.; Kono, S. Noncompact and slender concrete-filled steel tubes under axial compression: Finite-element modeling and evaluation of stress-strain models for fiber-based analysis. J. Constr. Steel Res. 2022, 196, 107353. [Google Scholar] [CrossRef]
- Lai, Z.; Jiang, H.; Cai, Y. A new design equation to estimate the axial compressive strength of circular concrete-filled steel tubular stub columns. Structures 2022, 46, 1043–1054. [Google Scholar] [CrossRef]
- Han, L. Tests on Concrete Filled Steel Tubular Columns with High Slenderness Ratio. Adv. Struct. Eng. 2000, 3, 337–344. [Google Scholar] [CrossRef]
- Lakshmi, B.; Shanmugam, N.E. Nonlinear Analysis of In-Filled Steel Concrete Composite Columns. J. Struct. Eng. 2002, 128, 922–933. [Google Scholar] [CrossRef]
- Tu, C.; Shi, Y.; Liu, D.; Wang, W.; Ban, H. Behavior and general design method of concrete-filled high-strength steel tube (CFHST) columns. Eng. Struct. 2021, 243, 112506. [Google Scholar] [CrossRef]
- Nakahara, H.; Sakino, K.; Kawano, A. Bond Behavior of concrete filled steel tubular frames under cyclic horizontal load. J. Struct. Constr. Eng. 2008, 73, 465–472. [Google Scholar] [CrossRef]
- Zubydan, A.H.; ElSabbagh, A.I. Monotonic and cyclic behavior of concrete-filled steel-tube beam-columns considering local buckling effect. Thin-Walled Struct. 2011, 49, 465–481. [Google Scholar] [CrossRef]
- Wu, B.; Zhao, X.Y.; Zhang, J.S. Cyclic behavior of thin-walled square steel tubular columns filled with demolished concrete lumps and fresh concrete. J. Constr. Steel Res. 2012, 77, 69–81. [Google Scholar] [CrossRef]
- Petrus, C.; Hamid, H.A.; Ibrahim, A.; Parke, G. Experimental behaviour of concrete filled thin-walled steel tubes with tab stiffeners. J. Constr. Steel Res. 2010, 66, 915–922. [Google Scholar] [CrossRef]
- Lee, S.-H.; Choi, Y.-H.; Kim, Y.-H.; Choi, S.-M. Structural performance of welded built-up square CFST stub columns. Thin-Walled Struct. 2012, 52, 12–20. [Google Scholar] [CrossRef]
- Wang, Z.B.; Tao, Z.; Yu, Q. Axial compressive behaviour of concrete-filled double-tube stub columns with stiffeners. Thin-Walled Struct. 2017, 120, 91–104. [Google Scholar] [CrossRef]
- Wang, Y.; Yang, Y.; Zhang, S. Static behaviors of reinforcement-stiffened square concrete-filled steel tubular columns. Thin-Walled Struct. 2012, 58, 18–31. [Google Scholar] [CrossRef]
- Yang, Y.; Wang, Y.; Fu, F. Effect of reinforcement stiffeners on square concrete-filled steel tubular columns subjected to axial compressive load. Thin-Walled Struct. 2014, 82, 132–144. [Google Scholar] [CrossRef]
- Pang, B. Experimental Study on Seismic Performance of Circular Concrete-filled Steel Bridge Columns. Master’s Thesis, Chongqing Jiaotong University, Chongqing, China, 2012. (In Chinese). [Google Scholar]
- ABAQUS Inc. ABAQUS Analysis User’s Manual; Dassault Systèmes: Providence, RI, USA, 2013. [Google Scholar]
- Sayadi, A.A.; Rahman, A.B.; Jumaat, M.Z.B.; Alengaram, U.J. The relationship between interlocking mechanism and bond strength in elastic and inelastic segment of splice sleeve. Constr. Build. Mater. 2014, 55, 227–237. [Google Scholar] [CrossRef]
- Xu, C.S.; Liu, H.T.; Du, X.L. Experimental study on connection performance of grouted sleeve splicing for rebars under high stress repeated tension-compression loading. J. Build. Struct. 2018, 39, 178–193. [Google Scholar]
- Liu, H.T.; Han, Q.; Bai, Y.L.; Xu, C.S.; Du, X.L. Connection performance of restrained de formed grouted sleeve splice. Adv. Struct. Eng. 2018, 21, 488–499. [Google Scholar] [CrossRef]
- Demir, A.; Caglar, N.; Ozturk, H.; Sumer, Y. Nonlinear finite element study on the im provement of shear capacity in reinforced concrete T-Section beams by an alter native diagonal shear reinforcement. Eng. Struct. 2016, 120, 158–165. [Google Scholar] [CrossRef]
- Zhu, H.; Stephens, M.T.; Roeder, C.W.; Lehman, D.E. Inelastic response prediction of CFST columns and connections subjected to lateral loading. J. Constr. Steel Res. 2017, 132, 130–140. [Google Scholar] [CrossRef]
- Lubliner, J.; Oliver, J.; Oller, S. A plastic-damage model for concrete. Int. J. Solids Struct. 1989, 25, 299–326. [Google Scholar] [CrossRef]
- Lee, J.; Fenves, G. Plastic-damage model for cyclic loading of concrete structures. J. Eng. Mech. 1998, 124, 892–900. [Google Scholar] [CrossRef]
- Yasui, N. Elasto-plastic analysis for local buckling behavior of circular tubes under axially cyclic loading. J. Struct. Constr. Eng. 2001, 543, 161–181. [Google Scholar] [CrossRef] [PubMed][Green Version]
- Wu, B.; Peng, W.; Zhao, X. Cyclic loading tests of semi-precast circular steel tubular columns incorporating precast segments containing demolished concrete lumps. Eng. Struct. 2020, 211, 110438. [Google Scholar] [CrossRef]
Disclaimer/Publisher’s Note: The statements, opinions and data contained in all publications are solely those of the individual author(s) and contributor(s) and not of MDPI and/or the editor(s). MDPI and/or the editor(s) disclaim responsibility for any injury to people or property resulting from any ideas, methods, instructions or products referred to in the content. |
© 2025 by the authors. Licensee MDPI, Basel, Switzerland. This article is an open access article distributed under the terms and conditions of the Creative Commons Attribution (CC BY) license (https://creativecommons.org/licenses/by/4.0/).